the negative effects of managerial incentives on … · the negative effects of managerial...
TRANSCRIPT

The Negative Effects of Managerial Incentives on Operating Lease Intensity
Erik Devos Department of Economics and Finance
College of Business Administration
University of Texas at El Paso
El Paso, TX 79968
Email: [email protected]
He Li
Department of Economics and Finance
College of Business Administration
University of Texas at El Paso
El Paso, TX 79968
Email: hli2@ utep.edu
December 2016
Corresponding author. We thank Tim Roth, Emma Xu, Jim Upson, Eddie Wei, and seminar participants at the
University of Texas – El Paso for comments. The authors retain the responsibility for any remaining errors.

1
The Negative Effects of Managerial Incentives on Operating Lease Intensity
Abstract
Based on the idea that operating leases have the attributes that allow them to serve as hedges on
the assets of the firm, we provide evidence of a negative relation between CEO risk-taking
incentives and firms’ operating lease intensity. Using both equity- and asset-based measures of
managerial incentives (vega) and controlling for CEO pay-performance sensitivity (delta), we find
that a $1 million increase in the sensitivity of the CEO’s wealth to changes in the firm’s stock
return volatility (equity-based vega), or to changes in the firm’s asset volatility (asset-based vega)
leads to a 40.25%, or 16.21% decrease in the use of operating leases. Our empirical results are
robust to alternative econometric models and alternative measures of operating lease intensity.

2
I. Introduction
Operating leases are an important financing vehicle for firms in the U.S. In 2015 the
average U.S. Compustat firm had an (operating) lease intensity of about 33%. This dependency on
leases is not recent, for example, Graham, Lemmon, and Schallheim (1998) find that operating
leases total about 43% of fixed claims.1 Despite the importance of leasing, it is surprising that
“leasing has been essentially ignored in the theoretical and empirical literature” (Eisfeldt and
Rampini, 2009, p.1624).
Historically, leasing has been studied in the context of the lease-versus-buy decision, and
early studies focused on the role of taxes in explaining the use of leases (e.g., Franks and Hodges,
1978; Miller and Upton 1976, Myers, Dill and Bautista, 1976)2 finding that leases are generally
negatively related to firms’ tax liabilities. Somewhat more recent leasing literature investigates the
role of financial contracting by focusing on the effects of ownership structure (Flath, 1980;
Mehran, Taggart and Yermack, 1999; Smith and Wakeman, 1985) and the investment-opportunity
set (Barclay and Smith, 1995; Smith and Wakeman, 1985; Stulz and Johnson, 1985; Williamson,
1988) on firms’ lease intensity and suggests that higher levels of managerial ownership and greater
growth opportunities are associated with higher levels of lease financing. This strand of literature
also stresses the effects of transaction costs on leasing as leases can be used to minimize transaction
costs when the life of the capital equipment exceeds its usefulness (Flath, 1980; Sharpe and
Nguyen, 1995; Smith and Wakeman, 1985). Lastly, there is literature that examines corporate
leases from an information asymmetry and agency cost perspective. For example, Robicheaux, Fu,
and Ligon (2008) document that leasing is a mechanism used to reduce agency costs of debt and
1Operating lease intensity is defined as operating leases divided by fixed claims. For reasons explained later in this
section, we focus our paper on operating leases and do not include capital leases in our analyses. 2 See also Graham, et al. (1998), Ross, Westerfield and Jaffe (1996), and Smith and Wakeman (1985).

3
can be used as a complement to other agency cost reducing measures. And, Devos and Rahman
(2014) find that rural firms have lower lease intensities, due to greater information asymmetry
between the lessor and the lessee.3
One important property of leases that is recognized in the lease valuation literature are the
embedded options associated with leasing contracts. For example, McConnell and Schallheim
(1983) develop a general model for valuing different types of lease contracts under a compound
option framework. And, similarly, Grenadier (1995) builds a unified framework for pricing a
variety of leasing contracts using a real-option approach. The underlying economic concept of
these valuation models is that leasing allows the separation of ownership from use, with the lessee
receiving the benefits of the use and the lessor receiving lease payments and absorbing the risk of
obsolescence and decrease in the assets’ residual value. For example, a lease can be characterized
as s a portfolio of an asset and an option on that asset. This characterization of leasing is also
provided by Smith (1979).
Importantly, the real-options embedded in leasing contracts should allow for hedging of
firms’ asset risk through these leases. However, surprisingly missing from the leasing literature is
an examination of the role this hedging property of lease contracts plays in the corporate lease-
versus-buy decision. To fill this gap in the literature, in this paper, we argue that the real-option
feature of leasing contracts serves as a potential hedging mechanism on firm asset risk. And,
because the CEO’s incentive compensations have a substantial influence on executives’ hedging
activities (Akron and Benninga, 2013), risk-taking incentives should also have a significant impact
3 In addition, there is a substantial literature that examines the substitutability between debt and leasing. Empirical
results in this area are mixed. On the one hand, both debt and lease contracts subject firms to fixed claims, and thus
could be substitutes (Bayless and Diltz, 1986; Krishnan and Moyer, 1994; Marston and Harris, 1988; Mukherjee,
1991). On the other hand, a number of empirical studies have found opposing evidence of a positive relationship
between debt and leasing (Ang and Peterson, 1984; Bowman, 1980; Finucane, 1988).

4
on the firm’s operating lease intensity. In particular, greater risk-taking incentives discourage
hedging and should be negatively related to the use of corporate leases.
The reason we hypothesize that there is a negative relationship between the CEO’s risk-
taking incentives and operating lease intensity is simple. In order for a leasing contract to have
hedging properties, the contract has to require the transfer of the risk in the asset’s residual value
from the lessee to the lessor. This can only occur if the lessor retains the ownership of the asset.
The IRS defines this type of lease as true leases, whereas leasing contracts that give the lessee the
ownership of the asset are defined as nontrue leases (Graham, et al. 1998). In terms of financial
accounting standards, a lease contract can be classified as either an operating lease, or a capital
lease. Operating leases consist only of true leases, and capital leases can be a mixture of true and
nontrue leases, which can generate results that are difficult to interpret. Hence, we focus our study
on operating leases.
To measure CEO risk-taking incentives, we first use the sensitivity of a CEO’s wealth to
firms’ stock volatility (vega). This measure is extensively used in the literature. For example,
Coles, Daniel, and Naveen (2006) find that, controlling for pay-performance sensitivity (delta),
higher vega leads to riskier policy choices. While equity-based vega is directly linked to the
incentive to take equity risk, it arises only from option grants, and does not reflect the incentives
from stock holdings to undertake asset risk. Therefore, in order to examine how a CEO’s risk
attitude affects the tendency to hedge asset risk through leasing, we also use a measure of risk-
taking incentives that links the CEO’s wealth to the firm’s asset volatility. Following Chesney,
Stromberg, and Wagner (2012), we construct asset-based delta and asset-based vega and examine
the effects of both equity- and asset-based risk-taking incentives on operating leases. Consistent
with our main hypothesis, our Tobit regression results show that, controlling for pay-performance

5
sensitivity (delta), when the sensitivity of the CEO’s wealth to a one percentage point increase in
the standard deviation of the firm’s stock return (equity-based vega) increases by $1 million,
operating lease intensity decreases by approximately 4.28%. At the same time, when the sensitivity
of the CEO’s wealth to a one percentage point increase in the firm’s asset volatility (asset-based
vega) increases by $1 million, operating lease intensity decreases by approximately 1.51%.
Importantly, these results remain robust when we control for industry and year fixed effects.
To ensure that our findings are empirically sound, we conduct several robustness tests.
First, there could be a concern that there may be endogeneity when investigating the relation
between risk-taking incentives and corporate leasing policy. On one hand, managerial incentives
and (financing) policy choices may be jointly determined (Coles et al., 2006). In other words, the
parameter estimates from the Tobit regression may be biased when delta and vega are determined
endogenously, along with operating lease intensity, by a common set of firm characteristics. On
the other hand, although the Tobit regressions suggest a negatively relation between operating
lease intensity and risk-taking incentives, the direction in which causality may run is unclear.
While risk-taking incentives can have an impact on operating lease intensity, leasing policy may
also change the firm’s return and volatility, which, in turn, can lead to changes risk-taking
incentives. To address these issues, we first employ an exogenous shock to the use of executive
option grants. The Financial Accounting Standards Board (FASB) Final Incentive Stock Option
Regulations in 2004 stipulate the expensing requirement of option grants and a set of requirements
that stock option plans must meet in order to qualify for favorable tax benefits. These include the
maximum number of options issued, exercise price, shareholders’ approval, etc. The requirements
outlined in the Final Regulations make stock option compensation less appealing for both
corporations and executives, due to its negative effect on firms’ earnings and by lowering exercise

6
prices. And, indeed we do find that CEO risk-taking incentives decreased from 2003 to 2005. This
exogenous reduction in CEO risk-taking incentives allows us to isolate the possible concern that
CEO compensation is endogenously determined. We find that, using this reduction in risk taking
incentives, our results and conclusions do not change.4
To address the concern that corporate leasing policy can affect firms’ returns and volatility,
and thus can have a feedback effect on CEO risk-taking incentives, we follow Coles et al. (2006)
and test our hypothesis using a simultaneous equation model. We obtain results similar to those
obtained in our earlier analyses, albeit with stronger economic significance. Controlling for pay-
performance sensitivity (delta), a $1 million increase equity-based vega leads to 40.25% decrease
in operating lease intensity, and a $1 million increase in asset-based vega leads to 16.21% decrease
operating lease intensity. Moreover, our results remain unchanged when we employ an alternative
measure of operating lease intensity.
Our study first contributes to the literature by connecting research that uses an option-
pricing framework to value lease contracts to research that examines the determinants of corporate
leasing. Second, to our knowledge, the only two studies that link managerial compensation and
lease intensity are Mehran et al. (1999) and Robicheaux et al. (2008). Mehran et al. (1999) argue
that high CEO stock ownership encourages more leasing, as a mechanism to reduce asset-specific
risk. Robicheaux et al. (2008) suggest that leasing serves as a mechanism to reduce the agency
cost of debt, and is used as a complement to other agency cost reducing mechanisms. Both studies
find a positive relationship between incentive compensation and lease intensity. However, ignored
in these two studies is the risk-inducing effect of incentive compensation, which can discourage
4 Note that we do not use the asset-based incentives measure in these particular tests, because asset-based vega results
from not only option grants, but also stock holdings. Although the FASB Final Regulations decreases option grants,
firms could substitute options with stocks, leading to unpredictable changes in asset-based vega.

7
leasing. To our knowledge, our paper is the first to examine this effect. After controlling for pay-
performance sensitivity, we present robust evidence that CEO’s risk-taking incentives have a
negative effect on operating lease intensity. Third, our paper contributes to the literature by
employing asset-based incentive measures. These measures, developed in Chesney et al. (2012),
have only been sparsely used in managerial compensation research. Most research uses equity-
based incentive measures. However, equity based measures neglect the risk-taking incentives
stemming from stock holdings. As Chesney et al. (2012) argue, for policy choices concerning asset
risk, instead of solely equity risk, the risk-taking incentives from stock holdings should not be
ignored. By documenting the effects of asset-based risk-taking incentives on corporate operating
lease intensity, our study provides validation of this alternative incentive measure.
The rest of the paper is organized as follows. Section II reviews related literature and
develops the main hypothesis. Section III describes our sample and presents summary statistics.
Section IV provides empirical evidence supporting our main hypothesis. Section V reports the
results of our robustness tests. Finally, Section VI concludes.
II. Literature Review and Hypotheses Development
A. Determinants of Corporate Lease Intensity
The vast majority of the corporate leasing literature attempts to identify leasing
determinants. Early research suggests an important role for taxes. This literature suggests that lease
financing displaces other forms of borrowing, and this is caused by tax effects (Franks and Hodges,
1978; Miller and Upton, 1976; Myers et al., 1976). While interest on debt and lease payments are
tax deductible, ownership of the asset generates additional tax benefits, in the form of depreciation

8
tax shields. Hence, a lease contract, which does not give the lessee ownership of the asset, transfers
the tax benefit to the lessor, to whom the associated tax shields may be more valuable. Therefore,
the tax-based explanations suggest that tax liability is negatively related to the lease activity. This
prediction is supported by empirical evidence. For example, Barclay and Smith (1995) and Sharpe
and Nguyen (1995) find that the presence of tax loss carryforwards is associated with greater lease
intensity. Furthermore, Graham et al. (1998) document a positive relationship between tax rates
and the use of debt and a negative relationship between tax rates and leasing. Related to the tax
argument, a stream of research examines whether leasing is used as a substitute to debt financing.
Theoretically, both financing methods represent a firm’s commitment to fixed payments and thus
should be substitutes. However, empirical evidence concerning this issue is inconclusive. Whereas
Bayless and Diltz (1986), Krishnan and Moyer (1994), Martson and Harris (1988), and Mukherjee
(1991) document evidence of substitution, Ang and Peterson (1984), Bowman (1980), and
Finucane (1988) find debt and leasing tend to be complementary. The positive relation between
debt and leasing may arise from firm characteristics that are conducive to both debt and leasing
(Mehran et al., 1999). Furthermore, Lewis and Schallheim (1992) suggest that when the lessee
transfers tax benefits to the lessor, tax deductions may become more valuable and, at the margin,
encourage the lessee to increase debt levels.
A second strand of leasing research examines their determinants from a financial
contracting perspective. Besides tax status, the financial contracting literature identifies two firm
characteristics that may influence the way a firm acquires new assets: ownership structure and the
investment opportunities set (Mehran et al. 1999). First, regarding ownership structure, both debt
and leasing expose owners to fixed obligations, but leasing allows the lessee to avoid asset value
risk. And, as managerial ownership increases, managers attempt to avoid risk. Therefore, this

9
literature predicts that managerial ownership should be associated with higher leasing intensity.
Mehran et al. (1999) provide empirical evidence supporting this prediction. Second, the nature of
a firm’s investment opportunities may have an effect on the conflicts between shareholders and
fixed-claim holders. For example, Myers (1977) suggests that firms with greater growth
opportunities should limit the use of debt to avoid underinvestment. Meanwhile, Stulz and Johnson
(1985) argue that senior claims, such as leasing, can limit the wealth transfer from shareholders to
bondholders and thus mitigate the underinvestment problem. Consistent with this argument, Smith
and Wakeman (1985) argue that, for a given amount of fixed claims, firms with greater growth
opportunities tend to lease more. Other empirical results regarding growth opportunities are mixed.
While Barclay and Smith (1995) find that the market-to-book ratio is positively related to leasing,
Graham et al. (1998) find the opposite. Other literature in this area focuses on the effect of financial
contracting costs. For example, Finucane (1988) documents a positive relation between leasing
and the use of mortgage debt. Sharpe and Nguyen (1995) and Krishnan and Moyer (1994) show
that financially constrained firms are more likely to lease.
Besides the tax and financial contracting arguments, some studies examine leasing from an
agency cost perspective. For example, Robicheaux et al. (2008) argue that leasing is a mechanism
that reduces agency cost of debt and is used along with other agency cost reducing mechanisms.
They provide evidence that firms that use more incentive compensation and have more outside
directors tend to lease more. Finally, Devos and Rahman (2014) suggest that leasing is associated
with agency costs as well, as they find that rural firms have lower lease intensity, due to the
difficulties that the lessor faces in monitoring the use of the leased asset.
B. Option-based Valuation of Leasing Contracts

10
The valuation of lease contracts is another prominent focus of the leasing literature.
Theoretical studies that develop valuation models are mostly built on option-pricing theory. For
example, McConnell and Schallheim (1983) build a general pricing model for seven types of lease
contracts under a compound option pricing framework. Similarly, Grenadier (1995) develops a
unified pricing model for the entire term-structure of lease rates, using a real-option approach. It
is important to note that these option-valuation pricing models for leasing are designed for
contracts that require the lessor to retain ownership of the asset, or true leases. In other words, the
lessee of the contract receives the benefits of the use, whereas the lessor receives the lease
payments and bears the risks associated with the asset’s residual value. As an example, Grenadier
(1995) suggests that the value of a T-year lease on an asset is equivalent to a portfolio that
simultaneously purchases the asset and writes a European call option on the asset with maturity T
and exercise price zero.
While this example in Grenadier (1995) illustrates the intuition behind the option feature
of leasing clearly, it can be refined to reflect the characteristics of different types of leases. For
example, consider the following T-year lease:
1. At time 0 , the market value of the asset is V0; and suppose that at time T, the market
value of the asset is VT;
2. The annual lease payment is p and the present value of all lease payments equals PVT;
3. At the end of year T, the lessee is required to return the asset to the lessor.
By entering the contract, the lessee, in this case, constructs a portfolio that purchases the asset at
time 0 for price V0, and simultaneously takes a short position in a futures contract on the asset that

11
requires the sale of the asset at time T and the predetermined sales price equals the future value of
V0 – PVT. At the end of the leasing term, both the lease contract and the portfolio leave the lessee
with no ownership of the asset, and the total cost to the lessee is PVT in both cases.
Alternatively, if the contract above gives the lessee the option to purchase the asset at the
end of the leasing term at price PT, this contract can be viewed as economically equivalent to a
portfolio that purchases the asset at time 0 for price V0, and simultaneously takes a long position
in a European put option on the asset with maturity T, with a premium equal to PVT plus the present
value of PT, minus V0, and an exercise price equal to PT. And, at time T, if VT < PT, the lessee will
not purchase the asset, which is equivalent to exercising the put option and selling the asset back
to the lessor at price PT. In this case, the total cost that the lessee incurs for this lease equals PVT.
Oppositely, if at time T, VT > PT, the lessee will purchase the asset at price PT, which is equivalent
to letting the put option expire without exercising, in which case, the lessee’s total cost is PVT plus
the present value of PT. Again, both the leasing contract and the portfolio leave the lessee with the
same position in the asset, and yield the same cost.
In both examples above, the lease contracts allow the ownership of the asset to remain with
the lessor and allow the lessee to lock the total cost of using the asset at PVT, without bearing the
risk of a loss in asset value at time T. In addition, when the lease contract offers a purchase option
at maturity, it gives the lessee the flexibility to decide whether to acquire ownership of the asset,
based on the contemporary market value and the predetermined purchase price. Therefore, the real
option feature embedded in both contracts offers a hedging mechanism to the lessee against the
risk of adverse changes in the asset’s residual value. In the next section, we develop our main
hypothesis based on this hedging property of lease contracts.

12
C. Hypotheses Development
CEO incentives have been shown to have a significant influence on executives’ hedging
activities. For example, Akron and Benninga (2013) find that managerial over-hedging increases
with equity-linked compensation levels. Similarly, Coles et al. (2006) find that higher CEO risk-
taking incentives are associated with riskier policy choices. Therefore, if leasing serves as a
hedging mechanism on a firm’s assets value, the CEO’s risk-taking incentives should play an
important role in the decision to lease. Specifically, we argue that CEO’s risk-taking incentives
discourage hedging and thus are negatively related to lease intensity.
However, as discussed above, the hedging feature of leasing only pertains to leases that
allow the lessor to retain the ownership of the leased assets. From the tax authority’s perspective,
this type of lease is defined as a true lease, whereas leases that involve the transfer of ownership
from the lessor to the lessee is referred to as nontrue leases (Graham et al. (1998)). Clearly, only
true leases possess the required feature. However, the classification of leasing from a financial
accounting perspective is different from the IRS’ classification. Specifically, a lease contract can
be classified as either a capital lease or an operating lease. With the establishment of a capital
lease, the lessee capitalizes the asset and records the associated debt obligation on the balance
sheet. In contrast, an operating lease represents off-balance-sheet finance and is only reflected in
the income statement as rent expenses (Sharpe and Nguyen, 1995). So, from a firm’s financial
statements, one can only separate capital leases from operating leases. However, one cannot easily
differentiate between true leases and nontrue leases. The Statement of Financial Accounting
Standards (SFAS) No. 13 outlines four criteria that apply to capital leases. Specifically, a lease is
defined as a capital lease if it meets at least one of the following criteria:

13
1. Ownership of the asset is transferred to the lessee at the end of the lease contract;
2. A bargain purchase option is available;
3. The lease term is equal to 75% or more of the remaining economic life of the asset;
4. The present value of lease payments equals to or exceeds 90% of the asset’s market
value.
Although the second criterion represents the lease contract with a purchase option illustrated in
Section II B, leases that meet any of the other three criteria do not offer hedging advantages. In
other words, capital leases are a mixture of true and nontrue leases, whereas operating leases can
be considered to consist of only true leases (Graham et al. (1998)). Accordingly, we hypothesize
that CEO’s risk-taking incentives are negatively related to firms’ operating lease intensity.
D. Equity- versus Asset-based Managerial Incentives
The sensitivities of CEO’s wealth to changes in firm performance and performance
volatility are some of the most used measures of managerial incentives. Specifically, delta
measures the dollar change in wealth to a 1% increase in stock return, and vega measures the dollar
change in wealth to a 1% increase in stock volatility. A number of empirical studies link these
incentive measures to various performance indicators. For example, Guay (1999) shows that stock
return volatility is contemporaneously associated with CEO vega. Cohen, Hall, and Viceira (2000)
find that CEO vega is positively related with leverage and stock volatility. Additionally, Rajgopal
and Shevlin (2002) document a positive relation between oil exploration risk and lagged vega.
Rogers (2002) argues that, while these studies provide evidence of an association between firm
risk-taking policy and managerial risk-taking incentives, they do not establish a clear causal

14
relation. Coles et al. (2006) address this endogeneity by assuming that shareholders choose vega,
along with delta, in order to implement second-best, value-maximizing policies. They provide
evidence that, controlling for delta, a higher vega leads to riskier policy choices.
While prior literature provides considerable evidence suggesting a role of managerial risk-
taking incentives in corporate policy choices, Chesney et al. (2012) argue that two potentially
troublesome issues exist when using the delta and vega measures that are used in the prior
literature. First, existing studies link equity-based vega, which measures the incentives of the CEO
to increase stock return volatility, to policy measures concerning the firm’s asset risk. This is
potentially troublesome as researchers may end up mixing asset risk and financial (leverage) risk.
Second, equity-based vega neglects the incentives embeded in stock holdings to take equity risk.
However, the incentives from stock ownership to take asset risk can be significant. To address
these issues, Chesney et al. (2012) construct measures of incentives that directly link to firms’
asset value and asset volatility, asset-based delta and vega. Specifically, they treat stocks as options
on the firm’s asset value, because they represent contigent claims on the firm’s assets. Similarly,
stock options, which represent contigent claims on the firm’s shares, are treated as compound
options on the firm’s asset value (Merton, 1974; Geske, 1979). Viewing stocks as contingent
claims on a firm’s asset adds substantial incentives for the CEO to take asset risk. The Chesney et
al. (2012) study documents that controlling for pay-performance sensitivity, asset-based vega is
significantly higher than equity-based vega. In particular, for their sample firms, the ratio of asset-
based vega to asset-based delta is, on average, 50% higher than the ratio of equity-based vega to
equity-based delta, which suggests that asset-based measures reflect stronger risk-taking
incentives than equity-based measures.

15
Since the aim of our study is to examine operating leases as a potential hedging instrument
for a firm’s assets, we deem it appropriate to also employ risk-taking incentive measures that
directly link to the firm’s asset value and volatility. Hence, in our empirical analyses, we examine
the effects of both equity-based and asset-based incentive measures on operating lease intensity.
III. Sample Description
A. Sample Construction and Data Source
We begin our sample construction with all non-financial Compustat firms, for which total
assets and operating lease information is available, between 1992 and 2015. Then, we calculate
incentive measures for all CEOs, for whom compensation data is available on Execucomp, during
the same period. To calculate equity-based delta and vega, we obtain monthly stock return data
from CRSP and risk-free rates from the Federal Reserve Bank Reports. In addition, to construct
the asset-based delta and vega, we obtain weekly US corporate 7-year bond effective yields, from
Merrill Lynch Bank of America. The bond yield data starts December 1996. Hence, we are able
construct equity-based delta and vega for the years 1992 to 2015, and asset-based delta and vega
for the years 1997 to 2015. To get our final sample we merge the CEO incentive measures to the
corresponding firm-year data from Compustat. We end up with 32,599 firm-year observations for
which we are able to calculate at least one of the incentive measures.
B. Variable Construction
The main dependent variable in our analyses is operating lease intensity. Following
Graham et al. (1998), we measure operating lease intensity (Opl_fc), as operating leases divided

16
by the fixed claim deflator, where operating leases are calculated as current rental expense plus
the present value of operating lease commitments for the next five years, discounted at 10%
(Graham, et al. (1998)), and the fixed claim deflator is defined as the book value of long-term debt
plus the present value of operating leases. Because this variable is central to all our analysis, we
require this variable to be available for all our sample firm-years. This requirement decreases our
sample size from 32,599 firm-year observations to 18,092 firm-year observations.
As mentioned earlier in the paper, the main independent variables in our paper measure
CEOs’ risk-taking incentives. Delta_eq is the equity-based delta, which measures the dollar
change in the CEO’s wealth, associated with a one percentage point increase in the firm’s stock
price (in $ millions). Delta_at is the asset-based delta, which measures the dollar change in the
CEO’s wealth associated with a one percentage point increase in the firm’s asset value (in $
millions). Vega_eq is the equity-based vega, measuring the dollar change in the CEO’s wealth
associated with a one percentage point increase in the firm’s stock return volatility (in $ millions).
And Vega_at is the asset-based vega, measuring the dollar change in the CEO’s wealth associated
with a one percentage point increase in the firm’s asset volatility (in $ millions). We provide details
of the calculations of Delta_eq, Delta_at, Vega_eq and Vega_at in appendix A.
Following prior literature, we also include a host of control variables in our analysis. On
the CEO level, we control for CashComp, which is total current compensation (salary plus bonus,
in $ thousands), and CEO Tenure (in years)5. As firm level control variables we use: LogSale,
defined as the natural logarithm of total sales; Leverage, defined as the sum of long-term debt and
debt in current liabilities, divided by the sum of long-term debt, debt in current liabilities, and the
market value of common stock; Rating, a dummy variable that takes the value of 1 if a firm has an
5 These last two variables come from Execucomp, all other financial data are from Compustat.

17
S&P domestic long-term issuer credit rating, zero otherwise; Earning, calculated as EBITDA
divided by sales; Oeneg, is a dummy variable equal to 1 if the book value of common equity is
negative, zero otherwise; NoDiv, a dummy variable equal to 1 if a firm pays no dividends in a
given year, zero otherwise; Volatility, defined as the annualized 36-month rolling standard
deviation of monthly stock returns; MB, calculated as the book value of assets minus the book
value of common equity plus the market value of common equity, divided by the book value of
assets; AgePPE, which measures equipment age and is calculated as one minus the ratio of net
PPE to gross PPE; TaxRate, defined as income taxes divided by pretax income; Ltloss, a dummy
variable that takes the value of 1 if a firm has a tax-loss carryforward exceeding current-year
EBITDA, zero otherwise; Stloss, a dummy variable that takes the value of 1 if a firm has a tax-
loss carryforward not exceeding current-year EBITDA, zero otherwise.
C. Summary Statistics
Table I contains the summary statistics of the sample. When it comes to CEO
characteristics, CEOs have a mean (median) Delta_eq of 0.6340 (0.1569), whereas the mean
(median) Delta_at is 0.4845 (0.0910). The mean (median) Vega_eq is 0.0801 (0.0121) and the
mean (median) Vega_at is 0.1339 (0.0032). We also find that the average (median) CEO tenure
of the CEOs in our sample is approximately 7 (5) years and that the average median CEO cash
compensation is $1,224,500 ($915,000).
Sample firms have an average operating lease intensity of 39.30%, measured by Opl_fc,
with a median of 23.44% and a standard deviation of 35.59%. In addition, 52.06% of the sample
firms have S&P public debt ratings, 43.43% do not pay dividends, 12.08% report large tax-loss
carryforwards, measured by Ltloss, and 26.12% report small tax-loss carryforwards, measured by

18
Stloss. The mean (median) of Leverage, Earning, Volatility, and MB, are 20.37% (15.34%),
15.95% (14.52%), 40.76% (36.27%) and 2.0413 (1.6112), respectively. The mean of LogSale is
about 7.35, which corresponds to total sales of about $1,554 million. Clearly, our sample firms are
much larger than the average Compustat firm. This is not surprising given that in order to be part
of our sample, Execucomp data are required and Execucomp only reports data for the 1,500 largest
firms, or so.
D. Equity- versus Asset-based Incentives
First, we present correlation coefficients, from a simple Pearson correlation test, of our
equity-based and asset-based incentive measures Table II presents the correlation coefficients
between Delta_eq, Delta_at, Vega_eq and Vega_at. Whereas Delta_eq and Delta_at are highly
correlated (the correlation coefficient is 0.8153), the correlation between Vega_eq and Vega_at is
only 0.3302. This result seems to confirm the notion that taking stock holdings into consideration
results in significantly different levels of risk-taking incentives.
To further investigate differences between our incentive measures, we conduct t-tests and
report the results of this analysis in Table III. At first glance, the full sample has a higher mean of
Delta_eq, compared to the mean of Delta_at. The difference in means is highly significant (the T
Stat is 19.37). However, after dividing the sample into four quartiles based on financial leverage
(Leverage), we find that when we move from the lowest to the highest leverage quartile, both
Delta_eq and the extent to which Delta_eq exceeds Delta_at decreases monotonically.
When we investigate vega we find a different pattern. First, we find that Vega_at is higher
than Vega_eq for the full sample, as indicated by a T Stat of -24.57. When we divide the sample
into quarters based on Leverage, we find that Vega_eq exceeds Vega_at in the two lower Leverage

19
quartiles, but Vega_at is higher than Vega_eq in the two higher Leverage quartiles. This suggests
that the difference between the equity-based and asset-based risk-taking incentive measures may
be driven by firm leverage. As leverage increases, the asset-based measure suggests stronger risk-
taking incentives than the equity-based measure.
As Coles et al. (2006) suggest, when examining the effects related to vega, it is important
to control for delta. Therefore, we also provide univariate comparisons of the ratios of vega to
delta between our equity- and asset-based measures. Doing so, which effectively controls for delta,
we find that our sample firms have higher Vega_at, when compared to Vega_eq. As shown in the
bottom row of the Table, the ratio of Vega_at to Delta_at is significantly higher than the ratio of
Vega_eq to Delta_eq for the full sample (the T Stat is -18.44) Interestingly, as firms’ financial
leverage increases, the extent to which the ratio of Vega_at to Delta_at exceeds the ratio of
Vega_eq to Delta_eq increases monotonically. This evidence is consistent with what was found
when Vega_eq and Vega_at were compared. This finding suggests that incentives to take asset risk
stemming from stock holdings increase when debt ratios increase. This finding is consistent with
the tendency of stockholders to expropriate debtholders’ wealth (Jensen and Meckling, 1976).
E. Univariate Analysis: Operating Lease Intensity and CEO Incentives
In Table IV, we report univariate evidence suggesting that there is a link between operating
lease intensity and CEO’s risk-taking incentives. Because Coles et al. (2006) suggest that the
empirical evidence of the effect of delta on risk-taking is unclear (Guay, 1999; John and John
1993), we focus our analysis on the effect of vega, while controlling for delta. Specifically, we
divide our sample into four quartiles based on measures of vega and the ratio of vega to delta, and

20
compare mean operating lease intensities (Opl_fc) of the lowest and the highest quartiles. The
differences in operating lease intensity between the quartiles are striking.
The lowest Vega_eq quartile has an average operating lease intensity of about 49%,
whereas the highest Vega_eq quartile has a mean operating lease intensity of about 36%. These
means are different from each other at the 1% level and suggest that there is a negative relation
between equity vega and operating lease intensity. We find very similar results when we use of
Vega_at as our incentive measure. There is a highly significant difference between the mean
operating lease intensities of the lowest (58%) and highest (25%) Vega_at quartiles. These results
continue to hold when we control for delta. In particular, when firms are divided into quartiles
based on the ratio of Vega_eq to Delta_eq, Opl_fc, the means of the lowest quartiles are always
lower than those of the highest quartiles, and they are significantly different from each other.
Overall, the evidence presented in this table is consistent with our main hypothesis that operating
leases serve as hedging instruments on the asset of the firm, leading to a negative relation between
CEO risk-taking incentives and operating lease intensity.
IV. Empirical Results: Managerial Incentives and Operating Leases
To test our main hypothesis in a multivariate setting, we employ the following base models:
Opl_fci,t = α0 + α1Vegai,t + α2LogSalei,t + α3Leveragei,t + α4Ratingi,t + α5Earningi,t + α6Oenegi,t +
α7Nodivi,t + α8MBi,t + α9AgePPEi,t + α10TaxRatei,t + α11Ltlossi,t + α12Stlossi,t + εi,t (1),

21
Opl_fci,t = β0 + β1Vegai,t + β2Deltai,t + β3LogSalei,t + β4Leveragei,t + β5Ratingi,t + β6Earningi,t +
β7Oenegi,t + β8Nodivi,t + β9MBi,t + β10AgePPEi,t + β11TaxRatei,t + β12Ltlossi,t + β13Stlossi,t
+ μi,t (2),
where Vegai,t is measured by Vega_eq and Vega_at, and Deltai,t is measured by Delta_eq and
Delta_at. If operating leases are used as hedging instruments on the firms’ assets, we should expect
that higher CEO risk-taking incentives, Vegai,t, leads to lower Opl_fc, thus α1 and β1 should be
negative and significant. As suggested in Coles et al. (2006), we control for pay-performance
sensitivity, Deltai,t, in model (2), but do not form a prediction of the sign of β2, given the ambiguous
effects of delta on risk-taking (Coles, et al. 2006; Guay, 1999; John and John 1993). Because the
dependent variable Opl_fc is a ratio censored between 0 and 1, we employ a Tobit regression
model in addition to a regular OLS regression model.
Table V reports the regression estimates of models (1) and (2), using both equity-based and
asset-based incentive measures and a Tobit regression model. As expected, the coefficients on both
Vega_eq and Vega_at are negatively and significantly related to Opl_fc. Specifically, when
Vega_eq increases by $1 million, operating lease intensity goes down by approximately 2.88%.
The results continue to hold after we control for Delta_eq. Here, economically, after controlling
for Delta_eq, when Vega_eq increases by $1 million, operating lease intensity goes down by
approximately 4.28%. The regressions using asset-based incentive measures produce similar
results. In particular, without controlling for delta, we find that when Vega_at increases by $1
million, operating lease intensity goes down by approximately 2.76%. And, after controlling for
Delta_at, a $1 million increase in Vega_at leads to 1.51% lower operating lease intensity (albeit
that this is not statistically significant, with a t-value of 1.61). We also observe patterns from

22
several control variables. For example, firms with long-term credit rating (Rating) and debt tend
to lease less, indicating substitutability between debt and leasing in our sample. Furthermore, firms
that have negative common equity (Oeneg) or pay no dividend (NoDiv) tend to lease more. This
evidence is consistent with the idea that financially distressed firms and firms with higher external
financing cost tend to use leasing to economize fixed capital costs (Sharpe and Nguyen, 1995;
Graham et al., 1998).
Overall, the analyses using the base regressions (equations (1) and (2)) support our main
hypothesis that higher CEO risk-taking incentives lead to a lower operating lease intensity. In the
following section, we perform some additional analyses to investigate the robustness of these
results.
V. Robustness Tests
A. FASB Final Incentive Stock Option Regulations
A possible endogeneity concern about the results obtained above may arise. It is possible
that managerial incentives and (financing) policy choices are jointly determined by a common set
of firm characteristics (Coles et al., 2006). Moreover, the negative relation between risk-taking
incentives and operating lease intensity does not suggest a clear direction of the causality. On one
hand, risk-taking incentives may influence the leasing decision. On the other hand, corporate
leasing policy may have an effect on the CEO’s risk-taking incentives, through changing the
firm’s return and volatility. To address this possible concern, we employ the fact that there was
an exogenous shock to the use of executive option grants. In 2004, the Financial Accounting
Standards Board (FASB) issued final rules with regard to expensing equity-based compensation,
in which stock options are required to be expensed for financial accounting purposes. In addition,

23
the Final Incentive Stock Option Regulations also provide detailed requirements that stock option
plans must meet in order to qualify for favorable tax benefits. These requirements include the
maximum number of options issued, a minimum exercise price, and shareholders’ approval, etc.
Especially, the expensing requirement in the Final Regulations made stock option plans less
favorable to corporations, because expensing option grants significantly reduces firms’ earnings
(Arya and Sun, 2004). The requirement on the minimum exercise price also made options less
appealing to executives. To investigate the effect of the regulations on CEO compensation, we
conduct a pairwise comparison of Vega_eq for the years 2003 and 2005. The results are reported
in Table VI, Panel A. CEO risk-taking incentives decreased by $10,500 from 2003 to 2005. This
reduction in CEO risk-taking incentives is likely caused by the exogenous regulation changes,
which allows us to preempt the possibilities that CEO compensation is endogenously determined
along with, or is influenced by corporate leasing policy. Hence, we repeat our base regressions
on the subsample of firms with non-zero equity-based vega in 2003, for the period of 2003 to
2005. The results of this analysis are reported in Table VI Panel B. Specifically, controlling for
Delta_eq, a $1 million increase in Vega_eq leads to a 10.48% decrease in Opl_fc. We do not use
the asset-based incentives measure in this test, due to the fact that both stock and option grants
result in asset-based vega. Although the FASB Final Regulations decreases the use of option
grants, the possibility that firms substitute option compensation with stocks makes a prediction
on the direction of possible changes in Vega_at difficult.
B. Simultaneous Equations
A potential issue related to our results that were based on our base regressions is that these
results present evidence of an association between operating lease intensity and CEO risk-taking

24
incentives, but may not reflect a casual relation. In particular, the negative association between
vega and operating leases suggests that CEOs with higher vega tend to implement riskier policies,
and thus avoid hedging through operating leases. Alternatively, leasing policy could have an
impact on CEO risk taking incentives, through changing the firm’s return and volatility. To address
this concern, we follow Coles et al. (2006) and estimate a system of equations using a three-stage
least squares (3SLS) model. In particular, we first suppose that shareholders choose vega, along
with delta, to implement second-best and value-maximizing leasing policy. Furthermore, possible
causation also runs from the implemented leasing policy to risk-taking incentives. Specifically,
suppose that the optimal leasing policy for a firm is to maintain a high operating lease intensity.
Shareholders will first design a low-vega compensation structure in order to encourage the CEO
to hedge through leasing. However, if the implemented high lease intensity, in turn, increases the
CEO’s vega, the CEO will have no incentive to continue leasing to maintain the implemented
leasing policy. Alternatively, if the implemented high operating lease intensity helps to keep the
CEO’s vega low, the CEO will be incentivized to keep lease intensity high in the firm, in which
case, optimal leasing policy will continue. In other words, a sustainable optimal leasing policy also
leads to a more efficient compensation structure. Therefore, we expect to observe not only that
higher risk-taking incentives lead to lower operating lease intensity, but also a feedback effect of
higher operating lease intensity leading to lower vega. We use the same set of control variables in
the delta and vega equations as Coles et al. (2006).
Table VII, Panel A and Panel B report our results pertaining to the 3SLS analyses, using
the equity-based and asset-based incentive measures, respectively. We find evidence that is
consistent with our earlier results. Both Vega_eq and Vega_at are negatively related to Opl_fc.
However, we find significantly larger economic effects using 3SLS. Specifically, from Panel A,

25
controlling for Delta_eq, when the sensitivity of the CEO’s wealth increases to a one percentage
point return volatility (Vega_eq) increases by $1 million the firm’s operating lease intensity
decreases by 40.25%. And controlling for Delta_at, a $1 million increase in Vega_at corresponds
to a 16.21% decrease in the firm’s operating lease intensity. What is also interesting is that we
observe the expected feedback effect of operating leases on vega, as a 1% increase in Opl_fc leads
to a $159 decrease in Vega_eq and a $420 decrease in Vega_at. Overall, the analysis using
simultaneous equations yields results that support our main hypothesis.
C. Alternative Measure of Operating Leases
To provide additional evidence showing the effects of CEO risk-taking incentives on
operating lease intensity, we adopt an alternative measure of operating leases. Specifically,
following Graham et al. (1998), we calculate Opl_mv, as operating leases divided by the market
value deflator, where the market value is defined as the book value of total assets minus the book
value of equity plus the market value of equity plus the present value of operating leases. We repeat
the Tobit and 3SLS tests in Tables VIII and IX, using Opl_mv as the measure of operating lease
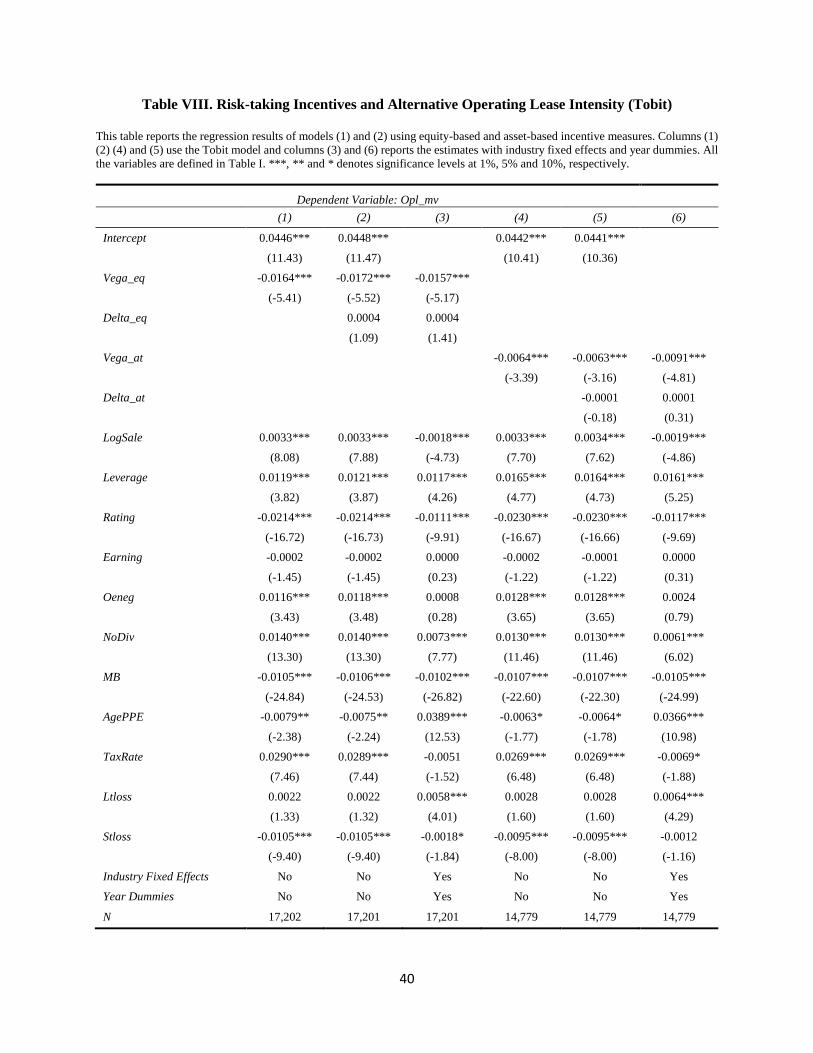
intensity. Table VIII reports the Tobit regressions results. In particular, without controlling for
Delta_eq, as the dollar change in the CEO’s wealth to a one percentage point increase in the firm’s
return volatility (Vega_eq) increases by $1 million, Opl_mv goes down by approximately 1.64%.
This decrease in operating lease intensity becomes 1.72% after we control for Delta_eq. In
addition, using asset-based incentive measures generate similar results. A $1 million increase in
the dollar change in the CEO’s wealth to a one percentage point increase in the firm’s asset
volatility (Vega_at) leads to 0.64% decrease in Opl_mv, without controlling for Delta_at, and
0.63% decrease in Opl_mv, after controlling for Delta_at.
26
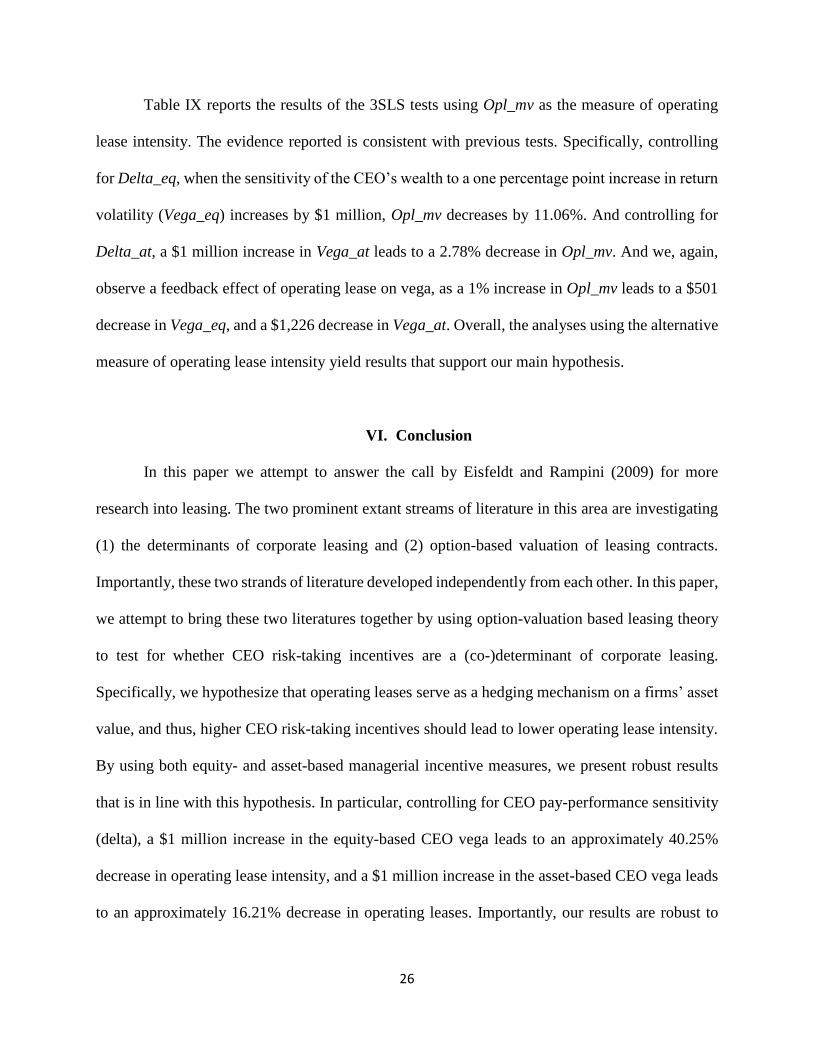
Table IX reports the results of the 3SLS tests using Opl_mv as the measure of operating
lease intensity. The evidence reported is consistent with previous tests. Specifically, controlling
for Delta_eq, when the sensitivity of the CEO’s wealth to a one percentage point increase in return
volatility (Vega_eq) increases by $1 million, Opl_mv decreases by 11.06%. And controlling for
Delta_at, a $1 million increase in Vega_at leads to a 2.78% decrease in Opl_mv. And we, again,
observe a feedback effect of operating lease on vega, as a 1% increase in Opl_mv leads to a $501
decrease in Vega_eq, and a $1,226 decrease in Vega_at. Overall, the analyses using the alternative
measure of operating lease intensity yield results that support our main hypothesis.
VI. Conclusion
In this paper we attempt to answer the call by Eisfeldt and Rampini (2009) for more
research into leasing. The two prominent extant streams of literature in this area are investigating
(1) the determinants of corporate leasing and (2) option-based valuation of leasing contracts.
Importantly, these two strands of literature developed independently from each other. In this paper,
we attempt to bring these two literatures together by using option-valuation based leasing theory
to test for whether CEO risk-taking incentives are a (co-)determinant of corporate leasing.
Specifically, we hypothesize that operating leases serve as a hedging mechanism on a firms’ asset
value, and thus, higher CEO risk-taking incentives should lead to lower operating lease intensity.
By using both equity- and asset-based managerial incentive measures, we present robust results
that is in line with this hypothesis. In particular, controlling for CEO pay-performance sensitivity
(delta), a $1 million increase in the equity-based CEO vega leads to an approximately 40.25%
decrease in operating lease intensity, and a $1 million increase in the asset-based CEO vega leads
to an approximately 16.21% decrease in operating leases. Importantly, our results are robust to

27
alternative econometric models and measures of operating leases. To our knowledge, our empirical
results present the first evidence of CEO risk-taking incentives being a determinant of corporate
leasing policy. Furthermore, by adopting the asset-based incentive measures developed in Chesney
et al. (2012), which have not been widely used in the managerial incentive compensation literature,
we provide supports to the argument that CEO stock holdings add significantly to their asset risk-
taking incentives.

28
References
Akron, S., & Benninga, S. (2013). Production and Hedging Implications of Executive Compensation
Scheme. Journal of Corporate Finance, 19, 119-139.
Ang, J., & Peterson, P. P. (1984). The Leasing Puzzle. Journal of Finance, 39, 1055-1065.
Arya, A., & Sun, P. (2004). Stock Option Repricing: Heads I Win, Tails You lose. Journal of Business
Ethics, 50, 297-312
Barclay, M. J., & Smith, C. W. (1995). The Priority Structure of Corporate Liabilities. Journal of Finance,
50, 899-916.
Bayless, M. E., & Diltz, J. D. (1986). An Empirical Study of the Debt Displacement Effects of Leasing.
Financial Management, 15, 53-60.
Black, F., & Scholes, M. (1973). The Pricing of Options and Corporate Liabilities. Journal of Political
Economy, 81, 637-654.
Bowman, R. G. (1980). The Debt Equivalence of Leases: An Empirical Study. 55, 237-253.
Chesney, M., Stromberg, J., & Wagner, A. F. (2012). Risk-taking Incentives and Losses in the Financial
Crisis. Working Paper.
Cohen, R. B., Hall, B. J., & Viceira, L. M. (2000). Do Executive Stock Options Encourage Risk-taking?
Working Paper, Harvard Business School.
Coles, J. L., Daniel, N. D., & Naveen, L. (2006). Managerial Incentives and Risk-taking. Journal of
Financial Economics, 79, 431-468.
Coles, J. L., Daniel, N. D., & Naveen, L. (2013). Calculation of Compensation Incentives and Firm-related
Wealth using Execucomp: Data, Program and Explanation. Working Paper.
Core, J., & Guay, W. (2002). Estimating the Value of Employee Stock Option Portfolios and Their
Sensitivity to Price and Volatility. Journal of Accounting Research, 40, 613-630.
Eisfeldt, A. L., & Rampini, A. A. (2009). Leasing, Ability to Repossess and Debt Capacity. Review of
Financial Studies, 22, 1621-1657.
Finucane, T. J. (1988). Some Empirical Evidence on the Use of Financial Leases. Journal of Financial
Research, 11, 321-333.
Flath, D. (1980). The Economics of Short-term Leasing. 18, 247-259.
Franks, J. R., & Hodges, S. D. (1978). Valuation of Financial Lease Contracts: A Note. Journal of Finance,
33, 657-669.
Geske, R. (1979). The Valuation of Compound Options. Journal of Financial Economics, 7, 63-81.

29
Graham, J., Lemmon, M. L., & Schallheim, J. S. (1998). Debt, Leases, Taxes, and the Endogeneity of
Corporate Tax Status. Journal of Finance, 53, 131-162.
Grenadier, S. R. (1995). Valuing Lease Contracts A Real Option Approach. Journal of Financial
Economics, 38, 297-331.
Grinblatt, M., & Titman, S. (1998). Financial Markets and Corporate Strategy. New York, NY:
Irwin/McGraw-Hill.
Guay, W. R. (1999). The Sensitivity of CEO Wealth to Equity Risk: An Analysis of the Magnitude and
Determinants. Journal of Financial Economics, 53, 43-71.
Jensen, M. C., & Meckling, W. H. (1976). Theory of the Firm: Managerial Behavior, Agency Costs and
Ownership Structure. Journal of Financial Economics, 3, 305-360.
John, T. A., & John, K. (1993). Top-management Compensation and Capital Structure. Journal of Finance,
48, 949-974.
Krishnan, V. S., & Moyer, R. C. (1994). Bankruptcy Costs and Financial Leasing Decision. Financial
Management, 23, 31-42.
Lewis, C. M., & Schallheim, J. S. (1992). Are Debt and Leases Substitutes? Journal of Financial and
Quantitative Analysis, 27, 497-511.
Marston, F., & Harris, R. S. (1988). Substitutability of Leases and Debt in Corporate Capital Structures.
Journal of Accounting, Auditing, and Finance, 3, 147-164.
McConnell, J. J., & Schallheim, J. S. (1983). Valuation of Asset Leasing Contracts. Journal of Financial
Economics, 12, 237-261.
Mehran, H., Taggart, R. A., & Yermack, D. (1999). CEO Ownership, Leasing and Debt Financing.
Financial Management, 28, 5-14.
Merton, R. (1974). On the Pricing of Corporate Debt: The Risk Structure of Interest Rates. Journal of
Finance, 3, 449-470.
Miller, M. H., & Upton, C. W. (1976). Leasing, Buying and the Cost of Capital Service. Journal of Finance,
31, 761-786.
Mukherjee, T. K. (1991). A Survey of Corporate Leasing Analysis. Financial Management, 20, 96-107.
Myers, S. C. (1977). Determinants of Corporate Borrowing. Journal of Financial Economics, 5, 147-175.
Myers, S. C., Dill, D. A., & Bautista, A. J. (1976). Valuation of Financial Lease Contracts. Journal of
Finance, 31, 799-819.
Rajgopal, S., & Shevlin, T. (2002). Empirical Evidence on the Relation between Stock Option
Compensation and Risk-taking. Journal Accounting and Economics, 33, 145-171.

30
Rogers, D. A. (2002). Does Executive Portfolio Structure Affect Risk Management? CEO Risk-taking
Incentives and Corporate Derivative Usage. Journal of Banking and Finance, 26, 271-295.
Ross, S., Westerfield, R., & Jaffe, J. (1996). Corporate Finance. Chicago, IL: Irwin.
Sharpe, S. A., & Nguyen, H. H. (1995). Capital Market Imperfections and the Incentive to Lease. Journal
of Financial Economics, 39, 271-294.
Smith, C. W. (1979). Applications of Option Pricing Analysis. In J. L. Bicksler, Handbook of Financial
Economics. Amsterdam: North-Holland.
Smith, C. W., & Wakeman, M. L. (1985). Determinants of Corporate Leasing Policy. Journal of Finance,
40, 895-908.
Stulz, R. M., & Johnson, H. (1985). An Analysis of Secured Debt. Journal of Financial Economics, 14,
501-521.
Williamson, O. E. (1988). Corporate Finance and Corporate Governance. Journal of Finance, 567-591.

31
Table I. Summary Statistics
This table reports summary statistics for variables used in our analyses. Delta_eq is the equity-based delta, which measures the
dollar change in the CEO’s wealth, associated with a 1% increase in the firm’s stock price (in millions); Delta_at is the asset-based
delta, which measures the dollar change in the CEO’s wealth associated with a 1% increase in the firm’s asset value (in millions);
Vega_eq is the equity-based vega, measuring the dollar change in the CEO’s wealth associated with a 0.01 increase in the firm’s
stock return volatility (in millions); Vega_at is the asset-based vega, measuring the dollar change in the CEO’s wealth associated
with a 0.01 increase in the firm’s asset volatility (in millions); CashComp is the total current compensation (salary plus bonus, in
thousands, from Execucomp); Tenure is CEO tenure (in years, from Execucomp). Financial data is from Compustat: Opl_fc is
calculated as operating leases divided by the fixed claim deflator, where operating leases are calculated as current rental expense
plus the present value of operating lease commitments for the next five years, discounted at average short-term borrowing rate, and
the fixed claim deflator is defined as the book value of long-term debt plus the present value of operating leases; Opl_mv is
calculated as operating leases divided by the market value deflator, where operating leases are calculated as current rental expense
plus the present value of operating lease commitments for the next five years, discounted at average short-term borrowing rate, and
the market value is defined as the book value of total assets minus the book value of equity plus the market value of equity plus the
present value of operating leases; LogSale is the natural logarithm of total sales; Leverage is defined as the sum of long-term debt
and debt in current liabilities, divided by the sum of long-term debt, debt in current liabilities, and the market value of common
stock; Rating is a dummy variable that takes the value of 1 if a firm has S&P domestic long-term issuer credit rating, zero otherwise;
Earning is calculated as EBITDA divided by sales; Oeneg is a dummy variable equal to 1 if the book value of common equity is
negative, zero otherwise; NoDiv is a dummy variable equal to 1 if a firm pays no dividends in a given year, zero otherwise;
Volatility, is calculated as the annualized 36-month rolling standard deviation of monthly stock returns (from CRSP); MB is
calculated as the book value of assets minus the book value of common equity plus the market value of common equity, divided
by the book value of assets; AgePPE, is calculated as one minus the ratio of net PPE to gross PPE; TaxRate is defined as income
taxes divided by pretax income; Ltloss is a dummy variable that takes the value of 1 if a firm has a tax-loss carryforward exceeding
current-year EBITDA, zero otherwise; and Stloss is a dummy variable that takes the value of 1 if a firm has a tax-loss carryforward
not exceeding current-year EBITDA, zero otherwise.
N Mean Median Standard Deviation Minimum Maximum
CEO Characteristics
Delta_eq 17,774 0.6340 0.1569 1.5961 0.0000 11.4874
Delta_at 15,234 0.4845 0.0910 1.2770 0.0000 8.5638
Vega_eq 17,772 0.0801 0.0121 0.1699 0.0000 0.9790
Vega_at 15,234 0.1339 0.0032 0.2948 0.0000 1.1720
CashComp 18,092 1224.5500 915.0000 1086.4400 1.8990 6755.0000
Tenure 18,092 7.2564 5.0000 7.2005 0.0000 34.0000
Firm Characteristics
Opl_fc 18,092 0.3930 0.2344 0.3559 0.0071 1.0000
Opl_mv 18,033 0.0461 0.0228 0.0646 0.0010 0.3605
LogSale 18,066 7.3489 7.2808 1.5950 3.1206 11.1272
Leverage 17,966 0.2037 0.1534 0.1995 0.0000 0.9021
Rating 18,092 0.5206 1.0000 0.4996 0.0000 1.0000
Earning 17,830 0.1595 0.1452 0.1614 -0.6997 0.6468
Oeneg 18,092 0.0249 0.0000 0.1557 0.0000 1.0000
NoDiv 18,092 0.4343 0.0000 0.4957 0.0000 1.0000
Volatility 18,092 0.4076 0.3627 0.1929 0.1459 1.0854
MB 17,975 2.0413 1.6112 1.3300 0.7602 8.4092
AgePPE 17,678 0.4762 0.4856 0.1516 0.0902 0.8387
TaxRate 18,092 0.3220 0.3503 0.1312 0.0000 0.9989
Ltloss 18,092 0.1208 0.0000 0.3259 0.0000 1.0000
Stloss 18,092 0.2612 0.0000 0.4393 0.0000 1.0000

32
Table II. Correlations between Equity- and Asset-based Incentives
This table reports Pearson correlations between the equity- and asset-based incentive measures of the full sample. All variables are
defined in Table I. ***, ** and * denotes significance levels at 1%, 5% and 10%, respectively.
Delta_eq Delta_at Vega_eq Vega_at
Delta_eq 1
Delta_at 0.8153*** 1
Vega_eq 0.3352*** 0.3428*** 1
Vega_at 0.1707*** 0.3206*** 0.3302*** 1

33
Table III. Univariate Comparison of Equity- and Asset-based Incentives
This table reports T-test results of the equity- and asset-based incentive measures, for the full sample, and for quartiles based on Leverage. All variables are defined in Table I. ***,
** and * denotes significance levels at 1%, 5% and 10%, respectively.
Full Sample Leverage Quartile 1 Leverage Quartile 2 Leverage Quartile 3 Leverage Quartile 4
Mean Median Mean Median Mean Median Mean Median Mean Median
Delta_eq 0.6340 0.1569 0.8089 0.1787 0.7571 0.2164 0.5432 0.1513 0.4408 0.1152
Delta_at 0.4845 0.0910 0.4146 0.0035 0.6047 0.1467 0.4807 0.1156 0.4412 0.0936
Delta_diff 0.1463*** -0.0021 0.4048*** 0.0204 0.1765*** -0.0028 0.0736*** -0.0120 -0.0339** -0.0253
T Stats (19.37) (17.92) (12.92) (7.74) (-2.55)
N 15,221 3,399 3,897 3,928 3,913
Vega_eq 0.0801 0.0121 0.0659 0.0089 0.0945 0.0141 0.0872 0.0169 0.0738 0.0121
Vega_at 0.1339 0.0032 0.0184 0.0000 0.0698 0.0020 0.1485 0.0096 0.2868 0.0343
Vega_diff -0.0573*** 0.0000 0.0355*** 0.0000 0.0258*** 0.0000 -0.0605*** -0.0024 -0.2188*** -0.0232
T Stats (-24.57) (16.19) (8.40) (-14.33) (-34.18)
N 15,225 3,396 3,893 3,927 3,913
Vega/Delta_eq 0.2281 0.0797 0.1705 0.0382 0.2028 0.0722 0.2561 0.1153 0.2819 0.1216
Vega/Delta_at 0.7926 0.1385 0.2901 0.0041 0.2341 0.0465 0.6294 0.1566 1.8474 0.5360
Vega/Delta_diff -0.5646*** -0.0304 -0.1265 0.0000 -0.0392*** -0.0022 -0.3747*** -0.0611 -1.5740*** -0.4038
T Stats (-18.44) (-0.90) (-5.15) (-19.28) (-21.76)
N 11,317 1,767 3,245 3,240 3,065

34
Table IV. Univariate Analysis: Risk-taking Incentives and Operating Lease Intensity
This table presents univariate T-test results on the relation between risk-taking incentives and operating lease intensity. All variables
are defined in Table I. ***, ** and * denotes significance levels at 1%, 5% and 10%, respectively.
Opl_fc
Vega_eq
Quartile1 0.4870
Quartile4 0.3550
T Stat (16.74)***
Vega_at
Quartile1 0.5802
Quartile4 0.2547
T Stat (39.41)***
Vega/Delta_eq
Quartile1 0.4685
Quartile4 0.3505
T Stat (14.85)***
Vega/Delta_at
Quartile1 0.4828
Quartile4 0.2075
T Stat (34.62)***

35
Table V. Risk-taking Incentives and Operating Lease Intensity (Tobit)
This table reports the regression results of models (1) and (2) using equity-based and asset-based incentive measures. Columns (1)
(2) (4) and (5) use the Tobit model and columns (3) and (6) report the estimates with industry fixed effects and year dummies. All
variables are defined in Table I . ***, ** and * denotes significance levels at 1%, 5% and 10%, respectively.
Dependent Variable: Opl_fc
(1) (2) (3) (4) (5) (6)
Intercept 0.5506*** 0.5552*** 0.5823*** 0.5751***
(28.64) (28.85) (28.42) (27.98)
Vega_eq -0.0288** -0.0428*** -0.0557***
(-1.96) (-2.82) (-3.90)
Delta_eq 0.0061*** 0.0040***
(3.81) (2.99)
Vega_at -0.0276*** -0.0151 -0.0130
(-3.09) (-1.61) (-1.45)
Delta_at -0.0087*** -0.0063***
(-4.13) (-3.51)
LogSale -0.0044** -0.0054*** -0.0137*** -0.0060*** -0.0046** -0.0152***
(-2.17) (-2.66) (-7.54) (-2.88) (-2.16) (-8.05)
Leverage -0.8047*** -0.8028*** -0.7524*** -0.7698*** -0.7766*** -0.7323***
(-52.71) (-52.58) (-58.23) (-46.45) (-46.64) (-50.80)
Rating -0.2194*** -0.2194*** -0.1668*** -0.2122*** -0.2117*** -0.1608***
(-35.31) (-35.35) (-31.64) (-32.20) (-32.13) (-28.19)
Earning -0.0059*** -0.0059*** -0.0012** -0.0062*** -0.0063*** -0.0012**
(-3.54) (-3.54) (-2.09) (-3.37) (-3.39) (-2.00)
Oeneg 0.0339** 0.0325** 0.0140 0.0516*** 0.0516*** 0.0282**
(2.06) (0.0481) (1.02) (3.06) (3.07) (1.98)
NoDiv 0.0938*** 0.0934*** 0.0562*** 0.0801*** 0.0805*** 0.0467***
(18.16) (18.10) (12.67) (14.71) (14.78) (9.80)
MB 0.0184*** 0.0167*** 0.0124*** 0.0080*** 0.0095*** 0.0068***
(8.59) (7.65) (6.92) (3.44) (4.07) (3.42)
AgePPE 0.1887*** 0.1965*** 0.2322*** 0.1594*** 0.1530*** 0.2042***
(11.56) (11.96) (15.89) (9.28) (8.87) (12.99)
TaxRate 0.0489*** 0.0483** -0.0342** 0.0439** 0.0437** -0.0354**
(2.56) (2.53) (-2.13) (2.19) (2.18) (-2.06)
Ltloss 0.0514*** 0.0507*** 0.0518*** 0.0487*** 0.0490*** 0.0513***
(6.35) (6.26) (7.66) (5.86) (5.90) (7.25)
Stloss -0.0482*** -0.0481*** -0.0223*** -0.0441*** -0.0440*** -0.0209***
(-8.88) (-8.87) (-4.79) (-7.79) (-7.77) (-4.23)
Industry Fixed Effects No No Yes No No Yes
Year Dummies No No Yes No No Yes
N 17,201 17,200 17,200 14,778 14,778 14,778

36
Table VI. Risk-taking Incentives and Operating Lease Intensity (2004 FASB Regulation Shock)
This table presents the analysis of the effects of FASB Final Stock Incentive Option Regulations in 2004. Panel A reports the
pairwise comparison of Vega_eq between 2003 and 2005. Panel B reports the regression results of models (1) and (2) using equity-
based for the subsample of firms with non-zero Vega_eq in 2003, for the period of 2003 to 2005. Columns (1) (2) use the Tobit
model and columns (3) reports the estimates with industry fixed effects and year dummies. All variables are defined in Table I.
***, ** and * denotes significance levels at 1%, 5% and 10%, respectively.
Panel A: Pairwise Comparison of Vega_eq
2003 2005 Difference (2005-2003)
Mean 0.2081*** 0.2130*** -0.0105**
T-stats (29.98) (26.72) (-2.16)

37
(Table VI Continued)
Panel B: Risk-taking Incentives and Operating Lease Intensity (2003-2005)
Dependent Variable: Opl_fc
(1) (2) (3)
Intercept 0.4618*** 0.4629***
(8.05) (8.06)
Vega_eq -0.0986*** -0.1048*** -0.0709***
(-3.25) (-3.27) (-2.68)
Delta_eq 0.0025 0.0031
(0.60) (0.90)
LogSale 0.0156** 0.0153** -0.0005
(2.52) (2.47) (-0.10)
Leverage -0.9857*** -0.9854*** -0.8916***
(-21.61) (-21.61) (-23.70)
Rating -0.2660*** -0.2661*** -0.1977***
(-16.13) (-16.13) (-14.47)
Earning -0.0085 -0.0085 -0.0032
(-1.31) (-1.32) (-1.62)
Oeneg 0.0813 0.0818 0.0818**
(1.60) (1.61) (1.97)
NoDiv 0.0791*** 0.0789*** 0.0494***
(5.83) (5.80) (4.40)
MB 0.0294*** 0.0290*** 0.0197***
(4.70) (4.60) (4.02)
AgePPE 0.1690*** 0.1711*** 0.2235***
(3.81) (3.85) (5.81)
TaxRate 0.0733 0.0733 0.0027
(1.39) (1.39) (0.06)
Ltloss 0.0833*** 0.0835*** 0.0706***
(4.12) (4.13) (4.32)
Stloss -0.0341** -0.0338** -0.0123
(-2.44) (-2.43) (-1.07)
Industry Fixed Effects No No Yes
Year Dummies No No Yes
N 2,652 2,652 2,652

38
Table VII. Risk-taking Incentives and Operating Lease Intensity (3SLS)
This table reports the 3SLS estimation on the relationship between equity-based (Panel A) and asset-based (Panel B) risk-taking
incentive measures and operating lease intensity. All variables are defined in Table I. ***, ** and * denotes significance levels at
1%, 5% and 10%, respectively.
Panel A: Equity-based Risk-taking Incentives and Operating Lease (N=17,200)
Opl_fc Delta_eq Vega_eq
Intercept 0.5015*** -1.7302*** -0.0914*** (29.00) (-22.00) (-11.56) Vega_eq -0.4025*** 3.9438*** (-14.76) (60.99)
Delta_eq 0.0424*** 0.0387*** (13.46) (55.28) Tenure 0.0554*** (38.21)
Volatility 0.2966*** 0.0497*** (4.83) (7.99) Opl_fc 0.0491 -0.0159*** (1.30) (-4.14) CashComp 0.0001*** (52.49) LogSale 0.0021 0.1395*** 0.0086*** (1.07) (17.54) (9.93) Leverage -0.7524*** -0.0537 -0.0512*** (-56.13) (-0.77) (-7.22) Rating -0.1981*** (-36.30)
Earning -0.0018*** (-2.89)
Oeneg 0.0400*** (2.77)
NoDiv 0.0837*** (18.55)
MB 0.0062*** 0.2435*** 0.0036*** (3.12) (26.89) (3.79) AgePPE 0.1650*** (11.58)
TaxRate 0.0495*** (2.98)
Ltloss 0.0455*** (6.48)
Stloss -0.0431*** (-9.06)

39
(Table VII continued)
Panel B: Asset-based Risk-taking Incentives and Operating Lease (N=14,778)
Opl_fc Delta_at Vega_at
Intercept 0.4994*** -1.2300*** -0.0418***
(27.06) (-17.95) (-2.70) Vega_at -0.1621*** 2.4822*** (-11.06) (77.00) Delta_at -0.0173*** 0.1223***
(-5.24) (74.60) Tenure 0.0325*** (26.44) Volatility -0.0976* 0.2170***
(-1.81) (18.00) Opl_fc -0.0915*** -0.0420***
(-2.77) (-5.61) CashComp 0.0000***
(14.85) LogSale 0.0033* 0.1520*** -0.0064***
(1.71) (22.82) (-3.82) Leverage -0.6523*** -1.1439*** 0.4039***
(-41.45) (-18.70) (29.68) Rating -0.1919*** (-32.54) Earning -0.0017*** (-2.74) Oeneg 0.0531*** (3.53) NoDiv 0.0789*** (16.24) MB 0.0099*** 0.1710*** -0.0168***
(4.69) (21.03) (-8.96) AgePPE 0.1255*** (8.19) TaxRate 0.0443** (2.49) Ltloss 0.0452*** (6.14) Stloss -0.0414*** (-8.19)
40
Table VIII. Risk-taking Incentives and Alternative Operating Lease Intensity (Tobit)
This table reports the regression results of models (1) and (2) using equity-based and asset-based incentive measures. Columns (1)
(2) (4) and (5) use the Tobit model and columns (3) and (6) reports the estimates with industry fixed effects and year dummies. All
the variables are defined in Table I. ***, ** and * denotes significance levels at 1%, 5% and 10%, respectively.
Dependent Variable: Opl_mv
(1) (2) (3) (4) (5) (6)
Intercept 0.0446*** 0.0448*** 0.0442*** 0.0441***
(11.43) (11.47) (10.41) (10.36)
Vega_eq -0.0164*** -0.0172*** -0.0157***
(-5.41) (-5.52) (-5.17)
Delta_eq 0.0004 0.0004
(1.09) (1.41)
Vega_at -0.0064*** -0.0063*** -0.0091***
(-3.39) (-3.16) (-4.81)
Delta_at -0.0001 0.0001
(-0.18) (0.31)
LogSale 0.0033*** 0.0033*** -0.0018*** 0.0033*** 0.0034*** -0.0019***
(8.08) (7.88) (-4.73) (7.70) (7.62) (-4.86)
Leverage 0.0119*** 0.0121*** 0.0117*** 0.0165*** 0.0164*** 0.0161***
(3.82) (3.87) (4.26) (4.77) (4.73) (5.25)
Rating -0.0214*** -0.0214*** -0.0111*** -0.0230*** -0.0230*** -0.0117***
(-16.72) (-16.73) (-9.91) (-16.67) (-16.66) (-9.69)
Earning -0.0002 -0.0002 0.0000 -0.0002 -0.0001 0.0000
(-1.45) (-1.45) (0.23) (-1.22) (-1.22) (0.31)
Oeneg 0.0116*** 0.0118*** 0.0008 0.0128*** 0.0128*** 0.0024
(3.43) (3.48) (0.28) (3.65) (3.65) (0.79)
NoDiv 0.0140*** 0.0140*** 0.0073*** 0.0130*** 0.0130*** 0.0061***
(13.30) (13.30) (7.77) (11.46) (11.46) (6.02)
MB -0.0105*** -0.0106*** -0.0102*** -0.0107*** -0.0107*** -0.0105***
(-24.84) (-24.53) (-26.82) (-22.60) (-22.30) (-24.99)
AgePPE -0.0079** -0.0075** 0.0389*** -0.0063* -0.0064* 0.0366***
(-2.38) (-2.24) (12.53) (-1.77) (-1.78) (10.98)
TaxRate 0.0290*** 0.0289*** -0.0051 0.0269*** 0.0269*** -0.0069*
(7.46) (7.44) (-1.52) (6.48) (6.48) (-1.88)
Ltloss 0.0022 0.0022 0.0058*** 0.0028 0.0028 0.0064***
(1.33) (1.32) (4.01) (1.60) (1.60) (4.29)
Stloss -0.0105*** -0.0105*** -0.0018* -0.0095*** -0.0095*** -0.0012
(-9.40) (-9.40) (-1.84) (-8.00) (-8.00) (-1.16)
Industry Fixed Effects No No Yes No No Yes
Year Dummies No No Yes No No Yes
N 17,202 17,201 17,201 14,779 14,779 14,779

41
Table IX. Risk-taking Incentives and Alternative Operating Lease Intensity (3SLS)
This table reports the 3SLS estimation on the relationship between equity-based (Panel A) and asset-based (Panel B) risk-taking
incentive measures and operating lease intensity. All the variables are defined in Table I. ***, ** and * denotes significance levels
at 1%, 5% and 10%, respectively.
Panel A: Equity-based Risk-taking Incentives and Operating Lease (N=17,201)
Opl_mv Delta_eq Vega_eq
Intercept 0.0372*** -1.7082*** -0.0993*** (9.23) (-22.61) (-13.11) Vega_eq -0.1106*** 3.9431*** (-17.40) (60.95)
Delta_eq 0.0076*** 0.0387*** (10.28) (55.24) Tenure 0.0554*** (38.23)
Volatility 0.3034*** 0.0468*** (5.01) (7.62) Opl_mv 0.1994 -0.0501*** (1.19) (-2.94) CashComp 0.0001*** (52.30) LogSale 0.0049*** 0.1380*** 0.0091*** (10.92) (17.49) (10.59) Leverage 0.0096*** -0.0967 -0.0372*** (3.09) (-1.59) (-6.02) Rating -0.0209*** (-16.46)
Earning -0.0002 (-1.57)
Oeneg 0.0120*** (3.57)
NoDiv 0.0140*** (13.27)
MB -0.0111*** 0.2462*** 0.0029*** (-23.81) (26.75) (2.99) AgePPE -0.0073** (-2.19)
TaxRate 0.0280*** (7.25)
Ltloss 0.0023 (1.42)
Stloss -0.0105*** (-9.46)

42
(Table IX continued)
Panel B: Asset-based Risk-taking Incentives and Operating Lease (N=14,779)
Opl_mv Delta_at Vega_at
Intercept 0.0420*** -1.2854*** -0.0627*** (9.73) (-19.59) (-4.23) Vega_at -0.0278*** 2.5026*** (-8.16) (77.81)
Delta_at 0.0004 0.1233*** (0.56) (75.28) Tenure 0.0321*** (26.18)
Volatility -0.1376** 0.2101*** (-2.57) (17.55) Opl_mv 0.1064 -0.1226*** (0.73) (-3.69) CashComp 0.0000*** (14.84) LogSale 0.0038*** 0.1541*** -0.0052*** (8.38) (23.39) (-3.11) Leverage 0.0264*** -1.0716*** 0.4398*** (7.19) (-19.67) (36.89) Rating -0.0230*** (-16.69)
Earning -0.0002 (-1.27)
Oeneg 0.0132*** (3.76)
NoDiv 0.0135*** (11.90)
MB -0.0106*** 0.1715*** -0.0185*** (-21.47) (20.71) (-9.70) AgePPE -0.0072** (-2.00)
TaxRate 0.0256*** (6.17)
Ltloss 0.0031* (1.78)
Stloss -0.0095*** (-8.05)

43
Appendix A: Calculations of Managerial Incentives
A. Equity-based Incentives
We calculate equity-based incentive measures following Core and Guay (2002), Coles et
al. (2006) and Coles et al. (2013), using the Black-Scholes formula (Black and Scholes, 1973).
The value of a plain vanilla call is given by
𝐶 = 𝑆𝑒−𝛿𝑇𝑁1(𝑑1_𝑒𝑞) − 𝐾𝑒−𝑟𝑇𝑁1(𝑑2_𝑒𝑞) (3)
with
𝑑1_𝑒𝑞 =𝑙𝑛(𝑆 𝐾⁄ )+[(𝑟−𝛿)+
𝜎𝑆2
2]𝑇
𝜎𝑆√𝑇 (4)
𝑑2_𝑒𝑞 = 𝑑1_𝑒𝑞 − 𝜎𝑆√𝑇 (5)
where 𝑁1 denotes the standard normal cumulative distribution function, S is the stock price, K is
the strike price of the option, 𝜎𝑆is the annualized 36-month rolling standard deviation of stock
returns, r is the risk-free rate6, 𝛿 is the annualized dividend yield, and T represents the maturity of
the option.
The equity-based deltas of stocks and options are calculated as follows:
𝐷𝑒𝑙𝑡𝑎_𝑒𝑞𝑠𝑡𝑜𝑐𝑘 = 1 (6)
𝐷𝑒𝑙𝑡𝑎_𝑒𝑞𝑜𝑝𝑡𝑖𝑜𝑛 = 𝑒−𝛿𝑇𝑁1(𝑑1_𝑒𝑞)(𝑆 100⁄ ) (7)
6 Following Chesney et al. (2012), we use the 7-year risk free rate.
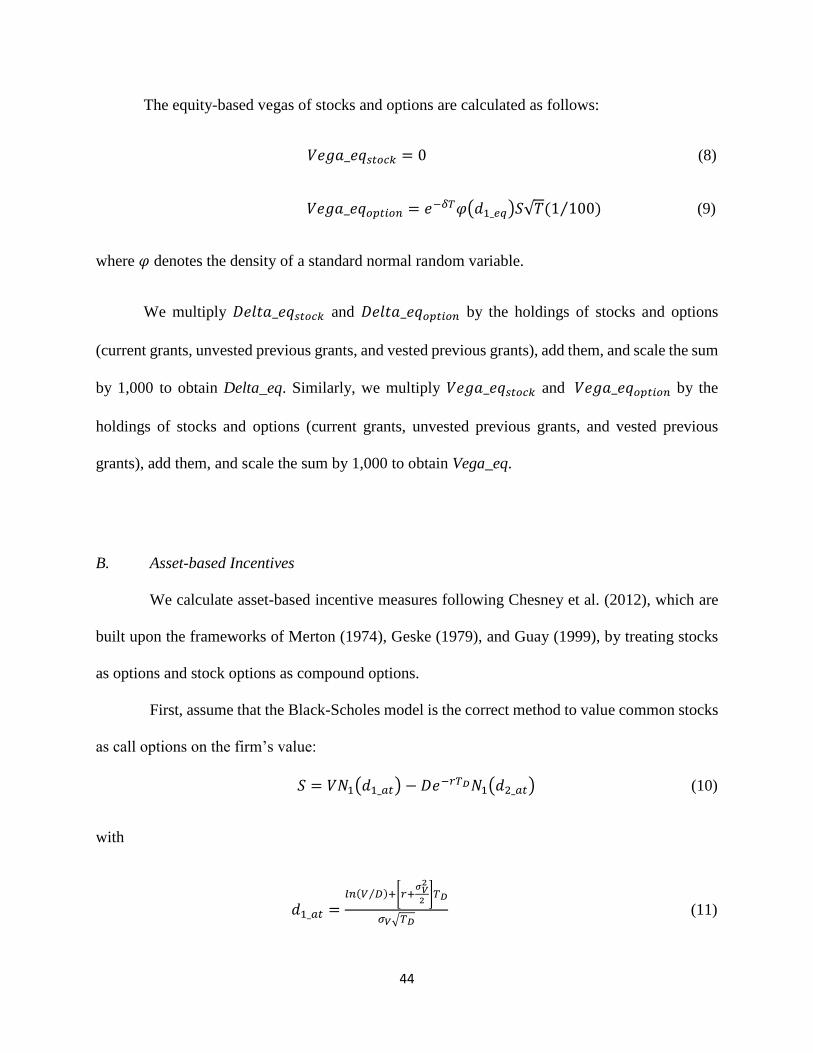
44
The equity-based vegas of stocks and options are calculated as follows:
𝑉𝑒𝑔𝑎_𝑒𝑞𝑠𝑡𝑜𝑐𝑘 = 0 (8)
𝑉𝑒𝑔𝑎_𝑒𝑞𝑜𝑝𝑡𝑖𝑜𝑛 = 𝑒−𝛿𝑇𝜑(𝑑1_𝑒𝑞)𝑆√𝑇(1 100⁄ ) (9)
where 𝜑 denotes the density of a standard normal random variable.
We multiply 𝐷𝑒𝑙𝑡𝑎_𝑒𝑞𝑠𝑡𝑜𝑐𝑘 and 𝐷𝑒𝑙𝑡𝑎_𝑒𝑞𝑜𝑝𝑡𝑖𝑜𝑛 by the holdings of stocks and options
(current grants, unvested previous grants, and vested previous grants), add them, and scale the sum
by 1,000 to obtain Delta_eq. Similarly, we multiply 𝑉𝑒𝑔𝑎_𝑒𝑞𝑠𝑡𝑜𝑐𝑘 and 𝑉𝑒𝑔𝑎_𝑒𝑞𝑜𝑝𝑡𝑖𝑜𝑛 by the
holdings of stocks and options (current grants, unvested previous grants, and vested previous
grants), add them, and scale the sum by 1,000 to obtain Vega_eq.
B. Asset-based Incentives
We calculate asset-based incentive measures following Chesney et al. (2012), which are
built upon the frameworks of Merton (1974), Geske (1979), and Guay (1999), by treating stocks
as options and stock options as compound options.
First, assume that the Black-Scholes model is the correct method to value common stocks
as call options on the firm’s value:
𝑆 = 𝑉𝑁1(𝑑1_𝑎𝑡) − 𝐷𝑒−𝑟𝑇𝐷𝑁1(𝑑2_𝑎𝑡) (10)
with
𝑑1_𝑎𝑡 =𝑙𝑛(𝑉 𝐷⁄ )+[𝑟+
𝜎𝑉2
2]𝑇𝐷
𝜎𝑉√𝑇𝐷 (11)

45
𝑑2_𝑎𝑡 = 𝑑1_𝑎𝑡 − 𝜎𝑉√𝑇𝐷 (12)
where V is implied firm value per share, D represents the book value of debt per share, TD is the
maturity of long-term debt (following Guay (1999) and Chesney et al. (2012), we set TD equal to
7.5 years), and 𝜎𝑉 represents firm value return volatility. Following the portfolio theory method of
Guay (1999), we calculate 𝜎𝑉 as follows:
𝛿𝑉2 = 𝑊𝐷
2𝜎𝐷2 + 𝑊𝑆
2𝜎𝑆2 + 2𝑊𝐷𝑊𝑆𝐶𝑜𝑣 (𝜎𝐷, 𝜎𝑆) (13)
where 𝑊𝐷 and 𝑊𝑆 are the weights of debt and equity in the firm’s capital structure, 𝜎𝐷 is the
annualized 52-week rolling standard deviation of bond returns using the US corporate 7-year bond
effective yield from Merrill Lynch Bank of America. Further, assume that 𝐶𝑜𝑟𝑟(𝜎𝐷 , 𝜎𝑆) =
𝐶𝑜𝑣 (𝜎𝐷,𝜎𝑆)
√𝜎𝐷2 𝜎𝑆
2= 1, which leads to 𝐶𝑜𝑣 (𝜎𝐷, 𝜎𝑆) = 𝜎𝐷𝜎𝑆. Therefore,
𝜎𝑉2 = 𝑊𝐷
2𝜎𝐷2 + 𝑊𝑆
2𝜎𝑆2 + 2𝑊𝐷𝑊𝑆𝜎𝐷𝜎𝑆 (14)
Using (8) to (12), we back out the implied firm value per share, V.
The price of a compound call option is given by:
𝐶𝑜𝑚𝑝𝑜𝑢𝑛𝑑 𝐶 = 𝑉𝑁2(ℎ + 𝜎𝑉√𝑇, 𝑘 + 𝜎𝑉√𝑇𝐷 , √𝑇 𝑇𝐷⁄ ) − 𝐷𝑒−𝑟𝑇𝐷𝑁2(ℎ, 𝑘, √𝑇 𝑇𝐷⁄ ) −
𝐾𝑒−𝑟𝑇𝑁1 (ℎ) (15)
with
ℎ =𝑙𝑛(𝑉 �̅�⁄ )+[𝑟−
𝛿𝑉2
2]𝑇
𝛿𝑉√𝑇 (16)

46
𝑘 =𝑙𝑛(𝑉 𝐷⁄ )+[𝑟−
𝛿𝑉2
2]𝑇𝐷
𝛿𝑉√𝑇𝐷 (17)
where N2 denotes the bivariate cumulative normal distribution function. And �̅� is the value of V
as the solution to the following equation7:
𝑉𝑁1(𝑘 + 𝜎𝑉√𝑇𝐷 − 𝑇) − 𝐷𝑒−𝑟(𝑇𝐷−𝑇)𝑁1(𝑘) − 𝐾 = 0 (18)
The asset-based deltas for stocks and options are calculated as follows:
𝐷𝑒𝑙𝑡𝑎_𝑎𝑡𝑠𝑡𝑜𝑐𝑘 = 𝑁1(𝑑1𝑎𝑡)(𝑉 100⁄ ) (19)
𝐷𝑒𝑙𝑡𝑎_𝑎𝑡𝑜𝑝𝑡𝑖𝑜𝑛 = 𝑁2(ℎ + 𝜎𝑉√𝑇, 𝑘 + 𝜎𝑉√𝑇𝐷 , √𝑇 𝑇𝐷⁄ )(𝑉 100⁄ ) (20)
The asset-based vegas for stocks and options are calculated as follows:
𝑉𝑒𝑔𝑎_𝑎𝑡𝑠𝑡𝑜𝑐𝑘 = 𝜑(𝑑1𝑎𝑡)𝑉√𝑇(1 100⁄ ) (21)
𝑉𝑒𝑔𝑎_𝑎𝑡𝑜𝑝𝑡𝑖𝑜𝑛 = 𝑉 [𝜑(ℎ + 𝜎𝑉√𝑇)𝑁1 (𝑘+ 𝜎𝑉√𝑇𝐷−√
𝑇
𝑇𝐷(ℎ+𝜎𝑉√𝑇)
√1−𝑇
𝑇𝐷
) √𝑇 + 𝜑(𝑘 +
𝜎𝑉√𝑇𝐷)𝑁1 ( ℎ+ 𝜎𝑉√𝑇−√
𝑇
𝑇𝐷(𝑘+𝜎𝑉√𝑇𝐷)
√1−𝑇
𝑇𝐷
)𝑑(𝑘+ 𝜎𝑉√𝑇𝐷)
𝑑𝜎𝑉] − 𝐷𝑒−𝑟𝑇𝐷𝜑(𝑘)𝑁1 (
ℎ− √𝑇
𝑇𝐷𝑘
√1−𝑇
𝑇𝐷
)𝑑𝑘
𝑑𝜎𝑉 (22)
with
𝑑𝑘
𝑑𝜎𝑉= −
𝑘
𝜎𝑉− √𝑇𝐷 (23)
7 Following Chesney et al. (2012), for cases where T > TD, we set TD equal to T plus 2 years.

47
𝑑(𝑘+ 𝜎𝑉√𝑇𝐷)
𝑑𝜎𝑉= −
𝑘
𝜎𝑉 (24)
We multiply 𝐷𝑒𝑙𝑡𝑎_𝑎𝑡𝑠𝑡𝑜𝑐𝑘 and 𝐷𝑒𝑙𝑡𝑎_𝑎𝑡𝑜𝑝𝑡𝑖𝑜𝑛 by the holdings of stocks and options
(current grants, unvested previous grants, and vested previous grants), add them, and scale the sum
by 1,000 to obtain Delta_at. Similarly, we multiply 𝑉𝑒𝑔𝑎_𝑎𝑡𝑠𝑡𝑜𝑐𝑘 and 𝑉𝑒𝑔𝑎_𝑎𝑡𝑜𝑝𝑡𝑖𝑜𝑛 by the
holdings of stocks and options (current grants, unvested previous grants, and vested previous
grants), add them, and scale the sum by 1,000 to obtain Vega_at.