the national stream quality - usgs
TRANSCRIPT


THE NATIONAL STREAM QUALITY
ACCOUNTING NETWORK {NASQAN)
SOME QUESTIONS AND ANSWERS
By John F. Ficke and Richard 0. Hawkinson
GEOLOGICAL SURVEY CIRCULAR 719
1975

United States Department of the Interior STANLEY K. HATHAWAY, Secretary
Geological Survey V. E. McKelvey, Director
Library of Congress Cataloging in Publication Data
Ficke, John F
The National Stream Quality Accounting Network (NASQAN)-Some questions and answers.
(Geological Survey circular ; ) Bibliography: p.
Supt. of Docs. no.: I 19.4/2:
1. Water quality management-United States. 2. Water-Pollution-United States-Measurement. 3. National Stream Quality Accounting NetwOTk. I. Hawkinson, Richard 0., joint author. II. Title. III. Sr.ries: United States. Geological Survey. Circular ;
QE75.C5 [TD223] 557.3'08s [628.1'61'0973] 75-619140
Free on application to the U.S. Geological Survey, National Cenfw, lesion, Va. 22092

CONTENTS
Page Page
Introduction -----------------------------·--- 1 Operation ----------------------------------- 8
Purpose ------------------------------------ 1 How many stations are in NASQAN and where
What is NASQAN? ----------------------- 1 are they? ------------------------------·- 8 What water-quality characteristics are measurE'd Why is it needed? ------------------------- 1
How are NASQAN stations different from those at NASQAN stations? ------------------- 8 Will changes be made in the suite of chara~-that have operated for many years? ________ 2
Who began NASQAN? -------------------- 2 teristics measured at N ASQAN stations? _ _ 8
Accounting networks ------------------------ 3 Who collects data at NASQAN stations? ---·- 8 How long will stations be operated? -------- 10
What are the geographical units used in level I What will be done with the data? ----------- 11 accounting? ----------------------------- 3 What will be the principal problems in tl ~
How are NASQAN stations located within interpretation of the data? --------------·- 12 accounting units? ------------------------ 5 What is the policy regarding NASQAN sta-
How are stations in coastal units selected? ____ 5 tions near reservoirs? -------------------- 12 How are sites selected for stations in closed Summary ---------------------------------- 12
basins? -------------------------------- 5 References ---------------------------------- 12
COVER
ILLUSTRATIONS
Mosaic of ERTS imagery showing parts of the Tennessee, Ohio, and Mississippi Rivers. Uncontrolled mosaic from photo prints of band 6 ERTS multispectral scanner data, constructed by the Maps and Surveys Branch of the Tennessee Valley Authority.
Page
FIGURE 1. Map of United States showing outlines of regions and accounting
2.
3.
4.
TABLE 1.
units --------------------------------------------------
Map showing accounting units. in New England ---------------
Map of United States showing NASQAN stations in operation
January 1, 1975 ---------------------------------------
Graph showing numbers of stations in NASQAN, 1973-78 ------
TABLE
Stations in the National Stream Quality Accounting Network on January 1, 1975 ------------------------------------------
4
6
9
10
Page
15
III


The National Stream Quality Accounting Network ( NASQAN)
Some Questions and Answers
By JOHN F. FICKE and RICHARD 0. HAWKINSON
INTRODUCTION
One of the major new efforts of the U.S. Geological Survey is the National Stream Quality Accounting Network (NASQAN). This circular is intended to answer some of the fre-. quently asked questions concerning concepts used in establishing NASQAN, its purposes, design, value, and future plans.
PURPOSE
What is NASQAN?
NASQAN is a series of stations at which systematic and continuing measurements are made to determine the quality of the Nation's streams. Design of the network specifies measurement of a broad range of water-quality characteristics which were selected to meet many of the information requests of groups involved in planning and management on a national or regional scale. The primary objectives are (1) to account for the quantity and quality of water moving within and from the United States, (2) to depict areal variability, (3) to detect changes in stream quality, and ( 4) to lay the groundwork for future assessments of changes in stream quality.
Why is it needed?
Data of the type needed to determine longterm trends in the physical, chemical, and biological characteristics of the Nation's surface waters are relatively sparse. Wolman (1971) and Enviro Control (1972) have documented the problems associated with the assessment
1
of changes in characteristics of surface waters. Wolman stated some fairly obvious problems involving statistical analysis of water-quality data· these include (1) the relatively short lengt'h of hydrologic records, (2) changes in location and frequency of observations, (3) tbe fact that comparisons of specific variables related to surface-water quality require systematic correlation with hydrologic behavior, and ( 4) the fact that knowledge of temporal variability of a specific constituent is often essential to the detection of a trend. Enviro Control's study verified the existence of the first problem, noting that of 70,000 stations in the Environmental Protection Agency's waterquality data-storage system, only 142 stations had 8 or more years of records of samples taken as frequently as at quarterly intervals.
Another problem is the unbalanced areal distribution of existing stations having adequate data for statistical analysis. Seventy percent of the stations used in the Enviro Control study were in the northwestern and northeastern United States. Steele and others (197 4) noted a deficiency of stations in the northcentral and southeast United States. With continued operation of the series of stations established under NASQAN, a set of systematically collected baseline water-quality data will be available for nationwide studies involving transport of and changes in ·chemical constituents in surface waters.
NASQAN also will provide data needed to assess regional trends in order to evaluate the

effectiveness of programs to control water quality. Such assessments will provide local and State officials with some of the information required to judge whether revisions in programs or new legislation is needed. However, the broad-scale information from N ASQAN is not likely to be detailed enough to assess the effectiveness of pollution-control measures on a localized basis, as prescribed by Public Law 92-500. Enough insight should be supplied by the NASQAN data, however, to identify problem areas which require detailed monitoring of subbasins to evaluate the effects of land use and treatment measures.
How are NASQAN stations different from those that have operated for many years?
Stations in NASQAN are different in that they form a nationwide network in which station location was based upon hydrologic subdivision of river basins. This assures fairly uniform coverage of the entire United States, including Puerto Rico. NASQAN stations can be further characterized by the facts that a uniform operational design has been designated and station operations are committed to fulfilling the long-term obje·ctives of detection of trends in water quality.
In the past, it has not been possible, on a nationwide basis, to determine areal differences and (or) changes in water quality over time because most data-collection programs have been operated to satisfy local objectives or objectives of special programs. Consequently, the stations have been operated for short periods, have been moved frequently, and have experienced variation in constituents sampled. However, it should be noted that many of the stations specified in NASQAN were previously operated for other programs and that some historical data exist for certain chemical constituents (primarily the common constituents) that will be useful in evaluation of trends. Unfortunately, most previous data~ollection programs did not monitor the suites of constituents (nitrogen and phosphorus species, bacteria, minor elements, organic indicators, and biological parameters) that are of primary concern in establishing the suitability of water for a given use. The N ASQAN program, :as designed, will help to eliminate this deficiency as well as, in time, some of the problems which Wolman
2
Sampling from bridge.
(1971) discussed; notably, establishing the data base needed for nationwide evaluation of trends in quality of surface waters, and the need to account for the movement of materials in surface waters.
In addition, NASQAN will use other agencies' documentation of the man-induced changes that occur within basins to help explain changes that may occur in water quality. Water-quality data from adjacent nonnetwork stations and other environmental data will also be used in the analyses and interpretation of NASQAN data, particularly where changes in the waterquality characteristics of a river are detected.
Who began NASQAN?
NASQAN was established by the U.S. Department of Interior, Geological Survey. The initial need for a national network to provide water data for Federal agencies was recognized in Bureau of the Budget Circular A-67, dated August 28, 1964. The circular stated that the national network is the mechanism for providing data on the quantity and quality of surface water and ground water, including sedi-

Sampling by boat in a large river.
ment load of streams, and it assigns the responsibility for network operation to the Department of the Interior. The Office of Water Data Coordination of the U.S. Geological Survey was designated by the Secretary of the Interior to design and coordinate the National Water Data Network.
As a basis for network design activities, the Office of Water Data Coordination used the "level-of-information concept" to specify three categories (levels I, II, and III) into which data-collection activities can be classified (Langford and Davis, 1970). Level I data constitute a basic level of information nationwide and thus are suitable for broad national and regional planning and as a foundation for more detailed work in the future.
The need for a national river-quality accounting network to provide broad-scale accounting data (Office of Water Data Coordination level I information) was a primary component of a Departmental "thrust document" on river-quality monitoring in March 1972. On the basis of this impetus, NASQAN became an official activity of the Geological Survey.
3
Data-collection activities were either initiated or upgraded at 50 stations in January 1973, and at another 50 s·tations in January 197 4, to meet the design specifications for network operation. Appropriations during ihe 1975 fiscal year permitted expansion to at least one station in each unit of the level I accounting network, thereby placing the present level of network operations at 345 stations.
ACCOUNTING NETWORKS What are the geographical units used in level I
accounting? Through the Water Resources Planning Act
of 1965 (PL 89-80), the Water Resources Council was established to provide a framework that would facilitate coordination of water-resource and land-resource activities. In compliance with this charge, Water Resources Council (1970) divided the United States into waterplanning regions and subregions. The U.S. Geological Survey's Office of Water Data Coordination has carried the division one step further by specification of accounting units. Figure 1 outlines the existing 21 regions and 324 accounting units in the United States.

~
0 !>0 100 150MILE
.. · ............... ~ ... · r----..-0 200 ~00 600 MILES I" t,__,./'- '
MITO RICO ·o-
0 200 - 600 KILOMfTR£5
EXPLANATION
Water Resource1
Region boundary
Accounting unit
boundary
FIGURE !.-Outlines of the 21 regions and the 324 accounting units as defined by the U.S. Water Resources Council and the Office of Water Data Coordination (U.S. Department of Interior, Geological Survey).

The Office of Water Data Coordination is presently rev1smg certain accounting-unit boundaries, using input from other Federal, State, and local agencies. Revisions receive approval from the Water Resources Council before publication of base maps (Hydrologic Unit Map -1974, U.S. Geological Survey, issued by State) bearing the hydrologic subdivisions.
Accounting units in New England are shown at a larger scale (1: 5,000,000) in figure 2 to illustrate in greater detail than in figure 1 how stream drainage patterns influence selection of station locations. Figure 2 shows that accounting units along coastlines are drained by numerous streams flowing into the sea; similar situations exist along the shores of the Great Lakes. In inland accounting units, however, most of the outflow drains by single streams.
How are NASQAN stations located within accounting units?
Guidelines for level I accounting that have been established specify that data will measure water discharge and water quality for approximately 90 percent of the surface water leaving an accounting unit. This means that most NASQAN stations will measure or account for discharge and quality at a stream station near the downstream end of each accounting unit. Obvious exceptions must be made for units that discharge to the oceans or to the Great Lakes, across international boundaries, or into closed basill8. Current revisions of accounting-unit boundaries have been reviewed and apparently have little affect on the locations of stations specified in 1972 for inclusion in the network.
How are stations in coastal units selected?
As figure 2 shows, some units stretch along coastlines (oceall8 or the Great Lakes) where numerous stations would be needed to sample 90 percent of the flow. This problem has been recognized in the design of NASQAN, and special criteria have been established for selecting station locations within coastal accounting units. NASQAN stations have been located to provide a sampling of from 30 to 50 percent of the water flowing from the coastal accounting unit. Such sampling is possible because adjacent drainage basins usually have similar physio-
5
Automatic continuous monitor.
graphic and hydrologic characteristics. Therefore, it may reasonably be inferred that waterquality data from properly selected stations may be extrapolated to represent the remainder of the discharge. In choosing sites for stations, short-term reconnaissance studies are needed to confirm similarity of waters. It is also necessary to recognize and evaluate obvious differences in such parameters as population patterns, geology, or industrial development.
How are sites selected for stations in closed basins?
Accounting units with only interior drainage have been considered on a case-by-case basis in the selection of NASQAN station locations. The principal policy has been to select sites on streams that represent as much of the drainage area of or flow within the accounting unit as possible.

\
0 20 40 60 80 100 MILES
~· \ \ \ \ _j I I I I I 0 20 40 60 80100 KILOMETRES
39·~~~~L---~----JL ____ _L __ ~~----------------------~ FIGURE 2.-Accounting units in New England.
6

10 0
10 0
APPROXIMATE SCALE
10
10 20
20 30 MILES
30 KILOMETRES
Part of the coast of Georgia from ERTS imagery, February 1974. (NASA ERTS E-1568-15284, band 7.)
7

OP·ERATION
How many stations are in NASQAN and where are they?
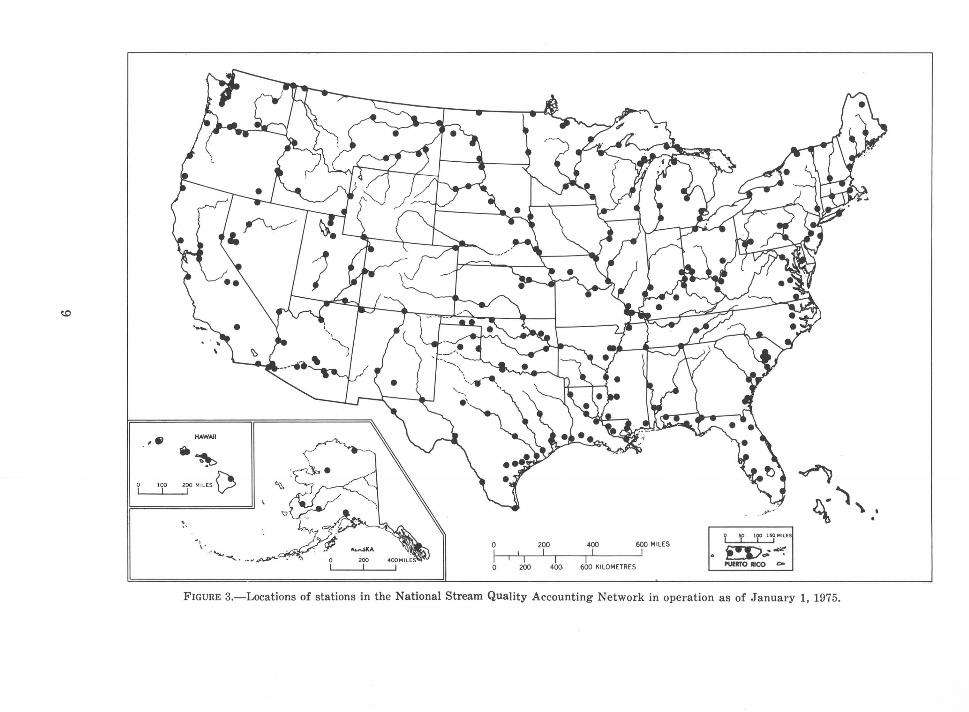
As of January 1, 1975, 345 NASQAN stations were being operated. As stated earlier, the plan used in selecting l~tions of existing and future stations calls for most of them to be near the points of outflow from ac-counting units. Locations of the current 345 stations are shown in figure 3. Details of station location, including the names of towns or other cultural features near the stations, and latitudes and longitudes are given in table 1 (see p. 15).
Plans call for NASQAN to reach its final design size of 525 stations by October 1976. Figure 4 summarizes the network's past growth as well as the projected expansion to full implementation.
What water-quality characteristics are measured at NASQAN stations?
The following list summarizes the characteristic·s measured at network stations and the minimum frequencies of measurements under present network design.
Characteristics measured at NASQAN stations [Fl"equencies: C, continuous; D, daily; M, monthly; Q, quarterly]
Field determinations : Frequency
Water temperature ----------------- 1 C, D, or M Specific conductance ---------------- 1 C, D, or M
pli -------------------------------- M Discharge ------------------------- C Coliform, fecal --------------------- M Streptococci, fecal ------------------- M
Common constituents (dissolved) 2: _______ 3 M or Q
(Bicarbonate, carbonate, total hardness, non-carbonate hardness, calcium, magnesium, fluoride, sodium, potassium, dissolved solids, silica, turbidity, chloride, and sulfate).
Major nutrients: Phosphorus, total 4 as P ------------Nitrite plus nitrate, total as N ------Nitrogen, total Kjeldahl as N --------
Trace elements (total and dissolved): _____ _ (Arsenic, cadmium, chromium, cobalt,
copper, iron, lead, manganese, mer-cury, selenium, and zinc).
Organics and biological: Organic carbon, total --------------Phytoplankton, total, cells/ml -------Phytoplankton, identification of 3
co-dominants ---------------------
M M M Q
Q M
M
8
Characteristics measured at N ASQAN stations-Con. Organics and biological-Continued
Phytoplankton, 3 co-dominants, percent of total -------------------------- M
Periphyton, biomass, dry weight g/m" _ Q Periphyton, biomass, ash weight g/m2
_ Q Periphyton, chlorophyll a ------------ Q Periphyton, chlorophyll b ------------ Q
Suspended sediment: Suspended sediment concentration ---- M Percent finer than 0.062-mm sieve
diameter ------------------------- M 1 Continuous or daily depending upon whether the station is
equipped with a monitor or whether daily observations are made. Monthly measurements made at stations where a long-term record is available.
2 Dissolved constituents in water are those remaining after filtering samples through 0.45-micrometre membrane filters.
a Quarterly or monthly, depending upon whether relationships have been established between conductance and concentrations of various common constituents.
4 Total concentrations are those determined by analyses of unfiltered samples. They include both dissolved and suspended materials.
In addition to the measurements shown above, determinations of pesticide residues and radiochemical constituents are made at selected stations. These stations can be viewed as subnetworks of NASQAN.
Will changes be made in the suite of characteristics measured at NASQAN stations?
Yes, but in a manner that conforms with the stated objectives of the network. A continual examination will be made for correlations among measured characteristics. If correlations are established so that changes in one characteristic can be used to estimate changes in others, certain measurements may be discontinued. Also, some measurements may be added as water-quality characteristics change in importance. Consideration presently is being given to including two 24-hour dissolved oxygen profiles each year, to be conducted during critical periods ; to monthly determination of ammonia nitrogen; and to an increased frequency of determination of total organic carbon, from quarterly to monthly. Any such adjustments in the operational design of the network will be made to coincide with the beginning of a water year (October 1).
Who collects data at NASQAN stations?
Most of the NASQAN data are and will be collected by the Geological Survey. However,
~
-· HAWAII
jt~
0 100 200 MILES ~
0 200 400 .600 MILES I I I I I I I I I
0 200 400 600 KILOMETRES
y f lf l,MilE
~-~~· MITO IICO <>
~ ~~,
FIGURE 3.-Locations of stations in the National Stream Quality Accounting Network in operation as of January 1, 1975.

CALENDAR YEAR
FIGURE 4.-Numbers of stations in the National Stream Quality Accounting Network, 1973-78.
some of the stations are operated partly by other Federal agencies, such as the Environmental Protection Agency and the U.S. Army Corps of Engineers, and some are operated partly by State and local organizations. For those stations operated by the Geological Survey, some are paid for partly by monies from other Federal agencies, from State and local cooperators, and from other more specialized Federal data-collection programs of the Geological Survey. Because of local interests or needs, it is not uncommon to have several different sources interested in and paying for total operations of a single station.
10
How long will stations be operated?
Indefinitely, as required by one of the network objectives-to assess changes in water quality with time. However, some changes in operating practices will be made, as explained previously in answer to a question regarding changes in the suite of characteristics. Such changes will be made only after it ha.s been determined that the proposed modification, presumaJbly a change in frequency of sampling, will not affect the fulfillment of network objectives.

Automatic analyzer in Central Laboratory, Doraville, Ga.
What will be done with the data?
Present plans call for data collected under the auspices of N ASQAN to be published in three types of publications.
First, all data will be published in the annual Geological Survey basic-data reports on a State-by-State basis. Copies of these reports can be obtained from Geological Survey district offices or from Geological Survey headquarters, Reston, Virginia 22092. Users of STORET, the computerized data base of the Environmental Protection Agency, can retrieve
11
NASQAN data by using Geological Survey station numbers (see table 1).
The second type of report is an annual summary report depicting the Nation's surfacewater quality. This report, the prototype of which should be completed by August 1975, will use ta;bulations of the yearly range in concentrations of specific constituents, statistical summaries, and graphical presentations.
The third type of report, which will be more analytical, will deal with the changes (or lack thereof) in water quality. Preliminary work by

the Geological Survey (Steele and others, 1974) employed an approach which may be used to ·evaluate trends in water quality. This type of report will be prepared less frequently (every 3 to 5 years) .
NASQAN interpretive reports (the second and third types) will be published in forms suitable for use by hydrologists as well as nontechnical persons.
What will be the principal problems in the interpretation of the data?
Undoubtedly there will be several problems in dat~a interpretation, but two will probably be hardest to resolve: (1) Differentiating yearto-year variability (wet-year, dry-year effects) from the long-term trends and from the real areal differences in variables significantly affected by flow conditions, ·and (2) adjusting for the effects of streamflow regulation (particularly by reservoirs) or streamflow diversions on the water-quality conditions.
To resolve the first problem, several statistical 'and other analytical techniques are being evaluated to discover their utility in determining significant long-term trends from the data. For some w·ater-quality characteristics, 5 or more years of data may be needed before adequate bases exist for detecting longterm trends.
Regarding the second problem, reservoirs are particularly significant because they alter the pattern of streamflow during the year and also influence many water-quality characteristics. Seasonal streamflow patterns are affected by patterns of reservoir release, but the annual volumes of flow usually do not change, except for evaporation losses. The quality of water released from reservoirs differs from that of inflow, in terms of temperature, dissolved solids, sediment, nutrients, dissolved oxygen, and other characteristics. There is much literature describing the processes that take place in reservoirs, but quantitative modeling is not far enough advanced to be helpful in determining the precise degree to which the reservoirs will affect water quality at N ASQAN stations.
What is the policy regarding NASQAN stations near reservoirs?
The lower boundaries of many of the accounting units used to establish the hydrologic
design of N ASQAN cross stream channels at or just below dams. Because an objective of the network operation is to account for the quantity and quality of water actually flowing from one accounting unit into another, the placement of sampling stations below reservoirs is necessary. On the other hand, N ASQAN's goal of interpreting changes in water quantity and quality in terms of cultural changes in the basin is not fully served qy a station located below a reservoir because the effects of the reservoir will mask most other influences. Therefore, operation of NASQAN will involve evaluation of the effects of some reservoirs by placing secondary stations above several large reservoirs. These stations ~are referred to ~as secondary because they will be used to collect a more limited suite of data and probably will operate for a limited number of years.
SUMMARY N ASQAN is designed to describe the water
quality of the Nation's streams and rivers on a systematic and continuing basis. NASQAN station operation supplements the ongoing activities of the U.S. Geological Survey and other agencies. Whereas other operations meet local and short-term needs, N ASQAN provides for nationwide quantitative descriptions of the physical, chemical, and biological characteristics of streams. There presently are 345 stations in the network, and network design allows for an ultimate size of 525 stations.
12
REFERENCES Enviro Control, 1972, National assessment of trends
in water quality: U.S. Dept. Commerce, Natl. Tech. Inf. Service, PB-210 669, 52 p.
Langford, R. H., and Davis, G. H., 1970, National system for water data: Am. Soc. Civil Engineers Proc., Jour. Hydraulics Div., v. 96, no. HY7, p. 1391-1401.
Steele, T. D., Gilroy, E. J., and Hawkinson, R. 0., 1974, An assessment of areal and temporal variations in streamflow quality using selected data from the National Stream Quality Accounting Network: U.S. Geol. Survey open-file rept. 74-217, 210 p.
Water Resources Council, 1970, Water resources regions and subregions for the national assessment of water and related land resources: Washington, D.C., U.S. Water Resources Council, 188 p., 6 plates.
Wolman, M. G., 1971, The Nation's rivers: Science, v. 174, no. 4012, p. 905-918.

TABLE 1


TABLE !.-Stations in the National Stream Quality Accounting Network on January 1, 1975
USGS STATION NAME ST 1 LATI• LONG I• STAT.NO. TUDE TUDE
DEG/ DEG/ MIN MIN
02420000 ALABAMA RIVEH NEAR MONTGOMERY AL 3224 08624 02429500 ALABAMA RIVE~ AT CLAIBORNE AL 3133 08731 02449000 TOMBIGBEE HIVER AT GAINESVILLE AL 3249 08809 02469762 TOMBIGBEE R. AT COFFEEVILLE L~D NR. CFVL AL 3145 08808
1SOc4800 STIKINE RIVER NEAR WRANGELL AK 5642 13207 15294350 SUSITNA RIVER AT SUSITNA STATION AK 6132 15033 15304000 KUSKOKWIM RIVER AT CROOKED CREEK AK 6152 15807 15565447 YUKON RIVER AT PILOT STATION AK 6156 16253 !5744~00 KOBUK RIVER NEAR KIANA AK 6658 16007 15896000 KUPARUK RIVER NEAR OEADHOHSE AK 7017 14858
09380000 COLORADO RIVER AT LEES FEHHY AZ 3652 11135 09'+01200 LITTLE COLORADO RIVER AT CAMERON AZ 3553 11125 09'+21500 COLORADO RIV~R BELOW HOOVER DAM AZ 3601 11444 09'+26600 BILL WILLIAMS R BL MINERAL WASH NR PLANETAZ 3416 11402 09429490 COLORADO RIVER ABOVE IMPERIAL DAM AZ 3253 11428 09'+66500 GILA HIVER AT CALVA AZ 3311 11031 09473500 SAN PEDRO RIVER AT WINKELMAN AZ 3259 11049 09474000 GILA RIVER AT KELVIN AZ 3306 11059 09489000 SANTA CRUZ RIVER NEAR LAVEEN AZ 3314 11210 09502000 SALT RIVER B~LOw STEWART MT DAM AZ 3334 11132 09510000 VEHDE RIVER ~ELOW BARTLETT DAM AZ 3349 11138 09518000 GILA RIVER ABOVE DIV AT GILLESPIE DAM AZ 3314 11246 09520700 GILA RIVER NtAR MOUTH NEAR YUMA AZ 3243 11433 09522000 COLORADO RIVER AT N.INT.BURY.AB MOREL OS DAZ 3243 11443
07032000 MISSISSIPPI HIVER AT MEMPHIS (TN)AR 3508 09004 07047800 ST FRANCIS RlVER NEAR PARKIN AR 3516 09034 07047900 ST FRANCIS BAV AT RIVERFRONT AR 3516 09041 07077800 WHITE RIVER AT CLARENDON AR 3441 09119 07250550 ARKANSAS RIVER AT DAM 13 NEAR VAN BUREN AR 3521 09418 07263620 ARKANSAS RIVER AT L AND 0 b LIT ROCK AR 3440 09209 07265450 MISSISSIPPI RIVER NEAR ARKANSAS CITY AR 3334 09115 07362000 OUACHITA RIVER AT CAMDEN AR 3336 09249
09'+24190 COLORADO RIVER AQUED. NR SAN JACINTO CA 3349 11658 10254970 NEW RIVER AT INT. BORY. NRe CALEXICO CA 3240 11530 10277400 OWENS RIVER BLw TINEMAHA De NR BIG PINE CA 3703 11813 10261500 MOJAVE R. AT LOW NARROWS NR VICTORVILLE CA 3434 11719 11074000 SANTA ANA RIVER ~ELOW PRADO DAM CA 3353 11739 11103010 LOS ANGELES HeAT WILeST.BHDG.AT LONG BCH CA 3348 11812 11152500 SALINAS RIVER NEAR SPRECKELS CA 3638 12140 11250000 FRAINT•KERN CANAL AT FRAINT CA 3700 11942 11303500 SAN JOAQUIN RIVER NEAR VERNALIS CA 3741 12116
1 See footnote at end of table.
15

TABLE 1.-St-ations in the National Stream Quality Accounting Network on January 1, 1975-Continued
USGS STATION NAME ST 1 LATI- LONG I• STAT.NO. TUC'E TUDE
DEG/ DEG/ Ml~' MIN
11325500 MOKE~UMNE ~lVER AT WOODBRIUGE CA 38l0 12118 11447650 SACRAMENTO RIVER AT FREEPO~T CA 381:7 12130 11467000 RUSSIAN RIVER NEAR GUERNEVILLE CA 38rO 12256 11530500 KLAMATH RIVER NEAR KLAMATH CA 41?1 12358
06764000 SOUTH PLATTE RIVER AT JULESBURG co 40~9 10215 07137500 ARKANSAS RIVER NR COOLIDGE (KS) co 38r2 10201 08251500 RIO GRANDE NEAR LOBATOS co 37rs 10545 09152500 GUNNISON RIVER NEAR GRAND JUNCTION co 38~9 10827 09163530 COLORADO HIVER BLW. COLO•UTAH STATE LINE co 39r5 10906 09251000 YAMPA RIVER ~EAR MAYBELL co 40?0 10802 092600.00 LITTLE SNAKE RIVER NEAR LILY co 40?3 10825
01184000 CONNECTICUT RIVER AT THOMPSONVI~LE CT 41!-9 07236 01205500 HOUSATONIC RIVER AT STEVENSON CT 411:3 07310
02231000 ST MARYS RIVER NEAR MACCLENNY FL 3022 08205 02244450 ST JOHNS RIVER AT PALATKA FL 29?9 08138 02248000 SPRUCE CREEK NEAR SAMSULA FL 29r3 08103 02253000 MAIN CANAL AT VERO BEACH FL 27?9 08024 02273000 KISSIMMEE RIVER AT S65E NEAR OKEECHOBEE F'L 2714 08058 02279000 WEST PALM BEACH CANAL AT WEST PALM BEACH FL 26?9 08004 02288600 MIAMI CANAL AT N~ 36TH STHEETt MIAMI FL 25t,8 08016 02292400 CALOOSAHATCHEE CNL AT ORTONA LeNR LABELLEFL 26~'0 08105 02296750 PEAC~ RIVER AT ARCADIA FL 2713 08153 02303000 HILLSBOROUG~ HIVER NEAR ZEPHYRHILLS FL 28f9 08214 02313000 WITHLACOOCHEE RIVER·NEAR HOLDER FL 28f9 08221 02320500 SU~ANNEE RIVER AT BRANFORD FL 29f7 08256 02329000 OCHLOCKONEE RIVER NEAR HAVANA FL 30!3 08423 02358000 APALACHICOLA RIVER AT CHATTAHOOCHEE FL 30~,2 08452 02359000 CHIPOLA RIVER NEAR ALTHA FL 30?2 08510 02366500 CHOCTAWHAlCHEE HIVER NEAR dRUCE FL 30l1 08554 02368000 YELLOW RIVER AT MILLIGAN F'L 30~ 5 08638 02375500 ESCAMBIA HIVER NEAR CENTURY FL 30~7 08714
02202500 OGEECHEE HIVE~ NEAR EDEN GA 3211 08125 02226000 ALTAMAHA RIVER AT OOCTORTOWN GA 31!9 08149 02228000 SATILLA RIVER AT ATKINSON GA 31]3 08152
16031000 WAIMEA RIVER AT WAIMEA HI 21~9 15940 16213000 WAIKELE STHEAM AT WAIPAHU HI 21t:3 15801 16229300 KALIHI STHEAM AT KALIHI HI 21t:O 15753 16400000 HALAWA STREAM NEAR HALA~A HI 21]0 15646 16618000 KAHAKULOA STHEAM NEAR HONOKOHAU HI 20f9 15633· 16704000 WAILUKU RIVEH AT PIIHONUA HI 19~ 3 15509
1 See footnote at end of table.
16

TABLE 1.-Stations in the National Stream Quality Accounting Network on January 1, 1975-Cont~"lued
USGS STATION NAME ST 1 LATI- LONG I• STAT.NO. TUDE TUDE
DEG/ DEG/ MIN MIN
12318500 KOOTENAI RIVER NEAR COPELAND ID 4855 11625 13154500 SNAKE RIVER AT KING HILL ID 4300 11512 13213000 BOISE RIVEH NEAH PARMA ID 4347 11659 13213100 SNAKE RIVER AT NYSSA (OR) ID 4353 11659 13290450 SNAKE RIVER AT HELLS CANYON DAM (OR) ID 4515 11642 13317000 SALMON RIVER AT WHITE BIRD ID 4545 11619
0~446500 ROCK ~IVER NEAR JOSLIN IL 4143 09011 05543500 ILLINOIS RIVER AT MARSEILLES IL 4120 08843 05585500 ILLINOIS RI~EH AT MEREDOSIA IL 3949 09034 05594100 KASKASKIA RIVEH NEAR VENOY STATION IL 3827 08938 05599500 BIG MUDDY RIVER AT MURPHYSdORO IL 3745 08921
03276500 WHITEWATER RIVER AT aROOKVlLLE IN 3924 08501 03374100 W·HITE RIVER NEAR HAZEL TON IN 3829 08733 03378500 WABASH RIVER AT NEW HARMONY IN 3808 08756
05420500 MISSISSIPPI HIVER AT CLINTON IA 4147 09015 05474500 MISSISSIPPI HIVER AT KEOKUK IA 4024 09122 06486000 MISSOURI RIVE~ AT SIOUX CITY IA 4229 09625 06807000 MISSOURI HIV~R AT NEBRASKA CITY (NB) IA 4041 09551 06856600 REPUBLICAN RIVER AT CLAY CENTER KS 3921 09708 06877600 SMOKY HILL RIVER AT ENTERPHISE KS 3854 09707 06887000 BIG BLUE RIVER NEAR MANHATTAN KS 3914 09634 06892350 KANSAS RIVER AT DESOTO KS 3859 09458 07139500 ARKANSAS RIVER AT DODGE CITY KS 3745 10001 07146500 ARKANSAS RIVER AT ARKANSAS CITY KS 3703 09704
03215000 BIG SANDY RIVER AT lOUISA KY 3810 08238 03216600 OHIO RIVER AT GREENUP DAM KY 3839 08252 03254000 LICKING RIVER AT BUTLER KY 3847 08422 03277200 OHIO Re AT MARK~AND DAM NEAR WARSAW KY 3846 08458 03290500 KENTUCKY RIVER AT LOCK 2 AT LOCKPORT KY 3826 08458 03301630 ROLLING FORK NEAR LEHANON ~UNCTION KY 3749 08545 03303280 OHIO RIVER AT CANNELTON DAM KY 3754 08642 03321230 GREEN RIVER NEAR BEECH GROVE KY 3732 08716 03438220 CUMBERLAND RIVER NEAR GRAND RIVERS KY 3701 08813 03609750 TENNESSEE RIVER AT HWY 60 NEAR PADUCAH KY 3702 08832 03612500 OHIO RIVER AT ~~D 53 NEAR GRAND CHAIN(IL)KY 3712 08902
02489500 PEARL RIVER NEAR BOGALUSA LA 3048 08949 02492000 BOQUE CHITTO NEAR BUSH LA 3038 08954 07344410 RED RIVER ABOVE SHREVEPORT lA 3233 09346 07355500 RED RIVER AT ALEXANDRIA lA 3119 09227 07367640 OUACHITA RIVER AT COLUMBIA LA 3206 09204
1 See footnote at end of table.
17

TABLE 1.-Stations in the National Stream Quality Accounting Network on January 1, 1975-Continued
USGS STATION NAME ST 1 LATI- LONG I• STAT.NO. TUDE TUDE
DEG/ DEG/ MIN MIN
07369500 TENSAS RIVEH AT TEMDAL LA 3226 09122 07373420 MISSISSIPPI HIVER NEAR ST FRANCISVILLE LA 3046 09124 07374508 MISSISSIPPI RIVEH AT NEW OHLEANS LA 2957 09008 07378510 AMITE RIVER AT 4•H CAMP NR DENHAM SPGS LA 3026 09058 07381490 ATCHAFALAYA HlVER AT SIMMESPORT LA 30S9 09148 07385700 BAYOU TECHE AT KEVST L'D N~ ST MARTINSVL LA 3004 09150 08015900 CALCASIEU RIVER NEAR LAKE CHARLES LA 3018 09311
01017100 AROOSTOOK RIVER AT CARIBOU ME 4651 06800 01021050 ST. CROIX RIVER AT MILLTOWN ME 4510 06718 01034500 PENOBSCOT RIVER AT WEST ENFIELD ME 4514 06839 01046500 KENNEREC RIVER AT BINGHAM ME 4503 06953 01059000 ANDROSCOGGIN RIVER NEAR AU~UR~ ME 4404 07013 01066000 SACO RIVER AT CORNISH ME 4348 07047
01491000 CHOPTANK HIVEH NEAR GREENSBORO MD 3900 07547 Olb'+5500 POTOMAC RIVER AT GREAT fA~LS MD 3900 07715
01096550 MERRIMACK RIVER ABOVE LOW~~L MA 4238 07122 01103500 CHARLES RIVEH AT CHARLES HIVER VILLAGE MA 4215 07116
04040000 ONTONAGON RIVER NEAR ROCKLAND Ml 4643 08912 040'+5500 TAHQUAMENON ~. NR TAHQUAMENON PARADISE MI 4643 08516 04045580 ST MARYS RIV~H ABOVE SAULT STE MARIE MI 4629 08425 04057005 MANISTIQUE RlVER AT MANISTIQUE MI 4557 08615 04059000 ESCANABA RIV~R AT CORNELL MI 4555 08713 04059500 FORD RIVER NEAR HYDE Ml 4545 08712 04108690 KALAMAlOO RivER AT SAUGATUCK MI 4239 08612 04122030 MUSKEGON RIVEH AT BRIDGETON MI 4319 08602 04126520 MANISTEE RlVtR AT MANISTEE MI 4415 08619 04132052 CHEBOYGAN RivER AT CHEBOYGAN MI 4539 08428 04142000 RIFLE RIVER NEAR STERLING MI 4404 08401 04157000 SAGINAw RIVE~ AT SAGINAW Ml 4325 08358 04165500 CLINTON RIVER AT MT. CLEMENS MI 4236 08255 04165700 DET~OIT RIVEH AT DETROIT MI 4221 08258
04014500 BAPTISM RIVEH NEAR BEAVER ~AY MN 4720 09112 04024000 ST LOUIS RIVtR AT SCANLON MN 4642 09225 05112000 ROSEAU RIVER NEAR CAHIBOU MN 4859 09628 05131500 LITTLE FORK HIVER AT LITTLEFORK MN 4824 09334 05132000 BIG FORK RIVER AT BIG FALLS MN 4812 09348 05267000 MISSISSIPPI ~IVER NEAR ROYALTON MN 4552 09422 05331000 MISSISSIPPI RIVER AT ST PAUL MN 4457 09305 05378500 MISSISSIPPI kiVER AT WINONA MN 4403 09138 05533000 MINNESOTA HIVER NEAR JOROA~ MN 4442 09338
1 See footnote at end of table.
18
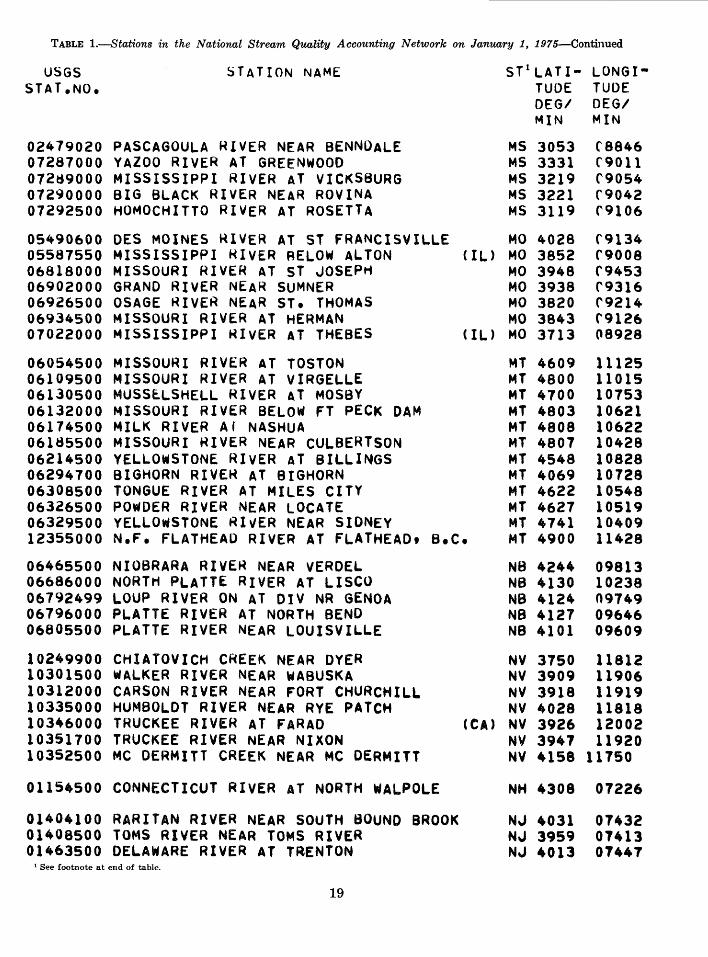
TABLE 1.-Stations in the National Stream Quality Accounting Network on January 1, 1975-Continued
USGS STAT.NO.
STATION NAME
02479020 PASCAGOULA RIVER NEAR BENNOALE 07287000 YAZOO RIVER AT GREENWOOD 072d9000 MISSISSIPPI RIVER AT VIC~S8URG 07290000 BIG BLACK RIVER NEAR ROVINA 07292500 HOMOCHITTO RIVER AT ROSETTA
05490600 DES MOINES HIVER AT ST FRANCISVILLE 05587550 MISSISSIPPI HIVER RELOW ALTON 06818000 MISSOURI RIVER AT ST JOSEPH 06902000 GRAND RIVER NEAR SUMNER 06926500 OSAGE ~IVER NEAR ST. THOMAS 06934500 MISSOURI RIVER AT HERMAN 07022000 MISSISSIPPI HIVER AT THEBES
06054500 MISSOURI RIVER AT TOSTON 06109500 MISSOURI RIVER AT VlRGELLE 06130500 MUSS~LSHELL RIVER AT MOSBY 06132000 MISSOURI RIVER BELOW FT PECK DAM 06174500 MILK RIVER Ar NASHUA 06185500 MISSOURI RIVER NEAR CULBERTSON 06214500 YELLOWSTONE RIVER AT BILLINGS 06294700 BIGHORN RIVEH AT BIGHORN 06308500 TONGUE RIVER AT MILES CITY 063Z6500 POWDER RIVER NEAR LOCATE
ST 1 LATI- LONGI• TUDE TUDE DEG/ DEG/ MIN MIN
MS 3053 MS 3331 MS 3219 MS 3221 MS 3119
MO 4028 (IL) MO 3852
MO 3948 MO 3938 MO 3820 MO 3843
( IL) MO 3713
('8846 ('9011 ('9054 ('9042 ('9106
('9134 ('9008 ('9453 ('9316 ('9214 ('9126 (18928
06329500 YELLOwSTONE RI~ER NEAR SIDNEY 12355000 N.F. FLATHEAD RIVER AT FLATHEAOt B.C.
MT 4609 MT 4800 MT 4700 MT 4803 MT 4808 MT 4807 MT 4548 MT 4069 MT 4622 MT 4627 MT 4741 MT 4900
11125 11015 10753 10621 10622 10428 10828 10728 10548 10519 10409 11428
06465500 NIOBRARA RIVER NEAR VERDEL 06686000 NORT~ PLATTE RIVER AT LISCO 06792499 LOUP RIVER ON AT DIV NR GENOA 06796000 PLATTE RIVER AT NORTH BEND 06805500 PLATTE RIVER NEAR LOUISVILLE
10249900 CHIATOVICH CREEK NEAR DYER 10301500 WALKER RIVER NEAR WABUSKA 10312000 CARSON RIVER NEAR FORT CHURCHILL 10335000 HUMBOLDT RIVER NEAR RYE PATCH 10346000 TRUCKEE RIVER AT FARAD 10351700 TRUCKEE RIVER NEAR NIXON 10352500 MC OERMITT CREEK NEAR MC DERMITT
01154500 CONNECTICUT RIVER AT NORTH WALPOLE
01404100 RARITAN RIVER NEAR SOUTH BOUND BROOK 01408500 TOMS RIVER NEAR TOMS RIVER 01463500 DELAWARE RIVER AT TRENTON
1 See footnote at end of table.
19
CCA)
NB 4244 NB 4130 NB 4124 NB 4127 NB 4101
NV 3750 NV 3909 NV 3918 NV 4028 NV 3926 NV 3941 NV 4158
NH 4308
NJ 4031 NJ 3959 NJ 4013
09813 10238 09749 09646 09609
11812 11906 11919 11818 12002 11920
11750
07226
07432 07413 07447

TABLE 1.-Stations in the Nationtil Stream'Quality Accounting Network on January 1, 1975--Continued
USGS STATION NAME ST 1 LATI- LONG I• STAT.NO. TUDE TUDE
OEG/ DEG/
07227140 CANADIAN RIVER ABOVE NM•TEX STATELINE NM 3523 10303 08313000 RIO GRANDE AT OTOWI BRIDGE NR SeiLDEFONSONM 355~ 10608 08358300 RIO GRANDE CNV CH AT SAN MARCIAL NM 3341 10700 08407500 PECOS RIVER AT RED BLUFF NM 3204- 10402 08481500 TULAROSA RIVER NEAR BENT NM 3309 10554 09368000 SAN JUAN RIVER AT SHIPROCK NM 3648 10844
01304500 PECONIC RIVER AT RIVERHEAD NY 4100 07241 01372043 HUDSON RIVER NEAR POUGHKEEPSIE NY 4143 07356 04219640 NIAGARA RIVER AT fORT NIAGARA NY 4316 OT904 04l32006 GENESEE R AT CHARLOTTE DOCKS AT ROCHESTERNY 4313 07737 04249000 OSWEGO RIVER AT LOCK 7t OSW[GO NY 4327 07630 04260500 BLACK RIVER AT WATERTOWN NY 4359 07556 04264331 ST LAWRENCE R AT CORNWALL ONT NA MASSE-NA NY 4500 07448 04269000 ST REGIS RIVER AT BRASHER tENTER NY 4452 07447 04295000 RICHELIEU RIVER AT ROUSES POINT NY 4500 07322
02081000 ROANOKE RIVER NEAR SCOTLAND NECK NC 3612 07723 -02083500 TAR RIVER AT TA~BORO NC 3554 07732 02089500 NEUSE RIVER AT KINSTON NC 3515 07735 02105769 CAPE FEAR RIVER AT LOCK 1 NEAR KELLY NC 3424 07818 02129000 PEE DEE RIVEH NEAR-ROCKINGHAM NC 3457 07952
05054020 RED RIVER OF TH£ NORTH BELOW FARGO NO 4656 09647 05083590 REO HIYER OF THE NORTH AT OSLO (MN) NO 4812 09708 05124000 SOURIS RIY£R N·[Aftt WESTHOPE (OUTFLOW) ND 4900 10057 06337008 LITTLE MISSOUHI RIVER NEAH WAT,ORD CITY NO 4735 10315 06338490 MISSOURI RIVER AT GARRISON DAM NO 4730 10126 06340500 KNI'E RIVER AT HAZEN NO 4717 10137 06354000 CANMON ~IVEA ~AR 8MIEN NO 4623 10056
03150000 MUSKINGUM RIVER AT "CCONN€LSVILL[ OH 3939 08151 03234500 SCIOTO RIVEH AT HIGBY OH 3913 08252 03Z45500 LITTLE MIAMI RIVER AT MILFORD OH 3910 08418 03274600 GREAT MIAMI HIVE:R AT N£W BALTIMORE OH 3916 08440 04193500 MAUMEE RIW[R AT ~ATEMVILLl OH 4130 08343 04201000 CUYAHOGA MIVlR AT INDEPENDENCE OH 4124 08138
07157950 CIMARRON RIVER NEAR BUFFALO OK 3655 09924 07161000 CIMARRON HIVER AT PERKINS Ot< 355 .. 09702 07164400 ARKANSAS RIVER AT SO SPNG NEAR TUL OK 3607 09607 07178620 NEWT GRAHAM ~~0 (VERDIGRIS R) NEAR INOLA OK 3603 09532 07193500 NEOSHO R BL FT GIBSON RES NR FT GIBSON OK 3551 09514 07231500 CANADIAN HIVER AT CALVIN OK 3459 09614 07232500 N CANADIAN HIVER NEAR GUYMON OK 3643 10130 07234000 NORTH CANADIAN (BEAVER) RIVER AT SEAVER OK 3649 10031
1 See footnote at end of table.
20

TABLE 1.-Stati0n8 in the National Stream Quality Accounting Network on January 1, 1975-Continued
USGS STAT.NO.
STATION NAME
07237500 NORTH CANADIAN RIVER AT WOODWARD 07Z45~00 CANADIAN RIVEH NEAR WHITEFIELD 07305000 NF RED RIVEH NEAR HEADRICK 07331000 WASHITA RIVEH NEAR DURWOOU
10396000 DONNER UNO ~LITZEN R. NEAH FRENCHGLEN 14048000 JOHN DAY HIVtR AT MCDONALU FERRY 1410300~ DESCHUTES RIVER AT MOODY NEAR RIGGS 14128910 COLUMBIA RIVE~ AT WARRENDALE 14207500 TUALATIN HIVER AT WEST LINN 14211720 wiLLAMETTE HIVER AT PORTLAND 14301000 NEHALEM RIVEH NEAR FOSS 14321000 UMPQUA RIVER NEAH ELKTON 14372300 ROGUE RIVER NEAR AGNESS
01474500 SCHUYLKILL HIVER AT PHILADELPHIA 01540500 SUSQUEHANNA ~~V~R AT DANVILLE 01553500 w.BR. SUSQUEHANNA RIVER AT LE~ISBURG 01570500 SUSQUEHANNA RIVER AT HARRISBURG 03049625 ALLEGHENY RIVER AT NEW KENSINGTON 03085000 MONONGAHELA HIVER AT BRAOOOCK
50038100 RIO GRANDE D~ MANATI 50046000 RIO DE LA PLATA AT TOA ALTA 50092000 RIO GRANDE DE PATILLAS NEAH PATILLAS 50144000 RIO GRANDE DE ANASCO NEAR SAN SEBASTIAN
02132000 LYNCHES RIVER AT EFFINGHAM 02136000 BLACK RIVER AT KINGSTREE 02170500 LAKE MARION MOULTRIE CANAL NR PINEVILLE 02171500 SANTEE RIVEH NEAR PINEVILLE 02175000 EDISIO RIVEH NEAR GIVHANS 02176500 COOSAWHATCHIE RIVER NEAR HAMPTON 02198500 SAVANNAH RIVER NEAR CLYO (GA)
06357800 GHAND RIVER AT LITTLE EAGLE 06438000 BELLE FOURCHE RIVER NEAR ELM SPRINGS 06439300 CHEYENNE RIVER AT CHERRY CREE~ 06440000 MISSOURI RIVER AT PIERRE 06452000 WHITE RIVER NEAR OACOMA 06453000 MISSOURI RIVER BELOW FT RANDALL DAM 06478500 JAMES RIVER NEAR SCOTLAND 06485500 BIG SIOUX HIVER AT AKRON CIA)
03425000 CUMBERLAND HIVER AT CARTHAGE 03470500 FRENCH BROAD RIVER NEAR KNOXVILLE
1 See footnote at end of table.
21
ST1 LATI• tONGI• TUDE TUDE DEG/ r~G/ MIN ~~IN
OK 3626 OK 3516 OK 3438 OK 3414
OR 4247 OR 4535 OR 4537 OR 4537 OR 4521 OR 4531 OR 4542 OR 4335 OR 4235
PA 4000 PA 4057 PA 4058 PA 4015 PA 4034 PA 4024
PR 1826 PR 1824 PR 1802 PR 1817
sc 3403 sc 3340 sc 3323 sc 3327 sc 3302 sc 3250 sc 3232
so 4530 so 4422 so 4436 so 4422 so 4345 so 4304 so 4311 so 4250
09917 09514 09906 09659
11852 12024 12054 12202 12240 12240 12345 12333 12404
C7512 07637 07653 07653 07946 C7953
06632 C6615 06602 C6703
07945 07950 08008 C8009 08024 08108 0 8116
]0049 ]0234 ]0129 ]0022 C9933 09833 09738 09634
TN 3615 (l8557 TN 3558 C8346

TABLE 1.-Stations in the National Stream Quality Accounting Network on January 1, 1975-Continued
USGS STAT.NO.
STATION NAME ST 1 LATI- LONGITUDE TUDE DEG/ DEG/ MIN MIN
03543005 TENNESSEE Re AT WATTS BAR UAM (lAILWATER)TN 3537 03571850 TENNESSEE RIVER AT SOUTH PITTSBURG TN 3501 03593005 TENNESSEE R. AT PICK~ICK LAND. D.<L.LOCK)TN 3504 07026000 OBION RIVEH AT OBION TN 3615
08447 08542 08815 08912
07228000 CANADIAN RIVER NEAR CANADIAN 07297910 PDTF RED RIVER NEAR ~AYSIDE TEXAS 07300000 SALT FORK RED RIVER NEAR WELLINGTON 07308500 RED RIVER NEAR BURKBURNETT 07331600 RED RIVER AT DENISON DAM NEAR DENISON 08030500 SASINE RIVEH NEAR RULIFF 08041000 NECHES RIVER AT EVADALE 08065350 TRINITY RIVEH NEAR CROCKETT 08066500 TRINITY RIVER AT ROMAYOR 08068000 WEST FORK SAN JACINTO RIVER NEAR CONROE 08082000 SALT FORK BRAZOS RIVER NEAR ASPERMONT 08082500 BRAZOS RIVER AT SEYMOUR 08098290 BRAZOS RIVER NEAR HIGHBANK 08116650 BRAZOS RIVER AT ROSHARON 08123800 BEA~S CREEK NEAR WESTBROOK 08136700 COLORADO RIVER NEAR STACY 08158000 COLORADO RIVER AT AUSTIN 08162000 COLORADO RIVER AT WHARTON 08164500 NAVIDAD RIVER NEAR GANADO 08176500 GUADALUPE RIVER AT VICTORIA 08188500 SAN ANTONIO HIVER AT GOLIAD 08210000 NUECES RIVER NEAR THREE RIVERS 08212400 LOS OLMOS CREEK NEAR FALFU~RIAS 08370500 RIO GRANDE AT FT QUITMAN 08377200 RIO GRANDE AT FOSTER RANCH 08447410 PECOS RIVER NEAR LANGTRY 08459000 RIO GRANDE AT LAREDO 08475000 RIO GRANDE AT BROWNSVILLE
09180500 COLORADO RIVER NEAR CISCO 09234500 GHEEN RIVER NEA~ GREENDALE 09315000 GREEN RIVEH AT GREEN RIVER
TX 3556 TX 3450 TX 3457 TX 3406 TX 3349 TX 3018 TX 3021 TX 3120 TX 3026 TX 3015 TX 3320 TX 333~ TX 310A TX 2921 TX 321i! TX 3130 TX 301!: TX 291~ TX 2901! TX 284r TX 283~ TX 282f TX 271f TX 310!: TX 294i TX 294r TX 2731' TX 2553
UT 384r UT 405" UT 385~ UT 370~
10022 10125 10013 09832 09634 09345 09406 09539 09451 09527 10014 09916 09649 09535 10101 09934 09742 09606 09633 09701 09723 09811 09808 10536 10145 10127 09930 09727
09379500 SAN JUAN RIV~H NEAR BLUFF 10059500 BEAR LAKE OUTLET CANAL NEAR PARIS 10126000 BEAR RIVER NlAR CORINNE
(IO) UT 421?
10918 10925 11009 10952 11121 11206 11205 11155 11224 11246
10141000 WEBER RIVER NEAR PLAIN CITY 10171000 JORDAN RIVER AT SALT LAKE CITY 10224000 SEVIER RIVER NEAR LYNNDYL 10237000 BEAVER RIVER AT ADAMSVILLE
04296500 CLYDE RIVER AT NEWPORT 1 See footnote at end of table.
22
UT 413~ UT 4117 UT 404" UT 392~
UT 381~
VT 445f 07211

TABLE !.-Stations in the National Stream Quality Accounting Network on January 1, 1975-Contillued
USGS STATION NAME ST 1 LATI• LONG I• STAT.NO. TUDE TUDE
DEG/ DEG/
01673000 PAMUNKEY RIVER NEAR HANOVE~ VA 3746 07720 02035000 JAMES RIVER AT CARTERSVILLf VA 3740 07805 02049500 BLACKWATER HlVER NEAR FRANKLIN VA 3646 076.54
12031000 CHEHALIS RIVfR AT PORTER WA 4656 12319 12Q45500 EL~HA A AT MCDONALD BRIDGE NR PT ANGELES WA 4803 12335 12200&0~ SKAGIT RIVER NEAR MT VERNON WA 4831 12220 123~8600 PEND OREILLE R AT INTERNATIONAL BOUNDARY WA 4900 11721 12400520 COLUMBIA RIVER AT NORTHPORT WA 4855 11747 12433aoo SPOKANE RIVER AT LONG LAKE WA 4750 11751 12510500 YAKIMA RIVEH AT KIONA WA 4615 11929 13353200 SNAKE RIVER AT BURBANK WA 4613 11901 14113000 KLICKITAT RIVER NEAR PITT WA 4545 12113
03201300 KANAWHA RIVER AT•WINFIELO wv 3832 08155 03204500 MUD RIVER NEAR MILTON wv 3823 08207
04027000 BAD RIVER NEAR ODANAH WI 4629 09042 04085000 FOX RIVER AT WRIGHTSTOWN WI 4420 08810 04087000 MILWAUKEE RIVER AT MILWAUKEE WI 4306 08755 05340500 STe CROIX RIVER AT ST. CROIX FALLS WI 4524 09239 05369500 CHIPPEWA RIVER AT DURAND WI 4438 09158 05407000 WISCONSIN RIVER AT MUSCODA WI 4312 09026
13022500 SNAKE RIVER ABOVE RESERVOIR NEAR ALPINE WY 4318 11047 1 If two States are shown, that in parentheses is the State in which the station is located The other State designates the Geological
Survey district that operates the station.
23
