the multicultural economy - latino donor...
TRANSCRIPT

THE
ECONOMYMULTICULTURAL
2017
Jeffrey M. Humphreys

The MulTiculTural econoMy 2
Selig Center for Economic GrowthTerry College of BusinessThe University of Georgia
Benjamin C. Ayers, Dean Terry College of Business
Jeffrey M. Humphreys, Director Selig Center
Lorena M. Akioka, Managing EditorBeata D. Kochut, Senior Research AnalystAlexandra Fulmer, Research AnalystMary T. Evans, Administrative ProfessionalSeamus Murrock, Student Assistant
The Multicultural EconomyCopyright 2017 by the Selig Center for Economic Growth. All rights reserved.
CONTENTS
Part 1 The Multicultural Economy, 1990-2022 3
Part 2 Buying Power Statistics By State for All 50 States 69
For more information on the Selig Center, visit our Website at www.selig.uga.edu
No part of this publication may be repro-duced, stored in a retrieval system, or trans-mitted, in any form or by any means, electron-ic, mechanical, photocopying, recording, or otherwise, without the express permission of the Selig Center for Economic Growth at the University of Georgia.

Part 1
ECONOMYMULTICULTURAL
1990-2022

The MulTiculTural econoMy 4
The Multicultural Economy
TTotal Buying Power Statistics
he Selig Center’s estimates and projections of buying power show that minorities—African Americans, Asians, Native Americans, and Hispanics—wield formidable eco-nomic clout. The numbers are impressive. For example, in 2017, the $1.5 trillion Hispanic market is larger than
the entire economies (2017 GDP measured in U.S. dollars) of all but twelve countries in the world—smaller than the GDP of South Korea and larger than the GDP of Australia. The buying power data presented here and differences in spend-ing by race and/or ethnicity suggest that as the U.S. consumer market becomes more diverse, advertising, products, and media must be tailored to each market segment. With this in mind, entrepreneurs, established businesses, marketing specialists, economic development organizations, and chambers of commerce now seek estimates of the buying power of the nation’s major racial and ethnic minority groups. This study provides a comprehensive statistical overview of the buying power of African Americans, Asians, Native Americans, and Hispanics for the U.S. and all the states. Estimates are provided for 1990, 2000, 2010, 2017, and 2022. Majority—or white—buying power, multiracial buying power, and non-Hispanic buying power are also reported, but the estimates for these groups are not discussed.
Simply defined, buying power is the total personal income of resi-dents that is available, after taxes, for spending on virtually everything that they buy, but it does not include dollars that are borrowed or that were saved in previous years. It is not a measure of wealth, and it does not include what tourists spend during their visits. Unfortunately, there are no geographically precise surveys of annual expenditures and income of all the nation’s major racial and ethnic groups. Even estimates of expenditures by race or ethnicity are difficult to find, especially for individual states.
The Selig Center addresses this problem by providing estimates of black, Native American, Asian, white, Hispanic, and non-Hispanic buying power for the nation, the fifty states, and the District of Co-lumbia. These current dollar (unadjusted for inflation) estimates and projections indicate the growing economic power of various racial or ethnic groups; measure the vitality of geographic markets; help to judge business opportunities for start-ups or expansions; gauge a business’s annual sales growth against potential market increases; indicate the market potential of new and existing products; and guide targeted advertising campaigns.
The estimates supersede those previously published by the Selig Center. The buying power estimates should be considered only as the first step toward a more comprehensive analysis of the market. Anyone
considering the investment of substantial capital in a new enterprise, a new product line, or a new advertising campaign will need extensive feasibility analysis to determine market opportunities more precisely.
The Selig Center projects that the nation’s total buying power will rise from $4.3 trillion in 1990 to $7.4 trillion in 2000, to $11.2 trillion in 2010, to $14.6 trillion in 2017, and to $17.4 trillion in 2022. The percentage increase for 1990-2017 is 239 percent. From 2000-2017, total buying power will rise by 97 percent. The percentage gain in total buying power far outstrips cumulative inflation. For example, the U.S. Consumer Price Index for All Urban Consumers (CPI-U) increased by approximately 91 percent during 1990-2017, or about two fifths of the 239 percent increase in total buying power. From 2000 to 2017, the U.S. CPI-U increased by 44 percent whereas total buying power rose by 97 percent. Total buying power expanded by 30 percent from 2010 through 2017, and will expand by 20 percent from 2017 through 2022.
Diverse forces support this substantial growth. The 33-year span encompasses a mild recession in 1990-91, the longest economic expan-sion in the nation’s history from 1991-2000, another mild recession in 2001, a modest expansion from 2002-2007, and a severe recession that began late in 2007 and continued through mid-2009. As this is written, U.S economic conditions can be described as expansionary, and the assumptions underlying the baseline forecast call for modest growth in 2017-2022.
Ranked by percentage change in total buying power between 2000 and 2017, the top ten states are North Dakota (158 percent), Utah (146 percent), Wyoming (140 percent), Texas (140 percent), Oklahoma (132 percent), District of Columbia (124 percent), Arizona (122 percent), Washington (118 percent), Idaho (117 percent), and Montana (116 percent). From 2000 through 2017, the five slowest growing states are Michigan (54 percent), Illinois (70 percent), Ohio (71 percent), West Virginia (75 percent), and New Jersey (77 percent). That the state estimates show differing outcomes is not surprising, given the differences in labor market performance, industrial bases, the importance of exports, dependence on federal spending, real estate markets, labor markets, immigration rates, domestic migration rates, and natural resources. As always, states with low costs of doing business, favorable regulatory environments, updated transportation infrastructure, educated workforces, and an abundance of natural re-sources will continue to attract domestic and international businesses.

Selig Center for eConomiC growth 5
Where Blacks Spend More
natural gasused vehiclesshoes
n Black Buying Power nThe Multicultural Dollar
Where Blacks Spend Less
new carsdining outhealth careeducationpensions
I
Buying Power Statistics by Race
In 2017, the combined buying power of blacks, Asians, and Native Americans will be $2.4 trillion—156 percent higher than its 2000 level of $926 billion —which amounts to a gain of $1.4 trillion. In 2017, African Americans will account for 54 percent of combined spending, or $1.3 trillion. From 2000 through 2017, the percentage gains in buying power vary considerably by race, from a gain of 257 percent for Asians to 180 percent for Native Americans to 108 percent for blacks. All of these target markets will grow much faster than the white market, where buying power will increase by 87 percent.
The combined buying power of African Americans, Asians, and Native Americans will account for 16.2 percent of the nation’s total buying power in 2017, up from 12.5 percent in 2000 and from 10.6 percent in 1990. The 2000-to-2017 gain in combined market share of 3.7 percent amounts to an additional $544 billion in buying power in 2017. The market share claimed by a targeted group of consumers is important because the higher their market share, the lower the aver-age cost of reaching a potential buyer in the group. The combined buying power of these three racial groups will rise to $3 trillion in 2022, accounting for 17.3 percent of the nation’s total buying power.
n 2017, African Americans will constitute the nation’s largest racial minority market, but the buying power of Hispanics—an ethnic group—is larger. Despite the severe impact of the Great Recession,
2016, 87 percent of blacks over 25 years of age had completed high school or college, far better than the 66 percent reported in 1990 and the 79 percent recorded in 2000. Despite this, the percentage of African Americans who are high school graduates or better was still lower than the percentage of whites (89 percent) and Asians (90 percent). Also, the Current Population Survey indicates that 23 percent of blacks had a bachelor’s, graduate, or professional degree compared to 33 percent of whites and 56 percent of Asians. Nonetheless, the percentage of blacks who had completed college in 2016 (23 percent) was higher than in either 2000 (17 percent) or in 1990 (11 percent). Favorable demographic trends help, too, since the black popula-tion continues to grow more rapidly than the total population. From 2000 to 2017, the nation’s black population grew by 21.7 percent compared to 9.4 percent for the white population and 15.8 percent for the total population. From 2017 to 2022, the nation’s black population is projected to grow by 5.9 percent, which exceeds the 4.3 percent growth estimated for the total U.S. population. Also, the black popula-tion is younger: the 2010 Current Population Survey indicates that the median age of blacks is only 31.4 years compared to 38.2 years for the white population or 36.7 years for the total population. Compared to the older white population, larger proportions of blacks will enter
the workforce for the first time or will move up from entry-level jobs. This will provide an extra push to the group’s overall buying power. Conversely, smaller proportions of blacks have reached their career pinnacles or are of traditional retirement age. In 2010, only 8.6 per-cent of blacks were over 65, compared to 13.8 percent of whites or 12.7 percent of the total population. So, black buying power may be slightly more resistant to reforms of popular government entitlement programs for retirees (e.g., Social Security and Medicare), especially if those reforms focus benefit reductions on higher income households. Because they are much younger, African-American consumers in-creasingly are setting trends for teens (and young adults) of every race
blacks’ economic clout continues to energize the U.S. consumer mar-ket. The Selig Center estimates that the nation’s black buying power will rise from $320 billion in 1990 to $609 billion in 2000, to $957 billion in 2010, to $1.3 trillion in 2017, and to $1.5 trillion in 2022. The 108 percent increase between 2000 and 2017 outstrips the 87 percent rise in white buying power and the 97 percent increase in total buying power (all races combined). In 2017, the nation’s share of total buying power that is black will be 8.7 percent, up from 8.5 percent in 2010 and from 7.5 percent in 1990. African-American consumers’ share of the nation’s total buying power will rise to 8.8 percent in 2022, accounting for almost nine cents out of every dollar that is spent. The gains in black buying power reflect much more than just population growth and inflation. Of the many diverse supporting forces, one of the most important and enduring is the increasing number of blacks who are starting and expanding their own busi-nesses. The 2012 Survey of Business Owners (released by the U.S. Census Bureau) shows that the number of black-owned firms was 34 percent higher in 2012 than in 2007, which is more than eleven times the 3 percent gain in the number of all U.S. firms. Still another positive factor underpinning the group’s buying power is that African Americans continue to become more highly educated, which should allow proportionally more blacks to enter occupations with higher average salaries. Census data show that in

The MulTiculTural econoMy 6
T
n Native American Buying Power n
With a sizable population under 18, it is not surprising that blacks are consumer trendsetters.
and ethnic background. This isn’t surprising given that 29.4 percent of the black population is under 18 years old compared to 23.3 percent of the white population or 24.6 percent of the total population. The youthful profile of the black population has its downside, however. Compared to people who are either more established in their careers or retired, young adults, regardless of their race or ethnicity, are more exposed to job losses in economic downturns. So, in this regard, black buying power is vulnerable to the effects of economic recessions, but over time the above-average growth of black buying power has more than compensated for that high cyclical exposure. Due to the unusual severity of the Great Recession, employment growth no longer can be cited as one of the main forces behind the above-average gains in black buying power. From January 2000 through March 2017 (the most recent data available at the time of this writing), the number of jobs held by blacks had increased by 3.2 million, or 1.2 percent per year. In contrast, the number of jobs held by whites increased by only 0.3 percent per year. In 2017, the ten states with the larg-est African-American markets, in order, are Texas ($117 billion), New York ($116 billion), California ($93 billion), Florida ($90 billion), Georgia ($90 billion), Mary-land ($72 billion), North Carolina ($60 billion), Virginia ($54 billion), Illinois ($52 billion), and New Jersey ($46 bil-lion). Of these, however, Georgia, North Carolina, and Maryland are the only ones that did not rank among the top ten markets for all consumers.
One characteristic that sets the African-American consumer market apart from the Hispanic and Asian markets is that this vibrant consumer market is very widespread, and therefore is an attractive customer segment in many of the states. In 2017, the five largest African-American markets account for 40 percent of black buying power. The five states with the largest total consumer markets account for 39 percent of total buying power. Similarly, the ten largest black markets account for 62 percent of the African-American market and the ten largest total consumer markets account for 56 percent of total buying power.
In order, the top ten states ranked by the rate of growth of black buying power between 2000 and 2017 are North Dakota (862 percent), South Dakota (400 percent), Idaho (385 percent), Wyoming (384 percent), Vermont (333 percent), Hawaii (301 percent), Montana (251 percent), Arizona (245 percent), New Hampshirea (242 percent), and Utah (203 percent). All have flourishing African-American consumer markets, but none is among the nation’s ten largest black consumer markets.
In 2017, the ten states with the largest share of total buying power that is black are Mississippi (24.7 percent), the District of Columbia (24.2 percent), Maryland (23.3 percent), Georgia (22.8 percent), Louisiana (20.2 percent), Alabama (18.1 percent), South Carolina (18 percent), Delaware (16.7 percent), North Carolina (15.2 percent), and Virginia (13.3 percent).
The 3.3 percent, 3.2 percent, and 2.4 percent increases in African
American’s share of the consumer markets in Georgia, Delaware, and Maryland were the three biggest share shifts in the nation from 2000 to 2017, respectively. There also was a 2.1 percent advance in Nevada and a 1.7 percent gain in Mississippi. The District of Columbia saw African Americans’ share drop by 11.8 percent between 2000 and 2017, however. Due to differences in per capita income, wealth, demograph-ics, educational attainment, occupational distribution, geographic distribution, and culture, the spending habits of blacks as a group are not the same as those of non-black consumers. Thus, as African Americans’ share of the nation’s total buying power expands, busi-ness-to-consumer firms can be expected to devote more resources to developing and marketing products that meet the needs and match the preferences of black consumers. Data from the 2016 Consumer Expenditure Survey indicate that the average black household spent in total only 70 percent as much as the average non-black household, reflecting blacks’ lower median
household incomes. The values are for money income, which differs somewhat from buying power, but nonetheless of-fers some insights into spending by black consumers. Despite lower average household income levels, African Americans lead in some categories. For example, on aver-age, black households spent more than
non-black households on natural gas, used vehicles, and footwear. Also, blacks spent a significantly higher proportion of their money on cell phones, gas and motor oil, TVs, and cash contributions. Blacks and non-blacks spent about the same proportion of their income for grocer-ies, housekeeping supplies, appliances, furniture, children’s apparel, public transportation, and life insurance. Compared to non-blacks, however, blacks spent much less of their total outlays on restaurants, alcoholic beverages, new cars, health care, entertainment, education, and pensions and Social Security. The same survey indicates that black households are slightly less likely to have older people (over 65 years of age). Blacks have only 1.2 vehicles per household compared to two vehicles for white and other households; and they are more likely to be renters rather than homeowners.
he Selig Center projects that the nation’s Native American buying power will rise from $20 billion in 1990, to $40 billion in 2000, to $82 billion in 2010, to $113 billion in
2017, and to $139 billion in 2022. Native American buying power in 2017 will be 180 percent greater than in 2000. The 2000-2017 gain is larger than the increases in buying power estimated for whites (87 percent), for the U.S. population as a whole (97 percent), and for blacks (108 percent). It is smaller than those estimated for Asians (257 percent) and Hispanics

Selig Center for eConomiC growth 7
n Asian Buying Power n
I
(203 percent), however. Despite this fast-paced growth, Native Americans will account for only 0.8 percent of all U.S. buying power in 2017, up only slightly from their 0.5 percent share in 2000, when they accounted for $40 billion in buying power. Many forces support the continued growth of Native Ameri-can buying power, but one of the most important is that the Native American population is growing more rapidly than the total population, and is expected to continue to do so. From 2000 through 2017, the Native American population grew by 54 percent, outpacing the projected gains of 22 percent for the black population, 16 percent for the total U.S. population, and 9 percent for the white population. From 2017 to 2022, the nation’s Native American population is projected to grow by 7 percent, which exceeds both the 6 percent gain projected for the total population and the 2 percent gain projected for the white population.
Historically, entrepreneurial activity has been a force pow-ering the growth of Native American buying power. The 2012 Survey of Business Owners, released by the U.S. Census Bureau in December 2015 shows that the number of American Indian- and Alaska native-owned firms increased by 15 percent from 2007 to 2012, which is five times greater than the 3 percent increase in the number of all U.S. firms.
Although comprising only 1.3 percent of the country’s population in 2017, Native Americans control $113 billion in disposable income, which makes this diverse group economi-cally attractive to businesses. In 2017, the ten states with the largest Native American markets are California ($20 billion), Oklahoma ($11 billion), Texas ($10 billion), Arizona ($7 bil-lion), New York ($6 billion), New Mexico ($4 billion), Wash-ington ($4 billion), North Carolina ($4 billion), Alaska ($3 billion), and Florida ($3 billion). This market is slightly more focused on a few states than is the total U.S. consumer market. In 2017, the five largest American Indian markets account for 47 percent of Native American buying power, whereas the five largest total consumer markets account for 39 percent of U.S. buying power. Similarly, the ten largest Native American mar-kets account for 64 percent of Native American buying power and the top ten total consumer markets account for 56 percent of total U.S. buying power.
Ranked by the rate of growth of Native American buying power over 2000-2017, the top ten states are Texas (281 per-cent), Hawaii (248 percent), New York (259 percent), Pennsyl-vania (238 percent), Rhode Island (237 percent), Illinois (234 percent), Virginia (212 percent), Massachusetts (212 percent), California (209 percent), and New Jersey (204 percent). Many of these states have relatively small, flourishing markets, but California, Texas, and New York stand out from the other lead-ing states as the first, third, and fifth largest Native American consumer markets in the nation, respectively.
In 2017, the ten states with the largest Native American shares of total buying power include Alaska (8.1 percent), Okla-homa (6.4 percent), New Mexico (5.7 percent), South Dakota
(3.5 percent), Montana (3.1 percent), Arizona (2.6 percent), North Dakota (2.4 percent), Wyoming (1.4 percent), Washing-ton (1.1 percent), and Nevada (1.1 percent). From 2000 to 2017, Native Americans’ share of the market will increase the most in Oklahoma, New Mexico, Arizona, California, and Texas. Except for Alaska and Montana, where Native Americans’ market share dropped by 0.7 percent and 0.1 percent respectively, the share of buying power controlled by Native American consumers rose in every state from 2000 to 2017.
n 2017, 20 million Americans—6.1 percent of the country’s population—will claim Asian ancestry, which makes the group a powerful force in the U.S. consumer market. This
racial group’s shares of the population were 3 percent, 4 percent, 5.2 percent, and 6.1 percent in 1990, 2000, 2010, and 2017, respectively; and their enormous economic clout continues to attract more attention from businesses and advertisers. The Selig Center’s data for Asians combines two race categories, including those who identified themselves as Asian or as Native Hawaiian and Other Pacific Islander.
We project that the nation’s Asian buying power will climb from $117 billion in 1990, to $277 billion in 2000, to $606 billion in 2010, to $986 billion in 2017, and to $1.3 trillion in 2022. The 257 percent gain from 2000 through 2017 exceeds the increases in buying power projected for whites (87 percent), the U.S. as a whole (97 percent), blacks (108 percent), Native Americans (180 percent), and Hispanics (203 percent). At $986 billion in 2017, the U.S. Asian market already outshines the entire economies of all but 16 countries – it is slightly smaller than the GDP of Mexico and slightly larger than the GDP of Turkey.
The group’s fast-paced growth in buying power demon-strates the increasing importance of Asian consumers and should create opportunities for businesses that pay attention to their needs. Because the group includes consumers of so many national ancestries, languages, and such diverse cultures, firms that target specific subgroups—Chinese or Filipino, for example —may find niche markets particularly rewarding. Accordingly, the Selig Center provides 2017 buying power estimates for 17 selected groups of Asian consumers for which sufficient demo-graphic data were available at the national level. These groups collectively account for 96.4 percent of the US Asian population. In terms of buying power, Asian Indians comprise the larg-est of the groups that constitute the Asian American market. Asian Indians account for $266 billion in buying power, or 27 percent of U.S. Asian buying power. The Chinese (except Tai-wanese) are second, accounting for $231 billion, or 23.4 percent of Asian buying power. They constitute the largest sub-group in population, however. Filipinos constitute the third largest group

The MulTiculTural econoMy 8
Where Asians Spend Less
The Multicultural Dollar
Where Asians Spend More
dining outhousingpublic transportationeducationclothing
utilitiesused carscash contributionshealth careentertainment
in terms of both population and buying power, accounting for $147 billion in buying power or 14.92 percent of Asian buying power. Koreans are the fifth largest group in terms of popula-tion, but rank fourth in terms of buying power, accounting for $81 billion, or 8.2 percent of the U.S. Asian market. Vietnamese rank fifth in terms of buying power ($71 billion), but fourth in terms of population. Due to data limitations estimates could not be provided for several groups with relatively small popula-tions (e.g., Bhutanese, Malaysian, Mongolian, Okinawan, and Sri Lankan), for persons who did not specify a category, or for those who specified two or more categories. The statistics for these groups are reported as “other,” and represent only 3.6 percent of Asian buying power in 2017. Employment gains are one of the forces supporting the growth of Asian buying power. From January 2000 through
March 2017 (the most recent data available at the time of this writing), the number of jobs held by Asians increased by 3.6 million, or 63 percent. While the percentage gain is very im-pressive, it falls slightly short of the 79 percent increase in the U.S. Asian population over the same period. Demographics are a key, too. The Asian population is grow-ing more rapidly than the total population, mostly because of strong immigration, a trend that is expected to continue. In 2017, the Asian population will be 20 million, or 79 percent higher than its 2000 base of 11.2 million. This 79 percent gain in population exceeds that projected for any other racial group as well as Hispanics. From 2017 to 2022, the U.S. Asian popula-tion will grow by 18 percent, which is the highest of any group. The Asian population of the U.S. is younger than the overall U.S. population: The Current Population Survey indicates that the median age of Asians is 35.4 years compared to 36.7 years for the total population and 38.2 years for whites. Compared to whites,
more Asians are either entering the workforce for the first time or are moving up their career ladders. Also, fewer of them are of traditional retirement age. Another factor contributing to Asian buying power is that nearly all Asians are urbanites. The economic rewards of education also provide a big boost. Asians are much better educated than is the average American, and therefore hold many top-level jobs in manage-ment, professional, and scientific specialties. Compared to the overall population, Asians are much less likely to hold jobs in agriculture, forestry, construction, and government. According to recent data, 55.9 percent of Asians over 25 had a bachelor’s degree or higher compared to 33.7 percent of whites. The increasing number of successful Asian entrepreneurs also helps to increase the group’s buying power. The 2012 Sur-vey of Business Owners shows that the number of Asian owned firms increased by 24 percent from 2007 to 2012, which is eight times greater than the 3 percent increase in the number of all U.S. firms. In 2017, the ten states with the largest Asian consumer markets, in order, are California ($323 billion), New York ($88 billion), Texas ($78 billion), New Jersey ($57 billion), Illinois ($39 billion), Washington ($36 billion), Virginia ($32 billion), Hawaii ($30 billion), Florida ($29 billion, and Massachusetts ($26 billion). Compared to the overall consumer market, the group’s spending is much more focused geographically. In 2017, the five and the ten states with the largest Asian consumer markets account for 59 percent and 75 percent of Asian buying power, respectively. In contrast, the five and the ten largest total con-sumer markets account for 39 percent and 56 percent of U.S. buying power, respectively. In 2017, California stands out as the largest Asian consumer market ($323 billion), but Asian buying power is attaining critical mass in a growing number of states. In 2000, only six states had over $10 billion in Asian buying power. In 2017, twenty states have over $10 billion in Asian buying power. Ranked by the rate of growth of Asian buying power over 2000-2017, the top ten states are South Dakota (488 percent), Arkansas (424 percent), Texas (411 percent), North Dakota (403 percent), Vermont (402 percent), North Carolina (398 percent), Arizona (371 percent), Nevada (339 percent), Indiana (336 percent), and Georgia (335 percent). Texas (ranks 3) is the only one that is among the nation’s ten largest Asian consumer markets. Georgia (ranks 11) and North Carolina (ranks 12) are among the nation’s rapidly emerging Asian markets, however. Nationally, Asian consumers’ share of the nation’s total buy-ing power will increase from 2.7 percent in 1990, to 3.7 percent in 2000, to 5.4 percent in 2010, to 6.8 percent in 2017, and to 7.7 percent in 2022. In order, the ten states with the largest shares of total buying power that is Asian in 2017 are Hawaii, where Asians account for 45.2 percent of the state’s buying power, California (16.4 percent), New Jersey (11.6 percent), Washington (9.9 percent), Nevada (9.2 percent), New York (8.5

Selig Center for eConomiC growth 9
T
n Hispanic Buying Power nThe Multicultural Dollar
Where Hispanics Spend More
tobaccohealth careentertainmenteducationpersonal insurance
Where Hispanics Spend Less
groceriesclothingcell phone servicesvehicle financing
percent), Virginia (7.7 percent), Maryland (7.3 percent), Mas-sachusetts (6.7 percent), and Illinois (6.4 percent). Except for Hawaii, where Asians’ market shares dropped by 5.4 percent, the share of buying power controlled by Asian consumers rose in every state from 2000 to 2017. The 6.4 percent gain in Asians’ share of California’s consumer market is the largest share increase in the nation, followed by the 5.6 percent increase in market share in New Jersey. The 2015-16 Consumer Expenditure Survey indicates that Asian households spent 17 percent more than the average U.S. household, reflecting their higher mean household incomes. Asian households spent far more than the average U.S. house-hold on groceries, restaurants, housing, household operations, public transportation, education, and pensions and Social Security. They spent less than average on alcoholic beverages, utilities, furniture, vehicle purchases, gasoline, health care, entertainment, reading materials, and cash contributions. Compared to the average household, Asian households are much more likely to be renters than homeowners. The same survey indicates that there are 2.8 persons per Asian household compared to 2.5 persons for the average house-hold. Asians have only 1.5 vehicles per household compared to 1.9 vehicles for the average household.
he immense buying power of the nation’s Hispanic con-sumers continues to energize the nation’s consumer mar-ket, and Selig Center projections reveal that Hispanics will
control $1.5 trillion in spending power in 2017. More than one person in six who lives in the U.S. is of Hispanic origin, and the U.S. Hispanic population continues to grow much more rapidly that the non-Hispanic population. Over the period, 1990-2022, the nation’s Hispanic buying power will grow dramatically. In sheer dollar power, Hispanics’ economic clout will rise from $213 billion in 1990, to $494 billion in 2000, to $1 trillion in 2010, to $1.5 trillion in 2017, and to $1.9 trillion in 2022. The 2017 value exceeds the 2000 value by 203 percent--a percentage gain that is far greater than either the 90 percent increase in non-Hispanic buying power or the 97 percent increase in the buying power of all consumers. U.S. Hispanic buying power will grow faster than black buying power (108 percent) and Native American buying power (180 percent), but more slowly than Asian buying power (257 per-cent). In 2017, Hispanics account for 10.3 percent of all U.S. buying power, up from 9.1 percent in 2010, from 6.7 percent in 2000, and from 5 percent in 1990. In 2022, Hispanics will account for 11.1 percent of total U.S. buying power. The Selig Center provides 2017 buying power national-level estimates for seven selected groups of Hispanic consumers for which sufficient demographic data were available at the na-
tional level. These seven groups collectively account for 96.2 percent of the Hispanic population. Mexicans comprise the largest of the groups, and account for $854 billion in buying power, or 57.1 percent of U.S. Hispanic buying power. Puerto Ricans are second largest group in terms of buying power, ac-counting for $158 billion, or 10.6 percent of Hispanic buying power. Central Americans are the third largest, accounting for $133 billion in buying power, or 8.9 percent of Hispanic buy-ing power. South Americans rank fourth, accounting for $129 billion, or 8.7 percent of the U.S. Hispanic market. Cubans rank fifth, accounting for $79 billion. Of the myriad forces supporting this substantial and continued growth, by far the most important is favorable de-mographics. Because of both higher rates of natural increase and strong immigration, the Hispanic population is growing much more rapidly than the total population, a trend that is projected to continue. Between 2000 and 2017, the Hispanic population increased by 65.8 percent compared to 8.5 percent for the non-Hispanic population and 15.8 percent for the total population. The relatively young Hispanic population, with propor-tionally more Hispanics either entering the workforce for the first time or moving up their career ladders, also argues for ad-
ditional gains in buying power. Hispanics’ spending patterns already help to determine the success or failure of many youth-oriented products and services. Data show that 34.9 percent of the Hispanic population is under age 18 compared to 20.8 percent of the non-Hispanic population.. The increasing number of Hispanic business owners is an-other potent force powering this consumer market. Estimates from the 2012 Survey of Business Owners show that the number of Hispanic-owned firms increased by 46 percent from 2007 to

The MulTiculTural econoMy 10
2012, which is fifteen times greater than the 3 percent increase in the number of all U.S. firms. Increased entrepreneurial activity and a rising level of educational attainment help Hispanics’ upward mobility, too. The 2016 Current Population Survey indicates that 68.5 percent of Hispanics over 25 were high school graduates. (That compares to only 57 percent in 2000 and to 50.8 percent in 1990.) The proportion with four or more years of college increased from 9.2 percent in 1990 to 10.6 percent in 2000, and to 16.4 percent in 2016. The Census Bureau cautions, however, that levels of educational attainment for Hispanics are lower than those for non-Hispanic whites, blacks, and Asians largely because of the vast number of less educated foreign-born Hispanics.
Employment gains strongly support the growth of Hispanic buying power. From January 2000 through March 2017, the number of jobs held by Hispanics increased by 10.4 million jobs, or 66 percent. That cumulative gain is very impressive and it equals the 66 percent increase in the Hispanic population that occurred over the same time period.
Hispanic refers to a person of Mexican, Puerto Rican, Cu-ban or other Spanish/Hispanic/Latino culture or origin, and is considered an ethnic category rather than a racial group. Persons of Hispanic origin therefore may be of any race, and since their culture varies with the country of origin, the Span-ish language often is the uniting factor. Three out of every five Hispanics living in the U.S. are born here, and among the foreign born the vast majority are Mexican, which suggests that many Hispanics share similar backgrounds and cultural experiences. Nonetheless, spending patterns differ significantly based on country of origin, and the composition of the nation’s Hispanic population is changing. Hispanics will comprise 18.1 percent of the country’s popu-lation in 2017, and will have disposable income of $1.5 trillion. In 2017, the ten states with the largest Hispanic markets, in order, are California ($388 billion), Texas ($284 billion), Florida ($155 billion), New York ($109 billion), Illinois ($55 billion), New Jersey ($54 billion), Arizona ($45 billion), Colorado ($29 billion), New Mexico ($25 billion), and Virginia ($24 billion). Hispanics and their buying power are much more geographi-cally concentrated than non-Hispanics. California alone ac-counts for 26 percent of Hispanic buying power. In 2017, the five states and the ten states with the largest Hispanic markets account for 66 percent and 78 percent of Hispanic buying power, respectively. In contrast, the five states with the largest non-Hispanic markets account for only 36 percent of total buy-ing power and the ten largest non-Hispanic markets account for only 53 percent of total buying power. The top ten states, as ranked by the rate of growth of His-panic buying power over 2000-2017, are North Dakota (642 percent), South Dakota (482 percent), Oklahoma (353 percent), South Carolina (350 percent), Arkansas (349 percent), Alaska (341 percent), Montana (329 percent), Tennessee (328 percent), Maryland (314 percent), and Pennsylvania (308 percent). Only
Pennsylvania (ranks 12), Maryland (ranks 17), and Oklahoma (ranks 23) are among the nation’s 25 largest Hispanic consumer markets in 2017, however.
The share of buying power controlled by Hispanic consum-ers will rise from 5 percent in 1990 to 6.7 percent in 2000, to 9.1 percent in 2010, to 10.3 percent in 2017, and to 11.1 percent in 2022. The group’s share will rise in every state. In 2017, the ten states with the largest Hispanic market shares will be New Mexico (33.7 percent), Texas (22.8 percent), California (19.7 percent), Florida (17.8 percent), Arizona (17.2 percent), Nevada (16.1 percent), Colorado (11 percent), New Jersey (11 percent), New York (10.6 percent), and Illinois (9.1 percent).
From 2000 to 2017, New Mexico’s and Texas’ respective 6.7 percent and 6.3 percent shifts in Hispanic market share are the nation’s largest. Florida will see a 6.1 percent advance in Hispanic market share, while Hispanics’ share of Nevada’s consumer market will rise by 5.4 percent. Hispanics’ share of California’s market will rise by 4.9 percent, which is remarkable for a state which such a large, established, market. Arizona’s Hispanics share of the state’s total buying power will rise by 4.8 percent.
Because of differences in per capita income, wealth, de-mographics, and culture, the spending habits of Hispanics as a group are not the same as those of the average U.S. consumer. The Consumer Expenditure Survey indicates that the average Hispanic household spends in total only about 83 percent as much as the average non-Hispanic household. Despite markedly lower average income levels, Hispanic households spent more on groceries, cell phone services, appar-el, footwear, and gasoline. Also, they spent a higher proportion of their income (though less money) on restaurants, housing, and used cars. Hispanics spent about the same proportion of their total outlays (though less money) as non-Hispanics on alcoholic beverages, housekeeping supplies, furniture, floor coverings, appliances, public transportation, personal care products and services, and reading materials. Compared to the non-Hispanic population, Hispanics spent substantially smaller proportions of total outlays (and substantially less money) on health care, entertainment, edu-cation, tobacco products, cash contributions, life insurance, and pensions and Social Security. The same survey found that Hispanic households are substantially larger than non-Hispanic households (3.2 persons per household versus 2.4 persons for non-Hispanics), and have more than twice as many children under 18. On average, there are 1.7 vehicles per Hispanic house-hold compared to 1.9 vehicles per non-Hispanic household. Hispanics also are much more likely to be renters instead of homeowners. n

Selig Center for eConomiC growth 11
METHODOLOGY
Because there are no direct measures of the buying power of African Americans, Native Americans, Asians, Whites, and Hispanics, these estimates were calculated using national and regional economic models, univariate forecasting techniques, and data from various U.S. government sources. The model developed by the Selig Center integrates statistical methods used in regional economics with those of market research. In general, the estimation process has two parts: estimating disposable personal income and allocating that estimate by race or ethnicity based on both population estimates and variances in per capita income. The Selig Center’s estimates of disposable personal income (the total buying power of all groups, regardless of race or ethnicity) are reported in Table 7. Total buying power for 1990-2016 equals disposable personal income as reported in the National Income and Product Accounts tables by the U.S. Department of Commerce, Bureau of Economic Analysis in March 2017. Based on the data provided by the Commerce Department, the Selig Center prepared projections of total buying power for 2017-2022. Defined as the share of total personal income that is available for spending on personal consumption, personal interest payments, and savings, disposable personal income measures the total buying power held by residents of an area. In 2016, 91.6 percent of disposable personal income was used to purchase goods and services (personal consumption expenditures); the remaining 8.4 percent represents personal savings, non-mortgage interest paid by persons, or personal transfer payments to either government or to persons living abroad. The Selig Center’s estimates are consistent with the concepts and definitions used in the National Income and Product Accounts (NIPA). Readers should note that buying power is not the equivalent of aggregate money income as defined by the Census Bureau. Because the Selig Center’s estimates are based on disposable personal income data obtained from the BEA, rather than money income values issued by the Census Bureau, the result is significantly higher estimates of buying power. There are several reasons for this lack of correspondence. First, the income definition used by the BEA is not the same as the definition used by the Census Bureau. Second, Census income data are gathered through a nationwide survey sample of households, and respondents tend to underreport their income, which accounts for much of the discrepancy. Finally, the population universe for the Census money income estimates differs from the universe used by the BEA. It should also be emphasized that the Selig Center’s estimates are not equivalent to aggregate consumer expenditures as reported in the Consumer Expenditure Survey that is conducted each year by the U.S. Bureau of Labor Statistics. The Selig Center’s estimates of total buying power were allocated to each racial group and Hispanics based on popula-tion estimates and variances in per capita personal income by race or ethnicity. For 2010-2014, the Selig Center relied upon annual estimates of the resident population provided by the U.S. Census Bureau that were released in June 2015. For 2000 through 2009, the Selig Center relied upon the population distributions provided by the U.S. Census Bureau’s intercensal estimates of the resident population by race, sex, and Hispanic origin for the states and the United States. For 1990 through 1999, the Selig Center used the U. S. Census Bureau’s time series of intercensal population estimates that were revised in August 2004. The Census Bureau indicates that these estimates were developed to take into account differences between the postcensal time series population estimates for the 1990s and Census 2000 results. Because there are differences between the data series, there is a series break, which limits the comparability of the race-based estimates for 1990 to those for 2000 and 2010. The main difference is that the multiracial category first appears in 2000. There is no corresponding series break for Hispanics, however. Based on trends in the historical data, the Selig Center prepared independent population projections for 2016-2022. To do this, the Selig Center took into account the projections of the population by age, race, and Hispanic origin for the United States: 2015 to 2060, released by the U.S. Census Bureau in December 2014, but the Selig Center did not control total to these estimates. A relative income adjustment factor was estimated for each group for each geographic area to compensate for the varia-tion in per capita personal income (and by extension, in per capita disposable personal income) that is accounted for by race or ethnicity. These factors were calculated on an annual basis using Summary File 3 (SF 3) data regarding income by race and Hispanic origin from Census 2000 and per capita money income data by race for local areas that were gathered during the 1990 Census of Population and Housing. For more recent years, the Selig Center relied on data obtained from the Census Bureau’s 2008-2012 American Community Survey 5-year estimates. The expenditures data by item for African Americans, Hispanics, Asians, and the comparison groups were obtained di-rectly from the third quarter 2015 through second quarter 2016 Consumer Expenditure Survey that was released by the Bureau of Labor Statistics in April 2017. The amounts are direct out-of-pocket expenditures, and do not include reimbursements, such as for medical care or car repairs covered by insurance.

The MulTiculTural econoMy 12
Table 1
U.S. Buying Power Statistics by Race, 1990, 2000, 2010, 2017, and 2022
Buying Power (billions of dollars) 1990 2000 2010 2017 2022 Total 4,297.1 7,399.4 11,221.6 14,577.9 17,435.3White 3,840.0 6,413.5 9,434.5 11,998.1 14,127.2Black 320.4 608.9 957.4 1,268.7 1,536.3American Indian 19.8 40.3 82.4 112.8 139.4Asian 116.9 276.5 605.7 986.2 1,345.5Multiracial 0.0 60.2 141.5 212.2 287.0
Percentage Change in Buying Power 1990-2000 2000-2010 2010-2017 2017-2022
Total 72.2 51.7 29.2 19.6 White 67.0 47.1 27.2 17.7 Black 90.0 57.3 32.5 21.1 American Indian 103.1 104.7 36.9 23.5 Asian 136.6 119.0 62.8 36.4 Multiracial 0.0 135.0 50.0 35.3
Share of Market (percent) 1990 2000 2010 2017 2022 Total 100.0 100.0 100.0 100.0 100.0White 89.4 86.7 84.1 82.3 81.0Black 7.5 8.2 8.5 8.7 8.8 American Indian 0.5 0.5 0.7 0.8 0.8 Asian 2.7 3.7 5.4 6.8 7.7 Multiracial 0.0 0.8 1.3 1.5 1.6
Source: Selig Center for Economic Growth, Terry College of Business, The University of Georgia, June 2017.

Selig Center for eConomiC growth 13
Table 2
U.S. Population Statistics by Race, 1990, 2000, 2010, 2017, and 2022
Total White Black American Indian Asian Multiracial
Population 1990 2000 2010 2017 2022
Percentage Change in Population 1990-2000 2000-2010 2010-2017 2017-2022
Total 13.0 9.6 5.6 4.3 White 9.2 6.0 3.2 2.4 Black 16.9 12.7 8.0 5.9 American Indian 30.4 39.8 9.8 7.0 Asian 48.0 42.8 25.4 17.9 Multiracial NA 77.8 24.9 17.5
Share of Population (percent) 1990 2000 2010 2017 2022 Total 100.0 100.0 100.0 100.0 100.0White 83.9 81.0 78.3 76.6 75.2 Black 12.3 12.7 13.0 13.3 13.6 American Indian 0.8 1.0 1.2 1.3 1.3 Asian 3.0 4.0 5.2 6.1 6.9 Multiracial NA 1.4 2.3 2.7 3.0
Source: Selig Center for Economic Growth, Terry College of Business, The University of Georgia, June 2017.
249,622,814 282,162,411 309,346,863 326,605,194 340,582,274 209,366,661 228,530,479 242,244,848 250,085,478 256,060,141 30,648,345 35,814,706 40,356,211 43,601,079 46,187,957 2,058,726 2,684,491 3,752,403 4,120,151 4,409,112 7,549,082 11,173,178 15,952,765 20,006,033 23,596,333 NA 3,959,557 7,040,636 8,792,452 10,328,732

The MulTiculTural econoMy 14
Table 3
U.S. Hispanic Market Statistics, 1990, 2000, 2010, 2017, and 2022
Buying Power (billions of dollars) 1990 2000 2010 2017 2022 Total Hispanic Non-Hispanic
Percentage Change in Buying Power 1990-2000 2000-2010 2010-2017 2017-2022
Total Hispanic Non-Hispanic
Market Share (percent) 1990 2000 2010 2017 2022 Total 100.0 100.0 100.0 100.0 100.0Hispanic Non-Hispanic
Source: Selig Center for Economic Growth, Terry College of Business, The University of Georgia, June 2017.
4,297 7,399 11,222 14,578 17,435 213 494 1,015 1,494 1,928 4,084 6,906 10,206 13,084 15,507
72.2 51.7 29.9 19.6 132.1 105.7 47.1 29.0 69.1 47.8 28.2 18.5
4.9 6.7 9.0 10.2 11.1 95.1 93.3 91.0 89.8 88.9

Selig Center for eConomiC growth 15
Table 4
U.S. Hispanic Population Statistics,1990, 2000, 2010, 2017, and 2022
Population 1990 2000 2010 2017 2022 Total Hispanic Non-Hispanic
Percentage Change in Population 1990-2000 2000-2010 2010-2017 2017-2022
Total Hispanic Non-Hispanic
Share of Population (percent) 1990 2000 2010 2017 2022 Total 100.0 100.0 100.0 100.0 100.0Hispanic Non-Hispanic
Source: Selig Center for Economic Growth, Terry College of Business, The University of Georgia, June 2017.
249,622,814 282,162,411 309,346,863 326,605,194 340,582,274 22,572,838 35,661,885 50,756,117 59,133,450 66,061,851 227,049,976 246,500,526 258,590,746 267,471,744 274,520,423
13.0 9.6 5.6 4.3 58.0 42.3 16.5 11.7 8.6 4.9 3.4 2.6
9.0 12.6 16.4 18.1 19.4 91.0 87.4 83.6 81.9 80.6

The MulTiculTural econoMy 16
Table 5
U.S. Hispanic Market Statistics, By Subgroup, 2017
Percentage of Per Capita Population Buying Power Total Hispanic Buying Power Subgroup (number) (thousands of dollars) Buying Power (thousands of dollars)
Source: Selig Center for Economic Growth, Terry College of Business, The University of Georgia, June 2017.
Mexican 37,468,144 853,831,792 57.1 23Puerto Rican 5,623,568 157,671,702 10.6 28Central American 5,454,161 132,830,987 8.9 24South American 3,562,505 129,308,813 8.7 36Cuban 2,204,836 79,230,830 5.3 36Other Hispanic or Latino 2,041,342 56,944,681 3.8 28Dominican 1,960,536 46,829,736 3.1 24Spaniard 818,357 37,460,196 2.5 46 Total 59,133,450 1,494,108,736 100.0 25

Selig Center for eConomiC growth 17
Table 6
U.S. Asian Market Statistics, By Subgroup, 2017
Percentage of Per Capita Population Buying Power Total Asian Buying Power Subgroup (number) (thousands of dollars) Buying Power (thousands of dollars)
Source: Selig Center for Economic Growth, Terry College of Business, The University of Georgia, June 2017.
Asian Indian Chinese (except Taiwanese) Filipino Korean Vietnamese Japanese Others Pakistani Native Hawaiian & Other Taiwanese Thai Cambodian Laotian Hmong Bangladeshi Nepalese Burmese Indonesian Total
4,151,810 266,494,630 27.0 64 4,459,009 231,232,685 23.4 52 3,195,974 146,851,456 14.9 46 1,638,843 80,736,957 8.2 49 1,951,203 71,365,505 7.2 37 849,973 52,879,192 5.4 62 721,914 35,691,392 3.6 49 541,654 21,818,007 2.2 40 622,718 18,945,393 1.9 30 179,485 11,729,648 1.2 65 218,552 9,083,840 0.9 42 309,412 8,657,026 0.9 28 240,083 7,346,998 0.7 31 319,877 6,807,879 0.7 21 198,333 6,030,894 0.6 30 150,891 3,911,646 0.4 26 172,509 3,477,330 0.4 20 83,796 3,102,777 0.3 37 20,006,033 986,163,256 100.0 49

The MulTiculTural econoMy 18
Table 7
Total Buying Power by Place of Residence for U.S. and the States, 1990, 2000, 2010, 2017, and 2022
(millions of dollars)
Source: Selig Center for Economic Growth, Terry College of Business, The University of Georgia, June 2017.
Area 1990 2000 2010 2017 2022
United States 4, 297,144 7,399,368 11,221,631 14,577,908 17,435,314 Alabama 57,240 95,836 148,032 177,650 202,804 Alaska 11,176 17,716 32,033 38,124 41,877 Arizona 56,446 118,133 197,639 261,716 321,091 Arkansas 30,989 54,162 85,133 109,396 128,441 California 560,853 929,360 1,438,637 1,966,486 2,439,083 Colorado 56,985 125,014 179,813 265,196 344,386 Connecticut 75,817 120,079 194,529 217,247 235,383 Delaware 12,425 23,463 33,309 42,633 49,804 District of Columbia 13,382 20,517 32,788 45,908 57,162 Florida 233,392 417,813 669,630 872,152 1,043,103 Georgia 101,543 203,992 305,356 395,852 467,948 Hawaii 21,676 31,334 52,129 67,185 81,066 Idaho 14,393 28,539 45,832 61,833 76,267 Illinois 210,267 353,492 480,289 599,170 702,246 Indiana 86,450 150,286 207,140 267,870 317,123 Iowa 43,433 71,305 105,430 135,096 156,764 Kansas 40,409 66,687 101,534 130,241 150,243 Kentucky 50,742 88,034 130,672 161,556 186,481 Louisiana 57,961 94,700 155,793 189,913 219,331 Maine 19,195 30,469 45,450 54,311 61,578 Maryland 95,032 159,463 255,785 309,525 350,576 Massachusetts 119,409 197,898 305,363 387,627 461,249 Michigan 154,504 261,466 316,519 403,454 474,223 Minnesota 75,513 135,276 198,871 256,594 303,874 Mississippi 31,198 55,392 83,898 100,965 113,848 Missouri 81,011 136,888 200,620 243,851 280,127 Montana 11,099 18,626 32,084 40,189 46,090 Nebraska 26,113 43,445 67,577 86,296 96,961 Nevada 21,956 56,095 91,179 119,918 146,877 New Hampshire 20,549 37,981 57,031 72,380 85,375 New Jersey 167,682 278,764 400,167 492,566 569,438 New Mexico 20,717 37,314 63,142 75,093 83,457 New York 372,093 568,107 803,888 1,034,404 1,227,848 North Carolina 102,023 191,504 306,690 393,242 471,921 North Dakota 9,338 15,081 26,870 38,843 48,341 Ohio 177,799 279,079 378,781 476,751 551,127 Oklahoma 44,914 72,829 123,903 169,191 208,263 Oregon 45,397 83,681 122,776 168,297 211,375 Pennsylvania 205,244 322,561 480,760 597,254 692,588 Rhode Island 17,920 27,440 40,821 49,687 57,517 South Carolina 49,745 88,483 136,945 184,168 226,414 South Dakota 10,566 18,328 31,266 38,444 42,566 Tennessee 74,200 139,483 211,641 273,609 325,810 Texas 265,354 519,119 878,701 1,245,457 1,561,387 Utah 22,754 47,279 80,090 116,364 150,096 Vermont 9,005 15,379 23,442 28,927 33,090 Virginia 113,476 197,832 324,533 407,897 474,832 Washington 88,094 167,689 261,264 365,111 464,853 West Virginia 23,367 35,973 54,375 62,917 68,314 Wisconsin 78,979 137,626 198,163 249,674 290,962 Wyoming 7,317 12,359 23,316 29,677 33,734
Selig Center for eConomiC growth 19
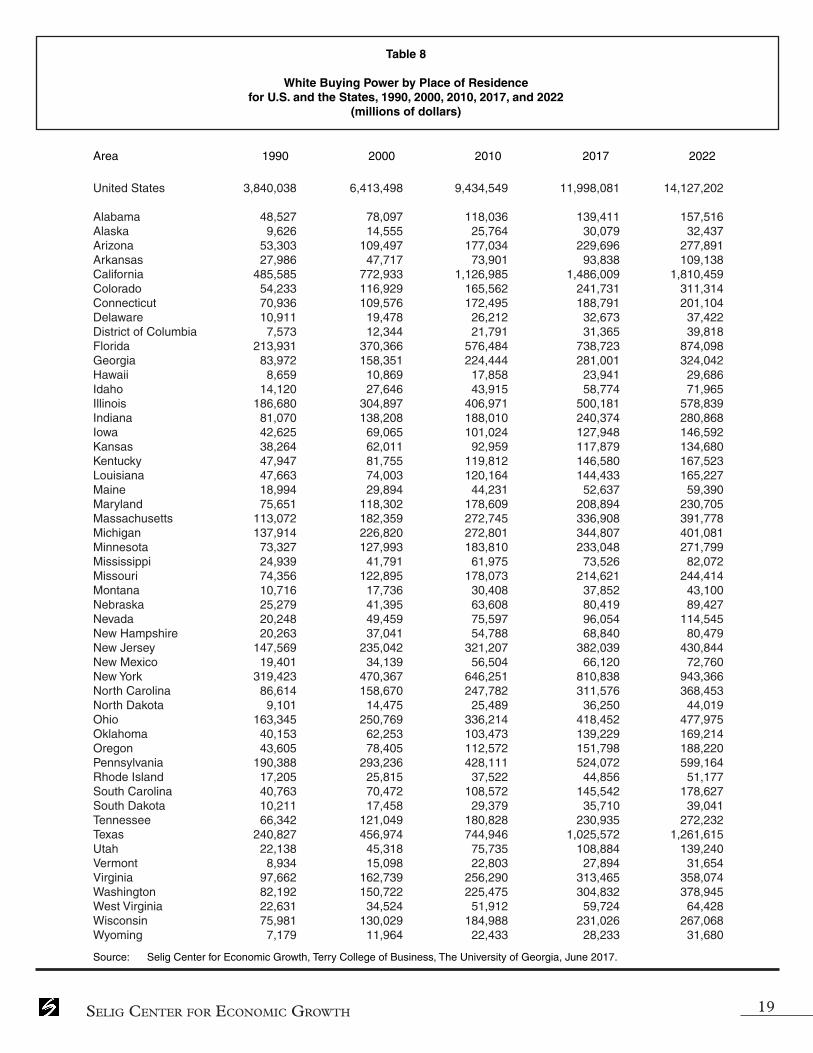
Table 8
White Buying Power by Place of Residence for U.S. and the States, 1990, 2000, 2010, 2017, and 2022
(millions of dollars)
Area 1990 2000 2010 2017 2022
Source: Selig Center for Economic Growth, Terry College of Business, The University of Georgia, June 2017.
United States 3,840,038 6,413,498 9,434,549 11,998,081 14,127,202 Alabama 48,527 78,097 118,036 139,411 157,516 Alaska 9,626 14,555 25,764 30,079 32,437 Arizona 53,303 109,497 177,034 229,696 277,891 Arkansas 27,986 47,717 73,901 93,838 109,138 California 485,585 772,933 1,126,985 1,486,009 1,810,459 Colorado 54,233 116,929 165,562 241,731 311,314 Connecticut 70,936 109,576 172,495 188,791 201,104 Delaware 10,911 19,478 26,212 32,673 37,422 District of Columbia 7,573 12,344 21,791 31,365 39,818 Florida 213,931 370,366 576,484 738,723 874,098 Georgia 83,972 158,351 224,444 281,001 324,042 Hawaii 8,659 10,869 17,858 23,941 29,686 Idaho 14,120 27,646 43,915 58,774 71,965 Illinois 186,680 304,897 406,971 500,181 578,839 Indiana 81,070 138,208 188,010 240,374 280,868 Iowa 42,625 69,065 101,024 127,948 146,592 Kansas 38,264 62,011 92,959 117,879 134,680 Kentucky 47,947 81,755 119,812 146,580 167,523 Louisiana 47,663 74,003 120,164 144,433 165,227 Maine 18,994 29,894 44,231 52,637 59,390 Maryland 75,651 118,302 178,609 208,894 230,705 Massachusetts 113,072 182,359 272,745 336,908 391,778 Michigan 137,914 226,820 272,801 344,807 401,081 Minnesota 73,327 127,993 183,810 233,048 271,799 Mississippi 24,939 41,791 61,975 73,526 82,072 Missouri 74,356 122,895 178,073 214,621 244,414 Montana 10,716 17,736 30,408 37,852 43,100 Nebraska 25,279 41,395 63,608 80,419 89,427 Nevada 20,248 49,459 75,597 96,054 114,545 New Hampshire 20,263 37,041 54,788 68,840 80,479 New Jersey 147,569 235,042 321,207 382,039 430,844 New Mexico 19,401 34,139 56,504 66,120 72,760 New York 319,423 470,367 646,251 810,838 943,366 North Carolina 86,614 158,670 247,782 311,576 368,453 North Dakota 9,101 14,475 25,489 36,250 44,019 Ohio 163,345 250,769 336,214 418,452 477,975 Oklahoma 40,153 62,253 103,473 139,229 169,214 Oregon 43,605 78,405 112,572 151,798 188,220 Pennsylvania 190,388 293,236 428,111 524,072 599,164 Rhode Island 17,205 25,815 37,522 44,856 51,177 South Carolina 40,763 70,472 108,572 145,542 178,627 South Dakota 10,211 17,458 29,379 35,710 39,041 Tennessee 66,342 121,049 180,828 230,935 272,232 Texas 240,827 456,974 744,946 1,025,572 1,261,615 Utah 22,138 45,318 75,735 108,884 139,240 Vermont 8,934 15,098 22,803 27,894 31,654 Virginia 97,662 162,739 256,290 313,465 358,074 Washington 82,192 150,722 225,475 304,832 378,945 West Virginia 22,631 34,524 51,912 59,724 64,428 Wisconsin 75,981 130,029 184,988 231,026 267,068 Wyoming 7,179 11,964 22,433 28,233 31,680
The MulTiculTural econoMy 20
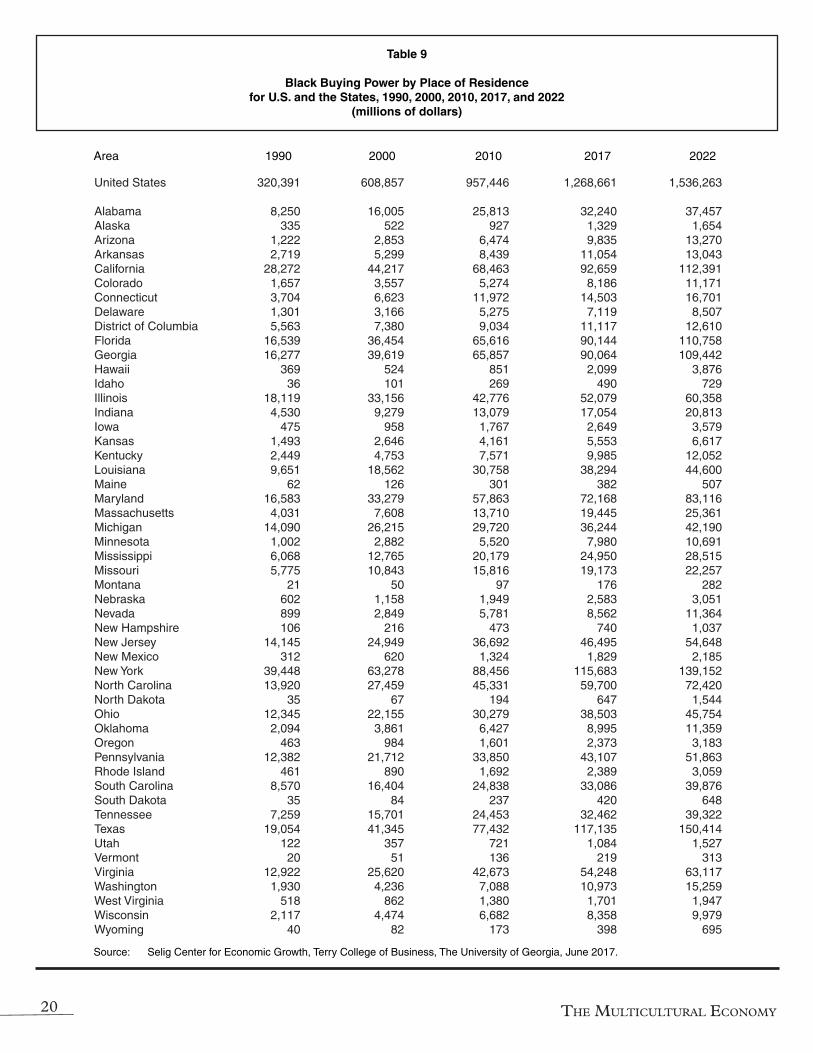
Table 9
Black Buying Power by Place of Residence for U.S. and the States, 1990, 2000, 2010, 2017, and 2022
(millions of dollars)
Area 1990 2000 2010 2017 2022
Source: Selig Center for Economic Growth, Terry College of Business, The University of Georgia, June 2017.
United States 320,391 608,857 957,446 1,268,661 1,536,263 Alabama 8,250 16,005 25,813 32,240 37,457 Alaska 335 522 927 1,329 1,654 Arizona 1,222 2,853 6,474 9,835 13,270 Arkansas 2,719 5,299 8,439 11,054 13,043 California 28,272 44,217 68,463 92,659 112,391 Colorado 1,657 3,557 5,274 8,186 11,171 Connecticut 3,704 6,623 11,972 14,503 16,701 Delaware 1,301 3,166 5,275 7,119 8,507 District of Columbia 5,563 7,380 9,034 11,117 12,610 Florida 16,539 36,454 65,616 90,144 110,758 Georgia 16,277 39,619 65,857 90,064 109,442 Hawaii 369 524 851 2,099 3,876 Idaho 36 101 269 490 729 Illinois 18,119 33,156 42,776 52,079 60,358 Indiana 4,530 9,279 13,079 17,054 20,813 Iowa 475 958 1,767 2,649 3,579 Kansas 1,493 2,646 4,161 5,553 6,617 Kentucky 2,449 4,753 7,571 9,985 12,052 Louisiana 9,651 18,562 30,758 38,294 44,600 Maine 62 126 301 382 507 Maryland 16,583 33,279 57,863 72,168 83,116 Massachusetts 4,031 7,608 13,710 19,445 25,361 Michigan 14,090 26,215 29,720 36,244 42,190 Minnesota 1,002 2,882 5,520 7,980 10,691 Mississippi 6,068 12,765 20,179 24,950 28,515 Missouri 5,775 10,843 15,816 19,173 22,257 Montana 21 50 97 176 282 Nebraska 602 1,158 1,949 2,583 3,051 Nevada 899 2,849 5,781 8,562 11,364 New Hampshire 106 216 473 740 1,037 New Jersey 14,145 24,949 36,692 46,495 54,648 New Mexico 312 620 1,324 1,829 2,185 New York 39,448 63,278 88,456 115,683 139,152 North Carolina 13,920 27,459 45,331 59,700 72,420 North Dakota 35 67 194 647 1,544 Ohio 12,345 22,155 30,279 38,503 45,754 Oklahoma 2,094 3,861 6,427 8,995 11,359 Oregon 463 984 1,601 2,373 3,183 Pennsylvania 12,382 21,712 33,850 43,107 51,863 Rhode Island 461 890 1,692 2,389 3,059 South Carolina 8,570 16,404 24,838 33,086 39,876 South Dakota 35 84 237 420 648 Tennessee 7,259 15,701 24,453 32,462 39,322 Texas 19,054 41,345 77,432 117,135 150,414 Utah 122 357 721 1,084 1,527 Vermont 20 51 136 219 313 Virginia 12,922 25,620 42,673 54,248 63,117 Washington 1,930 4,236 7,088 10,973 15,259 West Virginia 518 862 1,380 1,701 1,947 Wisconsin 2,117 4,474 6,682 8,358 9,979 Wyoming 40 82 173 398 695

Selig Center for eConomiC growth 21
Table 10
American Indian Buying Power by Place of Residence for U.S. and the States, 1990, 2000, 2010, 2017, and 2022
(millions of dollars)
Area 1990 2000 2010 2017 2022
Source: Selig Center for Economic Growth, Terry College of Business, The University of Georgia, June 2017.
United States 19,826 40,271 82,435 112,820 139,376 Alabama 168 394 906 1,190 1,386 Alaska 915 1,552 2,629 3,089 3,387 Arizona 1,158 2,500 4,755 6,787 8,440 Arkansas 134 314 610 860 1,104 California 3,553 6,581 14,813 20,311 24,954 Colorado 321 898 1,685 2,516 3,339 Connecticut 106 233 531 690 849 Delaware 34 65 152 191 221 District of Columbia 25 56 114 149 184 Florida 498 1,175 2,459 3,470 4,370 Georgia 170 485 1,124 1,401 1,666 Hawaii 83 86 182 299 424 Idaho 122 252 464 672 876 Illinois 314 725 1,896 2,420 2,880 Indiana 143 331 555 741 934 Iowa 59 150 293 431 559 Kansas 239 429 778 1,042 1,241 Kentucky 50 154 295 397 482 Louisiana 169 425 924 1,238 1,498 Maine 56 111 179 219 261 Maryland 206 442 1,073 1,329 1,584 Massachusetts 163 328 773 1,023 1,286 Michigan 625 1,120 1,549 2,083 2,540 Minnesota 411 856 1,353 1,821 2,262 Mississippi 59 171 330 413 490 Missouri 236 458 766 1,042 1,286 Montana 321 597 1,002 1,263 1,484 Nebraska 89 186 376 513 623 Nevada 243 529 973 1,345 1,709 New Hampshire 28 66 99 136 175 New Jersey 256 533 1,306 1,619 1,974 New Mexico 816 1,693 3,245 4,253 4,910 New York 814 1,635 4,181 5,632 6,823 North Carolina 777 1,594 2,970 3,769 4,549 North Dakota 162 347 670 945 1,162 Ohio 247 451 714 987 1,213 Oklahoma 2,239 3,819 7,606 10,829 13,550 Oregon 422 727 1,311 1,847 2,384 Pennsylvania 192 382 950 1,293 1,686 Rhode Island 44 75 178 252 322 South Carolina 100 257 521 674 838 South Dakota 290 587 1,087 1,342 1,488 Tennessee 123 372 788 1,102 1,415 Texas 883 2,613 6,752 9,964 12,753 Utah 156 366 688 1,088 1,465 Vermont 15 42 55 68 80 Virginia 239 531 1,291 1,654 2,005 Washington 924 1,592 2,783 4,097 5,405 West Virginia 16 63 86 108 132 Wisconsin 341 783 1,313 1,792 2,223 Wyoming 68 140 305 424 505

The MulTiculTural econoMy 22
Table 11
Asian Buying Power by Place of Residence for U.S. and the States, 1990, 2000, 2010, 2017, and 2022
(millions of dollars)
Area 1990 2000 2010 2017 2022
Source: Selig Center for Economic Growth, Terry College of Business, The University of Georgia, June 2017.
United States 116,889 276,531 605,720 986,163 1,345,485 Alabama 295 812 2,063 3,072 4,107 Alaska 300 592 1,486 2,131 2,694 Arizona 763 2,439 6,918 11,485 16,024 Arkansas 151 437 1,301 2,287 3,281 California 43,442 93,579 199,503 323,105 431,643 Colorado 773 2,529 4,806 8,526 12,425 Connecticut 1,071 2,945 7,819 11,130 14,112 Delaware 179 615 1,363 2,233 3,102 District of Columbia 222 533 1,251 2,288 3,206 Florida 2,424 7,109 18,117 29,089 39,120 Georgia 1,124 4,349 10,962 18,929 26,638 Hawaii 12,564 15,871 25,208 30,398 34,713 Idaho 115 325 672 1,086 1,552 Illinois 5,153 12,804 24,503 38,606 52,377 Indiana 706 1,711 3,953 7,460 11,420 Iowa 274 877 1,732 3,130 4,737 Kansas 413 1,090 2,428 4,053 5,516 Kentucky 297 920 1,990 3,195 4,541 Louisiana 479 1,189 2,711 4,215 5,621 Maine 83 178 407 647 870 Maryland 2,592 6,187 14,837 22,475 29,206 Massachusetts 2,143 6,399 15,325 25,892 36,585 Michigan 1,875 5,373 9,249 15,838 22,508 Minnesota 773 2,735 6,350 11,052 15,518 Mississippi 132 431 909 1,382 1,833 Missouri 644 1,724 3,963 6,232 8,485 Montana 40 91 199 353 512 Nebraska 143 504 1,129 2,009 2,847 Nevada 566 2,521 6,958 11,057 15,216 New Hampshire 152 466 1,217 2,011 2,807 New Jersey 5,712 16,556 37,233 57,039 74,800 New Mexico 187 535 1,187 1,673 2,098 New York 12,408 28,498 55,500 87,882 119,048 North Carolina 712 2,839 7,813 14,124 20,906 North Dakota 40 117 302 588 969 Ohio 1,863 4,045 8,242 14,071 19,888 Oklahoma 428 939 2,202 4,043 6,058 Oregon 907 2,527 5,050 8,774 12,726 Pennsylvania 2,282 5,830 14,240 23,500 32,632 Rhode Island 211 469 965 1,555 2,131 South Carolina 313 939 1,985 3,289 4,785 South Dakota 29 95 275 557 868 Tennessee 476 1,564 3,718 6,338 8,973 Texas 4,590 15,176 40,979 77,605 114,416 Utah 338 921 2,118 3,920 5,819 Vermont 36 95 253 478 693 Virginia 2,653 7,279 19,602 31,531 42,226 Washington 3,048 8,657 20,125 36,099 52,579 West Virginia 202 337 579 835 1,105 Wisconsin 541 1,701 3,848 6,606 9,139 Wyoming 29 75 175 288 409
Selig Center for eConomiC growth 23
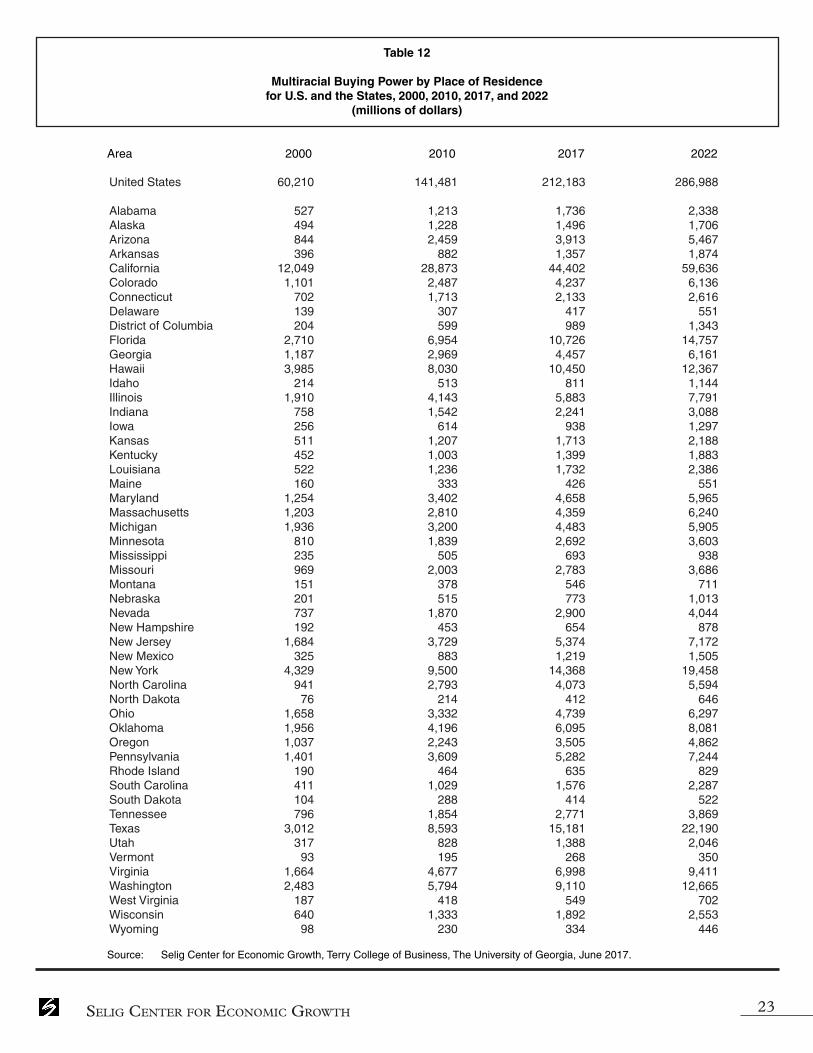
Table 12
Multiracial Buying Power by Place of Residencefor U.S. and the States, 2000, 2010, 2017, and 2022
(millions of dollars)
Area 2000 2010 2017 2022
Source: Selig Center for Economic Growth, Terry College of Business, The University of Georgia, June 2017.
United States 60,210 141,481 212,183 286,988 Alabama 527 1,213 1,736 2,338 Alaska 494 1,228 1,496 1,706 Arizona 844 2,459 3,913 5,467 Arkansas 396 882 1,357 1,874 California 12,049 28,873 44,402 59,636 Colorado 1,101 2,487 4,237 6,136 Connecticut 702 1,713 2,133 2,616 Delaware 139 307 417 551 District of Columbia 204 599 989 1,343 Florida 2,710 6,954 10,726 14,757 Georgia 1,187 2,969 4,457 6,161 Hawaii 3,985 8,030 10,450 12,367 Idaho 214 513 811 1,144 Illinois 1,910 4,143 5,883 7,791 Indiana 758 1,542 2,241 3,088 Iowa 256 614 938 1,297 Kansas 511 1,207 1,713 2,188 Kentucky 452 1,003 1,399 1,883 Louisiana 522 1,236 1,732 2,386 Maine 160 333 426 551 Maryland 1,254 3,402 4,658 5,965 Massachusetts 1,203 2,810 4,359 6,240 Michigan 1,936 3,200 4,483 5,905 Minnesota 810 1,839 2,692 3,603 Mississippi 235 505 693 938 Missouri 969 2,003 2,783 3,686 Montana 151 378 546 711 Nebraska 201 515 773 1,013 Nevada 737 1,870 2,900 4,044 New Hampshire 192 453 654 878 New Jersey 1,684 3,729 5,374 7,172 New Mexico 325 883 1,219 1,505 New York 4,329 9,500 14,368 19,458 North Carolina 941 2,793 4,073 5,594 North Dakota 76 214 412 646 Ohio 1,658 3,332 4,739 6,297 Oklahoma 1,956 4,196 6,095 8,081 Oregon 1,037 2,243 3,505 4,862 Pennsylvania 1,401 3,609 5,282 7,244 Rhode Island 190 464 635 829 South Carolina 411 1,029 1,576 2,287 South Dakota 104 288 414 522 Tennessee 796 1,854 2,771 3,869 Texas 3,012 8,593 15,181 22,190 Utah 317 828 1,388 2,046 Vermont 93 195 268 350 Virginia 1,664 4,677 6,998 9,411 Washington 2,483 5,794 9,110 12,665 West Virginia 187 418 549 702 Wisconsin 640 1,333 1,892 2,553 Wyoming 98 230 334 446

The MulTiculTural econoMy 24
Table 13
Hispanic Buying Power by Place of Residence for U.S. and the States, 1990, 2000, 2010, 2017, and 2022
(millions of dollars)
Area 1990 2000 2010 2017 2022
Source: Selig Center for Economic Growth, Terry College of Business, The University of Georgia, June 2017.
United States 212,678 493,718 1,015,422 1,494,109 1,928,034 Alabama 280 1,112 3,482 4,381 5,377 Alaska 233 480 1,257 2,119 2,924 Arizona 5,527 14,646 31,182 45,081 57,276 Arkansas 166 988 2,974 4,435 5,834 California 68,916 137,396 264,521 387,697 494,481 Colorado 3,988 11,132 19,096 29,299 39,321 Connecticut 2,334 5,051 12,198 16,853 20,946 Delaware 185 612 1,507 2,219 2,854 District of Columbia 466 955 1,963 3,509 4,852 Florida 20,325 48,898 105,717 155,211 201,951 Georgia 1,340 6,372 15,162 20,877 26,184 Hawaii 979 1,349 2,933 4,712 6,491 Idaho 404 1,132 2,732 4,251 5,694 Illinois 8,917 22,993 39,926 54,536 68,106 Indiana 1,060 3,344 7,358 10,642 13,928 Iowa 316 1,104 2,723 4,094 5,430 Kansas 896 2,509 5,508 7,862 9,930 Kentucky 231 865 2,505 3,521 4,538 Louisiana 1,198 2,031 5,224 7,450 10,032 Maine 79 169 398 604 842 Maryland 1,819 4,305 12,336 17,841 23,484 Massachusetts 2,569 6,065 13,473 21,212 29,306 Michigan 2,183 5,310 8,309 11,898 15,423 Minnesota 509 2,064 4,612 6,546 8,507 Mississippi 158 607 1,620 2,135 2,675 Missouri 740 1,896 4,432 6,322 8,282 Montana 87 226 572 971 1,378 Nebraska 348 1,295 3,116 4,540 5,757 Nevada 1,366 5,974 13,372 19,256 25,011 New Hampshire 149 382 920 1,511 2,179 New Jersey 9,120 19,712 37,991 54,008 68,953 New Mexico 5,045 10,081 19,738 25,322 29,193 New York 24,081 45,216 76,613 109,289 138,340 North Carolina 845 4,880 13,123 18,332 23,840 North Dakota 33 123 316 916 1,964 Ohio 1,552 3,446 7,261 11,006 14,696 Oklahoma 721 2,095 5,852 9,488 13,379 Oregon 927 3,200 7,196 11,230 15,204 Pennsylvania 2,129 5,451 14,107 22,255 30,815 Rhode Island 407 1,019 2,278 3,462 4,636 South Carolina 376 1,354 4,218 6,094 8,032 South Dakota 45 155 499 900 1,315 Tennessee 398 1,887 5,509 8,078 10,831 Texas 32,980 85,715 184,942 284,432 366,700 Utah 740 2,537 5,805 8,860 12,087 Vermont 47 106 251 407 577 Virginia 2,231 6,035 16,477 24,391 32,111 Washington 2,083 6,063 14,312 22,795 31,759 West Virginia 93 204 492 736 996 Wisconsin 797 2,664 5,966 8,535 11,108 Wyoming 264 510 1,345 1,991 2,506

Selig Center for eConomiC growth 25
Table 14
Non-Hispanic Buying Power by Place of Residence for U.S. and the States, 1990, 2000, 2010, 2017, and 2022
(millions of dollars)
Area 1990 2000 2010 2017 2022
Source: Selig Center for Economic Growth, Terry College of Business, The University of Georgia, June 2017.
United States 4,084,466 6,905,650 10,206,209 13,083,799 15,507,281 Alabama 56,960 94,724 144,550 173,269 197,427 Alaska 10,944 17,236 30,776 36,006 38,953 Arizona 50,919 103,486 166,457 216,635 263,815 Arkansas 30,823 53,174 82,158 104,961 122,607 California 491,937 791,964 1,174,116 1,578,788 1,944,602 Colorado 52,997 113,883 160,717 235,897 305,064 Connecticut 73,483 115,028 182,332 200,394 214,437 Delaware 12,241 22,851 31,801 40,414 46,949 District of Columbia 12,916 19,561 30,825 42,399 52,309 Florida 213,067 368,915 563,914 716,941 841,152 Georgia 100,203 197,620 290,194 374,975 441,765 Hawaii 20,697 29,986 49,196 62,474 74,574 Idaho 13,989 27,407 43,100 57,582 70,572 Illinois 201,350 330,499 440,363 544,634 634,140 Indiana 85,389 146,942 199,781 257,228 303,195 Iowa 43,116 70,202 102,707 131,002 151,335 Kansas 39,513 64,178 96,026 122,379 140,313 Kentucky 50,511 87,169 128,167 158,035 181,943 Louisiana 56,763 92,669 150,569 182,463 209,300 Maine 19,116 30,300 45,052 53,707 60,736 Maryland 93,213 155,158 243,449 291,684 327,091 Massachusetts 116,839 191,833 291,890 366,415 431,943 Michigan 152,321 256,155 308,210 391,557 458,800 Minnesota 75,004 133,212 194,259 250,047 295,367 Mississippi 31,040 54,784 82,277 98,830 111,172 Missouri 80,271 134,991 196,189 237,529 271,845 Montana 11,012 18,400 31,512 39,218 44,712 Nebraska 25,766 42,150 64,461 81,756 91,205 Nevada 20,591 50,121 77,806 100,662 121,867 New Hampshire 20,400 37,599 56,111 70,869 83,196 New Jersey 158,562 259,051 362,176 438,558 500,485 New Mexico 15,672 27,233 43,404 49,772 54,265 New York 348,013 522,891 727,275 925,115 1,089,508 North Carolina 101,177 186,623 293,567 374,910 448,081 North Dakota 9,305 14,958 26,554 37,927 46,377 Ohio 176,247 275,633 371,520 465,746 536,432 Oklahoma 44,193 70,734 118,051 159,703 194,883 Oregon 44,470 80,481 115,581 157,067 196,172 Pennsylvania 203,115 317,110 466,653 574,999 661,774 Rhode Island 17,513 26,421 38,543 46,225 52,882 South Carolina 49,370 87,129 132,727 178,073 218,382 South Dakota 10,521 18,173 30,767 37,543 41,251 Tennessee 73,801 137,596 206,131 265,531 314,979 Texas 232,374 433,404 693,760 961,025 1,194,687 Utah 22,014 44,741 74,284 107,504 138,009 Vermont 8,958 15,273 23,191 28,520 32,513 Virginia 111,246 191,798 308,056 383,506 442,721 Washington 86,012 161,626 246,952 342,316 433,093 West Virginia 23,274 35,769 53,883 62,181 67,318 Wisconsin 78,183 134,962 192,197 241,140 279,854 Wyoming 7,053 11,849 21,971 27,686 31,228
The MulTiculTural econoMy 26
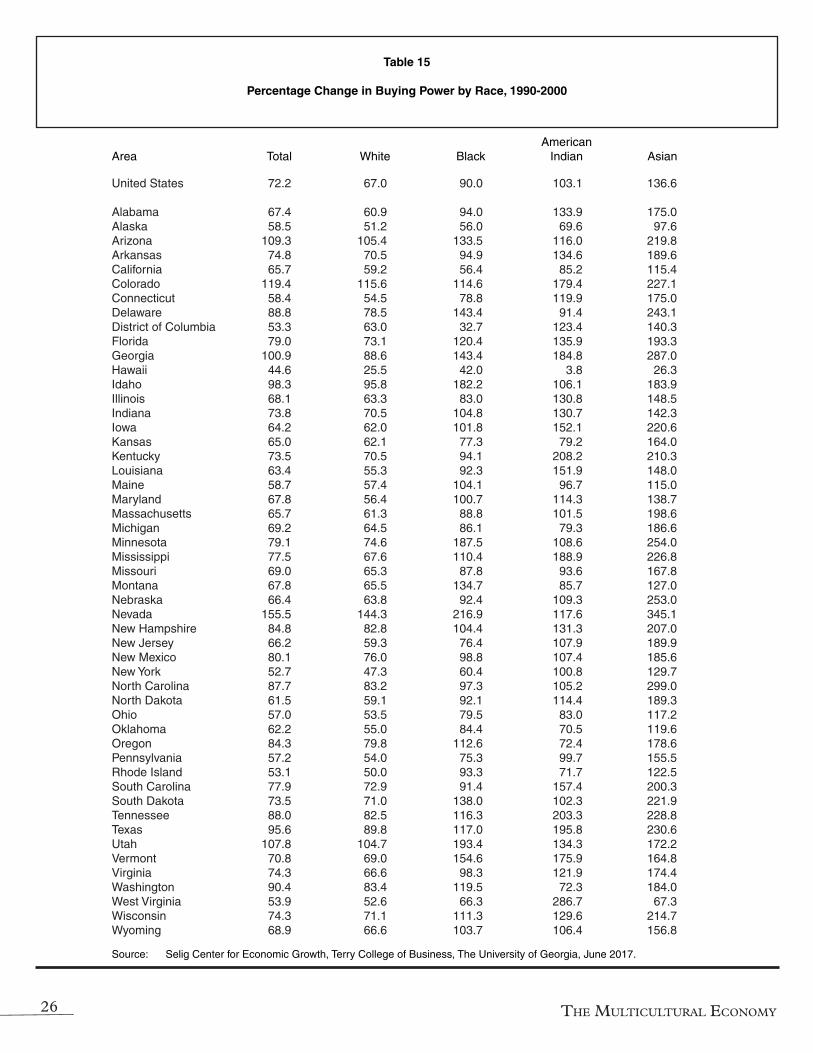
Table 15
Percentage Change in Buying Power by Race, 1990-2000
AmericanArea Total White Black Indian Asian
Source: Selig Center for Economic Growth, Terry College of Business, The University of Georgia, June 2017.
United States 72.2 67.0 90.0 103.1 136.6 Alabama 67.4 60.9 94.0 133.9 175.0Alaska 58.5 51.2 56.0 69.6 97.6Arizona 109.3 105.4 133.5 116.0 219.8Arkansas 74.8 70.5 94.9 134.6 189.6California 65.7 59.2 56.4 85.2 115.4Colorado 119.4 115.6 114.6 179.4 227.1Connecticut 58.4 54.5 78.8 119.9 175.0Delaware 88.8 78.5 143.4 91.4 243.1District of Columbia 53.3 63.0 32.7 123.4 140.3Florida 79.0 73.1 120.4 135.9 193.3Georgia 100.9 88.6 143.4 184.8 287.0Hawaii 44.6 25.5 42.0 3.8 26.3Idaho 98.3 95.8 182.2 106.1 183.9Illinois 68.1 63.3 83.0 130.8 148.5Indiana 73.8 70.5 104.8 130.7 142.3Iowa 64.2 62.0 101.8 152.1 220.6Kansas 65.0 62.1 77.3 79.2 164.0Kentucky 73.5 70.5 94.1 208.2 210.3Louisiana 63.4 55.3 92.3 151.9 148.0Maine 58.7 57.4 104.1 96.7 115.0Maryland 67.8 56.4 100.7 114.3 138.7Massachusetts 65.7 61.3 88.8 101.5 198.6Michigan 69.2 64.5 86.1 79.3 186.6Minnesota 79.1 74.6 187.5 108.6 254.0Mississippi 77.5 67.6 110.4 188.9 226.8Missouri 69.0 65.3 87.8 93.6 167.8Montana 67.8 65.5 134.7 85.7 127.0Nebraska 66.4 63.8 92.4 109.3 253.0Nevada 155.5 144.3 216.9 117.6 345.1New Hampshire 84.8 82.8 104.4 131.3 207.0New Jersey 66.2 59.3 76.4 107.9 189.9New Mexico 80.1 76.0 98.8 107.4 185.6New York 52.7 47.3 60.4 100.8 129.7North Carolina 87.7 83.2 97.3 105.2 299.0North Dakota 61.5 59.1 92.1 114.4 189.3Ohio 57.0 53.5 79.5 83.0 117.2Oklahoma 62.2 55.0 84.4 70.5 119.6Oregon 84.3 79.8 112.6 72.4 178.6Pennsylvania 57.2 54.0 75.3 99.7 155.5Rhode Island 53.1 50.0 93.3 71.7 122.5South Carolina 77.9 72.9 91.4 157.4 200.3South Dakota 73.5 71.0 138.0 102.3 221.9Tennessee 88.0 82.5 116.3 203.3 228.8Texas 95.6 89.8 117.0 195.8 230.6Utah 107.8 104.7 193.4 134.3 172.2Vermont 70.8 69.0 154.6 175.9 164.8Virginia 74.3 66.6 98.3 121.9 174.4Washington 90.4 83.4 119.5 72.3 184.0West Virginia 53.9 52.6 66.3 286.7 67.3Wisconsin 74.3 71.1 111.3 129.6 214.7Wyoming 68.9 66.6 103.7 106.4 156.8

Selig Center for eConomiC growth 27
Table 16
Percentage Change in Buying Power by Race, 2000-2010
AmericanArea Total White Black Indian Asian
Source: Selig Center for Economic Growth, Terry College of Business, The University of Georgia, June 2017.
United States 51.7 47.1 57.3 104.7 119.0 Alabama 54.5 51.1 61.3 130.2 154.1Alaska 80.8 77.0 77.5 69.4 150.8Arizona 67.3 61.7 126.9 90.2 183.7Arkansas 57.2 54.9 59.3 94.3 197.9California 54.8 45.8 54.8 125.1 113.2Colorado 43.8 41.6 48.3 87.6 90.0Connecticut 62.0 57.4 80.8 127.9 165.5Delaware 42.0 34.6 66.6 135.3 121.5District of Columbia 59.8 76.5 22.4 101.8 134.8Florida 60.3 55.7 80.0 109.4 154.9Georgia 49.7 41.7 66.2 131.6 152.0Hawaii 66.4 64.3 62.4 111.7 58.8Idaho 60.6 58.8 166.1 83.7 106.6Illinois 35.9 33.5 29.0 161.4 91.4Indiana 37.8 36.0 41.0 67.8 131.1Iowa 47.9 46.3 84.5 96.1 97.4Kansas 52.3 49.9 57.2 81.6 122.8Kentucky 48.4 46.6 59.3 91.6 116.2Louisiana 64.5 62.4 65.7 117.4 128.1Maine 49.2 48.0 138.7 60.9 128.9Maryland 60.4 51.0 73.9 143.0 139.8Massachusetts 54.3 49.6 80.2 135.4 139.5Michigan 21.1 20.3 13.4 38.2 72.1Minnesota 47.0 43.6 91.5 58.0 132.1Mississippi 51.5 48.3 58.1 93.4 111.0Missouri 46.6 44.9 45.9 67.4 129.9Montana 72.3 71.4 94.3 67.9 117.9Nebraska 55.5 53.7 68.3 101.8 123.8Nevada 62.5 52.8 102.9 84.1 175.9New Hampshire 50.2 47.9 119.0 50.1 161.2New Jersey 43.6 36.7 47.1 145.2 124.9New Mexico 69.2 65.5 113.3 91.6 121.8New York 41.5 37.4 39.8 155.7 94.8North Carolina 60.1 56.2 65.1 86.3 175.2North Dakota 78.2 76.1 189.4 93.0 158.6Ohio 35.7 34.1 36.7 58.2 103.8Oklahoma 70.1 66.2 66.4 99.1 134.5Oregon 46.7 43.6 62.7 80.2 99.8Pennsylvania 49.0 46.0 55.9 148.3 144.2Rhode Island 48.8 45.3 90.0 137.9 105.8South Carolina 54.8 54.1 51.4 102.7 111.4South Dakota 70.6 68.3 181.7 85.2 190.7Tennessee 51.7 49.4 55.7 111.4 137.8Texas 69.3 63.0 87.3 158.4 170.0Utah 69.4 67.1 101.7 88.0 130.0Vermont 52.4 51.0 169.8 30.0 165.5Virginia 64.0 57.5 66.6 143.3 169.3Washington 55.8 49.6 67.3 74.9 132.5West Virginia 51.2 50.4 60.1 36.6 71.6Wisconsin 44.0 42.3 49.3 67.7 126.3Wyoming 88.7 87.5 111.0 117.6 133.9

The MulTiculTural econoMy 28
Table 17
Percentage Change in Buying Power by Race, 2010-2017
AmericanArea Total White Black Indian Asian Multiracial
Source: Selig Center for Economic Growth, Terry College of Business, The University of Georgia, June 2017.
United States 29.9 27.2 32.5 36.9 62.8 50.0 Alabama 20.0 18.1 24.9 31.3 48.9 43.2Alaska 19.0 16.8 43.3 17.5 43.4 21.9Arizona 32.4 29.7 51.9 42.7 66.0 59.2Arkansas 28.5 27.0 31.0 41.1 75.8 53.7California 36.7 31.9 35.3 37.1 62.0 53.8Colorado 47.5 46.0 55.2 49.4 77.4 70.4Connecticut 11.7 9.4 21.1 29.9 42.4 24.5Delaware 28.0 24.6 35.0 25.5 63.8 35.9District of Columbia 40.0 43.9 23.1 30.9 83.0 65.2Florida 30.2 28.1 37.4 41.1 60.6 54.3Georgia 29.6 25.2 36.8 24.7 72.7 50.1Hawaii 28.9 34.1 146.6 64.2 20.6 30.1Idaho 34.9 33.8 82.2 45.0 61.7 58.2Illinois 24.8 22.9 21.8 27.6 57.6 42.0Indiana 29.3 27.9 30.4 33.4 88.7 45.3Iowa 28.1 26.7 49.9 46.9 80.7 52.7Kansas 28.3 26.8 33.5 33.9 66.9 41.9Kentucky 23.6 22.3 31.9 34.7 60.6 39.5Louisiana 21.9 20.2 24.5 34.0 55.5 40.1Maine 19.5 19.0 27.1 22.9 59.1 27.9Maryland 21.0 17.0 24.7 23.8 51.5 36.9Massachusetts 26.9 23.5 41.8 32.3 69.0 55.1Michigan 27.5 26.4 22.0 34.4 71.2 40.1Minnesota 29.0 26.8 44.6 34.6 74.1 46.3Mississippi 20.3 18.6 23.6 25.3 52.1 37.1Missouri 21.5 20.5 21.2 36.1 57.3 38.9Montana 25.3 24.5 80.5 26.0 76.9 44.5Nebraska 27.7 26.4 32.5 36.5 78.0 50.0Nevada 31.5 27.1 48.1 38.3 58.9 55.1New Hampshire 26.9 25.6 56.2 37.9 65.2 44.3New Jersey 23.1 18.9 26.7 24.0 53.2 44.1New Mexico 18.9 17.0 38.2 31.1 40.9 38.0New York 28.7 25.5 30.8 34.7 58.3 51.2North Carolina 28.2 25.7 31.7 26.9 80.8 45.8North Dakota 44.6 42.2 232.6 41.1 94.7 92.6Ohio 25.9 24.5 27.2 38.3 70.7 42.2Oklahoma 36.6 34.6 40.0 42.4 83.6 45.3Oregon 37.1 34.8 48.2 40.9 73.7 56.3Pennsylvania 24.2 22.4 27.3 36.1 65.0 46.3Rhode Island 21.7 19.5 41.2 41.7 61.1 36.8South Carolina 34.5 34.1 33.2 29.4 65.7 53.2South Dakota 23.0 21.6 77.4 23.4 102.3 43.8Tennessee 29.3 27.7 32.8 40.0 70.5 49.4Texas 41.7 37.7 51.3 47.6 89.4 76.7Utah 45.3 43.8 50.4 58.1 85.1 67.6Vermont 23.4 22.3 60.4 24.0 89.0 37.4Virginia 25.7 22.3 27.1 28.2 60.9 49.6Washington 39.7 35.2 54.8 47.2 79.4 57.2West Virginia 15.7 15.0 23.3 26.0 44.2 31.3Wisconsin 26.0 24.9 25.1 36.5 71.7 42.0Wyoming 27.3 25.9 129.5 39.1 64.4 45.7
Selig Center for eConomiC growth 29
Table 18
Percentage Change in Buying Power by Race, 2017-2022
AmericanArea Total White Black Indian Asian Multiracial
Source: Selig Center for Economic Growth, Terry College of Business, The University of Georgia, June 2017.
United States 19.6 17.7 21.1 23.5 36.4 35.3 Alabama 14.2 13.0 16.2 16.5 33.7 34.7Alaska 9.8 7.8 24.4 9.6 26.4 14.0Arizona 22.7 21.0 34.9 24.4 39.5 39.7Arkansas 17.4 16.3 18.0 28.3 43.5 38.2California 24.0 21.8 21.3 22.9 33.6 34.3Colorado 29.9 28.8 36.5 32.7 45.7 44.8Connecticut 8.3 6.5 15.2 23.0 26.8 22.7Delaware 16.8 14.5 19.5 16.2 38.9 32.2District of Columbia 24.5 27.0 13.4 24.0 40.1 35.8Florida 19.6 18.3 22.9 25.9 34.5 37.6Georgia 18.2 15.3 21.5 18.9 40.7 38.2Hawaii 20.7 24.0 84.7 41.8 14.2 18.3Idaho 23.3 22.4 48.7 30.3 43.0 41.0Illinois 17.2 15.7 15.9 19.0 35.7 32.4Indiana 18.4 16.8 22.0 26.1 53.1 37.8Iowa 16.0 14.6 35.1 29.7 51.4 38.2Kansas 15.4 14.3 19.2 19.1 36.1 27.7Kentucky 15.4 14.3 20.7 21.5 42.1 34.5Louisiana 15.5 14.4 16.5 21.0 33.3 37.7Maine 13.4 12.8 32.7 19.1 34.5 29.3Maryland 13.3 10.4 15.2 19.2 29.9 28.0Massachusetts 19.0 16.3 30.4 25.8 41.3 43.2Michigan 17.5 16.3 16.4 22.0 42.1 31.7Minnesota 18.4 16.6 34.0 24.2 40.4 33.9Mississippi 12.8 11.6 14.3 18.7 32.6 35.3Missouri 14.9 13.9 16.1 23.4 36.1 32.4Montana 14.7 13.9 60.8 17.5 45.2 30.4Nebraska 12.4 11.2 18.1 21.5 41.7 31.1Nevada 22.5 19.3 32.7 27.0 37.6 39.4New Hampshire 18.0 16.9 40.1 28.5 39.6 34.1New Jersey 15.6 12.8 17.5 21.9 31.1 33.5New Mexico 11.1 10.0 19.4 15.5 25.4 23.5New York 18.7 16.3 20.3 21.1 35.5 35.4North Carolina 20.0 18.3 21.3 20.7 48.0 37.3North Dakota 24.5 21.4 138.8 23.0 64.7 56.6Ohio 15.6 14.2 18.8 22.8 41.3 32.9Oklahoma 23.1 21.5 26.3 25.1 49.8 32.6Oregon 25.6 24.0 34.2 29.1 45.0 38.7Pennsylvania 16.0 14.3 20.3 30.4 38.9 37.1Rhode Island 15.8 14.1 28.0 27.8 37.1 30.4South Carolina 22.9 22.7 20.5 24.3 45.5 45.1South Dakota 10.7 9.3 54.2 10.8 55.8 25.9Tennessee 19.1 17.9 21.1 28.4 41.6 39.6Texas 25.4 23.0 28.4 28.0 47.4 46.2Utah 29.0 27.9 40.9 34.7 48.4 47.4Vermont 14.4 13.5 43.0 17.4 45.0 30.4Virginia 16.4 14.2 16.3 21.2 33.9 34.5Washington 27.3 24.3 39.1 31.9 45.7 39.0West Virginia 8.6 7.9 14.4 22.1 32.4 27.8Wisconsin 16.5 15.6 19.4 24.1 38.3 34.9Wyoming 13.7 12.2 74.7 19.1 42.0 33.3

The MulTiculTural econoMy 30
Table 19
White Share of Buying Power, for U.S. and the States,1990, 2000, 2010, 2017, and 2022
(percent)
Area 1990 2000 2010 2017 2022
Source: Selig Center for Economic Growth, Terry College of Business, The University of Georgia, June 2017.
United States 89.4 86.7 84.1 82.3 81.0 Alabama 84.8 81.5 79.7 78.5 77.7Alaska 86.1 82.2 80.4 78.9 77.5Arizona 94.4 92.7 89.6 87.8 86.5Arkansas 90.3 88.1 86.8 85.8 85.0California 86.6 83.2 78.3 75.6 74.2Colorado 95.2 93.5 92.1 91.2 90.4Connecticut 93.6 91.3 88.7 86.9 85.4Delaware 87.8 83.0 78.7 76.6 75.1District of Columbia 56.6 60.2 66.5 68.3 69.7Florida 91.7 88.6 86.1 84.7 83.8Georgia 82.7 77.6 73.5 71.0 69.2Hawaii 40.0 34.7 34.3 35.6 36.6Idaho 98.1 96.9 95.8 95.1 94.4Illinois 88.8 86.3 84.7 83.5 82.4Indiana 93.8 92.0 90.8 89.7 88.6Iowa 98.1 96.9 95.8 94.7 93.5Kansas 94.7 93.0 91.6 90.5 89.6Kentucky 94.5 92.9 91.7 90.7 89.8Louisiana 82.2 78.1 77.1 76.1 75.3Maine 99.0 98.1 97.3 96.9 96.4Maryland 79.6 74.2 69.8 67.5 65.8Massachusetts 94.7 92.1 89.3 86.9 84.9Michigan 89.3 86.7 86.2 85.5 84.6Minnesota 97.1 94.6 92.4 90.8 89.4Mississippi 79.9 75.4 73.9 72.8 72.1Missouri 91.8 89.8 88.8 88.0 87.3Montana 96.5 95.2 94.8 94.2 93.5Nebraska 96.8 95.3 94.1 93.2 92.2Nevada 92.2 88.2 82.9 80.1 78.0New Hampshire 98.6 97.5 96.1 95.1 94.3New Jersey 88.0 84.3 80.3 77.6 75.7New Mexico 93.6 91.5 89.5 88.1 87.2New York 85.8 82.8 80.4 78.4 76.8North Carolina 84.9 82.9 80.8 79.2 78.1North Dakota 97.5 96.0 94.9 93.3 91.1Ohio 91.9 89.9 88.8 87.8 86.7Oklahoma 89.4 85.5 83.5 82.3 81.3Oregon 96.1 93.7 91.7 90.2 89.0Pennsylvania 92.8 90.9 89.0 87.7 86.5Rhode Island 96.0 94.1 91.9 90.3 89.0South Carolina 81.9 79.6 79.3 79.0 78.9South Dakota 96.6 95.3 94.0 92.9 91.7Tennessee 89.4 86.8 85.4 84.4 83.6Texas 90.8 88.0 84.8 82.3 80.8Utah 97.3 95.9 94.6 93.6 92.8Vermont 99.2 98.2 97.3 96.4 95.7Virginia 86.1 82.3 79.0 76.8 75.4Washington 93.3 89.9 86.3 83.5 81.5West Virginia 96.8 96.0 95.5 94.9 94.3Wisconsin 96.2 94.5 93.4 92.5 91.8Wyoming 98.1 96.8 96.2 95.1 93.9

Selig Center for eConomiC growth 31
Table 20
Black Share of Buying Power, for U.S. and the States,1990, 2000, 2010, 2017, and 2022
(percent)
Area 1990 2000 2010 2017 2022
Source: Selig Center for Economic Growth, Terry College of Business, The University of Georgia, June 2017.
United States 7.5 8.2 8.5 8.7 8.8 Alabama 14.4 16.7 17.4 18.1 18.5Alaska 3.0 2.9 2.9 3.5 3.9Arizona 2.2 2.4 3.3 3.8 4.1Arkansas 8.8 9.8 9.9 10.1 10.2California 5.0 4.8 4.8 4.7 4.6Colorado 2.9 2.8 2.9 3.1 3.2Connecticut 4.9 5.5 6.2 6.7 7.1Delaware 10.5 13.5 15.8 16.7 17.1District of Columbia 41.6 36.0 27.6 24.2 22.1Florida 7.1 8.7 9.8 10.3 10.6Georgia 16.0 19.4 21.6 22.8 23.4Hawaii 1.7 1.7 1.6 3.1 4.8Idaho 0.2 0.4 0.6 0.8 1.0Illinois 8.6 9.4 8.9 8.7 8.6Indiana 5.2 6.2 6.3 6.4 6.6Iowa 1.1 1.3 1.7 2.0 2.3Kansas 3.7 4.0 4.1 4.3 4.4Kentucky 4.8 5.4 5.8 6.2 6.5Louisiana 16.7 19.6 19.7 20.2 20.3Maine 0.3 0.4 0.7 0.7 0.8Maryland 17.5 20.9 22.6 23.3 23.7Massachusetts 3.4 3.8 4.5 5.0 5.5Michigan 9.1 10.0 9.4 9.0 8.9Minnesota 1.3 2.1 2.8 3.1 3.5Mississippi 19.5 23.0 24.1 24.7 25.0Missouri 7.1 7.9 7.9 7.9 7.9Montana 0.2 0.3 0.3 0.4 0.6Nebraska 2.3 2.7 2.9 3.0 3.1Nevada 4.1 5.1 6.3 7.1 7.7New Hampshire 0.5 0.6 0.8 1.0 1.2New Jersey 8.4 8.9 9.2 9.4 9.6New Mexico 1.5 1.7 2.1 2.4 2.6New York 10.6 11.1 11.0 11.2 11.3North Carolina 13.6 14.3 14.8 15.2 15.3North Dakota 0.4 0.4 0.7 1.7 3.2Ohio 6.9 7.9 8.0 8.1 8.3Oklahoma 4.7 5.3 5.2 5.3 5.5Oregon 1.0 1.2 1.3 1.4 1.5Pennsylvania 6.0 6.7 7.0 7.2 7.5Rhode Island 2.6 3.2 4.1 4.8 5.3South Carolina 17.2 18.5 18.1 18.0 17.6South Dakota 0.3 0.5 0.8 1.1 1.5Tennessee 9.8 11.3 11.6 11.9 12.1Texas 7.2 8.0 8.8 9.4 9.6Utah 0.5 0.8 0.9 0.9 1.0Vermont 0.2 0.3 0.6 0.8 0.9Virginia 11.4 13.0 13.1 13.3 13.3Washington 2.2 2.5 2.7 3.0 3.3West Virginia 2.2 2.4 2.5 2.7 2.8Wisconsin 2.7 3.3 3.4 3.3 3.4Wyoming 0.6 0.7 0.7 1.3 2.1

The MulTiculTural econoMy 32
Table 21
American Indian Share of Buying Power, for U.S. and the States,1990, 2000, 2010, 2017, and 2022
(percent)
Area 1990 2000 2010 2017 2022
Source: Selig Center for Economic Growth, Terry College of Business, The University of Georgia, June 2017.
United States 0.5 0.5 0.7 0.8 0.8 Alabama 0.3 0.4 0.6 0.7 0.7Alaska 8.2 8.8 8.2 8.1 8.1Arizona 2.1 2.1 2.4 2.6 2.6Arkansas 0.4 0.6 0.7 0.8 0.9California 0.6 0.7 1.0 1.0 1.0Colorado 0.6 0.7 0.9 0.9 1.0Connecticut 0.1 0.2 0.3 0.3 0.4Delaware 0.3 0.3 0.5 0.4 0.4District of Columbia 0.2 0.3 0.3 0.3 0.3Florida 0.2 0.3 0.4 0.4 0.4Georgia 0.2 0.2 0.4 0.4 0.4Hawaii 0.4 0.3 0.3 0.4 0.5Idaho 0.9 0.9 1.0 1.1 1.1Illinois 0.1 0.2 0.4 0.4 0.4Indiana 0.2 0.2 0.3 0.3 0.3Iowa 0.1 0.2 0.3 0.3 0.4Kansas 0.6 0.6 0.8 0.8 0.8Kentucky 0.1 0.2 0.2 0.2 0.3Louisiana 0.3 0.4 0.6 0.7 0.7Maine 0.3 0.4 0.4 0.4 0.4Maryland 0.2 0.3 0.4 0.4 0.5Massachusetts 0.1 0.2 0.3 0.3 0.3Michigan 0.4 0.4 0.5 0.5 0.5Minnesota 0.5 0.6 0.7 0.7 0.7Mississippi 0.2 0.3 0.4 0.4 0.4Missouri 0.3 0.3 0.4 0.4 0.5Montana 2.9 3.2 3.1 3.1 3.2Nebraska 0.3 0.4 0.6 0.6 0.6Nevada 1.1 0.9 1.1 1.1 1.2New Hampshire 0.1 0.2 0.2 0.2 0.2New Jersey 0.2 0.2 0.3 0.3 0.3New Mexico 3.9 4.5 5.1 5.7 5.9New York 0.2 0.3 0.5 0.5 0.6North Carolina 0.8 0.8 1.0 1.0 1.0North Dakota 1.7 2.3 2.5 2.4 2.4Ohio 0.1 0.2 0.2 0.2 0.2Oklahoma 5.0 5.2 6.1 6.4 6.5Oregon 0.9 0.9 1.1 1.1 1.1Pennsylvania 0.1 0.1 0.2 0.2 0.2Rhode Island 0.2 0.3 0.4 0.5 0.6South Carolina 0.2 0.3 0.4 0.4 0.4South Dakota 2.7 3.2 3.5 3.5 3.5Tennessee 0.2 0.3 0.4 0.4 0.4Texas 0.3 0.5 0.8 0.8 0.8Utah 0.7 0.8 0.9 0.9 1.0Vermont 0.2 0.3 0.2 0.2 0.2Virginia 0.2 0.3 0.4 0.4 0.4Washington 1.0 0.9 1.1 1.1 1.2West Virginia 0.1 0.2 0.2 0.2 0.2Wisconsin 0.4 0.6 0.7 0.7 0.8Wyoming 0.9 1.1 1.3 1.4 1.5

Selig Center for eConomiC growth 33
Table 22
Asian Share of Buying Power, for U.S. and the States,1990, 2000, 2010, 2017, and 2022
(percent)
Area 1990 2000 2010 2017 2022
Source: Selig Center for Economic Growth, Terry College of Business, The University of Georgia, June 2017.
United States 2.7 3.7 5.4 6.8 7.7 Alabama 0.5 0.8 1.4 1.7 2.0Alaska 2.7 3.3 4.6 5.6 6.4Arizona 1.4 2.1 3.5 4.4 5.0Arkansas 0.5 0.8 1.5 2.1 2.6California 7.7 10.1 13.9 16.4 17.7Colorado 1.4 2.0 2.7 3.2 3.6Connecticut 1.4 2.5 4.0 5.1 6.0Delaware 1.4 2.6 4.1 5.2 6.2District of Columbia 1.7 2.6 3.8 5.0 5.6Florida 1.0 1.7 2.7 3.3 3.8Georgia 1.1 2.1 3.6 4.8 5.7Hawaii 58.0 50.6 48.4 45.2 42.8Idaho 0.8 1.1 1.5 1.8 2.0Illinois 2.5 3.6 5.1 6.4 7.5Indiana 0.8 1.1 1.9 2.8 3.6Iowa 0.6 1.2 1.6 2.3 3.0Kansas 1.0 1.6 2.4 3.1 3.7Kentucky 0.6 1.0 1.5 2.0 2.4Louisiana 0.8 1.3 1.7 2.2 2.6Maine 0.4 0.6 0.9 1.2 1.4Maryland 2.7 3.9 5.8 7.3 8.3Massachusetts 1.8 3.2 5.0 6.7 7.9Michigan 1.2 2.1 2.9 3.9 4.7Minnesota 1.0 2.0 3.2 4.3 5.1Mississippi 0.4 0.8 1.1 1.4 1.6Missouri 0.8 1.3 2.0 2.6 3.0Montana 0.4 0.5 0.6 0.9 1.1Nebraska 0.5 1.2 1.7 2.3 2.9Nevada 2.6 4.5 7.6 9.2 10.4New Hampshire 0.7 1.2 2.1 2.8 3.3New Jersey 3.4 5.9 9.3 11.6 13.1New Mexico 0.9 1.4 1.9 2.2 2.5New York 3.3 5.0 6.9 8.5 9.7North Carolina 0.7 1.5 2.5 3.6 4.4North Dakota 0.4 0.8 1.1 1.5 2.0Ohio 1.0 1.4 2.2 3.0 3.6Oklahoma 1.0 1.3 1.8 2.4 2.9Oregon 2.0 3.0 4.1 5.2 6.0Pennsylvania 1.1 1.8 3.0 3.9 4.7Rhode Island 1.2 1.7 2.4 3.1 3.7South Carolina 0.6 1.1 1.4 1.8 2.1South Dakota 0.3 0.5 0.9 1.4 2.0Tennessee 0.6 1.1 1.8 2.3 2.8Texas 1.7 2.9 4.7 6.2 7.3Utah 1.5 1.9 2.6 3.4 3.9Vermont 0.4 0.6 1.1 1.7 2.1Virginia 2.3 3.7 6.0 7.7 8.9
Washington 3.5 5.2 7.7 9.9 11.3West Virginia 0.9 0.9 1.1 1.3 1.6Wisconsin 0.7 1.2 1.9 2.6 3.1Wyoming 0.4 0.6 0.8 1.0 1.2

The MulTiculTural econoMy 34
Table 23
Multiracial Share of Buying Power, for U.S. and the States,2000, 2010, 2017, and 2022
(percent)
Area 2000 2010 2017 2022
Source: Selig Center for Economic Growth, Terry College of Business, The University of Georgia, June 2017.
United States 0.8 1.3 1.5 1.6 Alabama 0.5 0.8 1.0 1.2Alaska 2.8 3.8 3.9 4.1Arizona 0.7 1.2 1.5 1.7Arkansas 0.7 1.0 1.2 1.5California 1.3 2.0 2.3 2.4Colorado 0.9 1.4 1.6 1.8Connecticut 0.6 0.9 1.0 1.1Delaware 0.6 0.9 1.0 1.1District of Columbia 1.0 1.8 2.2 2.3Florida 0.6 1.0 1.2 1.4Georgia 0.6 1.0 1.1 1.3Hawaii 12.7 15.4 15.6 15.3Idaho 0.7 1.1 1.3 1.5Illinois 0.5 0.9 1.0 1.1Indiana 0.5 0.7 0.8 1.0Iowa 0.4 0.6 0.7 0.8Kansas 0.8 1.2 1.3 1.5Kentucky 0.5 0.8 0.9 1.0Louisiana 0.6 0.8 0.9 1.1Maine 0.5 0.7 0.8 0.9Maryland 0.8 1.3 1.5 1.7Massachusetts 0.6 0.9 1.1 1.4Michigan 0.7 1.0 1.1 1.2Minnesota 0.6 0.9 1.0 1.2Mississippi 0.4 0.6 0.7 0.8Missouri 0.7 1.0 1.1 1.3Montana 0.8 1.2 1.4 1.5Nebraska 0.5 0.8 0.9 1.0Nevada 1.3 2.1 2.4 2.8New Hampshire 0.5 0.8 0.9 1.0New Jersey 0.6 0.9 1.1 1.3New Mexico 0.9 1.4 1.6 1.8New York 0.8 1.2 1.4 1.6North Carolina 0.5 0.9 1.0 1.2North Dakota 0.5 0.8 1.1 1.3Ohio 0.6 0.9 1.0 1.1Oklahoma 2.7 3.4 3.6 3.9Oregon 1.2 1.8 2.1 2.3Pennsylvania 0.4 0.8 0.9 1.0Rhode Island 0.7 1.1 1.3 1.4South Carolina 0.5 0.8 0.9 1.0South Dakota 0.6 0.9 1.1 1.2Tennessee 0.6 0.9 1.0 1.2Texas 0.6 1.0 1.2 1.4Utah 0.7 1.0 1.2 1.4Vermont 0.6 0.8 0.9 1.1Virginia 0.8 1.4 1.7 2.0Washington 1.5 2.2 2.5 2.7West Virginia 0.5 0.8 0.9 1.0Wisconsin 0.5 0.7 0.8 0.9Wyoming 0.8 1.0 1.1 1.3

Selig Center for eConomiC growth 35
Table 24
Hispanic Share of Buying Power, for U.S. and the States,1990, 2000, 2010, 2017, and 2022
(percent)
Area 1990 2000 2010 2017 2022
Source: Selig Center for Economic Growth, Terry College of Business, The University of Georgia, June 2017.
United States 4.9 6.7 9.0 10.2 11.1 Alabama 0.5 1.2 2.4 2.5 2.7Alaska 2.1 2.7 3.9 5.6 7.0Arizona 9.8 12.4 15.8 17.2 17.8Arkansas 0.5 1.8 3.5 4.1 4.5California 12.3 14.8 18.4 19.7 20.3Colorado 7.0 8.9 10.6 11.0 11.4Connecticut 3.1 4.2 6.3 7.8 8.9Delaware 1.5 2.6 4.5 5.2 5.7District of Columbia 3.5 4.7 6.0 7.6 8.5Florida 8.7 11.7 15.8 17.8 19.4Georgia 1.3 3.1 5.0 5.3 5.6Hawaii 4.5 4.3 5.6 7.0 8.0Idaho 2.8 4.0 6.0 6.9 7.5Illinois 4.2 6.5 8.3 9.1 9.7Indiana 1.2 2.2 3.6 4.0 4.4Iowa 0.7 1.5 2.6 3.0 3.5Kansas 2.2 3.8 5.4 6.0 6.6Kentucky 0.5 1.0 1.9 2.2 2.4Louisiana 2.1 2.1 3.4 3.9 4.6Maine 0.4 0.6 0.9 1.1 1.4Maryland 1.9 2.7 4.8 5.8 6.7Massachusetts 2.2 3.1 4.4 5.5 6.4Michigan 1.4 2.0 2.6 2.9 3.3Minnesota 0.7 1.5 2.3 2.6 2.8Mississippi 0.5 1.1 1.9 2.1 2.3Missouri 0.9 1.4 2.2 2.6 3.0Montana 0.8 1.2 1.8 2.4 3.0Nebraska 1.3 3.0 4.6 5.3 5.9Nevada 6.2 10.7 14.7 16.1 17.0New Hampshire 0.7 1.0 1.6 2.1 2.6New Jersey 5.4 7.1 9.5 11.0 12.1New Mexico 24.4 27.0 31.3 33.7 35.0New York 6.5 8.0 9.5 10.6 11.3North Carolina 0.8 2.5 4.3 4.7 5.1North Dakota 0.4 0.8 1.2 2.4 4.1Ohio 0.9 1.2 1.9 2.3 2.7Oklahoma 1.6 2.9 4.7 5.6 6.4Oregon 2.0 3.8 5.9 6.7 7.2Pennsylvania 1.0 1.7 2.9 3.7 4.4Rhode Island 2.3 3.7 5.6 7.0 8.1South Carolina 0.8 1.5 3.1 3.3 3.5South Dakota 0.4 0.8 1.6 2.3 3.1Tennessee 0.5 1.4 2.6 3.0 3.3Texas 12.4 16.5 21.0 22.8 23.5Utah 3.3 5.4 7.2 7.6 8.1Vermont 0.5 0.7 1.1 1.4 1.7Virginia 2.0 3.1 5.1 6.0 6.8Washington 2.4 3.6 5.5 6.2 6.8West Virginia 0.4 0.6 0.9 1.2 1.5Wisconsin 1.0 1.9 3.0 3.4 3.8Wyoming 3.6 4.1 5.8 6.7 7.4
The MulTiculTural econoMy 36
Table 25
Non-Hispanic Share of Buying Power, for U.S. and the States,1990, 2000, 2010, 2017, and 2022
(percent)
Area 1990 2000 2010 2017 2022
Source: Selig Center for Economic Growth, Terry College of Business, The University of Georgia, June 2017.
United States 95.1 93.3 91.0 89.8 88.9 Alabama 99.5 98.8 97.6 97.5 97.3Alaska 97.9 97.3 96.1 94.4 93.0Arizona 90.2 87.6 84.2 82.8 82.2Arkansas 99.5 98.2 96.5 95.9 95.5California 87.7 85.2 81.6 80.3 79.7Colorado 93.0 91.1 89.4 89.0 88.6Connecticut 96.9 95.8 93.7 92.2 91.1Delaware 98.5 97.4 95.5 94.8 94.3District of Columbia 96.5 95.3 94.0 92.4 91.5Florida 91.3 88.3 84.2 82.2 80.6Georgia 98.7 96.9 95.0 94.7 94.4Hawaii 95.5 95.7 94.4 93.0 92.0Idaho 97.2 96.0 94.0 93.1 92.5Illinois 95.8 93.5 91.7 90.9 90.3Indiana 98.8 97.8 96.4 96.0 95.6Iowa 99.3 98.5 97.4 97.0 96.5Kansas 97.8 96.2 94.6 94.0 93.4Kentucky 99.5 99.0 98.1 97.8 97.6Louisiana 97.9 97.9 96.6 96.1 95.4Maine 99.6 99.4 99.1 98.9 98.6Maryland 98.1 97.3 95.2 94.2 93.3Massachusetts 97.8 96.9 95.6 94.5 93.6Michigan 98.6 98.0 97.4 97.1 96.7Minnesota 99.3 98.5 97.7 97.4 97.2Mississippi 99.5 98.9 98.1 97.9 97.7Missouri 99.1 98.6 97.8 97.4 97.0Montana 99.2 98.8 98.2 97.6 97.0Nebraska 98.7 97.0 95.4 94.7 94.1Nevada 93.8 89.3 85.3 83.9 83.0New Hampshire 99.3 99.0 98.4 97.9 97.4New Jersey 94.6 92.9 90.5 89.0 87.9New Mexico 75.6 73.0 68.7 66.3 65.0New York 93.5 92.0 90.5 89.4 88.7North Carolina 99.2 97.5 95.7 95.3 94.9North Dakota 99.6 99.2 98.8 97.6 95.9Ohio 99.1 98.8 98.1 97.7 97.3Oklahoma 98.4 97.1 95.3 94.4 93.6Oregon 98.0 96.2 94.1 93.3 92.8Pennsylvania 99.0 98.3 97.1 96.3 95.6Rhode Island 97.7 96.3 94.4 93.0 91.9South Carolina 99.2 98.5 96.9 96.7 96.5South Dakota 99.6 99.2 98.4 97.7 96.9Tennessee 99.5 98.6 97.4 97.0 96.7Texas 87.6 83.5 79.0 77.2 76.5Utah 96.7 94.6 92.8 92.4 91.9Vermont 99.5 99.3 98.9 98.6 98.3Virginia 98.0 96.9 94.9 94.0 93.2Washington 97.6 96.4 94.5 93.8 93.2West Virginia 99.6 99.4 99.1 98.8 98.5Wisconsin 99.0 98.1 97.0 96.6 96.2Wyoming 96.4 95.9 94.2 93.3 92.6

Selig Center for eConomiC growth 37
Table 26
Percentage Change in Total, Hispanic, and Non-Hispanic Buying Power for U.S. and the States, 1990-2000
Area Total Hispanic Non-Hispanic
Source: Selig Center for Economic Growth, Terry College of Business, The University of Georgia, June 2017.
United States 72.2 132.1 69.1 Alabama 67.4 296.9 66.3Alaska 58.5 106.4 57.5Arizona 109.3 165.0 103.2Arkansas 74.8 493.7 72.5California 65.7 99.4 61.0Colorado 119.4 179.1 114.9Connecticut 58.4 116.4 56.5Delaware 88.8 231.2 86.7District of Columbia 53.3 105.0 51.4Florida 79.0 140.6 73.1Georgia 100.9 375.6 97.2Hawaii 44.6 37.8 44.9Idaho 98.3 180.0 95.9Illinois 68.1 157.9 64.1Indiana 73.8 215.3 72.1Iowa 64.2 249.1 62.8Kansas 65.0 179.9 62.4Kentucky 73.5 274.2 72.6Louisiana 63.4 69.5 63.3Maine 58.7 114.4 58.5Maryland 67.8 136.6 66.5Massachusetts 65.7 136.1 64.2Michigan 69.2 143.3 68.2Minnesota 79.1 305.8 77.6Mississippi 77.5 284.8 76.5Missouri 69.0 156.3 68.2Montana 67.8 161.3 67.1Nebraska 66.4 272.7 63.6Nevada 155.5 337.5 143.4New Hampshire 84.8 156.2 84.3New Jersey 66.2 116.1 63.4New Mexico 80.1 99.8 73.8New York 52.7 87.8 50.3North Carolina 87.7 477.3 84.5North Dakota 61.5 275.1 60.8Ohio 57.0 122.0 56.4Oklahoma 62.2 190.5 60.1Oregon 84.3 245.4 81.0Pennsylvania 57.2 156.1 56.1Rhode Island 53.1 150.4 50.9South Carolina 77.9 260.5 76.5South Dakota 73.5 246.1 72.7Tennessee 88.0 373.7 86.4Texas 95.6 159.9 86.5Utah 107.8 243.0 103.2Vermont 70.8 125.5 70.5Virginia 74.3 170.6 72.4Washington 90.4 191.1 87.9West Virginia 53.9 118.6 53.7Wisconsin 74.3 234.4 72.6Wyoming 68.9 93.5 68.0

The MulTiculTural econoMy 38
Table 27
Percentage Change in Total, Hispanic, and Non-Hispanic Buying Power for U.S. and the States, 2000-2010
Area Total Hispanic Non-Hispanic
Source: Selig Center for Economic Growth, Terry College of Business, The University of Georgia, June 2017.
United States 51.7 105.7 47.8 Alabama 54.5 213.1 52.6Alaska 80.8 161.8 78.6Arizona 67.3 112.9 60.8Arkansas 57.2 201.0 54.5California 54.8 92.5 48.3Colorado 43.8 71.5 41.1Connecticut 62.0 141.5 58.5Delaware 42.0 146.5 39.2District of Columbia 59.8 105.5 57.6Florida 60.3 116.2 52.9Georgia 49.7 138.0 46.8Hawaii 66.4 117.5 64.1Idaho 60.6 141.4 57.3Illinois 35.9 73.6 33.2Indiana 37.8 120.0 36.0Iowa 47.9 146.7 46.3Kansas 52.3 119.6 49.6Kentucky 48.4 189.5 47.0Louisiana 64.5 157.1 62.5Maine 49.2 135.7 48.7Maryland 60.4 186.5 56.9Massachusetts 54.3 122.1 52.2Michigan 21.1 56.5 20.3Minnesota 47.0 123.4 45.8Mississippi 51.5 166.8 50.2Missouri 46.6 133.7 45.3Montana 72.3 152.9 71.3Nebraska 55.5 140.6 52.9Nevada 62.5 123.8 55.2New Hampshire 50.2 141.1 49.2New Jersey 43.6 92.7 39.8New Mexico 69.2 95.8 59.4New York 41.5 69.4 39.1North Carolina 60.1 168.9 57.3North Dakota 78.2 155.9 77.5Ohio 35.7 110.7 34.8Oklahoma 70.1 179.3 66.9Oregon 46.7 124.9 43.6Pennsylvania 49.0 158.8 47.2Rhode Island 48.8 123.6 45.9South Carolina 54.8 211.5 52.3South Dakota 70.6 222.3 69.3Tennessee 51.7 192.0 49.8Texas 69.3 115.8 60.1Utah 69.4 128.8 66.0Vermont 52.4 136.3 51.8Virginia 64.0 173.0 60.6Washington 55.8 136.1 52.8West Virginia 51.2 141.0 50.6Wisconsin 44.0 124.0 42.4Wyoming 88.7 163.5 85.4
Selig Center for eConomiC growth 39
Table 28
Percentage Change in Total, Hispanic, and Non-Hispanic Buying Power for U.S. and the States, 2010-2017
Area Total Hispanic Non-Hispanic
Source: Selig Center for Economic Growth, Terry College of Business, The University of Georgia, June 2017.
United States 29.9 47.1 28.2 Alabama 20.0 25.8 19.9Alaska 19.0 68.5 17.0Arizona 32.4 44.6 30.1Arkansas 28.5 49.1 27.8California 36.7 46.6 34.5Colorado 47.5 53.4 46.8Connecticut 11.7 38.2 9.9Delaware 28.0 47.2 27.1District of Columbia 40.0 78.7 37.5Florida 30.2 46.8 27.1Georgia 29.6 37.7 29.2Hawaii 28.9 60.6 27.0Idaho 34.9 55.6 33.6Illinois 24.8 36.6 23.7Indiana 29.3 44.6 28.8Iowa 28.1 50.4 27.5Kansas 28.3 42.7 27.4Kentucky 23.6 40.6 23.3Louisiana 21.9 42.6 21.2Maine 19.5 51.8 19.2Maryland 21.0 44.6 19.8Massachusetts 26.9 57.4 25.5Michigan 27.5 43.2 27.0Minnesota 29.0 41.9 28.7Mississippi 20.3 31.7 20.1Missouri 21.5 42.7 21.1Montana 25.3 69.7 24.5Nebraska 27.7 45.7 26.8Nevada 31.5 44.0 29.4New Hampshire 26.9 64.2 26.3New Jersey 23.1 42.2 21.1New Mexico 18.9 28.3 14.7New York 28.7 42.7 27.2North Carolina 28.2 39.7 27.7North Dakota 44.6 189.7 42.8Ohio 25.9 51.6 25.4Oklahoma 36.6 62.1 35.3Oregon 37.1 56.1 35.9Pennsylvania 24.2 57.8 23.2Rhode Island 21.7 52.0 19.9South Carolina 34.5 44.5 34.2South Dakota 23.0 80.5 22.0Tennessee 29.3 46.6 28.8Texas 41.7 53.8 38.5Utah 45.3 52.6 44.7Vermont 23.4 62.4 23.0Virginia 25.7 48.0 24.5Washington 39.7 59.3 38.6West Virginia 15.7 49.4 15.4Wisconsin 26.0 43.0 25.5Wyoming 27.3 48.0 26.0

The MulTiculTural econoMy 40
Table 29
Percentage Change in Total, Hispanic, and Non-Hispanic Buying Power for U.S. and the States, 2017-2022
Area Total Hispanic Non-Hispanic
Source: Selig Center for Economic Growth, Terry College of Business, The University of Georgia, June 2017.
United States 19.6 29.0 18.5 Alabama 14.2 22.7 13.9Alaska 9.8 38.0 8.2Arizona 22.7 27.1 21.8Arkansas 17.4 31.5 16.8California 24.0 27.5 23.2Colorado 29.9 34.2 29.3Connecticut 8.3 24.3 7.0Delaware 16.8 28.6 16.2District of Columbia 24.5 38.3 23.4Florida 19.6 30.1 17.3Georgia 18.2 25.4 17.8Hawaii 20.7 37.8 19.4Idaho 23.3 33.9 22.6Illinois 17.2 24.9 16.4Indiana 18.4 30.9 17.9Iowa 16.0 32.6 15.5Kansas 15.4 26.3 14.7Kentucky 15.4 28.9 15.1Louisiana 15.5 34.7 14.7Maine 13.4 39.4 13.1Maryland 13.3 31.6 12.1Massachusetts 19.0 38.2 17.9Michigan 17.5 29.6 17.2Minnesota 18.4 29.9 18.1Mississippi 12.8 25.3 12.5Missouri 14.9 31.0 14.4Montana 14.7 41.9 14.0Nebraska 12.4 26.8 11.6Nevada 22.5 29.9 21.1New Hampshire 18.0 44.2 17.4New Jersey 15.6 27.7 14.1New Mexico 11.1 15.3 9.0New York 18.7 26.6 17.8North Carolina 20.0 30.0 19.5North Dakota 24.5 114.5 22.3Ohio 15.6 33.5 15.2Oklahoma 23.1 41.0 22.0Oregon 25.6 35.4 24.9Pennsylvania 16.0 38.5 15.1Rhode Island 15.8 33.9 14.4South Carolina 22.9 31.8 22.6South Dakota 10.7 46.0 9.9Tennessee 19.1 34.1 18.6Texas 25.4 28.9 24.3Utah 29.0 36.4 28.4Vermont 14.4 41.8 14.0Virginia 16.4 31.7 15.4Washington 27.3 39.3 26.5West Virginia 8.6 35.3 8.3Wisconsin 16.5 30.1 16.1Wyoming 13.7 25.9 12.8

Selig Center for eConomiC growth 41
Table 30
Total Population Statistics for the U.S. and States,1990, 2000, 2010, 2017, and 2022
Area 1990 2000 2010 2017 2022
Source: Selig Center for Economic Growth, Terry College of Business, The University of Georgia, June 2017.
United States 249,622,814 282,162,411 309,346,863 326,605,194 340,582,274 Alabama 4,050,055 4,452,173 4,785,161 4,890,104 4,972,397Alaska 553,290 627,963 714,021 748,921 777,185Arizona 3,684,097 5,160,586 6,408,208 7,006,828 7,483,776Arkansas 2,356,586 2,678,588 2,922,394 3,001,989 3,065,676California 29,959,515 33,987,977 37,334,079 39,908,284 41,923,452Colorado 3,307,618 4,326,921 5,048,254 5,630,520 6,094,440Connecticut 3,291,967 3,411,777 3,579,717 3,597,584 3,620,445Delaware 669,567 786,373 899,791 965,568 1,017,967District of Columbia 605,321 572,046 605,126 701,954 784,551Florida 13,033,307 16,047,515 18,849,890 20,875,267 22,482,232Georgia 6,512,602 8,227,303 9,713,454 10,429,313 11,004,732Hawaii 1,113,491 1,213,519 1,363,980 1,462,059 1,549,671Idaho 1,012,384 1,299,430 1,570,986 1,690,296 1,783,659Illinois 11,453,316 12,434,161 12,841,249 12,873,171 12,921,955Indiana 5,557,798 6,091,866 6,490,590 6,675,910 6,830,255Iowa 2,781,018 2,929,067 3,050,694 3,156,466 3,247,782Kansas 2,481,349 2,693,681 2,858,824 2,934,063 2,993,760Kentucky 3,694,048 4,049,021 4,347,937 4,457,966 4,545,920Louisiana 4,221,532 4,471,885 4,544,951 4,723,261 4,860,820Maine 1,231,719 1,277,072 1,327,695 1,330,363 1,334,026Maryland 4,799,770 5,311,034 5,788,409 6,099,454 6,348,447Massachusetts 6,022,639 6,361,104 6,565,036 6,895,714 7,176,557Michigan 9,311,319 9,952,450 9,877,369 9,944,777 10,012,139Minnesota 4,389,857 4,933,692 5,310,903 5,567,146 5,778,398Mississippi 2,578,897 2,848,353 2,970,316 3,001,865 3,027,743Missouri 5,128,880 5,607,285 5,996,052 6,121,013 6,220,878Montana 800,204 903,773 990,643 1,050,856 1,098,513Nebraska 1,581,660 1,713,820 1,830,025 1,924,424 2,000,163Nevada 1,220,695 2,018,741 2,703,440 2,971,932 3,191,962New Hampshire 1,112,384 1,239,882 1,316,708 1,336,778 1,353,954New Jersey 7,762,963 8,430,621 8,803,881 9,026,607 9,217,481New Mexico 1,521,574 1,821,204 2,064,741 2,093,839 2,117,239New York 18,020,784 19,001,780 19,402,920 19,967,636 20,438,401North Carolina 6,664,016 8,081,614 9,558,979 10,248,291 10,796,191North Dakota 637,685 642,023 674,530 795,284 911,587Ohio 10,864,162 11,363,543 11,540,766 11,647,404 11,746,430Oklahoma 3,148,825 3,454,365 3,759,596 3,975,286 4,144,266Oregon 2,860,375 3,429,708 3,837,972 4,109,831 4,324,352Pennsylvania 11,903,299 12,284,173 12,712,014 12,845,966 12,975,293Rhode Island 1,005,995 1,050,268 1,053,219 1,058,252 1,065,124South Carolina 3,501,155 4,024,223 4,635,894 5,005,755 5,294,995South Dakota 697,101 755,844 816,299 876,917 928,062Tennessee 4,894,492 5,703,719 6,356,585 6,702,512 6,971,227Texas 17,056,755 20,944,499 25,244,363 28,429,141 31,027,614Utah 1,731,223 2,244,502 2,775,426 3,090,058 3,341,859Vermont 564,798 609,618 625,984 626,398 628,267Virginia 6,216,884 7,105,817 8,025,787 8,535,327 8,942,916Washington 4,903,043 5,910,512 6,743,060 7,354,431 7,851,861West Virginia 1,792,548 1,807,021 1,854,225 1,840,578 1,833,068Wisconsin 4,904,562 5,373,999 5,690,204 5,806,249 5,900,532Wyoming 453,690 494,300 564,516 595,586 622,055

The MulTiculTural econoMy 42
Table 31
White Population Statistics for the U.S. and States,1990, 2000, 2010, 2017, and 2022
Area 1990 2000 2010 2017 2022
Source: Selig Center for Economic Growth, Terry College of Business, The University of Georgia, June 2017.
United States 209,366,661 228,530,479 242,244,848 250,085,478 256,060,141 Alabama 2,987,764 3,196,875 3,365,162 3,378,339 3,387,783Alaska 423,276 446,506 486,121 493,474 498,794Arizona 3,293,186 4,542,461 5,429,251 5,809,782 6,097,813Arkansas 1,956,611 2,186,443 2,346,450 2,376,255 2,397,776California 24,354,238 26,421,365 27,677,269 28,885,877 29,781,348Colorado 3,077,815 3,924,356 4,465,150 4,907,537 5,250,116Connecticut 2,949,149 2,936,355 2,952,785 2,883,091 2,834,319Delaware 543,973 602,544 646,486 674,234 694,781District of Columbia 191,834 197,141 253,575 315,330 368,450Florida 11,042,189 13,084,373 14,835,972 16,128,978 17,120,990Georgia 4,659,378 5,556,989 6,153,811 6,353,740 6,500,512Hawaii 377,435 311,643 349,960 396,859 434,159Idaho 985,151 1,244,029 1,478,989 1,572,903 1,643,614Illinois 9,422,280 9,926,774 10,034,841 9,901,943 9,808,094Indiana 5,072,268 5,435,770 5,641,712 5,697,644 5,737,934Iowa 2,700,752 2,793,299 2,841,578 2,876,277 2,901,321Kansas 2,282,199 2,417,833 2,504,612 2,530,408 2,548,997Kentucky 3,407,136 3,672,766 3,869,853 3,909,298 3,937,719Louisiana 2,859,186 2,894,096 2,908,361 2,972,722 3,019,564Maine 1,214,008 1,242,070 1,268,741 1,258,997 1,252,082Maryland 3,439,866 3,498,455 3,546,111 3,596,116 3,632,264Massachusetts 5,533,629 5,610,140 5,533,555 5,599,228 5,646,614Michigan 7,844,171 8,143,698 7,941,895 7,896,014 7,863,405Minnesota 4,163,468 4,484,113 4,625,545 4,709,707 4,770,759Mississippi 1,640,316 1,762,713 1,790,004 1,775,711 1,765,572Missouri 4,516,213 4,811,076 5,042,579 5,079,761 5,106,488Montana 746,412 825,459 892,254 933,971 964,958Nebraska 1,499,293 1,587,253 1,651,399 1,705,149 1,744,610Nevada 1,077,497 1,697,938 2,106,538 2,221,132 2,306,782New Hampshire 1,093,515 1,199,618 1,248,078 1,250,330 1,251,941New Jersey 6,386,168 6,593,966 6,548,591 6,490,256 6,448,907New Mexico 1,336,983 1,555,012 1,724,967 1,719,607 1,715,789New York 14,159,914 14,162,802 13,906,414 13,861,123 13,828,862North Carolina 5,058,613 6,019,940 6,912,080 7,254,221 7,508,928North Dakota 605,655 596,394 610,355 696,084 764,597Ohio 9,588,185 9,752,216 9,663,454 9,581,595 9,523,549Oklahoma 2,619,987 2,721,397 2,855,075 2,954,660 3,027,912Oregon 2,700,987 3,132,686 3,407,377 3,579,830 3,708,329Pennsylvania 10,636,478 10,670,718 10,664,385 10,537,413 10,447,646Rhode Island 939,017 943,392 910,215 889,462 874,930South Carolina 2,423,347 2,745,477 3,170,870 3,421,087 3,611,814South Dakota 640,530 674,595 708,089 745,175 772,848Tennessee 4,069,981 4,635,849 5,062,318 5,255,037 5,397,170Texas 14,596,281 17,525,167 20,458,357 22,489,284 24,062,251Utah 1,659,462 2,109,989 2,557,105 2,805,954 2,998,397Vermont 558,134 592,031 598,619 591,271 586,077Virginia 4,864,381 5,291,975 5,738,769 5,946,533 6,099,525Washington 4,441,089 5,089,730 5,544,857 5,843,526 6,066,660West Virginia 1,727,452 1,721,633 1,747,160 1,718,054 1,697,561Wisconsin 4,561,903 4,871,484 5,037,368 5,065,707 5,086,047Wyoming 437,906 469,875 529,786 548,790 562,781
Selig Center for eConomiC growth 43
Table 32
Black Population Statistics for the U.S. and States,1990, 2000, 2010, 2017, and 2022
Area 1990 2000 2010 2017 2022
Source: Selig Center for Economic Growth, Terry College of Business, The University of Georgia, June 2017.
United States 30,648,345 35,814,706 40,356,211 43,601,079 46,187,957 Alabama 1,024,198 1,161,454 1,261,318 1,316,648 1,357,649Alaska 22,665 22,843 24,713 30,655 35,756Arizona 115,796 170,022 282,313 351,955 411,988Arkansas 375,370 421,693 455,323 470,499 481,647California 2,322,371 2,384,908 2,487,088 2,579,650 2,647,868Colorado 136,626 174,461 216,304 257,807 292,244Connecticut 283,440 335,609 393,492 428,491 455,380Delaware 114,248 154,406 197,043 218,093 234,492District of Columbia 400,254 349,214 310,987 330,344 344,905Florida 1,794,796 2,439,447 3,092,431 3,543,987 3,906,360Georgia 1,763,068 2,384,774 3,005,586 3,339,231 3,599,994Hawaii 27,844 22,938 22,959 45,483 74,117Idaho 3,330 5,929 10,977 15,326 19,452Illinois 1,711,998 1,904,071 1,903,660 1,882,336 1,867,251Indiana 435,339 518,311 605,276 649,645 683,314Iowa 48,262 63,677 92,510 117,964 140,330Kansas 144,681 157,776 174,082 186,524 195,952Kentucky 264,471 299,914 344,420 375,574 399,538Louisiana 1,302,816 1,459,999 1,467,389 1,537,995 1,590,498Maine 5,111 7,231 16,473 20,521 24,007Maryland 1,203,347 1,504,746 1,737,001 1,867,983 1,967,546Massachusetts 328,341 408,355 507,577 603,098 682,148Michigan 1,302,647 1,429,866 1,414,871 1,408,149 1,403,366Minnesota 96,863 181,181 282,593 349,356 406,498Mississippi 918,137 1,037,743 1,104,923 1,132,956 1,153,415Missouri 551,614 637,132 701,174 725,575 743,523Montana 2,200 2,797 4,284 7,269 10,605Nebraska 57,861 70,299 86,393 97,082 105,518Nevada 81,467 141,698 231,886 284,037 328,324New Hampshire 7,350 9,980 16,514 21,319 25,586New Jersey 1,080,360 1,214,799 1,284,249 1,348,680 1,396,671New Mexico 31,537 38,255 49,335 55,160 59,738New York 3,075,556 3,352,839 3,384,498 3,534,600 3,645,874North Carolina 1,471,373 1,761,665 2,093,570 2,276,990 2,417,762North Dakota 3,366 4,167 8,514 25,028 54,066Ohio 1,163,105 1,321,574 1,428,578 1,497,135 1,548,109Oklahoma 236,142 264,137 285,452 311,672 331,863Oregon 47,386 58,647 74,625 87,538 98,108Pennsylvania 1,110,238 1,261,602 1,435,221 1,523,128 1,589,196Rhode Island 43,674 60,320 75,289 86,448 95,418South Carolina 1,046,915 1,194,520 1,305,087 1,372,734 1,423,189South Dakota 3,090 4,985 10,774 18,350 26,842Tennessee 782,830 941,527 1,070,510 1,154,375 1,218,273Texas 2,055,356 2,461,903 3,083,804 3,599,873 4,020,569Utah 12,085 19,465 34,121 42,869 50,461Vermont 1,890 3,251 6,518 8,897 11,111Virginia 1,174,876 1,416,671 1,583,428 1,683,478 1,758,790Washington 154,374 199,718 254,011 313,179 363,706West Virginia 56,068 57,767 64,101 68,445 71,728Wisconsin 248,027 310,480 367,775 386,956 401,267Wyoming 3,586 3,940 5,191 9,990 15,947
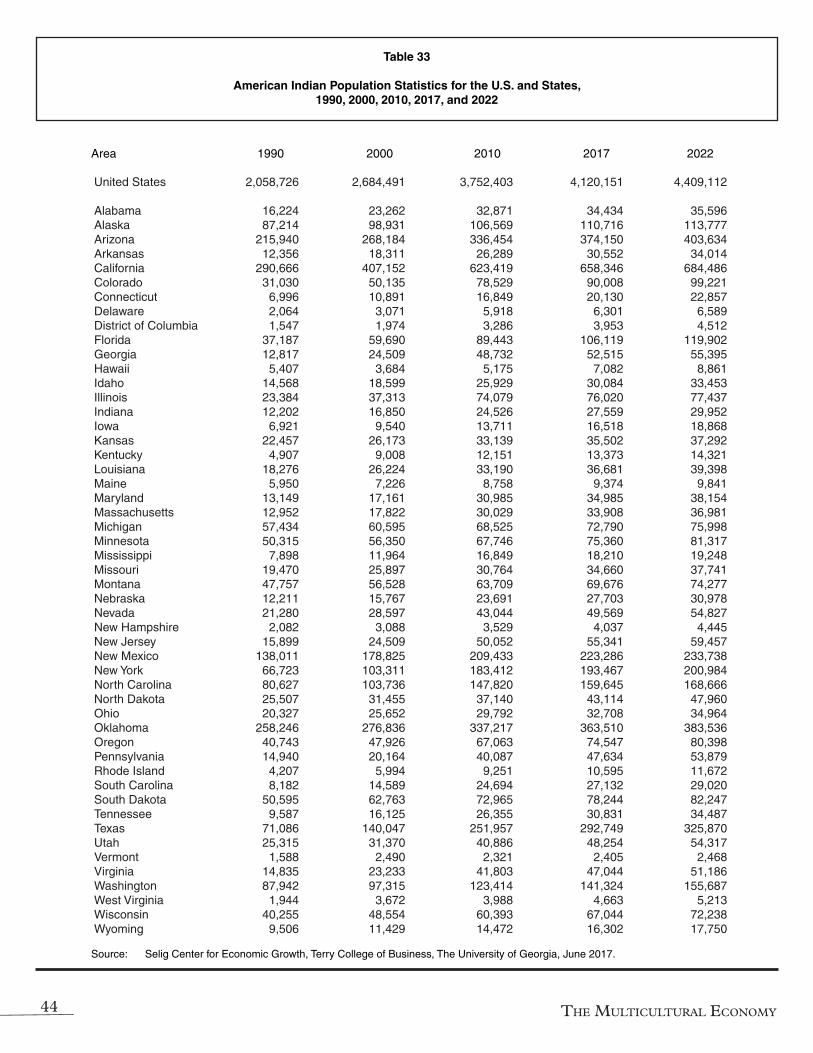
The MulTiculTural econoMy 44
Table 33
American Indian Population Statistics for the U.S. and States,1990, 2000, 2010, 2017, and 2022
Area 1990 2000 2010 2017 2022
Source: Selig Center for Economic Growth, Terry College of Business, The University of Georgia, June 2017.
United States 2,058,726 2,684,491 3,752,403 4,120,151 4,409,112 Alabama 16,224 23,262 32,871 34,434 35,596Alaska 87,214 98,931 106,569 110,716 113,777Arizona 215,940 268,184 336,454 374,150 403,634Arkansas 12,356 18,311 26,289 30,552 34,014California 290,666 407,152 623,419 658,346 684,486Colorado 31,030 50,135 78,529 90,008 99,221Connecticut 6,996 10,891 16,849 20,130 22,857Delaware 2,064 3,071 5,918 6,301 6,589District of Columbia 1,547 1,974 3,286 3,953 4,512Florida 37,187 59,690 89,443 106,119 119,902Georgia 12,817 24,509 48,732 52,515 55,395Hawaii 5,407 3,684 5,175 7,082 8,861Idaho 14,568 18,599 25,929 30,084 33,453Illinois 23,384 37,313 74,079 76,020 77,437Indiana 12,202 16,850 24,526 27,559 29,952Iowa 6,921 9,540 13,711 16,518 18,868Kansas 22,457 26,173 33,139 35,502 37,292Kentucky 4,907 9,008 12,151 13,373 14,321Louisiana 18,276 26,224 33,190 36,681 39,398Maine 5,950 7,226 8,758 9,374 9,841Maryland 13,149 17,161 30,985 34,985 38,154Massachusetts 12,952 17,822 30,029 33,908 36,981Michigan 57,434 60,595 68,525 72,790 75,998Minnesota 50,315 56,350 67,746 75,360 81,317Mississippi 7,898 11,964 16,849 18,210 19,248Missouri 19,470 25,897 30,764 34,660 37,741Montana 47,757 56,528 63,709 69,676 74,277Nebraska 12,211 15,767 23,691 27,703 30,978Nevada 21,280 28,597 43,044 49,569 54,827New Hampshire 2,082 3,088 3,529 4,037 4,445New Jersey 15,899 24,509 50,052 55,341 59,457New Mexico 138,011 178,825 209,433 223,286 233,738New York 66,723 103,311 183,412 193,467 200,984North Carolina 80,627 103,736 147,820 159,645 168,666North Dakota 25,507 31,455 37,140 43,114 47,960Ohio 20,327 25,652 29,792 32,708 34,964Oklahoma 258,246 276,836 337,217 363,510 383,536Oregon 40,743 47,926 67,063 74,547 80,398Pennsylvania 14,940 20,164 40,087 47,634 53,879Rhode Island 4,207 5,994 9,251 10,595 11,672South Carolina 8,182 14,589 24,694 27,132 29,020South Dakota 50,595 62,763 72,965 78,244 82,247Tennessee 9,587 16,125 26,355 30,831 34,487Texas 71,086 140,047 251,957 292,749 325,870Utah 25,315 31,370 40,886 48,254 54,317Vermont 1,588 2,490 2,321 2,405 2,468Virginia 14,835 23,233 41,803 47,044 51,186Washington 87,942 97,315 123,414 141,324 155,687West Virginia 1,944 3,672 3,988 4,663 5,213Wisconsin 40,255 48,554 60,393 67,044 72,238Wyoming 9,506 11,429 14,472 16,302 17,750

Selig Center for eConomiC growth 45
Table 34
Asian Population Statistics for the U.S. and States,1990, 2000, 2010, 2017, and 2022
Area 1990 2000 2010 2017 2022
Source: Selig Center for Economic Growth, Terry College of Business, The University of Georgia, June 2017.
United States 7,549,082 11,173,178 15,952,765 20,006,033 23,596,333 Alabama 21,869 34,152 60,903 77,380 91,813Alaska 20,135 29,497 47,085 59,727 70,785Arizona 59,175 108,016 206,234 269,443 326,137Arkansas 12,249 23,086 44,728 60,760 75,621California 2,992,240 3,994,168 5,248,660 6,232,041 7,045,358Colorado 62,147 105,800 154,729 202,201 244,788Connecticut 52,382 89,128 145,519 181,331 212,189Delaware 9,282 17,257 30,277 41,367 51,698District of Columbia 11,686 16,317 22,768 32,505 41,917Florida 159,135 293,663 496,954 646,288 779,710Georgia 77,339 186,698 337,487 460,463 574,882Hawaii 702,805 629,428 670,610 677,693 682,799Idaho 9,335 14,030 22,944 30,310 36,978Illinois 295,654 447,626 616,166 759,595 882,063Indiana 37,989 64,124 110,571 162,995 215,058Iowa 25,083 39,178 57,606 86,120 114,775Kansas 32,012 50,459 73,226 94,528 113,441Kentucky 17,534 32,496 54,006 74,034 92,744Louisiana 41,254 58,019 75,173 95,220 112,736Maine 6,650 9,841 14,221 18,042 21,385Maryland 143,408 221,533 335,286 426,952 507,402Massachusetts 147,717 253,669 369,518 491,135 601,814Michigan 107,067 186,058 247,917 326,271 396,983Minnesota 79,211 149,713 222,713 294,052 358,610Mississippi 12,546 19,999 28,448 35,913 42,417Missouri 41,583 67,319 108,392 140,201 168,490Montana 3,835 5,371 7,214 10,612 13,981Nebraska 12,295 23,828 35,909 52,058 67,871Nevada 40,451 104,907 224,322 289,045 346,420New Hampshire 9,437 16,967 29,668 38,115 45,584New Jersey 280,536 505,611 759,899 930,232 1,074,808New Mexico 15,043 23,453 34,662 41,498 47,192New York 718,591 1,132,653 1,515,434 1,869,071 2,171,148North Carolina 53,403 124,685 228,883 328,918 426,156North Dakota 3,157 3,985 7,507 13,122 19,555Ohio 92,545 140,369 203,981 272,524 335,175Oklahoma 34,450 51,250 73,206 101,549 128,291Oregon 71,259 113,888 161,056 210,725 255,329Pennsylvania 141,643 232,527 368,639 478,174 575,824Rhode Island 19,097 26,757 33,640 42,499 50,221South Carolina 22,711 39,475 65,965 90,313 113,034South Dakota 2,886 4,779 8,439 14,586 21,562Tennessee 32,094 61,548 100,227 134,433 165,803Texas 334,032 615,076 1,043,498 1,478,030 1,895,297Utah 34,361 55,409 84,603 114,367 141,843Vermont 3,186 5,611 8,303 11,561 14,646Virginia 162,792 276,219 462,163 598,292 719,445Washington 219,638 360,114 539,633 709,913 863,537West Virginia 7,084 10,156 13,268 17,371 21,058Wisconsin 54,377 94,007 135,306 174,970 210,238Wyoming 2,692 3,259 5,199 7,490 9,721

The MulTiculTural econoMy 46
Table 35
Multiracial Population Statistics for the U.S. and States,2000, 2010, 2017, and 2022
Area 2000 2010 2017 2022
Source: Selig Center for Economic Growth, Terry College of Business, The University of Georgia, June 2017.
United States 3,959,557 7,040,636 8,792,452 10,328,732 Alabama 36,430 64,907 83,303 99,557Alaska 30,186 49,533 54,349 58,073Arizona 71,903 153,956 201,499 244,205Arkansas 29,055 49,604 63,923 76,618California 780,384 1,297,643 1,552,370 1,764,392Colorado 72,169 133,542 172,967 208,070Connecticut 39,794 71,072 84,542 95,700Delaware 9,095 20,067 25,572 30,407District of Columbia 7,400 14,510 19,821 24,767Florida 170,342 335,090 449,895 555,270Georgia 74,333 167,838 223,363 273,950Hawaii 245,826 315,276 334,942 349,735Idaho 16,843 32,147 41,674 50,162Illinois 118,377 212,503 253,278 287,111Indiana 56,811 108,505 138,067 163,995Iowa 23,373 45,289 59,587 72,487Kansas 41,440 73,765 87,101 98,079Kentucky 34,837 67,507 85,687 101,599Louisiana 33,547 60,838 80,643 98,625Maine 10,704 19,502 23,430 26,711Maryland 69,139 139,026 173,419 203,080Massachusetts 71,118 124,357 168,344 209,001Michigan 132,233 204,161 241,554 272,387Minnesota 62,335 112,306 138,671 161,215Mississippi 15,934 30,092 39,075 47,091Missouri 65,861 113,143 140,815 164,635Montana 13,618 23,182 29,328 34,692Nebraska 16,673 32,633 42,432 51,185Nevada 45,601 97,650 128,149 155,609New Hampshire 10,229 18,919 22,977 26,398New Jersey 91,736 161,090 202,098 237,638New Mexico 25,659 46,344 54,287 60,781New York 250,175 413,162 509,375 591,532North Carolina 71,588 176,626 228,518 274,678North Dakota 6,022 11,014 17,935 25,408Ohio 123,732 214,961 263,443 304,633Oklahoma 140,745 208,646 243,896 272,665Oregon 76,561 127,851 157,191 182,187Pennsylvania 99,162 203,682 259,617 308,748Rhode Island 13,805 24,824 29,248 32,883South Carolina 30,162 69,278 94,489 117,939South Dakota 8,722 16,032 20,562 24,563Tennessee 48,670 97,175 127,834 155,494Texas 202,306 406,747 569,205 723,627Utah 28,269 58,711 78,614 96,840Vermont 6,235 10,223 12,263 13,966Virginia 97,719 199,624 259,980 313,971Washington 163,635 281,145 346,489 402,269West Virginia 13,793 25,708 32,045 37,507Wisconsin 49,474 89,362 111,572 130,743Wyoming 5,797 9,868 13,013 15,856

Selig Center for eConomiC growth 47
Table 36
Hispanic Population Statistics for the U.S. and States,1990, 2000, 2010, 2017, and 2022
Area 1990 2000 2010 2017 2022
Source: Selig Center for Economic Growth, Terry College of Business, The University of Georgia, June 2017.
United States 22,572,838 35,661,885 50,756,117 59,133,450 66,061,851 Alabama 24,107 77,016 186,652 210,404 229,199Alaska 17,228 25,963 40,055 57,452 74,335Arizona 697,660 1,309,389 1,903,754 2,181,736 2,404,815Arkansas 19,208 87,804 187,478 225,568 257,426California 7,779,607 11,054,553 14,068,684 15,655,294 16,897,001Colorado 429,571 745,292 1,044,330 1,216,024 1,355,688Connecticut 214,806 323,852 482,799 585,015 671,025Delaware 16,031 37,834 73,719 90,434 104,647District of Columbia 32,878 45,266 55,880 78,335 99,710Florida 1,597,237 2,717,081 4,252,776 5,280,863 6,164,118Georgia 109,286 441,576 858,643 997,139 1,109,543Hawaii 81,378 87,989 122,339 160,779 195,430Idaho 52,914 103,038 177,083 213,557 244,125Illinois 911,704 1,544,165 2,034,898 2,233,872 2,387,801Indiana 98,601 217,326 391,742 463,731 523,117Iowa 31,923 83,414 152,967 190,048 221,919Kansas 93,332 190,633 302,268 351,392 391,297Kentucky 21,180 60,730 134,012 160,184 181,953Louisiana 92,013 108,997 194,483 249,760 298,624Maine 6,597 9,421 17,029 22,721 27,918Maryland 126,350 231,155 475,439 616,471 742,159Massachusetts 289,315 433,611 633,633 816,129 977,853Michigan 202,246 327,050 437,877 506,661 562,313Minnesota 53,704 145,301 251,817 298,311 336,690Mississippi 14,801 40,032 82,025 95,683 106,811Missouri 60,949 119,859 214,088 262,381 303,412Montana 11,520 18,191 28,895 41,157 52,988Nebraska 36,465 95,505 169,209 209,974 244,977Nevada 127,751 400,260 719,088 854,489 966,548New Hampshire 11,286 20,697 36,945 49,634 61,287New Jersey 754,012 1,128,903 1,566,531 1,847,120 2,077,814New Mexico 584,566 769,988 957,830 1,019,176 1,065,385New York 2,230,090 2,894,316 3,433,409 3,851,066 4,180,151North Carolina 77,118 385,209 805,335 965,507 1,099,071North Dakota 4,174 7,834 13,818 34,957 67,834Ohio 139,402 219,498 356,864 440,291 511,575Oklahoma 85,463 181,095 333,435 424,887 505,196Oregon 114,212 278,259 452,586 537,749 608,226Pennsylvania 233,727 398,374 726,514 938,630 1,127,092Rhode Island 46,250 91,654 131,753 161,069 185,924South Carolina 30,367 96,470 236,709 282,164 319,883South Dakota 4,617 10,995 22,537 35,557 49,247Tennessee 32,411 125,572 291,513 362,339 423,238Texas 4,380,366 6,739,868 9,515,613 11,170,207 12,525,440Utah 85,534 204,356 360,639 433,272 493,948Vermont 3,512 5,556 9,307 12,554 15,545Virginia 160,703 334,268 638,425 806,993 954,016Washington 217,833 446,953 761,823 941,786 1,095,814West Virginia 7,775 12,347 22,441 30,300 37,548Wisconsin 93,534 195,371 337,835 401,062 453,346Wyoming 25,524 31,999 50,593 61,564 70,829

The MulTiculTural econoMy 48
Table 37
Non-Hispanic Population Statistics for the U.S. and States,1990, 2000, 2010, 2017, and 2022
Area 1990 2000 2010 2017 2022
Source: Selig Center for Economic Growth, Terry College of Business, The University of Georgia, June 2017.
United States 227,049,976 246,500,526 258,590,746 267,471,744 274,520,423 Alabama 4,025,948 4,375,157 4,598,509 4,679,700 4,743,198Alaska 536,062 602,000 673,966 691,469 702,850Arizona 2,986,437 3,851,197 4,504,454 4,825,092 5,078,961Arkansas 2,337,378 2,590,784 2,734,916 2,776,421 2,808,250California 22,179,908 22,933,424 23,265,395 24,252,990 25,026,452Colorado 2,878,047 3,581,629 4,003,924 4,414,496 4,738,752Connecticut 3,077,161 3,087,925 3,096,918 3,012,570 2,949,421Delaware 653,536 748,539 826,072 875,133 913,320District of Columbia 572,443 526,780 549,246 623,619 684,841Florida 11,436,070 13,330,434 14,597,114 15,594,404 16,318,114Georgia 6,403,316 7,785,727 8,854,811 9,432,173 9,895,190Hawaii 1,032,113 1,125,530 1,241,641 1,301,280 1,354,242Idaho 959,470 1,196,392 1,393,903 1,476,739 1,539,534Illinois 10,541,612 10,889,996 10,806,351 10,639,299 10,534,154Indiana 5,459,197 5,874,540 6,098,848 6,212,179 6,307,138Iowa 2,749,095 2,845,653 2,897,727 2,966,418 3,025,862Kansas 2,388,017 2,503,048 2,556,556 2,582,671 2,602,463Kentucky 3,672,868 3,988,291 4,213,925 4,297,782 4,363,967Louisiana 4,129,519 4,362,888 4,350,468 4,473,500 4,562,197Maine 1,225,122 1,267,651 1,310,666 1,307,642 1,306,108Maryland 4,673,420 5,079,879 5,312,970 5,482,982 5,606,288Massachusetts 5,733,324 5,927,493 5,931,403 6,079,585 6,198,704Michigan 9,109,073 9,625,400 9,439,492 9,438,116 9,449,826Minnesota 4,336,153 4,788,391 5,059,086 5,268,835 5,441,708Mississippi 2,564,096 2,808,321 2,888,291 2,906,182 2,920,932Missouri 5,067,931 5,487,426 5,781,964 5,858,631 5,917,465Montana 788,684 885,582 961,748 1,009,699 1,045,525Nebraska 1,545,195 1,618,315 1,660,816 1,714,450 1,755,186Nevada 1,092,944 1,618,481 1,984,352 2,117,443 2,225,414New Hampshire 1,101,098 1,219,185 1,279,763 1,287,144 1,292,666New Jersey 7,008,951 7,301,718 7,237,350 7,179,487 7,139,667New Mexico 937,008 1,051,216 1,106,911 1,074,663 1,051,854New York 15,790,694 16,107,464 15,969,511 16,116,570 16,258,250North Carolina 6,586,898 7,696,405 8,753,644 9,282,784 9,697,119North Dakota 633,511 634,189 660,712 760,327 843,753Ohio 10,724,760 11,144,045 11,183,902 11,207,113 11,234,855Oklahoma 3,063,362 3,273,270 3,426,161 3,550,400 3,639,070Oregon 2,746,163 3,151,449 3,385,386 3,572,081 3,716,126Pennsylvania 11,669,572 11,885,799 11,985,500 11,907,335 11,848,201Rhode Island 959,745 958,614 921,466 897,183 879,200South Carolina 3,470,788 3,927,753 4,399,185 4,723,592 4,975,112South Dakota 692,484 744,849 793,762 841,360 878,814Tennessee 4,862,081 5,578,147 6,065,072 6,340,173 6,547,989Texas 12,676,389 14,204,631 15,728,750 17,258,934 18,502,174Utah 1,645,689 2,040,146 2,414,787 2,656,786 2,847,911Vermont 561,286 604,062 616,677 613,844 612,721Virginia 6,056,181 6,771,549 7,387,362 7,728,334 7,988,900Washington 4,685,210 5,463,559 5,981,237 6,412,645 6,756,047West Virginia 1,784,773 1,794,674 1,831,784 1,810,278 1,795,520Wisconsin 4,811,028 5,178,628 5,352,369 5,405,188 5,447,186Wyoming 428,166 462,301 513,923 534,022 551,226

Selig Center for eConomiC growth 49
Table 38
The Nation’s Largest Consumer Markets in 2017(billions of dollars)
Total Rank Buying Power 1 California 1,966.5 2 Texas 1,245.6 3 New York 1,034.4 4 Florida 872.2 5 Illinois 599.2 6 Pennsylvania 597.3 7 New Jersey 492.6 8 Ohio 476.8 9 Virginia 407.9 10 Michigan 403.5
White Black American Indian Rank Buying Power Buying Power Buying Power 1 California 1,486.0 Texas 117.1 California 20.3 2 Texas 1,025.6 New York 115.7 Oklahoma 10.6 3 New York 810.8 California 92.7 Texas 10.0 4 Florida 738.7 Florida 90.1 Arizona 6.6 5 Pennsylvania 524,1 Georgia 90.1 New York 5.6 6 Illinois 500.2 Maryland 72.2 New Mexico 4.3 7 Ohio 418.6 North Carolina 59.7 Washington 4.1 8 New Jersey 382.0 Virginia 54.2 North Carolina 3.8 9 Michigan 344.8 Illinois 52.1 Florida 3.5 10 Massachusetts 336.9 New Jersey 46.5 Alaska 3.1s
Asian Multiracial Hispanic Rank Buying Power Buying Power Buying Power 1 California 323.1 California 44.4 California 387.7 2 New York 87.9 Texas 15.2 Texas 284.4 3 Texas 77.6 New York 14.4 Florida 155.2 4 New Jersey 57.0 Florida 10.7 New York 109.3 5 Illinois 38.6 Hawaii 10.4 Illinois 54.5 6 Washington 36.1 Washington 9.1 New Jersey 54.0 7 Virginia 31.5 Virginia 7.0 Arizona 45.1 8 Hawaii 30.4 Oklahoma 6.1 Colorado 29.3 9 Florida 29.1 Illinois 5.9 New Mexico 25.3 10 Massachusetts 25.9 New Jersey 5.4 Virginia 24.4
Source: Selig Center for Economic Growth, Terry College of Business, The University of Georgia, June 2017.

The MulTiculTural econoMy 50
Table 39
The Nation’s Fast-Growing Consumer Markets in 2010-2017(percent)
Percentage Change Percentage Change Percentage Change in in inRank Total Buying Power White Buying Power Black Buying Power 1 Colorado 47.5 Colorado 46.0 North Dakota 232.6 2 Utah 45.3 District of Columbia 43.9 Hawaii 146.6 3 North Dakota 44.6 Utah 43.8 Wyoming 129.5 4 Texas 41.7 North Dakota 42.2 Idaho 82.2 5 District of Columbia 40.0 Texas 37.7 Montana 80.5 6 Washington 39.7 Washington 35.2 South Dakota 77.4 7 Oregon 37.1 Oregon 34.8 Vermont 60.4 8 California 36.7 Oklahoma 34.6 New Hampshire 56.2 9 Oklahoma 36.6 Hawaii 34.1 Coloradot 55.2 10 Idaho 34.9 South Carolina 34.1 Washington 54.8
Percentage Change Percentage Change Percentage Change in in inRank American Indian Buying Power Asian Buying Power Hispanic Buying Power
1 Hawaii 64.2 South Dakota 102.3 North Dakota 189.7 2 Utah 58.1 North Dakota 94.7 South Dakota 80.5 3 Colorado 49.4 Texas 89.4 District of Columbia 78.7 4 Texas 47.6 Vermont 89.0 Montana 69.7 5 Washington 47.2 Indiana 88.7 Alaska 68.5 6 Iowa 46.9 Utah 85.1 New Hampshire 64.2 7 Idaho 45.0 Oklahoma 83.6 Vermont 62.4 8 Arizona 42.7 District of Columbia 83.0 Oklahoma 62.1 9 Oklahoma 42.4 North Carolina 80.8 Hawaii 60.6 10 Rhode Island 41.7 Iowa 80.7 Washington 59.3
Source: Selig Center for Economic Growth, Terry College of Business, The University of Georgia, June 2017.

Selig Center for eConomiC growth 51
Table 40
The Nation’s Most Concentrated Consumer Markets in 2017(percent)
White Black American Indian Share of Share of Share of Rank Total Buying Power Total Buying Power Total Buying Power 1 Maine 96.9 Mississippi 24.7 Alaska 8.1 2 Vermont 96.4 District of Columbia 24.2 Oklahoma 6.4 3 Wyoming 95.1 Maryland 23.3 New Mexico 5.7 4 New Hampshire 95.1 Georgia 22.8 South Dakota 3.5 5 Idaho 95.1 Louisiana 20.2 Montana 3.1 6 West Virginia 94.9 Alabama 18.1 Arizona 2.6 7 Iowa 94.7 South Carolina 18.0 North Dakota 2.4 8 Montana 94.2 Delaware 16.7 Wyoming 1.4 9 Utah 93.6 North Carolina 15.2 Washington 1.1 10 North Dakota 93.3 Virginia 13.3 Nevada 1.1
Asian Multiracial Hispanic Share of Share of Share of Rank Total Buying Power Total Buying Power Total Buying Power 1 Hawaii 45.2 Hawaii 15.6 New Mexico 33.7 2 California 16.4 Alaska 3.9 Texas 22.8 3 New Jersey 11.6 Oklahoma 3.6 California 19.7 4 Washington 9.9 Washington 2.5 Florida 17.8 5 Nevada 9.2 Nevada 2.4 Arizona 17.2 6 New York 8.5 California 2.3 Nevada 16.1 7 Virginia 7.7 District of Columbia 2.2 Colorado 11.0 8 Maryland 7.3 Oregon 2.1 New Jersey 11.0 9 Massachusetts 6.7 Virginia 1.7 New York 10.6 10 Illinois 6.4 New Mexico 1.6 Illinois 9.1
Source: Selig Center for Economic Growth, Terry College of Business, The University of Georgia, June 2017.

The MulTiculTural econoMy 52
Table 41
States Ranked by the Dollar Value of Buying Power,by Race and Hispanic Origin, in 2017
AmericanArea Total White Black Indian Asian Multiracial Hispanic
Source: Selig Center for Economic Growth, Terry College of Business, The University of Georgia, June 2017.
Alabama 26 28 17 26 34 28 35Alaska 49 48 42 10 38 32 43Arizona 19 20 27 4 17 19 7Arkansas 34 34 24 34 36 35 34California 1 1 3 1 1 1 1Colorado 18 15 31 11 22 17 8Connecticut 23 23 22 36 18 26 18Delaware 45 46 33 47 37 47 41District of Columbia 44 47 23 48 35 37 39Florida 4 4 4 9 9 4 3Georgia 11 14 5 19 13 15 14Hawaii 39 51 39 44 8 5 32Idaho 41 40 46 38 44 39 36Illinois 5 6 9 12 5 9 5Indiana 17 16 21 35 23 25 22Iowa 30 30 35 40 33 38 37Kansas 31 31 34 30 28 30 27Kentucky 29 25 26 43 32 33 38Louisiana 24 27 13 25 27 29 28Maine 42 41 49 46 46 46 50Maryland 15 22 6 22 12 13 17Massachusetts 13 10 19 31 10 16 13Michigan 10 9 14 13 14 14 19Minnesota 20 17 32 15 20 24 29Mississippi 35 36 18 42 43 41 42Missouri 22 21 20 29 26 22 30Montana 46 43 51 24 50 45 46Nebraska 36 35 36 39 40 40 33Nevada 32 33 29 20 19 21 15New Hampshire 38 37 44 49 39 42 45New Jersey 7 8 10 18 4 10 6New Mexico 37 38 40 6 41 36 9New York 3 3 2 5 2 3 4North Carolina 12 12 7 8 15 18 16North Dakota 47 44 45 33 47 49 47Ohio 8 7 12 32 16 12 21Oklahoma 27 29 28 2 29 8 23Oregon 28 24 38 14 21 20 20Pennsylvania 6 5 11 23 11 11 12Rhode Island 43 42 37 45 42 43 40South Carolina 25 26 15 37 31 31 31South Dakota 48 45 47 21 48 48 48Tennessee 16 19 16 27 25 23 26Texas 2 2 1 3 3 2 2Utah 33 32 43 28 30 34 24Vermont 51 50 50 51 49 51 51Virginia 9 11 8 17 7 7 10Washington 14 13 25 7 6 6 11West Virginia 40 39 41 50 45 44 49Wisconsin 21 18 30 16 24 27 25Wyoming 50 49 48 41 51 50 44

Selig Center for eConomiC growth 53
Table 42
States Ranked by Percentage Change in Buying Power,by Race and Hispanic Origin, 2010-2017
AmericanArea Total White Black Indian Asian Hispanic
Source: Selig Center for Economic Growth, Terry College of Business, The University of Georgia, June 2017.
Alabama 46 46 42 33 46 51 Alaska 48 49 18 51 48 5 Arizona 12 13 11 8 25 33 Arkansas 21 18 33 11 15 23 California 8 12 25 20 31 29 Colorado 1 1 9 3 13 16 Connecticut 51 51 51 36 49 46 Delaware 25 30 26 43 30 26 District of Columbia 5 2 47 35 8 3 Florida 14 14 23 13 35 27 Georgia 15 28 24 45 18 47 Hawaii 19 9 2 1 51 9 Idaho 10 11 4 7 32 14 Illinois 35 34 49 39 40 48 Indiana 16 15 35 31 5 31 Iowa 24 21 14 6 10 21 Kansas 22 19 27 30 24 38 Kentucky 37 36 31 26 36 44 Louisiana 41 41 44 29 42 41 Maine 47 43 39 50 37 19 Maryland 44 48 43 48 45 32 Massachusetts 29 33 19 32 23 12 Michigan 27 23 48 28 20 36 Minnesota 18 20 17 27 16 43 Mississippi 45 45 45 44 44 49 Missouri 43 40 50 24 41 39 Montana 34 31 5 41 14 4 Nebraska 26 22 30 21 12 30 Nevada 13 17 16 17 38 35 New Hampshire 30 26 8 19 27 6 New Jersey 39 44 40 47 43 42 New Mexico 49 47 22 34 50 50 New York 20 27 34 25 39 40 North Carolina 23 25 32 40 9 45 North Dakota 3 4 1 12 2 1 Ohio 32 32 37 18 21 20 Oklahoma 9 8 21 9 7 8 Oregon 7 7 15 14 17 13 Pennsylvania 36 35 36 23 28 11 Rhode Island 42 42 20 10 33 18 South Carolina 11 10 28 37 26 34 South Dakota 40 39 6 49 1 2 Tennessee 17 16 29 15 22 28 Texas 4 5 12 4 3 15 Utah 2 3 13 2 6 17 Vermont 38 37 7 46 4 7 Virginia 33 38 38 38 34 24 Washington 6 6 10 5 11 10 West Virginia 50 50 46 42 47 22 Wisconsin 31 29 41 22 19 37 Wyoming 28 24 3 16 29 25

The MulTiculTural econoMy 54
Table 43
States Ranked by Market Share, by Race and Hispanic Origin,in 2017
AmericanArea White Black Indian Asian Multiracial Hispanic .
Source: Selig Center for Economic Growth, Terry College of Business, The University of Georgia, June 2017.
Alabama 40 6 22 43 38 41Alaska 39 32 1 12 2 24Arizona 24 31 6 18 13 5Arkansas 28 14 19 39 19 30California 46 29 13 2 6 3Colorado 14 36 15 25 11 7Connecticut 27 23 43 15 36 11Delaware 44 8 28 13 37 28District of Columbia 49 2 41 16 7 12Florida 30 13 37 24 20 4Georgia 48 4 39 17 25 26Hawaii 51 34 29 1 1 14Idaho 5 48 12 42 17 16Illinois 33 18 35 10 35 10Indiana 20 24 44 29 47 31Iowa 7 41 42 35 50 36Kansas 17 30 18 27 16 20Kentucky 16 25 46 40 45 46Louisiana 45 5 23 38 40 32Maine 1 50 34 49 48 51Maryland 50 3 30 8 12 22Massachusetts 26 27 45 9 26 25Michigan 29 17 26 21 27 38Minnesota 15 35 21 19 31 40Mississippi 47 1 32 47 51 47Missouri 22 20 31 32 23 39Montana 8 51 5 51 15 42Nebraska 11 38 24 34 42 27Nevada 36 22 10 5 5 6New Hampshire 4 46 50 30 41 48New Jersey 42 15 40 3 28 8New Mexico 21 40 3 37 10 1New York 41 12 25 6 14 9North Carolina 37 9 14 22 32 29North Dakota 10 42 7 45 30 43Ohio 23 19 49 28 34 45Oklahoma 35 26 2 33 3 23Oregon 19 43 11 14 8 18Pennsylvania 25 21 48 20 43 33Rhode Island 18 28 27 26 18 15South Carolina 38 7 38 41 46 35South Dakota 12 45 4 46 29 44Tennessee 31 11 36 36 33 37Texas 34 16 17 11 21 2Utah 9 47 16 23 22 13Vermont 2 49 47 44 39 49Virginia 43 10 33 7 9 21Washington 32 37 9 4 4 19West Virginia 6 39 51 48 44 50Wisconsin 13 33 20 31 49 34Wyoming 3 44 8 50 24 17

Selig Center for eConomiC growth 55
Table 44
U.S. Average Annual Spending and Item Share for All Consumers, 2015-2016
Source: Shares were calculated by the Selig Center for Economic Growth, based on data obtained from the U.S. Department of Labor, Bureau of Labor Statistics, Consumer Expenditure Survey, 2016.
Average Spending, All Consumers Item Share
Item (dollars) (percent)
AVERAGE ANNUAL EXPENDITURES FOOD AT HOMEFOOD AWAY FROM HOME ALCOHOLIC BEVERAGES HOUSING Shelter Utilities, fuels, and public services Natural gas Electricity Fuel oil and other fuels Telephone services, VOIP, phone cards Cellular phone services Water and other public services Household operations Housekeeping supplies Household furnishings and equipment Household textiles Furniture Floor coverings Major appliances Small appliances & misc. housewares Miscellaneous household equipment APPAREL & SERVICES Men and boys Women and girls Children under 2 Footwear Other apparel products and services TRANSPORTATION Vehicle purchases (net outlay) Cars and trucks, new Cars and trucks, used Other vehicles Gasoline and motor oil Other vehicle expenses Finance charges Maintenance, repairs Insurance Rental, leases, licenses, other Public transportation HEALTH CARE Health insurance Medical services Drugs Medical supplies ENTERTAINMENT Fees and admissions Television, radios, sound equipment Pets, toys, hobbies, playground equipment Other PERSONAL CARE PRODUCTS & SERVICES READING EDUCATION TOBACCO PRODUCTS & SMOKING SUPPLIES MISCELLANEOUS CASH CONTRIBUTIONS PERSONAL INSURANCE & PENSIONS Life and other personal insurance Pensions and Social Security
56,258 100.0 4,101 7.3 3,095 5.5 513 0.9 18,495 32.9 10,847 19.3 3,858 6.9 365 0.6 1,443 2.6 94 0.2 325 0.6 1,074 1.9 558 1.0 1,351 2.4 651 1.2 1,788 3.2 103 0.2 479 0.9 20 0.0 272 0.5 118 0.2 796 1.4 1,794 3.2 417 0.7 655 1.2 77 0.1 355 0.6 290 0.5 9,225 16.4 3,779 6.7 1,759 3.1 1,958 3.5 62 0.1 1,932 3.4 2,874 5.1 221 0.4 838 1.5 1,180 2.1 635 1.1 641 1.1 4,470 7.9 3,086 5.5 799 1.4 435 0.8 150 0.3 2,908 5.2 674 1.2 1,082 1.9 716 1.2 437 0.8 699 1.2 115 0.2 1,241 2.2 338 0.6 898 1.6 1,813 3.2 6,553 11.6 332 0.6 6,221 11.1

The MulTiculTural econoMy 56
Table 45
U.S. Average Annual Spending and Item Share for Black and Non-Black Consumers, 2015-2016
Source: Selig Center for Economic Growth, based on data from the Consumer Expenditure Survey, 2016.
Black Consumers Non-Black Consumers Average Average Spending Per Spending Per Difference Consumer Share of Total Consumers Share of Total in ShareItem (dollars) (percent) (dollars) (percent) (percent)
AVERAGE ANNUAL EXPENDITURES FOOD AT HOME FOOD AWAY FROM HOME ALCOHOLIC BEVERAGES HOUSING Shelter Utilities, fuels, and public services Natural gas Electricity Fuel oil and other fuels Telephone services, VOIP, phone cards Cellular phone services Water and other public services Household operations Housekeeping supplies Household furnishings and equipment Household textiles Furniture Floor coverings Major appliances Small appliances & misc. housewares Miscellaneous household equipment APPAREL & SERVICES Men and boys Women and girls Children under 2 Footwear Other apparel products and services TRANSPORTATION Vehicle purchases (net outlay) Cars and trucks, new Cars and trucks, used Other vehicles Gasoline and motor oil Other vehicle expenses Finance charges Maintenance, repairs Insurance Rental, leases, licenses, other Public transportation HEALTH CARE Health insurance Medical services Drugs Medical supplies ENTERTAINMENT Fees and admissions Television, radios, sound equipment Pets, toys, and playground equipment Other PERSONAL CARE PRODUCTS & SERVICES READING EDUCATION TOBACCO PRODUCTS & SMOKING SUPPLIES MISCELLANEOUS CASH CONTRIBUTIONS PERSONAL INSURANCE & PENSIONS Life and other personal insurance Pensions and Social Security
40,860 100.0 58,555 100.0 0.0 2,891 7.1 4,279 7.3 -0.2 2,049 5.0 3,250 5.6 -0.5 223 0.5 555 0.9 -0.4 15,016 36.7 19,015 32.5 4.3 8,970 22.0 11,128 19.0 2.9 3,640 8.9 3,891 6.6 2.3 418 1.0 357 0.6 0.4 1,410 3.5 1,448 2.5 1.0 31 0.1 103 0.2 -0.1 315 0.8 326 0.6 0.2 979 2.4 1,088 1.9 0.5 487 1.2 569 1.0 0.2 789 1.9 1,435 2.5 -0.5 480 1.2 676 1.2 0.0 1,137 2.8 1,885 3.2 -0.4 91 0.2 105 0.2 0.0 362 0.9 497 0.8 0.0 16 0.0 21 0.0 0.0 168 0.4 287 0.5 -0.1 54 0.1 127 0.2 -0.1 447 1.1 848 1.4 -0.4 1,460 3.6 1,844 3.1 0.4 330 0.8 430 0.7 0.1 484 1.2 680 1.2 0.0 77 0.2 77 0.1 0.1 361 0.9 355 0.6 0.3 207 0.5 302 0.5 -0.0 7,447 18.2 9,492 16.2 2.0 3,125 7.6 3,877 6.6 1.0 970 2.4 1,878 3.2 -0.8 2,123 5.2 1,933 3.3 1.9 31 0.1 66 0.1 -0.0 1,561 3.8 1,987 3.4 0.4 2,342 5.7 2,954 5.0 0.7 199 0.5 225 0.4 0.1 616 1.5 871 1.5 0.0 1,154 2.8 1,184 2.0 0.8 373 0.9 674 1.2 -0.2 419 1.0 674 1.2 -0.1 2,463 6.0 4,770 8.1 -2.1 1,875 4.6 3,268 5.6 -1.0 268 0.7 878 1.5 -0.8 222 0.5 466 0.8 -0.3 98 0.2 157 0.3 -0.0 1,557 3.8 3,109 5.3 -1.5 228 0.6 741 1.3 -0.7 992 2.4 1,095 1.9 0.6 211 0.5 791 1.3 -0.8 127 0.3 483 0.8 -0.5 547 1.3 721 1.2 0.1 43 0.1 126 0.2 -0.1 636 1.6 1,331 2.3 -0.7 259 0.6 350 0.6 0.0 607 1.5 941 1.6 -0.1 1,427 3.5 1,871 3.2 0.3 4,235 10.4 6,900 11.8 -1.4 227 0.6 348 0.6 -0.0 4,008 9.8 6,552 11.2 -1.4

Selig Center for eConomiC growth 57
Table 46
U.S. Average Annual Spending and Item Share for Asian and All Consumers, 2015-2016
Source: Selig Center for Economic Growth, based on data from the Consumer Expenditure Survey, 2016.
Asian Consumers All Consumers Average Average Spending Per Spending Per Difference Consumer Share of Total Consumer Share of Total in ShareItem (dollars) (percent) (dollars) (percent) (percent)
AVERAGE ANNUAL EXPENDITURES FOOD AT HOME FOOD AWAY FROM HOME ALCOHOLIC BEVERAGES HOUSING Shelter Utilities, fuels, and public services Natural gas Electricity Fuel oil and other fuels Telephone services, VOIP, phone cards Cellular phone services Water and other public services Household operations Housekeeping supplies Household furnishings and equipment Household textiles Furniture Floor coverings Major appliances Small appliances & misc. housewares Miscellaneous household equipment APPAREL & SERVICES Men and boys Women and girls Children under 2 Footwear Other apparel products and services TRANSPORTATION Vehicle purchases (net outlay) Cars and trucks, new Cars and trucks, used Other vehicles Gasoline and motor oil Other vehicle expenses Finance charges Maintenance, repairs Insurance Rental, leases, licenses, other Public transportation HEALTH CARE Health insurance Medical services Drugs Medical supplies ENTERTAINMENT Fees and admissions Television, radios, sound equipment Pets, toys, and playground equipment Other PERSONAL CARE PRODUCTS & SERVICES READING EDUCATION TOBACCO PRODUCTS & SMOKING SUPPLIES MISCELLANEOUS CASH CONTRIBUTIONS PERSONAL INSURANCE & PENSIONS Life and other personal insurance Pensions and Social Security
65,839 100.0 56,258 100.0 0.0 4,379 6.7 4,101 7.3 -0.6 4,277 6.5 3,095 5.5 1.0 305 0.5 513 0.9 -0.4 22,656 34.4 18,495 32.9 1.5 14,951 22.7 10,847 19.3 3.4 3,577 5.4 3,858 6.9 -1.4 426 0.6 365 0.6 -0.0 1,186 1.8 1,443 2.6 -0.8 41 0.1 94 0.2 -0.1 256 0.4 325 0.6 -0.2 1,079 1.6 1,074 1.9 -0.3 589 0.9 558 1.0 -0.1 1,780 2.7 1,351 2.4 0.3 578 0.9 651 1.2 -0.3 1,769 2.7 1,788 3.2 -0.5 90 0.1 103 0.2 -0.0 502 0.8 479 0.9 -0.1 14 0.0 20 0.0 -0.0 211 0.3 272 0.5 -0.2 146 0.2 118 0.2 0.0 806 1.2 796 1.4 -0.2 2,474 3.8 1,794 3.2 0.6 593 0.9 417 0.7 0.2 980 1.5 655 1.2 0.3 134 0.2 77 0.1 0.1 479 0.7 355 0.6 0.1 287 0.4 290 0.5 -0.1 10,325 15.7 9,225 16.4 -0.7 3,763 5.7 3,779 6.7 -1.0 2,351 3.6 1,759 3.1 0.4 1,412 2.1 1,958 3.5 -1.3 0 0.0 62 0.1 -0.1 2,031 3.1 1,932 3.4 -0.3 3,294 5.0 2,874 5.1 -0.1 142 0.2 221 0.4 -0.2 763 1.2 838 1.5 -0.3 1,481 2.2 1,180 2.1 0.2 907 1.4 635 1.1 0.2 1,237 1.9 641 1.1 0.7 4,189 6.4 4,470 7.9 -1.6 3,044 4.6 3,086 5.5 -0.9 772 1.2 799 1.4 -0.2 266 0.4 435 0.8 -0.4 106 0.2 150 0.3 -0.1 2,545 3.9 2,908 5.2 -1.3 898 1.4 674 1.2 0.2 819 1.2 1,082 1.9 -0.7 363 0.6 716 1.2 -0.7 464 0.7 437 0.8 -0.1 742 1.1 699 1.2 -0.1 113 0.2 115 0.2 -0.0 2,469 3.8 1,241 2.2 1.5 146 0.2 338 0.6 -0.4 717 1.1 898 1.6 -0.5 1,357 2.1 1,813 3.2 -1.2 9,146 13.9 6,553 11.6 2.2 270 0.4 332 0.6 -0.2 8,876 13.5 6,221 11.1 2.4

The MulTiculTural econoMy 58
Table 47
U.S. Average Annual Spending and Item Share for Hispanic and Non-Hispanic Consumers, 2015-2016
Source: Selig Center for Economic Growth, based on data from the Consumer Expenditure Survey, 2016.
Hispanic Consumers Non-Hispanic Consumers Average Average Spending Per Spending Per Difference Consumer Share of Total Consumer Share of Total in ShareItem (dollars) (percent) (dollars) (percent) (percent)
AVERAGE ANNUAL EXPENDITURES FOOD AT HOME FOOD AWAY FROM HOME ALCOHOLIC BEVERAGES HOUSING Shelter Utilities, fuels, and public services Natural gas Electricity Fuel oil and other fuels Telephone services, VOIP, phone cards Cellular phone services Water and other public services Household operations Housekeeping supplies Household furnishings and equipment Household textiles Furniture Floor coverings Major appliances Small appliances & misc. housewares Miscellaneous household equipment APPAREL & SERVICES Men and boys Women and girls Children under 2 Footwear Other apparel products and services TRANSPORTATION Vehicle purchases (net outlay) Cars and trucks, new Cars and trucks, used Other vehicles Gasoline and motor oil Other vehicle expenses Finance charges Maintenance, repairs Insurance Rental, leases, licenses, other Public transportation HEALTH CARE Health insurance Medical services Drugs Medical supplies ENTERTAINMENT Fees and admissions Television, radios, sound equipment Pets, toys, and playground equipment Other PERSONAL CARE PRODUCTS & SERVICES READING EDUCATION TOBACCO PRODUCTS & SMOKING SUPPLIES MISCELLANEOUS CASH CONTRIBUTIONS PERSONAL INSURANCE & PENSIONS Life and other personal insurance Pensions and Social Security
47,633 100.0 57,534 100.0 0.0 4,375 9.2 4,061 7.1 2.1 2,931 6.2 3,119 5.4 0.7 388 0.8 531 0.9 -0.1 16,994 35.7 18,717 32.5 3.1 10,213 21.4 10,941 19.0 2.4 3,617 7.6 3,894 6.8 0.8 278 0.6 378 0.7 -0.1 1,343 2.8 1,458 2.5 0.3 23 0.0 104 0.2 -0.1 180 0.4 346 0.6 -0.2 1,291 2.7 1,042 1.8 0.9 502 1.1 566 1.0 0.1 983 2.1 1,405 2.4 -0.4 574 1.2 663 1.2 0.1 1,607 3.4 1,815 3.2 0.2 96 0.2 104 0.2 0.0 479 1.0 479 0.8 0.2 9 0.0 22 0.0 -0.0 258 0.5 274 0.5 0.1 110 0.2 119 0.2 0.0 655 1.4 817 1.4 -0.0 2,047 4.3 1,757 3.1 1.2 576 1.2 393 0.7 0.5 645 1.4 657 1.1 0.2 103 0.2 73 0.1 0.1 480 1.0 337 0.6 0.4 243 0.5 296 0.5 -0.0 8,320 17.5 9,359 16.3 1.2 2,995 6.3 3,895 6.8 -0.5 1,117 2.3 1,854 3.2 -0.9 1,838 3.9 1,976 3.4 0.4 40 0.1 65 0.1 -0.0 2,133 4.5 1,902 3.3 1.2 2,675 5.6 2,904 5.0 0.6 235 0.5 219 0.4 0.1 741 1.6 852 1.5 0.1 1,170 2.5 1,181 2.1 0.4 528 1.1 651 1.1 -0.0 517 1.1 659 1.1 -0.1 2,676 5.6 4,735 8.2 -2.6 1,902 4.0 3,261 5.7 -1.7 430 0.9 853 1.5 -0.6 254 0.5 461 0.8 -0.3 90 0.2 159 0.3 -0.1 1,893 4.0 3,058 5.3 -1.3 381 0.8 717 1.2 -0.4 921 1.9 1,105 1.9 0.0 425 0.9 759 1.3 -0.5 165 0.3 477 0.8 -0.5 621 1.3 711 1.2 0.1 62 0.1 123 0.2 -0.1 901 1.9 1,291 2.2 -0.4 144 0.3 366 0.6 -0.3 660 1.4 933 1.6 -0.2 850 1.8 1,956 3.4 -1.6 4,773 10.0 6,816 11.8 -1.8 154 0.3 358 0.6 -0.3 4,619 9.7 6,458 11.2 -1.5

Selig Center for eConomiC growth 59
Buying Power by Race and Hispanic Origin, United States, 2017(billions of dollars)
Source: Selig Center for Economic Growth, Terry College of Business, The University of Georgia, June 2017.
Buying Power by Race and Hispanic Origin, United States, 1990-2022, Selected Years(trillions of dollars)
Source: Selig Center for Economic Growth, Terry College of Business, The University of Georgia, June 2017.

The MulTiculTural econoMy 60
Projected Change in Buying Power, by Race and Hispanic Origin,United States, 2010-2017
Projected Change in Buying Power, by Race and Hispanic Origin,United States, 2017-2022
Source: Selig Center for Economic Growth, Terry College of Business, The University of Georgia, June 2017.
Source: Selig Center for Economic Growth, Terry College of Business, The University of Georgia, June 2017.

Selig Center for eConomiC growth 61
Sou
rce:
S
elig
Cen
ter
for
Eco
nom
ic G
row
th, T
erry
Col
lege
of B
usin
ess,
The
Uni
vers
ity o
f Geo
rgia
, Jun
e 20
17
Tota
l Bu
yin
g P
ow
er, 2
017
(bill
ion
s o
f d
olla
rs)

The MulTiculTural econoMy 62
Sou
rce:
S
elig
Cen
ter
for
Eco
nom
ic G
row
th, T
erry
Col
lege
of B
usin
ess,
The
Uni
vers
ity o
f Geo
rgia
, Jun
e 20
17.
Wh
ite
Bu
yin
g P
ow
er, 2
017
(bill
ion
s o
f d
olla
rs)

Selig Center for eConomiC growth 63
Sou
rce:
S
elig
Cen
ter
for
Eco
nom
ic G
row
th, T
erry
Col
lege
of B
usin
ess,
The
Uni
vers
ity o
f Geo
rgia
, Jun
e 20
17.
Bla
ck B
uyi
ng
Po
wer
, 201
7(b
illio
ns
of
do
llats
)

The MulTiculTural econoMy 64
Sou
rce:
S
elig
Cen
ter
for
Eco
nom
ic G
row
th, T
erry
Col
lege
of B
usin
ess,
The
Uni
vers
ity o
f Geo
rgia
, Jun
e 20
167.
Nat
ive
Am
eric
an B
uyi
ng
Po
wer
, 201
7(b
illio
ns
of
do
llars
)

Selig Center for eConomiC growth 65
Sou
rce:
S
elig
Cen
ter
for
Eco
nom
ic G
row
th, T
erry
Col
lege
of B
usin
ess,
The
Uni
vers
ity o
f Geo
rgia
, Jun
e 20
17.
Asi
an B
uyi
ng
Po
wer
, 201
7(b
illio
ns
of
do
llars
)

The MulTiculTural econoMy 66
Sou
rce:
S
elig
Cen
ter
for
Eco
nom
ic G
row
th, T
erry
Col
lege
of B
usin
ess,
The
Uni
vers
ity o
f Geo
rgia
, Jun
e 20
17.
Mu
ltir
acia
l Bu
yin
g P
ow
er, 2
017
(bill
ion
s o
f d
olla
rs)

Selig Center for eConomiC growth 67
Sou
rce:
S
elig
Cen
ter
for
Eco
nom
ic G
row
th, T
erry
Col
lege
of B
usin
ess,
The
Uni
vers
ity o
f Geo
rgia
, Jun
e 20
17.
His
pan
ic B
uyi
ng
Po
wer
, 201
7(b
illio
ns
of
do
llars
)

The MulTiculTural econoMy 68

Part 2
ECONOMYMULTICULTURAL
State Statistics

The MulTiculTural econoMy70
Alabama
Table 1
Buying Power for 2017(thousands of dollars)
Source: Selig Center for Economic Growth, Terry College of Business, The University of Georgia, June 2017.
Alabama
Table 2
Buying Power for 2010(thousands of dollars)
Source: Selig Center for Economic Growth, Terry College of Business, The University of Georgia, June 2017.
ALABAMA
Race U.S. Alabama State Rank
Race U.S. Alabama State Rank
Total 14,577,908,009 177,649,689 26 White 11,998,080,528 139,411,081 28 Black 1,268,661,126 32,240,300 17 American Indian 112,819,670 1,189,748 26 Asian 986,163,256 3,072,196 34 Multiracial 212,183,429 1,736,365 28 Hispanic/ Latino 1,494,108,736 4,380,612 35 Non Hispanic 13,083,799,273 173,269,077 2
Total 11,221,631,000 148,031,950 25 White 9,434,548,552 118,036,424 26 Black 957,445,530 25,813,249 15 American Indian 82,435,170 906,335 26 Asian 605,720,293 2,063,309 31 Multiracial 141,481,455 1,212,634 30 Hispanic/ Latino 1,015,422,479 3,482,037 32 Non Hispanic 10,206,208,521 144,549,913 25

Selig Center for eConomiC growth 71
Alabama
Table 3
Percentage Change in Buying Power, 2010-2017,and State Rank
U.S. Alabama Race 2010-2017 2010-2017 State Rank
Source: Selig Center for Economic Growth, Terry College of Business, The University of Georgia, June 2017.
Alabama
Table 4
Market Share in Buying Power, 2010 and 2017 (percentage)
U.S. AlabamaRace 2010 2017 2010 2017
Source: Selig Center for Economic Growth, Terry College of Business, The University of Georgia, June 2017.
ALA
BA
MA
Total 29.9 20.0 46 White 27.2 18.1 46 Black 32.5 24.9 42 American Indian 36.9 31.3 33 Asian 62.8 48.9 46 Multiracial 50.0 43.2 32 Hispanic/ Latino 47.1 25.8 51 Non Hispanic 28.2 19.9 45
Total 100.0 100.0 100.0 100.0White 84.1 82.3 79.7 78.5Black 8.5 8.7 17.4 18.1American Indian 0.7 0.8 0.6 0.7Asian 5.4 6.8 1.4 1.7Multiracial 1.3 1.5 0.8 1.0Hispanic/ Latino 9.0 10.2 2.4 2.5Non Hispanic 91.0 89.8 97.6 97.5

The MulTiculTural econoMy72
Alaska
Table 1
Buying Power for 2017(thousands of dollars)
Source: Selig Center for Economic Growth, Terry College of Business, The University of Georgia, June 2017.
Alaska
Table 2
Buying Power for 2010(thousands of dollars)
Source: Selig Center for Economic Growth, Terry College of Business, The University of Georgia, June 2017.
ALASKA
Race U.S. Alaska State Rank
Race U.S. Alaska State Rank
Total 14,577,908,009 38,124,413 49 White 11,998,080,528 30,079,136 48 Black 1,268,661,126 1,329,222 42 American Indian 112,819,670 3,089,159 10 Asian 986,163,256 2,130,797 38 Multiracial 212,183,429 1,496,098 32 Hispanic/ Latino 1,494,108,736 2,118,582 43 Non Hispanic 13,083,799,273 36,005,831 49
Total 11,221,631,000 32,033,401 47 White 9,434,548,552 25,763,599 46 Black 957,445,530 927,347 41 American Indian 82,435,170 2,629,052 9 Asian 605,720,293 1,485,657 35 Multiracial 141,481,455 1,227,746 29 Hispanic/ Latino 1,015,422,479 1,257,153 44 Non Hispanic 10,206,208,521 30,776,248 47
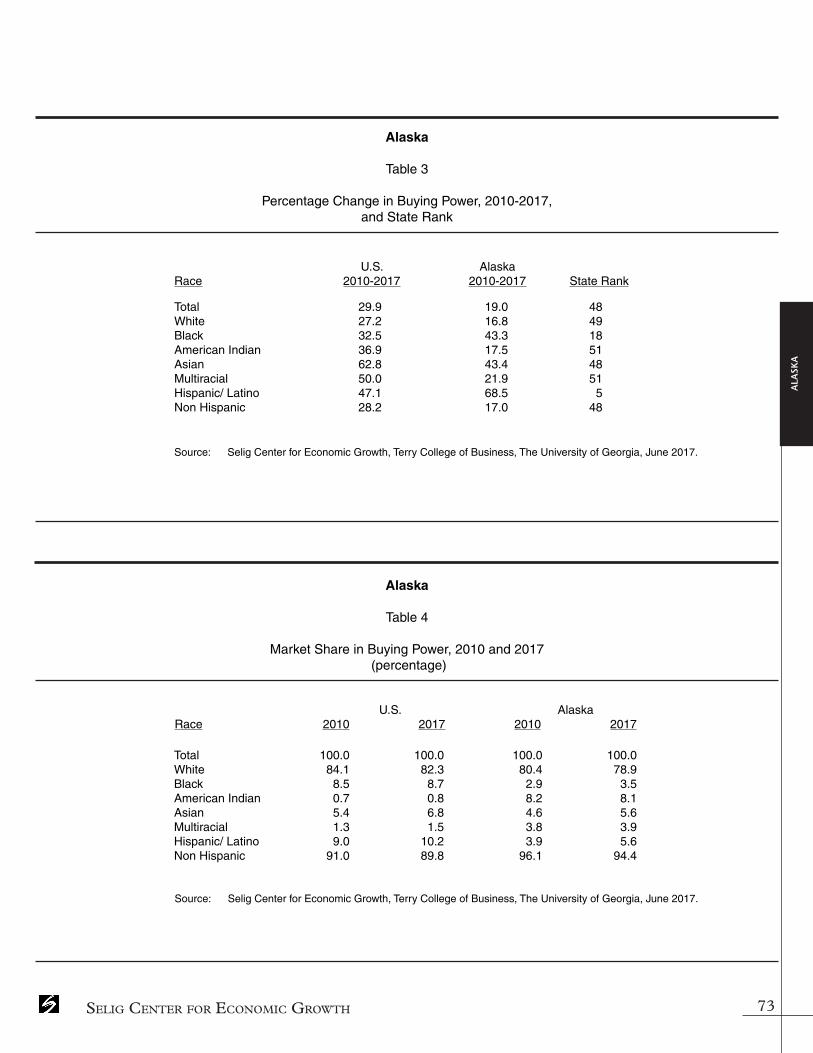
Selig Center for eConomiC growth 73
Alaska
Table 3
Percentage Change in Buying Power, 2010-2017,and State Rank
U.S. Alaska Race 2010-2017 2010-2017 State Rank
Source: Selig Center for Economic Growth, Terry College of Business, The University of Georgia, June 2017.
Alaska
Table 4
Market Share in Buying Power, 2010 and 2017 (percentage)
U.S. AlaskaRace 2010 2017 2010 2017
Source: Selig Center for Economic Growth, Terry College of Business, The University of Georgia, June 2017.
ALA
SKA
Total 29.9 19.0 48 White 27.2 16.8 49 Black 32.5 43.3 18 American Indian 36.9 17.5 51 Asian 62.8 43.4 48 Multiracial 50.0 21.9 51 Hispanic/ Latino 47.1 68.5 5 Non Hispanic 28.2 17.0 48
Total 100.0 100.0 100.0 100.0White 84.1 82.3 80.4 78.9Black 8.5 8.7 2.9 3.5American Indian 0.7 0.8 8.2 8.1Asian 5.4 6.8 4.6 5.6Multiracial 1.3 1.5 3.8 3.9Hispanic/ Latino 9.0 10.2 3.9 5.6Non Hispanic 91.0 89.8 96.1 94.4
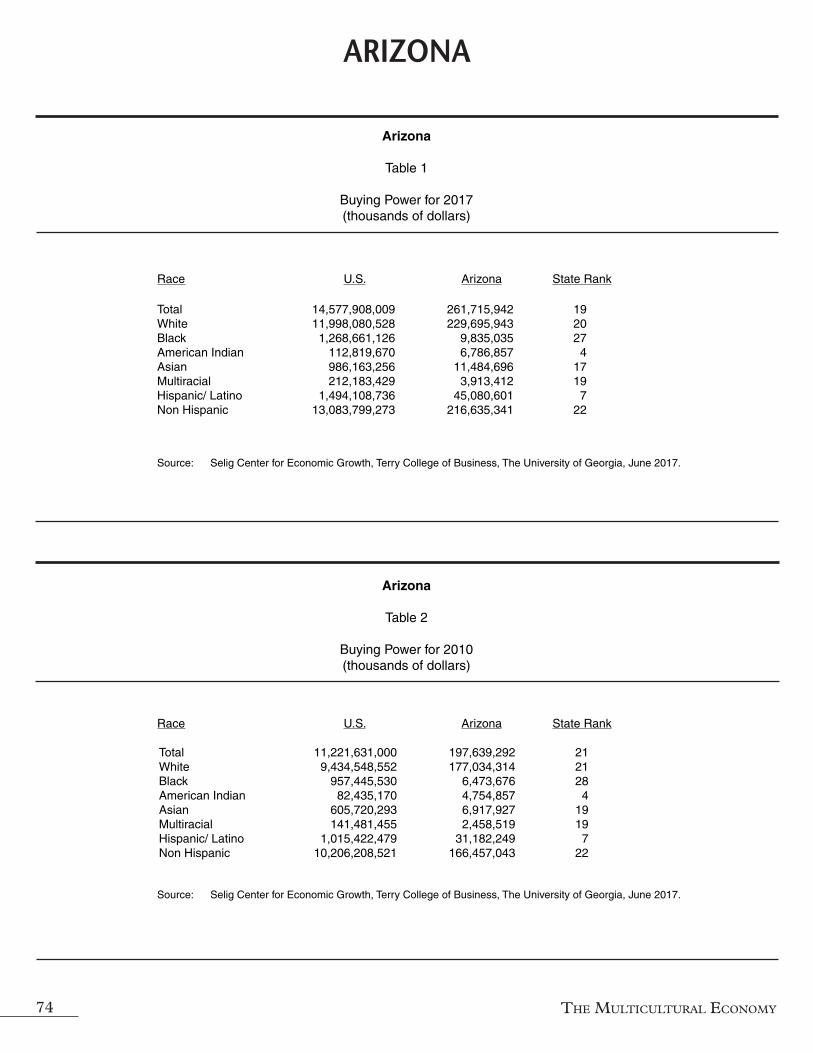
The MulTiculTural econoMy74
Arizona
Table 1
Buying Power for 2017(thousands of dollars)
Race U.S. Arizona State Rank
Source: Selig Center for Economic Growth, Terry College of Business, The University of Georgia, June 2017.
Arizona
Table 2
Buying Power for 2010(thousands of dollars)
Race U.S. Arizona State Rank
Source: Selig Center for Economic Growth, Terry College of Business, The University of Georgia, June 2017.
ARIZONA
Total 14,577,908,009 261,715,942 19 White 11,998,080,528 229,695,943 20 Black 1,268,661,126 9,835,035 27 American Indian 112,819,670 6,786,857 4 Asian 986,163,256 11,484,696 17 Multiracial 212,183,429 3,913,412 19 Hispanic/ Latino 1,494,108,736 45,080,601 7 Non Hispanic 13,083,799,273 216,635,341 22
Total 11,221,631,000 197,639,292 21 White 9,434,548,552 177,034,314 21 Black 957,445,530 6,473,676 28 American Indian 82,435,170 4,754,857 4 Asian 605,720,293 6,917,927 19 Multiracial 141,481,455 2,458,519 19 Hispanic/ Latino 1,015,422,479 31,182,249 7 Non Hispanic 10,206,208,521 166,457,043 22

Selig Center for eConomiC growth 75
Arizona
Table 3
Percentage Change in Buying Power, 2010-2017,and State Rank
U.S. Arizona Race 2010-2017 2010-2017 State Rank
Source: Selig Center for Economic Growth, Terry College of Business, The University of Georgia, June 2017.
Arizona
Table 4
Market Share in Buying Power, 2010 and 2017 (percentage)
U.S. ArizonaRace 2010 2017 2010 2017
Source: Selig Center for Economic Growth, Terry College of Business, The University of Georgia, June 2017.
AR
IZO
NA
Total 29.9 32.4 12 White 27.2 29.7 13 Black 32.5 51.9 11 American Indian 36.9 42.7 8 Asian 62.8 66.0 25 Multiracial 50.0 59.2 6 Hispanic/ Latino 47.1 44.6 33 Non Hispanic 28.2 30.1 12
Total 100.0 100.0 100.0 100.0White 84.1 82.3 89.6 87.8Black 8.5 8.7 3.3 3.8American Indian 0.7 0.8 2.4 2.6Asian 5.4 6.8 3.5 4.4Multiracial 1.3 1.5 1.2 1.5Hispanic/ Latino 9.0 10.2 15.8 17.2Non Hispanic 91.0 89.8 84.2 82.8

The MulTiculTural econoMy76
Arkansas
Table 1
Buying Power for 2017(thousands of dollars)
Race U.S. Arkansas State Rank
Source: Selig Center for Economic Growth, Terry College of Business, The University of Georgia, June 2017.
Arkansas
Table 2
Buying Power for 2010(thousands of dollars)
Race U.S. Arkansas State Rank
Source: Selig Center for Economic Growth, Terry College of Business, The University of Georgia, June 2017.
ARKANSAS
Total 14,577,908,009 109,396,215 34 White 11,998,080,528 93,837,889 34 Black 1,268,661,126 11,053,945 24 American Indian 112,819,670 860,496 34 Asian 986,163,256 2,287,362 36 Multiracial 212,183,429 1,356,522 35 Hispanic/ Latino 1,494,108,736 4,435,033 34 Non Hispanic 13,083,799,273 104,961,183 33
Total 11,221,631,000 85,132,515 33 White 9,434,548,552 73,900,506 34 Black 957,445,530 8,438,800 24 American Indian 82,435,170 609,785 34 Asian 605,720,293 1,301,041 37 Multiracial 141,481,455 882,383 35 Hispanic/ Latino 1,015,422,479 2,974,417 34 Non Hispanic 10,206,208,521 82,158,098 33

Selig Center for eConomiC growth 77
Arkansas
Table 3
Percentage Change in Buying Power, 2010-2017,and State Rank
U.S. Arkansas Race 2010-2017 2010-2017 State Rank
Source: Selig Center for Economic Growth, Terry College of Business, The University of Georgia, June 2017.
Arkansas
Table 4
Market Share in Buying Power, 2010 and 2017 (percentage)
U.S. AkansasRace 2010 2017 2010 2017
Source: Selig Center for Economic Growth, Terry College of Business, The University of Georgia, June 2017.
AR
KA
NSA
S
Total 29.9 28.5 21 White 27.2 27.0 18 Black 32.5 31.0 33 American Indian 36.9 41.1 11 Asian 62.8 75.8 15 Multiracial 50.0 53.7 14 Hispanic/ Latino 47.1 49.1 23 Non Hispanic 28.2 27.8 18
Total 100.0 100.0 100.0 100.0White 84.1 82.3 86.8 85.8Black 8.5 8.7 9.9 10.1American Indian 0.7 0.8 0.7 0.8Asian 5.4 6.8 1.5 2.1Multiracial 1.3 1.5 1.0 1.2Hispanic/ Latino 9.0 10.2 3.5 4.1Non Hispanic 91.0 89.8 96.5 95.9
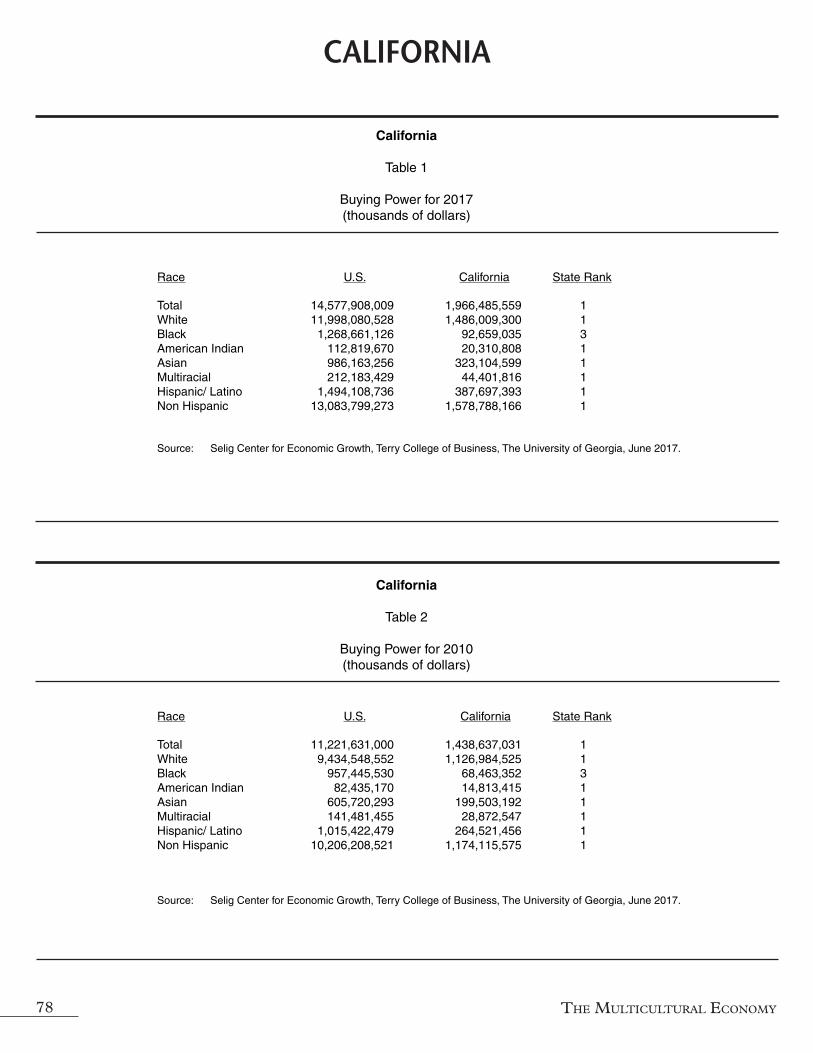
The MulTiculTural econoMy78
California
Table 1
Buying Power for 2017(thousands of dollars)
Race U.S. California State Rank
Source: Selig Center for Economic Growth, Terry College of Business, The University of Georgia, June 2017.
California
Table 2
Buying Power for 2010(thousands of dollars)
Race U.S. California State Rank
Source: Selig Center for Economic Growth, Terry College of Business, The University of Georgia, June 2017.
CALIFORNIA
Total 14,577,908,009 1,966,485,559 1 White 11,998,080,528 1,486,009,300 1 Black 1,268,661,126 92,659,035 3 American Indian 112,819,670 20,310,808 1 Asian 986,163,256 323,104,599 1 Multiracial 212,183,429 44,401,816 1 Hispanic/ Latino 1,494,108,736 387,697,393 1 Non Hispanic 13,083,799,273 1,578,788,166 1
Total 11,221,631,000 1,438,637,031 1 White 9,434,548,552 1,126,984,525 1 Black 957,445,530 68,463,352 3 American Indian 82,435,170 14,813,415 1 Asian 605,720,293 199,503,192 1 Multiracial 141,481,455 28,872,547 1 Hispanic/ Latino 1,015,422,479 264,521,456 1 Non Hispanic 10,206,208,521 1,174,115,575 1

Selig Center for eConomiC growth 79
California
Table 3
Percentage Change in Buying Power, 2010-2017,and State Rank
U.S. California Race 2010-2017 2010-2017 State Rank
Source: Selig Center for Economic Growth, Terry College of Business, The University of Georgia, June 2017.
California
Table 4
Market Share in Buying Power, 2010 and 2017 (percentage)
U.S. CaliforniaRace 2010 2017 2010 2017
Source: Selig Center for Economic Growth, Terry College of Business, The University of Georgia, June 2017.
CA
LIFO
RN
IA
Total 29.9 36.7 8 White 27.2 31.9 12 Black 32.5 35.3 25 American Indian 36.9 37.1 20 Asian 62.8 62.0 31 Multiracial 50.0 53.8 13 Hispanic/ Latino 47.1 46.6 29 Non Hispanic 28.2 34.5 9
Total 100.0 100.0 100.0 100.0White 84.1 82.3 78.3 75.6Black 8.5 8.7 4.8 4.7American Indian 0.7 0.8 1.0 1.0Asian 5.4 6.8 13.9 16.4Multiracial 1.3 1.5 2.0 2.3Hispanic/ Latino 9.0 10.2 18.4 19.7Non Hispanic 91.0 89.8 81.6 80.3
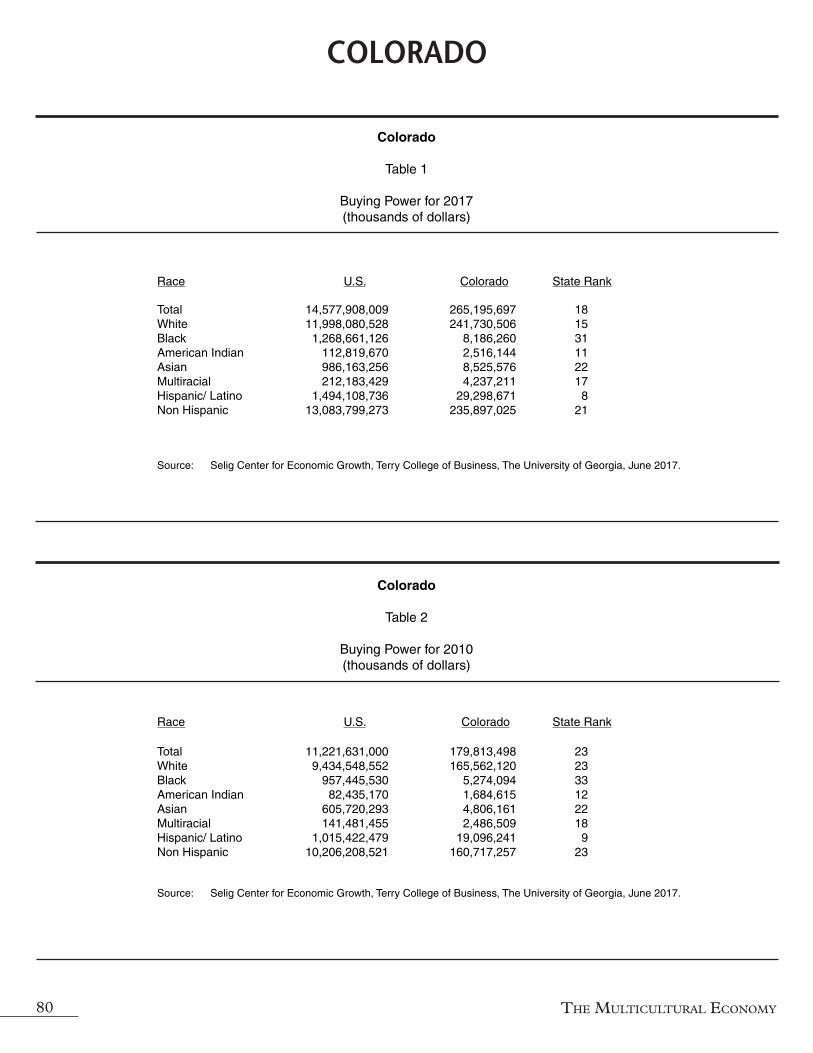
The MulTiculTural econoMy80
Colorado
Table 1
Buying Power for 2017(thousands of dollars)
Race U.S. Colorado State Rank
Source: Selig Center for Economic Growth, Terry College of Business, The University of Georgia, June 2017.
Colorado
Table 2
Buying Power for 2010(thousands of dollars)
Race U.S. Colorado State Rank
Source: Selig Center for Economic Growth, Terry College of Business, The University of Georgia, June 2017.
COLORADO
Total 14,577,908,009 265,195,697 18 White 11,998,080,528 241,730,506 15 Black 1,268,661,126 8,186,260 31 American Indian 112,819,670 2,516,144 11 Asian 986,163,256 8,525,576 22 Multiracial 212,183,429 4,237,211 17 Hispanic/ Latino 1,494,108,736 29,298,671 8 Non Hispanic 13,083,799,273 235,897,025 21
Total 11,221,631,000 179,813,498 23 White 9,434,548,552 165,562,120 23 Black 957,445,530 5,274,094 33 American Indian 82,435,170 1,684,615 12 Asian 605,720,293 4,806,161 22 Multiracial 141,481,455 2,486,509 18 Hispanic/ Latino 1,015,422,479 19,096,241 9 Non Hispanic 10,206,208,521 160,717,257 23

Selig Center for eConomiC growth 81
Colorado
Table 3
Percentage Change in Buying Power, 2010-2017,and State Rank
U.S. Colorado Race 2010-2017 2010-2017 State Rank
Source: Selig Center for Economic Growth, Terry College of Business, The University of Georgia, June 2017.
Colorado
Table 4
Market Share in Buying Power, 2010 and 2017 (percentage)
U.S. ColoradoRace 2010 2017 2010 2017
Source: Selig Center for Economic Growth, Terry College of Business, The University of Georgia, June 2017.
CO
LOR
AD
O
Total 29.9 47.5 1 White 27.2 46.0 1 Black 32.5 55.2 9 American Indian 36.9 49.4 3 Asian 62.8 77.4 13 Multiracial 50.0 70.4 3 Hispanic/ Latino 47.1 53.4 16 Non Hispanic 28.2 46.8 1
Total 100.0 100.0 100.0 100.0White 84.1 82.3 92.1 91.2Black 8.5 8.7 2.9 3.1American Indian 0.7 0.8 0.9 0.9Asian 5.4 6.8 2.7 3.2Multiracial 1.3 1.5 1.4 1.6Hispanic/ Latino 9.0 10.2 10.6 11.0Non Hispanic 91.0 89.8 89.4 89.0

The MulTiculTural econoMy82
Connecticut
Table 1
Buying Power for 2017(thousands of dollars)
Race U.S. Connecticut State Rank
Source: Selig Center for Economic Growth, Terry College of Business, The University of Georgia, June 2017.
Connecticut
Table 2
Buying Power for 2010(thousands of dollars)
Race U.S. Connecticut State Rank
Source: Selig Center for Economic Growth, Terry College of Business, The University of Georgia, June 2017.
CONNECTICUT
Total 14,577,908,009 217,247,215 23 White 11,998,080,528 188,790,921 23 Black 1,268,661,126 14,503,031 22 American Indian 112,819,670 690,213 36 Asian 986,163,256 11,130,143 18 Multiracial 212,183,429 2,132,906 26 Hispanic/ Latino 1,494,108,736 16,852,752 18 Non Hispanic 13,083,799,273 200,394,462 23
Total 11,221,631,000 194,529,201 22 White 9,434,548,552 172,494,624 22 Black 957,445,530 11,972,139 22 American Indian 82,435,170 531,339 36 Asian 605,720,293 7,818,555 16 Multiracial 141,481,455 1,712,543 25 Hispanic/ Latino 1,015,422,479 12,197,661 18 Non Hispanic 10,206,208,521 182,331,540 21

Selig Center for eConomiC growth 83
Connecticut
Table 3
Percentage Change in Buying Power, 2010-2017,and State Rank
U.S. Connecticut Race 2010-2017 2010-2017 State Rank
Source: Selig Center for Economic Growth, Terry College of Business, The University of Georgia, June 2017.
Connecticut
Table 4
Market Share in Buying Power, 2010 and 2017 (percentage)
U.S. ConnecticutRace 2010 2017 2010 2017
Source: Selig Center for Economic Growth, Terry College of Business, The University of Georgia, June 2017.
CO
NN
ECTI
CU
T
Total 29.9 11.7 51 White 27.2 9.4 51 Black 32.5 21.1 51 American Indian 36.9 29.9 36 Asian 62.8 42.4 49 Multiracial 50.0 24.5 50 Hispanic/ Latino 47.1 38.2 46 Non Hispanic 28.2 9.9 51
Total 100.0 100.0 100.0 100.0White 84.1 82.3 88.7 86.9Black 8.5 8.7 6.2 6.7American Indian 0.7 0.8 0.3 0.3Asian 5.4 6.8 4.0 5.1Multiracial 1.3 1.5 0.9 1.0Hispanic/ Latino 9.0 10.2 6.3 7.8Non Hispanic 91.0 89.8 93.7 92.2

The MulTiculTural econoMy84
Delaware
Table 1
Buying Power for 2017(thousands of dollars)
Race U.S. Delaware State Rank
Source: Selig Center for Economic Growth, Terry College of Business, The University of Georgia, June 2017.
Delaware
Table 2
Buying Power for 2010(thousands of dollars)
Race U.S. Delaware State Rank
Source: Selig Center for Economic Growth, Terry College of Business, The University of Georgia, June 2017.
DELAWARE
Total 14,577,908,009 42,633,142 45 White 11,998,080,528 32,673,287 46 Black 1,268,661,126 7,119,035 33 American Indian 112,819,670 190,554 47 Asian 986,163,256 2,233,074 37 Multiracial 212,183,429 417,193 47 Hispanic/ Latino 1,494,108,736 2,219,295 41 Non Hispanic 13,083,799,273 40,413,847 45
Total 11,221,631,000 33,308,619 44 White 9,434,548,552 26,212,142 45 Black 957,445,530 5,274,771 32 American Indian 82,435,170 151,781 47 Asian 605,720,293 1,362,884 36 Multiracial 141,481,455 307,041 47 Hispanic/ Latino 1,015,422,479 1,507,281 42 Non Hispanic 10,206,208,521 31,801,338 44

Selig Center for eConomiC growth 85
Delaware
Table 3
Percentage Change in Buying Power, 2010-2017,and State Rank
U.S. Delaware Race 2010-2017 2010-2017 State Rank
Source: Selig Center for Economic Growth, Terry College of Business, The University of Georgia, June 2017.
Delaware
Table 4
Market Share in Buying Power, 2010 and 2017 (percentage)
U.S. DelawareRace 2010 2017 2010 2017
Source: Selig Center for Economic Growth, Terry College of Business, The University of Georgia, June 2017.
DEL
AW
AR
E
Total 29.9 28.0 25 White 27.2 24.6 30 Black 32.5 35.0 26 American Indian 36.9 25.5 43 Asian 62.8 63.8 30 Multiracial 50.0 35.9 46 Hispanic/ Latino 47.1 47.2 26 Non Hispanic 28.2 27.1 24
Total 100.0 100.0 100.0 100.0White 84.1 82.3 78.7 76.6Black 8.5 8.7 15.8 16.7American Indian 0.7 0.8 0.5 0.4Asian 5.4 6.8 4.1 5.2Multiracial 1.3 1.5 0.9 1.0Hispanic/ Latino 9.0 10.2 4.5 5.2Non Hispanic 91.0 89.8 95.5 94.8

The MulTiculTural econoMy86
District of Columbia
Table 1
Buying Power for 2017(thousands of dollars)
Race U.S. District of Columbia State Rank
Source: Selig Center for Economic Growth, Terry College of Business, The University of Georgia, June 2017.
District of Columbia
Table 2
Buying Power for 2010(thousands of dollars)
Race U.S. District of Columbia State Rank
Source: Selig Center for Economic Growth, Terry College of Business, The University of Georgia, June 2017.
DISTRICT OF COLUMBIA
Total 14,577,908,009 45,907,545 44 White 11,998,080,528 31,364,513 47 Black 1,268,661,126 11,116,649 23 American Indian 112,819,670 148,762 48 Asian 986,163,256 2,288,321 35 Multiracial 212,183,429 989,300 37 Hispanic/ Latino 1,494,108,736 3,508,762 39 Non Hispanic 13,083,799,273 42,398,783 44
Total 11,221,631,000 32,787,948 45 White 9,434,548,552 21,790,553 50 Black 957,445,530 9,034,183 23 American Indian 82,435,170 113,662 48 Asian 605,720,293 1,250,703 38 Multiracial 141,481,455 598,846 38 Hispanic/ Latino 1,015,422,479 1,963,405 40 Non Hispanic 10,206,208,521 30,824,543 46

Selig Center for eConomiC growth 87
District of Columbia
Table 3
Percentage Change in Buying Power, 2010-2017,and State Rank
U.S. District of Columbia Race 2010-2017 2010-2017 State Rank
Source: Selig Center for Economic Growth, Terry College of Business, The University of Georgia, June 2017.
District of Columbia
Table 4
Market Share in Buying Power, 2010 and 2017 (percentage)
U.S. District of ColumbiaRace 2010 2017 2010 2017
Source: Selig Center for Economic Growth, Terry College of Business, The University of Georgia, June 2017.
DIS
TRIC
T O
F C
OLU
MB
IA
Total 29.9 40.0 5 White 27.2 43.9 2 Black 32.5 23.1 47 American Indian 36.9 30.9 35 Asian 62.8 83.0 8 Multiracial 50.0 65.2 5 Hispanic/ Latino 47.1 78.7 3 Non Hispanic 28.2 37.5 6
Total 100.0 100.0 100.0 100.0White 84.1 82.3 66.5 68.3Black 8.5 8.7 27.6 24.2American Indian 0.7 0.8 0.3 0.3Asian 5.4 6.8 3.8 5.0Multiracial 1.3 1.5 1.8 2.2Hispanic/ Latino 9.0 10.2 6.0 7.6Non Hispanic 91.0 89.8 94.0 92.4

The MulTiculTural econoMy88
Florida
Table 1
Buying Power for 2017(thousands of dollars)
Race U.S. Florida State Rank
Source: Selig Center for Economic Growth, Terry College of Business, The University of Georgia, June 2017.
Florida
Table 2
Buying Power for 2010(thousands of dollars)
Race U.S. Florida State Rank
Source: Selig Center for Economic Growth, Terry College of Business, The University of Georgia, June 2017.
FLORIDA
Total 14,577,908,009 872,152,482 4 White 11,998,080,528 738,722,510 4 Black 1,268,661,126 90,144,493 4 American Indian 112,819,670 3,469,849 9 Asian 986,163,256 29,089,190 9 Multiracial 212,183,429 10,726,440 4 Hispanic/ Latino 1,494,108,736 155,210,992 3 Non Hispanic 13,083,799,273 716,941,490 4
Total 11,221,631,000 669,630,238 4 White 9,434,548,552 576,483,597 4 Black 957,445,530 65,616,271 5 American Indian 82,435,170 2,459,277 10 Asian 605,720,293 18,117,358 9 Multiracial 141,481,455 6,953,735 5 Hispanic/ Latino 1,015,422,479 105,716,529 3 Non Hispanic 10,206,208,521 563,913,709 4

Selig Center for eConomiC growth 89
Florida
Table 3
Percentage Change in Buying Power, 2010-2017,and State Rank
U.S. Florida Race 2010-2017 2010-2017 State Rank
Source: Selig Center for Economic Growth, Terry College of Business, The University of Georgia, June 2017
Florida
Table 4
Market Share in Buying Power, 2010 and 2017 (percentage)
U.S. FloridaRace 2010 2017 2010 2017
Source: Selig Center for Economic Growth, Terry College of Business, The University of Georgia, June 2017.
FLO
RID
A
Total 29.9 30.2 14 White 27.2 28.1 14 Black 32.5 37.4 23 American Indian 36.9 41.1 13 Asian 62.8 60.6 35 Multiracial 50.0 54.3 12 Hispanic/ Latino 47.1 46.8 27 Non Hispanic 28.2 27.1 23
Total 100.0 100.0 100.0 100.0White 84.1 82.3 86.1 84.7Black 8.5 8.7 9.8 10.3American Indian 0.7 0.8 0.4 0.4Asian 5.4 6.8 2.7 3.3Multiracial 1.3 1.5 1.0 1.2Hispanic/ Latino 9.0 10.2 15.8 17.8Non Hispanic 91.0 89.8 84.2 82.2

The MulTiculTural econoMy90
Georgia
Table 1
Buying Power for 2017(thousands of dollars)
Race U.S. Georgia State Rank
Source: Selig Center for Economic Growth, Terry College of Business, The University of Georgia, June 2017.
Georgia
Table 2
Buying Power for 2010(thousands of dollars)
Race U.S. Georgia State Rank
Source: Selig Center for Economic Growth, Terry College of Business, The University of Georgia, June 2017.
GEORGIA
Total 14,577,908,009 395,851,812 11 White 11,998,080,528 281,000,792 14 Black 1,268,661,126 90,063,994 5 American Indian 112,819,670 1,400,874 19 Asian 986,163,256 18,929,488 13 Multiracial 212,183,429 4,456,664 15 Hispanic/ Latino 1,494,108,736 20,877,029 14 Non Hispanic 13,083,799,273 374,974,783 11
Total 11,221,631,000 305,356,245 13 White 9,434,548,552 224,444,373 14 Black 957,445,530 65,857,024 4 American Indian 82,435,170 1,123,807 19 Asian 605,720,293 10,962,141 13 Multiracial 141,481,455 2,968,899 15 Hispanic/ Latino 1,015,422,479 15,162,070 11 Non Hispanic 10,206,208,521 290,194,175 13

Selig Center for eConomiC growth 91
Georgia
Table 3
Percentage Change in Buying Power, 2010-2017,and State Rank
U.S. Georgia Race 2010-2017 2010-2017 State Rank
Source: Selig Center for Economic Growth, Terry College of Business, The University of Georgia, June 2017.
Georgia
Table 4
Market Share in Buying Power, 2010 and 2017 (percentage)
U.S. GeorgiaRace 2010 2017 2010 2017
Source: Selig Center for Economic Growth, Terry College of Business, The University of Georgia, June 2017.
GEO
RG
IA
Total 29.9 29.6 15 White 27.2 25.2 28 Black 32.5 36.8 24 American Indian 36.9 24.7 45 Asian 62.8 72.7 18 Multiracial 50.0 50.1 18 Hispanic/ Latino 47.1 37.7 47 Non Hispanic 28.2 29.2 14
Total 100.0 100.0 100.0 100.0White 84.1 82.3 73.5 71.0Black 8.5 8.7 21.6 22.8American Indian 0.7 0.8 0.4 0.4Asian 5.4 6.8 3.6 4.8Multiracial 1.3 1.5 1.0 1.1Hispanic/ Latino 9.0 10.2 5.0 5.3Non Hispanic 91.0 89.8 95.0 94.7

The MulTiculTural econoMy92
Hawaii
Table 1
Buying Power for 2017(thousands of dollars)
Race U.S. Hawaii State Rank
Source: Selig Center for Economic Growth, Terry College of Business, The University of Georgia, June 2017.
Hawaii
Table 2
Buying Power for 2010(thousands of dollars)
Race U.S. Hawaii State Rank
Source: Selig Center for Economic Growth, Terry College of Business, The University of Georgia, June 2017.
HAWAII
Total 14,577,908,009 67,185,276 39 White 11,998,080,528 23,940,685 51 Black 1,268,661,126 2,098,546 39 American Indian 112,819,670 298,677 44 Asian 986,163,256 30,397,543 8 Multiracial 212,183,429 10,449,825 5 Hispanic/ Latino 1,494,108,736 4,711,654 32 Non Hispanic 13,083,799,273 62,473,621 38
Total 11,221,631,000 52,128,555 40 White 9,434,548,552 17,858,080 51 Black 957,445,530 850,931 42 American Indian 82,435,170 181,895 44 Asian 605,720,293 25,207,910 5 Multiracial 141,481,455 8,029,739 4 Hispanic/ Latino 1,015,422,479 2,933,023 35 Non Hispanic 10,206,208,521 49,195,532 39

Selig Center for eConomiC growth 93
Hawaii
Table 3
Percentage Change in Buying Power, 2010-2017,and State Rank
U.S. Hawaii Race 2010-2017 2010-2017 State Rank
Source: Selig Center for Economic Growth, Terry College of Business, The University of Georgia, June 2017.
Hawaii
Table 4
Market Share in Buying Power, 2010 and 2017 (percentage)
U.S. HawaiiRace 2010 2017 2010 2017
Source: Selig Center for Economic Growth, Terry College of Business, The University of Georgia, June 2017.
HA
WA
II
Total 29.9 28.9 19 White 27.2 34.1 9 Black 32.5 146.6 2 American Indian 36.9 64.2 1 Asian 62.8 20.6 51 Multiracial 50.0 30.1 48 Hispanic/ Latino 47.1 60.6 9 Non Hispanic 28.2 27.0 26
Total 100.0 100.0 100.0 100.0White 84.1 82.3 34.3 35.6Black 8.5 8.7 1.6 3.1American Indian 0.7 0.8 0.3 0.4Asian 5.4 6.8 48.4 45.2Multiracial 1.3 1.5 15.4 15.6Hispanic/ Latino 9.0 10.2 5.6 7.0Non Hispanic 91.0 89.8 94.4 93.0

The MulTiculTural econoMy94
Idaho
Table 1
Buying Power for 2017(thousands of dollars)
Race U.S. Idaho State Rank
Source: Selig Center for Economic Growth, Terry College of Business, The University of Georgia, June 2017.
Idaho
Table 2
Buying Power for 2010(thousands of dollars)
Race U.S. Idaho State Rank
Source: Selig Center for Economic Growth, Terry College of Business, The University of Georgia, June 2017.
IDAHO
Total 14,577,908,009 61,833,383 41 White 11,998,080,528 58,773,756 40 Black 1,268,661,126 490,230 46 American Indian 112,819,670 672,446 38 Asian 986,163,256 1,085,880 44 Multiracial 212,183,429 811,071 39 Hispanic/ Latino 1,494,108,736 4,251,107 36 Non Hispanic 13,083,799,273 57,582,277 40
Total 11,221,631,000 45,831,604 41 White 9,434,548,552 43,914,558 41 Black 957,445,530 269,009 46 American Indian 82,435,170 463,697 38 Asian 605,720,293 671,668 44 Multiracial 141,481,455 512,672 40 Hispanic/ Latino 1,015,422,479 2,732,004 36 Non Hispanic 10,206,208,521 43,099,600 42

Selig Center for eConomiC growth 95
Idaho
Table 3
Percentage Change in Buying Power, 2010-2017,and State Rank
U.S. Idaho Race 2010-2017 2010-2017 State Rank
Source: Selig Center for Economic Growth, Terry College of Business, The University of Georgia, June 2017.
Idaho
Table 4
Market Share in Buying Power, 2010 and 2017 (percentage)
U.S. IdahoRace 2010 2017 2010 2017
Source: Selig Center for Economic Growth, Terry College of Business, The University of Georgia, June 2017.
IDA
HO
Total 29.9 34.9 10 White 27.2 33.8 11 Black 32.5 82.2 4 American Indian 36.9 45.0 7 Asian 62.8 61.7 32 Multiracial 50.0 58.2 7 Hispanic/ Latino 47.1 55.6 14 Non Hispanic 28.2 33.6 11
Total 100.0 100.0 100.0 100.0White 84.1 82.3 95.8 95.1Black 8.5 8.7 0.6 0.8American Indian 0.7 0.8 1.0 1.1Asian 5.4 6.8 1.5 1.8Multiracial 1.3 1.5 1.1 1.3Hispanic/ Latino 9.0 10.2 6.0 6.9Non Hispanic 91.0 89.8 94.0 93.1

The MulTiculTural econoMy96
Illinois
Table 1
Buying Power for 2017(thousands of dollars)
Race U.S. Illinois State Rank
Source: Selig Center for Economic Growth, Terry College of Business, The University of Georgia, June 2017.
Illinois
Table 2
Buying Power for 2010(thousands of dollars)
Race U.S. Illinois State Rank
Source: Selig Center for Economic Growth, Terry College of Business, The University of Georgia, June 2017.
ILLINOIS
Total 14,577,908,009 599,170,225 5 White 11,998,080,528 500,181,153 6 Black 1,268,661,126 52,079,472 9 American Indian 112,819,670 2,420,308 12 Asian 986,163,256 38,606,399 5 Multiracial 212,183,429 5,882,893 9 Hispanic/ Latino 1,494,108,736 54,535,784 5 Non Hispanic 13,083,799,273 544,634,442 6
Total 11,221,631,000 480,288,860 6 White 9,434,548,552 406,971,046 6 Black 957,445,530 42,775,555 8 American Indian 82,435,170 1,896,149 11 Asian 605,720,293 24,503,285 6 Multiracial 141,481,455 4,142,825 9 Hispanic/ Latino 1,015,422,479 39,926,325 5 Non Hispanic 10,206,208,521 440,362,535 6

Selig Center for eConomiC growth 97
Illinois
Table 3
Percentage Change in Buying Power, 2010-2017,and State Rank
U.S. Illinois Race 2010-2017 2010-2017 State Rank
Source: Selig Center for Economic Growth, Terry College of Business, The University of Georgia, June 2017.
Illinois
Table 4
Market Share in Buying Power, 2010 and 2017 (percentage)
U.S. IllinoisRace 2010 2017 2010 2017
Source: Selig Center for Economic Growth, Terry College of Business, The University of Georgia, June 2017.
ILLI
NO
IS
Total 29.9 24.8 35 White 27.2 22.9 34 Black 32.5 21.8 49 American Indian 36.9 27.6 39 Asian 62.8 57.6 40 Multiracial 50.0 42.0 34 Hispanic/ Latino 47.1 36.6 48 Non Hispanic 28.2 23.7 35
Total 100.0 100.0 100.0 100.0White 84.1 82.3 84.7 83.5Black 8.5 8.7 8.9 8.7American Indian 0.7 0.8 0.4 0.4Asian 5.4 6.8 5.1 6.4Multiracial 1.3 1.5 0.9 1.0Hispanic/ Latino 9.0 10.2 8.3 9.1Non Hispanic 91.0 89.8 91.7 90.9

The MulTiculTural econoMy98
Indiana
Table 1
Buying Power for 2017(thousands of dollars)
Race U.S. Indiana State Rank
Source: Selig Center for Economic Growth, Terry College of Business, The University of Georgia, June 2017.
Indiana
Table 2
Buying Power for 2010(thousands of dollars)
Race U.S. Indiana State Rank
Source: Selig Center for Economic Growth, Terry College of Business, The University of Georgia, June 2017.
INDIANA
Total 14,577,908,009 267,869,871 17 White 11,998,080,528 240,374,460 16 Black 1,268,661,126 17,054,003 21 American Indian 112,819,670 740,670 35 Asian 986,163,256 7,460,050 23 Multiracial 212,183,429 2,240,689 25 Hispanic/ Latino 1,494,108,736 10,641,702 22 Non Hispanic 13,083,799,273 257,228,169 17
Total 11,221,631,000 207,139,699 17 White 9,434,548,552 188,009,815 15 Black 957,445,530 13,078,948 21 American Indian 82,435,170 555,136 35 Asian 605,720,293 3,953,325 24 Multiracial 141,481,455 1,542,475 26 Hispanic/ Latino 1,015,422,479 7,358,253 20 Non Hispanic 10,206,208,521 199,781,446 17

Selig Center for eConomiC growth 99
Indiana
Table 3
Percentage Change in Buying Power, 2010-2017,and State Rank
U.S. Indiana Race 2010-2017 2010-2017 State Rank
Source: Selig Center for Economic Growth, Terry College of Business, The University of Georgia, June 2017.
Indiana
Table 4
Market Share in Buying Power, 2010 and 2017 (percentage)
U.S. IndianaRace 2010 2017 2010 2017
Source: Selig Center for Economic Growth, Terry College of Business, The University of Georgia, June 2017.
IND
IAN
A
Total 29.9 29.3 16 White 27.2 27.9 15 Black 32.5 30.4 35 American Indian 36.9 33.4 31 Asian 62.8 88.7 5 Multiracial 50.0 45.3 26 Hispanic/ Latino 47.1 44.6 31 Non Hispanic 28.2 28.8 16
Total 100.0 100.0 100.0 100.0White 84.1 82.3 90.8 89.7Black 8.5 8.7 6.3 6.4American Indian 0.7 0.8 0.3 0.3Asian 5.4 6.8 1.9 2.8Multiracial 1.3 1.5 0.7 0.8Hispanic/ Latino 9.0 10.2 3.6 4.0Non Hispanic 91.0 89.8 96.4 96.0
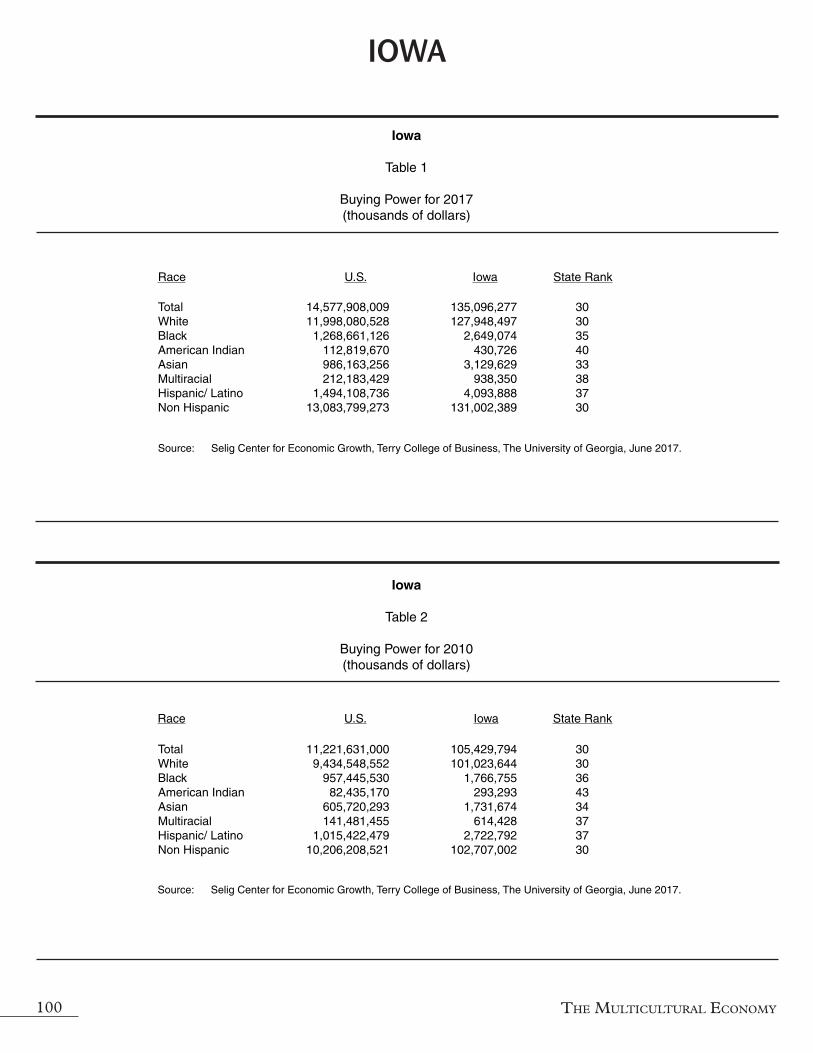
The MulTiculTural econoMy100
Iowa
Table 1
Buying Power for 2017(thousands of dollars)
Race U.S. Iowa State Rank
Source: Selig Center for Economic Growth, Terry College of Business, The University of Georgia, June 2017.
Iowa
Table 2
Buying Power for 2010(thousands of dollars)
Race U.S. Iowa State Rank
Source: Selig Center for Economic Growth, Terry College of Business, The University of Georgia, June 2017.
IOWA
Total 14,577,908,009 135,096,277 30 White 11,998,080,528 127,948,497 30 Black 1,268,661,126 2,649,074 35 American Indian 112,819,670 430,726 40 Asian 986,163,256 3,129,629 33 Multiracial 212,183,429 938,350 38 Hispanic/ Latino 1,494,108,736 4,093,888 37 Non Hispanic 13,083,799,273 131,002,389 30
Total 11,221,631,000 105,429,794 30 White 9,434,548,552 101,023,644 30 Black 957,445,530 1,766,755 36 American Indian 82,435,170 293,293 43 Asian 605,720,293 1,731,674 34 Multiracial 141,481,455 614,428 37 Hispanic/ Latino 1,015,422,479 2,722,792 37 Non Hispanic 10,206,208,521 102,707,002 30

Selig Center for eConomiC growth 101
Iowa
Table 3
Percentage Change in Buying Power, 2010-2017,and State Rank
U.S. Iowa Race 2010-2017 2010-2017 State Rank
Source: Selig Center for Economic Growth, Terry College of Business, The University of Georgia, June 2017.
Iowa
Table 4
Market Share in Buying Power, 2010 and 2017 (percentage)
U.S. IowaRace 2010 2017 2010 2017
Source: Selig Center for Economic Growth, Terry College of Business, The University of Georgia, June 2017.
IOW
A
Total 29.9 28.1 24 White 27.2 26.7 21 Black 32.5 49.9 14 American Indian 36.9 46.9 6 Asian 62.8 80.7 10 Multiracial 50.0 52.7 16 Hispanic/ Latino 47.1 50.4 21 Non Hispanic 28.2 27.5 20
Total 100.0 100.0 100.0 100.0White 84.1 82.3 95.8 94.7Black 8.5 8.7 1.7 2.0American Indian 0.7 0.8 0.3 0.3Asian 5.4 6.8 1.6 2.3Multiracial 1.3 1.5 0.6 0.7Hispanic/ Latino 9.0 10.2 2.6 3.0Non Hispanic 91.0 89.8 97.4 97.0

The MulTiculTural econoMy102
Kansas
Table 1
Buying Power for 2017(thousands of dollars)
Race U.S. Kansas State Rank
Source: Selig Center for Economic Growth, Terry College of Business, The University of Georgia, June 2017.
Kansas
Table 2
Buying Power for 2010(thousands of dollars)
Race U.S. Kansas State Rank
Source: Selig Center for Economic Growth, Terry College of Business, The University of Georgia, June 2017.
KANSAS
Total 14,577,908,009 130,240,502 31 White 11,998,080,528 117,879,235 31 Black 1,268,661,126 5,553,435 34 American Indian 112,819,670 1,041,629 30 Asian 986,163,256 4,052,772 28 Multiracial 212,183,429 1,713,431 30 Hispanic/ Latino 1,494,108,736 7,862,000 27 Non Hispanic 13,083,799,273 122,378,502 31
Total 11,221,631,000 101,533,917 31 White 9,434,548,552 92,959,073 31 Black 957,445,530 4,161,220 34 American Indian 82,435,170 778,153 28 Asian 605,720,293 2,428,364 28 Multiracial 141,481,455 1,207,108 31 Hispanic/ Latino 1,015,422,479 5,508,126 27 Non Hispanic 10,206,208,521 96,025,791 31

Selig Center for eConomiC growth 103
U.S. KansasRace 2010 2017 2010 2017
Source: Selig Center for Economic Growth, Terry College of Business, The University of Georgia, June 2017.
Kansas
Table 3
Percentage Change in Buying Power, 2010-2017,and State Rank
U.S. Kansas Race 2010-2017 2010-2017 State Rank
Source: Selig Center for Economic Growth, Terry College of Business, The University of Georgia, June 2017.
Kansas
Table 4
Market Share in Buying Power, 2010 and 2017 (percentage)
KA
NSA
S
Total 29.9 28.3 22 White 27.2 26.8 19 Black 32.5 33.5 27 American Indian 36.9 33.9 30 Asian 62.8 66.9 24 Multiracial 50.0 41.9 36 Hispanic/ Latino 47.1 42.7 38 Non Hispanic 28.2 27.4 21
Total 100.0 100.0 100.0 100.0White 84.1 82.3 91.6 90.5Black 8.5 8.7 4.1 4.3American Indian 0.7 0.8 0.8 0.8Asian 5.4 6.8 2.4 3.1Multiracial 1.3 1.5 1.2 1.3Hispanic/ Latino 9.0 10.2 5.4 6.0Non Hispanic 91.0 89.8 94.6 94.0

The MulTiculTural econoMy104
Race U.S. Kentucky State Rank
Source: Selig Center for Economic Growth, Terry College of Business, The University of Georgia, June 2017.
Kentucky
Table 1
Buying Power for 2017(thousands of dollars)
Kentucky
Table 2
Buying Power for 2010(thousands of dollars)
Race U.S. Kentucky State Rank
Source: Selig Center for Economic Growth, Terry College of Business, The University of Georgia, June 2017.
KENTUCKY
Total 14,577,908,009 161,556,320 29 White 11,998,080,528 146,580,223 25 Black 1,268,661,126 9,985,129 26 American Indian 112,819,670 396,831 43 Asian 986,163,256 3,194,813 32 Multiracial 212,183,429 1,399,324 33 Hispanic/ Latino 1,494,108,736 3,521,180 38 Non Hispanic 13,083,799,273 158,035,140 28
Total 11,221,631,000 130,671,505 27 White 9,434,548,552 119,812,410 25 Black 957,445,530 7,571,325 25 American Indian 82,435,170 294,604 42 Asian 605,720,293 1,989,804 32 Multiracial 141,481,455 1,003,361 33 Hispanic/ Latino 1,015,422,479 2,504,508 38 Non Hispanic 10,206,208,521 128,166,997 27

Selig Center for eConomiC growth 105
Kentucky
Table 3
Percentage Change in Buying Power, 2010-2017,and State Rank
U.S. Kentucky Race 2010-2017 2010-2017 State Rank
Source: Selig Center for Economic Growth, Terry College of Business, The University of Georgia, June 2017.
Kentucky
Table 4
Market Share in Buying Power, 2010 and 2017 (percentage)
U.S. KentuckyRace 2010 2017 2010 2017
Source: Selig Center for Economic Growth, Terry College of Business, The University of Georgia, June 2017.
KEN
TUC
KY
Total 29.9 23.6 37 White 27.2 22.3 36 Black 32.5 31.9 31 American Indian 36.9 34.7 26 Asian 62.8 60.6 36 Multiracial 50.0 39.5 39 Hispanic/ Latino 47.1 40.6 44 Non Hispanic 28.2 23.3 36
Total 100.0 100.0 100.0 100.0White 84.1 82.3 91.7 90.7Black 8.5 8.7 5.8 6.2American Indian 0.7 0.8 0.2 0.2Asian 5.4 6.8 1.5 2.0Multiracial 1.3 1.5 0.8 0.9Hispanic/ Latino 9.0 10.2 1.9 2.2Non Hispanic 91.0 89.8 98.1 97.8

The MulTiculTural econoMy106
Race U.S. Louisiana State Rank
Source: Selig Center for Economic Growth, Terry College of Business, The University of Georgia, June 2017.
Louisiana
Table 1
Buying Power for 2017(thousands of dollars)
Louisiana
Table 2
Buying Power for 2010(thousands of dollars)
Race U.S. Louisiana State Rank
Source: Selig Center for Economic Growth, Terry College of Business, The University of Georgia, June 2017.
LOUISIANA
Total 14,577,908,009 189,913,208 24 White 11,998,080,528 144,433,169 27 Black 1,268,661,126 38,294,286 13 American Indian 112,819,670 1,238,023 25 Asian 986,163,256 4,215,313 27 Multiracial 212,183,429 1,732,417 29 Hispanic/ Latino 1,494,108,736 7,449,951 28 Non Hispanic 13,083,799,273 182,463,256 24
Total 11,221,631,000 155,793,077 24 White 9,434,548,552 120,163,648 24 Black 957,445,530 30,757,889 12 American Indian 82,435,170 923,950 25 Asian 605,720,293 2,711,173 27 Multiracial 141,481,455 1,236,417 28 Hispanic/ Latino 1,015,422,479 5,223,588 28 Non Hispanic 10,206,208,521 150,569,489 24

Selig Center for eConomiC growth 107
Louisiana
Table 3
Percentage Change in Buying Power, 2010-2017,and State Rank
U.S. Louisiana Race 2010-2017 2010-2017 State Rank
Source: Selig Center for Economic Growth, Terry College of Business, The University of Georgia, June 2017.
Louisiana
Table 4
Market Share in Buying Power, 2010 and 2017 (percentage)
U.S. LouisianaRace 2010 2017 2010 2017
Source: Selig Center for Economic Growth, Terry College of Business, The University of Georgia, June 2017.
LOU
ISIA
NA
Total 29.9 21.9 41 White 27.2 20.2 41 Black 32.5 24.5 44 American Indian 36.9 34.0 29 Asian 62.8 55.5 42 Multiracial 50.0 40.1 38 Hispanic/ Latino 47.1 42.6 41 Non Hispanic 28.2 21.2 40
Total 100.0 100.0 100.0 100.0White 84.1 82.3 77.1 76.1Black 8.5 8.7 19.7 20.2American Indian 0.7 0.8 0.6 0.7Asian 5.4 6.8 1.7 2.2Multiracial 1.3 1.5 0.8 0.9Hispanic/ Latino 9.0 10.2 3.4 3.9Non Hispanic 91.0 89.8 96.6 96.1

The MulTiculTural econoMy108
Race U.S. Maine State Rank
Source: Selig Center for Economic Growth, Terry College of Business, The University of Georgia, June 2017.
Maine
Table 1
Buying Power for 2017(thousands of dollars)
Maine
Table 2
Buying Power for 2010(thousands of dollars)
Race U.S. Maine State Rank
Source: Selig Center for Economic Growth, Terry College of Business, The University of Georgia, June 2017.
MAINE
Total 14,577,908,009 54,310,789 42 White 11,998,080,528 52,636,771 41 Black 1,268,661,126 382,135 49 American Indian 112,819,670 219,387 46 Asian 986,163,256 646,869 46 Multiracial 212,183,429 425,627 46 Hispanic/ Latino 1,494,108,736 604,051 50 Non Hispanic 13,083,799,273 53,706,738 41
Total 11,221,631,000 45,450,288 42 White 9,434,548,552 44,231,495 40 Black 957,445,530 300,770 45 American Indian 82,435,170 178,545 45 Asian 605,720,293 406,581 46 Multiracial 141,481,455 332,898 46 Hispanic/ Latino 1,015,422,479 397,885 49 Non Hispanic 10,206,208,521 45,052,403 40

Selig Center for eConomiC growth 109
Maine
Table 3
Percentage Change in Buying Power, 2010-2017,and State Rank
U.S. Maine Race 2010-2017 2010-2017 State Rank
Source: Selig Center for Economic Growth, Terry College of Business, The University of Georgia, June 2017.
Maine
Table 4
Market Share in Buying Power, 2010 and 2017 (percentage)
U.S. MaineRace 2010 2017 2010 2017
Source: Selig Center for Economic Growth, Terry College of Business, The University of Georgia, June 2017.
MA
INE
Total 29.9 19.5 47 White 27.2 19.0 43 Black 32.5 27.1 39 American Indian 36.9 22.9 50 Asian 62.8 59.1 37 Multiracial 50.0 27.9 49 Hispanic/ Latino 47.1 51.8 19 Non Hispanic 28.2 19.2 47
Total 100.0 100.0 100.0 100.0White 84.1 82.3 97.3 96.9Black 8.5 8.7 0.7 0.7American Indian 0.7 0.8 0.4 0.4Asian 5.4 6.8 0.9 1.2Multiracial 1.3 1.5 0.7 0.8Hispanic/ Latino 9.0 10.2 0.9 1.1Non Hispanic 91.0 89.8 99.1 98.9

The MulTiculTural econoMy110
MARYLAND
Maryland
Table 1
Buying Power for 2017(thousands of dollars)
Race U.S. Maryland State Rank
Source: Selig Center for Economic Growth, Terry College of Business, The University of Georgia, June 2017.
Maryland
Table 2
Buying Power for 2010(thousands of dollars)
Race U.S. Maryland State Rank
Source: Selig Center for Economic Growth, Terry College of Business, The University of Georgia, June 2017.
Total 14,577,908,009 309,524,523 15 White 11,998,080,528 208,894,049 22 Black 1,268,661,126 72,167,967 6 American Indian 112,819,670 1,328,696 22 Asian 986,163,256 22,475,467 12 Multiracial 212,183,429 4,658,343 13 Hispanic/ Latino 1,494,108,736 17,840,582 17 Non Hispanic 13,083,799,273 291,683,940 15
Total 11,221,631,000 255,785,296 15 White 9,434,548,552 178,609,199 19 Black 957,445,530 57,862,881 6 American Indian 82,435,170 1,073,332 21 Asian 605,720,293 14,837,398 11 Multiracial 141,481,455 3,402,486 12 Hispanic/ Latino 1,015,422,479 12,336,138 17 Non Hispanic 10,206,208,521 243,449,158 15

Selig Center for eConomiC growth 111
MA
RYLA
ND
Maryland
Table 3
Percentage Change in Buying Power, 2010-2017,and State Rank
U.S. Maryland Race 2010-2017 2010-2017 State Rank
Source: Selig Center for Economic Growth, Terry College of Business, The University of Georgia, June 2017.
Maryland
Table 4
Market Share in Buying Power, 2010 and 2017 (percentage)
U.S. MarylandRace 2010 2017 2010 2017
Source: Selig Center for Economic Growth, Terry College of Business, The University of Georgia, June 2017.
Total 29.9 21.0 44 White 27.2 17.0 48 Black 32.5 24.7 43 American Indian 36.9 23.8 48 Asian 62.8 51.5 45 Multiracial 50.0 36.9 44 Hispanic/ Latino 47.1 44.6 32 Non Hispanic 28.2 19.8 46
Total 100.0 100.0 100.0 100.0White 84.1 82.3 69.8 67.5Black 8.5 8.7 22.6 23.3American Indian 0.7 0.8 0.4 0.4Asian 5.4 6.8 5.8 7.3Multiracial 1.3 1.5 1.3 1.5Hispanic/ Latino 9.0 10.2 4.8 5.8Non Hispanic 91.0 89.8 95.2 94.2

The MulTiculTural econoMy112
MASSACHUSETTS
Massachusetts
Table 1
Buying Power for 2017(thousands of dollars)
Race U.S. Massachusetts State Rank
Source: Selig Center for Economic Growth, Terry College of Business, The University of Georgia, June 2017.
Massachusetts
Table 2
Buying Power for 2010(thousands of dollars)
Race U.S. Massachusetts State Rank
Source: Selig Center for Economic Growth, Terry College of Business, The University of Georgia, June 2017.
Total 14,577,908,009 387,627,203 13 White 11,998,080,528 336,908,473 10 Black 1,268,661,126 19,444,921 19 American Indian 112,819,670 1,022,555 31 Asian 986,163,256 25,892,380 10 Multiracial 212,183,429 4,358,873 16 Hispanic/ Latino 1,494,108,736 21,211,864 13 Non Hispanic 13,083,799,273 366,415,339 13
Total 11,221,631,000 305,362,981 12 White 9,434,548,552 272,744,501 10 Black 957,445,530 13,710,158 20 American Indian 82,435,170 772,833 29 Asian 605,720,293 15,325,032 10 Multiracial 141,481,455 2,810,457 16 Hispanic/ Latino 1,015,422,479 13,473,300 14 Non Hispanic 10,206,208,521 291,889,681 12

Selig Center for eConomiC growth 113
MA
SSA
CH
USE
TTS
Massachusetts
Table 3
Percentage Change in Buying Power, 2010-2017,and State Rank
U.S. Massachusetts Race 2010-2017 2010-2017 State Rank
Source: Selig Center for Economic Growth, Terry College of Business, The University of Georgia, June 2017.
Massachusetts
Table 4
Market Share in Buying Power, 2010 and 2017 (percentage)
U.S. MassachusettsRace 2010 2017 2010 2017
Source: Selig Center for Economic Growth, Terry College of Business, The University of Georgia, June 2017.
Total 29.9 26.9 29 White 27.2 23.5 33 Black 32.5 41.8 19 American Indian 36.9 32.3 32 Asian 62.8 69.0 23 Multiracial 50.0 55.1 11 Hispanic/ Latino 47.1 57.4 12 Non Hispanic 28.2 25.5 30
Total 100.0 100.0 100.0 100.0White 84.1 82.3 89.3 86.9Black 8.5 8.7 4.5 5.0American Indian 0.7 0.8 0.3 0.3Asian 5.4 6.8 5.0 6.7Multiracial 1.3 1.5 0.9 1.1Hispanic/ Latino 9.0 10.2 4.4 5.5Non Hispanic 91.0 89.8 95.6 94.5

The MulTiculTural econoMy114
Michigan
Table 1
Buying Power for 2017(thousands of dollars)
Race U.S. Michigan State Rank
Source: Selig Center for Economic Growth, Terry College of Business, The University of Georgia, June 2017.
Michigan
Table 2
Buying Power for 2010(thousands of dollars)
Race U.S. Michigan State Rank
Source: Selig Center for Economic Growth, Terry College of Business, The University of Georgia, June 2017.
MICHIGAN
Total 14,577,908,009 403,454,428 10 White 11,998,080,528 344,807,284 9 Black 1,268,661,126 36,243,539 14 American Indian 112,819,670 2,082,586 13 Asian 986,163,256 15,837,597 14 Multiracial 212,183,429 4,483,422 14 Hispanic/ Latino 1,494,108,736 11,897,864 19 Non Hispanic 13,083,799,273 391,556,564 9
Total 11,221,631,000 316,519,039 10 White 9,434,548,552 272,801,335 9 Black 957,445,530 29,719,842 14 American Indian 82,435,170 1,548,977 13 Asian 605,720,293 9,249,172 14 Multiracial 141,481,455 3,199,713 14 Hispanic/ Latino 1,015,422,479 8,308,897 19 Non Hispanic 10,206,208,521 308,210,142 9

Selig Center for eConomiC growth 115
Michigan
Table 3
Percentage Change in Buying Power, 2010-2017,and State Rank
U.S. Michigan Race 2010-2017 2010-2017 State Rank
Source: Selig Center for Economic Growth, Terry College of Business, The University of Georgia, June 2017.
Michigan
Table 4
Market Share in Buying Power, 2010 and 2017 (percentage)
U.S. MichiganRace 2010 2017 2010 2017
Source: Selig Center for Economic Growth, Terry College of Business, The University of Georgia, June 2017.
MIC
HIG
AN
Total 29.9 27.5 27 White 27.2 26.4 23 Black 32.5 22.0 48 American Indian 36.9 34.4 28 Asian 62.8 71.2 20 Multiracial 50.0 40.1 37 Hispanic/ Latino 47.1 43.2 36 Non Hispanic 28.2 27.0 25
Total 100.0 100.0 100.0 100.0White 84.1 82.3 86.2 85.5Black 8.5 8.7 9.4 9.0American Indian 0.7 0.8 0.5 0.5Asian 5.4 6.8 2.9 3.9Multiracial 1.3 1.5 1.0 1.1Hispanic/ Latino 9.0 10.2 2.6 2.9Non Hispanic 91.0 89.8 97.4 97.1

The MulTiculTural econoMy116
MINNESOTA
Minnesota
Table 1
Buying Power for 2017(thousands of dollars)
Race U.S. Minnesota State Rank
Source: Selig Center for Economic Growth, Terry College of Business, The University of Georgia, June 2017.
Minnesota
Table 2
Buying Power for 2010(thousands of dollars)
Race U.S. Minnesota State Rank
Source: Selig Center for Economic Growth, Terry College of Business, The University of Georgia, June 2017.
Total 14,577,908,009 256,593,519 20 White 11,998,080,528 233,048,497 17 Black 1,268,661,126 7,980,459 32 American Indian 112,819,670 1,820,825 15 Asian 986,163,256 11,051,976 20 Multiracial 212,183,429 2,691,762 24 Hispanic/ Latino 1,494,108,736 6,546,144 29 Non Hispanic 13,083,799,273 250,047,375 18
Total 11,221,631,000 198,871,357 19 White 9,434,548,552 183,809,604 17 Black 957,445,530 5,519,790 31 American Indian 82,435,170 1,352,981 14 Asian 605,720,293 6,349,569 20 Multiracial 141,481,455 1,839,413 24 Hispanic/ Latino 1,015,422,479 4,611,866 29 Non Hispanic 10,206,208,521 194,259,491 19

Selig Center for eConomiC growth 117
MIN
NES
OTA
Minnesota
Table 3
Percentage Change in Buying Power, 2010-2017,and State Rank
U.S. Minnesota Race 2010-2017 2010-2017 State Rank
Source: Selig Center for Economic Growth, Terry College of Business, The University of Georgia, June 2017.
Minnesota
Table 4
Market Share in Buying Power, 2010 and 2017 (percentage)
U.S. MinnesotaRace 2010 2017 2010 2017
Source: Selig Center for Economic Growth, Terry College of Business, The University of Georgia, June 2017.
Total 29.9 29.0 18 White 27.2 26.8 20 Black 32.5 44.6 17 American Indian 36.9 34.6 27 Asian 62.8 74.1 16 Multiracial 50.0 46.3 23 Hispanic/ Latino 47.1 41.9 43 Non Hispanic 28.2 28.7 17
Total 100.0 100.0 100.0 100.0White 84.1 82.3 92.4 90.8Black 8.5 8.7 2.8 3.1American Indian 0.7 0.8 0.7 0.7Asian 5.4 6.8 3.2 4.3Multiracial 1.3 1.5 0.9 1.0Hispanic/ Latino 9.0 10.2 2.3 2.6Non Hispanic 91.0 89.8 97.7 97.4

The MulTiculTural econoMy118
Mississippi
Table 1
Buying Power for 2017(thousands of dollars)
Race U.S. Mississippi State Rank
Source: Selig Center for Economic Growth, Terry College of Business, The University of Georgia, June 2017.
Mississippi
Table 2
Buying Power for 2010(thousands of dollars)
Race U.S. Mississippi State Rank
Source: Selig Center for Economic Growth, Terry College of Business, The University of Georgia, June 2017.
MISSISSIPPI
Total 14,577,908,009 100,964,663 35 White 11,998,080,528 73,526,484 36 Black 1,268,661,126 24,949,643 18 American Indian 112,819,670 413,238 42 Asian 986,163,256 1,382,305 43 Multiracial 212,183,429 692,993 41 Hispanic/ Latino 1,494,108,736 2,134,708 42 Non Hispanic 13,083,799,273 98,829,956 35
Total 11,221,631,000 83,897,785 34 White 9,434,548,552 61,975,367 36 Black 957,445,530 20,178,663 18 American Indian 82,435,170 329,721 40 Asian 605,720,293 908,560 43 Multiracial 141,481,455 505,474 41 Hispanic/ Latino 1,015,422,479 1,620,460 41 Non Hispanic 10,206,208,521 82,277,325 32
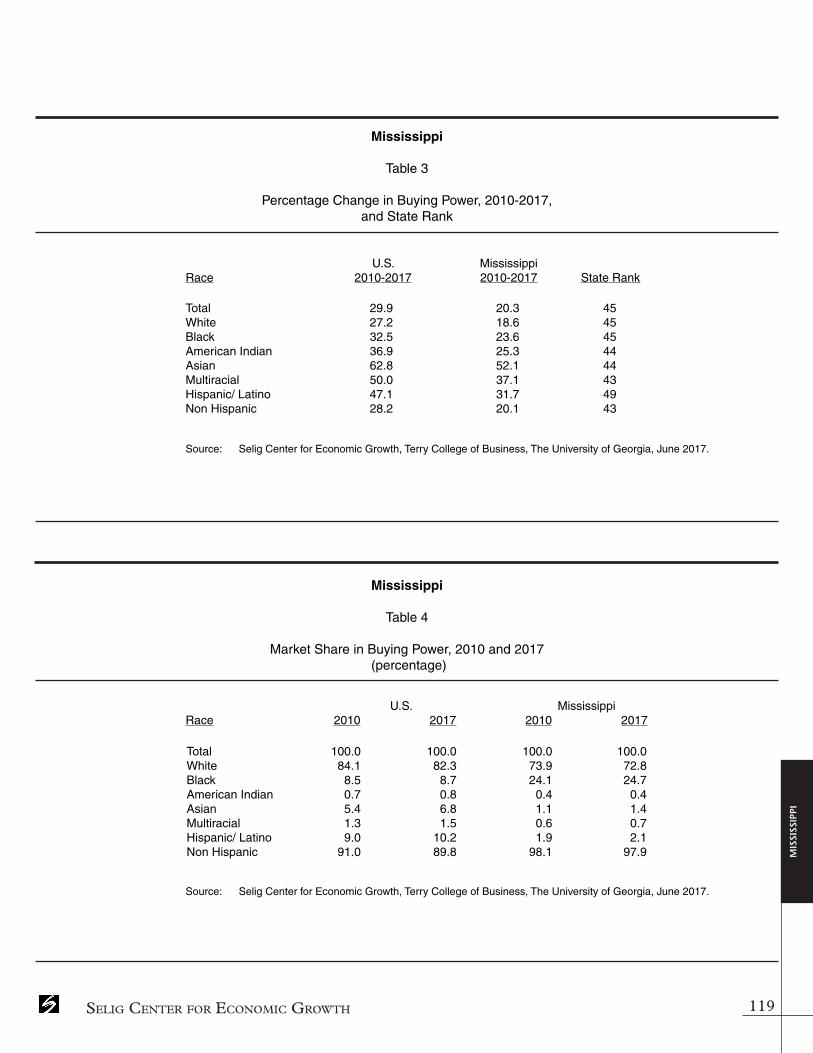
Selig Center for eConomiC growth 119
Mississippi
Table 3
Percentage Change in Buying Power, 2010-2017,and State Rank
U.S. Mississippi Race 2010-2017 2010-2017 State Rank
Source: Selig Center for Economic Growth, Terry College of Business, The University of Georgia, June 2017.
Mississippi
Table 4
Market Share in Buying Power, 2010 and 2017 (percentage)
U.S. MississippiRace 2010 2017 2010 2017
Source: Selig Center for Economic Growth, Terry College of Business, The University of Georgia, June 2017.
MIS
SISS
IPPI
Total 29.9 20.3 45 White 27.2 18.6 45 Black 32.5 23.6 45 American Indian 36.9 25.3 44 Asian 62.8 52.1 44 Multiracial 50.0 37.1 43 Hispanic/ Latino 47.1 31.7 49 Non Hispanic 28.2 20.1 43
Total 100.0 100.0 100.0 100.0White 84.1 82.3 73.9 72.8Black 8.5 8.7 24.1 24.7American Indian 0.7 0.8 0.4 0.4Asian 5.4 6.8 1.1 1.4Multiracial 1.3 1.5 0.6 0.7Hispanic/ Latino 9.0 10.2 1.9 2.1Non Hispanic 91.0 89.8 98.1 97.9
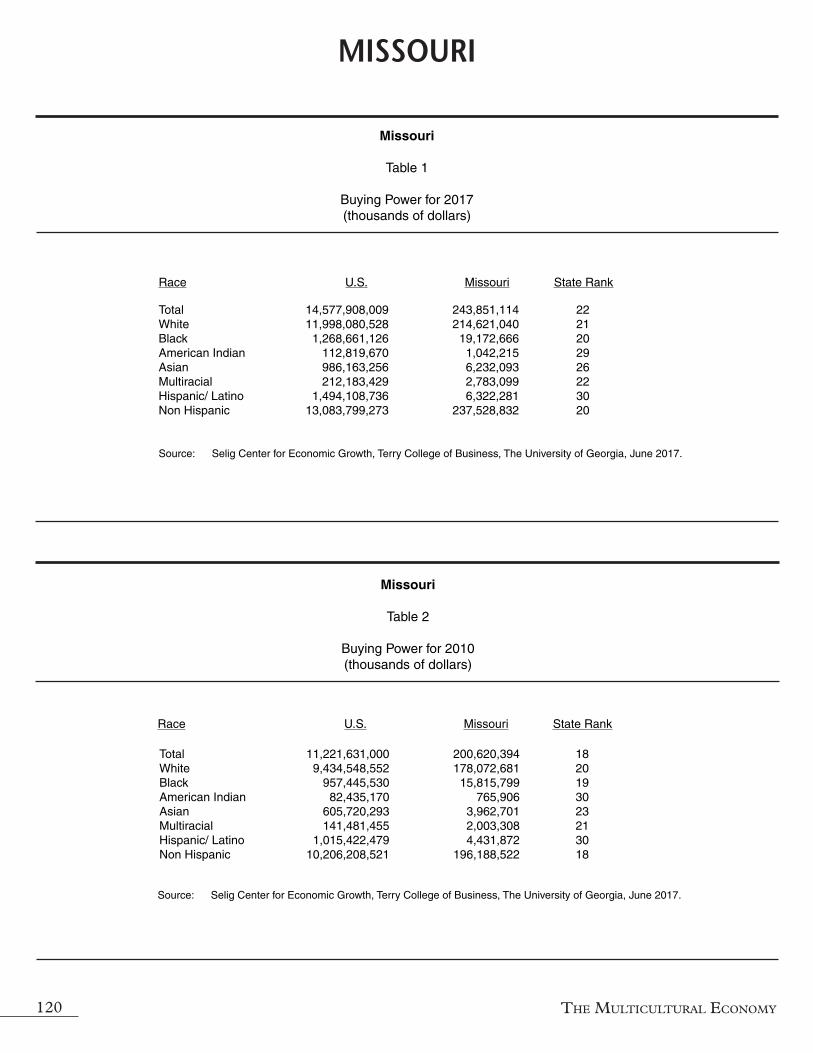
The MulTiculTural econoMy120
Missouri
Table 1
Buying Power for 2017(thousands of dollars)
Race U.S. Missouri State Rank
Source: Selig Center for Economic Growth, Terry College of Business, The University of Georgia, June 2017.
Missouri
Table 2
Buying Power for 2010(thousands of dollars)
Race U.S. Missouri State Rank
Source: Selig Center for Economic Growth, Terry College of Business, The University of Georgia, June 2017.
MISSOURI
Total 14,577,908,009 243,851,114 22 White 11,998,080,528 214,621,040 21 Black 1,268,661,126 19,172,666 20 American Indian 112,819,670 1,042,215 29 Asian 986,163,256 6,232,093 26 Multiracial 212,183,429 2,783,099 22 Hispanic/ Latino 1,494,108,736 6,322,281 30 Non Hispanic 13,083,799,273 237,528,832 20
Total 11,221,631,000 200,620,394 18 White 9,434,548,552 178,072,681 20 Black 957,445,530 15,815,799 19 American Indian 82,435,170 765,906 30 Asian 605,720,293 3,962,701 23 Multiracial 141,481,455 2,003,308 21 Hispanic/ Latino 1,015,422,479 4,431,872 30 Non Hispanic 10,206,208,521 196,188,522 18

Selig Center for eConomiC growth 121
Missouri
Table 3
Percentage Change in Buying Power, 2010-2017,and State Rank
U.S. Missouri Race 2010-2017 2010-2017 State Rank
Source: Selig Center for Economic Growth, Terry College of Business, The University of Georgia, June 2017.
Missouri
Table 4
Market Share in Buying Power, 2010 and 2017 (percentage)
U.S. MissouriRace 2010 2017 2010 2017
Source: Selig Center for Economic Growth, Terry College of Business, The University of Georgia, June 2017.
MIS
SOU
RI
Total 29.9 21.5 43 White 27.2 20.5 40 Black 32.5 21.2 50 American Indian 36.9 36.1 24 Asian 62.8 57.3 41 Multiracial 50.0 38.9 40 Hispanic/ Latino 47.1 42.7 39 Non Hispanic 28.2 21.1 42
Total 100.0 100.0 100.0 100.0White 84.1 82.3 88.8 88.0Black 8.5 8.7 7.9 7.9American Indian 0.7 0.8 0.4 0.4Asian 5.4 6.8 2.0 2.6Multiracial 1.3 1.5 1.0 1.1Hispanic/ Latino 9.0 10.2 2.2 2.6Non Hispanic 91.0 89.8 97.8 97.4

The MulTiculTural econoMy122
MONTANA
Montana
Table 1
Buying Power for 2017(thousands of dollars)
Race U.S. Montana State Rank
Source: Selig Center for Economic Growth, Terry College of Business, The University of Georgia, June 2017.
Montana
Table 2
Buying Power for 2010(thousands of dollars)
Race U.S. Montana State Rank
Source: Selig Center for Economic Growth, Terry College of Business, The University of Georgia, June 2017.
Total 14,577,908,009 40,188,528 46 White 11,998,080,528 37,851,828 43 Black 1,268,661,126 175,577 51 American Indian 112,819,670 1,262,841 24 Asian 986,163,256 352,554 50 Multiracial 212,183,429 545,729 45 Hispanic/ Latino 1,494,108,736 970,918 46 Non Hispanic 13,083,799,273 39,217,611 46
Total 11,221,631,000 32,083,978 46 White 9,434,548,552 30,407,890 43 Black 957,445,530 97,288 51 American Indian 82,435,170 1,001,957 22 Asian 605,720,293 199,284 50 Multiracial 141,481,455 377,560 45 Hispanic/ Latino 1,015,422,479 572,060 46 Non Hispanic 10,206,208,521 31,511,918 45

Selig Center for eConomiC growth 123
MO
NTA
NA
Montana
Table 3
Percentage Change in Buying Power, 2010-2017,and State Rank
U.S. Montana Race 2010-2017 2010-2017 State Rank
Source: Selig Center for Economic Growth, Terry College of Business, The University of Georgia, June 2017.
Montana
Table 4
Market Share in Buying Power, 2010 and 2017 (percentage)
U.S. MontanaRace 2010 2017 2010 2017
Source: Selig Center for Economic Growth, Terry College of Business, The University of Georgia, June 2017.
Total 29.9 25.3 34 White 27.2 24.5 31 Black 32.5 80.5 5 American Indian 36.9 26.0 41 Asian 62.8 76.9 14 Multiracial 50.0 44.5 28 Hispanic/ Latino 47.1 69.7 4 Non Hispanic 28.2 24.5 34
Total 100.0 100.0 100.0 100.0White 84.1 82.3 94.8 94.2Black 8.5 8.7 0.3 0.4American Indian 0.7 0.8 3.1 3.1Asian 5.4 6.8 0.6 0.9Multiracial 1.3 1.5 1.2 1.4Hispanic/ Latino 9.0 10.2 1.8 2.4Non Hispanic 91.0 89.8 98.2 97.6
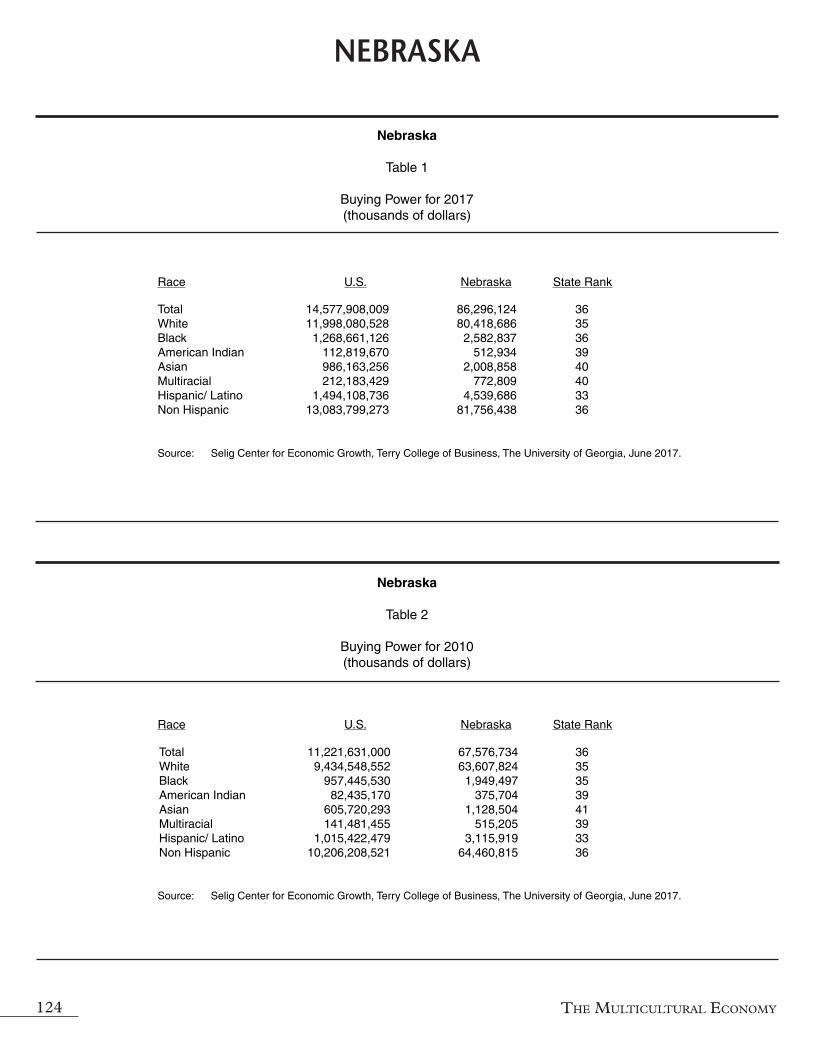
The MulTiculTural econoMy124
Nebraska
Table 1
Buying Power for 2017(thousands of dollars)
Race U.S. Nebraska State Rank
Source: Selig Center for Economic Growth, Terry College of Business, The University of Georgia, June 2017.
Nebraska
Table 2
Buying Power for 2010(thousands of dollars)
Race U.S. Nebraska State Rank
Source: Selig Center for Economic Growth, Terry College of Business, The University of Georgia, June 2017.
NEBRASKA
Total 14,577,908,009 86,296,124 36 White 11,998,080,528 80,418,686 35 Black 1,268,661,126 2,582,837 36 American Indian 112,819,670 512,934 39 Asian 986,163,256 2,008,858 40 Multiracial 212,183,429 772,809 40 Hispanic/ Latino 1,494,108,736 4,539,686 33 Non Hispanic 13,083,799,273 81,756,438 36
Total 11,221,631,000 67,576,734 36 White 9,434,548,552 63,607,824 35 Black 957,445,530 1,949,497 35 American Indian 82,435,170 375,704 39 Asian 605,720,293 1,128,504 41 Multiracial 141,481,455 515,205 39 Hispanic/ Latino 1,015,422,479 3,115,919 33 Non Hispanic 10,206,208,521 64,460,815 36

Selig Center for eConomiC growth 125
Nebraska
Table 3
Percentage Change in Buying Power, 2010-2017,and State Rank
U.S. Nebraska Race 2010-2017 2010-2017 State Rank
Source: Selig Center for Economic Growth, Terry College of Business, The University of Georgia, June 2017.
Nebraska
Table 4
Market Share in Buying Power, 2010 and 2017 (percentage)
U.S. NebraskaRace 2010 2017 2010 2017
Source: Selig Center for Economic Growth, Terry College of Business, The University of Georgia, June 2017.
NEB
RA
SKA
Total 29.9 27.7 26 White 27.2 26.4 22 Black 32.5 32.5 30 American Indian 36.9 36.5 21 Asian 62.8 78.0 12 Multiracial 50.0 50.0 19 Hispanic/ Latino 47.1 45.7 30 Non Hispanic 28.2 26.8 27
Total 100.0 100.0 100.0 100.0White 84.1 82.3 94.1 93.2Black 8.5 8.7 2.9 3.0American Indian 0.7 0.8 0.6 0.6Asian 5.4 6.8 1.7 2.3Multiracial 1.3 1.5 0.8 0.9Hispanic/ Latino 9.0 10.2 4.6 5.3Non Hispanic 91.0 89.8 95.4 94.7

The MulTiculTural econoMy126
NEVADA
Nevada
Table 1
Buying Power for 2017(thousands of dollars)
Race U.S. Nevada State Rank
Source: Selig Center for Economic Growth, Terry College of Business, The University of Georgia, June 2017.
Nevada
Table 2
Buying Power for 2010(thousands of dollars)
Race U.S. Nevada State Rank
Source: Selig Center for Economic Growth, Terry College of Business, The University of Georgia, June 2017.
Total 14,577,908,009 119,917,927 32 White 11,998,080,528 96,053,502 33 Black 1,268,661,126 8,561,705 29 American Indian 112,819,670 1,345,349 20 Asian 986,163,256 11,056,991 19 Multiracial 212,183,429 2,900,380 21 Hispanic/ Latino 1,494,108,736 19,256,382 15 Non Hispanic 13,083,799,273 100,661,545 34
Total 11,221,631,000 91,178,563 32 White 9,434,548,552 75,596,814 33 Black 957,445,530 5,781,247 30 American Indian 82,435,170 972,985 23 Asian 605,720,293 6,957,765 18 Multiracial 141,481,455 1,869,751 22 Hispanic/ Latino 1,015,422,479 13,372,279 15 Non Hispanic 10,206,208,521 77,806,284 34

Selig Center for eConomiC growth 127
NEV
AD
A
Nevada
Table 3
Percentage Change in Buying Power, 2010-2017,and State Rank
U.S. Nevada Race 2010-2017 2010-2017 State Rank
Source: Selig Center for Economic Growth, Terry College of Business, The University of Georgia, June 2017.
Nevada
Table 4
Market Share in Buying Power, 2010 and 2017 (percentage)
U.S. NevadaRace 2010 2017 2010 2017
Source: Selig Center for Economic Growth, Terry College of Business, The University of Georgia, June 2017.
Total 29.9 31.5 13 White 27.2 27.1 17 Black 32.5 48.1 16 American Indian 36.9 38.3 17 Asian 62.8 58.9 38 Multiracial 50.0 55.1 10 Hispanic/ Latino 47.1 44.0 35 Non Hispanic 28.2 29.4 13
Total 100.0 100.0 100.0 100.0White 84.1 82.3 82.9 80.1Black 8.5 8.7 6.3 7.1American Indian 0.7 0.8 1.1 1.1Asian 5.4 6.8 7.6 9.2Multiracial 1.3 1.5 2.1 2.4Hispanic/ Latino 9.0 10.2 14.7 16.1Non Hispanic 91.0 89.8 85.3 83.9

The MulTiculTural econoMy128
New Hampshire
Table 1
Buying Power for 2017(thousands of dollars)
Race U.S. New Hampshire State Rank
Source: Selig Center for Economic Growth, Terry College of Business, The University of Georgia, June 2017.
New Hampshire
Table 2
Buying Power for 2010(thousands of dollars)
Race U.S. New Hampshire State Rank
Source: Selig Center for Economic Growth, Terry College of Business, The University of Georgia, June 2017.
NEW HAMPSHIRE
Total 14,577,908,009 72,380,493 38 White 11,998,080,528 68,839,848 37 Black 1,268,661,126 739,708 44 American Indian 112,819,670 136,100 49 Asian 986,163,256 2,010,511 39 Multiracial 212,183,429 654,325 42 Hispanic/ Latino 1,494,108,736 1,511,299 45 Non Hispanic 13,083,799,273 70,869,194 37
Total 11,221,631,000 57,031,089 38 White 9,434,548,552 54,788,456 38 Black 957,445,530 473,462 44 American Indian 82,435,170 98,685 49 Asian 605,720,293 1,217,188 39 Multiracial 141,481,455 453,298 43 Hispanic/ Latino 1,015,422,479 920,144 45 Non Hispanic 10,206,208,521 56,110,945 37

Selig Center for eConomiC growth 129
New Hampshire
Table 3
Percentage Change in Buying Power, 2010-2017,and State Rank
U.S. New Hampshire Race 2010-2017 2010-2017 State Rank
Source: Selig Center for Economic Growth, Terry College of Business, The University of Georgia, June 2017.
New Hampshire
Table 4
Market Share in Buying Power, 2010 and 2017 (percentage)
U.S. New HampshireRace 2010 2017 2010 2017
Source: Selig Center for Economic Growth, Terry College of Business, The University of Georgia, June 2017.
NEW
HA
MPS
HIR
E
Total 29.9 26.9 30 White 27.2 25.6 26 Black 32.5 56.2 8 American Indian 36.9 37.9 19 Asian 62.8 65.2 27 Multiracial 50.0 44.3 29 Hispanic/ Latino 47.1 64.2 6 Non Hispanic 28.2 26.3 28
Total 100.0 100.0 100.0 100.0White 84.1 82.3 96.1 95.1Black 8.5 8.7 0.8 1.0American Indian 0.7 0.8 0.2 0.2Asian 5.4 6.8 2.1 2.8Multiracial 1.3 1.5 0.8 0.9Hispanic/ Latino 9.0 10.2 1.6 2.1Non Hispanic 91.0 89.8 98.4 97.9

The MulTiculTural econoMy130
NEW JERSEY
New Jersey
Table 1
Buying Power for 2017(thousands of dollars)
Race U.S. New Jersey State Rank
Source: Selig Center for Economic Growth, Terry College of Business, The University of Georgia, June 2017.
New Jersey
Table 2
Buying Power for 2010(thousands of dollars)
Race U.S. New Jersey State Rank
Source: Selig Center for Economic Growth, Terry College of Business, The University of Georgia, June 2017.
Total 14,577,908,009 492,566,043 7 White 11,998,080,528 382,039,393 8 Black 1,268,661,126 46,494,693 10 American Indian 112,819,670 1,619,140 18 Asian 986,163,256 57,038,939 4 Multiracial 212,183,429 5,373,878 10 Hispanic/ Latino 1,494,108,736 54,007,746 6 Non Hispanic 13,083,799,273 438,558,297 8
Total 11,221,631,000 400,167,225 7 White 9,434,548,552 321,207,478 8 Black 957,445,530 36,691,824 10 American Indian 82,435,170 1,306,251 17 Asian 605,720,293 37,233,044 4 Multiracial 141,481,455 3,728,628 10 Hispanic/ Latino 1,015,422,479 37,991,053 6 Non Hispanic 10,206,208,521 362,176,172 8

Selig Center for eConomiC growth 131
NEW
JER
SEY
New Jersey
Table 3
Percentage Change in Buying Power, 2010-2017,and State Rank
U.S. New Jersey Race 2010-2017 2010-2017 State Rank
Source: Selig Center for Economic Growth, Terry College of Business, The University of Georgia, June 2017.
New Jersey
Table 4
Market Share in Buying Power, 2010 and 2017 (percentage)
U.S. New JerseyRace 2010 2017 2010 2017
Source: Selig Center for Economic Growth, Terry College of Business, The University of Georgia, June 2017.
Total 29.9 23.1 39 White 27.2 18.9 44 Black 32.5 26.7 40 American Indian 36.9 24.0 47 Asian 62.8 53.2 43 Multiracial 50.0 44.1 30 Hispanic/ Latino 47.1 42.2 42 Non Hispanic 28.2 21.1 41
Total 100.0 100.0 100.0 100.0White 84.1 82.3 80.3 77.6Black 8.5 8.7 9.2 9.4American Indian 0.7 0.8 0.3 0.3Asian 5.4 6.8 9.3 11.6Multiracial 1.3 1.5 0.9 1.1Hispanic/ Latino 9.0 10.2 9.5 11.0Non Hispanic 91.0 89.8 90.5 89.0
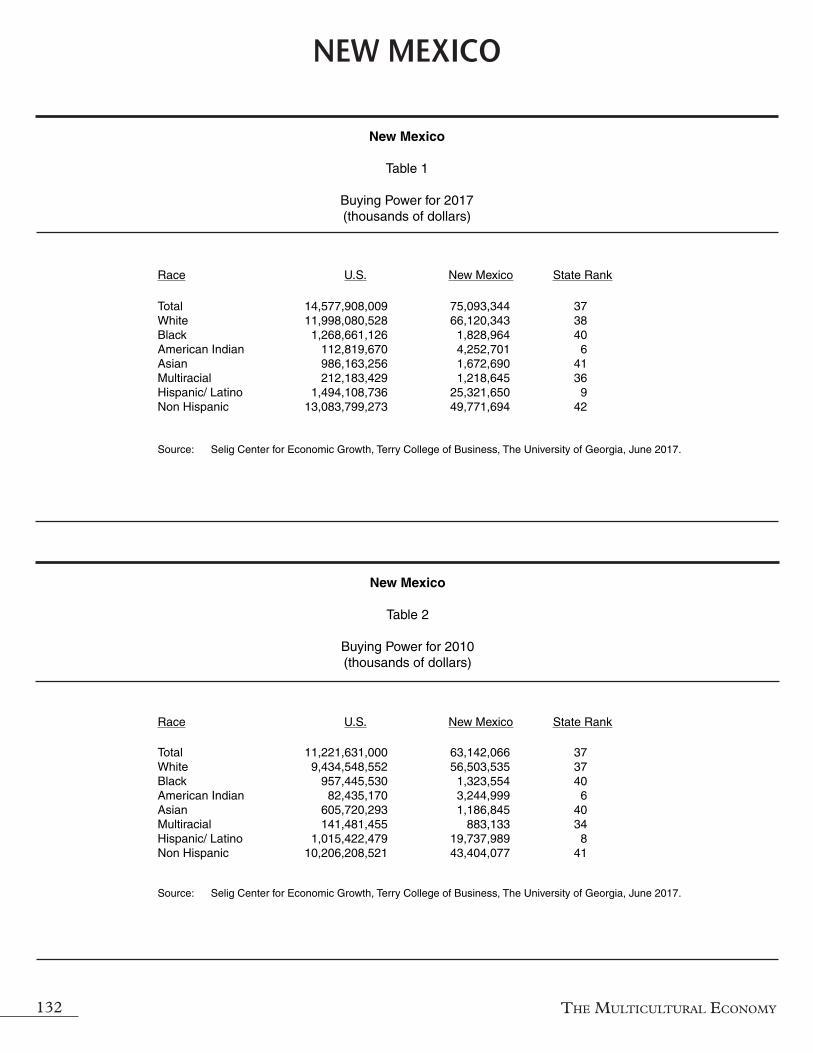
The MulTiculTural econoMy132
New Mexico
Table 1
Buying Power for 2017(thousands of dollars)
Race U.S. New Mexico State Rank
Source: Selig Center for Economic Growth, Terry College of Business, The University of Georgia, June 2017.
New Mexico
Table 2
Buying Power for 2010(thousands of dollars)
Race U.S. New Mexico State Rank
Source: Selig Center for Economic Growth, Terry College of Business, The University of Georgia, June 2017.
NEW MEXICO
Total 14,577,908,009 75,093,344 37 White 11,998,080,528 66,120,343 38 Black 1,268,661,126 1,828,964 40 American Indian 112,819,670 4,252,701 6 Asian 986,163,256 1,672,690 41 Multiracial 212,183,429 1,218,645 36 Hispanic/ Latino 1,494,108,736 25,321,650 9 Non Hispanic 13,083,799,273 49,771,694 42
Total 11,221,631,000 63,142,066 37 White 9,434,548,552 56,503,535 37 Black 957,445,530 1,323,554 40 American Indian 82,435,170 3,244,999 6 Asian 605,720,293 1,186,845 40 Multiracial 141,481,455 883,133 34 Hispanic/ Latino 1,015,422,479 19,737,989 8 Non Hispanic 10,206,208,521 43,404,077 41
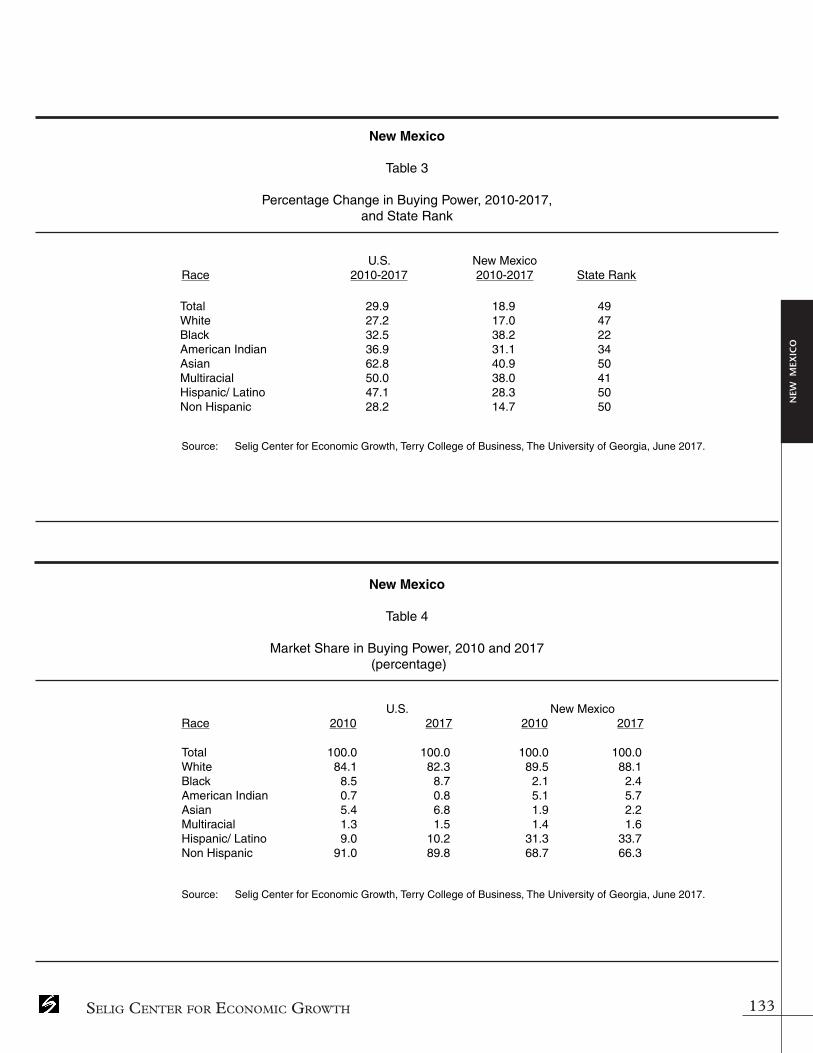
Selig Center for eConomiC growth 133
New Mexico
Table 3
Percentage Change in Buying Power, 2010-2017,and State Rank
U.S. New Mexico Race 2010-2017 2010-2017 State Rank
Source: Selig Center for Economic Growth, Terry College of Business, The University of Georgia, June 2017.
New Mexico
Table 4
Market Share in Buying Power, 2010 and 2017 (percentage)
U.S. New MexicoRace 2010 2017 2010 2017
Source: Selig Center for Economic Growth, Terry College of Business, The University of Georgia, June 2017.
NEW
MEX
ICO
Total 29.9 18.9 49 White 27.2 17.0 47 Black 32.5 38.2 22 American Indian 36.9 31.1 34 Asian 62.8 40.9 50 Multiracial 50.0 38.0 41 Hispanic/ Latino 47.1 28.3 50 Non Hispanic 28.2 14.7 50
Total 100.0 100.0 100.0 100.0White 84.1 82.3 89.5 88.1Black 8.5 8.7 2.1 2.4American Indian 0.7 0.8 5.1 5.7Asian 5.4 6.8 1.9 2.2Multiracial 1.3 1.5 1.4 1.6Hispanic/ Latino 9.0 10.2 31.3 33.7Non Hispanic 91.0 89.8 68.7 66.3

The MulTiculTural econoMy134
New York
Table 1
Buying Power for 2017(thousands of dollars)
Race U.S. New York State Rank
Source: Selig Center for Economic Growth, Terry College of Business, The University of Georgia, June 2017.
New York
Table 2
Buying Power for 2010(thousands of dollars)
Race U.S. New York State Rank
Source: Selig Center for Economic Growth, Terry College of Business, The University of Georgia, June 2017.
NEW YORK
Total 14,577,908,009 1,034,403,792 3 White 11,998,080,528 810,837,730 3 Black 1,268,661,126 115,683,174 2 American Indian 112,819,670 5,632,250 5 Asian 986,163,256 87,882,434 2 Multiracial 212,183,429 14,368,204 3 Hispanic/ Latino 1,494,108,736 109,289,243 4 Non Hispanic 13,083,799,273 925,114,549 3
Total 11,221,631,000 803,888,456 3 White 9,434,548,552 646,250,756 3 Black 957,445,530 88,456,104 1 American Indian 82,435,170 4,181,101 5 Asian 605,720,293 55,500,073 2 Multiracial 141,481,455 9,500,422 2 Hispanic/ Latino 1,015,422,479 76,613,467 4 Non Hispanic 10,206,208,521 727,274,989 2

Selig Center for eConomiC growth 135
New York
Table 3
Percentage Change in Buying Power, 2010-2017,and State Rank
U.S. New York Race 2010-2017 2010-2017 State Rank
Source: Selig Center for Economic Growth, Terry College of Business, The University of Georgia, June 2017.
New York
Table 4
Market Share in Buying Power, 2010 and 2017 (percentage)
U.S. New YorkRace 2010 2017 2010 2017
Source: Selig Center for Economic Growth, Terry College of Business, The University of Georgia, June 2017.
NEW
YO
RK
Total 29.9 28.7 20 White 27.2 25.5 27 Black 32.5 30.8 34 American Indian 36.9 34.7 25 Asian 62.8 58.3 39 Multiracial 50.0 51.2 17 Hispanic/ Latino 47.1 42.7 40 Non Hispanic 28.2 27.2 22
Total 100.0 100.0 100.0 100.0White 84.1 82.3 80.4 78.4Black 8.5 8.7 11.0 11.2American Indian 0.7 0.8 0.5 0.5Asian 5.4 6.8 6.9 8.5Multiracial 1.3 1.5 1.2 1.4Hispanic/ Latino 9.0 10.2 9.5 10.6Non Hispanic 91.0 89.8 90.5 89.4
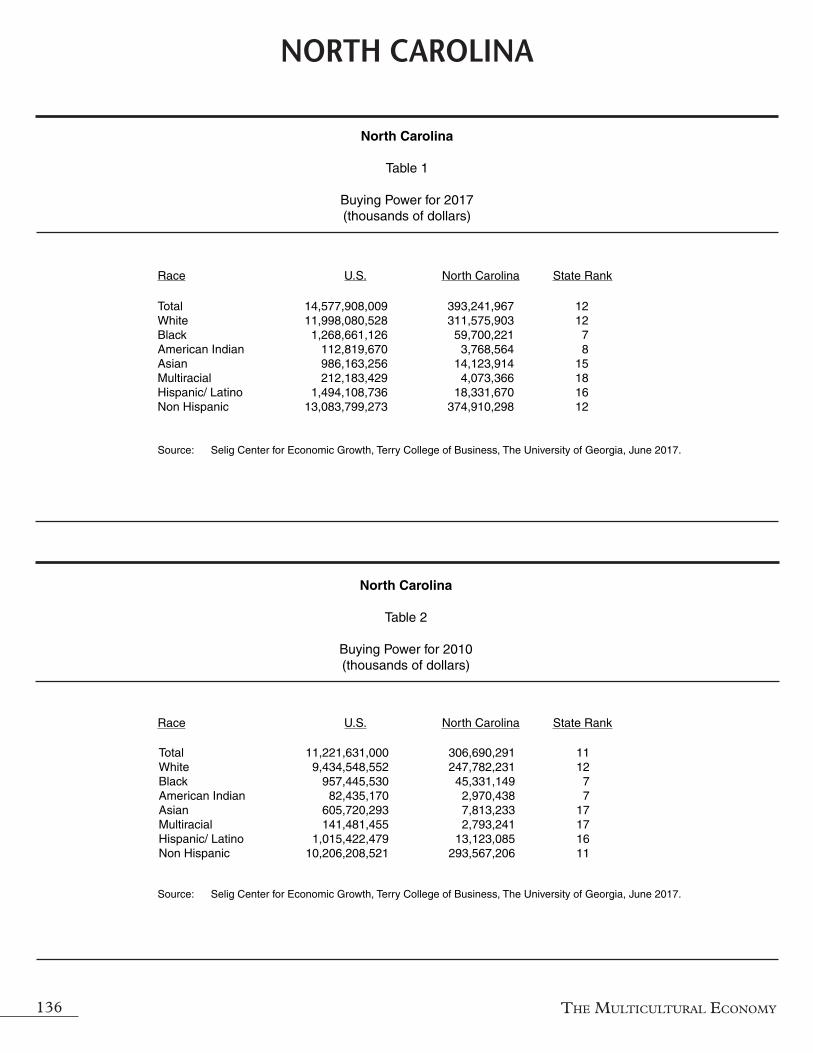
The MulTiculTural econoMy136
NORTH CAROLINA
North Carolina
Table 1
Buying Power for 2017(thousands of dollars)
Race U.S. North Carolina State Rank
Source: Selig Center for Economic Growth, Terry College of Business, The University of Georgia, June 2017.
North Carolina
Table 2
Buying Power for 2010(thousands of dollars)
Race U.S. North Carolina State Rank
Source: Selig Center for Economic Growth, Terry College of Business, The University of Georgia, June 2017.
Total 14,577,908,009 393,241,967 12 White 11,998,080,528 311,575,903 12 Black 1,268,661,126 59,700,221 7 American Indian 112,819,670 3,768,564 8 Asian 986,163,256 14,123,914 15 Multiracial 212,183,429 4,073,366 18 Hispanic/ Latino 1,494,108,736 18,331,670 16 Non Hispanic 13,083,799,273 374,910,298 12
Total 11,221,631,000 306,690,291 11 White 9,434,548,552 247,782,231 12 Black 957,445,530 45,331,149 7 American Indian 82,435,170 2,970,438 7 Asian 605,720,293 7,813,233 17 Multiracial 141,481,455 2,793,241 17 Hispanic/ Latino 1,015,422,479 13,123,085 16 Non Hispanic 10,206,208,521 293,567,206 11

Selig Center for eConomiC growth 137
NO
RTH
CA
RO
LIN
A
North Carolina
Table 3
Percentage Change in Buying Power, 2010-2017,and State Rank
U.S. North Carolina Race 2010-2017 2010-2017 State Rank
Source: Selig Center for Economic Growth, Terry College of Business, The University of Georgia, June 2017.
North Carolina
Table 4
Market Share in Buying Power, 2010 and 2017 (percentage)
U.S. North CarolinaRace 2010 2017 2010 2017
Source: Selig Center for Economic Growth, Terry College of Business, The University of Georgia, June 2017.
Total 29.9 28.2 23 White 27.2 25.7 25 Black 32.5 31.7 32 American Indian 36.9 26.9 40 Asian 62.8 80.8 9 Multiracial 50.0 45.8 24 Hispanic/ Latino 47.1 39.7 45 Non Hispanic 28.2 27.7 19
Total 100.0 100.0 100.0 100.0White 84.1 82.3 80.8 79.2Black 8.5 8.7 14.8 15.2American Indian 0.7 0.8 1.0 1.0Asian 5.4 6.8 2.5 3.6Multiracial 1.3 1.5 0.9 1.0Hispanic/ Latino 9.0 10.2 4.3 4.7Non Hispanic 91.0 89.8 95.7 95.3

The MulTiculTural econoMy138
NORTH DAKOTA
North Dakota
Table 1
Buying Power for 2017(thousands of dollars)
Race U.S. North Dakota State Rank
Source: Selig Center for Economic Growth, Terry College of Business, The University of Georgia, June 2017.
North Dakota
Table 2
Buying Power for 2010(thousands of dollars)
Race U.S. North Dakota State Rank
Source: Selig Center for Economic Growth, Terry College of Business, The University of Georgia, June 2017.
Total 14,577,908,009 38,843,009 47 White 11,998,080,528 36,250,500 44 Black 1,268,661,126 646,719 45 American Indian 112,819,670 945,176 33 Asian 986,163,256 588,403 47 Multiracial 212,183,429 412,213 49 Hispanic/ Latino 1,494,108,736 915,584 47 Non Hispanic 13,083,799,273 37,927,425 47
Total 11,221,631,000 26,870,017 49 White 9,434,548,552 25,489,447 47 Black 957,445,530 194,462 48 American Indian 82,435,170 669,873 33 Asian 605,720,293 302,234 47 Multiracial 141,481,455 214,001 50 Hispanic/ Latino 1,015,422,479 316,046 50 Non Hispanic 10,206,208,521 26,553,971 49

Selig Center for eConomiC growth 139
NO
RTH
DA
KO
TA
North Dakota
Table 3
Percentage Change in Buying Power, 2010-2017,and State Rank
U.S. North Dakota Race 2010-2017 2010-2017 State Rank
Source: Selig Center for Economic Growth, Terry College of Business, The University of Georgia, June 2017.
North Dakota
Table 4
Market Share in Buying Power, 2010 and 2017 (percentage)
U.S. North DakotaRace 2010 2017 2010 2017
Source: Selig Center for Economic Growth, Terry College of Business, The University of Georgia, June 2017.
Total 29.9 44.6 3 White 27.2 42.2 4 Black 32.5 232.6 1 American Indian 36.9 41.1 12 Asian 62.8 94.7 2 Multiracial 50.0 92.6 1 Hispanic/ Latino 47.1 189.7 1 Non Hispanic 28.2 42.8 3
Total 100.0 100.0 100.0 100.0White 84.1 82.3 94.9 93.3Black 8.5 8.7 0.7 1.7American Indian 0.7 0.8 2.5 2.4Asian 5.4 6.8 1.1 1.5Multiracial 1.3 1.5 0.8 1.1Hispanic/ Latino 9.0 10.2 1.2 2.4Non Hispanic 91.0 89.8 98.8 97.6

The MulTiculTural econoMy140
Ohio
Table 1
Buying Power for 2017(thousands of dollars)
Race U.S. Ohio State Rank
Source: Selig Center for Economic Growth, Terry College of Business, The University of Georgia, June 2017.
Ohio
Table 2
Buying Power for 2010(thousands of dollars)
Race U.S. Ohio State Rank
Source: Selig Center for Economic Growth, Terry College of Business, The University of Georgia, June 2017.
OHIO
Total 14,577,908,009 476,751,496 8 White 11,998,080,528 418,451,672 7 Black 1,268,661,126 38,502,520 12 American Indian 112,819,670 987,302 32 Asian 986,163,256 14,071,205 16 Multiracial 212,183,429 4,738,797 12 Hispanic/ Latino 1,494,108,736 11,005,891 21 Non Hispanic 13,083,799,273 465,745,605 7
Total 11,221,631,000 378,781,433 8 White 9,434,548,552 336,214,142 7 Black 957,445,530 30,278,892 13 American Indian 82,435,170 714,093 31 Asian 605,720,293 8,242,469 15 Multiracial 141,481,455 3,331,837 13 Hispanic/ Latino 1,015,422,479 7,261,153 21 Non Hispanic 10,206,208,521 371,520,280 7

Selig Center for eConomiC growth 141
Ohio
Table 3
Percentage Change in Buying Power, 2010-2017,and State Rank
U.S. Ohio Race 2010-2017 2010-2017 State Rank
Source: Selig Center for Economic Growth, Terry College of Business, The University of Georgia, June 2017.
Ohio
Table 4
Market Share in Buying Power, 2010 and 2017 (percentage)
U.S. OhioRace 2010 2017 2010 2017
Source: Selig Center for Economic Growth, Terry College of Business, The University of Georgia, June 2017.
OH
IO
Total 29.9 25.9 32 White 27.2 24.5 32 Black 32.5 27.2 37 American Indian 36.9 38.3 18 Asian 62.8 70.7 21 Multiracial 50.0 42.2 33 Hispanic/ Latino 47.1 51.6 20 Non Hispanic 28.2 25.4 32
Total 100.0 100.0 100.0 100.0White 84.1 82.3 88.8 87.8Black 8.5 8.7 8.0 8.1American Indian 0.7 0.8 0.2 0.2Asian 5.4 6.8 2.2 3.0Multiracial 1.3 1.5 0.9 1.0Hispanic/ Latino 9.0 10.2 1.9 2.3Non Hispanic 91.0 89.8 98.1 97.7

The MulTiculTural econoMy142
Oklahoma
Table 1
Buying Power for 2017(thousands of dollars)
Race U.S. Oklahoma State Rank
Source: Selig Center for Economic Growth, Terry College of Business, The University of Georgia, June 2017.
Oklahoma
Table 2
Buying Power for 2010(thousands of dollars)
Race U.S. Oklahoma State Rank
Source: Selig Center for Economic Growth, Terry College of Business, The University of Georgia, June 2017.
OKLAHOMA
Total 14,577,908,009 169,190,775 27 White 11,998,080,528 139,228,554 29 Black 1,268,661,126 8,995,300 28 American Indian 112,819,670 10,828,970 2 Asian 986,163,256 4,043,091 29 Multiracial 212,183,429 6,094,860 8 Hispanic/ Latino 1,494,108,736 9,487,938 23 Non Hispanic 13,083,799,273 159,702,837 27
Total 11,221,631,000 123,903,177 28 White 9,434,548,552 103,472,531 29 Black 957,445,530 6,426,646 29 American Indian 82,435,170 7,605,739 2 Asian 605,720,293 2,202,264 29 Multiracial 141,481,455 4,195,998 8 Hispanic/ Latino 1,015,422,479 5,852,076 24 Non Hispanic 10,206,208,521 118,051,101 28

Selig Center for eConomiC growth 143
Oklahoma
Table 3
Percentage Change in Buying Power, 2010-2017,and State Rank
U.S. Oklahoma Race 2010-2017 2010-2017 State Rank
Source: Selig Center for Economic Growth, Terry College of Business, The University of Georgia, June 2017.
Oklahoma
Table 4
Market Share in Buying Power, 2010 and 2017 (percentage)
U.S. OklahomaRace 2010 2017 2010 2017
Source: Selig Center for Economic Growth, Terry College of Business, The University of Georgia, June 2017.
OK
LAH
OM
A
Total 29.9 36.6 9 White 27.2 34.6 8 Black 32.5 40.0 21 American Indian 36.9 42.4 9 Asian 62.8 83.6 7 Multiracial 50.0 45.3 27 Hispanic/ Latino 47.1 62.1 8 Non Hispanic 28.2 35.3 8
Total 100.0 100.0 100.0 100.0White 84.1 82.3 83.5 82.3Black 8.5 8.7 5.2 5.3American Indian 0.7 0.8 6.1 6.4Asian 5.4 6.8 1.8 2.4Multiracial 1.3 1.5 3.4 3.6Hispanic/ Latino 9.0 10.2 4.7 5.6Non Hispanic 91.0 89.8 95.3 94.4

The MulTiculTural econoMy144
Oregon
Table 1
Buying Power for 2017(thousands of dollars)
Race U.S. Oregon State Rank
Source: Selig Center for Economic Growth, Terry College of Business, The University of Georgia, June 2017.
Oregon
Table 2
Buying Power for 2010(thousands of dollars)
Race U.S. Oregon State Rank
Source: Selig Center for Economic Growth, Terry College of Business, The University of Georgia, June 2017.
OREGON
Total 14,577,908,009 168,296,651 28 White 11,998,080,528 151,797,992 24 Black 1,268,661,126 2,373,059 38 American Indian 112,819,670 1,846,789 14 Asian 986,163,256 8,774,298 21 Multiracial 212,183,429 3,504,513 20 Hispanic/ Latino 1,494,108,736 11,230,110 20 Non Hispanic 13,083,799,273 157,066,541 29
Total 11,221,631,000 122,776,471 29 White 9,434,548,552 112,571,925 27 Black 957,445,530 1,601,321 38 American Indian 82,435,170 1,310,518 16 Asian 605,720,293 5,050,118 21 Multiracial 141,481,455 2,242,590 20 Hispanic/ Latino 1,015,422,479 7,195,625 22 Non Hispanic 10,206,208,521 115,580,846 29

Selig Center for eConomiC growth 145
Oregon
Table 3
Percentage Change in Buying Power, 2010-2017,and State Rank
U.S. Oregon Race 2010-2017 2010-2017 State Rank
Source: Selig Center for Economic Growth, Terry College of Business, The University of Georgia, June 2017.
Oregon
Table 4
Market Share in Buying Power, 2010 and 2017 (percentage)
U.S. OregonRace 2010 2017 2010 2017
Source: Selig Center for Economic Growth, Terry College of Business, The University of Georgia, June 2017.
OR
EGO
N
Total 29.9 37.1 7 White 27.2 34.8 7 Black 32.5 48.2 15 American Indian 36.9 40.9 14 Asian 62.8 73.7 17 Multiracial 50.0 56.3 9 Hispanic/ Latino 47.1 56.1 13 Non Hispanic 28.2 35.9 7
Total 100.0 100.0 100.0 100.0White 84.1 82.3 91.7 90.2Black 8.5 8.7 1.3 1.4American Indian 0.7 0.8 1.1 1.1Asian 5.4 6.8 4.1 5.2Multiracial 1.3 1.5 1.8 2.1Hispanic/ Latino 9.0 10.2 5.9 6.7Non Hispanic 91.0 89.8 94.1 93.3

The MulTiculTural econoMy146
PENNSYLVANIA
Pennsylvania
Table 1
Buying Power for 2017(thousands of dollars)
Race U.S. Pennsylvania State Rank
Source: Selig Center for Economic Growth, Terry College of Business, The University of Georgia, June 2017.
Pennsylvania
Table 2
Buying Power for 2010(thousands of dollars)
Race U.S. Pennsylvania State Rank
Source: Selig Center for Economic Growth, Terry College of Business, The University of Georgia, June 2017.
Total 14,577,908,009 597,254,072 6 White 11,998,080,528 524,072,066 5 Black 1,268,661,126 43,106,634 11 American Indian 112,819,670 1,292,963 23 Asian 986,163,256 23,500,306 11 Multiracial 212,183,429 5,282,103 11 Hispanic/ Latino 1,494,108,736 22,254,717 12 Non Hispanic 13,083,799,273 574,999,355 5
Total 11,221,631,000 480,759,863 5 White 9,434,548,552 428,110,890 5 Black 957,445,530 33,849,730 11 American Indian 82,435,170 949,784 24 Asian 605,720,293 14,239,994 12 Multiracial 141,481,455 3,609,466 11 Hispanic/ Latino 1,015,422,479 14,106,886 13 Non Hispanic 10,206,208,521 466,652,977 5

Selig Center for eConomiC growth 147
PEN
NSY
LVA
NIA
Pennsylvania
Table 3
Percentage Change in Buying Power, 2010-2017,and State Rank
U.S. Pennsylvania Race 2010-2017 2010-2017 State Rank
Source: Selig Center for Economic Growth, Terry College of Business, The University of Georgia, June 2017.
Pennsylvania
Table 4
Market Share in Buying Power, 2010 and 2017 (percentage)
U.S. PennsylvaniaRace 2010 2017 2010 2017
Source: Selig Center for Economic Growth, Terry College of Business, The University of Georgia, June 2017.
Total 29.9 24.2 36 White 27.2 22.4 35 Black 32.5 27.3 36 American Indian 36.9 36.1 23 Asian 62.8 65.0 28 Multiracial 50.0 46.3 22 Hispanic/ Latino 47.1 57.8 11 Non Hispanic 28.2 23.2 37
Total 100.0 100.0 100.0 100.0White 84.1 82.3 89.0 87.7Black 8.5 8.7 7.0 7.2American Indian 0.7 0.8 0.2 0.2Asian 5.4 6.8 3.0 3.9Multiracial 1.3 1.5 0.8 0.9Hispanic/ Latino 9.0 10.2 2.9 3.7Non Hispanic 91.0 89.8 97.1 96.3

The MulTiculTural econoMy148
Rhode Island
Table 1
Buying Power for 2017(thousands of dollars)
Race U.S. Rhode Island State Rank
Source: Selig Center for Economic Growth, Terry College of Business, The University of Georgia, June 2017.
Rhode Island
Table 2
Buying Power for 2010(thousands of dollars)
Race U.S. Rhode Island State Rank
Source: Selig Center for Economic Growth, Terry College of Business, The University of Georgia, June 2017.
RHODE ISLAND
Total 14,577,908,009 49,687,360 43 White 11,998,080,528 44,855,731 42 Black 1,268,661,126 2,389,101 37 American Indian 112,819,670 252,264 45 Asian 986,163,256 1,554,804 42 Multiracial 212,183,429 635,461 43 Hispanic/ Latino 1,494,108,736 3,462,423 40 Non Hispanic 13,083,799,273 46,224,938 43
Total 11,221,631,000 40,821,167 43 White 9,434,548,552 37,521,764 42 Black 957,445,530 1,691,853 37 American Indian 82,435,170 177,986 46 Asian 605,720,293 965,115 42 Multiracial 141,481,455 464,449 42 Hispanic/ Latino 1,015,422,479 2,278,332 39 Non Hispanic 10,206,208,521 38,542,835 43

Selig Center for eConomiC growth 149
Rhode Island
Table 3
Percentage Change in Buying Power, 2010-2017,and State Rank
U.S. Rhode Island Race 2010-2017 2010-2017 State Rank
Source: Selig Center for Economic Growth, Terry College of Business, The University of Georgia, June 2017.
Rhode Island
Table 4
Market Share in Buying Power, 2010 and 2017 (percentage)
U.S. Rhode IslandRace 2010 2017 2010 2017
Source: Selig Center for Economic Growth, Terry College of Business, The University of Georgia, June 2017.
RH
OD
E IS
LAN
D
Total 29.9 21.7 42 White 27.2 19.5 42 Black 32.5 41.2 20 American Indian 36.9 41.7 10 Asian 62.8 61.1 33 Multiracial 50.0 36.8 45 Hispanic/ Latino 47.1 52.0 18 Non Hispanic 28.2 19.9 44
Total 100.0 100.0 100.0 100.0White 84.1 82.3 91.9 90.3Black 8.5 8.7 4.1 4.8American Indian 0.7 0.8 0.4 0.5Asian 5.4 6.8 2.4 3.1Multiracial 1.3 1.5 1.1 1.3Hispanic/ Latino 9.0 10.2 5.6 7.0Non Hispanic 91.0 89.8 94.4 93.0

The MulTiculTural econoMy150
South Carolina
Table 1
Buying Power for 2017(thousands of dollars)
Race U.S. South Carolina State Rank
Source: Selig Center for Economic Growth, Terry College of Business, The University of Georgia, June 2017.
South Carolina
Table 2
Buying Power for 2010(thousands of dollars)
Race U.S. South Carolina State Rank
Source: Selig Center for Economic Growth, Terry College of Business, The University of Georgia, June 2017.
SOUTH CAROLINA
Total 14,577,908,009 184,167,582 25 White 11,998,080,528 145,542,486 26 Black 1,268,661,126 33,085,796 15 American Indian 112,819,670 673,813 37 Asian 986,163,256 3,289,034 31 Multiracial 212,183,429 1,576,453 31 Hispanic/ Latino 1,494,108,736 6,094,190 31 Non Hispanic 13,083,799,273 178,073,393 25
Total 11,221,631,000 136,945,213 26 White 9,434,548,552 108,572,016 28 Black 957,445,530 24,838,150 16 American Indian 82,435,170 520,905 37 Asian 605,720,293 1,985,435 33 Multiracial 141,481,455 1,028,706 32 Hispanic/ Latino 1,015,422,479 4,218,004 31 Non Hispanic 10,206,208,521 132,727,209 26

Selig Center for eConomiC growth 151
South Carolina
Table 3
Percentage Change in Buying Power, 2010-2017,and State Rank
U.S. South Carolina Race 2010-2017 2010-2017 State Rank
Source: Selig Center for Economic Growth, Terry College of Business, The University of Georgia, June 2017.
South Carolina
Table 4
Market Share in Buying Power, 2010 and 2017 (percentage)
U.S. South CarolinaRace 2010 2017 2010 2017
Source: Selig Center for Economic Growth, Terry College of Business, The University of Georgia, June 2017.
SOU
TH C
AR
OLI
NA
Total 29.9 34.5 11 White 27.2 34.1 10 Black 32.5 33.2 28 American Indian 36.9 29.4 37 Asian 62.8 65.7 26 Multiracial 50.0 53.2 15 Hispanic/ Latino 47.1 44.5 34 Non Hispanic 28.2 34.2 10
Total 100.0 100.0 100.0 100.0White 84.1 82.3 79.3 79.0Black 8.5 8.7 18.1 18.0American Indian 0.7 0.8 0.4 0.4Asian 5.4 6.8 1.4 1.8Multiracial 1.3 1.5 0.8 0.9Hispanic/ Latino 9.0 10.2 3.1 3.3Non Hispanic 91.0 89.8 96.9 96.7

The MulTiculTural econoMy152
SOUTH DAKOTA
South Dakota
Table 1
Buying Power for 2017(thousands of dollars)
Race U.S. South Dakota State Rank
Source: Selig Center for Economic Growth, Terry College of Business, The University of Georgia, June 2017.
South Dakota
Table 2
Buying Power for 2010(thousands of dollars)
Race U.S. South Dakota State Rank
Source: Selig Center for Economic Growth, Terry College of Business, The University of Georgia, June 2017.
Total 14,577,908,009 38,443,779 48 White 11,998,080,528 35,709,900 45 Black 1,268,661,126 420,162 47 American Indian 112,819,670 1,342,468 21 Asian 986,163,256 557,012 48 Multiracial 212,183,429 414,237 48 Hispanic/ Latino 1,494,108,736 900,363 48 Non Hispanic 13,083,799,273 37,543,416 48
Total 11,221,631,000 31,266,250 48 White 9,434,548,552 29,378,522 44 Black 957,445,530 236,889 47 American Indian 82,435,170 1,087,463 20 Asian 605,720,293 275,327 48 Multiracial 141,481,455 288,048 48 Hispanic/ Latino 1,015,422,479 498,900 47 Non Hispanic 10,206,208,521 30,767,350 48

Selig Center for eConomiC growth 153
SOU
TH D
AK
OTA
South Dakota
Table 3
Percentage Change in Buying Power, 2010-2017,and State Rank
U.S. South Dakota Race 2010-2017 2010-2017 State Rank
Source: Selig Center for Economic Growth, Terry College of Business, The University of Georgia, June 2017.
South Dakota
Table 4
Market Share in Buying Power, 2010 and 2017 (percentage)
U.S. South DakotaRace 2010 2017 2010 2017
Source: Selig Center for Economic Growth, Terry College of Business, The University of Georgia, June 2017.
Total 29.9 23.0 40 White 27.2 21.6 39 Black 32.5 77.4 6 American Indian 36.9 23.4 49 Asian 62.8 102.3 1 Multiracial 50.0 43.8 31 Hispanic/ Latino 47.1 80.5 2 Non Hispanic 28.2 22.0 39
Total 100.0 100.0 100.0 100.0White 84.1 82.3 94.0 92.9Black 8.5 8.7 0.8 1.1American Indian 0.7 0.8 3.5 3.5Asian 5.4 6.8 0.9 1.4Multiracial 1.3 1.5 0.9 1.1Hispanic/ Latino 9.0 10.2 1.6 2.3Non Hispanic 91.0 89.8 98.4 97.7
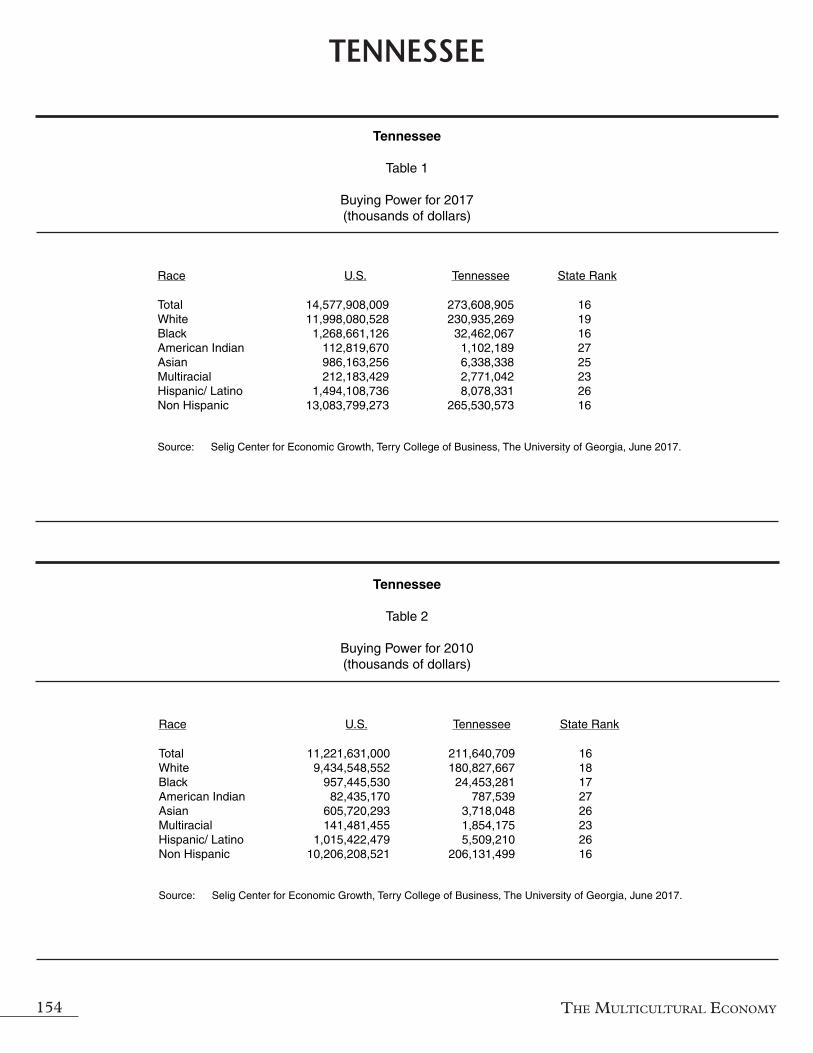
The MulTiculTural econoMy154
TENNESSEE
Tennessee
Table 1
Buying Power for 2017(thousands of dollars)
Race U.S. Tennessee State Rank
Source: Selig Center for Economic Growth, Terry College of Business, The University of Georgia, June 2017.
Tennessee
Table 2
Buying Power for 2010(thousands of dollars)
Race U.S. Tennessee State Rank
Source: Selig Center for Economic Growth, Terry College of Business, The University of Georgia, June 2017.
Total 14,577,908,009 273,608,905 16 White 11,998,080,528 230,935,269 19 Black 1,268,661,126 32,462,067 16 American Indian 112,819,670 1,102,189 27 Asian 986,163,256 6,338,338 25 Multiracial 212,183,429 2,771,042 23 Hispanic/ Latino 1,494,108,736 8,078,331 26 Non Hispanic 13,083,799,273 265,530,573 16
Total 11,221,631,000 211,640,709 16 White 9,434,548,552 180,827,667 18 Black 957,445,530 24,453,281 17 American Indian 82,435,170 787,539 27 Asian 605,720,293 3,718,048 26 Multiracial 141,481,455 1,854,175 23 Hispanic/ Latino 1,015,422,479 5,509,210 26 Non Hispanic 10,206,208,521 206,131,499 16

Selig Center for eConomiC growth 155
TEN
NES
SEE
Tennessee
Table 3
Percentage Change in Buying Power, 2010-2017,and State Rank
U.S. Tennessee Race 2010-2017 2010-2017 State Rank
Source: Selig Center for Economic Growth, Terry College of Business, The University of Georgia, June 2017.
Tennessee
Table 4
Market Share in Buying Power, 2010 and 2017 (percentage)
U.S. TennesseeRace 2010 2017 2010 2017
Source: Selig Center for Economic Growth, Terry College of Business, The University of Georgia, June 2017.
Total 29.9 29.3 17 White 27.2 27.7 16 Black 32.5 32.8 29 American Indian 36.9 40.0 15 Asian 62.8 70.5 22 Multiracial 50.0 49.4 21 Hispanic/ Latino 47.1 46.6 28 Non Hispanic 28.2 28.8 15
Total 100.0 100.0 100.0 100.0White 84.1 82.3 85.4 84.4Black 8.5 8.7 11.6 11.9American Indian 0.7 0.8 0.4 0.4Asian 5.4 6.8 1.8 2.3Multiracial 1.3 1.5 0.9 1.0Hispanic/ Latino 9.0 10.2 2.6 3.0Non Hispanic 91.0 89.8 97.4 97.0

The MulTiculTural econoMy156
TEXAS
Texas
Table 1
Buying Power for 2017(thousands of dollars)
Race U.S. Texas State Rank
Source: Selig Center for Economic Growth, Terry College of Business, The University of Georgia, June 2017.
Texas
Table 2
Buying Power for 2010(thousands of dollars)
Race U.S. Texas State Rank
Source: Selig Center for Economic Growth, Terry College of Business, The University of Georgia, June 2017.
Total 14,577,908,009 1,245,457,484 2 White 11,998,080,528 1,025,571,525 2 Black 1,268,661,126 117,135,067 1 American Indian 112,819,670 9,964,370 3 Asian 986,163,256 77,605,474 3 Multiracial 212,183,429 15,181,049 2 Hispanic/ Latino 1,494,108,736 284,432,144 2 Non Hispanic 13,083,799,273 961,025,340 2
Total 11,221,631,000 878,701,412 2 White 9,434,548,552 744,946,240 2 Black 957,445,530 77,431,901 2 American Indian 82,435,170 6,752,054 3 Asian 605,720,293 40,978,640 3 Multiracial 141,481,455 8,592,576 3 Hispanic/ Latino 1,015,422,479 184,941,796 2 Non Hispanic 10,206,208,521 693,759,616 3

Selig Center for eConomiC growth 157
TEX
AS
Texas
Table 3
Percentage Change in Buying Power, 2010-2017,and State Rank
U.S. Texas Race 2010-2017 2010-2017 State Rank
Source: Selig Center for Economic Growth, Terry College of Business, The University of Georgia, June 2017.
Texas
Table 4
Market Share in Buying Power, 2010 and 2017 (percentage)
U.S. TexasRace 2010 2017 2010 2017
Source: Selig Center for Economic Growth, Terry College of Business, The University of Georgia, June 2017.
Total 29.9 41.7 4 White 27.2 37.7 5 Black 32.5 51.3 12 American Indian 36.9 47.6 4 Asian 62.8 89.4 3 Multiracial 50.0 76.7 2 Hispanic/ Latino 47.1 53.8 15 Non Hispanic 28.2 38.5 5
Total 100.0 100.0 100.0 100.0White 84.1 82.3 84.8 82.3Black 8.5 8.7 8.8 9.4American Indian 0.7 0.8 0.8 0.8Asian 5.4 6.8 4.7 6.2Multiracial 1.3 1.5 1.0 1.2Hispanic/ Latino 9.0 10.2 21.0 22.8Non Hispanic 91.0 89.8 79.0 77.2

The MulTiculTural econoMy158
UTAH
Utah
Table 1
Buying Power for 2017(thousands of dollars)
Race U.S. Utah State Rank
Source: Selig Center for Economic Growth, Terry College of Business, The University of Georgia, June 2017.
Utah
Table 2
Buying Power for 2010(thousands of dollars)
Race U.S. Utah State Rank
Source: Selig Center for Economic Growth, Terry College of Business, The University of Georgia, June 2017.
Total 14,577,908,009 116,363,739 33 White 11,998,080,528 108,884,016 32 Black 1,268,661,126 1,083,909 43 American Indian 112,819,670 1,087,794 28 Asian 986,163,256 3,920,441 30 Multiracial 212,183,429 1,387,580 34 Hispanic/ Latino 1,494,108,736 8,859,762 24 Non Hispanic 13,083,799,273 107,503,977 32
Total 11,221,631,000 80,089,581 35 White 9,434,548,552 75,735,179 32 Black 957,445,530 720,811 43 American Indian 82,435,170 687,908 32 Asian 605,720,293 2,117,904 30 Multiracial 141,481,455 827,778 36 Hispanic/ Latino 1,015,422,479 5,805,190 25 Non Hispanic 10,206,208,521 74,284,391 35
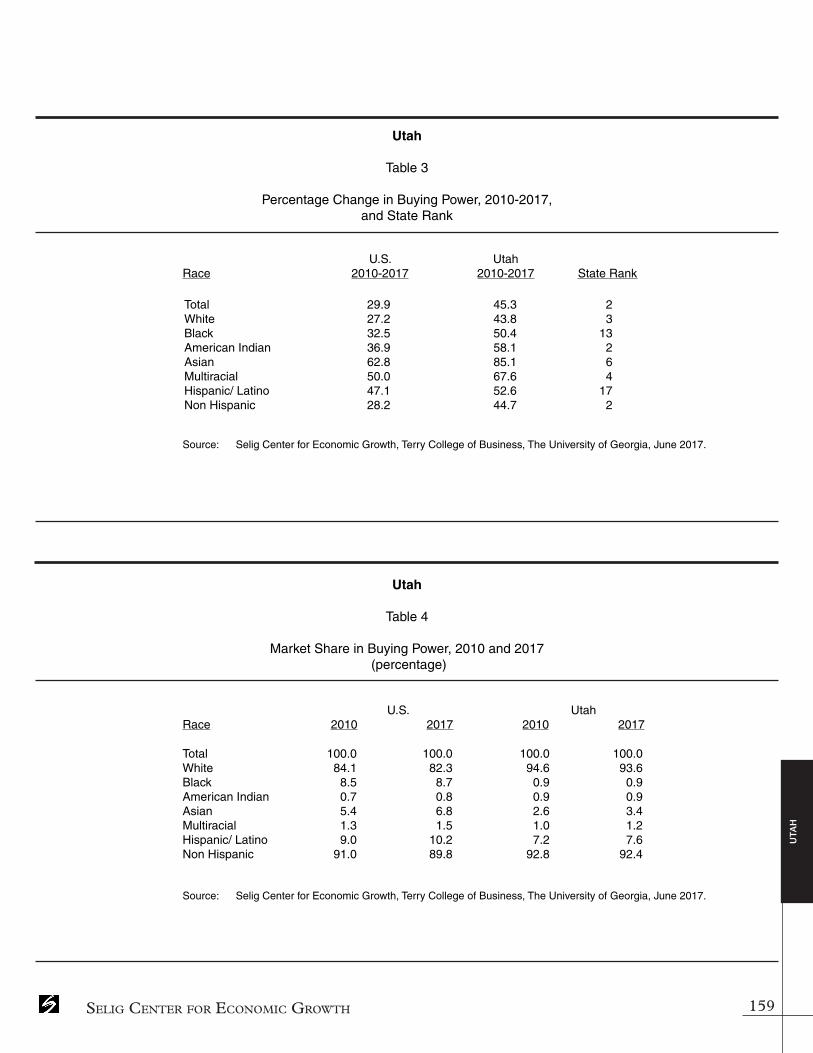
Selig Center for eConomiC growth 159
UTA
H
Utah
Table 3
Percentage Change in Buying Power, 2010-2017,and State Rank
U.S. Utah Race 2010-2017 2010-2017 State Rank
Source: Selig Center for Economic Growth, Terry College of Business, The University of Georgia, June 2017.
Utah
Table 4
Market Share in Buying Power, 2010 and 2017 (percentage)
U.S. UtahRace 2010 2017 2010 2017
Source: Selig Center for Economic Growth, Terry College of Business, The University of Georgia, June 2017.
Total 29.9 45.3 2 White 27.2 43.8 3 Black 32.5 50.4 13 American Indian 36.9 58.1 2 Asian 62.8 85.1 6 Multiracial 50.0 67.6 4 Hispanic/ Latino 47.1 52.6 17 Non Hispanic 28.2 44.7 2
Total 100.0 100.0 100.0 100.0White 84.1 82.3 94.6 93.6Black 8.5 8.7 0.9 0.9American Indian 0.7 0.8 0.9 0.9Asian 5.4 6.8 2.6 3.4Multiracial 1.3 1.5 1.0 1.2Hispanic/ Latino 9.0 10.2 7.2 7.6Non Hispanic 91.0 89.8 92.8 92.4

The MulTiculTural econoMy160
VERMONT
Vermont
Table 1
Buying Power for 2017(thousands of dollars)
Race U.S. Vermont State Rank
Source: Selig Center for Economic Growth, Terry College of Business, The University of Georgia, June 2017.
Vermont
Table 2
Buying Power for 2010(thousands of dollars)
Race U.S. Vermont State Rank
Source: Selig Center for Economic Growth, Terry College of Business, The University of Georgia, June 2017.
Total 14,577,908,009 28,927,159 51 White 11,998,080,528 27,894,291 50 Black 1,268,661,126 218,957 50 American Indian 112,819,670 67,948 51 Asian 986,163,256 477,677 49 Multiracial 212,183,429 268,286 51 Hispanic/ Latino 1,494,108,736 406,718 51 Non Hispanic 13,083,799,273 28,520,442 50
Total 11,221,631,000 23,441,849 50 White 9,434,548,552 22,802,560 48 Black 957,445,530 136,469 50 American Indian 82,435,170 54,790 51 Asian 605,720,293 252,746 49 Multiracial 141,481,455 195,283 51 Hispanic/ Latino 1,015,422,479 250,513 51 Non Hispanic 10,206,208,521 23,191,336 50

Selig Center for eConomiC growth 161
VER
MO
NT
Vermont
Table 3
Percentage Change in Buying Power, 2010-2017,and State Rank
U.S. Vermont Race 2010-2017 2010-2017 State Rank
Source: Selig Center for Economic Growth, Terry College of Business, The University of Georgia, June 2017.
Vermont
Table 4
Market Share in Buying Power, 2010 and 2017 (percentage)
U.S. VermontRace 2010 2017 2010 2017
Source: Selig Center for Economic Growth, Terry College of Business, The University of Georgia, June 2017.
Total 29.9 23.4 38 White 27.2 22.3 37 Black 32.5 60.4 7 American Indian 36.9 24.0 46 Asian 62.8 89.0 4 Multiracial 50.0 37.4 42 Hispanic/ Latino 47.1 62.4 7 Non Hispanic 28.2 23.0 38
Total 100.0 100.0 100.0 100.0White 84.1 82.3 97.3 96.4Black 8.5 8.7 0.6 0.8American Indian 0.7 0.8 0.2 0.2Asian 5.4 6.8 1.1 1.7Multiracial 1.3 1.5 0.8 0.9Hispanic/ Latino 9.0 10.2 1.1 1.4Non Hispanic 91.0 89.8 98.9 98.6

The MulTiculTural econoMy162
VIRGINIA
Virginia
Table 1
Buying Power for 2017(thousands of dollars)
Race U.S. Virginia State Rank
Source: Selig Center for Economic Growth, Terry College of Business, The University of Georgia, June 2017.
Virginia
Table 2
Buying Power for 2010(thousands of dollars)
Race U.S. Virginia State Rank
Source: Selig Center for Economic Growth, Terry College of Business, The University of Georgia, June 2017.
Total 14,577,908,009 407,896,827 9 White 11,998,080,528 313,465,201 11 Black 1,268,661,126 54,248,287 8 American Indian 112,819,670 1,654,497 17 Asian 986,163,256 31,531,218 7 Multiracial 212,183,429 6,997,623 7 Hispanic/ Latino 1,494,108,736 24,390,551 10 Non Hispanic 13,083,799,273 383,506,276 10
Total 11,221,631,000 324,532,741 9 White 9,434,548,552 256,289,955 11 Black 957,445,530 42,673,316 9 American Indian 82,435,170 1,290,829 18 Asian 605,720,293 19,601,829 8 Multiracial 141,481,455 4,676,813 7 Hispanic/ Latino 1,015,422,479 16,476,798 10 Non Hispanic 10,206,208,521 308,055,943 10

Selig Center for eConomiC growth 163
VIR
GIN
IA
Virginia
Table 3
Percentage Change in Buying Power, 2010-2017,and State Rank
U.S. Virginia Race 2010-2017 2010-2017 State Rank
Source: Selig Center for Economic Growth, Terry College of Business, The University of Georgia, June 2017.
Virginia
Table 4
Market Share in Buying Power, 2010 and 2017 (percentage)
U.S. VirginiaRace 2010 2017 2010 2017
Source: Selig Center for Economic Growth, Terry College of Business, The University of Georgia, June 2017.
Total 29.9 25.7 33 White 27.2 22.3 38 Black 32.5 27.1 38 American Indian 36.9 28.2 38 Asian 62.8 60.9 34 Multiracial 50.0 49.6 20 Hispanic/ Latino 47.1 48.0 24 Non Hispanic 28.2 24.5 33
Total 100.0 100.0 100.0 100.0White 84.1 82.3 79.0 76.8Black 8.5 8.7 13.1 13.3American Indian 0.7 0.8 0.4 0.4Asian 5.4 6.8 6.0 7.7Multiracial 1.3 1.5 1.4 1.7Hispanic/ Latino 9.0 10.2 5.1 6.0Non Hispanic 91.0 89.8 94.9 94.0

The MulTiculTural econoMy164
WASHINGTON
Washington
Table 1
Buying Power for 2017(thousands of dollars)
Race U.S. Washington State Rank
Source: Selig Center for Economic Growth, Terry College of Business, The University of Georgia, June 2017.
Washington
Table 2
Buying Power for 2010(thousands of dollars)
Race U.S. Washington State Rank
Source: Selig Center for Economic Growth, Terry College of Business, The University of Georgia, June 2017.
Total 14,577,908,009 365,111,448 14 White 11,998,080,528 304,831,516 13 Black 1,268,661,126 10,973,096 25 American Indian 112,819,670 4,097,370 7 Asian 986,163,256 36,099,240 6 Multiracial 212,183,429 9,110,227 6 Hispanic/ Latino 1,494,108,736 22,795,333 11 Non Hispanic 13,083,799,273 342,316,115 14
Total 11,221,631,000 261,264,267 14 White 9,434,548,552 225,474,752 13 Black 957,445,530 7,087,788 26 American Indian 82,435,170 2,783,356 8 Asian 605,720,293 20,124,504 7 Multiracial 141,481,455 5,793,868 6 Hispanic/ Latino 1,015,422,479 14,312,464 12 Non Hispanic 10,206,208,521 246,951,803 14
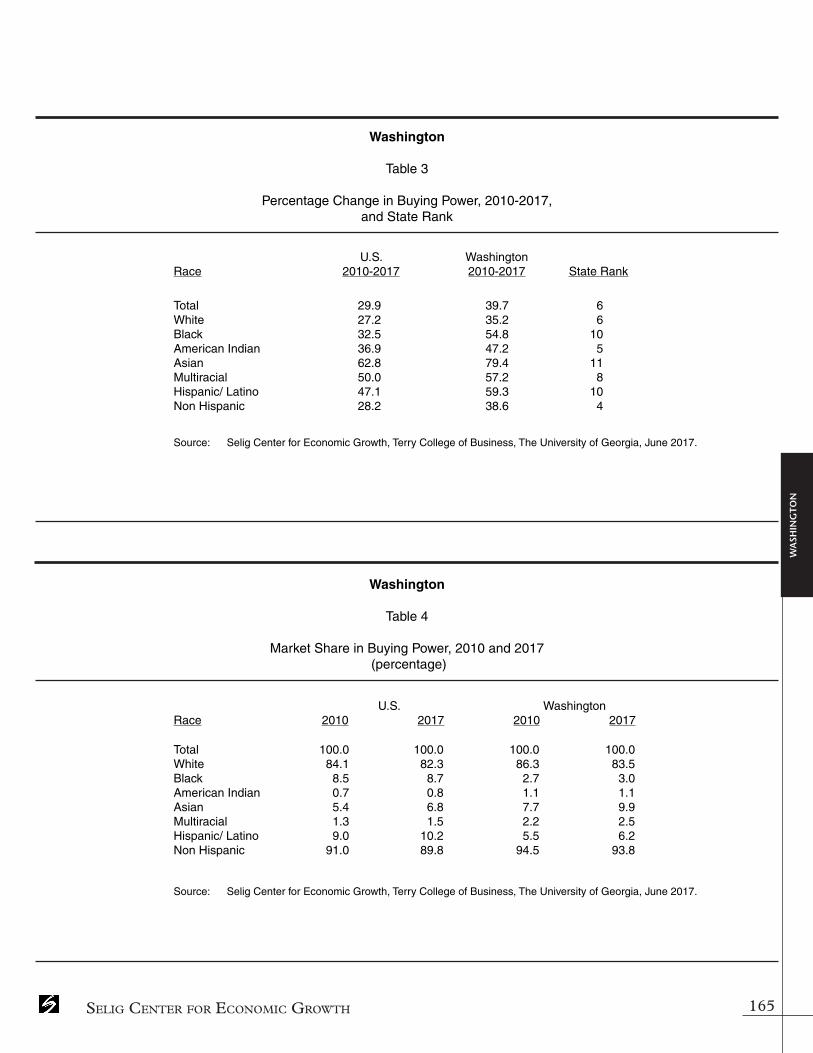
Selig Center for eConomiC growth 165
WA
SHIN
GTO
N
Washington
Table 3
Percentage Change in Buying Power, 2010-2017,and State Rank
U.S. Washington Race 2010-2017 2010-2017 State Rank
Source: Selig Center for Economic Growth, Terry College of Business, The University of Georgia, June 2017.
Washington
Table 4
Market Share in Buying Power, 2010 and 2017 (percentage)
U.S. WashingtonRace 2010 2017 2010 2017
Source: Selig Center for Economic Growth, Terry College of Business, The University of Georgia, June 2017.
Total 29.9 39.7 6 White 27.2 35.2 6 Black 32.5 54.8 10 American Indian 36.9 47.2 5 Asian 62.8 79.4 11 Multiracial 50.0 57.2 8 Hispanic/ Latino 47.1 59.3 10 Non Hispanic 28.2 38.6 4
Total 100.0 100.0 100.0 100.0White 84.1 82.3 86.3 83.5Black 8.5 8.7 2.7 3.0American Indian 0.7 0.8 1.1 1.1Asian 5.4 6.8 7.7 9.9Multiracial 1.3 1.5 2.2 2.5Hispanic/ Latino 9.0 10.2 5.5 6.2Non Hispanic 91.0 89.8 94.5 93.8

The MulTiculTural econoMy166
WEST VIRGINIA
West Virginia
Table 1
Buying Power for 2017(thousands of dollars)
Race U.S. West Virginia State Rank
Source: Selig Center for Economic Growth, Terry College of Business, The University of Georgia, June 2017.
West Virginia
Table 2
Buying Power for 2010(thousands of dollars)
Race U.S. West Virginia State Rank
Source: Selig Center for Economic Growth, Terry College of Business, The University of Georgia, June 2017.
Total 14,577,908,009 62,917,276 40 White 11,998,080,528 59,723,709 39 Black 1,268,661,126 1,701,317 41 American Indian 112,819,670 107,949 50 Asian 986,163,256 835,253 45 Multiracial 212,183,429 549,049 44 Hispanic/ Latino 1,494,108,736 735,917 49 Non Hispanic 13,083,799,273 62,181,359 39
Total 11,221,631,000 54,375,081 39 White 9,434,548,552 51,912,024 39 Black 957,445,530 1,380,072 39 American Indian 82,435,170 85,660 50 Asian 605,720,293 579,098 45 Multiracial 141,481,455 418,228 44 Hispanic/ Latino 1,015,422,479 492,423 48 Non Hispanic 10,206,208,521 53,882,658 38

Selig Center for eConomiC growth 167
WES
T V
IRG
INIA
West Virginia
Table 3
Percentage Change in Buying Power, 2010-2017,and State Rank
U.S. West Virginia Race 2010-2017 2010-2017 State Rank
Source: Selig Center for Economic Growth, Terry College of Business, The University of Georgia, June 2017.
West Virginia
Table 4
Market Share in Buying Power, 2010 and 2017 (percentage)
U.S. West VirginiaRace 2010 2017 2010 2017
Source: Selig Center for Economic Growth, Terry College of Business, The University of Georgia, June 2017.
Total 29.9 15.7 50 White 27.2 15.0 50 Black 32.5 23.3 46 American Indian 36.9 26.0 42 Asian 62.8 44.2 47 Multiracial 50.0 31.3 47 Hispanic/ Latino 47.1 49.4 22 Non Hispanic 28.2 15.4 49
Total 100.0 100.0 100.0 100.0White 84.1 82.3 95.5 94.9Black 8.5 8.7 2.5 2.7American Indian 0.7 0.8 0.2 0.2Asian 5.4 6.8 1.1 1.3Multiracial 1.3 1.5 0.8 0.9Hispanic/ Latino 9.0 10.2 0.9 1.2Non Hispanic 91.0 89.8 99.1 98.8

The MulTiculTural econoMy168
WISCONSIN
Wisconsin
Table 1
Buying Power for 2017(thousands of dollars)
Race U.S. Wisconsin State Rank
Source: Selig Center for Economic Growth, Terry College of Business, The University of Georgia, June 2017.
Wisconsin
Table 2
Buying Power for 2010(thousands of dollars)
Race U.S. Wisconsin State Rank
Source: Selig Center for Economic Growth, Terry College of Business, The University of Georgia, June 2017.
Total 14,577,908,009 249,674,331 21 White 11,998,080,528 231,026,459 18 Black 1,268,661,126 8,358,042 30 American Indian 112,819,670 1,791,780 16 Asian 986,163,256 6,605,800 24 Multiracial 212,183,429 1,892,250 27 Hispanic/ Latino 1,494,108,736 8,534,735 25 Non Hispanic 13,083,799,273 241,139,596 19
Total 11,221,631,000 198,163,372 20 White 9,434,548,552 184,987,711 16 Black 957,445,530 6,682,056 27 American Indian 82,435,170 1,312,765 15 Asian 605,720,293 3,848,117 25 Multiracial 141,481,455 1,332,722 27 Hispanic/ Latino 1,015,422,479 5,966,414 23 Non Hispanic 10,206,208,521 192,196,958 20

Selig Center for eConomiC growth 169
WIS
CO
NSI
N
Wisconsin
Table 3
Percentage Change in Buying Power, 2010-2017,and State Rank
U.S. Wisconsin Race 2010-2017 2010-2017 State Rank
Source: Selig Center for Economic Growth, Terry College of Business, The University of Georgia, June 2017.
Wisconsin
Table 4
Market Share in Buying Power, 2010 and 2017 (percentage)
U.S. WisconsinRace 2010 2017 2010 2017
Source: Selig Center for Economic Growth, Terry College of Business, The University of Georgia, June 2017.
Total 29.9 26.0 31 White 27.2 24.9 29 Black 32.5 25.1 41 American Indian 36.9 36.5 22 Asian 62.8 71.7 19 Multiracial 50.0 42.0 35 Hispanic/ Latino 47.1 43.0 37 Non Hispanic 28.2 25.5 31
Total 100.0 100.0 100.0 100.0White 84.1 82.3 93.4 92.5Black 8.5 8.7 3.4 3.3American Indian 0.7 0.8 0.7 0.7Asian 5.4 6.8 1.9 2.6Multiracial 1.3 1.5 0.7 0.8Hispanic/ Latino 9.0 10.2 3.0 3.4Non Hispanic 91.0 89.8 97.0 96.6

The MulTiculTural econoMy170
WYOMING
Wyoming
Table 1
Buying Power for 2017(thousands of dollars)
Race U.S. Wyoming State Rank
Source: Selig Center for Economic Growth, Terry College of Business, The University of Georgia, June 2017.
Wyoming
Table 2
Buying Power for 2010(thousands of dollars)
Race U.S. Wyoming State Rank
Source: Selig Center for Economic Growth, Terry College of Business, The University of Georgia, June 2017.
Total 14,577,908,009 29,676,886 50 White 11,998,080,528 28,232,753 49 Black 1,268,661,126 397,711 48 American Indian 112,819,670 423,874 41 Asian 986,163,256 288,246 51 Multiracial 212,183,429 334,302 50 Hispanic/ Latino 1,494,108,736 1,990,955 44 Non Hispanic 13,083,799,273 27,685,932 51
Total 11,221,631,000 23,315,906 51 White 9,434,548,552 22,433,010 49 Black 957,445,530 173,332 49 American Indian 82,435,170 304,687 41 Asian 605,720,293 175,373 51 Multiracial 141,481,455 229,503 49 Hispanic/ Latino 1,015,422,479 1,345,119 43 Non Hispanic 10,206,208,521 21,970,787 51

Selig Center for eConomiC growth 171
WY
OM
ING
Wyoming
Table 3
Percentage Change in Buying Power, 2010-2017,and State Rank
U.S. Wyoming Race 2010-2017 2010-2017 State Rank
Source: Selig Center for Economic Growth, Terry College of Business, The University of Georgia, June 2017.
Wyoming
Table 4
Market Share in Buying Power, 2010 and 2017 (percentage)
U.S. WyomingRace 2010 2017 2010 2017
Source: Selig Center for Economic Growth, Terry College of Business, The University of Georgia, June 2017.
Total 29.9 27.3 28 White 27.2 25.9 24 Black 32.5 129.5 3 American Indian 36.9 39.1 16 Asian 62.8 64.4 29 Multiracial 50.0 45.7 25 Hispanic/ Latino 47.1 48.0 25 Non Hispanic 28.2 26.0 29
Total 100.0 100.0 100.0 100.0White 84.1 82.3 96.2 95.1Black 8.5 8.7 0.7 1.3American Indian 0.7 0.8 1.3 1.4Asian 5.4 6.8 0.8 1.0Multiracial 1.3 1.5 1.0 1.1Hispanic/ Latino 9.0 10.2 5.8 6.7Non Hispanic 91.0 89.8 94.2 93.3

The MulTiculTural econoMy172