the moisture content of forest fuels - ii comparison …
TRANSCRIPT

THE MOIST URE C ONTE NT OF FOREST FUELS - I I
C OMPARIS ON OF MOI ST URE C ONTE NT V ARIATI ONS ABOVE THE
FIBER SAT URAT ION P OI NT BE �r.EE N A NUMBER OF FUEL TYPES
By
Al be rt J. S imard
Fores t Fire Res earch Institute Department of Forestry and Rural Development
Sir Guy Carleton Bui lding Ottawa 4, Canada
O.D .C . 431.2 Information Report FF- X- 1S July 196 8

AC KNOlv.LEDGEME NTS
A sincere word of appreciation is due to Gy Pech and L. D.
MacHattie f C:L'their ti me and e f fort spent in reviewin g this paper
and for th eir su ggestions for its i mprove ment . The ass i s tance of
P. J. Z in ke , P. Day and P. Casa maj or , of the S chool of Fores try ,
Univers i ty o f Cali fornia is also grate fully ac kn owled ged .
The author also appreciate s the assis tance of the Fores t
Products Laboratory , Ottawa , i n the distil lation of the water
sa mples used in the soa kin g study . A note of than ks is also due
to J. Val enzuela for drawin g many of the gra phs , and doin g many
of the routine calculations re quire d in this s tudy .
NOTE
This is the s econd in a seri es of pa pe rs on fue l mois ture .
Other papers in the series are :
The Moisture Content of Forest Fue ls - I
A Review of the Bas i c Concepts
Canada , Dept . of Forestry and Rural Develop ment . FP- X- l4

TABLE OF conT ENTS
Introduction � � . . . . . . . . . . . . . . . . . . . . . . . . . . . . . . . . . . . . . . . . . . . . .
Experi men ta �_ Procedure · . . . . . . . . . . . . . . . . . . . . . . . . . . . . . . . . . . . .
1. Foliage sa mp les • • • • • • • • • • • • • • • • • • • • • • • • a, a • • • • • • • •
2 . Twig sa mples · . . . . . . . . . � . . . . . . . . . . . . . . . . . . . . . . . . . .
Results and Discussions • • • • • • • • • • • • • • • • • • • • • • • • • • • • • • • • • • • •
1. Foliage S a mples • • • • • • • • • • • • • • • • • • • • • • • • • • • • • • • • • •
A . Total water rete ntion • • • • • • • • • • • • • • • • • • • • • · . .
B. Rate o f wate r absorption • • • • • • • • • • • • • • • • • • • • • C . Rate of wa t�r loss • • • • • • • • • • • • · . . . • • · . • • • • • • • D . Species diffe rences • • • • • • • • • • • • • • • · . · . • • • • • • •
E . Effects of i mmersion in water • • • • • • • • • • • • • • • • F. Co mparison of wetting and dryin g · . • • • • • • • • • • •
G� Conclusions - Folia ge . . . . . . . . . . . . . . . · . . . . . . . .
2 . Twig sa mples • • • • • • • • • • • • • • • • • • • • • • • • • • • • • • • • • • • • •
A . Total absorption • • • • • • • • • • . . . . • • • • • • • • • • • • • • •
B. Rate o f water absorption • • • • • • · . • • · . · . • • • • • • • C . Rate of water loss . . . . . � . . . . . . . . • • • • • • • • • • • • •
D . Effects of i mmersion in water • • • • • · . • • • • • • • • •
E . Co mparison o f twi gs with foliage • • • • • • • • • • • • •
F. Conc .lusio n$ - Twigs . . . . . . . . . . . . . . . . . . . • • • • • • •
Pa qe
1
3
6
10
13
13
13 15 19 2 7 2 9 3 0 3 1
3 2
3 2 40 46 48 49 50
Su mmary • • • • • • • • • • • • • • • • • • • • • • • • • • • • • • • • • • • • • • • • • • • • • • • • • • • • 51
References • • • • • • • • • • • • • • • • • • • • • • • • • • • • • • • • • • • • • • • • • • • • • • • • • 5 2
Appendix • • • • • • • • • • • • • • • • • • • • • • • . • • • • • • • • • . • • • • • . . • • • • • • • • . • 5 4

I NTR OD UCTI ON
It is a well known fact that fore s t fire beha vior is closely
correlated with forest fuel moisture . I t is for this reaso n that
all the f ire danger ratin g sys �e ms in use today make so me e ffort
to esti mate the mois ture content of forest fuels . Generally
speaking , so me for m of bookke e.ping sys te m i s usually in vol ved . A
certain a mount i s added to th � i qdex i n the absence of rain , "
based on various dryin � factor �. ' A certain a mount is subtracted
fro m the index when rain occurs , b ased on the a Mount of
precipitation which falls .
A conside rable a mount of work has been done by the drying of
forest fue l s . Relatively little i s known about the wetting
proce ss . I t was shown by S i mard ( 196 8 ) that so long as the rate
of rainfall exceeds the rate at which fue l s can absorb wa te r , it
is the duration of precipitation and not the a mount which governs
the a mount of water which the fue ls wil l absorb . In other words ,
much of a heavy rainfall with only a short duration will not be
absorbed , especially i f the rate o f percolation through the fue l
co mplex is high .
To the author 's knowledge , there i s only one fire danger
rating syste m which cons iders duration of precipi tation . I t was
deve loped by Wright and Beall ( 1940 ) . Unfortunate ly this feature
had to be e sti mated , due to the d i f fi culty of deter mining
ra infall duration without fairly e labo rate i ns tru mentation .
- 1-
r

The critical factor as to whether the duration or amount of
precipitation is limiting with respect to absorption of water is
the maximum rate of absorption by the fuelR. The purpose of the
present study is to determine the rate at which various fuels can
absorb water. The present study is concerned primarily with
relative absorption and drying rates between various types of
fuels. Future research will attempt to determine actual rates,
based on various environmental parameters, sl�ch as temperature,
and in the case of drying, relative humidity.
-2-

EXPEJUIJfEHTAL PROCEDURE
A survey of the literature indicated that nuch work had been
done on the moisture content of \'1ood belo\'! the fiber saturation
point, and to a more limited extent above the fiber saturation
point. Although some efforts have been made to correlate the
behavior of moisture content in \vood \-,i th that in other fuels,
most present fire danger rating systems are based on \-lood only.
This is curious since the litter layer is normally the fuel
component which propagates forest fires. Por this reason it was
decided that this study would concentrate on the various litter
components.
For the purpose of this paper, moisture mOVeMents above the
fiber saturation point are assumed to be in the form of liquid
water only. All water vapor movements are assuned to take place
below the fiber saturation point.
Since nothing could be found in the literature on the rate
of absorption of liquid water, some basic experiments in the
laboratory were planned which it was hoped \'TOuld provide some
preliminary information on this topic.
The moisture content of duff and litter, under constant
environmental condi tions, is a function of bTO general
independent variables. They are internal structure of the
material itself, and mechanical arrangement of tl;te cOMponents.
Only the material itself was investigated in this study.
Subsequent investigation will attempt to combine the two
variables. In order to determine the effect of internal
- 3-

structure, a number of fue l conponcnts of several species \\Tere
selected for testing. Haterials and species tested Here :
1) Hhite Spruce (Picea glacua Voss.) - Needles (old and new),
twigs (several sizes, all with bark).
2 )
3)
White Pine (Pinus Strobus L.) Needles (old and new),
twigs (several sizes, with and without bark).
Red Pine (Pinus resinosa Ait.)
twi gs (with and without bark).
- Needles (old and new),
4) Jack Pine (pinus Banksi ana Lamb.) - Needles (old and new),
5)
6 )
twigs (with and without bark).
Sugar Maple (Acer saccharum Harsh.)
twigs (with and without bark).
Grass - Species not i denti fied
Leaves (ne", only),
(ne"., only).
For the purpose of this paper, weathering i s defined as
exposure to .the elements for a period of several months with only
minor physical changes tak ing place. Decomposi tion is defined as
the physi cal breakdm-m (i.e. crumbling, falling apart) whi ch
accompani es prolonged exposure (usually several years). Old
material i s defined as anything which ·has undergone at least one
summer of weatheri ng but "'hi ch retains i ts normal structural
characteristics. New materi al is that whi ch has recently fallen.
It was deci ded that the follm-ling questions "lOuld be
i nvestigated :
1) - The total amount of water that can be held.
2 ) - The maxi mum rate of water absorption (i.e. , submerged).
3) - The rate of ",ater loss.
4) - The effect of age (needles only).
5) - The effect of size · (bligs only) •
- 4-

6) - 'l'he effect of bark (bligs only).
7) - lI.ny other observations \'lhich suggest themselves during
the course of the inve sti gation.
All samples were allowed to remain at room temperature and
relative humidity (70 °F. and 30-40�, respectively) for 3 weeks
prior to starting to insure unifornity. Litter samples of from
1.5 to 2 grams were then selected. The ran<Je in weiCJht of blig
samples was O. 8 to 4. 3 grams. Tap water \'las placed in a large
container and its temperature allowed to come to equilibrium with
the surrounding environment. Temperatures \'lere measured wi th a
mercury thermometer and a hygrothermograph. The large amount of
water used helped to maintain a fairly constant ter.lperature of
70 °F. with a range of 69.5 ° to 71.5 °F.
The litter samples \tlere placed in individual containers
covered with a fine nylon mesh. This insured free circulation of
water, and complete submersion of the samples. The twig samples
were placed in test tubes which were filled with water, covered
and s ubmerged in a water bath, to maintain a uniform tePlperature.
The samples were then removed from the water at periodic
intervals and "ltleighed. lI.n attempt "TaS made to renove as much
surface water as possible by shaki ng and drying \·lith paper towels
so that only absorbed water ,.,ould be measured.' Since i t \'laS
impossi ble to remove all surface \'later, tests "Vlere conducted to
determine the amount remaining, and the amount of variation in
the drying process.
When the samples ceased to gain weight, they were renoved
from the water and allowed to dry at 78 ° (::2 °) and 5 5 % RH (+5%) •
They were again weighed at peri odi c intervals to determine the
-5-

weight loss. A series of sample s was maintained at room
conditions for the duration of the experime nt to be used for
comparison with the soaked samples.
When the "soaked" samples had ceased to lose weight, both
they and the control samples were oven dried and the oven-dry
weights determined. These were then used to convert all previous
weighings to percent moisture content. These were then compared,
in an effort to provide answers to the previously mentioned
questions.
Since, to the author's knowledge, this type of experiment
has not been performed previously, a discussion of some of the
problems involved would be in order at this point. The results
of this study should be regarded as preliminary. The method used
was such th�t only the more obvious results can be considered
significant at this time.
1. Foliage Samples
The most outstanding difficulty encountered was the loss of
weight by the samples between the initial weighing prior to
soaking, and the final weighing after drying. In Table 1 it
can be seen that some of the losses were very high, as in the
case of maple leaves.
Table 1 Individual Foliage Weight Losses During Tests (in Percent of Oven Dry t'leight)
Species New Old Average
Maple Leaves 69% 69% �'lhi te Spruce 22% 16% 19% Red Pine 4% 4% 4 % vlhite Pine 4% 10% 7 % Jack Pine 14% 12% 13% Grass 14% 14%
-6-
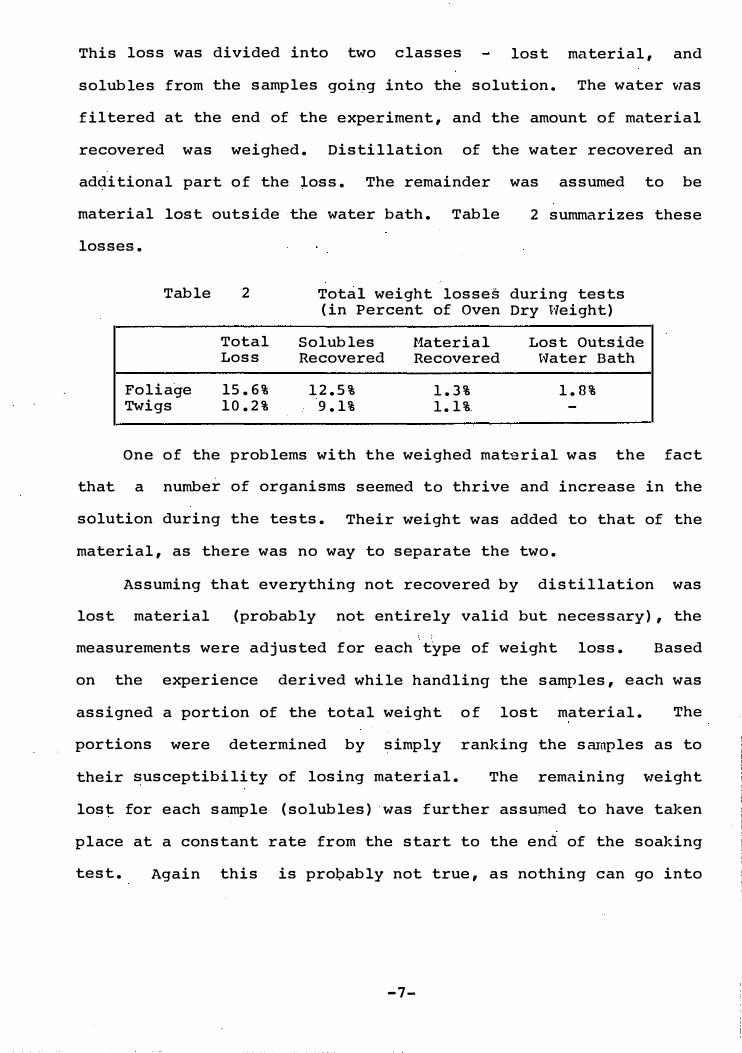
This loss was divided into two classes lost material, and
solub1es from the samples going into the solution. The water 'VIas
filtered at the end of the experiment, and the amount of material
recovered was weighed. Distillation of the water recovered an
additional part of the loss. The remainder was assumed to be
material lost outside the water bath. Table 2 summarizes these
losses.
Table 2 Total weight losses during tests (in Percent of Oven Dry tVeight)
Total Solub1es t1ateria1 Lost Outside Loss Recovered Recovered �vater Bath
Foliage 15.6% 1 2.5% 1.3% 1.8% Twigs 10.2% 9.1% 1.1%,
One of the problems with the weighed matsria1 was the fact
that a number of organisms seemed to thrive and increase in the
solution during the tests. Their weight was added to that of the
material, as there was no way to separate the two.
Assuming that everything not recovered by distillation was
lost material (probably not entirely valid but necessary), the I I
measurements were adj usted for each type of weight loss. Based
on the experience derived while handling the samples, each was
assigned a portion of the total weight of lost material. The
portions were determined by simply ranking the sruaples as to
their �usceptibility of losing material. The remaining ",eight
lost for each sample (solubles) was further assu�ed to have taken
place at a constant rate from the start to the end of the soaking
test. Again this is probably not true, as nothing can go into
-7-

solut ion unt il after water has entered the fue l . Lack in g
measurements on the rate of d issolv ing , a co ns tant r ate was
as sumed . A further assumpt ion was made that anyth ing wh ich
disso ived was replaced by an equa l vo lu me of water regardless of
the mo isture content of the fue l. All the prev ious we igh ings
wer � then ad justed to make them comparab le to the · f ina l we ight by
subtract ing the amount o f soluble that would have be en lost at
the time o f e ach measurement . The diagra m which was used for the
foliage s amples is shown be low.
AdJustments for solubles lost by foliage samples during soaking test.
DAYS
VERTICAL LINn CORRESPOND TO TIME OF WEIGHING
IS 1& 11 HUMSER OF WEIGHING
- 8 -
II

The lost material was accounted for in an entirely different
manner. Examination of the graphs of moisture content over time
indicated that there were several instances where the moisture
content dropped in subsequent readings. This \-laS assumed to be
partially due to material being lost bet\'leen the measurements.
The weight of material (at room conditions) \-'as then adjusted to
the percent moisture at the time of the "'7eight loss and
subtracted from the first weighing. In IllOSt cases this was only
sufficient to reduce the loss, not eliminate it entirely.
The loss 6f \veight \-lhile submerged requires further
elaboration. As previously mentioned, the total amount of lost
material was unable to compensate for many of these losses. A
number of other possible causes arc :
1. Weighing error - the scales used measured to an accuracy of
.01 gm. This is equivalent to 0.8% and 0.6% of oven dry
\veight for the lightest and heaviest samples, respectively.
All percents \vere rounded off to whole numbers. Any errors
here are considerably less than the measured weight losses,
and cannot be considered a significant causative factor.
2. Incorrect measurements - this may be the cause in the case
of an individual low (or high) reading followed by one which
seems to continue the original trend. In the case of
several subsequent low readings this is not the likely
cause.
3. Inaccuracy of drying technique. E ach sample was shaken and
blotted with paper towels to remove excess 'Hater prior to
weighing. An attempt to determine the accuracy of the
technique proved to be inconclusive. Visual examination of
- 9-

the graphs in the latter part of the soakin9 test indicated
that the error of the individual moisture content
measurements is probably less than + 10% of oven dry weight
and certainly not greater than + 20% . This again might
account for individua'l errors, but not likely for a series
of low readings after a series of high ones.
4. Effect of solubles entering solutions - At this time there
can be little more than conj ecture as to what occurs when a
soluble compound dissolves within the fuel and enters the
5.
surrounding water. Does
diffusion of water inward?
its diffusion oub-lard impede the
Or, more likely, do the two
occur simultaneously and independently? It is conceivable
that the rate at 'VJhich substances dissolve and diffuse
outward might be sufficiently great that all the \-later
entering the fuel simply replaces these substances, and
there is no net gain of weight. No conclusions are being
drawn on this point at this time. It is only intended that
some questions be presented which require ans\-lering.
Possible oxidation of organic matter by bacteria No
observations are available to confirm or contradict this
possibility.
2. Twig Samples
Prior to soaking, the twig samples were first coated 'Vii th
wax at the ends to seal the pores. A coat of varnish was then
applied. The purpose of sealing the ends Was to eliminate
longitudinal diffusion. The wax was applied first in an effort
to prevent absorption of a large amount of varnish. This proved
unsatisfactory, as the wax 'VlaS softened by the varnish, and
-10-

required more than a week to dry. Further, much of the wax
melted during oven drying, and was absorbed by the wood. Since
the total weight of the wax would not change by beinq abs orbed,
and since oven drying took place after completion of the
experiment, this was assumed to have had no effect on the
moisture content durin9 the tests.
Distillation of the water and weighing the material which
was filtered out resulted in recovery of slightly more than was
lost by the samples. This was aSsumed to be bacteria which was
weighed with the lost material. An appropriate amount was
subtracted from the recovered material to give 100 percent
recovery.
The drying technique appeared to be much more consistent in
the case of the twigs. Consequently, more reliance can be placed
on the values obtained during this portion of the test. The
error of the individual moisture content measurements is
estimated to be within + 15% of oven dry weight. Heighing
accuracy ranges from 0.2% to 2.3% for the heaviest and lightest
samples, respectively.
On the basis of a visual examination, the solution in which
the foliage samples had soaked was determined to be more opaque
than the solution which contained the twig samples. Despite
this, the water in which the twigs had been soaked contained
almost 3 times as much dissolved solubles. The amounts were
0.510 gil and 0.185 gil for the twigs and foliage samples
respecti vely • This indicates that much of \"lhat is going into
solution from the twigs is colorless and any attempt to measure
the rate of entry into solution on the basis of color change will
-11-

run into dif ficulty. Table 3 lists the los;, of Hciqht by
individual twigs.
Hard r1aple Size Loss
*B2.8 11.3% 4.0 13.2%
D4.0 9.6% 5.3 7.2% 7 .6 8.4% 8.2 4.8%
Average 6.5 9.1%
Table .3
v.7hite Size
Bl.6 B2.9 B3.5 B4.0 B4.6 B6.4
4.0
� 13 = \ii th bark
Individual T\-lig Hei�Jht IJosses Between Initial and Final l!eighinqs
(in Percent of Oven Dry Heiqht) (all sizes in f1rl)
Spruce Rell Pine Hhite Pine Jack Loss Size Loss Size Loss Size
16.6% D3.3 20.0% D2.2 25.5% 2.4 23.4% B4.0 15.3% 3.1 17.5% B2.4 17.2% 4.2 8.5% 135.2 1 1.6% 4.2 1 3.7 % 6.4 16.3% 4. 5 6.0% 7.1 12.5% 5.6 10.9% 137. 3 9.0% 9.1 10.2% 9.5 6.3% 6.7 5.2% 14. 4
15.6% 5.6 12.9% 4 .6 12.5% 6.6
Pine Loss
1 9.0% 1 1.6%
6.6% 7.8% 5.1% 4.3%
9.1%
Before leaving this topic, it should be mentioned that
equipment is being designed "lhich "lill, it is hoped, eliIl1inate
most of the problems encountered in this first attempt. Sone of
the improvements will be:
1 - No handling of the material "lill be necessary aftcr soaking
has started - thus eliminating loss of material.
2 - Continuous readings ".Jill be possible - especially important
in the early stages.
3 - Each sample ''1ill be in an individual container - thus making
possible a more detailed analysis of,the residual Hater at
the end of the test.
4 - An attempt will be made to measure the amount of solute
entering into solution. This ,'lill then be correlated; with
ch�nges in the rate of moisture content increase. -
5 - The sample \<1ill be totally submerged at all times. Only
"later entering the fuel will be cons idered thereby
eliminating the problem of residual surface \-mter.
- 12-

R ESUI.lT � �Nn DISCUSSION
1. Fol iage S amples
A. Total Water Retent ion
The total amounts of . water wh ich the ind iv idual samples
absorbed can be found in the append ix. These amounts inc lude the
surface water wh ich could not be removed by t he prev ious ly
ment ioned dry ing pro qess . By i dunk ing the s amp les , and
immed iately d ry ing and we igh ing -them , value s for s urface water
were obta ined . Subtract ing these from the total we ight g ives the
net total absorbed wate r . Table 4 presents a summary of these
values .
Table 4 Net Water Abs orbed by the Fol iage Samples
( in Percent of Oven Dry We ight )
Spec ies Average Old New
Maple leaves 388% - -Grass 282% - -
Wh ite s pruce 177 % 166% 187% Wh ite p ine 175% 211% 138% Red pine 139% 144% 134%, Jack p ine 188% 184% 191%
-- --
Average ( needles only ) 170% 17 6% 162%
There is a cons iderab le range in the average net total
values from 134% for -new red p ine to 388% for maple leaves .
There does not appear to b e s ign if-icant d ifference between the
var ious needle s amples , w ith the e xcept ion of red p ine w hich was
lower than the other spec ie s . The tot al range for needle s amples
is 77%.
-13-

There does not appe ar to be any consistent difference in the
net tot ai w ater absorbed between old and new s amples , which is
surprising , s ince on the b asis of short ter m me asure ments , one
would expect the older m ateri al to hold mor e w ater . The work of
Stocks and W alker (1967 ) indic ates th at different l ayers of duff
do h ave different tot al moisture hold ing c ap acity . Their
conclusions are b as ed , howeve r , on soaking periods of 24 hours or
less . They found th at the c ap acity incre ased as pro gressively
deeper measurements were m ade , s t arting at the top l ayer . A
m aximum mois ture holding cap acity was me asured in the center of
the duf f . From the center , the c ap acity decre ased as the
me asurements progres s ed downw ard through the re mainder of the
org anic m aterial . It appe ared to be correl ated w ith the s t ate of
decompos ition o f the materi al .
Wright (1930) noted that the mois ture content of a fuel
s ample was notic ab ly influenced by the e xtent to whi ch the lower
l ayers were decayed . Subs equent investig ation (Wright , 1935)
disclosed a difference in the mois ture holding c ap acity between
the top and ful l l ayers of duff . Furthermore , there is e xcel lent
agreement between the tot al abs orption d at a in the present
experiment and the abs orption by the top l ayer of duf f as
determined by Wright . He determined th at the top l ayer of duf f
of Red , White , and J ack p ine absorbed 152% , 166% and 17 0%
moisture respective ly . H ardwood le aves absorbed 336%. The full
l ayer of duff absorbed 50% to 85% more moisture th an the top
l ayer .

The present exper iment ind ic ates th at a d ifference in w ater
hold ing c ap ac ity does ex ist in it ially . After a prolonged per iod
of so ak ing , however , it is gr adu ally reduced , and almos t
el im in ated . W ith the except ion o f wh ite p ine , there appe ars to
be rel at ively l ittle d if ference in the absolute amount of w ater
th at c an be abs orbed by old and new needles . I t must be po inted
out , however , th at the s amples used in th is e xper iment were not
decomposed , the only d ifference be ing one or more summers of
we ather ing . S tocks and W alker used the ent ire org an ic l ayer ,
wh ich inc luded s ome cons ider ab ly decomposed m ater ial . I t is
poss ib le th at we ather ing affects pr im ar ily the r ate of w ater
absorpt ion , wh ile deco mpos it ion also affects the phys ic al
propert ies in such a w ay th at the m ater ial c an hold a gre ater
amount of w ater .
B. R ate of W ater Absorpt ion
The rel at ionsh ips between mo is ture content and t ime for all
s amples are shown in Figs . 1 through 5. The up per h alf
repres ents the dry ing curve s , w ith the ins erts show ing dry ing
after a moment ary dunk ing . Th is is l abelled surf ace w ater
dry ing , for s impl ic ity , and w il l be d is cussed in gre ater det ail
subsequently _ The lower h al f represents the wett ing curves . All
curves are plotted w ith the ad jus ted mo is ture 'content v alues
found in the appen dix . . Surf ace w ater h as not been subtr acted
from thes e v alue s '.
V isu al inspect ion d is c loses th at there ar e three b as ic
beh av ior p atterns wh ich appe ar in every wett i�g curve . In it ially ,
all s amples g ain w ater very r ap idly , for a short per iod . Th is
in it ial per iod is followed by a longer interv al o f v ar iable but
- 15-

reduced rates of absorption. It is tentatively sU<Jgested that
this is the period during which the various solutes are being
dissolved. Lastly, there is a long period of slow increase which
asymptotically approaches a final value. In some cases, there is
practically no increase at all during this final period.
The lack of smoothness in the wetting curves makes direct
comparisons between samples somewhat difficult. The use of a 11. . . wetting time lag constant- 1S of lim1ted value because, as w111
be discussed subsequently, great differences occur, depending on
whether the value is reached before or after the rate of increase
slows down. Also, a time lag constant assumes a smooth
exponential curve, which in most cases does not exist.
To compare the wetting phase of the various samples with
each other, the behavior during the first two periods will be
studied. The initial period is defined as the interval
immediately following initial dunking during which the moisture
content increases rapidly. The transition in rates was so marked
that the terminal point for this period was deter-mined visually
from the graphs. The second period is defined as the 48-hour
interval which immediately follows the rapid increase.
Table 2 summarizes the moisture content values and rates
of increase during a number of periods. Column A is the duration
of the period. Columns B and C are the moisture content
increases which occurred during the respective periods. In
Column B the values are expressed as a fraction of the _,total
change which will ultimately occur. Columns D and E are the
average - rates of increase during the respective periods. (D =
BIA, and E = CIA), D is also in terms of a fraction of the total
eventual change.
21 The amount of time required to go through 63% of the ultimate ahange whiah will eventual ly oaaur.
- 16-

Tab le 5 Summ ary of Rates of Incre as e and Hois ture Content Value s for Ol el and New Sample s
Conditions at En d Av . Rate of Incre ase of Period ( Pet . /Ilr . )
A n C (1) D E(l) As Fr action Percent As Fr action Percent
Dur ation of Tot al Hois ture of Tot al Hois ture ( Hrs . ) Ch ange Content Ch an ge Content
R aEi d Incre ase �Period
Old (2) 5.5 .70 1 66% .142 30.5% New 5.2 .50 98% .104 1 8.4%
Sig . Level of Dif ference (3) N. S. D . .06 .12 .14 .06
(4) V ari ab le Incre ase Period
Old 48 .92 New 48 .77
Sig . Level of Dif ference - .02
Time L ag
Old 8.3 .63 New 25.2 .63
Sig . Level o f Dif ference .07 -
1 . % of oven dry weight
213% 1 54%
.12
Period
146% 1 24%
.50
2. As determined from the gr aph 3. Signific ance 4. No s igni f i c ant d i f fe rence
.0045 0.98%
.0057 1.16%
N. S. D . N.S.D .
.151 33.6%
.030 5.8%
.04 .05
Looking first at the r apid incre ase period , we c an see th at on
the aver age the dur ation for both old and new s amples i s
essenti ally the s ame . On the other h and , the new s amples h ad
absorbed only about two-thirds as much w ater as the old at the
time of tr ansition . Looking at the r ates o f incre as e , it c an be
seen th at the s ame r atio applies . These d i f fe rences were found
to be s i gnific an t , despite the sm all s ample s i ze and l arge
s t and ard devi ations .
- 17-

Turning to the variable increase period, it can be seen that
a number of changes occur in addition to the marked reduction in
rates of increase. During this period the new samples actually
appear to increase faster than the old, which is in direct
contrast to the previous interval. This difference is very
small, however. As a result, the amount of water absorbed by the
old needles after two days of soaking was still significantly
higher than that absorbed by the new. By the end of the variable
increase period the new needles had absorbed about three-fourths
as much as the old, only a slight increase from the previous two
thirds, at the end of the rapid increase period.
Looking at the time lag period, it can be noted that the old
samples appeared to gain water five times as fast as the new
ones. On the other hand, we can see that the old needles require
only about one-third as much time as the n ew ones to go through
63 per cent of the ultimate change. This gives a false
impression, however, as the rates of change varied considerably,
depending on whether the . 63 value was attained prior to or after
the end of the rapid rise period. As mentioned, the actual
ratios between old and new are approximately 1.5:1, and not 5:1.
Therefore, it is felt that any comparison of wetting time lags
would be of rather questionable value.
In summary, due to the greater initial rate of absorption,
the old needles gain about one and a half times as much as the
new by the end of the rapid increase period. The actual
difference in moisture content is fairly large (68 per cent)
despite the relatively short period, due to the rapid rates of
increase. This initial difference persists for several days,
with the new needles slowly catching up to the old.
-10-

C. Rate of Water Loss
Visual inspection of the drying curves in Figs. 1 through 5
indicates a considerable difference between the rates of drying
of new and old material. This is confirmed by the summary of
water loss measurements and significance of differences given in
Table 6. (The individual measurements can be found in the appen-
dix.) Columns A, B, C, E and F correspond to the values given in
Columns A through E respectively of Table 5. Column D .is the
actual moisture content value at the end of the time lag period.
Table 6 Summary of l"later Loss
A B C (1) D (1) E F (1) Old 4.9 . 63 1 38% 92% . 129 20.4% New 17. 6 . 63 119% 79% .036 4.6%
Sig. Level of Difference .01 .50 .50 .02 .02
(1) In Percent of Oven Dry t'leight.
The smoothness of the curves indicates that this phase of the
test was more accurate than the wetting portion, which allows
greater reliance to be placed on the drying values. This also
makes the use of a time lag constant more meaningful. Although,
as in the case of wetting, the time lag for the new material was
about three times that for the old, the significance of the
difference is considerably greater due to the smaller amount of
variation while drying. It can be noted that there is little
difference in the water lost by the end of the time lag period.
One would expect a small difference, since the a�ount of water
lost during the time lag period is a function of the total water
gained, in which there is little difference. The rates of loss
-19-

Figur€ 1 Moisture aontent as a funation of time.
WHITE S PRUCE NEEDLES
250
200
150
-� ::t: 100 c.!) LLI :: >-0::: Cl 50 z LLI > o
� o . (HOURS) 12
� Z LLI � Z o 250 u LLI 0::: :::> � en 200 o :!:
150
100
50
24
o old
A new
DRYING
60
u
::E 40 �
20
60
SURFACE MOISTURE LOSS
1 2 3 4
(HOURS)
72 84
o L-------�1�------�
2--------�
3��----�
4--------
5L--- -----
6L-----------�
TIME (DAYS)
-20-

Figure 2 Moisture content as a function of time.
WHITE PINE NEEDLES
DRYING SURFACE MOISTURE LOSS
250 60
0 old u
200 b. new � 40
�
150 20 -
II-!:J: Ie.!) Iu:; j3: 100
0 4 ,>-,0:: (HOURS) :0 I� 50 i> '0 !� ,-'I-'z 0 ;LiJ (HOURS) 12 072 I- 0 0 0 ,z 0 0 u 0 0 LiJ WETTING 0:: 250 ::::> I- old en 0 0 �
200 b. new
150
100
50
o L-�. ____ � ______ -L ______ �� ______ � ______ � ______ -i __________ --J 1 2 3 4 5 6
TIME (DAYS)
-21-

Figure 3 Moisture content as a function of time.
t=' :I: (!) LIJ
25 0
200
150
100
3: 50 i>-'0:: ,0
JACK PINE NEEDLES
DRYING
0 old
A new
60
cJ . 40 :IE . tfl
20
o
SURFACE MOISTURE lOSS
1 2 3 4
(HOURS)
' Z iLIJ :> 0 t----*---�o:__--�*""---�---��---�-----___f ,0 (HOURS) 2 2 4 3 6 60 72 tfl IZ � 250 z o (.) LIJ 0:: 200 ::J I-en o �
150
100
50
o old
A new
WETTING
o �----�1�---�
2�-----�3-------�
4----�
5�----
6L-- ------�
TIME (DAYS)
-22:-·

Figure
250
200
150
t=' :c 100 C!' w 3: >-0:: 0 50 z w > 0
� 0 I-z w
'I-z o 250 <...> w 0:: :::> I-� 200 0 �
150
100
50
o
4 Moisture aontent as a funation of time.
RED PINE NEEDLES
(HOURS) 12
1
24
2
0
A
0
A
old
new
old
new
3
DRYING
60
<...> :::E 40
�
20
0
60
WETTING
4 5
TIME (DAYS)
-23-
SURFACE MOISTURE LOSS
(HOURS)
72
6

Figure 5 Moisture content as a function of time.
MA PLE LEAVES AND G RAS S
400
300
200
UJ
3: 100 ,>-a:: o z UJ > o
f!fl IZ I.IJ IZ o u 400 I.IJ a:: => I-en o ::E 300
200
100
(HOURS) 12
DRYING
A grass
o maple leaves
24
A grass
36
WETTING
o
o mapl� leaves
48
60
u ::E 40 f!fl
20
o
SURFACE MOISTURE LOSS
1
60
2 3 (HOURS)
72
o �--------1�--------
2�--------
3�------ --
4�-- ------
5�--------�
6----�
TIME (DAYS)
- 24-

are about four times faster for the old m�terial, and again the
significance is greater than during the wetting phase. This
indicates that once the moisture diffused into the fuel, it
encountered greater resistance in getting out in the new needles.
Presumably the outer wax layer on the new samples impedes the
flow of moisture.
Looking at the surface moisture drying curves gives further
confirmation of the above theory. In every case, the moisture
content of the new material was lower than that of the old after
the quick dunking tests (except Red Pine, where it was equal).
It can also be noted that the old White pine needles took
considerably longer to dry back to the starting moisture content
than did the new. Old and new needles of Red and Jack pine took
about the same time. The old White spruce needles are the only
ones which dried faster than the new. This is in direct contrast
to the drying time from complete saturation, where the old
material dried considerably faster. Rather than being a
contradiction, this is exactly what would be expected. The
reasoning is as follows: In the case of complete saturation,
both old and new n eedles have moisture inside the fuel, which has
to diffuse outward. In the case of dunking, the new material has
little chance to absorb water, and most of the drying is simply a
matter of evaporation from the surface. The old material, on the
other hand, does absorb some water, and the drying process is a
combination of evaporation and diffusion, hence(the 'difference in
the ratio between old and new drying rates after a q uick dunking
and prolonged soaking.
-25-

In studying the drying curves, it can be se�n that, in all
cases, the initial rate of .drying is relatively rapid. This
behavior is discussed by a number of early investigators whose
work is summarized by Rees and Buckman (1938) as follows:
" . . • when the solid is very wet, the rate of moisture loss
from the surface is similar to that from a free water
surface; therefore, under constant drying conditions, the
rate of drying remains constant. During this period, the
controlling factor is the rate of evaporation through the
surface air film. As drying continues, a critical point
eventually is reached on the drying curve where the rate of
moisture loss begins to decrease, and the range from this
point to the equilibrium moisture control is called the
"falling rate period"."
Rees and Buckman (1938) conducted a study of the relative
rates of moisture movements in different structural directions of
a number of wood samples. Using the formula for evaporation from
a free water surface derived by Lurie and Hichailoff (1936) Rees
and Buckman computed a value of 0.0187 gms/em/hr. for the rate of
evaporation under the conditions of their experiment (81%
relative humidity, and 30 °C.). The actual rates of water loss
which they measured in the longitudinal direction averaged 0.0128
gm/cm/hr. This difference is attributed to the n ecessity of
maintaining a moisture gradient at the surface of the material in
order for diffusion to take place.
Rees and Buckman noted that as much as 60 percent of the
total water available was lost during the constant rate period,
which indicates that diffusion through the material \olaS able to
-26-

· keep pace with evaporation from the surface until the critical
point was reached.
Detailed plotting of the first 12 hours of drying on both
ordinary and semi-log paper indicates that there is an initial
constant rate period or at least a rapid rate which is nearly
constant for old White and Jack pine and the leaves and grass
samples. These samples and also the old n eedles of all species
but White spruce show a critical point where the rate of drying
is markedly reduced.
The fact that the old material loses such a large percentage
of the total water available during the constant (or very rapid)
rate period indicates that diffusion through foliar material is
not the most limiting factor in the initial rate of drying.
Early initiation of a greatly reduced rate of drying in the new
material indicates that the rate of diffusion is greatly
hindered. Since the only apparent difference between the two
types of sample was the outer wax layer, it is therefore
concluded that this layer is much less permeable to the passage
of water than the foliar material itself.
Lastly, it can be seen that the initial rate of drying for
all new material, e xcept possibly White Pine, is considerably
more rapid than the average rate. This is attributed to the loss
of surface water. During this period, diffusion is of little
importance, as the water is already at the surface.
D. Species Differences
Some differences· between the species tested are evident.
Table 7 summarizes the time lags and rates of change for the
various species. The significant differences between the rates
of change and time lags are shown in Table 8.
-27-

Table 7 Species Differences
Species Hetting
Time Lag Rate of (hrs) Increase
(1 )(Pct/hr)
Grass 2.0 106 Maple leaves 6.0 44.8 vlhi te spruce 7.0 26.6 Jack pine 13.5 25.7 �vhite pine 16.5 23.1 Red pine 30.0 3.6 --
Average* 14.2 30.9
* From individual measurements. (1) Percent of oven dry weight per hour.
Drying
Time Rate of Lag Decrease
(IIrs) (Pct/Hr)
3.0 46.7 5.0 33.4
10.0 8.6 10.2 8.9 10.5 9.0 14.2 4.9
9.8 18.0
l\verage
Time Rate of Lag Change
(Hrs) (Pct/Hr)
2.5 76.4 5.5 39.1 D.5 17.6
11.8 17.3 13.5 16.0 22.1 4.2
Table 8 Significance of differences between the species tested
Grass Maple leaves \'Jhi te spruce Jack pine White pine Red ine
Grass
Avera e
Haple Hhite Leaves Spruce
la s
Jack Hhite Red Pine Pine Pine
.0
.30 .30 N.S.D.
Comparing the various species, it can readily be seen that
the average time lag of the fastest (grass) is about 10 times as
great as the slowest (Red Pine). The rate of change for grass is
about 20 times as great as for Red Pine. The grass samples used
had no noticeable outer wax layer, so it is presumed that they
presented little resistance to the flml of moisture, and hence
the rapid rates of diffusion. The Red Pine on the other hand
were the largest needles used, and appeared to have the heaviest
outer wax layer - hence the slow rates of diffusion.
-28-

Due to the greater variability in the rates of change as
opposed to the time lags, the significance of the differences is
poorer for the former. On the basis of Table 8, it is safe to
say that the rate of diffusion in grass is significantly faster
than all other species tested, with the possible exception of
maple leaves. Further testing with a larger sample will probably
confirm this difference. The rate of diffusion in Red Pine is
significantly slower than all species tested. Diffusion in Maple
Leaves appears to be faster than the three remaining needle
species, but the rather marginal significance of the difference
between the rates suggests that further tests are needed before a
definite conclusion can be reached. There appears to be little
significant difference between the three remaining needle
species.
E. Effects of Immersion in Water
A number of \ interesting observations were made on the
effects of soaking the needle samples. A comparison of the
moisture contents at room conditions of the soaked samples and
the untreated set indicated that a change had occurred. In every
case, the old needles held more moisture than the new ones at
room conditions. Table
new for both series.
Table 9
Species
9. lists the difference bebveen old and
Differences between old and new needle samples at room conditions
(in Percent of Oven Dry Height) Soaked Untreated
White Spruce 0.8% 1.7 % Red Pine 1.2% 2.4% White Pine 2.2% 3.7% Jack Pine 2.1% 5. 3%
Average 2.2% 4.4%

It can be seen that without exception the differences in the
soaked samples are about half of those in the untreated set.
This is interpreted as meaning that half of the difference
between old and new needles was removed in one week of immersion
in water. In other words,' the new needles were aged by soaking.
Rather than conclude that another week of soaking would eliminate
the differences entirely, it would probably be more accurate to
assume an exponential pattern for the change.
Only two samples changed their appearance during the wetting
phase. The maple leaves changed from yellow to brown, while the
spruce needles became a duller shade of tan. Rather than
occurring gradually in the needles, the color change proceeded in
an abrupt line, starting at the end where the needle had been
broken from the twig. Only the spruce needles had an open end1
all other samples included the entire fascicle. It was also
noted that when the needles were partially waterlogged they
inevitably sank with the open end down. These two observations
indicate that water entered through the broken ends more readily
than through the rest of the needle surface. This may be due to
either increased diffusivity in a longitudinal direction, or
resistance to the flow of water by the outer wax layer, or (and
more likely) both.
F. Comparison of Wetting and Drying
The last question which comes to mind is whether wetting is
faster or slower than drying. One would think that drying should
be faster, due to the added diffu�ion potential of evaporation.
The data gives conflicting evidence with respect to this point.
The average time lag for wetting is 14.2 hours as opposed to 9.8
- 30-

for drying. In contrast to this, the average rates of absorption
were 30.9 and 18.0%/hr. for wetting and drying respectively. This
is primarily due to the abrupt changes in the rate of �Iletting,
which makes comparison of the curves rather difficult. Further,
the average rates of change during the time lag period are of
doubtful value, because as the time lags becoMe smaller the
increase in sorption rates is entirely out of proportion to the
change in time lags.
Comparing a constant time period of blelve
average rates of change are 19.8 and 16.9 %/hr. for
hours, the
drying and
wetting respectively. Looking at the initial five hour period,
however, the rates are 14.2 and 14.8%/hr. for drying and wetting
respectively.
be said that
Therefore,
there does
on the basis of this data it can only
not
difference
material.
between the rates
appear to be any consistent
of wetting and drying of foliar
G. Conclusions Foliage
1. There is considerable difference in the amount of water that
the various species can hold. The entire range is about 250
percent. Maple leaves and grass absorb considerably more
than the needle samples tested. Only Red Pine appears to be
significantly different from the other needle species, in
that it absorbed less during the course of the experiment.
2. There does not appear to be a significant difference in the
net absorption over an extended period betweEm old and ne\,l
undecomposed needles.There is a significant difference,
however, over a short period, (24 hours or less), in that
the old material absorbs more (at a ratio of about 1.5:1).
- 31-

3. There is a difference between the rates at \'Thich old and new
4.
material gain and lose water. In the case of absorption,
the difference occurs primarily during the initial rapid
increase period, which lasts for about 5 hours. In the case
of drying, it starts after the surface water has been lost,
and continues throughout the entire drying period. The rate
of diffusion through the material does not appear to be the
limiting factor. The difference is due to the 'reduced
permeability of the outer cuticle wax layer, which is
heaviest on the new material.
There is a difference in the rates of moisture content
change between the species. Grass is significantly faster
than all other species tested, and Red Pine is significantly
slower. Maple leaves are probably faster than the needle
species'. Little difference could be found between the three
remaining needle species, White Spruce, White, and Jack
Pine.
5. The dissolving of solub1es within the material is one of the
important processes governing initial decomposition of dead
foliage material.
A. Total Absorption
2 . Twig Samples
Preliminary �xaminati6n of the results indicated that there
was a considerable difference in the total amount of water which
various sized twigs of a particular species would absorb. The .
range was as much as 195% for maple. The results are summarized
in Table 10, with a complete listing available in the appendix.
-32-

Table 10 Total Absorbed Hater (in Percent of Oven Dry �']ei�fh t)
Size �Vith Hithout Averaqe Class Bark Dark
(Dia. in rom)
1.0-3.0 196% 198% 197% 3.1-5.0 148% 210% 179% 5. 1-7.0 150% 183% l6 G % 7.1-9.0 124% 151% 144% 9.1 + 75% 138% 117 %
Average 139% 17 6% 158%
Kuebler (1957) found that the rates of response for equal sized
samples of a single species of wood vary by one order of
magnitude. Although he was working with water vapor only, the
emphasis here is that there is considerable variation within a
single species, despite the apparent uniformity of samples. In
all cases (except Red Pine which \<1 as discarded because of
considerable variability) the smaller twigs absorbed more than
the larger ones. The average difference between the largest and
smallest classes of twigs was 80% for all species.
In looking for an explanation for the difference in
absorptivity the question of the density of the samples suggested
itself. Phillips, et al., (1962) found that the late wood
within a growth ring zone of Longleaf Pine was about three times
as dense as the early wood of the same ring (Fig. '6) • Further,
the pattern of density corresponds closely to the fiber length
variation in a number of species where growth rings were
apparent, as determined by Bisset and Dodswell (1956), three of
which are shown in Fig. 7. They found that fibers in late wood
were invariably longer than those in early wood, when growth
rings were present. Examination of a graph of density across a
-33-
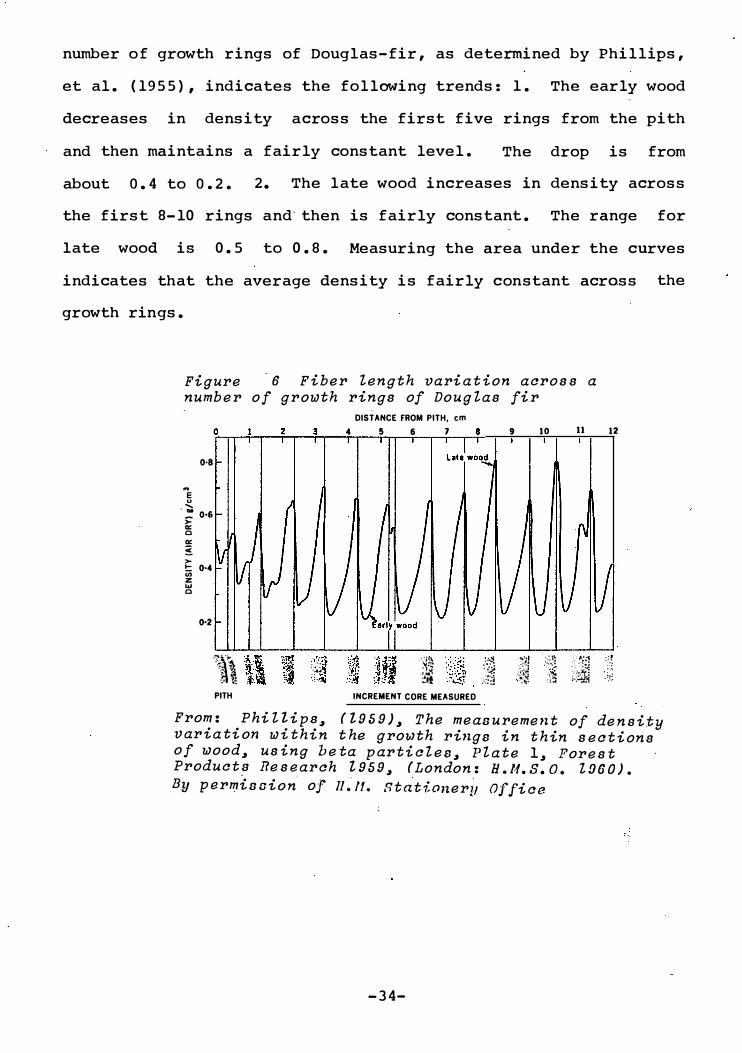
number of growth rings of Douglas-fir, as determined by Phillips,
et al. (1955), indicates the following trends: 1. The early wood
decreases in density across the first five rings from the pith
and then maintains a fairly constant level. The drop is from
about 0.4 to 0.2. 2. The late wood increases in density across
the first 8-10 rings and' then is fairly constant. The range for
late wood is 0.5 to 0 .8. Measuring the area under the curves
indicates that the average density is fairly constant across the
growth rings.
Figure 6 Fiber length vari a t ion aaros s a numb e r of growth rings of Doug las fi r
DISTANCE FROM PITH. em o 4 5 6 7 9 10 11 12
.. E u ....
0·8
. ::: 0·6 >II:: o II:: 3->-t: 0·4 U> z .... o
0·2
.,:\.�.it- '�i
.�.rtf " 'q
·:'�t l;. · · ;1 . ' "
�t '.:4:' :, ;; ',' t�
PITH
,,� '�fj .':;�
�:��) �!:� .��fJ \� ::::·�!i� :{:; 'i�\: :'IS
�:�� ··c·
:\� r� :lit .� �,:::! ,·a-l :,: : : ... ....
INCREMENT CORE MEASURED
From : Phi l Z i p s � ( Z 9 5 9 ) � The me aa ureme n t of de n s i ty v aria ti on w i t h i n t he growth ring8 in t h in s e a t i on s of wood� us ing b e ta p arti a l e 8 � � l a te l � Fore s t Produat� Re s e arah 1 9 5 9 � (London : H . M. S . O . l OG O ) . By p ermi a o i o n of ll � N. Stationery Ofli ae
-34-

Fi gure ? Fibe r l e ng t h v a r i a t i on aorOS 8 - a s ing l e growth �ing
e "'O e NO
0050
"'0
A
0-2 e m
wood
B _one growth ring _
.)01 0'] r. m
c
3·70 ....- one growth ring_
3*10 early late ]-00 wood wood
0 0'2 0'3 e m
Douglas f'ir lIard HCtple l·lonterey pine
From : Bi s s e t and Dadsw e l l ( l 9 5 0 ) , Varia t i o n s in ce l l Z en g t h wi thin o n e grow t h r i n g of c ertain angi ooperms a nd gymn o op e rmo
A more detailed examination of Fig . . 7a dis closes that the
late wood in Doug las- fir is only 1/4 to 1/3 of the total ring
width , wi th a rather abrupt transition . In the case of Sugar
Maple , and Monterey P ine , the l ate wood is 5 0 % to 7 5 % of the
total ring width , and the transition is much more gradual .
Characteris tics of the species tested in the present experiment ,
as given by Panshin and DeZeeuw (1964) are summari zed in Tab le
11.
Tab le 11 Visible Characteristics of S elected Ring Porous Woods
Species Late Wood Zone (1) Difference
H . Maple R. P ine W. Pine J. Pine \i . Spruce Douglas-fir
narrow narrow-to-wide wide narrow- to-'-lide moderate narrow
fairly dis tinct distinct dis tinct distinct dis tinct very dis tinct
1. Young growth where a difference e xists 2. From Fig . . 7 .
- 3 5-
Transi tion
gradual (2) fairly abrupt gradual abrupt gradual abrupt

It can be seen that in \'1hite Spruce , \'lhite Pine , and Hard
Maple , the trans ition to the denser wood zone is gradual , wh ile
and Douglas- fir for Jack Pine it is fairly abrupt , and Red Pine
have marked changes . Comparing Fig . 7a with 7b , i t can be
and increase the seen that if we decreas e the minimum values
maximum values by equal amounts over a numbe r of growth rings ,
the effect on the area under the curve or average f iber length
wi ll be quite different. For Douglas-fir , whe re the curve is
concave , it wi ll have litt le .effect. In fact , had the upper
portion not gone up fas ter than the lower , the densi ty might
have decreased . For Maple , on the other hand , the average value
should increase over a number of rings because the curve is
convex . Therefore , i f the density of the late wood increases as
fast (or even fas ter as in the case of Dougl as-fir) , the average
density of those species with more gradual trans i tions wi ll
increase als o . From this discussion i t appears pos s ib l e that the
densi ty of a number of the species tes ted actually increased as
the diameter of the twig increased .
S ince the difference in absorption had not been anticipated ,
no volume or densi ty measurements were made prior to the
experiment . In an e ffort to determine the degree of uni formi ty
of the material from whi ch the s amples had been s elected , the
dens ity of a number of · di fferent s i zed twigs of all species
tested was determined s eparately . The results were s tratified ,
and c lass averages were determined. The dens ity averages are
plotted in Fig . 8. Average value s for absprption are also
p lotted in Fig . 8.
- 3 6-

Figure . 8 Relationship between average total absorption and average twig density as a function of average twig size.
j::" J: C,!) w 200 3: >-0:: 0 z
· w > 150 0 tfl l-Z w I-z 100 0 u w 0:: :::> I-en 0 50 ::!:
o 2
6 density 0 water absorbed
Nu m bers r efer to the n u m ber of samples of wh ich t he po in t is an average
4 ' 6 114"
TWIG D I A M E T E R ( m m)
4 4
2 0
10
Figure 9 Relationship between average moisture content and average twig density .
i= :I: � .... 3: >-0:: 0 200 z .... > £ IZ � 150 z o o .... . 0:: � 1;; 100 � MC. 350.0- 336.7· p
��'4---'�5 --�--� D E NSITY (gm/cm3)
- 37 -
·8
;;;-E u .......
'6 E �
. >-I-en Z W
·4 0 C,!) 3: I-
·2

The assumption was made that the density of the soaked
samples was the same as that for comparable siz'ed b1i<]s used for
density determination. Average values for absorption and density
for comparable size twigs were then determined from Pig. 8, and
plotted in Pig. 9. The values obtained closely approxir1ate a
straight line, with a negative slope, which suggests that
adsorption is inversely proportional to the density of the wood.
This seems to be reasonable, since the denser wood would have
fewer air spaces, and therefore could hold less water, (assuming
that the intake of liquid water is proportional to the air space
present). A review of the literature failed to disclose any
evidence which supports or contradicts the premise. Therefore,
additional research will be necessary, involving a greater number
of samples, with greater uniformity, and more accurate
measurements before any definite conclusion can be drawn with
respect to the relationship between absorption and density.
A breakdown of the average density by species and size class
can be seen in Fig. ..10. It is interesting to compare the slope
of the curves with the verbal descriptions listed in Table 11.
The three species with gradual transitions between early and late
wood (Maple, Spruce, White Pine) have the greatest differences,
while Jack Pine has considerably less. Red Pine (not shown) was
highly variable (as was the amount of water absorbed) but showed
no tendency to increase with increasing size. It should be
mentioned, however, that the amount of deterioration of the Red
Pine samples appeared to be less uniform than the other species.
-38-

Figure . 1 0 Re lationship between wood density and average twig size by species .
;;E <J ....... E bO - -5 >-
t-iii z UJ o
-3
2
m aple
Jack p ine
.4 8 10 TWIG DIAMETER ( m m l
Further examination of Table 10 may lead one to believe
that the samples with bark absorbed less than those \-lithout. The
average for all samples was 139% and 17 6% for those with and
without bark, repsectively. This is further compounded by the
fact that the average diameter of the samples with bark was 2.0
nun smaller • The values \-'ere 4.1 nun and 6.1 rom for twigs with and
without bark, respectively. From the previous discussion, the
smaller twigs would be expected to absorb more water. One factor
which cannot be overlooked, however, is that : , �ll samples were
picked from the field... It is to be expected that a twig which
has lost its bark would be more deteriorated than one which has
-39-

not, and therefore it \-lould have a lower density., This cannot be
overlooked, and if this difference does exist, it probably would
account for a large proportion of the difference between the
samples with and without bark.
B. Rate of l"1ater Absorption
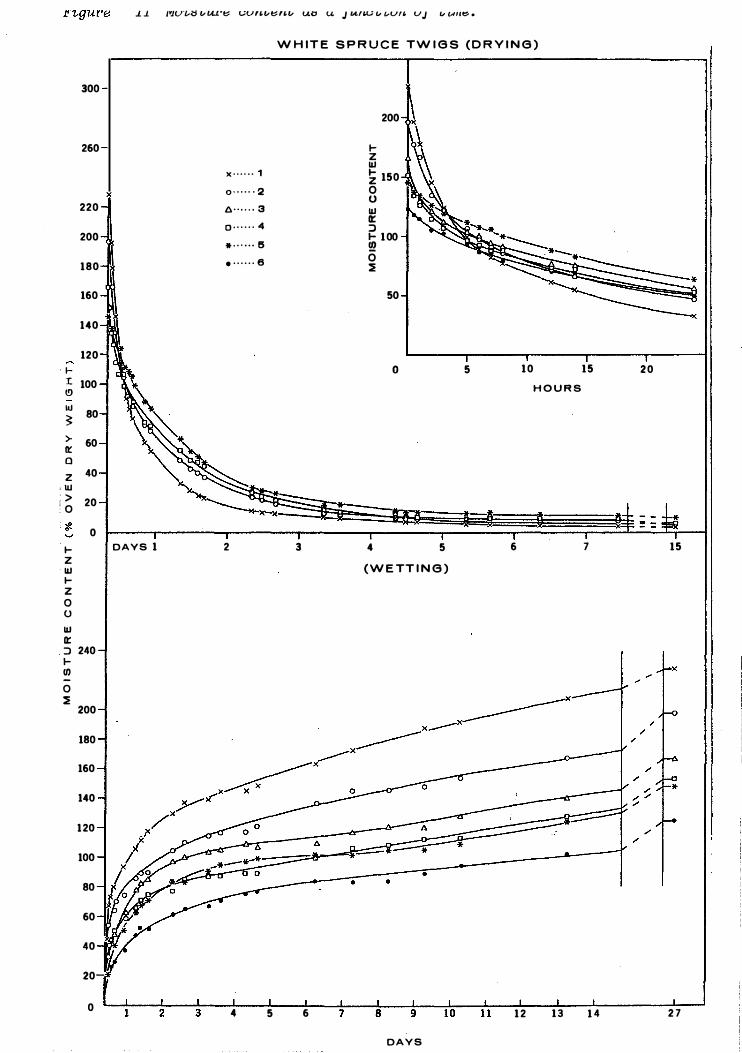
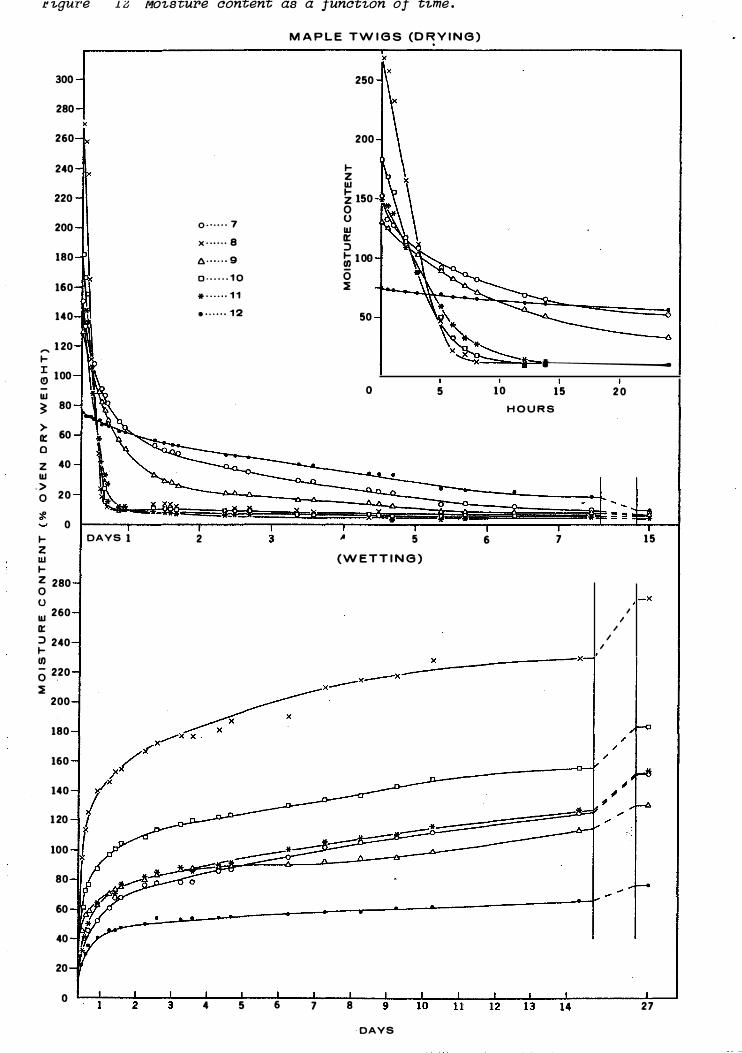
The twigs did not behave as did the foliage samples. For
the foliage, the rates of water absorption differed, but the
final values reached were not too far apart. In the case 'of the
twigs, the final values reached were considerably different.
Figs. 11 through 14 show the adj usted values. , The numbers
adj acent to the symbols refer to the sample numbers listed in
,the appendix. The problem which presents itself is one of
determining what prop'ortion of the differences in rates are due
to the factors which are being measured (brig size and bark) and
how much is simply a function of the differences in total
absorption.
The nature of the results are such that the effect of size
on rate of diffusion cannot be easily separated from the effect
of size on total absorption. Naturally, the rates of absorption
in the smaller brigs are faster than those in the larger ones.
The question is whether they are even faster than what would be
expected due to the different amounts absorbed. Rates of
absorption for the various size classes were determined for a
number of periods, and are presented in the appendix. Hhat is
more pertinent for the present discussion, these rates were
divided by the total amount of water absorbed by each class.
Comparison of the relative rates of absorption as a percent of
the total moisture gained indicates a slight dmm\-lard trend as
- 40-
300
260
x 220
200
180
160
140
120
' l-I 100 l!) w
80 � > 60 II:: Q Z 40
, W : > : 0 20
� 0
I-Z III I-Z 0 () III II:: ::> 240 l-II) -0 ::E
200
180
160
140
1 20
100
80
60
40
20-
0
.L .L l'lU'LA;;; v UL'� (';u" v � " v u.o u. J tA.1"-' V vVf£ V J V 1"1It:> _
W H IT E S P R U C E TW I G S (D R Y I N G )
DAYS 1
x · · · · · · 1 0 · · · · · · 2 6 · · · · · · 3 0 . . . . . . 4 * . . . . . . !5 . . . . . . . 6
2
4
..
3
5 6
IZ III
200
� 150 o () III II:: ::> I- 1 00 !a o ::E
50
o
4 5
(W E TT I N G )
D A Y S
5 1 0
H O U R S
6
1 2 1 3
1 5 2 0
7 1 5
x
1 4 2 7
J! 1-gure 1 � M01-st;Ul'e aont;ent; as a Junat1-0n of" time .
300
280
260
240
220
200
180
160
140
,... 1 20 � 1: 100 (!) -w
� 80
> 60 II::
0
Z 40 w
, > 0 20
� 0
� Z w � z 280 0 0 w 260
II:: ::J 240 � (fJ o 220
� 200
180
160
140
1 20
100
80
60
40
20
0
)(
DAYS 1
0 . . · · · · 7 x · · · · · · 8 1:;. · · · · · · 9 0 · · · · · · 1 0 * . . . . . . 1 1 • . . . . . . 1 2
2
4 5
3
6
M A P L E TW I G S (O � Y I N G )
7
� z w
250
200
� 150 o o w II:: ::J � 1 00
o �
50
o
)( )(
� 5
(W ETT I N G )
8
DAYS
* i\
�* )( ::::::::-.- .t--------------__a.
5 1 0 1 5 2 0
H O U R S
6 7
I ,
I I
I
1 5
)(
27

280
260
240
220
200
180
160
140
120 ,... ... J: 100 (!)
III
� 80 > 60 0: 0
Z 40 III > 20 0 'j. 0 ... DAYS 1
! z I III ...
Z 0 U
III 0: :J .... II) 0 210 ::e 200
180
160
140
120
100
80
60
40
20
0 2 3
0 . · . . . . 1 3
x · · . · · · 1 4 6 · · · · · · 1 5 0 . . . . . . 1 6
• . · . · . . 1 8
2
W H IT E P IN E TW I G S (D R Y I N G )
3
7
. ... Z III
200
� 150 o u III 0: :J ... 100 II) (5 ::e
50
4 5 (W ETT I N G )
8 9 10 DAYS
5 10
6
15 20 H O U R S
i ii
7 15
x
27

Figure 14 Moisture aontent as a funation of time .
J A C K P I N E TW I G S (D R Y I N G )
280 200
260 I-Z IIJ 240 0 · · · · · · 1 9 � 150
6 · · · · · · 22 0 0
220 0 · · · · . . 24 IIJ It * . . . . . . 25 :l
200 I- 100 . · · · · · · 26 IIJ
(5 180 �
160 50
140 � •
120 I- 0 5 1 0 1 5 20 I: 1 00 H O U R S (!) -IIJ � 80
> 60 It
0
· z 40 IIJ >
20 0
� 0
I- DAYS 1 2 3 4 5 6 7 1 5 z
( W E TT I N G ) IIJ I-z 0 0
IIJ It :::> 240 I-IIJ - 220 0
� 200 0 0 0
180
160
* 140 ...
... * *--* ,.
120 *
100
80
60
40
20
0 1 8 9 10 1 1 12 2 7
DAYS

si ze increases in the smaller si zes, bu t this does not continue
through the larger si ze classes. Sample vari ation and a small
sample size may be the reasons for this. Comparing the magni tude
of the difference between fastest and slowest rates, we can see
that during all three periods, ( 5 , 1 2 and 48 hours), the fastest
absolute rate is about blice as fast as the slowest. The
difference between the relative rates i s about one and a half to
one during the five and twelve hour periods, and decreases to
almost no di f ference at 48 hours. This suggests that, initially,
the slower absolute rate of absorpti on for larger sized twigs is
due to both slower dif fusi on rates and lower total water gain.
Under prolonged soaking the di fference in amounts absorbed seems
to become more important.
Further compounding the problem, Rees ( 19 3 8 ) found that the
rate of liquid water loss increased with decreasing densi ty.
Presumably the same relationship holds for moisture gain. Linton
( 19 6 2 ) found that response time (below the f i ber saturation
point) increases wi th increasi ng thi ckness of wood, although not
i n proportion to the square of the thickness as Kuebler ( 19 57 )
suggests. Byram ( 19 6 3 ) suggests that for fine material i t may be
more on the order of the first povler of the thickness. The
present experiment i ndicates that for twigs less than 6 mm in
diameter a fourfold i ncrease in diameter makes a di fference of
only 50 percent in the rate of di ffusion. Diffusi on does not
appear to be the limit ing factor i n f ine bligs as i t may be in
larger material.
-45-

The difference with and without bnrk is sl� qh tly eu sier to
demonstrate. Compuring the relntive rntios behlCen the blO, we
see that during the first five hours the bTi�Js \-Jithout bark gain
water almost twice as fast as those with bark . During the twelve
hour period, the ratio drops to 1. 6 : 1, and during the 4 8 hour
period it is 1 . 3 : 1 . From the present study it� can be concluded
that the presence of bark on small twigs reduces the rate of
water absorption by about one half . This is less thnn what would
be expected from the work of Reifsnyder (1967), \" ho gives values
for moisture dif fusivity through bark of 1/4 to 1/8 that of wood.
It should be noted that the single bark thickness of all samples
was only about 0. 4 mm , so that a reduction of 1/2 may not be out
of line . No doubt thicker bark \'lOuld be more ef fective in
reducing dif fusion .
C. Rate of Water Loss
Prior to processing the data, certain samples had to be
eliminated due to the fact that the bark had cracked or separated
from the wood during soaking. Examination of the drying curves
indicated that Maple No. 9, and White Pine No. 1 3 did not . behave
as did the other samples with tight bark . The samples were
examined and found to have loose bark . The curves indicate, as
would be expected, that loose bark modifies the rate of diffusion
so that it lies bet\'leen what would be expected with tight bark
and no bark at all .
Considering the effect of t\·lig size on the rate of drying,
about the same results are obtained as with the wetting portion.
A summary of the drying data can be found in the appendix . Hhile
the actual rates of change of the smallest t\'ligs is about five
-46-

times as fast uS the largest during - the first five hours , the
rates as a percent of the total change are j ust about double . We
can, therefore, conclude again that a fourfold increase in siz e
halves the rate of loss (in relative terms) . The ratio is reduced
by the end of the twelve hour pe riod , because many of the twigs
are approaching their equilibrium values . By the end of the 48
hour period, all twigs except the larger ones with bark have
reuched equilibrium with room conditions .
The effect of bark is clearly seen. Initially, the twigs
. without bark dry almost three times as fast as those with bark
(when the rate is measured as a percent of the total ultimate
change). During the twelve hour period, the difference is
reduced only slightly. By the end of the 48 hour period,
however, there is very little difference in the average rates , as
most of the brigs have nearly completed drying .
Looking at the percent of the total change completed, it can
be seen that all but the largest twigs without b ark are close to
the equ�librium moisture content within twelve hours. Even after
48 hours , the fastest twig \orith b ark has only completed 90% of
the total change, and the slmlest 39% .
The fact that all b ut the larger twigs without bark approach
a constant rate of loss initially indicates that diffusion is not
the main limiting factor in the smallest b,'lig siz es (6 mm and
less). It must be concluded, therefore, that the difference in
the rate of loss in the smaller brigs is due entirely to the
presence of bark.
-47-

The effect of bark does not appear to be constant, but
rather it seems to be of increasing importance with increasing
twig size. In the smallest sizes, the ratio of rates of loss of
the twigs without bark to those with was 1.7 : 1, while for the
largest size it was 4.7 : 1. It appears that as twig size (and
hence bark thickness) increases, bark becomes ,more effective in
reducing the passage of water.
The fact that most of the twigs with bark and the , larger
ones without bark did not dry at a rapid and constant rate
. initially is attributed to the fact that most of the surface
water was removed prior to drying.
Comparing the average rates of wetting and drying for all
twig samples given in the appendix , it can be seen that, on the
average, drying is about 1.4 times as fast as wetting. As
previously mentioned, this is what one would expect, considering
the added diffusion potential of evaporation during the drying
process.
D. Effects of Immersion in Hater
The loss of weight during the experiment is summarized by
size classes in Table 12.
Table 12 Size Class
(Dia. in mm)
1.0 - 3.0 3.1 - 5.0 5.1 - 7.0 7.1 - 9.0 9.1 +
Loss of Height by Size Class Average Loss
(in Percent of Oven Dry Height)
-48-
17.8% 11.6% 11.7%
9.4% 5.1%
It can be seen that the smal lest twigs los t 3 . 5 times as
much material ( in terms of percent 6f oven dry weight) as the
largest size . This is reasonable , considering that the cambi al
region contains most of the young material , and is most active ly
involved in the trans location of the various nutrients required
by the tree . These subs tances are generally s o lub le , hence - the
greater is the proportion of cambial tissue in relation to the
entire twig , the greater wi l l be the amount of material
dis solved .
E . Comparis on o f Twigs with Foliage
There does not appear to be a valid
twigs with foliage . Every method used
basis for comparing
leads to a different
conclusion . There are so many complicating factors involved that
such a comparis on would be of questionable value , i f it were
attempted . . However , a few general comments would be appropriate
at this time .
The smalle s t twigs , ( 3 mm and less ) , without bark lose water
at about the s ame rate as the old needles . The time lags for
both are short , ( 5 hours or less ). , and the drying rates are
rapid. The sorption r ates of even the smallest twigs with bark
are s lower , and the time lags are longer than any o f the foli age
samples . Las tly , the twigs show a greater difference between
wetting and drying than the foliage s amples .
- 49-

F. Conclusions Twigs
1. There is a considerable difference in the amount of water
that can be absorbed by different sized bligs of a single
species for twigs 6 rnrn or less in diameter. The smallest
twigs absorb the most. The amount of \'later absorbed may be
a function of the density of the material.
2. Small twigs without hark will gain water about twice as fast
as those with bark. They will lose it two to five times as
fast.
3. With respect to twigs 6 mm or less in diameter, a fourfold
increase in size reduces the relative moisture content
change by a ratio of about 1.5 to 1,
absolute amount of water absorbed.
irrespective of the
The actual rate of
change is reduced by about two to one. The difference
between the two is primarily a function of the difference in
total water absorbed.
4. As bark thickness increases, its effectiveness in retarding
the diffusion of water also increases during the drying
process. This is not apparent during the wetting phase.
-50-

SUHHARY
To investigate moisture content chanqes above the fiber
saturation point a number of foliage and twiq samples were soaked
for an extended period and then dried. The most i�portant
problem encountered was loss of weight � by the saMples during
soaking. A number of possible reasons for the weiqht loss are
discussed. The most likely answer appears to be the di�solving
of soluble substances within the samples.
The results indicate that there is a difference in total
water retention and sorption rates between the various foliage
samples. Grass and Haple leaves absorb considerably more than
the other samples tested, and the sorption rate is faster. Red
pine absorbed less than the other samples, and the sorption rate
was much slower. Weathered needles absorb water faster than
freshly fallen material. This is thought to be due to the outer
cuticle wax layer.
With respect to the twig samples, the maj or probleM
encountered was the large range in total water absorption by a
number of twigs of the same species. The smallest twigs absorbed
the most water in terms of percent of oven dry \'leiqht. This
difference is tentatively attributed to a difference in twig
density, with density increasing as twig size increases.
The results indicated that the small twigs vrithout bark gain
and lose water two to five times as fast as those with bark. A
fourfold increase in twig size reduces the average sorption rate
by about 1.5: 1, (when the effects of . the differences in total
absorption are eliminated).
-51-

1 . Bisset,
REFE REN CES
I. J. W. and H. E . Dackwell . 1950 . length within one growth angi osperms and gymnosperms. v. 14 : No. 1, pp . 17-29 .
variations in cell ring of certain
Australian Forestry,
2 . Byram, G . M . 1963. An analysis of the dryi ng process in forest material . Paper presented at 1963 International Symposium on Humidity and Hoisture, Washington, D . C . May 20-23.
3. Kuebler, II . 1957. Holzals Roh-und Uerkstaff, 15, 453 . {English transl . : U . S. Dept . Agr . , Forest Sci ence,
F . P. L . , Translation No. 365 (1958).
4. Linton, M. 1962. Report on moisture variation in forest fuels, prediction of moisture content . Commonwealth of Australia, C . S . I . R.O. , Div .
Physi cal Chemistry, Melbourne .
5 .
6.
7.
Lurie, M. and N. Michai loff. 1936. Evaporation water surface . Indus . and Engin . Chem. 345-349 .
from free V. 28, pp.
Panshin,
Phillips,
A . J . and C. technology. pp .
DeZ eeuw . 1964. Textbook of wood McGraw-Hill Book Co. , New York, 643
E . W . , et al e 1962. The measurement of densi ty variatIOn1Within the growth rings in thin sections of wood, using Beta particles. Jour. Inst . l'1ood Sci . , 1962: No. 10, pp. 11-28.
8 . Rees, L . W . and S . J . Buckman . 1938 . Hoisture movement in wood above the fiber saturation point . Jour . Agr . Res., V. 57 : No. 3, pp . 161-187 .
9. Reifsnyder, W. E . , et ale 1967. Thermophysical properties of bark or snortleaf, longleaf, and red pine. Yale Sch. For., New Haven, Conn . Bull . No. 7 0, 41 p.
10. Simard, A.J. 1968 . The moisture content of forest fuels I ; a review of the basic concepts . Canada, Dept. Forestry and Rural Dev., Info. Rpt. FF-X-14 .
11 . Stocks, B . J . and J.D. Walker . 1967. Duff moisture content profiles at Petawawa . Unpublished report on file at Petawawa F.E.S.
12. Wright, J . G. 1930. The i nfluence of weather on the inflammability of forest fire fuels . Canada, Dept. Interior, Forest Fire Hazard Paper No. 1.
- 5 2-

13. Wright, J.G. 1935. Research i n forest protection. Canada, Dept. Interior, Forest F ire Research Note No. 1.
14. Wright, J.G. and II . W . Beall. 1940. Preliminary improved forest fire hazard tables for Eastern Canada. Canada Dept. Hines & Resources, Lands, Parks and
Forests Br., For. Fire Res. Note. No. 5.
-53-

APPENDIX
This appendix contains lists of all data from the soaking experiment . It also contains the summaries of wetting and drying information over a number of periods referred to in the paper .
List of Tables
1 . List of Foliage Samples
2 . Foliage Sample Weights - Wetting Phase
3 . Foliage Sample Weights - Drying Phase
4 . Summary of Foliage Wetting Measurements
5 . Summary of Foliage Measurements during S elected Time Intervals
6 . Summary of Foliage Drying Measurements
7 . List of Twig Samples
8 . Twig Sample Weights - Wetting Phase
9. Twig Sample Weights - Drying Phase
1 0 . Summary of Twig Wetting Measurements
11 . Summary of ·Twig Drying Measurements
1 2 . Summary of Twig T ime Lag Measurements
- 5 4-

TABLE 1
No .
1
2
3
4
5
6
7
8
9
1 0
LIST O F FOLIAGE SAMPLES
Name
Maple Leaves
Spruce (old)
Spruce (new)
Jack Pine (old)
Jack Pine (new)
Grass
Red P ine (old)
Red Pine (new)
White Pine (old)
White Pine (new)
-55-

TABLE 2
FOLIAGE SAMPLE WEIGHTS - WETTING PHASE (UNADJUSTED)
Time 1 2 3 4 5 6 7 8 9 1 0
0 . 0 2 . 00 1 . 90 1 . 85 1 . 90 1 . 90 2 . 08 1 . 7 8 1 . 61 1 . 57' 1 . 80 1 . 0 2 . 58 3 . 03 2 . 53 3 . 01 2 . 48 5 . 60 2 . 40 1 . 99 2 . 87 " 2 . i7 1 . 5 3 . 17 3 . 30 2 . 60 3 . 45 2 . 7 2 5 . 60 2 . 54 2 . 25 3 . 38 2 . 46 2 . 0 3 . 8 6 3 . 41 2 . 71 3 . 51 2 . 55 6 . 25 3 . 26 2 . 41 3 . 28 2 . 38 3 . 5 4 . 59 3 . 93 2 . 91 4 . 12 3 . 15 6 . 40 3 . 20 2 . 60 4 . 41 3 . 35 4 . 5 4 . 61 4 . 06 3 . 10 4 . 20 3 . 24 7 . 29 3 . 22 2 . 74 4 . 10 3 . 17 6 . 5 5 . 13 3 . 99 3 . 06 4 . 20 3 . 21 7 . 21 3 . 17 2 . 39 4 . 30 3 . 29
11 . 5 5 . 71 3 . 99 3 . 45 4 . 31 3 . 39 7 . 09 3 . 26 2 . 45 4 . 84 3 . 00 23 . 0 5 . 86 4 . 07 3 . 80 4 . 29 3 . 60 6 . 80 3 . 45 2 . 70 4 . 80 3 . 03 26 . 0 6 . 00 3 . 96 3 . 90 4 . 60 3 . 87 6 . 88 3 . 43 2 . 62 4 . 73 3 . 30 31 . 0 6 . 14 4 . 27 4 . 00 4 . 74 3 . 91 6 . 88 3 . 50 2 . 81 4 . 7 9 3 . 43 37 . 0 6 . 05 4 . 47 4 . 24 5 . 09 4 . 20 7 . 23 3 . 7 9 3 . 00 5 . 12 3 . 50 47 . 0 6 . 01 4 . 4 2 4 . 07 4 . 95 4 . 28 7 . 4 2 4 . 02 3 . 07 5 . 04 3 . 76 53 . 0 6 . 11 4 . 3 2 4 . 32 5 . 08 4 . 38 7 . 39 3 . 93 3 . 20 5 . 10 3 . 7 2 71 . 0 6 . 07 4 . 57 4 . 31 5 . 14 4 . 48 7 . 30 4 . 29 3 . 40 4 . 87 4 . 17 83 . 0 6 . 15 4 . 70 4 . 39 5 . 18 4 . 62 7 . 49 4 . 20 3 . 5 6 5 . 02 4 . 19 98 . 0 6 . 17 4 . 69 4 . 40 5 . 24 4 . 76 7 . 40 4 . 30 3 . 63 5 . 08 4 . 33
143 . 0 6 . 10 4 . 77 4 . 49 5 . 13 4 . 91 7 . 50 4 . 41 3 . 88 5 . 02 4 . 50
OVen Dry Weights
1 . 13 1 . 51 1 . 4 2 1 . 52 1 . 53 1 . 64 1 . 57 1 . 43 1 . 29 1 . 58
Weight Los t During Experiment
0 . 78 0 . 25 0 . 31 0 . 19 0 . 21 0 . 23 0 . 06 0 . 06 0 . 13 0 . 07
- 56-

TABLE 3
FOLIAGE SAMPLE WEIGHTS - DRYING PHASE
Time 1 2 3 4 5 6 7 8 9 10
0 . 0 6 . 10 4 . 77 4 . 49 5 . 13 4 . 91 7 . 50 4 . 41 3 . 88 5 . 02 , 4 . 50 0 . 75 5 . 51 4 . 40 4 . 19 4 . 68 4 . 57 6 . 45 4 . 00 3 . 58 4 . 53 4 . 21 1 . 5 4 . 92 4 . 01 3 . 98 4 . 08 4 .. 34 5 . 31 3 . 75 3 . 44 3 . 92 4 . 00 2 . 0 4 . 62 3 . 83 3 . 91 3 . 8 6 4 . 27 4 . 77 3 . 51 3 . 41 3 . 66 3 . 91 2 . 5 4 . 39 3 . 62 3 . 85 3 . 60 4 . 15 4 . 3 2 3 . 41 3 . 39 3 . 38 3 . 87 3 . 0 4 . 05 3 . 40 3 . 75 3 . 33 4 . 06 3 . 87 3 . 26 3 . 35 3 . 02 3 . 79 4 . 0 3 . 62 3 . 16 3 . 63 2 . 97 3 . 94 3 . 32 3 . 10 3 . 3 2 2 . 64 3 . 70 4 . 5 3 . 35 2 . 98 3 . 57 2 . 7 2 3 . 86 2 . 98 3 . 00 3 . 24 2 . 44 3 . 67 5 . 0 3 . 02 2 . 84 3 . 52 2 . 52 3 . 80 2 . 7 2 2 . 93 3 . 23 2 . 28 3 . 60 6 . 0 2 . 48 2 . 64 3 . 43 2 . 27 3 . 70 2 . 46 2 . 8 2 3 . 17 2 . 05 3 . 53 7 . 0 1 . 88 2 . 39 3 . 30 2 . 00 3 . 59 2 . 20 2 . 7 2 3 . 11 1 . 81 3 . 43 8 . 0 1 . 65 2 . 27 3 . 20 1 . 90 3 . 50 2 . 13 2 . 62 3 . 04 1 . 69 3 . 33
10 . 5 1 . 40 2 . 06 2 . 95 1 . 81 3 . 26 2 . 00 2 . 44 2 . 89 1 . 58 3 . 10 11 . 5 1 . 39 2 . 01 2 . 90 1 . 80 3 . 21 2 . 00 2 . 41 2 . 86 1 . 57 3 . 08 23 . 5 1 . 26 1 . 7 3 2 . 13 1 . 74 2 . 52 1 . 90 2 . 00 2 . 30 1 . 50 2 . 4 2 25 . 0 1 . 25 1 . 73 2 . 07 1 . 74 2 . 45 1 . 90 1 . 98 2 . 24 1 . 49 2 . 38 27 . 0 1 . 25 1 . 70 1 . 97 1 . 73 2 . 38 1 . 90 1 . 92 2 . 17 1 . 49 2 . 29 28 . 5 1 . 24 1 . 70 1 . 91 1 . 71 2 . 30 1 . 88 1 . 91 2 . 10 1 . 48 2 . 23 3 0 . 5 1 . 23 1 . 70 1 . 83 1 . 71 2 . 22 1 . 88 1 . 88 2 . 02 1 . 47 2 . 18 31 . 5 1 . 22 1 . 69 1 . 81 1 . 71 2 . 20 1 . 88 1 . 86 2 . 01 1 . 47 2 . 14 47 . 5 1 . 22 1 . 67 1 . 59 1 . 71 1 . 87 1 . 88 1 . 77 1 . 71 1 . 47 1 . 84 49 . 5 1 . 22 1 . 66 1 . 59 1 . 71 1 . 84 1 . 88 1 . 75 1 . 68 1 . 47 1 . 83 52 . 5 1 . 22 1 . 65 1 . 59 1 . 71 1 . 83 1 . 88 1 . 75 1 . 68 1 . 47 1 . 8 2 55 . 5 1 . 22 1 . 65 1 . 54 1 . 71 1 . 81 1 . 88 1 . 75 1 . 63 1 . 47 1 . 82 71 . 5 1 . 22 1 . 65 1 . 54 1 . 71 1 . 71 1 . 85 1 . 7 2 1 . 58 1 . 44 1 . 73 75 . 0 1 . 22 1 . 65 1 . 54 1 . 71 1 . 71 1 . 8 5 1 . 7 2 1 . 58 1 . 44 1 . 73 79 . 5 1 . 22 1 . 65 1 . 54 1 . 71 1 . 71 1 . 85 1 . 7 2 1 . 58 1 . 44 1 . 73 95 . 5 1 . 22 1 . 65 1 . 54 1 . 71 1 . 69 1 . 85 1 . 7 2 1 . 55 1 . 44 1 . 73
-57-

I U1 co I
TABLE 4 SUMMARY OF FOLIAGE WETTING MEASUREMENTS
To tal Water Absorb e�j Surface Water Net Total Water
Time of Rate Change (Hrs . from Start) 2 / M. C . a t Rate10f Chang� Actua
As Fraction of Total
Rate of Increase ( %/hr) Rapid Rate Period
Actual As Fractiop of Total
Time Lag (hr s ) Rat e of Increase (%/hr ) Time Lag P eriod
Actual As Fraction of Total
Moisture Content at End o f Time Lag P eriod
Maple Leaves Grass
440% 357% . 52% 75% 388% 282%
13 · 4 350% 3 20% . 80 . 89
26 . 3 7 7 . 0 . 062 . 222
6 2
44 . 8 106 . 105 . 315
277% 2 25%
Whit e Spruce Ave . New Old
216% 216% 216% 30% 29% 50%
177% 187% 166%
4 . 5 4 5 119% 96% 143% . 55 . 44 . 66
24 . 4 22 . 0 26 . 8 . 122 . 110 . 13 2
7 11 3
26 . 6 11 . 6 41 . 6 . 090 . 05 7 . 210
136% 136% 136%
1/A11 moisture contents are in % oven dry weight .
1:./ Moisture', Content
Whit e Pine Ave . New Old
237% 185% 289% 63% 47% 78%
175% 138% 211%
7 4 10 186% 106% 265% . 75 . 57 . 92
24 . 8 24 . 2 25 . 3 . 107 . 14 2 . 09 2 16 . 5 2 9 4
23 . 1 3 . 7 4 2 . 5 . 038 . 022 . 158
145% 116% 182%
Red Pine Jack Pine Ave . New Old Ave . New Old
176% 171% 181% 229% 221% 238% 37% 37% 37% 42% 30% 54%
139% 134% 144% 188% 191% 184%
5 7 3 5 6 4 9 2% 85% 98% 132% 107% 157%
. 52 . 50 . 54 . 57 . 48 . 66
20 . 2 11 . 0 29 . 3 27 . 5 16 . 2 38 . 8 . 104 . 07 1 . 180 . 114 . 080 . 165
30 37 23 13 . 5 24 3
3 . 6 2 . 7 4 . 5 25 . 7 5 . 4 4 6 . 0 . 021 . 017 . 027 . 047 . 028 . 210
111% 108% 114% 111% 139% 150%

TABLE ·5
SUMMARY OF FOLIAGE MEASUREMENTS DURING SELECTED TIME INTERVALS
Maple White Spruce Whit e Pine Red Pine Jack P ine Leaves Grass Ave . New Old Ave . New Old Ave . New Old Ave . New Old
Moisture Content Change End of First 5 hrs .
Drying 275% 285% 98% 68% 128% 130% 57% 204% 73% 4 3% 103% 120% 71% 168% Wetting 249% 317% 115% 95% 135% 142% 96% 188% 81% 6 7 % 95% 118% 151% 86%
Rat e of Change ( %/hr) During Fir s t 5 Hours
Drying 55 . 0 5 7 . 0 1 9 . 6 13 . 6 25 . 6 26 . 0 11 . 4 40 . 8 14 . 6 8 . 6 20 . 6 24 . 0 14 . 2 33 . 6 Wet t ing 49 . 8 63 . 4 23 . 0 19 . 0 27 . 0 28 . 4 1 9 . 2 37 . 6 16 . 2 13 . 4 19 . 0 23 . 6 17 . 2 30 . 2
Moisture Content Change End o f Firs t 12 hrs .
I Drying 429% 345% 152% 116% 187% 178% 91% 2 64% 106% 7 1% 140% 166% 113% 219% U'1 Wet ting 331% 3 25% 130% 117% 142% \.0 171% 86% 256% 85% 64% 106% 138% 109% 167% I
Rat e of Change ( %/hr) During Firs t 12 hrs .
Drying 35 . 8 28 . 8 12 . 7 9 . 7 15 . 6 14 . 8 7 . 6 22 . 0 8 .• 8 5 . 9 11 . 7 13 . 8 9 . 4 18 . 2 Wetting 27 . 6 27 . 1 10 . 8 9 . 8 11 . 8 14 . 2 7 . 2 21 . 3 7 . 1 5 . 3 8 . 8 11 . 5 9 . 1 13 . 9
Moisture Content at End of 2nd 48 hrs . , . .
Actual 400% 340% 182% 180% 184% 210% 135% 285% 140% 122% 158% 202% 179% 225% As Fraction of Total . 91 . 95 . 84 . 83 . 85 . 86 . 73 . 99 . 7 9 . 71 . 87 . 88 . 81 . 95
Rat e of Increase ( %/hr) During 2nd 48 hrs .
Actual 1. 04 0 . 42 1 . 31 1 . 75 0 . 85 0 . 50 0 . 60 0 . 42 1 . 00 0 . 7 7 1 . 25 1 . 46 1 . 50 1 . 42 As Fraction of Total . 0022 . 0012 . 0060 . 0081 . 0039 . 0022 . 0033 . 0014 . 0056 . 0044 . 0069 . 0064 . 0069 . 0060
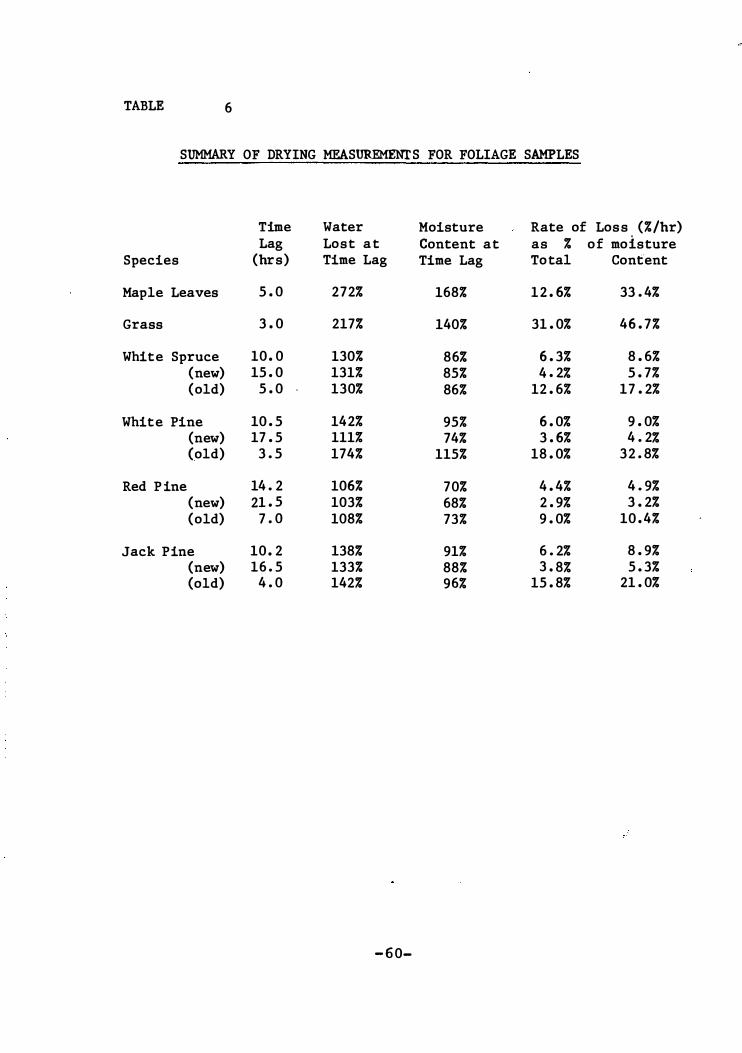
TABLE 6
SUMMARY OF DRYING MEASUREMENT S FOR FOLIAGE SAMPLES
Time Water Moisture Rate of Los s (%/br) Lag Los t a t Content at as % o f moisture
Species (br s ) Time Lag Time Lag To tal Content
Maple Leaves 5 . 0 272% 168% 1 2 . 6% 33 . 4%
Grass 3 . 0 217% 140% 31 . 0% 46 . 7%
Whit e Spruce 10 . 0 130% 86% 6 . 3% 8 . 6% (new) 15 . 0 131% 85% 4 . 2% 5 . 7% (old) 5 . 0 130% 86% 12 . 6% 17 . 2%
Whit e Pine 10 . 5 142% 95% 6 . 0% 9 . 0% (new) 17 . 5 111% 74% 3 . 6% 4 . 2% (old) 3 . 5 174% 115% 18 . 0% 3 2 . 8%
Red P ine 14 . 2 106% 70% 4 . 4% 4 . 9% (new) 21 . 5 103% 68% 2 . 9% 3 . 2% (old) 7 . 0 108% 73% 9 . 0% 10 . 4%
Jack Pine 10 . 2 138% 91% 6 . 2% 8 . 9% (new) 16 . 5 133% 88% 3 . 8% 5 . 3% (old) 4 . 0 142% 96% 15 . 8% 21 . 0%
- 6 0-

TABLE 7
LIST OF TWIG SAMPLES Average
No . Species Bark Diameter (mm)
1 White Spruce x 1 . 6 2 " " x 2 . 9 3 " " x 3 . 5 4 " " x 4 . 8 5 " " x 4 . 6 6 " " x 6 . 4 7 Maple 2 . 8 8 " x 4 . 0 9 " x 4 . 0
10 " 5 . 3 11 " 7 . 6 12 " x 8 . 2 13 White P ine x 2 . 2 14 " " 3 . 1 15 " " x 5 . 2 16 " " 4 . 5 18 " " 6 . 7 1 9 Jack P ine 2 . 4 22 " " 4 . 2 24 " " 7 . 1 25 " " 9 . 1 26 " " 14 . 4
Data for Whit e P ine No . 17 , Jack Pine No . 21 , and all Red P ine are not included in this appendix because the data for these samples was variable . They are touched upon only briefly in Tab l e 3 . 3 . Jack P ine No . 20 was eliminated prior to the s tart of the experiment .
- 6 1-

TABLE 8
Elapsed Time Days Hours
0 . 0 1 . 0 3 . 0 4 . 5 9 . 5
22 . 0 1 1 . 0 1 6 . 0 1 22 . 5 2 5 . 0 2 22 . 0 3 4 . 5 3 23 . 0 4 7 . 0 5 22 . 0 6 23 . 0 7 22 . 0 8 23 . 0 9 22 . 0
13 23 . 0 14 22 . 0 15 23 . 0 16 22 . 0 19 23 . 0 21 22 . 0 24 1 . 0 26 2 2 . 0
TWIG SAMPLE WEIGHTS - WETTING PHASE ( grams)
1 2 3 4 5 6 7
2 . 00 2 . 00 0 . 7 2 1 . 38 0 . 88 0 . 78 1 . 77 2 . 7 5 3 . 00 0 . 95 1 . 80 L OO 0 . 89 2 . 18 2 . 88 3 . 10 0 . 91 1 . 81 1 . 05 0 . 93 2 . 26 2 . 95 3 . 22 0 . 93 1 . 90 1 . 10 0 . 95 2 . 36 3 . 10 3 . 44 1 . 00 1 . 98 1 . 19 1 . 00 2 . 44 3 . 33 3 . 62 1 . 10 2 . 07 1 . 29 1 . 07 2 . 57 3 . 34 3 . 74 1 . 13 2 . 13 1 . 31 1 . 10 2 . 67 3 . 35 3 . 83 1 . 15 2 . 17 1 . 32 1 . 10 2 . 67 3 . 57 4 . 02 1 . 21 2 . 20 1 . 42 1 . 16 2 . 81 3 . 68 4 . 13 1 . 22 2 . 28 1 . 39 1 . 18 2 . 83 3 . 73 4 . 15 1 . 24 2 . 31 1 . 43 1 . 20 2 . 83 3 . 7 7 4 . 23 1 . 25 2 . 31 1 . 46 1 . 22 2 . 80 3 . 73 4 . 22 1 . 27 2 . 3 2 1 . 48 1 . 25 2 . 90 3 . 80 4 . 30 1 . 26 2 . 31 1 . 49 1 . 26 2 . 93 4 . 03 4 . 5 2 1 . 27 2 . 43 1 . 4 9 1 . 30 3 . 03 4 . 17 4 . 69 1 . 31 2 . 50 1 . 50 1 . 30 3 . 13 4 . 17 4 . 7 9 1 . 33 2 . 51 1 . 53 1 . 30 3 . 18 4 . 20 4 . 90 1 . 33 2 . 55 1 . 53 1 . 34 3 . 23 4 . 27 4 . 96 1 . 36 2 . 56 1 . 55 1 . 36 3 . 27 4 . 47 5 . 16 1 . 42 2 . 7 2 1 . 65 1 . 40 3 . 43 4 . 44 5 . 11 1 . 4 2 2 . 70 1 . 65 1 . 42 3 . 44 4 . 52 5 . 15 1 . 48 2 . 73 1 . 67 1 . 4 2 3 . 53 4 . 53 5 . 15 1 . 47 2 . 73 1 . 67 1 . 42 3 . 53 4 . 70 5 . 27 1 . 48 2 . 80 1 . 71 1 . 48 3 . 69 4 . 78 5 . 12 1 . 48 2 . 81 1 . 73 1 . 50 3 . 74 4 . 67 5 . 23 1 . 50 2 . 87 1 . 7 7 1 . 51 3 . 7 2 4 � 81 5 . 32 1 . 55 2 . 93 1 . 78 1 . 52 3 . 62
Oven Dry Weights 1 . 62 1 . 62 0 . 58 1 . 16 0 . 7 2 0 . 68 1 . 50
Weight Lost During Experiment
0 . 27 0 . 28 0 . 10 0 . 16 0 . 09 0 . 07 0 . 17
- 62-
(UNADJUSTED)
8 9 10 11
1 . 00 1 . 91 . 1 . 25 2 . 40 1 . 73 2 � 56 1 . 85 3 . 00 1 . 89 2 . 74 1 . 97 3 . 15 1 . 99 2 . 7 7 2 . 01 3 . 38 2 . 10 2 . 83 2 . 12 3 . 65 2 . 15 2 . 95 ' 2 . 24 3 . 78 2 . 21 3 . 00 2 . 28 3 . 7 9 2 . 23 3 . 03 2 . 32 3 . 90 2 . 3 2 3 . 10 2 . 36 4 . 00 2 . 37 3 . 16 2 . 41 4 . 05 2 . 40 3 . 20 2 . 45 4 . 12 2 . 40 3 . 22 2 . 48 4 . 13 2 . 43 3 . 22 2 . 50 4 . 16 2 . 48 3 . 27 2 . 52 4 . 20 2 . 52 3 . 27 2 . 58 4 . 39 2 . 68 3 . 29 2 . 62 4 . 49 2 . 71 3 . 31 2 . 66 4 . 53 2 . 73 3 . 33 2 . 71 4 . 61 2 . 81 3 . 38 2 . 78 4 . 7 2 2 . 81 3 . 60 2 . 83 4 . 87 2 . 93 3 . 62 2 . 90 4 . 93 2 . 95 3 . 62 2 . 90 5 . 00 2 . 95 3 . 65 2 . 92 5 . 03 3 . 00 3 . 7 2 2 . 99 5 . 15 3 . 05 3 . 78 3 . 03 5 . 27 3 . 00 3 . 79 3 . 08 5 . 31 3 . 07 3 . 80 3 . 11 5 . 36
0 . 83 1 . 65 L 10 2 . 13
0 . 11 0 . 16 0 . 08 0 . 18

TABLE 8 { cont ' d)
TWIG SAMPLE WEIGHTS - WETTING PHASE (UNADJUSTED) (grams )
Elapsed Time Days Hours 12 13 14 15 16 18 19 22 24 25 26
0 . 0 3 . 10 1 . 7 6 1 . 41 2 . 03 1 . 48 2 . 75 1 . 25 2 . 03 1 . 74 3 . 46 4 . 26 1 . 0 3 . 41 2 . 45 2 . 71 2 . 20 2 . 93 3 . 53 2 . 71 3 . 80 3 . 18 5 . 60 6 . 27 3 . 0 3 . 64 2 . 73 2 . 76 2 . 27 3 . 00 3 . 70 2 . 83 3 . 90 3 . 31 5 . 88 6 . 7 2 4 . 5 3 . 75 2 . 89 2 . 80 2 . 36 3 . 05 3 . 83 2 . 89 4 . 01 3 . 43 6 . 13 7 . 10 9 . 5 3 . 89 3 . 00 2 . 80 2 . 53 3 . 11 4 . 00 2 . 91 4 . 17 3 . 51 6 . 34 7 . 40
22 . 0 4 . 03 3 . 24 2 . 91 2 . 83 3 . 16 4 . 15 3 . 05 4 . 30 3 . 63 6 . 43 7 . 66 1 1 . 0 4 . 03 3 . 26 2 . 95 2 . 91 3 . 19 4 . 21 3 . 05 4 . 36 3 . 67 6 . 51 7 . 78 1 6 . 0 4 . 05 3 . 34 2 . 96 2 . 98 3 . 20 4 . 27 3 . 11 4 . 42 3 . 71 6 . 53 7 . 90 1 22 . 5 4 . 13 3 . 45 2 . 98 3 . 15 3 . 21 4 . 38 3 . 20 4 . 44 3 . 78 6 . 61 7 . 97 2 5 . 0 4 . 15 3 . 52 3 . 04 3 . 20 3 . 28 4 . 41 3 . 16 4 . 50 3 . 80 6 . 67 8 . 02 2 22 . 0 4 . 20 3 . 58 3 . 00 3 . 35 3 . 23 4 . 49 3 . 19 4 . 53 3 . 83 6 . 71 8 . 06 3 4 . 5 4 . 22 3 . 53 3 . 09 3 . 38 3 . 25 4 . 50 3 . 21 4 . 54 3 . 87 6 . 7 2 8 . 08 3 23 . 0 4 . 25 3 . 52 3 . 04 3 . 50 3 . 29 4 . 57 3 . 19 4 . 58 3 . 91 6 . 79 8 . 08 4 7 . 0 4 . 25 3 . 57 3 . 10 3 . 54 3 . 29 4 . 60 3 . 23 4 . 64 3 . 96 6 . 80 8 . 13 5 22 . 0 4 . 30 3 . 71 3 . 12 3 . 61 3 . 29 4 . 69 3 . 25 4 . 70 4 . 00 6 . 87 8 . 27 6 23 . 0 4 . 33 3 . 78 3 . 22 3 . 67 3 . 32 4 . 74 3 . 22 4 . 80 4 . 05 6 . 90 8 . 31 7 22 . 0 4 . 35 3 . 94 3 . 21 3 . 73 3 . 34 4 . 82 3 . 11 4 . 88 4 . 10 6 . 99 8 . 38 8 23 . 0 4 . 39 3 . 98 3 . 25 3 . 80 3 . 49 4 . 87 3 . 13 4 . 97 4 . 11 7 . 12 8 . 41 9 22 . 0 4 . 41 4 . 01 3 . 28 3 . 84 3 . 53 4 . 94 3 . 19 5 . 00 4 . 13 7 . 18 8 . 45
13 23 . 0 4 . 50 4 . 09 3 . 34 3 . 95 3 . 54 5 . 06 3 . 21 5 . 02 4 . 21 7 . 23 8 . 54 14 22 . 0 4 . 51 4 . 14 3 . 31 4 . 00 3 . 58 5 . 10 3 . 12 5 . 10 4 . 20 7 . 24 8 . 61 15 23 . 0 4 . 55 4 . 12 3 . 37 4 . 03 3 . 58 5 . 18 3 . 10 5 . 10 4 . 22 7 . 37 8 . 68 16 22 . 0 4 . 55 4 . 11 3 . 30 4 . 10 3 . 58 5 . 19 3 . 11 5 . 12 4 . 22 7 . 38 8 . 70 19 23 . 0 4 . 60 4 . 23 3 . 30 4 . 16 3 . 58 5 . 27 3 . 11 5 . 19 4 . 29 7 . 45 8 . 75 21 22 . 0 4 . 67 4 . 19 3 . 30 4 . 22 3 . 60 5 . 32 3 . 16 5 . 20 4 . 32 7 . 51 8 . 82 24 1 . 0 4 . 69 4 . 14 3 . 29 4 . 25 3 . 59 5 . 40 3 . 09 5 . 24 4 . 34 7 . 59 8 . 86 26 22 . 0 4 . 72 4 . 11 3 . 28 4 . 25 3 . 55 5 . 41 3 . 09 5 . 25 4 . 34 7 . 68 8 . 92
Oven Dry Weights
2 . 69 1 . 33 1 . 14 1 . 7 2 1 . 32 2 . 49 1 . 00 1 . 86 . 1 . 53 3 . 11 3 . 87
Weight Lost During Experiment -
0 . 13 0 . 34 0 . 20 0 . 20 0 . 09 0 . 14 0 . 20 0 . 13 0 . 12 0 . 16 0 . 17
- 63-

TABLE 9
TWIG SAMPLE WEIGHTS - DRYING PHASE
(grams)
Elapsed Time Days Hours 1 2 3 4 5 6 7 8 9 10 11
0 . 0 4 . 81 5 . 32 1 . 55 2 . 93 1 . 78 1 . 52 3 . 76 3 . 07 3 . 80 3 . 11 5 . 36 0 . 5 4 . 51 4 . 79 1 . 40 2 . 73 1 . 71 1 . 48 3 . 49 2 . 97 3 . 71 2 . 93 5 . 19 1 . 0 4 . 32 4 . 50 1 . 33 2 . 63 1 . 69 1 . 46 3 . 41 2 . 79 3 . 68 2 . 81 5 . 03 2 . 0 3 . 80 3 . 99 1 . 28 2 . 49 1 . 63 1 . 40 2 . 20 3 . 48 3 . 4 8 2 . 35 4 . 43 3 . 0 3 . 62 3 . 62 1 . 24 2 . 40 1 . 60 1 . 38 3 . 13 1 . 75 3 . 33 2 . 06 4 . 00 5 . 0 3 . 35 3 . 26 1 . 19 2 . 31 1 . 53 1 . 32 2 . 86 1 . 22 3 . 13 1 . 63 3 . 36 6 . 0 3 . 21 3 . 08 1 . 16 2 . 24 1 . 50 1 . 28 2 . 8 7 1 . 02 3 . 00 1 . 45 3 . 05 7 . 0 3 . 11 2 . 97 1 . 13 2 . 20 1 . 48 1 . 27 2 . 89 0 . 98 2 . 91 1 . 3 6 2 . 83 8 . 9 3 . 02 2 . 87 1 . 11 2 . 17 1 . 44 1 . 23 2 . 72 0 . 92 2 . 8 2 1 . 29 2 . 70
12 . 0 2 . 7 9 2 . 61 1 . 03 2 . 03 1 . 35 1 . 17 2 . 53 0 . 91 2 . 59 1 . 20 2 . 43 14 . 0 2 . 72 2 . 51 1 . 02 1 . 99 1 . 3 2 1 . 14 2 . 47 0 . 91 2 . 49 1 . 20 2 . 39
1 0 . 0 2 . 41 2 . 15 0 . 91 1 . 80 1 . 18 1 . 02 2 . 30 0 . 93 2 . 19 1 . 22 2 . 35 1 3 . 5 2 . 32 2 . 08 0 . 88 1 . 73 L 11 0 . 98 2 . 25 0 . 93 2 . 13 1 . 21 2 . 33 1 6 . 0 2 . 27 2 . 03 0 . 83 1 . 70 1 . 08 0 . 93 2 . 23 0 . 93 2 . 11 1 . 21 2 . 32 1 8 . 0 2 . 22 2 . 00 0 . 82 1 . 68 1 . 05 0 . 91 2 . 20 0 . 92 2 . 08 1 . 21 2 . 31 2 0 . 0 2 . 01 1 . 84 0 . 73 1 . 49 0 . 92 0 . 81 2 . 08 0 . 9 0 2 . 00 1 . 19 2 . 28 2 3 . 5 1 . 98 1 . 83 0 . 7 2 1 . 44 0 . 92 0 . 80 2 . 05 0 . 91 1 . 99 1 . 19 2 . 28 2 8 . 0 1 . 92 1 . 80 0 . 7 2 1 . 42 0 . 91 0 . 80 2 . 03 0 . 91 1 . 97 1 . 19 2 . 28 3 0 . 0 1 . 83 1 . 78 0 . 68 1 . 35 0 . 85 0 . 78 1 . 95 0 . 89 1 . 92 1 . 18 2 . 25 3 3 . 5 L 83 1 . 78 0 . 68 1 . 34 0 . 85 0 . 77 1 . 93 0 . 90 1 . 91 1 . 18 2 . 25 4 0 . 0 1 . 79 1 . 73 0 . 64 1 . 31 0 . 83 0 . 73 1 . 8 5 0 . 89 1 . 8 8 1 . 18 2 . 25 4 3 . 0 1 . 79 1 . 73 0 . 64 1 . 31 0 . 83 0 . 74 1 . 83 0 . 90 1 . 8 7 1 . 16 2 . 25 4 8 . 0 1 . 79 1 . 73 0 . 64 1 . 29 0 . 82 0 . 73 1 . 8 3 0 . 89 1 . 85 1 . 16 2 . 25 7 0 . 0 1 . 75 1 . 73 0 . 62 1 . 26 0 . 80 0 . 72 1 . 70 0 . 89 1 . 80 1 . 18 2 . 23 7 8 . 0 1 . 77 1 . 7 3 0 . 62 1 . 26 0 . 80 0 . 7 2 1 . 7 0 0 . 89 1 . 80 1 . 17 2 . 25 8 0 . 0 1 . 75 1 . 73 0 . 62 1 . 26 0 . 80 0 . 7 2 1 . 68 0 . 89 1 . 79 1 . 17 2 . 25 9 2 . 0 1 . 75 1 . 73 0 . 62 1 . 26 0 . 80 0 . 72 1 . 65 0 . 89 1 . 7 8 1 . 17 2 . 25
11 0 . 0 1 . 75 1 . 73 0 . 62 1 . 26 0 . 80 0 . 72 1 . 62 0 . 89 1 . 7 7 1 . 17 2 . 25 13 0 . 0 1 . 74 1 . 72 0 . 62 1 . 22 0 . 79 0 . 71 1 . 60 0 . 89 1 . 75 1 . 17 2 . 22 14 0 . 0 1 . 73 1 . 7 2 0 . 62 1 . 22 0 . 79 0 . 71 1 . 60 0 . 89 1 . 75 1 . 17 2 . 22
- 6 4-

TABLE 9 (cont ' d)
TWIG SAMPLE WEIGHTS - DRYING PHASE
(grams)
Elap sed Time Days Hours 12 13 14 15 16 18 19 22 24 25 26
0 . 0 4 . 7 2 4 . 11 3 . 28 4 . 25 3 . 55 5 . 41 3 . 09 5 . 25 4 . 34 . 7 . 68 8 . 92 0 . 5 4 . 68 3 . 92 2 . 91 4 . 20 3 . 44 5 . 08 2 . 96 4 . 91 4 . 18 7 . 43 8 . 6 2 1 . 0 4 . 68 3 . 76 2 . 78 4 . 15 3 . 29 4 . 94 2 . 86 4 . 75 4 . 11 7 . 3 2 8 . 50 2 . 0 4 . 62 3 . 20 2 . 30 4 . 07 2 . 87 4 . 52 2 . 47 4 . 28 3 . 79 6 . 9 2 8 . 05 3 . 0 4 . 59 2 . 82 1 . 81 4 . 00 2 . 40 4 . 17 2 . 20 3 . 92 3 . 58 6 . 67 7 . 71 5 . 0 4 . 56 2 . 38 1 . 39 3 . 91 1 . 88 3 . 68 1 . 61 3 . 08 3 . 08 5 . 92 6 . 48 6 . 0 4 . 50 2 . 11 1 . 31 3 . 8 2 1 . 63 3 . 37 1 . 3 2 2 . 63 2 . 73 5 . 48 6 . 41 7 . 0 4 . 49 1 . 99 1 . 28 3 . 79 1 . 53 3 . 22 1 . 21 2 . 42 2 . 52 5 . 19 6 . 12 8 . 9 4 . 47 1 . 88 1 . 28 3 . 7 2 1 . 48 3 . 08 1 . 13 2 . 20 2 . 37 4 . 88 5 . 80
12 . 0 4 . 39 1 . 73 1 . 26 3 . 59 1 . 44 2 . 85 1 . 09 2 . 00 1 . 95 4 . 19 5 . 27 14 . 0 4 . 36 1 . 69 1 . 26 3 . 52 1 . 44 2 . 79 1 . 09 1 . 99 1 . 79 3 . 98 5 . 08
1 0 . 0 4 . 21 1 . 59 1 . 28 3 . 20 1 . 47 2 . 74 1 . 11 1 . 99 1 . 71 3 . 48 4 . 46 1 3 . 5 4 . 18 1 . 55 1 . 26 3 . 10 1 . 44 2 . 7 2 1 . 10 1 . 97 1 . 70 3 . 43 4 . 37 1 6 . 0 4 . 15 1 . 54 1 . 28 3 . 03 1 . 44 2 . 72 1 . 10 1 . 97 1 . 69 3 . 42 4 . 30 1 8 . 0 4 . 1 2 1 . 53 1 . 26 3 . 00 1 . 44 2 . 71 1 . 09 1 . 97 1 . 69 3 . 41 4 . 30 2 0 . 0 3 . 95 1 . 48 1 . 22 2 . 61 1 . 41 2 . 68 1 . 07 1 . 94 1 . 63 3 . 34 4 . 18 2 3 . 5 3 . 92 1 . 47 1 . 22 2 . 55 1 . 41 2 . 68 1 . 08 1 . 94 1 . 64 3 . 34 4 . 18 2 8 . 0 3 . 89 1 . 45 1 . 22 2 . 48 1 . 41 2 . 68 1 . 08 1 . 92 1 . 64 3 . 33 4 . 18 3 0 . 0 3 . 78 1 . 45 1 . 22 2 . 28 1 . 41 2 . 63 1 . 07 1 . 91 1 . 63 3 . 31 4 . 11 3 3 . 5 3 . 73 1 . 45 1 . 22 2 . 22 1 . 41 2 . 63 1 . 06 1 . 91 1 . 64 3 . 31 4 . 11 4 0 . 0 3 . 60 1 . 42 1 . 22 2 . 08 1 . 41 2 . 63 1 . 06 1 . 91 1 . 64 3 . 29 4 . 09 4 3 . 0 3 . 60 1 . 42 1 . 22 2 . 05 1 . 40 2 . 63 1 . 05 1 . 91 1 . 62 3 . 30 4 . 10 4 8 . 0 3 . 58 1 . 45 1 . 22 2 . 02 1 . 39 2 . 62 1 . 06 1 . 91 1 . 63 3 . 30 4 . 09 7 0 . 0 3 . 34 1 . 43 1 . 22 1 . 90 1 . 40 2 . 62 1 . 06 1 . 91 1 . 63 3 . 30 4 . 09 7 8 . 0 3 . 3 2 1 . 44 1 . 22 1 . 90 1 . 40 2 . 63 1 . 06 1 . 91 1 . 63 3 . 30 4 . 09 8 0 . 0 3 . 28 1 . 43 1 . 22 1 . 88 1 . 40 2 . 62 1 . 06 1 . 91 1 . 63 3 . 30 4 . 09 9 2 . 0 3 . 21 1 . 43 1 . 21 1 . 87 1 . 40 2 . 62 1 . 06 1 . 91 1 . 63 3 . 30 4 . 09
11 0 . 0 3 . 10 1 . 43 1 . 21 1 . 85 1 . 40 2 . 62 1 . 06 1 . 91 1 . 63 3 . 30 4 . 09 13 0 . 0 3 . 00 1 . 42 1 . 21 1 . 84 1 . 39 2 . 61 1 . 05 1 . 90 1 . 62 3 . 27 4 . 06 14 0 . 0 2 . 97 1 . 42 1 . 21 1 . 83 1 . 39 2 . 61 1 . 05 1 . 90 1 . 62 3 . 30 4 . 09
-65-

TABLE 10
SUMMARY OF TWIG WETTING MEASUREMENTS
INITIAL 5-HOUR PERIOD Moisture Content Change (%) �/
A c t u a l R e I a t i v e Size With Without With Without
* Class Bark Bark Average Bark Bark Average No Bark/Bark (1IDI1)
1 66 139 90 34 70 46 2 . 1 . 3 45 118 82 30 56 46 1 . 9 5 35 74 48 23 40 30 1 . 7 7 26 68 57 21 45 40 2 . 5 9+ 29 80 63 39 58 54 1 . 5
Rate of Change ('Z/hr . ) ?:./
1 13 . 2 27 . 8 18 . 0 6 . 7 14 . 0 9 . 1 2 . 1 3 9 . 1 23 . 6 16 . 4 6 . 1 11 . 2 9 . 2 1 . 8 5 6 . 9 14 . 8 9 . 5 4 . 6 8 . 1 5 . 9 1 . 8 7 5 . 2 13 . 5 1 1 . 4 4 . 2 8 . 9 7 . 9 2 . 1 9+ 5 . 8 15 . 9 12 . 5 7 . 7 11 . 5 10 . 7 1 . 5
INITIAL 12-HOUR PERIOD
Moisture Content Change
1 82 149 104 42 75 53 1 . 8 3 60 132 96 40 63 53 1 . 6 5 50 88 63 33 48 39 1 . 4 7 40 80 70 32 53 49 1 . 6 9+ 40 92 74 53 67 63 1 . 3
Rate o f Change
1 6 . 3 11 . 9 8 . 2 3 . 2 6 . 0 4 . 2 1 . 9 3 4 . 4 10 . 5 7 . 5 3 . 0 5 . 0 t. . 2 1 . 7 5 3 . 7 6 . 8 4 . 7 2 . 5 3 . 7 2 . 9 1 . 5 7 3 . 8 6 . 3 5 . 6 3 . 1 4 . 1 3 . 9 1 . 3 9 .. 2 . 5 7 . 2 5 . 6 3 . 3 5 . 2 4 . 8 1 . 6
INITIAL 48-HOUR PERIOD
Moisture Content Change
1 111 168 130 57 85 66 1 . 5 3 87 152 120 59 72 67 1 . 2 5 72 111 85 48 61 53 1 . 3 7 61 98 89 49 65 62 1 . 3 9+ 56 106 97 67 77 74 1 . 2
Rate o f Change
1 2 . 3 3 . 5 2 . 7 1 . 2 1 . 8 1 . 4 1 . 5 3 1 . 8 3 . 2 2 . 5 1 . 2 1 . 5 1 . 4 1 . 2 5 1 . 5 2 . 3 1 . 8 1 . 0 1 . 3 1 . 1 1 . 3 7 1 . 3 2 . 0 1 . 8 1 . 0 1 . 2 1 . 3 1 . 2 9 ... 1 . 0 2 . 2 1 . 8 1 . 4 1 . 6 1 . 5 1 . 3
1 Values are in % oven dry weight 2Va1ues are in % oven dry weight change per hour *
From individual values - G fi-

TABLE 11
SUMMARY OF TWIG DRYING MEASUREMENTS
INIT IAL 5-HOUR PERIOD
Moisture Content Change (%) !/
A c t u a 1 R e I a t i v e Size With Without With Without Class Bark Bark Average Bark Bark Average * No Bark/Bark (nun)
1 93 161 120 49 84 63 1 . 7
3 50 158 115 35 7 7 6 6 2 . 2
5 38 136 70 26 77 45 3 . 0 ·
7 31 82 69 26 56 50 2 . 2
91- 6 54 38 8 . 6 41 32 4 . 8
Rate o f Change (%/hr . ) l/
1 18 . 5 32 . 2 24 . 0 9 . 7 16. 7 12 . 5 1 . 7
3 10 . 0 31 . 7 23 . 0 7 . 0 15 . 5 13 . 2 2 . 2
5 7 . 5 27 . 2 14 . 1 5 . 1 15 . 3 9 . 0 3 . 0
7 6 . 2 16 . 5 13 . 9 5 . 2 11 . 3 10 . 0 2 . 2
9+ 1 . 2 10 . 7 7 . 5 1 . 7 8 . 0 6 . 4 4 . 7
INITIAL 12-HOUR PERIOD
Moisture Content Change
1 123 188 149 65 98 78 1 . 5
3 77 197 147 54 96 85 1 . 8
5 58 172 96 38 97 62 2 . 6
7 52 133 113 44 92 82 2 . 1
9+ 12 110 78 17 83 67 4 . 9
Rate o f Change
1 10 . 3 15 . 6 1 2 . 4 5 . 4 8 . 1 6 . 4 1 . 5
3 6 . 0 16 . 4 12 . 3 4 . 2 8 . 0 7 . 1 1 . 9
5 4 . 8 14 . 3 8 . 0 3 . 2 8 . 0 5 . 1 2 . 5
7 4 . 3 11 . 1 9 . 4 3 . 6 7 . 6 6 . 8 2 . 1
9+ 1 . 0 9 . 2 6 . 5 1 . 4 6 . 9 5 . 5 4 . 9
INITIAL 48-HOUR PERIOD
Moisture Content Change
1 163 191 174 86 99 9 1 1 . 1
3 128 201 172 90 98 99 1 . 1
5 130 173 145 89 98 94 1 . 1
7 104 143 133 85 99 96 1 . 2
9+ 27 133 97 39 99 83 2 . 5
Rate o f Change
1 3 . 4 4 . 0 3 . 6 1 . 7 2 . 0 1 . 8 1 . 2
3 2 . 6 4 . 2 3 . 6 1 . 8 2 . 0 2 . 0 1 . 1
5 2 . 7 3 . 6 3 . 0 1 . 8 2 . 0 1 . 9 1 . 1
7 2 . 2 3 . 0 2 . 8 1 . 8 2 . 0 2 . 0 1 . 1
9+ 0 . 6 2 . 8 2 . 0 0 . 9 2 . 1 1 . 7 2 . 3
1 Values are in % oven dry weight 2 Values are in % oven dry weight change per hour *From individual values
- 6 7-
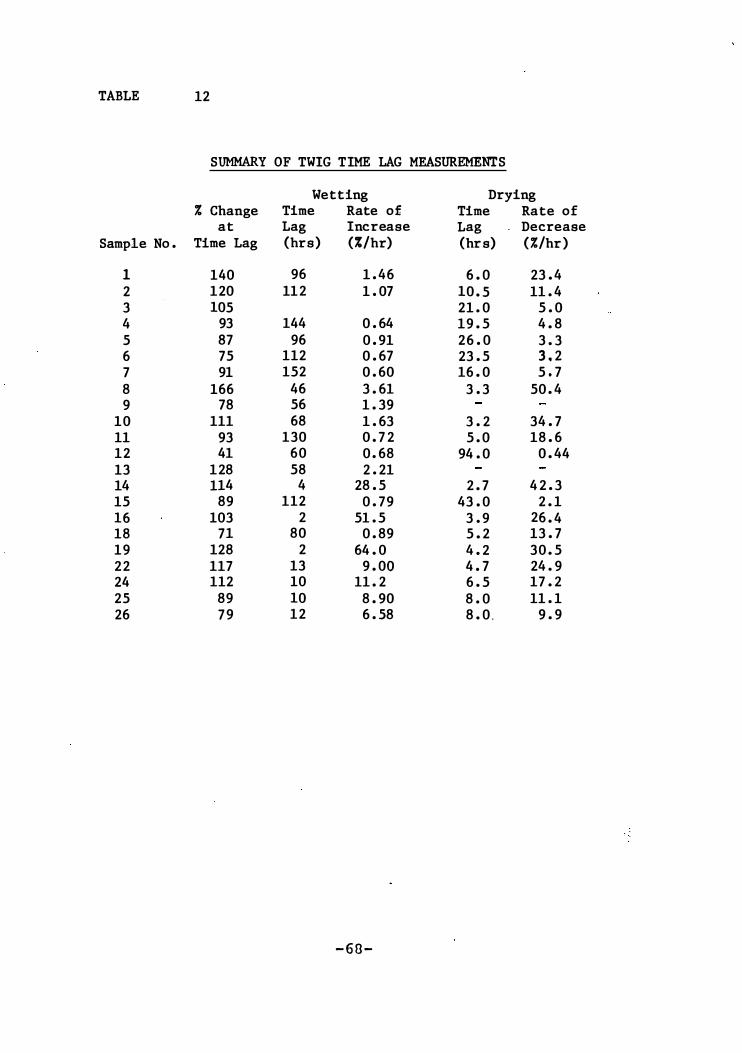
TABLE 12
SUMMARY OF TWIG TIME LAG MEASUREMENTS
Wetting Drying % Change Time Rate of Time Rate of
at Lag Increase Lag Decrease Sample No . Time Lag (hrs) (%/hr) (hr s) (%/hr )
1 140 96 1 . 46 6 . 0 23 . 4 2 1 20 11 2 1 . 07 10 . 5 11 . 4 3 105 21 . 0 5 . 0 4 93 144 0 . 64 19 . 5 4 . 8 5 87 96 0 . 91 2 6 . 0 3 . 3 6 75 112 0 . 67 23 . 5 3 . 2 7 91 152 0 . 60 16 . 0 5 . 7 8 166 46 3 . 61 3 . 3 50 . 4 9 78 56 1 . 39
1 0 111 68 1 . 63 3 . 2 34 . 7 11 93 130 0 . 7 2 5 . 0 18 . 6 1 2 41 6 0 0 . 68 94 . 0 0 . 44 13 1 28 58 2 . 21 14 114 4 28 . 5 2 . 7 4 2 . 3 15 89 112 0 . 79 43 . 0 2 . 1 16 103 2 51 . 5 3 . 9 26 . 4 18 71 80 0 . 89 5 . 2 13 . 7 19 128 2 64 . 0 4 . 2 3 0 . 5 2 2 117 13 9 . 00 4 . 7 24 . 9 24 112 10 11 . 2 6 . 5 17 . 2 25 89 10 8 . 90 8 . 0 11 . 1 26 7 9 1 2 6 . 58 8 . 0 . 9 . 9
- 6 8 -