the model city benchmark (toce) - impact - …€¦ · · 2008-12-15the model city flooding...
TRANSCRIPT

Mulet et al. 1
The model city flooding experiment benchmark. Analysis of modeller’s results and conclusions.
J. Murillo, J. Mulet, P. Brufau, P. García-Navarro, F. Alcrudo, Fluid Mechanics, University of Zaragoza (Spain) [email protected] SUMMARY In this part of the IMPACT project, a “model city flooding experiment” is performed. The flooding simulation over an urban area modelled using a simplified case with the help of a group of buildings, representing the urban area. Various possibilities are combined during the experimental program. The parameters that were modified from one test to the other are the width of the valley, the buildings arrangement, (either aligned or staggered) and finally an increase of the flooding peak hydrograph. Every modeller was asked to numerically simulate every case, so the the capability of each numerical models to represent flooding events is tested, without access to the experimental results. Also the influence of the buildings was introduced in the numerical methods in different ways. In this project report, a numerical vs. experimental comparison of the data provided by the different groups involved is described, in order to conclude about the capabilities of the modellers to simulate a flood in a simplified city. 1 INTRODUCTION. Flood Propagation, as one part of the four areas of the IMPACT Project, has been developed using a methodology similar to the one used in the previous test performed. Once again, the modellers performed several “blind” numerical simulations, including this time variations on the topography modelling. The results where presented in the Louvain Meeting, in November, 2003. The Model city flooding experiment benchmark is devoted to studying the flow characteristics of flow in urban like environments and the capabilities of different numerical models to accurately represent them. It is embodied in a broader study comprising detailed flow measurement and simulation around model building structures (The isolated building test case by S. Soares and Y. Zech 2002, see below) and mathematical modelling of an actual city flooding event, within Theme Area 3 (Flood propagation) of the EU IMPACT (Investigation of Extreme Flood Processes and Uncertainty) project.

Mulet et al. 2
The benchmark described here regards the study of flow arising when such a wave sweeps across the physical model of a city, represented by a certain number of buildings arranged in an ordered pattern as happens in an actual urban area. It is based upon data obtained by ENEL-CESI at its PIS (Polo Idraulico et Strutturale) facilities in Milano, Italy. All the details can be founf in the proyect report The Model City Flooding Experiment, (F. Alcrudo, P. Garcia, P. Brufau, J. Murillo, D. Garcia, J. Mulet, G. TESTA, D. ZUCCALÀ) The experiments are run over the model in order to test the different the methods proposed by the groups: CEMAGREF (E. Mignot, A. Paquier), U.C. Louvain (S. Soares, Y. Zech), University of Zaragoza (J. Mulet, F. Alcrudo), University of Zaragoza * (J. Murillo, P. Brufau, P. García Navarro) 2 BRIEF DESCRIPTION OF THE MODEL CITY FLOODING
EXPERIMENT. The simulations where based on new measurements done in the well-known Toce river model. The ENEL-PIS facilities in Milano comprise a reduced physical model (scale 1:100) of the Toce river valley that has been extensively used for flood propagation experiments. It is a 50m long concrete model of the river with quite geographical detail fitted with water depth gauges at certain locations. The city modelling was done imposing variations in dimensions and topography, introducing two urban models, one staggered and other aligned. The aim is to model a flood occurring in a simplified semi-urban area. In the aligned case the flow must cross a matrix-ordered building distribution composed by 16 buildings. In the staggered case the flow resistance is increased, and only 14 buildings are introduced. Water levels are measured by means of 10 gauges with pressure transducers, fixed in space in all the experiments performed. The buildings are modelled as impervious cubes, between 14 and 20 fifteen-centimetre side, and introduced 5m-length valley where typical flood hydrographs are introduced at its upstream boundary. The different configurations are based on
• two blocks configurations (one with the blocks aligned as a grid and the other staggered) • the width of the valley, that narrowed using two masonry walls aligned with the valley axis to confine the flow around the blocks (channelling efect) • two main hydrographs used as the upstream condition, one larger than the other • two bathymetric configurations:
-Original Toce river valley model -Modified model, river bed filled up with concrete and slight protrusion of
concrete slab into feeding reservoir
As regards the simulations corresponding to the modified bathymetric consfiguration, the meandering Toce river bed was filled up with concrete and no new DTM file according with new valley was performed. The actual filling process consisted of running a steady flow model on the original DTM bathymetry with increasing discharge until spilling over the river banks was achieved. Then the new bed function was set to the water free surface.

Mulet et al. 3
Finally, while placing the two masonry walls the model valley was extended upstream with a concrete slab a few cm long that protrudes into the feeding reservoir. Hence the data points on the new DTM file had to be extended upstream a few cm to cover the concrete slab protruding into the feed tank. The extrapolation has no influence on the hydraulics because it affects only about one cm at the upstream end. In all the cases, flooding of the model is achieved by rapidly rising the water level in a feed tank (Figure 1) connected to its upstream end by means of an electrically driven pump. The pump discharge and thus the flood intensity can be electronically controlled and recorded.
Figure 1. Overall view of the city modelling (aligned case). Figure 2 shows the location of the reservoir, the gauges and the buildings in the aligned case, with no channeling walls, and Fig. 3 shows the distribution in the aligned case with channeling walls
Figure 2. Disposition of the gauges and the buildings in the aligned case.
Figure 3. Disposition of channelling walls, the gauges and the buildings in the staggered case.

Mulet et al. 4
The initial and boundary conditions were:
• Initital state of valley assumed dry • Upstream boundary condition: imposed known pump discharge (evenly distributed) and inflow angle (perpendicular to inflow section) • Alternatively reading of probe No. 1 (inside feeding reservoir) as an approximation to total head, plus inflow angle • Downstream boundary condition: suggested free flow • Model roughness asumed constant (Manning’s n=0.0162)
The numerical calculations were done without any information about the experimental results, so no calibration could be made, prior to delivery of the computational results. 3 ANALYSIS OF EXPERIMENTAL RESULTS. GENERAL OVERVIEW. Seven different cases were proposed to the modellers, shown in Table 1, divided in four test cases, whose results will be analized and compared.
Table 1. Summary of proposed test cases.
T est C ase
M od el C ity L ay ou t
In flow H yd rograp h
V alley B ath ym etry
B u ild in g rep resen tation
V ariant N um ber
1a A ligned Lo w , 60 l/s C hannelled S o lid w alls 1
1b S taggered Lo w , 60 l/s C hannelled S o lid w alls 2
2a A ligned Lo w , 80 l/s O rig inal S o lid w alls 3 2b S taggered Lo w , 80 l/s O rig inal S o lid w alls 4
3a S taggered Lo w , 60 l/s C hannelled S o lid w alls 2 3b S taggered H igh, 100 l/s C hannelled S o lid w alls 5
4a S taggered Lo w , 60 l/s C hannelled S o lid w alls 2 4b S taggered Lo w , 60 l/s C hannelled B o tto m elevatio n 6
4c S taggered Lo w , 60 l/s C hannelled H igh frictio n 7
In the test case 1 the original boundaries of the valley are modified, so in this case remains channelled during the flooding. The difference between cases 1a) and 1b) is the building distribution, in the case 1a) aligned, and in the case 1b) staggered. For both cases the upstream discharge is similar, considered of low rate, and the buildings are modelled as solid walls. In the test case 2) the original bathymetry is kept, so the flooding advance, considered low, is not restricted by lateral walls. The buildings are represented as solid walls, and the main difference is found in the city design, aligned in case a), and staggered in case b). For the test case 3) the same staggered geometry is kept, the valley bathymetry is channeled, the buildings are modelled as solid walls. The differences are found in the discharge, low in the case a) and high in the case b).

Mulet et al. 5
In the test case 4) all the parameters are kept constant, staggered desing, low hydrograph, and channelled valley. The single difference is the building model used: solid walls in case a), bottom elevation in case b), and high fricction in case c). In general the simulations performed and the measured data have a good agreement despite the slight uncertainty associated with the in the case of the modified bed level. In this case the bed level dimensions where modified, in special in the inlet region, increasing its length, adding uncertainity at the computed arrival. The bed levels used in this case, worked out by means of a pre-process calculation that could have led to a scenario different from the real one, prove to be satisfactory. The conditions downstream are not clear, as at the exit of the study region the flow state changes rapidly in time and space from subcritical to supercritical conditions, as the measure point, gauge 10, shows in all the cases. The inlet region is an important item for most of the modellers, so its clear that more research must be done in the analysis of the boundary conditions. 3.1. Test case 1: Aligned and staggered buildings in channelled river with low hydrograph. In both cases the model supplies numerical results that agree well with the measured water levels. The greatest differences are found at the gauges located close to the exit or downstream boundary, where the boundary condition is difficult to reproduce. The results for the test case 1a) can be seen in Figure 4, and for the case 1b) in Figure 5. In the inlet boundary, gauge 2, for test cases 1a) and 1b) the modellers generate several hydrodynamic situations, from subcritical to supercritical conditions. Therefore the most important differences are found in this region. Despite great variations in the water levels are computed upstream, no great influence is shown in the downstream results. The results at gauge 3, where the flooding advance is stopped by the buildings, show noticeable differences depending on the energy of the flooding, but at gauge 4, located in the same zone, no important differences are found. At gauge 5, placed in a flow channeled region, in the case 1a), a water level overestimation tendency is found, while the in the case 1b), where the flow is restrained by a building, an excellent agreement is achieved. The numerical data provided by the modellers for the gauges 6, 7, 8, and 9 shown in general good agreement with the experimental data. In the exit zone the flow is highly variable, so the flow can change from subcritical to supercritical in a short distance due to the presence of a wake generated by the buildings in the flow. This situation can be observed in all the proposed cases in the comparison among measured data and numerical results at gauge10. In both cases advance is introduced in the arrival times. The responsible factor of this disagreement is attributable to the change in the dimensions of the inlet boundary.

Mulet et al. 6

Mulet et al. 7

Mulet et al. 8
Figure 4. Comparison between numerical and measured data for variant number 1.
( Test case 1a )

Mulet et al. 9

Mulet et al. 10

Mulet et al. 11
Figure 5. Comparison between numerical and measured data for variant number 2. (Test case 1b and 4a )

Mulet et al. 12
3.2. Test case 2. Aligned and staggered case with original geometry. As in the previous test case, the modellers produced results that agree well in general with the experimental data. The most significant differences are found in the inlet region, where gauge 2 is located, and the same tendency in the gauge 5 for the case a) can be seen. In this test case the underestimation of the water level is also visible. The computed data located at the exit show good agreement with the measured data, despite no information about the exit was allowable. The results for the test case 2a) can be seen in Figure 6, and for the case 2b) in Figure 7. Again in both cases advance is introduced in the arrival times..

Mulet et al. 13

Mulet et al. 14

Mulet et al. 15
Figure 6. Comparison between numerical and measured data for variant number 3.
(Test case 2a)
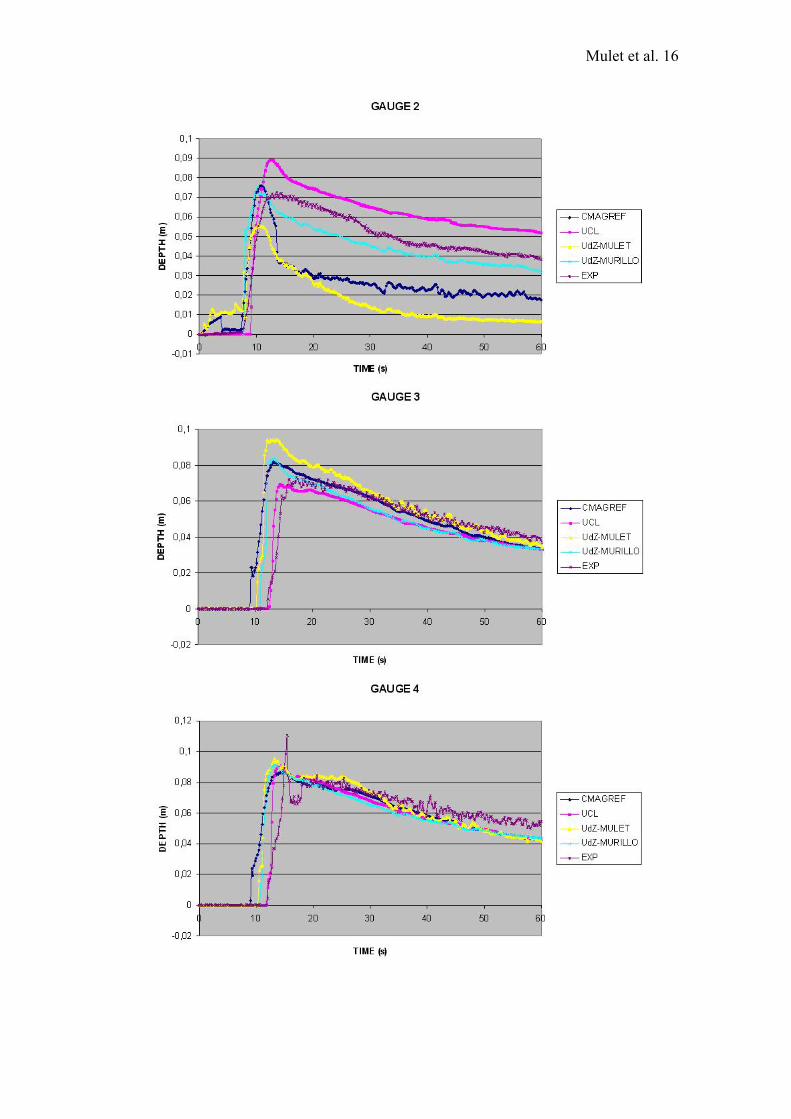
Mulet et al. 16

Mulet et al. 17

Mulet et al. 18
Figure 7. Comparison between numerical and measured data for variant number 4.
( Test case 2b)

Mulet et al. 19
3.3 Test case 3: Differences between low and high hydrograph for the channelled case with staggered buildings. The numerical results in both cases follow the same tendencies and in both cases probe 8 gives the worst results. In general the results show good agreement with the numerical data. The results for the test case 3a) can be seen in Figure 5, and for the case 2b) in Figure 8.

Mulet et al. 20

Mulet et al. 21

Mulet et al. 22
Figure 8. Comparison between numerical and measured data for variant number 5.
( Test case 3b)

Mulet et al. 23
3.4 Test case 4: Differences in the channelled river with staggered buildings case using different urban modelling. In this case all the parameters involved in the experiment remain constant. The differences are found in the building model. Three different approaches were used: a) represent buildings as solid wall boundaries limiting the flow by means of a zero normal flow condition, b) represent buildings as bottom elevations producing a high bed slope between building cells and their neighbours that is included in the calculation as any other bed irregularity, and c) represent buildings as grid cells of higher roughness, using a high value for the Manning roughness coefficient In all the cases the results using approaches a) and b) generate at least similar results, although taking in account that the buildings are never overtopped, no differences should be found. The discrepancy was produced by the results coming from option c). At probe 2 all the building representations gave the same results, because this zone is not affected by the structures presented downstream. At probes 3,4,5 and 6 the water level for the friction case is lower because the probes are located in front of the houses. At Probe 7 the friction model leads to better results. At probes 8 and 9 no difference between the results can be remarked. At probe 10 the results provided by the friction model lead to an excessive water level. In general the high friction technique produces lower water depth due to the storage effect of buildings. It is expected that this technique looses validity in flood scenatios with low flow velocity. The results for the test case 4a) can be seen in Figure 5, for the case 4b) in Figure 9, and for the case 4c) in Figure 10.

Mulet et al. 24

Mulet et al. 25

Mulet et al. 26
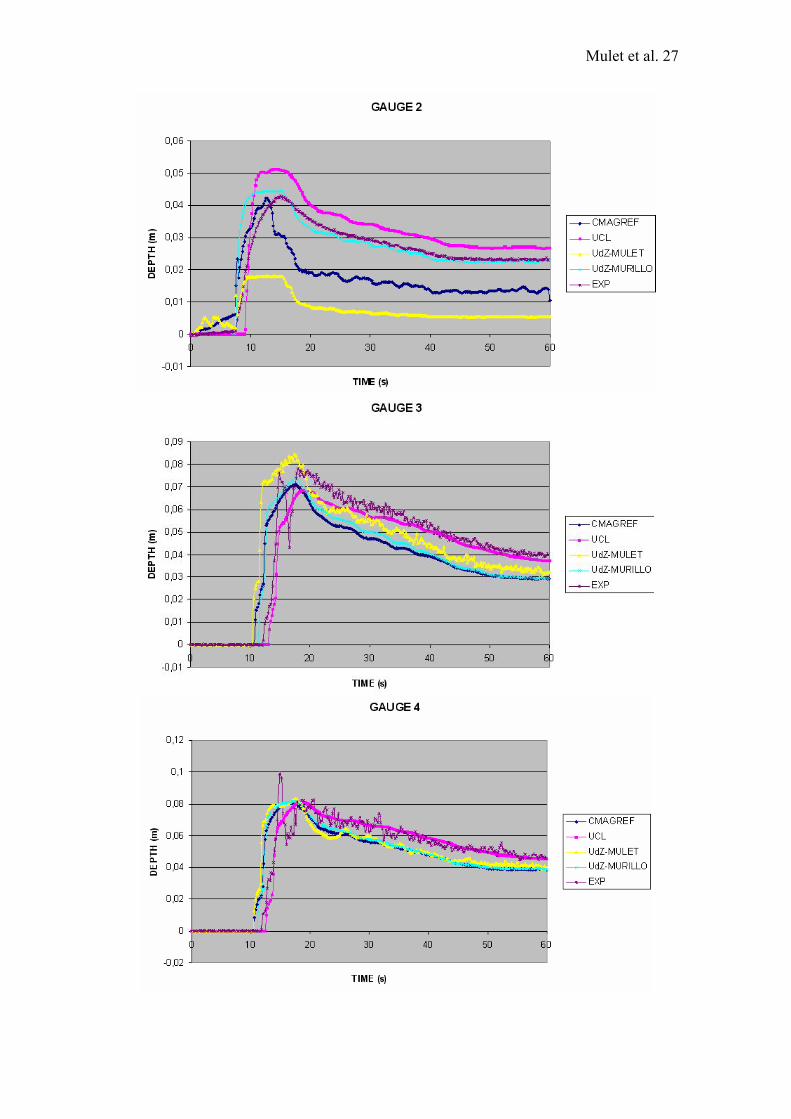
Figure 9. Comparison between numerical and measured data for variant number 6.
(Test case 4b)
Mulet et al. 27

Mulet et al. 28

Mulet et al. 29
Figure 10. Comparison between numerical and measured data for variant number 7.
(Test case 4c)

Mulet et al. 30
4 CONCLUSIONS All the proposed cases the modellers provided good results when using solid walls, bottom elevation or friction modelling, also managed well using the aligned building distribution and the staggered one. As the elevation of the structures involved by the flow did not allow them to get wetted, the results using solid walls or bottom elevation are acceptable. The size of the buildings used in the flooding experiments in combination with the friction modelling resulted in an acceptable approximation. Despite the many efforts made to avoid uncertainties in this benchmark, several sources remained: slight variations in the inflow section, bed function in the modified bathymetry runs and and the outflow boundaty conditions. 5 ACKNOWLEDGEMENTS The authors wish to acknowledge the financial support offered by the European Commission for the IMPACT project under the fifth framework programme (1998-2002), Environment and Sustainable Development thematic programme, for which Karen Fabbri was the EC Project Officer. The contents of this paper are based mainly upon data and information produced within WP3 of the project by CESI, University of Zaragoza (UDZ), Université Catholique de Louvain (UCL) CEMAGREF. The overall contribution made by the IMPACT project team is also recognised. IMPACT team member organisations comprise:
HR Wallingford Ltd (UK) Universität Der Bundeswehr Műnchen (Germany)
Université Catholique de Louvain (Belgium) CEMAGREF (France) Università di Trento (Italy) University of Zaragoza (Spain) CESI (Italy) SWECO (Norway) Instituto Superior Technico (Portugal)
Geo Group (Czech Republic) H-EURAqua (Hungary)
REFERENCES The isolated building test case by S. Soares and Y. Zech 2002. IMPACT Project technical report. The Model City Flooding Experiment, F. Alcrudo, P. Garcia, P. Brufau, J. Murillo, D. Garcia, J. Mulet, G. TESTA, D. ZUCCALÀ. IMPACT Project internal report.