the mission: economic persistence, human capital...
TRANSCRIPT
The Mission: Economic Persistence, Human Capital
Transmission and Culture in South America∗
Felipe Valencia Caicedo†
October 12, 2014
Abstract
This article documents the positive long-term economic impact of the Jesuit Missions in South
America, combining information from historical archives and municipal census data from Ar-
gentina, Brazil and Paraguay. Guarani Jesuit Missions (1609-1767) resulted in income levels
that are 10% higher today than in neighboring municipalities. I stress human capital as the
main channel of transmission, �nding a 10-15% increase in educational attainment. Results
are robust to the inclusion of geographic controls, the usage of placebos (abandoned mis-
sions) and instrumental variables (historical borders) estimation. Using historical censuses,
human capital appears to be even higher when close to missionary districts. Such enduring
educational di�erences are consistent with cultural mechanisms of inter-generational knowl-
edge transmission and occupational persistence�through labor specialization and changes in
sectoral employment. Additional empirical tests suggest that migration, urbanization and
tourism are not driving the results, and that the impact is speci�c to missions from the Jesuit
(as opposed to the Franciscan) order.
JEL: I25, N36, O15, O43
Keywords: Economic Persistence, Human Capital, Culture, Institutions, Religion, Missions, Technology
Transfer
∗I would like to thank my supervisor Hans-Joachim Voth for his guidance and support. My thanks also toOded Galor, Guy Michaels and Marta-Reynal Querol for their encouragement and advice. I thank Alex Eble,Eduardo Engel, Nicola Gennaioli, Ömer Özak, Jacopo Ponticelli and Ferdinand Rauch for detailed comments. Ihave bene�ted from conversations with Tim Besley, Pedro dal Bó, Melissa Dell, Jeremiah Dittmar, Quoc-Ahn Do,Mauricio Drelichman, Claudio Ferraz, James Fenske, Christian Fons-Rosen, William F. Maloney, Sandra McNally,Stelios Michalopoulos, Luigi Pascali, Giacomo Ponzetto, Martin Rossi, Shanker Satyanath, Andrei Shleifer, RodrigoSoares, Daniel Sturm, Alessandro Tarozzi, and Yanos Zylberberg, as well as comments from seminar participantsat the Brown University Growth Conference, LSE Summer Seminar, CEP Education Seminar, LSE Economic His-tory Workshop, Oxford University International Trade Seminar, STICERD Work in Progress Seminar, UniversitatPompeu Fabra Labour / Public / Development Breakfast and Lunch, CREi International Lunch, Ponti�cia Univer-sidad Javeriana and Universidad de los Andes. Financial support from Universitat Pompeu Fabra and the CatalanGovernment (FI-DGR) is gratefully acknowledged. All errors are my own.†Universitat Pompeu Fabra and the London School of Economics. E-mail: [email protected]
1

�[T]he settlement of Paraguay, established by only a few Spanish Jesuits, appearsthe triumph of humanity, and seems in some measure to make atonement for thecruelties of the �rst conquerors. (. . . ) The Jesuits have civilized the [natives], havetaught them to be industrious, and have succeeded in governing a vast country (. . . )[making] a virtue of subduing savages by mildness and instruction.�
Voltaire, Essay on the Customs and the Spirit of the Nations (1756), italics added.
1 Introduction and Motivation
The importance of history for economic development is now well established (Nunn, 2009 and
2013; Spolaore and Wacziarg, 2013). Historical shocks and �critical junctures� have been shown to
in�uence modern outcomes through geography and natural endowments (Diamond, 1997; Enger-
man and Sokolo�, 1997, Gallup et al. 1999), legal origins and institutions (La Porta et al. 1998,
Acemoglu et al. 2001 and 2002), and genetics, human capital and culture (Ashraf and Galor, 2013;
Glaeser et al. 2004; Landes, 1998). Though the degree of historical persistence appears strong,
there are still questions remaining about the speci�c channels of transmission driving these results.
Dell (2010) stresses the negative impact of the mita labor system in Latin America and Nunn and
Wantchekon (2011) document the negative e�ect of slavery through decreased trust. There is less
known, however, on the way in which other colonial arrangements might have led to positive e�ects
in the long run.
This paper contributes to the empirical understanding of path dependence in economic development
by estimating the long-term economic impact of Jesuit Missions in South America. I focus on the
Guarani Jesuit Missions (1609-1767) in modern day Argentina, Brazil and Paraguay to assess the
long-term e�ect these institutions have had on income and human capital. I �nd that places that
are closer to missionary districts have a level of modern income that is around 10% higher. For the
main channel of human capital, I �nd a positive and signi�cant e�ect of around 10-15% on median
years of schooling and literacy. I further examine speci�c cultural mechanisms capable of sustaining
such persistent outcomes. In particular, I �nd that people closer to missionary areas work more
hours and specialize in skilled labor, moving away from agriculture towards manufacturing and
services (as in Eckstein and Botticini, 2005, 2007 and 2012).
2

The Guarani Jesuit Missions in South America provide an ideal setting for examining questions
of persistence of income, human capital and culture. A similar argument has been made by
Nunn (2010 and forthcoming) in the case of African Christian missions. In contrast to previous
studies, I exploit the fact that, following political disputes in Europe, Jesuits were expelled from the
Americas in 1767, precluding any direct continuation e�ect. More than focusing on the direct e�ect
of religion and religiosity (McCleary and Barro, 2003 and 2006), I analyze the externalities that
it has in terms of education (Becker and Woessman, 2008 and 2009) and occupational persistence
(Eckstein and Botticini, 2005, 2007, and 2012). Even though religious conversion was the o�cial
aim of the missions, they also had human capital spillovers in terms of basic instruction for the
children and skilled labor training for the adults.
The virtues and vices of the Jesuit Catholic Missions have been hotly debated by prominent
contemporaries and have been a major topic of study for historians ever since. The Missions
constituted a large social experiment, involving more than 120,000 individuals at their peak around
1730 (see Figure A.1). According to Voltaire (1756), a �erce opponent of the Church, missions had
a positive impact in terms of industriousness and education.1 Missions were seen as a New World
Utopia that stood in stark contrast with European corruption and decay. Other contemporaries
and historians such as Palafox (1600-1659) and Popescu (1967), and even the current Pope, have
been more critical of the so-called `Jesuit Republic' of Paraguay.2 Even though volumes have been
written about the history of the Jesuit Missions of South America, very little is known about the
economic consequences that these religious institutions may have had in the long term. To the
best of my knowledge this is the �rst study in economics to scrutinize this issue.
To assess the impact of the Guarani Jesuit Missions I assemble a novel data set that combines
archival information about the missions with modern outcomes at the municipal level. The geo-
1�When in 1768 the missions of Paraguay left the hands of the Jesuits, they had arrived at perhaps the highest
degree of civilization to which it is possible to conduct a young people, and certainly at a far superior state thanthat which existed in the rest of the new hemisphere (italics added).� Indeed, Voltaire sent Candide to visit and aidthe Jesuits of Paraguay, a praise also shared by Montaigne and Montesquieu.
2Pope Francis, the �rst Jesuit Pope of the Catholic Church, declared on his o�cial visit to Paraguay, �The truthis that what [the Jesuits] left, with the reductions [missions], are many ruins.� Pope Francis, S.J., in his o�cial visitto Asuncion, Paraguay. Quoted in La Nación newspaper, Argentina on November 25, 2013. Author's translation.
3

coded data set covers the missionary area comprising the states of Misiones and Corrientes in
Argentina, Rio Grande do Sul in Brazil, and Misiones and Itapua in Paraguay (Figures 1 and
2). With this set up I can also study the outcomes of interest in places with di�erent national
histories and institutions. The Jesuit missionaries went to what were essentially the backwaters of
the Spanish and Portuguese empires. The area was populated by the same semi-nomadic indige-
nous tribe, so I can abstract from the direct e�ects of pre-colonial ethnic tribes (Michalopoulos
and Papaionannou, 2013; Maloney and Valencia, 2012). The Guarani area has broadly similar
geographic and weather characteristics, though I still control for these variables in the estimation.
In order to gauge Jesuit missionary treatment I use �rst a dummy variable for whether or not
the municipality had a mission, and then use a more continuous distance to the nearest mission
formulation. I then estimate an econometric model of modern outcomes such as income and
education, based on these measures of missionary presence. I use country or state-�xed e�ects and
employ either the full sample or restricted samples with municipalities close to missionary districts.
I �nd a positive e�ect on income of 10% and educational attainment of approximately 15% in the
full sample. The e�ects are higher at the local level and robust to the inclusion of geographic
controls. Using historical censuses I �nd that the e�ect on human capital emerges as larger for the
intermediate time periods. This e�ect also appears concentrated on locals rather than foreigners,
as theorized in models of vertical or inter-generational cultural transmission (Cavalli-Sforza, 1981;
Boyd and Richerson, 1985; and Bisin & Verdier 2000 and 2001).
The problem with the OLS and �xed e�ects results is that the location of the Jesuit Missions
can be endogenous. Even though I control for a large set of relevant geographic and weather
characteristics, Jesuit missionaries might have chosen favorable locations beyond such observable
factors. Hence the positive e�ects observed might be due to this initial choice and not to the
missionary treatment per se. To quantify this possibility I calculate Altonji ratios (Altonji et al.
2005), which suggest that selection on the basis of unobservables would have to be more than four
times larger to drive the results.
4

To further address the potential endogeneity issue, I conduct two empirical tests. The �rst one is
a placebo test that looks at missions that were initially founded but abandoned early on (before
1659) by the Jesuits. This way I can compare places that were initially picked by the Jesuits
with those that actually received the missionary treatment (in the spirit of Greenstone et al. 2010
and Michaels 2008). The main threat to the survival of these missions was the attack from bands
of Portuguese slave hunters or bandeirantes paulistas . I �nd no e�ect for the missions that were
abandoned by the Jesuits early on, suggesting that it is what the Jesuits did and not where they
�rst settled that mattered in the long run.
Additionally, I conduct a direct comparison with the neighboring Guarani Franciscan Missions.
The comparison is relevant as both orders wanted to convert souls to the Catholic Church, but the
Jesuits emphasized education and technical training in their conversion. I �nd no e�ect for Fran-
ciscan Missions on income and education once I control for geographic and weather characteristics.
Alternatively, I employ a standard instrumental variables strategy, where I use as instruments the
distance to Asuncion and the distance to the Tordesillas line that divided the Spanish and the
Portuguese empires. Asuncion served as a base of missionary exploration during the foundational
period, but became less relevant for Rio Grande do Sul after the 1750 Treaty of Madrid transferred
this territory to Portuguese hands. For this reason and to avoid the direct capital e�ect, I use
this variable only for the Brazilian sub-sample of my data. To avoid the Portuguese bandeirantes ,
missionaries also tried to locate themselves far away from the Tordesillas line. Hence, the prob-
ability of survival of a mission is inversely proportional to the distance from this dividing line.
The �rst stage results are strongly signi�cant throughout (with F-statistics well above 10) and the
coe�cients for literacy and income preserve their sign and signi�cance across the IV speci�cations.
To conclude the empirical analysis, I examine speci�c cultural mechanisms that can account for
the persistence of outcomes from the missionary period to today. Using two specialized surveys
from Brazil and Paraguay I �nd supportive evidence on this regard. Consistent with Botticini and
Eckstein's (2005, 2007 and 2012) �ndings for the Jewish population, municipalities closer to historic
missions have changed the sectoral composition of employment, moving away from agriculture
5

towards manufacturing and services. In the case of Brazil I document that today these places still
produce more handicrafts such as embroidery, a skill introduced by the Jesuits. People closer to
Jesuit missions also seem to participate more in the labor force and work more hours, consistent
with Weber (1978 and 2011). Lastly, I �nd that knowledge (of traditional medicine and myths)
and Jesuit introduced innovations (such as accounting) was transmitted more from generation to
generation in the missionary areas, again consistent with the cultural di�usion models of Cavalli-
Sforza (1981) Boyd and Richerson (1985), and Bisin & Verdier (2000 and 2001). Additional
empirical robustness checks suggest that the results are not driven by migration, urbanization or
tourism.
The rest of the paper is organized as follows. Section 2 provides the context in terms of relevant
literature, historical background and geographical setting. Section 3 describes the data and Section
4 presents the empirical strategy. Section 5 contains the main empirical �ndings on income,
education and culture. Section 6 provides robustness checks and Section 7 concludes.3
2 Context
2.1 Related Literature
This article builds upon the emerging literature on historical development, which has been recently
summarized by Nunn (2009 and 2013) and Spolaore & Wacziarg (2013). The literature has moved
away from cross-country studies towards analyses within countries or using sub-national level data
(Banerjee and Iyer 2005; Nunn 2008; Bleakley and Lin 2012; Naritomi et al. 2012; Bruhn and
Gallego 2012; Dell 2012; Gennaioli et al. 2013; Michalopoulos & Papaionannou 2013 and Jha 2013).
This article relates more speci�cally to the literature on the long-term impact of colonialism and
colonial investments (Feyrer and Sacerdote, 2009; Huillery, 2009; Dell 2010; Becker et al. 2011;
Grosfeld and Zhuravskaya 2014; Jedwab et al. 2014). I contribute to this literature with an
exploration of the empirical mechanisms behind economic persistence, and the positive long-term
3The Appendix contains a data section and additional results.
6

impact of a speci�c colonial institution: religious missions.
Of particular relevance to the current work are studies that point towards the role of human
capital for long-term economic development. Seminal pieces by Benhabib and Spiegel (1994), Barro
(2001), Mankiw et al. (2002) and Glaeser et al. (2004) stress the importance of human capital
accumulation for growth. Micro evidence from Heckman (2000) and Hanushek & Woessman (2008)
also points towards the same direction for personal income. Questions remain, however, about the
channels of transmission and the degree of persistence of human capital shocks (Waldinger, 2012):
does human capital accumulation persist through time? Can a one-o� educational intervention
have repercussions that can be traced today?
Cultural explanations of economic performance date back to Max Weber's Protestant work ethic
hypothesis (Weber, 2011). The importance of cultural norms for economic activity has been
restressed by Greif (1993 and 1994) and Putnam et al. (1994). Both the positive (Guiso et al.
2008, Tabellini 2008) and negative (Grosjean, 2010; Voigtländer and Voth, 2012) long-term impact
of culture has been documented in the literature. Such historical studies avoid the issue of reverse
causality, but cannot disentangle the continuation e�ect of the phenomena analyzed, be it social
capital or anti-Semitism. To avoid this situation I use the fact that Jesuits were expelled due to
exogenous reasons from the Americas in 1767. Moreover, there is still the empirical question as to
whether cultural traits are transmitted horizontally or vertically, as in the theoretical models of
Cavalli-Sforza (1981), Boyd and Richerson (1985) and Bisin & Verdier (2000 and 2001).
Religion is, of course, a fundamental aspect of culture. Classic papers on this topic include Ian-
naccone (1990) and McCleary and Barro (2003 and 2006) and modern re-interpretations include
Becker & Woessman (2008 and 2009), and Eckstein & Botticini (2005, 2007 and 2012). A nascent
literature has explored the long-term e�ects of nineteenth century Christian missions in Africa. At
the country level Woodberry (2004 and 2012) and Lankina & Getachew (2012) �nd a positive e�ect
of Protestant missions on democracy.4 At the sub-national level, Nunn (2010) �nds that missions
4For a more critical view see Frankema (2012).
7

resulted in higher levels of religiosity, Gallego and Woodberry (2012) and Nunn (forthcoming) �nd
a positive impact on educational attainment, and Cagé and Rueda (2013) on political participa-
tion. Acemoglu et al. (2014) use Protestant missions as instruments for education to argue that
institutions had a signi�cant impact on long-run development. Within countries Wantchekon et al.
(2013) �nd positive human capital externalities from religious schools in Benin.5 Outside Africa,
Mantovanelli (2013) �nds a positive e�ect of Protestant missions on Indian literacy and Ying Bai
& Kung (2012) and Chen et al. (2013) on Chinese economic performance.
I contribute to the missionary literature in several ways. First, by focusing on Africa and excluding
Latin America from their analysis the existing papers have essentially neglected an area with one
of the most intense missionary presences.6 I also go further back in time from the nineteenth
to the seventeenth century and focus on Catholic as opposed to Christian missions.7 Perhaps
more importantly, I address directly the endogeneity of missionary location with placebo and
instrumental variables strategies. I also exploit the expulsion of the Jesuits in 1767, which precludes
a direct continuation e�ect. Finally, I present novel cultural mechanisms through which missions
may have had a persistent e�ect on income and education.
This paper also contributes to the literature of historical determinants of schooling. Gallego
(2010) argues for the importance of democracy and political decentralization. In Brazil, Rocha
et al. (2013), look at the role of European settlement communities in the state of Sao Paulo.
Complementary evidence is presented by Summerhill (2010) and de Carvalho Filho & Colistete
(2010 and 2011), who also examine the role of slavery and historical inequality. Mussachio et al.
(2014) look instead at the interaction of political decentralization and commodity booms during
the nineteenth century. Though I also focus on the historical determinants of schooling at the
sub-national level, I go further back in time and stress a di�erent determinant and specify the
channels of transmission in the Brazilian state of Rio Grande do Sul, Argentina and Paraguay.
5For similar within country evidence see Wietzke (2014) for education in Madagascar, Okoye (2014) for trust inNigeria and Meier zu Selhausen (2014) for female empowerment in Uganda.
6For a notable exception �in the case of Mexico� see Waldinger (2013).7See, for instance McCleary and Pesina (2011) for the case of Guatemalan Christian missions during the early
20th century.
8

Lastly, this paper relates to the literature on technology transfer in a historical setting. Spolaore
and Wacziarg (2012), Comin et al. (2010) and Maloney and Valencia (2014) show the very long-
term e�ects of technological shocks (2010). Dittmar (2011) argues that the introduction of the
printing press had a positive impact on urban growth in Europe between 1500 and 1600, Hornung
(2014) �nds a positive e�ect for the Huguenot diaspora in Prussia and Squiacciarini & Voigtländer
(2014) on Encyclopédie subscriptions in France. I document in this paper the di�erential usage of
technologies introduced by Jesuit missionaries such as embroidery and accounting.
The historiography of the Guarani Jesuit missions is vast, so I only present a brief summary here.
Primary sources include the cartas anuas (annual letters) written by the Jesuits Fathers such
as Ruiz de Montoya, Cardiel and Charlevoix on the state of a�airs of the missions. Hernandez
(1913), Furlong (1955), and more recently Palacios and Zo�oli (1991) provide detailed accounts of
the history of the Guarani Jesuit Missions. Ganson (2003) and Wilde (2009) provide a revisionist
interpretation constructed around Guarani ethno-history. Demographers Maeder (1995), Livi-
Bacci & Maeder (2004), and Jackson (2008) �nd that despite wars and epidemics Jesuit Missions
had a positive impact on the Guarani population. Alden (1996) provides a comprehensive history
of the Society of Jesus in Portugal and the Portuguese empire, and Sarreal (2014) focuses on
the Jesuit territories during the eighteenth century. Still, there is a lack of empirical studies in
economics about the Guarani Jesuit missions in South America. This study aims to �ll precisely
this gap.
2.2 Historical Background
The Society of Jesus was founded during the European Counter-Reformation in 1534 at the Uni-
versity of Paris by the Basque knight St. Ignatius of Loyola. From the outset it stressed human
capital and Papal obedience. It is considered a relatively new Catholic order, when compared to
the Order of Saint Benedict founded in 529, as well as the Franciscan, Dominican and Carmelite
Orders, all founded in the 1200s. For this reason, the Jesuits were the last major Catholic order to
arrive in the Americas through the Spanish and Portuguese empires. The �rst Jesuits arrived in
9

South America at Salvador de Bahia, modern day Brazil, in 1549 (Bethell Ed. 1984, Chapter 14).
The Jesuits followed a two-pronged strategy, educating the elites in the major colonial capitals
(Mexico City, Lima, Bogota and Quito) and developing indigenous missions in some of the most
isolated areas of the Spanish and Portuguese empires (Bethell Ed. 1984, Chapter 15). The �rst
Jesuit mission in South America was established in Juli in 1565 in modern day Puno, on the border
of Bolivia and Peru. The Jesuits also started missions in Mainas (Peru), Moxos and Chiquitos
(Bolivia), and Casanare and Orinoco (Colombia and Venezuela), Baja California (Mexico) and
California (United States).8 Outside the Americas, they established missions in China, India and
Japan in the sixteenth and seventeenth centuries.9
Without a doubt, the Guarani missions in modern day Argentina, Brazil and Paraguay constitute
the heart of the Jesuit missionary e�orts. The Jesuits arrived in Asuncion, modern day Paraguay,
on August 11, 1588.10 From Asuncion, they explored the surrounding area and established the �rst
Guarani Jesuit Mission in 1609. The Jesuits were not the �rst to establish religious missions in the
Guarani area, as the Franciscans established their �rst Guarani mission in 1580 (Duran Estragó,
1987).11 The Jesuit foundation was followed by a period of exploration that lasted for around �fty
years until 1659.12 The Jesuits founded a total of 30 missions or reducciones (reductions) in the
modern day territories of Argentina, Brazil and Paraguay (Figure 1 and Table A.1). At their peak,
the Guarani Jesuit Missions involved more than 100,000 inhabitants (Figure A.1), four times the
population of Buenos Aires in 1779. Guarani Jesuit Missions constituted one of �the most original
experiments of the spiritual conquest of the New World� (Roa Bastos, in Saguier, 1991, p. 9).
The Jesuit order's focus on human capital cannot be overemphasized. Furlong and Storni (1994)
stress the Jesuit contributions to advanced human capital in terms of cartography, ethnography,
linguistics, botanic, mathematics and medicine, among others. The Jesuits introduced the printing
press to Argentina, Brazil and Paraguay, and even established an astronomical observatory in San
8For an account of the California missions, see Bolton (1917).9Though I focus on the Guarani area, in principle the geographical dispersion of the Jesuit missions allows for
testing the external validity of my results.10Distance to Asuncion will be analyzed later as in the instrumental variables section.11The role of the Franciscans will be analyzed in the placebo section.12Missions that were founded but abandoned earlier by the Jesuits will be studied in the placebo section.
10

Cosme and Damian (Paraguay).13 The printing press was not formally introduced in Brazil until
the arrival of the Portuguese court in 1807 (Landes, 1998 P 134). Jose de San Martin, who would
go on to lead the independence movement of the Southern Cone, was born in the Jesuit mission
of Yapeyú, Corrientes, Argentina. Jesuits were at the technological frontier of the time, and their
cultural contributions to both music and the arts are also famous.
Even though the o�cial aim of the missions was to convert souls to Christianity, the Jesuits taught
children how to read and write and carry out basic arithmetic. They also trained adults in masonry,
wood carving and embroidery (Gálvez, 1995). This emphasis on education can be seen in Figure
A.2, which provides a historical blueprint of the emblematic Guarani mission of San Ignacio de
Mini, Argentina. Right next to the main square and the church, we can observe the school (colegio)
for the children along with the workshop (taller) for the adults. For the Guaranis, the missions
provided not only educational opportunities, but also security and protection. The communities
thrived despite the attacks from the bandeirantes paulistas, which I analyze later.14
The expulsion of the Jesuits constitutes a major event in the history of colonial Latin America.
After intense political �ghts in Europe, the Jesuits were expelled from Spain and Portugal and
their Latin American colonies in 1767. Kings Charles III of Spain and Joseph I of Portugal,
counselled by the Marquis of Pombal, pressured the (Franciscan) Pope Clement XIV to issue an
order of expulsion. The order was carried on with surprising e�cacy in the Guarani area by the
Governor of Buenos Aires, Francisco de Paula Bucarelli. Clement XIV proceeded to dissolve the
Jesuit Order in 1773. The Jesuits were exiled to Ferdinand the Great's Prussia and Catherine the
Great's Russia and the order was only restored in 1814 by Pope Pius VII. The Jesuits were never
to return to the Guarani area.
13Books were printed in the missions of Santa María la Mayor and San Francisco Xavier (Ganson, 2003).14Ganson (2003) reports a maximum of 141,182 people in 1732.
11

2.3 Geographic Context
As mentioned previously, the Latin American Jesuit Missions were located in what were essentially
frontier lands of the Spanish and Portuguese empires (Bolton, 1917). The case for the Jesuit
Guarani lands was no di�erent, in the border between modern day Argentina and Brazil and
neighboring the bu�er state of Uruguay (Figures 1 and 2). Though targeted, the area under
consideration is not small and is comparable in size to Uruguay or Ecuador.15 For the Spanish
Crown, the missions were a tool for incorporating people into the empire (Sarreal, 2014). Even
though Paraguay was an important territory for the Spanish empire at the time, the Jesuit Missions
were isolated from the colonial capital of Asuncion. Even then, Asuncion counted only 6,451
inhabitants in 1761 (Ganson, 2003).16 The missions were also located far away from the state
capitals of Corrientes (1588) and Villarica (1682). The Jesuits went to an area that remains
relatively inaccessible today.
The Guarani area was populated by the same indigenous tribe, also known as the Tupis in Por-
tuguese. The Guaranis were semisedentary and cultivated manioc root and maize through slash-
and-burn agriculture. At the time of the arrival of the Jesuits, the Guarani lacked iron tools and
weapons (Ganson, 2003). By focusing on this area I abstract from the direct e�ects that di�erent
pre-colonial ethnic tribes have been shown to have in Africa and the Americas (Gennaioli and
Rainer (2007), Michalopoulos and Papaionannou, 2013; Maloney and Valencia, 2012). The zone
is covered by subtropical forests, the climate is humid and the area contains no major mineral
resources (Palacios and Zo�oli, 1991).
3 Data
I use archival records, government census data and household surveys to run my empirical analyses.
To extract usable data from historical sources, I use ArcGIS. An example can be seen in Figure
A.3., which shows a historical map of the Jesuit Missions of Paraguay. Overall, my data set
15Similar in size to Italy or the state of Arizona, in the US.16Buenos Aires and Sao Paulo lied even farther away.
12
covers �ve states in three countries (Figure 2); namely, the states of Misiones and Corrientes in
Argentina, Rio Grande do Sul in Brazil, and Misiones and Itapua in Paraguay. In total, there
are 578 observations that correspond to the municipal or third level divisions for these countries
(departamentos in Argentina, municipios in Brazil, and distritos in Paraguay).
The municipal-level data for this paper come from three separate sources. First, there is infor-
mation taken from historical archives on the location, year of foundation, population and general
workings of the Guarani Jesuit Missions.17 Additional historical data come from the National Cen-
suses of Argentina in 1895 and 1914; Brazil in 1890, 1920 and 1940; and Paraguay in 1950. Second,
there is an extensive set of geographic and weather controls at a highly disaggregated level. Third,
there are a series of outcomes from modern censuses for Argentina (2001, 2010), Brazil (2000,
2010) and Paraguay (2002, 2012). Modern data are in turn complemented by specialized survey
modules on culture carried on in the 2006 Brazilian Municipal Survey and the Paraguay Public
Household Survey of 2012. The speci�c variables used can be divided as follows and are described
in more detail in the Data Appendix:
Income and Poverty: Income data for Brazil at the municipality level are complemented with
poverty data for Argentina and Paraguay.
Education: Literacy rates at the municipal level for Argentina, Brazil and Paraguay are comple-
mented with data on median years of schooling for Brazil.
Missionary Presence: To measure missionary presence I use a missionary dummy and distance to
the nearest mission. Additionally, I use missionary population, year of foundation of the mission
and a dummy for whether or not it moved.
Geographic and Weather Controls: I include an extensive set of geographic and weather variables
for two reasons. The �rst is to use them simply as controls to increase the precision of the estimates.
17These include the Archivo de Indias (Seville), Archivo General de la Nación (Buenos Aires), Archivo Nacional(Asuncion) and the Roman Jesuit Archives (Vatican).
13

The second is related to identi�cation and will be discussed in that section. Aside from standard
measures, I include more sophisticated controls, such as ruggedness and distance to rivers that may
have been more relevant to missionary settlement. The precise variables I use are: area, altitude,
latitude, longitude, temperature, rainfall, ruggedness, slope, distance to river, distance to coast
and a coastal dummy.
Summary statistics for the variables presented so far can be found in Table 1, divided into income,
education, Jesuit missionary presence, geographic and weather characteristics. Log income is 5.67,
median years of schooling 5.08 and literacy levels of around 90%.
Historical Outcomes: A series of historical censuses for Argentina (1895 and 1914), Brazil (1890,
1920 and 1940) and Paraguay (1950) provide valuable information for the intermediate time period
between missionary and modern times. The historical boundaries were matched to calculate the
relevant distances. The data also allow for the calculation of heterogeneous e�ects. In particular
I use historical data on: literacy, religion, mixed marriages and language.
Cultural Variables: Two specialized surveys available for Brazil and Paraguay allow for the explo-
ration of cultural transmission mechanisms. In particular, I use the Brazilian Municipal Survey of
2006 and the Cultural Module of the 2011 Paraguayan Household Survey. Information from these
surveys is complemented with other cultural variables from the 2012 Paraguayan Household Sur-
vey.18 The speci�c variables used are: handicrafts and embroidery, inter-generational knowledge
transmission, language and race.
Additional Data: In order to test for possible confounders, analyze heterogeneous e�ects and
explore alternative transmission mechanisms, I gather additional demographic, economic and labor
data. The actual variables I employ are: population density, migration, hours worked, labor force
participation, occupation, inequality, health and tourism.
18To the best of my knowledge, no comparable information exists for Argentina at the municipal level for thearea studied. Note, for instance, that neither the World Values Survey nor the regional Latinobarometer samplethe areas under consideration.
14

4 Empirical Strategy
4.1 Estimating Equations
In order to estimate the e�ect of the Jesuit Missions on contemporary outcomes, I use the following
econometric models:
f(Y2000,ij) = α + βd(Mij) + γGEOij + µj + εij (1)
HK2000,ij = α + βd(Mij) + γGEOij + µj + εij (2)
where Y and HK are income and human capital in municipality i in state / country j in equations 1
and 2, respectively.19 M measures missionary presence at the municipality level and the d function
is either a missionary dummy or distance to the nearest mission in kilometers, as described in the
data section. Hence the coe�cient of interest is β which in the case of a positive impact would be
positive in the dummy formulation and negative in the distance to the nearest mission formulation.
GEO is a vector of geographic and weather controls with a corresponding vector of coe�cients γ.
µ captures a country or state-�xed e�ect, depending on the speci�cation.α is a generic constant
and ε is an idiosyncratic error term. I use a similar formulation to Equation 2 when I analyze
cultural outcomes.
4.2 Estimation
To actually estimate the equations above, I use OLS with �xed e�ects. Controlling for �xed factors
is important for several reasons. First, data collection might vary at the country and even the
state level. Second, there can be national institutional di�erences that are important to take
into account in the estimation (Acemoglu et al. 2001 and 2002). I use robust standard errors
throughout, except when the number of observations is too small and I jointly report bootstrap
standard errors. Given the small number of countries and states I do not cluster errors at this
level, but instead conduct robustness tests using spatially adjusted Conley standard errors (results
19As is standard, I take the logarithm of income.
15

not shown). As an exception, I use probit speci�cations with errors clustered at the district level
for the individual level data in the cultural section.
I report results for both the full as well as reduced samples, where I use di�erent distance thresholds
(<400, 200 and 100 kilometers from the nearest mission) in order to reduce the constraint imposed
by the modern administrative boundaries. The results are preserved and appear stronger at the
local level.
4.3 Identi�cation
The causal identi�cation of the missionary e�ect hinges on several assumptions. First, the historical
record suggests that the foundation of the missions proceeded in a relatively haphazard manner.
Hernandez (1913) describes as a `coincidence' the entrance of the Jesuit priests to Paraguay. Other
historians describe the foundation of San Ignacio de Guazu as an unprecedented `adventure' and
the initial establishment of the �rst missions as perilous and random (Astrain, 1996). As seen
in the Appendix, the remarkable success of some missionaries is contrasted with the failure and
even death of some of their contemporaries. Moreover, being the last Catholic order to arrive
to the Americas, the Jesuits had `last pick' and ended up in peripheral areas of the Portuguese
and Spanish empires. This will be examined in the section contrasting Jesuit and Franciscan
missionaries. I also control directly for geographic conditions such as lower altitude and proximity
to rivers that might have in�uenced the initial settlement choices. Since Jesuit missionaries might
have chosen places with more favorable geographic conditions, it is important to include these
variables directly in the estimation. Finally, I use standard econometric techniques such as placebo
tests (abandoned missions) and instrumental variables (distance to Asuncion and Tordesillas) to
con�rm the causal e�ect of the Jesuit missions. I discuss the possible issue of sorting in relation to
geography, migration and attacks throughout the results. In general, I do not �nd that selection
is driving the Jesuit missionary e�ect.
16

5 Results
The main results of the paper can be divided into three sections. The �rst shows that places closer
to Jesuit Missions have higher income or lower levels of poverty of around 10%. The second stresses
human capital as the main channel through which these outcomes have persisted. Missionary
districts have 15% more years of schooling and higher literacy both in modern and historical time
periods. The third and last section explores the speci�c cultural mechanisms that can explain the
persistence of outcomes from the missionary period to today. I complement these empirical results
with a battery of robustness tests.
5.1 Income and Poverty
5.1.1 Income with Dummies
As a �rst pass of the data, I look at the impact of missions on income in Brazil using dummy
variables. In this �rst speci�cation, a municipality receives a value of 1 if it had a Jesuit mission in
the past and 0 otherwise. This coarse measure assumes that the boundaries of the missions were
strict and is mostly used for descriptive purposes.20 As can be seen in Figure 3, the missionary e�ect
on logarithm of income appears positive, large and statistically signi�cant at di�erent distance
thresholds. This is true both for the full sample at around .8 log points as well as for progressively
smaller samples (starting with 500 kilometers to the nearest distance in 100 decreases). The
coe�cients appear stable in magnitude and relatively larger at the local level. Because missionary
presence might just be capturing di�erent geographic and weather characteristics, I control for these
variables directly in Figure 4. Although now smaller in magnitude, at around .6 log points, the
results are largely unchanged. The coe�cients are again positive and signi�cant, stable and larger
at the local level. The results suggest that geographic conditions have a positive and signi�cant
e�ect, but that there is still an important role for the missionary treatment.21
20The missionary area covers around one million of the total ten million inhabitants in the sample.21The direct e�ect of geographic factors has been stressed, among others, by Gallup et al. (1999), Rappaport
and Sachs (2003) and more recently by Nunn and Puga (2012).
17

To formally assess the role of observable variables and unobservable characteristics, I calculate
Altonji ratios (Altonji et al. 2005; Bellows & Miguel, 2009).22 The intuition of this exercise is to
see how large the selection in unobservableswould need to be relative to observables in order for it
to drive the observed e�ect. For the full sample the ratio is 4.15 (Altonji et al. 2005 report 3.55)
meaning that selection in unobservables would need to be that much higher to drive the results.
Technically, for this result to hold the R-squared of the regressions should be approaching the
maximum R-squared (Oster, 2013). In this case the R-squared increases from around .3 to (a very
high) .66 in the localized sample. Although the results from this exercise are reassuring, I employ
other strategies to deal with endogeneity in the rest of the paper.
5.1.2 Income with Distance
In order to better capture the missionary e�ect, I now use distance to the nearest Jesuit mission.
This variable has several advantages over the previous measure. First, as a continuous variable it
provides a more informative and �exible measure of missionary intensity for municipalities that
did not have a mission within their border. Second, it helps to solve the problem that missions
might not have had such clearly-de�ned boundaries over time.23 Additionally, people might have
migrated to nearby towns or vice versa, an issue I explore explicitly in the historical results and
robustness sections.
The results for the distance formulation can be seen in Table 2 (�rst three columns) for Brazil.
All speci�cations include geographic and weather controls. The coe�cients appear negative and
strongly signi�cant in the full sample (Column 1). They remain robust in the reduced samples of
400 and 200 kilometers to the nearest mission (next two Columns).24 In terms of interpretation,
being 100 kilometers closer to a mission brings a maximum of .3 log points of income per capita,
which is about half of the previous dummy variable formulation.
22For a similar application in a historical context, see Nunn and Wantchekon (2011).23Cf. with Dell (2010), where the mita boundaries were strictly drawn and enforced in Bolivia and Peru.24For Brazil, less than 400 kilometers covers less than 90% of the sample and less than 200 kilometers about half
of the sample.
18
5.1.3 Poverty: Unsatis�ed Basic Needs Index
Because of the lack of income data at the municipal level for Argentina and Paraguay, I study these
two countries separately using instead the Unsatis�ed Basic Needs (UBN) Index as a multidimen-
sional measure of poverty.25 The results can be seen in Table 2, using the continuous distance
to the nearest mission formulation and country �xed e�ects. Again, all speci�cations control for
geographic and weather characteristics. The results appear very similar to the ones for Brazil.
The coe�cient for distance to the nearest mission now emerges signi�cantly positive (since the
dependent variable is now poverty) in Column 4. I further reduce the sample to places 100 kilo-
meters away from a mission.26 Again the point estimates are stable and e�ects appear larger at
the local level (Column 5). By construction, the poverty index allows for an easier interpretation
of the results. In terms of magnitude, as one moves 100 kilometers farther away from a missionary
district, the poverty index increases by approximately 10%. The results are also robust to using
the household as opposed to the person UBN index, in the last two columns of Table 2. The
comparable results for countries with marked historical and institutional di�erences point towards
the strength of the Jesuit e�ect on income.27 To explore the main channel of transmission of this
e�ect, I now turn to human capital.
5.2 Human Capital
5.2.1 Raw Data
Before running any regression, Figure 5 summarizes the spirit of this section. This graph plots
modern literacy rates for people aged 15 and older versus distance to the nearest Jesuit mission
in kilometers. Municipalities that had missions (orange triangles) cluster at the left hand upper
corner with rates around 90%. It appears clear with the linear trend line that the farther away a
25The UBN methodology seeks to determine, with the help of a few simple indicators, if the population's basicneeds are being satis�ed. The groups that do not reach the minimum threshold are classi�ed as poor. The selectedsimple indicators are: inadequate housing, housing with critical overcrowding, housing with inadequate services,households with high levels of economic dependence, and households with school-age children not enrolled in school.The UBN index is normalized from 0 to 100.
26I use this cuto� for the Argentina and Paraguay sample since less than 200 kilometers covers around 90% ofthe observations and less than 100 kilometers around 70% of the sample.
27I explore alternative speci�cations in the robustness section.
19

municipality is from a historic mission, the lower its literacy level. This unconditional relationship
is negative and highly signi�cant with a t-statistic of -4.36. Although modern literacy rates are
relatively high in modern times, the negative relationship appears substantial. To better quantify
this phenomenon I estimate Equation 2 using median years of schooling for Brazil and literacy
rates in the merged sample. The pattern observable in the raw data is con�rmed in the regressions.
5.2.2 Median Years of Schooling
As a proxy for human capital, I use �rst Brazilian data on median years of schooling. Again I
control directly for geographic and weather characteristics. The results of estimating Equation
2 using this variable can be seen in Table 3. The coe�cients are negative, strongly signi�cant
and stable. With a mean of around 5 years of education, the estimates suggest that moving 100
kilometers closer to a mission increases years of schooling by .6 to .8 years or around 15%. So these
magnitudes are economically important, especially when considering that Brazil has a low level
of education even by Latin American standards (Hanushek and Woessman, 2012). The education
results are slightly larger than the ones found by Nunn (forthcoming) for Christian missions in
Africa.
5.2.3 Literacy
As a second proxy of human capital I use literacy rates, which are reported for the three countries.
Merging the data and running the human capital speci�cation with state �xed e�ects leads to
similar conclusions as before. The point estimates are positive and signi�cant for illiteracy rates
(Table 3). The coe�cients are stable and increase in magnitude in the local sample. With a mean
literacy rate of around 90%, the e�ect estimated suggests a reduction in illiteracy of at least 10%
when moving 100 kilometers closer to a mission. Again the missionary e�ect on education is notable
given the di�erent historical and institutional trajectories of Argentina, Brazil and Paraguay.28
28For robustness, I also estimate the literacy formulation in the merged sample using distance to the nearestmission for each country (not shown). This leaves the results unchanged only reducing slightly the magnitude ofthe coe�cients.
20
Overall, I �nd there to be a positive and signi�cant e�ect of Jesuit Missions on modern human
capital, measured as median years of schooling in Brazil and illiteracy for all of the three countries.
To assess the economic importance of the human capital results, I run a speci�cation of income on
literacy, instrumented by distance to the nearest Jesuit Mission (not shown). The unconditional
estimates are of around 27% while the ones with geographic and weather controls are of around
8%, which is consistent with micro evidence as discussed in Acemoglu et al. (2014). As for income,
the results suggest the importance of controlling for these variables in the estimation.
5.2.4 Intermediate Outcomes
I examine intermediate human capital outcomes for two reasons. First, to see how the e�ects I �nd
for the modern time period have been accumulated di�erentially over time. Second, the historical
data can also be used to identify heterogeneous e�ects. I focus here on the Argentinean Census of
1895 and the Brazilian Census of 1920, though the results also hold for alternative years for these
countries and for the Paraguay 1950 Census.29 In general, I �nd that Jesuits had an even larger
e�ect on human capital during intermediate periods.
Table 4 presents the results for the 1895 Argentinean census. Illiteracy appears consistently higher
the farther away the municipality is from a Jesuit mission. The results are not only positive and
signi�cant, but also larger than before (Column 1).30 Being 100 kilometers closer to a mission leads
to a reduction in illiteracy of 4%. The larger e�ect might be due to the much lower levels of literacy
during this period, which had an average of 23% and a standard deviation of 8%. Alternatively,
the missionary educational treatment might have faded away over time, so it is not surprising to
see a stronger e�ect at a historical time period.31 In terms of heterogeneity, the results are higher
for females than males (Columns 2 and 3). Furthermore, they also appear concentrated among
Argentineans as opposed to foreigners (Column 4).32 This is sensible, as the �rst were presumably
29These are the Argentinean Census of 1914 and the Brazilian Census of 1940, the 1950 Census is This is actuallythe �rst national o�cial Census of Paraguay.
30Due to the small number of observations, I also report bootstrap standard errors.31It is well known that literacy levels have largely converged during modern times (Hanushek and Woessman,
2012).32These results also hold when using the 1914 census (not shown). Using that census I �nd additionally that
missionary areas have higher levels of educational instruction.
21

the descendants of those who received the missionary treatment, while the second had only recently
arrived to the country.33 The heterogeneous �ndings are also consistent with a story of vertical
cultural transmission (Cavalli-Sforza, 1981, Boyd and Richerson 1985, Bisin & Verdier, 2000 and
2001) for the historical period.
The results for the 1920 Brazilian census are very similar to the ones just described for Argentina.34
The e�ect on literacy is statistically signi�cant and large for the Brazilian population as a whole
(Table 4, Column 5) and for di�erent age groups: 7 to 14 years and over 15 years of age (Columns
6 and 7). As for Argentina, the e�ect is also larger historically, in the order of 10%, and again it
appears concentrated on Brazilians as opposed to foreigners (Column 8).35
Additional results show a large degree of persistence between historical and modern levels of
literacy (Figure A.4). This is especially true for Argentina, with a slope of .23, but also holds for
Brazil, albeit with a higher degree of convergence with a slope of .193. A similar exercise with
the 1950 Paraguay data reveals a slope of .217. All relationships are statistically signi�cant at
the 1% level. Though striking in itself, this degree of historical persistence is not surprising if one
considers the earlier results for the Jesuits. Indeed, one interpretation of the intermediate historical
results is that the missionaries altered the early levels of human capital, generating di�erences in
accumulation that were observable during historical times and are prevalent even today.36
5.3 Placebo Test and Relevant Comparison
As has been discussed before, Jesuit missionaries might have sorted into better places, beyond
observable geographic and weather characteristics. In order to address the endogeneity problem of
missionary location I conduct a placebo test and a relevant comparison. The �rst looks at missions
33Recall that this was an age of mass migration to Argentina (Droller, 2012). The issue of migration in moderntimes is explored in the robustness section.
34Since the data are reported for di�erent age groups, I keep here the literacy variable instead of using itscomplement. I restrict the sample to municipalities 200 kilometers or closer to a historic mission.
35The literacy results also hold for the 1940 census, not shown. This census allows for the estimation of educationalinstruction as an alternative educational variable.
36A similar argument has been made by Rocha et al. (2013) for the European colonies in the state of Sao Paulo,Brazil. As will be seen later, this view is also consistent with Eckstein and Botticini (2005, 2007 and 2012) in thatan early human capital shock resulted in long-lasting di�erences in occupational structures.
22

that were initially founded but abandoned early on by the Jesuits. This goes to the heart of the
question as to whether Jesuits simply picked better places ex ante. The second is a comparison
with the neighboring Guarani Franciscan Missions, which did not stress human capital formation
and technical training. More than a placebo per se this exercise allows for the comparison between
two Catholic orders with a di�erent focus in a similar area.
5.3.1 Abandoned Missions
The Guarani missions were not the only ones founded by the Jesuits in the Guarani area. Three
nearby missionary nuclei were established by the Jesuits in Guayra, Alto Parana and Itatin. These
missions all belonged to the aforementioned exploratory period lasting for 50 years until 1659. In
the Guayra region the Jesuits founded Loreto and San Ignacio in 1610; and in Alto Parana the
missions of Nuestra Señora de la Natividad de Acaray in 1624 and Santa Maria la Mayor de Iguazu
in 1626. In the Itatin region they founded several reductions the last of which was Yatebó in 1634.
These missions were abandoned early on and were not integrated with the rest of the Guarani
system of missions (Hernandez, 1913).37 The Guayra foundations lasted from 1610 to 1630 and
the Alto Parana nuclei from 1609 to 1638. Itatin foundations were disbanded in 1648 and �nally
relocated in 1659. The principal threat to the survival of these missions was their proximity to
the Portuguese bands of slave hunters or bandeirantes (Ganson, 2003). The bandeirantes attacks
started in 1611 and continued from 1628 to 1632. 38 The whole Guarani area would remain prone
to attacks, as evince by the bandeira of Francisco Pedroso Xavier in 1676.39 These were not the
only threats to the consolidation of missions, which also depended on the survival of priests, as I
explore later using Jesuit martyrs data.
I retrieve the coordinates for the abandoned missions of Guayra, Alto Parana and Itatin to use
them as a placebo test. The rationale of this exercise is that these places were also picked originally
37Jesuit Domingo Muriel provides a valuable historical account of these missions (Muriel 1766, reprinted inFurlong 1955).
38The e�ect of the bandeirantes will be explored further in the instrumental variables section.39In this sense this set up is di�erent from the African one as in Nunn (2008) and Nunn and Wantchekon (2011).
23

but abandoned early, so they did not receive the full missionary treatment of the Guarani missions.
In the absence of a grand plan for the construction of the Jesuit Missions, these abandoned missions
are as close as I can get to unbuilt missions (see for instance, Greenstone et al. 2010 and Michaels
2008).
I �nd no e�ects for the abandoned missions, either in terms of income or education. As can be seen
in the �rst four Columns of Table 5, the coe�cients for income for the missions of Alto Parana,
Guayra and Itatin are not signi�cant either separately or jointly. For literacy (Columns 5 to 8),
some of the coe�cients are signi�cant separately but appear now with the opposite (positive)
sign. When estimated jointly, they lose signi�cance or do not appear with a consistent sign.40
The results do not support the hypothesis that the bandeirantes had a negative and long-lasting
e�ect in these areas. The �ndings also suggest that it was not just the original placement of
missions but the actual development of the missionary activities for centuries which had an impact
in the long-term.41 To further explore this issue I now consider the case of the Franciscan Guarani
missions.
5.3.2 Franciscan Guarani Missions
The comparison with the Franciscan Guarani Missions is a relevant one, as many of the elements
that led to their location�such as indigenous availability, favorable climatic and geographic condi-
tions�were common to the Jesuit Missions. Ultimately, both Catholic orders wanted to maximize
the number of souls converted to Christianity. As mentioned in the historical background, Jesuits
were not the �rst to establish religious missions in the Guarani area. The �rst Guarani Franciscan
Missions were established between 1580 and 1615 by Fathers Bolaños and Alonso, while the �rst
Guarani Jesuit Mission appeared in 1609 (Duran Estragó, 1987). By choosing �rst, Franciscans
located themselves further north and closer to the existing population centers, presumably ending
up in better locations. I study the early missions of Altos founded in 1580, Ita in 1585, Yaguarón
in 1586; Aytyrá, Guarambaré, Tobatí and Ypané from 1580 to 1600, Caazapá in 1606, and Yuty
40The Guarani Jesuit distance results are robust to the inclusion of these abandoned missions (not shown).41Another way to explore this issue is to look at the intensity of treatment of Guarani Jesuit Missions, an issue I
address in the Appendix of the paper.
24
in 1611. I use the exact location and the available historical population data for these Franciscan
Guarani missions.
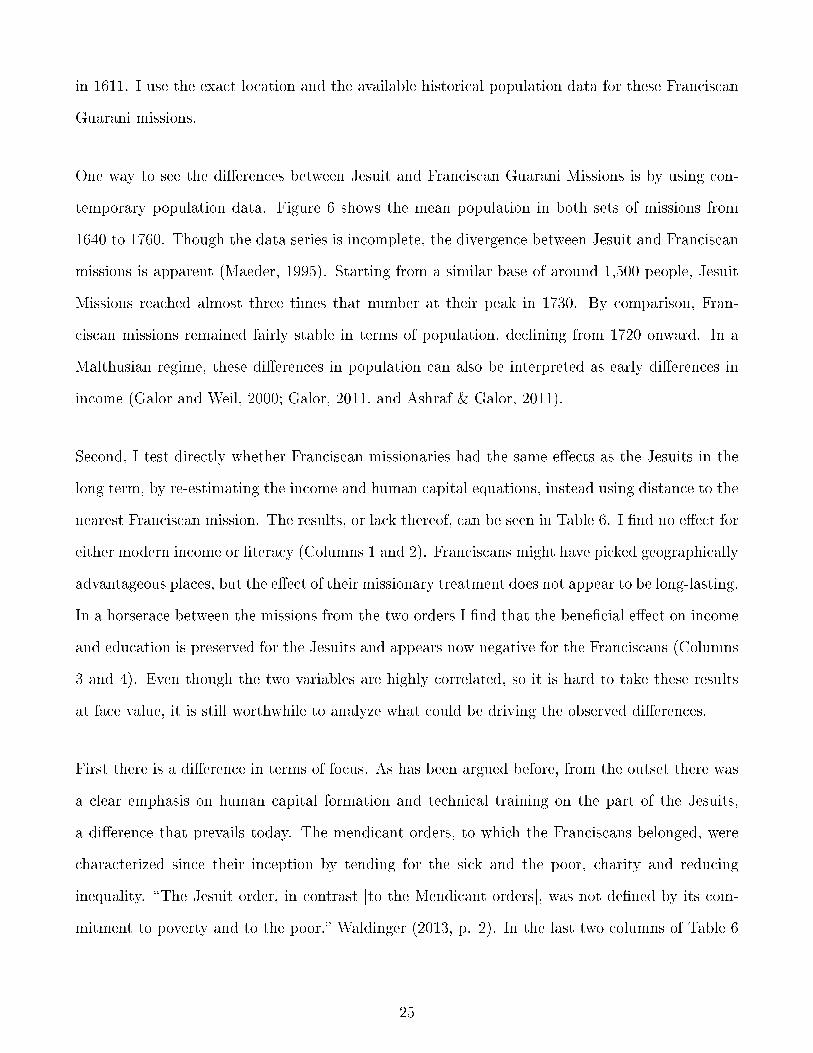
One way to see the di�erences between Jesuit and Franciscan Guarani Missions is by using con-
temporary population data. Figure 6 shows the mean population in both sets of missions from
1640 to 1760. Though the data series is incomplete, the divergence between Jesuit and Franciscan
missions is apparent (Maeder, 1995). Starting from a similar base of around 1,500 people, Jesuit
Missions reached almost three times that number at their peak in 1730. By comparison, Fran-
ciscan missions remained fairly stable in terms of population, declining from 1720 onward. In a
Malthusian regime, these di�erences in population can also be interpreted as early di�erences in
income (Galor and Weil, 2000; Galor, 2011, and Ashraf & Galor, 2011).
Second, I test directly whether Franciscan missionaries had the same e�ects as the Jesuits in the
long term, by re-estimating the income and human capital equations, instead using distance to the
nearest Franciscan mission. The results, or lack thereof, can be seen in Table 6. I �nd no e�ect for
either modern income or literacy (Columns 1 and 2). Franciscans might have picked geographically
advantageous places, but the e�ect of their missionary treatment does not appear to be long-lasting.
In a horserace between the missions from the two orders I �nd that the bene�cial e�ect on income
and education is preserved for the Jesuits and appears now negative for the Franciscans (Columns
3 and 4). Even though the two variables are highly correlated, so it is hard to take these results
at face value, it is still worthwhile to analyze what could be driving the observed di�erences.
First there is a di�erence in terms of focus. As has been argued before, from the outset there was
a clear emphasis on human capital formation and technical training on the part of the Jesuits,
a di�erence that prevails today. The mendicant orders, to which the Franciscans belonged, were
characterized since their inception by tending for the sick and the poor, charity and reducing
inequality. �The Jesuit order, in contrast [to the Mendicant orders], was not de�ned by its com-
mitment to poverty and to the poor.� Waldinger (2013, p. 2). In the last two columns of Table 6
25

I look at these possibilities.42 Areas closer to Franciscan missions, however, do not seem to have
lower levels of inequality relative to the Jesuit areas (Column 5). The same is true for health,
proxied by mortality (Column 6). If anything, the Jesuit areas do better in these regards. It is the
Jesuit focus on human capital, which appears to have had a bene�cial role in the long run.
Other di�erences between the Franciscan and Jesuit Missions have been documented in the his-
torical literature. Even when they were devoted to similar activities (cattle raising and yerba mate
cultivation), the Jesuits proved more e�ective (Maeder, 1995). Hence it is not surprising that the
Jesuits were also more successful in their educational endeavors. Institutionally, Franciscans were
more open towards the colonial labor system of encomienda, while Jesuits were more successful in
obtaining lower labor tributes and taxes from the Spanish Crown (Salinas, 2010).43 By choosing
�rst, Franciscans located themselves further north and closer to the existing population centers,
which made it harder for them to resist the Spanish colonial encroachment. For instance, indige-
nous people from these missions were used to execute local works (Salinas, 2010). The isolation of
the Jesuit Missions in what were essentially frontier lands made it harder for the Spaniards to use
the natives for such activities, protecting and bene�ting them in the long term.
5.4 Instrumental Variables
An alternative way to address the potential endogeneity of missionary placement is to use standard
instrumental variable techniques (Angrist and Pischke, 2008). The idea is to �nd a source of
variation that is correlated with the initial placing of the missions, but that does not a�ect the
outcomes of interest directly. In this section I present two such candidates: distance to Asuncion
and the horizontal distance from the Tordesillas line.44 I start with some historical background to
justify these choices and examine their corresponding exclusion restrictions.
42To see how the mendicant character of some Catholic orders actually bene�ted human capital formation in thecase of Mexico, see Waldinger (2013). Another distinction between the two scenarios is that the Jesuits focusedmore on elite education in Mexico relative to Paraguay, where the missions took the lion's share of their apostolice�orts.
43An exception being the Jesuit Mission of San Ignacio de Guazu which was located closer to the FranciscanMissions and experienced the encomienda labor regime.
44I also use proximity of Jesuit martyr sites in the appendix.
26

5.4.1 Distance to Asuncion
As was mentioned in the historical context, the �rst Jesuits arrived in Asuncion on the 11th of Au-
gust of 1588. From that base, Fathers Manuel Ortega and Thomas Fields started their evangelical
expedition in the territory of Guayra. Subsequent expeditions explored the area controlled by the
Guarani, leading to the foundation of the �rst mission of San Ignacio Guazu in 1609. Asuncion
would remain an exploratory base throughout the missionary period (Figure 7). Still, it is impor-
tant not to overemphasize the importance of Asuncion, which had a population of 6,451 in 1761,
twenty times less than the Jesuit Missions (Ganson, 2003).
In 1750, less than twenty years before the expulsion of the Jesuits, the Treaty of Madrid changed
the Spanish and Portuguese borders in South America. This treaty replaced the Tordesillas Treaty
of 1494, largely leaving the territory of Brazil in its current form.45 In the missionary area, the
modern state of Rio Grande do Sul passed to Portuguese hands along with the seven missions (also
known in Portuguese as the sete povos) of Sao Borja, Sao Luiz Gonzaga, Sao Nicolau, Sao Miguel,
Sao Lourenço Martir, Sao Joao and Santo Angelo. The center of in�uence for this region shifted
abruptly from the Spanish to the Portuguese empire, diminishing the importance of Asuncion as
a colonial capital. My working assumption is that this city is even less relevant for Rio Grande
do Sul in modern times, but that it was in�uential in the historical placing of the Jesuit Missions.
Despite being a neighbor, Paraguay is not among the main trading partners of Brazil and its trade
share (exports plus imports) was less than 2% in 2010.
I instrument distance to the nearest Jesuit Mission using distance from Asuncion, only for the
Brazilian sub-sample of the data (Figure 7). I exclude the states in Paraguay given the importance
of the national capital and Argentina, which remained part of the Spanish Empire after the borders
were changed in 1750 until it became independent in 1810. For robustness, I control directly for
distance to Sao Paulo, which became the new pole of in�uence for the region. This identi�cation
strategy is similar to the one employed recently by Becker and Woessman (2009) with distance to
Wittenberg and Dittmar (2011) with distance to Mainz. The results of this instrumental variables
45The Tordesillas treaty will be explained in the next section.
27
exercise can be found in Table 7. The �rst stage is very robust (F-statistic > 10). As before,
the instrumented coe�cients appear signi�cantly negative for income (Column 1) and positive for
illiteracy (Column 5). The coe�cients for income have a similar magnitude to the OLS estimations
and the ones for income appear slightly larger.
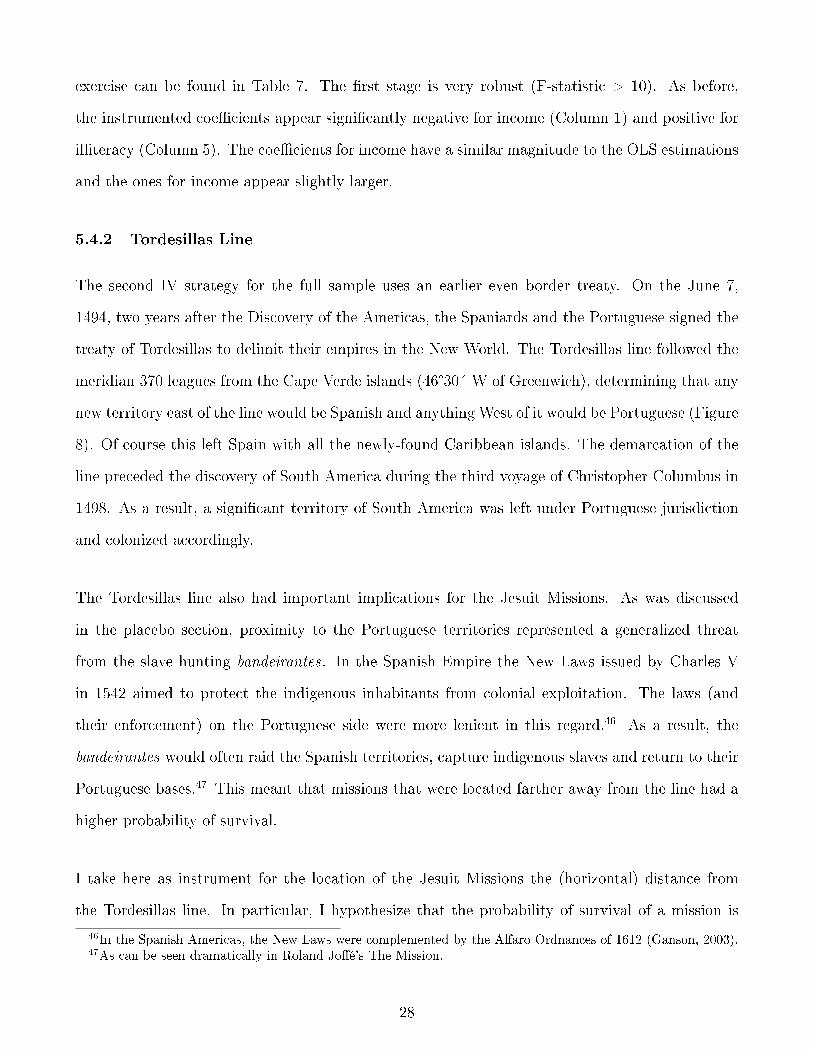
5.4.2 Tordesillas Line
The second IV strategy for the full sample uses an earlier even border treaty. On the June 7,
1494, two years after the Discovery of the Americas, the Spaniards and the Portuguese signed the
treaty of Tordesillas to delimit their empires in the New World. The Tordesillas line followed the
meridian 370 leagues from the Cape Verde islands (46°30´ W of Greenwich), determining that any
new territory east of the line would be Spanish and anything West of it would be Portuguese (Figure
8). Of course this left Spain with all the newly-found Caribbean islands. The demarcation of the
line preceded the discovery of South America during the third voyage of Christopher Columbus in
1498. As a result, a signi�cant territory of South America was left under Portuguese jurisdiction
and colonized accordingly.
The Tordesillas line also had important implications for the Jesuit Missions. As was discussed
in the placebo section, proximity to the Portuguese territories represented a generalized threat
from the slave hunting bandeirantes . In the Spanish Empire the New Laws issued by Charles V
in 1542 aimed to protect the indigenous inhabitants from colonial exploitation. The laws (and
their enforcement) on the Portuguese side were more lenient in this regard.46 As a result, the
bandeirantes would often raid the Spanish territories, capture indigenous slaves and return to their
Portuguese bases.47 This meant that missions that were located farther away from the line had a
higher probability of survival.
I take here as instrument for the location of the Jesuit Missions the (horizontal) distance from
the Tordesillas line. In particular, I hypothesize that the probability of survival of a mission is
46In the Spanish Americas, the New Laws were complemented by the Alfaro Ordnances of 1612 (Ganson, 2003).47As can be seen dramatically in Roland Jo�é's The Mission.
28

inversely proportional to the distance from the Tordesillas line. This is all conditional on being
to the left of the line, as can be seen in Figure 8, so I abstract from the actual consequences of
being on a particular side of it. I include country �xed e�ects, and control for geographic and
weather characteristics. The assumption is that distance to Tordesillas in�uenced the location of
the missions, but does not a�ect the outcomes of interest directly. As was seen in the placebo
section, I �nd no direct e�ect of the attacks in the long run.48 The results can be seen in Table 7.
Again the �rst stage is very strong. The instrumented coe�cient for missionary distance emerges
negative and signi�cant for income (Column 2) and positive and signi�cant for illiteracy (Column
6), as in the previous estimates.
By and large, the instrumental variable results con�rm the OLS results for income and education.
Taken together with the placebo results, they suggest a causal e�ect of the Jesuit Missions on
income and education. The results for distance to Asuncion are similar in magnitude while the
ones for Tordesillas speci�cations are larger than the OLS results. It does not seem that this
is caused by weak instruments or by the di�erence in samples. Beyond measurement error, this
might be due to di�erences between average and local treatment e�ects due to heterogeneous
e�ects (Imbens and Angrist, 1994 and Heckman, 1997). In the Appendix I extend the IV analysis
using proximity of Jesuit martyr sites as an alternative instrument.
Endogeneity issues aside, what speci�c transmission mechanisms can be behind the Jesuit e�ects
on income and education? To answer this question I now turn my attention to culture.
5.5 Cultural Mechanisms
In this section I focus on the particular cultural mechanisms that might be behind the persistent
income and human capital di�erences observed. I share the view that, �culture is an important
mechanism that helps explain why historical shocks can have persistent impacts.� (Nunn, 2012,
p. 108). Theoretically, historical and cultural factors can a�ect modern outcomes through path
48As before, I control for the direct distance to Sao Paulo. Results emerge essentially unchanged after thisintroduction.
29

dependence in models of multiple equilibria (Nunn, 2007 and Guiso et al. 2008).49 Models dealing
explicitly with cultural di�usion have been developed by Bisin & Verdier (2000), Doepke & Zilibotti
(2008), Mokyr (2010) and Alesina et al. (2013), among others.
De�ning culture is often problematic, so I focus here speci�cally on the persistence of occupational
structures and inter-generational knowledge transmission. Another common problem with cultural
explanations is that there is often a lack of reliable information on such variables. This problem is
partially overcome in this case with two specialized surveys: the Brazilian Cultural Module of the
2006 Municipal Survey and the Cultural Module of the 2011 Paraguayan Household Survey.50 My
setting is also unique as I can essentially shut down the genetic mechanism. Naturally, the Jesuits
did not intermarry and the period from the intervention to today is too short to entail signi�cant
genetic changes.51
5.5.1 Occupational Persistence
An important way to explore cultural transmission mechanisms is to examine the persistence and
transformation of occupational structures. In the spirit of Eckstein and Botticini's studies (2005,
2007 and 2012) the idea is that individuals that attended religious missions, receiving instruction
and technical training, moved away from agriculture to start a proto-artisan class. Three pieces of
empirical evidence point in this direction.
First, the Brazilian cultural survey asks speci�cally about the prevalence of handicraft activities.
Embroidery was one of the activities in which the Jesuit missionaries trained the natives. Father
Antonio Sepp (1655-1773) describes in his letters the role of the workshops and how he instructed
the natives to copy Dutch lace and embroidery (Amable, 1996, p. 58). In the state of Rio Grande
do Sul the most important handicraft is precisely embroidery, which results are presented in Table
49Though in his model Nunn focuses on the impact of slavery in Africa, his distinction between equilibria withproductive and unproductive activities due to colonial policies is still relevant in this context.
50Special thanks to Yolanda Barrios, Norma Medina and Zulma Sosa from the Paraguayan statistical o�ce forsharing these data.
51�Jesuits were never known to take Indian women as their concubines.� (Ganson, 2003, p. 78)
30
8.52 The empirical results are robust to the inclusion of geographic controls and larger at the local
level (Columns 1 and 2). Surprisingly, hundreds of years after the Jesuit expulsion, missionary
areas report more prevalence of this activity. More generally, in the missions, �Full-time craftsmen
included blacksmiths, carpenters, statuary artisans, gilders, silversmiths, tailors, hat makers, and
bronze fabricators such as bell makers� (Crocitti, 2002, p. 9). The long term e�ect of technical
training is consistent with Eckstein and Botticini (2005, 2007, and 2012), where early human
capital accumulation helped to consolidate a Jewish merchant and artisan class.53
I also examine the broader occupational structure of Paraguay. Because the data is now at the
individual level, I employ a probit speci�cation with state �xed e�ects and errors clustered at the
district level. In Table 8, it is evident that the areas closer to Jesuit Missions have moved away
from agriculture to manufacturing and commerce (Columns 3 to 5). This structural transformation
towards more productive activities is notable in an area that continues to be predominantly rural.
Again these results resemble Eckstein and Botticini (2005, 2007, and 2012), where the portable
skills transmitted to the natives might have helped to consolidate an artisan class.
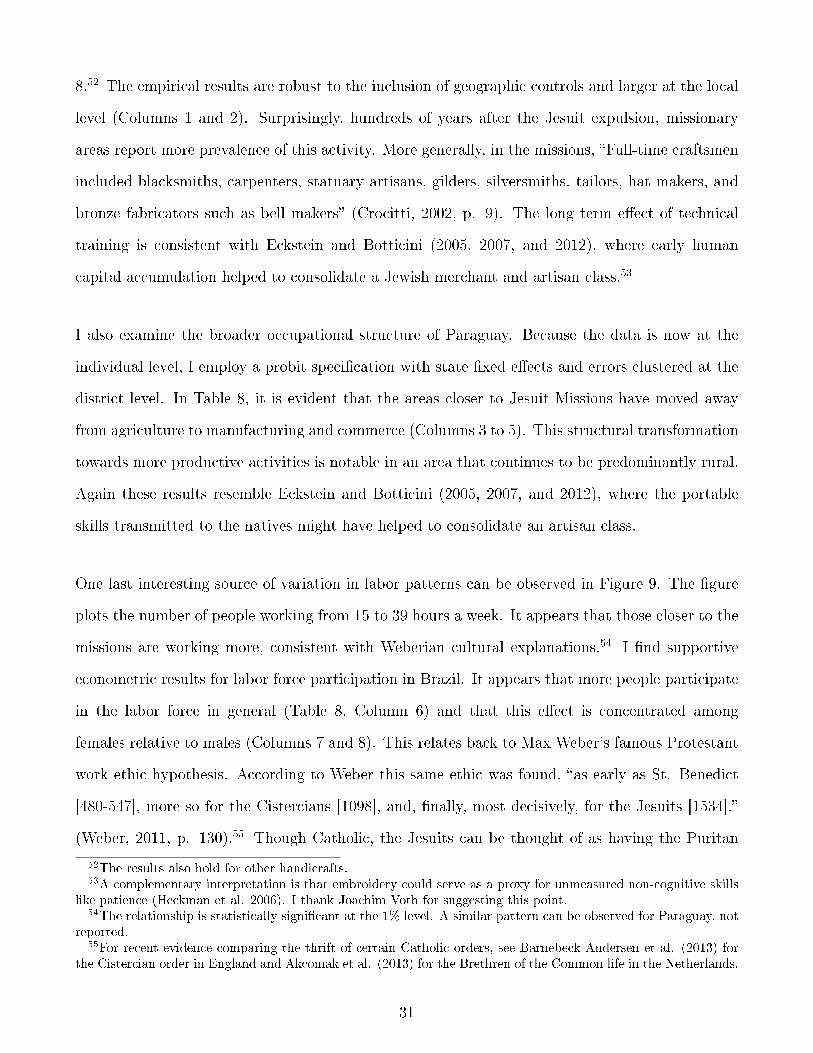
One last interesting source of variation in labor patterns can be observed in Figure 9. The �gure
plots the number of people working from 15 to 39 hours a week. It appears that those closer to the
missions are working more, consistent with Weberian cultural explanations.54 I �nd supportive
econometric results for labor force participation in Brazil. It appears that more people participate
in the labor force in general (Table 8, Column 6) and that this e�ect is concentrated among
females relative to males (Columns 7 and 8). This relates back to Max Weber's famous Protestant
work ethic hypothesis. According to Weber this same ethic was found, �as early as St. Benedict
[480-547], more so for the Cistercians [1098], and, �nally, most decisively, for the Jesuits [1534].�
(Weber, 2011, p. 130).55 Though Catholic, the Jesuits can be thought of as having the Puritan
52The results also hold for other handicrafts.53A complementary interpretation is that embroidery could serve as a proxy for unmeasured non-cognitive skills
like patience (Heckman et al. 2006). I thank Joachim Voth for suggesting this point.54The relationship is statistically signi�cant at the 1% level. A similar pattern can be observed for Paraguay, not
reported.55For recent evidence comparing the thrift of certain Catholic orders, see Barnebeck Andersen et al. (2013) for
the Cistercian order in England and Akcomak et al. (2013) for the Brethren of the Common life in the Netherlands.
31
work ethic Weber underscored. In fact, he noted �The gradual rationalization of asceticism into
an exclusively disciplinary method reached its apex in the Jesuit order.� (Weber, 1978, p. 1172).56
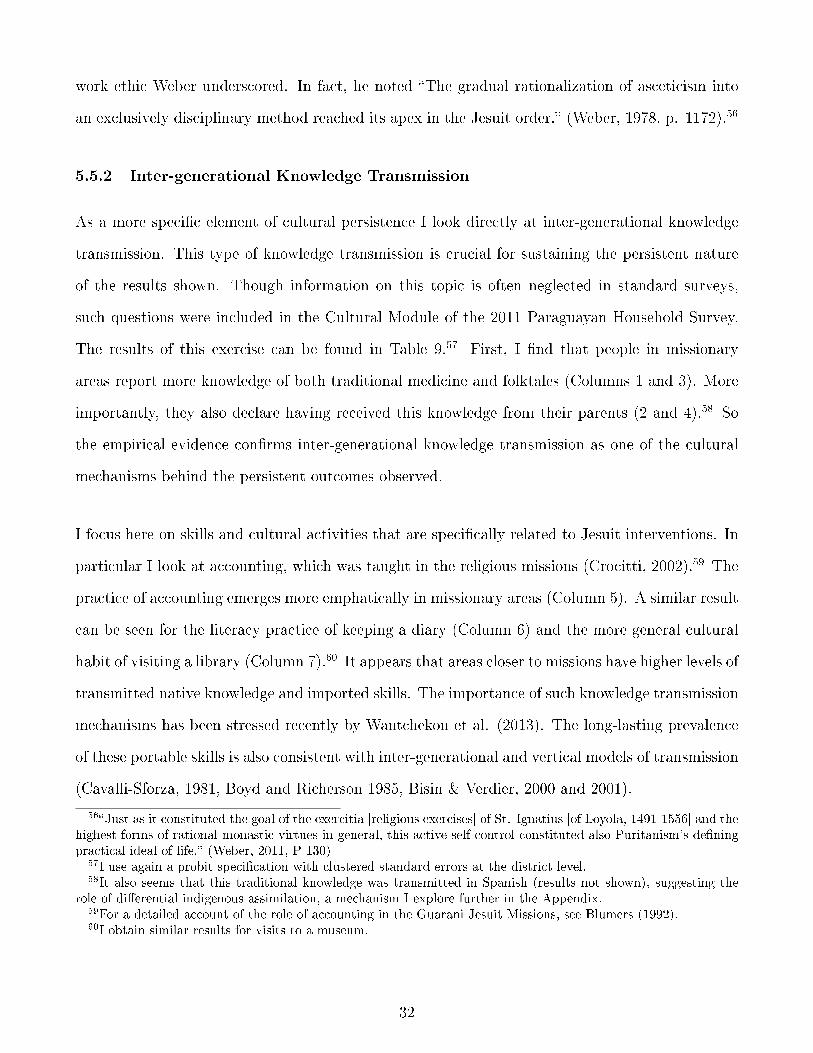
5.5.2 Inter-generational Knowledge Transmission
As a more speci�c element of cultural persistence I look directly at inter-generational knowledge
transmission. This type of knowledge transmission is crucial for sustaining the persistent nature
of the results shown. Though information on this topic is often neglected in standard surveys,
such questions were included in the Cultural Module of the 2011 Paraguayan Household Survey.
The results of this exercise can be found in Table 9.57 First, I �nd that people in missionary
areas report more knowledge of both traditional medicine and folktales (Columns 1 and 3). More
importantly, they also declare having received this knowledge from their parents (2 and 4).58 So
the empirical evidence con�rms inter-generational knowledge transmission as one of the cultural
mechanisms behind the persistent outcomes observed.
I focus here on skills and cultural activities that are speci�cally related to Jesuit interventions. In
particular I look at accounting, which was taught in the religious missions (Crocitti, 2002).59 The
practice of accounting emerges more emphatically in missionary areas (Column 5). A similar result
can be seen for the literacy practice of keeping a diary (Column 6) and the more general cultural
habit of visiting a library (Column 7).60 It appears that areas closer to missions have higher levels of
transmitted native knowledge and imported skills. The importance of such knowledge transmission
mechanisms has been stressed recently by Wantchekon et al. (2013). The long-lasting prevalence
of these portable skills is also consistent with inter-generational and vertical models of transmission
(Cavalli-Sforza, 1981, Boyd and Richerson 1985, Bisin & Verdier, 2000 and 2001).
56�Just as it constituted the goal of the exercitia [religious exercises] of St. Ignatius [of Loyola, 1491-1556] and thehighest forms of rational monastic virtues in general, this active self-control constituted also Puritanism's de�ningpractical ideal of life.� (Weber, 2011, P 130)
57I use again a probit speci�cation with clustered standard errors at the district level.58It also seems that this traditional knowledge was transmitted in Spanish (results not shown), suggesting the
role of di�erential indigenous assimilation, a mechanism I explore further in the Appendix.59For a detailed account of the role of accounting in the Guarani Jesuit Missions, see Blumers (1992).60I obtain similar results for visits to a museum.
32
Overall, the results in this section point towards cultural mechanisms that might be driving the
persistent di�erences in income and human capital. I see the results on occupational persistence
and inter-generational knowledge transmission as cultural markers that can help to further identify
the missionary treatment. I do not argue that embroidery is driving modern growth in these
areas, but instead take the view that this particular skill is part of the broader technological
package transferred to the indigenous people by the Jesuits. The technological transfer is even more
remarkable considering that there were only one to two Jesuit fathers per mission. Ultimately, the
persistence of these cultural traits is instrumental to understanding how income, and especially
human capital, might have taken divergent paths for hundreds of years.61
5.6 Robustness Checks
In this section, I present complementary evidence for the Jesuit e�ect on modern income and
human capital as the main channel of transmission. I do so by exploring alternative channels and
analyzing heterogeneous e�ects. In particular, I rule out possible confounders such as population
density, migration, health and tourism.
5.6.1 A. Population Density
Perhaps one of the most obvious alternative channels of transmission of the missionary e�ect is
population density. The religious entities might just have initiated future urban agglomerations,
as in Becker at al. (2010). The results of this exercise can be found in Table 10. I �nd, if anything,
that the places close to the Jesuit Missions are less dense today. The coe�cient is positive and
signi�cant for the full sample (Column 1) and insigni�cant for the more localized sample (Column
2). These results do not come as a surprise when collated with the historical record since Jesuit
missionaries went to peripheral areas isolated from existing population centers. Even though the
Jesuit Missions thrived historically, by no means did these places become modern metropolises. I
also explore the possible prior role of pre-colonial population density in Column 3.62 Data come
61I plan to take a more in-depth look at these questions using individual level data in future work.62I thank Nicola Gennaioli for suggesting this point.
33

from Maloney and Valencia (2012) and are only available at the state level. I do not �nd that
the states where Guarani Jesuit missions were located are denser relative to their Argentinean,
Brazilian and Paraguayan counterparts. The results suggest that the Jesuits a�ected the people
they treated more than the places they visited.
5.6.2 Migration
Although the issue of migration has been addressed before in the paper, this section focuses specif-
ically on this possible confounder. Recall that migration informed the empirical strategy and, in
particular, the usage of the more continuous nearest distance as opposed to dummy variables. His-
torically, missions grew through natural reproduction rather than immigration (Sarreal, 2014). In
the intermediate historical results it also appeared that the human capital e�ect was concentrated
among Argentinians and Brazilians as opposed to foreigners, but does this �nding hold also for
modern times?
To answer this question, I divide the Brazilian sample into municipalities with high and low mo-
bility, namely, where people declare that they are residents or not of that municipality. Table 10
presents the results for these sub-samples. It appears that the human capital results are concen-
trated among residents (Column 4). The results for non-residents are insigni�cant and smaller in
magnitude (Column 5). It does not appear that people are sorting themselves into the missionary
locations in modern times. If anything, there might have been historical outmigration from the
area, so that the results I �nd are underestimates.
5.6.3 Health
As hinted in the Franciscan comparison section, I study here health as a human capital investment
complementary to education. The data availability is restricted to Brazilian municipalities. I
use standard indicators such as mortality under 5 years of age and infant mortality, as well as a
multidimensional health index.63 The results for these variables can be found in Columns 6 to 8
63The IFDM (Indice FIRJAN de Desenvolvimento Municipal) is the Brazilian counterpart of the UN HealthDevelopment Index (HDI). The health index includes items such as the number of prenatal visits and deaths due
34
of Table 10. I �nd positive and signi�cant coe�cients for the mortality measures, indicating worse
indicators the farther away from the missionary areas. Similarly, I �nd negative and signi�cant
coe�cients for the health index suggesting better health outcomes in these areas. Moving 100
kilometers away from a mission is enough to go from a high to a fair level of health development,
a sizable downgrade.
5.6.4 Tourism
Another possible confounder of the Jesuit missionary results can be tourism. These areas might
simply receive more visitors and this could explain their relative prosperity. To test for this
confounder, I use data from the Cultural Module of the Brazilian Municipal Survey (2006). The
survey asks about the prevalence of tourism-related activities in the area. The results can be found
in Column 9. I �nd no e�ect on tourism when using distance to the nearest Jesuit mission. The
coe�cient is slightly positive (opposite sign), but insigni�cant. The results are not surprising given
the relative isolation and inaccessibility of some of the places studied.
Taken together, the results in this section point towards the robustness of the missionary e�ect.
They give additional evidence for education as the main channel of transmission for di�erent
sub-samples. The results also help to rule out the role of possible confounders.
6 Conclusion
Going back to Voltaire and the controversy over the Guarani Jesuit Missions, though it is hard
to measure mildness, I do �nd signi�cant long-lasting e�ects of these missions on income and
education. Places that are closer to missionary districts have incomes that are 10% higher today.
The e�ects are larger at the local level and robust to the inclusion of geographic controls. I
postulate human capital as the main channel of transmission, �nding a positive and signi�cant
e�ect of around 15% on median years of schooling and literacy. I �nd even larger magnitudes for
intermediate historical time periods. After conducting a placebo test, a relevant comparison and
to ill-de�ned and avoidable causes.
35

an instrumental variables strategy, the e�ects appear to be causal. The impact appears speci�c to
missions from the Jesuit �as opposed to the Franciscan� order which focused on human capital
and technical training. Moreover, the enduring educational di�erences are consistent with speci�c
cultural mechanisms of occupational persistence and inter-generational knowledge transmission.
Are the observed e�ects large? I interpret the di�erences of around 10% as substantial, but plau-
sible. My results are consistent with those found by Nunn (forthcoming) for nineteenth Century
Christian missions in Africa. In a sense, it is remarkable that the e�ects are still there centuries
after the Jesuit expulsion. To analyze the economic importance of my results, I run a speci�cation
of income on literacy, instrumented by distance to the nearest Jesuit Mission. Though the poten-
tial endogeneity of missionary location has already been discussed at length, I view this simply as
a benchmarking exercise. I �nd estimates in the order of 8%, which are consistent with micro evi-
dence in general and the particular estimates for Argentina, Brazil and Paraguay (Psacharopoulos
and Patrinos, 2004).
More broadly, the case of the Guarani Jesuit Missions serves as a microcosm to study important
economic questions. I �nd not only an important degree of economic persistence, in line with
the recent literature, but also speci�c channels through which this persistence is enacted. In
particular, I show how human capital di�erences can emerge in the long term and which speci�c
cultural mechanisms can sustain these di�erences. The evidence in this regard suggests the relative
importance of vertical as opposed to horizontal or oblique models of cultural transmission. Future
research could further examine the behavior of individuals in situ and in particular how their
preferences were shaped by the missionary intervention. As part of my research agenda, I plan
to study these questions in depth conducting a household survey in the area. Another option to
extend the analysis would be to focus on the behavior of �rms.
Overall, the �ndings in this paper suggest the importance of particular historical events and speci�c
institutions for long-term development and growth (Nunn, 2009 and 2013). I believe that �natural
experiments of history� � in the phrase of Diamond and Robinson (2011) � can be instrumental
36

in answering policy-relevant questions for which few counterfactuals exist today. This type of
research can help us uncover deep rooted factors of development. Far from advocating historical
determinism, a thorough understanding of these historical forces and their implied constraints
o�ers a possibility of making development policies more targeted and e�ective.
37

References
Acemoglu, D., Gallego, F.A., & Robinson, J.A. (2014). Institutions, Human Capital and Devel-opment. No. 19933. National Bureau of Economic Research.
Acemoglu, D., Johnson, S., & Robinson, J.A. (2002). Reversal of fortune: Geography and insti-tutions in the making of the modern world income distribution. Quarterly Journal of Economics.1231-1294.
Acemoglu, D., Johnson, S., & Robinson, J.A. (2001). The Colonial Origins of ComparativeDevelopment: An Empirical Investigation. American Economic Review, 91.5, 1369-1401.
Acemoglu, D., Robinson, J.A., & Woren, D. (2012). Why Nations Fail: The Origins of Power,Prosperity, and Poverty. Vol. 4. New York: Crown Business.
Akcomak, S., Webbink, D. & ter Weel, B. (2013). Why Did the Netherlands Develop so Early?The Legacy of the Brethren of the Common Life. CPB Discussion Paper, 228.
Alden, D. (1996). The Making of an Enterprise: the Society of Jesus in Portugal, its Empire,and Beyond, 1540-1750. Stanford University Press.
Alesina, A., Paola Giuliano, P., & Nunn, N. (2013). On the Origins of Gender Roles: Womenand the Plough. The Quarterly Journal of Economics, 128.2, 469-530.
Altonji, J., Elder, T., & Taber, C. (2005). Selection on Observed and Unobserved Variables:Assessing the E�ectiveness of Catholic Schools. Journal of Political Economy, 113(1), 151-184.
Amable, M.A., (1996). Historia Misionera: una perspectiva integradora. Ediciones Montoya.
Angrist, J.D., & Pischke, J-S. (2008). Mostly Harmless Econometrics: An Empiricist's Com-panion. Princeton University Press.
Ashraf, Q., & Galor, O. (2011). Dynamics and Stagnation in the Malthusian Epoch. TheAmerican Economic Review, 2003-2041.
Ashraf, Q., & Galor, O. (2013). The `Out-of-Africa' Hypothesis, Human Genetic Diversity, andComparative Economic Development. American Economic Review, 103 (1): 1�46.
Astrain, A. (1996) Jesuitas, Guaraníes y encomenderos. Ed. Bartomeu Melià. Centro deEstudios paraguayos, Antonio Guasch.
Bai, Y., and Kai-sing Kung, J. (2011) Di�using Knowledge while Spreading God's Message:Protestantism and Economic Prosperity in China, 1840�1920. Hong Kong University of Scienceand Technology. Unpublished paper.
Banerjee, A., and Iyer, L. (2005) History, Institutions, and Economic Performance: The Legacyof Colonial Land Tenure Systems in India. American Economic Review, 1190-1213.
Barnebeck A, Thomas , Bentzen, Jeanet , Dalgaard , Carl-Johan & Sharp, P. (2013) Pre-reformation roots of the protestant ethic. University of Warwick. Working Paper.
Barro, R.J., (2001). Human capital and growth. American Economic Review, 12-17.
Bates R., Nunn N., Robinson J.A., African Development in Historical Perspective. Cambridge:Cambridge University Press.
38

Becker, S.O. & Ludger, W. (2009). Was Weber Wrong? A Human Capital Theory of ProtestantEconomic History. The Quarterly Journal of Economics. 124 (2): 531-596.
Becker, S.O., and Woessmann, L. (2008). Luther and the Girls: Religious Denomination and theFemale Education Gap in Nineteenth-century Prussia*. The Scandinavian Journal of Economics,110.4, 777-805.
Becker, S.O., Cinnirella, F., & Woessmann, L. (2010). The trade-o� between fertility andeducation: evidence from before the demographic transition. Journal of Economic Growth, 15.3,177-204.
Bellows, J. & Miguel, E. (2009). War and local collective action in Sierra Leone. Journal ofPublic Economics, Volume 93, Issues 11�12, December, Pages 1144-1157.
Benhabib, J., & Spiegel, M.M. (1994). The role of human capital in economic developmentevidence from aggregate cross-country data. Journal of Monetary Economics 34.2, 143-173.
Bethell, L., ed. (1994). The Cambridge History of Latin America. Vol. 2. Cambridge: Cam-bridge University Press.
Bisin, A. & Verdier, T. (2001). The economics of cultural transmission and the dynamics ofpreferences. Journal of Economic Theory. Vol. 97, no. 2, pp. 298-319.
Bisin, A., & Verdier, T. (2000). Beyond The Melting Pot: Cultural Transmission, Marriage,And The Evolution Of Ethnic And Religious Traits. Quarterly Journal of Economics, 955-988.
Bleakley, H., & Lin, J. (2012). Portage and path dependence. The Quarterly Journal of Eco-nomics, 127.2, 587.
Blumers, T. (1992). La contabilidad en las reducciones Guaraníes. Asunción: Centro de EstudiosAntropológicos, Universidad Católica.
Bolton, H.E., (1917). The mission as a frontier institution in the Spanish-American colonies.The American Historical Review, 23.1,42-61.
Botticini, M. & Eckstein, Z. (2007). From Farmers to Merchants, Conversions and Diaspora:Human Capital and Jewish History. Journal of the European Economic Association. Vol. 5(5),pages 885-926.
Botticini, M. & Eckstein, Z. (2005). Jewish Occupational Selection: Education, Restrictions, orMinorities? The Journal of Economic History (2005) Vol. 65(04), pages 922-948, 2005.
Botticini, M. & Eckstein, Z.. (2012). The Chosen Few: How Education Shaped Jewish History,70-1492. Princeton University Press.
Boyd, R. & Richerson, P.J. (1985) Culture and the Evolutionary Process. University of ChicagoPress, 1985.
Cagé, J., & Rueda, V. (2013). The Long Term E�ects of the Printing Press in Sub SaharanAfrica.
Carbonell de Massy, R. (1992). Estrategias de desarrollo rural en los pueblos Guaraníes.Barcelona: Antoni Bosch.
Cavalli-Sforza, L. & Feldman, M. (1981). Cultural Transmission and Evolution: A QuantitativeApproach. Princeton, NJ: Princeton University Press.
Chanda, A., C. Cook, J. & Putterman, L. (2014). Persistence of Fortune: Accounting forPopulation Movements, There Was No Post-Columbian Reversal. American Economic Journal:Macroeconomics, 6(3): 1-28.
Chen, Y., Wang, H. & Yan, S. (2013). The Long-Term E�ects of Christian Activities in China.
39
Comin, D., Easterly, W. & Gong, E. (2010). Was the Wealth of Nations Determined in 1000BC?. American Economic Journal: Macroeconomics, 65-97.
Crocitti, J.J. (2002). The internal economic organization of the Jesuit missions among theGuarani. International Social Science Review, 77 (1&2): 3�15.
Cymbalista, R. (forthcoming). Seeds of Christ. University of Sao Paulo.
de Carvalho Filho, I., & Colistete, R.P. (2010). Education performance: was it all determined100 years ago? Evidence from São Paulo, Brazil.
de Carvalho Filho, I., & Monasterio, L., (2011). Immigration and the Origins of RegionalInequality: Government-sponsored European Migration to Southern Brazil before World War I,Regional Science and Urban Economics
Dell M. (2012). Path Dependence in Development: Evidence from the Mexican Revolution.
Dell, M.. (2010). The Persistent E�ects of Peru's Mining Mita. Econometrica, 78: 1863�1903.
Diamond, J., & Robinson, J.A., eds. (2010). Natural Experiments of History. Harvard Univer-sity Press.
Diamond, J.. (1997) Guns, germs, and steel: the fates of human societies. New York: WWNorton & Company: 14.
Diaz-Cayeros, A., & Saumitra J. (2012). Global Trade, Contracts and Poverty Alleviation inIndigenous Communities: Cochineal in Mexico.
Dittmar, J.E. (2011). Information technology and economic change: the impact of the printingpress. The Quarterly Journal of Economics, 126.3, 1133-1172.
Doepke, M., & Zilibotti, F. (2008). Occupational Choice and the Spirit of Capitalism. QuarterlyJournal of Economics 123.2.
Droller, F. (2012). Migration and Long-run Economic Development: Evidence from Settlementsin the Pampas.
Durán Estragó, M. (1987). Presencia franciscana en el Paraguay. Vol. 19. Universidad Católica.
Easterly, W., & Levine, R. (2012). The European Origins of Economic Development. No.w18162. National Bureau of Economic Research.
Engelbretch, G. & Ortiz, L. (1983). Guarani Literacy in Paraguay. International Journal of theSociology of Language. 42, 53-67.
Engerman, S.L., & Sokolo�, K.L. (1997) Factor endowments, institutions, and di�erential pathsof growth among new world economies. How Latin America Fell Behind, 260-304.
Feyrer, J., & Sacerdote, B. (2009). Colonialism and modern income: islands as natural experi-ments. The Review of Economics and Statistics 91.2, 245-262.
Frankema, E.HP. (2012). The origins of formal education in sub-Saharan Africa: was Britishrule more benign?. European Review of Economic History.
Furlong, C.G, & Muriel, D. (1995) Domingo Muriel, A. J., Y Su Relación De Las Misiones(1766). Buenos Aires: Librería del Plata.
Furlong, G., & Storni, F. (1994). Los jesuitas y la cultura rioplatense. Buenos Aires: Biblos.
Gallego, F.A. (2010). Historical origins of schooling: The role of democracy and political decen-tralization. The Review of Economics and Statistics, 92.2, 228-243.
Gallego, F.A., & Woodberry, R. (2010) Christian missionaries and education in former Africancolonies: How competition mattered. Journal of African Economies.
40

Gallup, J.L., Sachs, J.D., & Mellinger, A.D. (1999). Geography and economic development.International Regional Science Review 22.2, 179-232.
Galor, O. (2011). Uni�ed Growth Theory. Princeton University Press.
Galor, O., & Weil, D.N. (2000). Population, technology, and growth: From Malthusian stagna-tion to the demographic transition and beyond. American Economic Review, 806-828.
Ganson, B.A. (2005). The Guaraní under Spanish rule in the Río de la Plata. Stanford UniversityPress.
Gálvez, L. (1995). Guaraníes y Jesuitas: De la tierra sin mal al paraíso. Buenos Aires: Su-damericana.
Gennaioli, N., et al. (2013). Human Capital and Regional Development. The Quarterly Journalof Economics, 105, 164.
Gennaioli, N., & Rainer, I. (2007). The modern impact of precolonial centralization in Africa.Journal of Economic Growth, 12.3, 185-234.
Glaeser, E. L., La Porta, R., Lopez-de-Silanes, F., & Shleifer, A. (2004). Do institutions causegrowth?. Journal of Economic Growth, 9(3), 271-303.
Greif, A. (1993) Contract enforceability and economic institutions in early trade: The Maghribitraders' coalition. The American Economic Review, 525-548.
Greif, A. (1994). Cultural beliefs and the organization of society: A historical and theoreticalre�ection on collectivist and individualist societies. Journal of Political Economy, 912-950.
Greenstone, M., Hornbeck, R. & Moretti, E. (2010) Identifying agglomeration spillovers: Evi-dence from winners and losers of large plant openings. Journal of Political Economy, 118.3,536-598.
Grosjean, P. (2010). A History of Violence: The `Culture of Honor' as a Determinant of Homicidein the US South.
Guiso, L., Sapienza, P., & Zingales, L. (2008). Long term persistence. No. w14278. NationalBureau of Economic Research.
Hanushek, E.A., & Woessmann, L. (2008). The role of cognitive skills in economic development.Journal of Economic Literature, 607-668.
Hanushek, E.A., & Woessmann, L. (2012). Schooling, educational achievement, and the LatinAmerican growth puzzle. Journal of Development Economics 99.2, 497-512.
Heckman, J.J. (2000). Policies to foster human capital. Research in Economics, 54.1,3-56.
Heckman, J.J., Stixrud, J., & Urzua, S. (2006), The E�ects of Cognitive and NoncognitiveAbilities on Labour Market Outcomes and Social Behavior. Journal of Labor Economics, 24.3,411-482.
Heckman, J. (1997). Instrumental variables: A study of implicit behavioral assumptions usedin making program evaluations. Journal of Human Resources, 441-462.
Hernández, P.J. (1913). Misiones Del Paraguay: Organización Social De Las Doctrinas GuaraníesDe La Compañía De Jesús, Obra Escrita Por El P. Pablo Hernández, Religioso De La Misma Com-pañía. Barcelona: G. Gili.
Hornung, E. (2014). Immigration and the di�usion of technology: The Huguenot diaspora inPrussia. The American Economic Review, 104.1, 84-122.
Huillery, E. (2009). History matters: The long-term impact of colonial public investments inFrench West Africa. American Economic Journal: Applied Economics, 176-215.
41

Iannaccone, L.R. (1990). Religious practice: A human capital approach. Journal for the Scien-ti�c Study of Religion, 297-314.
Imbens, G.W., & Angrist, J.D. (1994). Identi�cation and estimation of local average treatmente�ects. Econometrica: Journal of the Econometric Society, 467-475.
Jackson, R.H. (2008). The population and vital rates of the Jesuit missions of Paraguay,1700�1767. Journal of Interdisciplinary History 38.3, 401-431.
Jedwab, R., Kerby, E. & Moradi, A. (2014). History, Path Dependence and Development:Evidence from Colonial Railroads, Settlers and Cities in Kenya. No. 2014-02.
Jha, S. (2013). Trade, Institutions, and Ethnic Tolerance: Evidence from South Asia. AmericanPolitical Science Review 107.04, 806-832.
La Porta, R., Lopez-de-Silanes, F., Shleifer, A., & Vishny, R. W. (1998). Law and Finance. TheJournal of Political Economy, 106(6), 1113-1155.
Landes, D.S. (1998). The Wealth and Poverty of Nations: Why Some Countries are so Rich andSome so Poor. WW Noton.
Lankina, T., & Getachew, L. (2012). Mission or Empire, Word or Sword? The Human CapitalLegacy in Postcolonial Democratic Development. American Journal of Political Science 56.2, 465-483.
Livi-Bacci, M., & Maeder, E.J. (2004) The Missions of Paraguay: the demography of an Exper-iment. Journal of Interdisciplinary History, 35.2, 185-224.
Maeder, E.J.A. (1995). Asimetría demográ�ca ente las reducciones franciscanas y jesuíticas deguaraníes. Revista Complutense de Historia de América. Num. 21, 71-83.
Maloney, W. F. & Valencia, F. (2012). The Persistence of (Subnational) Fortune: Geography,Agglomeration, and Institutions in the New World. Mimeo, World Bank.
Maloney, W.F., & Valencia Caicedo, F. (2014). Engineers, Innovative Capacity and Developmentin the Americas. Mimeo, World Bank.
Mankiw, N.G., Romer, D. & Weil, D.N. (1992). A contribution to the empirics of economicgrowth. No. w3541. National Bureau of Economic Research.
Mantovanelli, F. (2013). The Protestant Legacy: Missions and Literacy in India. Available atSSRN 2413170.
McCleary, R.M., & Barro, R. (2003). Religion and Economic Growth Across Countries. Amer-ican Sociological Review
McCleary, R.M., & Barro, R.J. (2006). Religion and Economy. Journal of Economic Perspec-tives, 20(2): 49-72.
McCleary, R.M., & de Jesús Pesina, J. (2011). Religious Competition, Protestant Syncretization,and Conversion in Guatemala since the 1880s.
Meier zu Selhausen, F. (2014). Missionaries and female empowerment in colonial Uganda: Newevidence from Protestant marriage registers, 1880�1945. Economic History of Developing Regions,1-39.
Michaels, G. (2008). The e�ect of trade on the demand for skill: Evidence from the interstatehighway system. The Review of Economics and Statistics, 90.4, 683-701.
Michalopoulos, S., & Papaioannou, E. (2013). Pre-Colonial Ethnic Institutions and Contempo-rary African Development. Econometrica, 81.1, 113-152.
Mokyr, J. (2010). Entrepreneurship and the industrial revolution in Britain. The Invention ofEnterprise: Entrepreneurship from Ancient Mesopotamia to Modern Times, 183-210.
42

Musacchio, A., Martinez, A. & Viarengo, M. (2014). Colonial Institutions, Commodity Booms,and the Di�usion of Elementary Education in Brazil, 1889-1930. No. w20029. National Bureau ofEconomic Research.
Naritomi, J., Soares, R.R. & Assunção, J.J. (2012). Institutional development and colonialheritage within Brazil. The Journal of Economic History, 72.02, 393-422.
Nunn, N. (2007). Historical legacies: A model linking Africa's past to its current underdevelop-ment. Journal of Development Economics, 83.1, 157-175.
Nunn, N. (2008).. The Long-Term E�ects of Africa's Slave Trades. The Quarterly Journal ofEconomics 123.1, 139-176.
Nunn, N. (2009). The Importance of History for Economic Development. Annual Review ofEconomics. Vol. 1(1), pages 65-92.
Nunn, N. (2010). Religious Conversion in Colonial Africa. American Economic Review, Papers& Proceedings. 100.2, 147-52.
Nunn, N. (2012). Culture and the historical process. Economic History of Developing Regions27.sup1, S108-S126.
Nunn, N. (2013) Historical Development. In: Aghion P., Durlauf S. Handbook of EconomicGrowth. Vol. 2. North-Holland.
Nunn N. (forthcoming). Gender and Missionary In�uence in Colonial Africa. In: AkyeampongE.,
Nunn, N., & Puga, D. (2012). Ruggedness: The blessing of bad geography in Africa. Review ofEconomics and Statistics, 94.1, 20-36.
Nunn, N., & Wantchekon, L. (2011). The Slave Trade and the Origins of Mistrust in Africa.American Economic Review, 101(7): 3221-52.
Okoye, D. (2014).Things Fall Apart: Missions, Institutions, and Trust.
Oster, E. (2013) Unobservable Selection and Coe�cient Stability: Theory and Validation. No.w19054. National Bureau of Economic Research.
Palacios, S. & Zo�oli. E. (1991). Gloria y Tragedia de las Misiones Guaraníes. EdicionesMensajero. Bilbao.
Popescu, O. (1967) El sistema económico en las misiones jesuíticas: un vasto experimento dedesarrollo indoamericano. Ariel.
Psacharopoulos, G., & Patrinos*, H.A. (2004). Returns to investment in education: a furtherupdate. Education Cconomics 12.2, 111-134.
Putnam, R.D., Leonardi, R. & Nanetti, R.Y. (1994). Making Democracy Work: Civic Traditionsin Modern Italy. Princeton University Press.
Putterman, L., & Weil, D.N. (2010). Post-1500 Population Flows and the Long Run Determi-nants of Economic Growth and Inequality. The Quarterly Journal of Economics 125.4, 1627.
Rappaport, J., & Sachs, J.D. (2003). The United States as a coastal nation. Journal of EconomicGrowth 8.1, 5-46.
Rocha, R., Ferraz, C. & Soares, R.R. (2013). Human Capital and Development: The Legacy ofEuropean Settlements in Brazil.
Saguier, R.B., ed. (1991). Tentación de la utopía: las misiones jesuíticas del Paraguay. Tusquets.
Salinas, M.L. �(2010). ida y trabajo en la misión, jesuitas y franciscanos en las misiones delParaguay en perspectiva comparada: Siglo XVII. In: Fronteiras e Indentidades. XIII JornadasInternacionales sobre Misssoes Jesuíticas.
43

Sarreal, J. (2014). The Guaraní and Their Missions: A Socioeconomic History. Stanford Uni-versity Press.
Spolaore, E., & Wacziarg, R. (2013). How Deep Are the Roots of Economic Development?.Journal of Economic Literature 51.2, 325-69.
Spolaore, E., & Wacziarg, R. (2009). The Di�usion of Development. Quarterly Journal ofEconomics 124.2.
Squicciarini, M.P., & Voigtländer, N.. Human Capital and Industrialization: Theory and Evi-dence from 18th Century Encyclopédie Subscriptions.
Summerhill, W. (2010).Colonial institutions, slavery, inequality, and development: evidence fromSao Paulo, Brazil.
Tabellini, G. (2008). Presidential address institutions and culture. Journal of the EuropeanEconomic Association 6.2-3, 255-294.
Voigtländer, N., & Voth, H-J. (2012). Persecution Perpetuated: The Medieval Origins of anti-Semitic Violence in Nazi Germany*. The Quarterly Journal of Economics 127.3, 1339-1392.
Voltaire, (1756) Essay on the Customs and the Spirit of the Nations. Paris.
Waldinger, F. (2012). Bombs, Brains, and Science: The Role of Human and Physical Capitalfor the Creation of Scienti�c Knowledge. CAGE Online Working Paper Series 78.
Waldinger, M. (2013) Colonial Missionaries and Long Run Development in Mexico.� LSEManuscript.
Wantchekon, L., Natalija N., & Kla²nja, M. (2013). Education and Human Capital Externalities:Evidence from Colonial Benin. Unpublished manuscript.
Weber, M. (1978). Economy and Society. University of California Press. Berkeley.
Weber, M. (2011) The Protestant Ethic and the Spirit of Capitalism. Oxford: Oxford UniversityPress.
Wietzke, F-B. (2014). Universal primary education, private schooling and interreligious inequal-ity: The case of Madagascar.
Wilde, G. (2009). de la obra: Religión y poder en las misiones de guaraníes.
Woodberry, R.D. (2012). The missionary roots of liberal democracy. American Political ScienceReview 106.02, 244-274.
Woodberry, R.D. (2004). The shadow of empire: Christian missions, colonial policy, and democ-racy in postcolonial societies. Diss. University of North Carolina at Chapel Hill.
World Bank (2008). World Development Report. Reshaping Economic Geography. Washington,DC.
44

I. Data Appendix
In this section I provide more detailed information about the variables (units and souces) used in
the paper.
A. Income and Poverty
Income: Data for Brazil comes from the Instituto Brasileiro de Geogra�a e Estatística (IBGE) and
can be accessed through IPEA.64 The data measures total annual income in 2000 in contemporary
Brazilian R$. As is standard, I take the natural logarithm of this number.65 Comparable data
for Paraguay are available from the World Bank (2008) World Development Report on Reshaping
Economic Geography. The data are for mean per capita income in 2005 US dollars; for details
please see Maloney and Valencia (2012).
Poverty: Since income data are not available at the municipality level for Argentina, I instead
use comparable poverty data on the Unsatis�ed Basic Needs (UBN) index measured for both
households and individuals. The data for Argentina are from the Instituto Nacional de Estadística
y Censos (INDEC)for 2001.66 Similar data for Paraguay comes from the Dirección General de
Estadística, Encuestas y Censos (DGEEC) and is for 2002.67
B. Education
Literacy: Literacy (and illiteracy) rates are measured in percentages of the relevant population.
Data for Brazil are also from the IBGE is for people aged 15 or 25 and above in 2000. Data for
64http://www.ibge.gov.br/home/ and http://www.ipeadata.gov.br/65Highly correlated data for municipal level GDP are also available and used for robustness only, as they tend to
be less reliable than income measures at this level of disaggregation.66http://www.indec.mecon.ar/67http://www.dgeec.gov.py/
45

Paraguay come from DGEEC and are for people aged ten years and above in 2002. Literacy data
for Argentina are again from INDEC for people aged ten years and above in 2001.
Median Years of Schooling: Brazil's IBGE reports data on median years of schooling for people
25 aged years and above in 2000. No comparable information is reported for either Argentina or
Paraguay.
C. Missions
Missionary Dummy: is the simplest measure and takes the value of 1 for the municipality that
had a mission historically and 0 otherwise. This coarse measure assumes that the boundaries of
the missions were strict and is mostly used for descriptive purposes.
Missionary Distance: This more continuous variable denotes the closest distance between a mu-
nicipality's centroid and a historical mission. It is measured in kilometers and calculated using
STATA and ArcGIS. This measure is more informative and �exible with respect to missionary
boundaries. A similar measure is used to study the e�ect of Franciscan Missions.
Missionary Population: For most of the thirty Jesuit Missions I was able to obtain historic infor-
mation on the indigenous population from the Archivo General de Indias and the Roman Jesuit
Archive (Vatican). Though incomplete, the records cover the period from 1650 to 1790, giving
a rough picture of the contemporary conditions of the religious establishments (see Figure A.1).
This measure can also be used to capture intensity of treatment e�ects. Comparable information
is also available for some Franciscan missions.
Year of Foundation: Similarly, I obtain the year of foundation of Guarani Jesuit Missions, which
can be used to calculate the number of years they was active and capture the intensity of treatment.
Mission Moved: Lastly, I construct a dummy variable taking the value of 1 if the Mission moved
and 0 otherwise, again to capture the intensity of treatment e�ect.
46
D. Geographic and Weather Controls
Area: Total area in squared kilometers taken from IBGE (2010) for Brazil, and calculated with
ArcGIS for Argentina and Paraguay.
Altitude: Elevation measured in meters over sea level originally available at very high resolution
from WorldClim and processed using ArcGIS.68 Similar data are also available from IBGE (2000)
for Brazil and used alternatively for robustness.
Latitude and Longitude: Measured in decimal degrees for the municipal centroid and taken from
IPEA (2000) for Brazil, and calculated with ArcGIS for Argentina and Paraguay.
Temperature: Annual mean temperature measured in °C x 10 available originally at very high
resolution (around 1 kilometer grid cells) from BIOCLIM (BIO12) and processed using ArcGIS.69
Alternative comparable data are also available for Brazil from IPEA based on the Climate Research
Unit of University of East Anglia (CRU-UEA) project.
Rainfall: Annual precipitation in millimeters also available from BIOCLIM (BIO1) converted using
ArcGIS. Alternative data are also available for Brazil from IPEA based on the CRU-UEA project.
Ruggedness: Terrain ruggedness index in millimeters, originally available from Nunn and Puga
2012) at high-resolution (30 x 30 arc-seconds) and later processed using ArcGIS.70
Slope: Similar to ruggedness, in thousandths of a percentage point, also originally from Nunn and
Puga (2012) at the grid cell level and processed with ArcGIS.
Distance to River: Distance to the nearest river in decimal degrees is calculated using ArcGIS
with the waterways shape �le for South America.71
68http://worldclim.com/69http://www.worldclim.org/bioclim70http://diegopuga.org/data/rugged/71Available, among others at: http://mapcruzin.com/
47
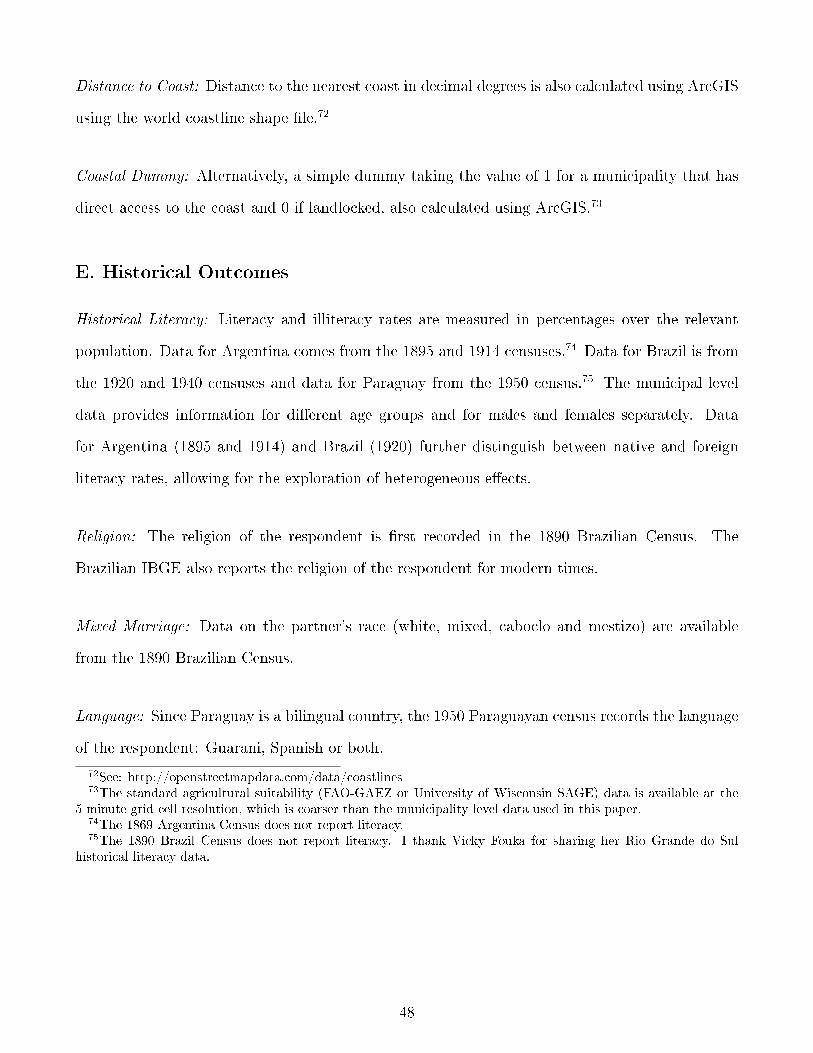
Distance to Coast: Distance to the nearest coast in decimal degrees is also calculated using ArcGIS
using the world coastline shape �le.72
Coastal Dummy: Alternatively, a simple dummy taking the value of 1 for a municipality that has
direct access to the coast and 0 if landlocked, also calculated using ArcGIS.73
E. Historical Outcomes
Historical Literacy: Literacy and illiteracy rates are measured in percentages over the relevant
population. Data for Argentina comes from the 1895 and 1914 censuses.74 Data for Brazil is from
the 1920 and 1940 censuses and data for Paraguay from the 1950 census.75 The municipal level
data provides information for di�erent age groups and for males and females separately. Data
for Argentina (1895 and 1914) and Brazil (1920) further distinguish between native and foreign
literacy rates, allowing for the exploration of heterogeneous e�ects.
Religion: The religion of the respondent is �rst recorded in the 1890 Brazilian Census. The
Brazilian IBGE also reports the religion of the respondent for modern times.
Mixed Marriage: Data on the partner's race (white, mixed, caboclo and mestizo) are available
from the 1890 Brazilian Census.
Language: Since Paraguay is a bilingual country, the 1950 Paraguayan census records the language
of the respondent: Guarani, Spanish or both.
72See: http://openstreetmapdata.com/data/coastlines73The standard agricultural suitability (FAO-GAEZ or University of Wisconsin SAGE) data is available at the
5-minute grid cell resolution, which is coarser than the municipality level data used in this paper.74The 1869 Argentina Census does not report literacy.75The 1890 Brazil Census does not report literacy. I thank Vicky Fouka for sharing her Rio Grande do Sul
historical literacy data.
48

F. Cultural Variables
Handicrafts: The Brazilian Municipal Survey of 2006 records very detailed information on handi-
craft production, most importantly, embroidery.
Knowledge Transmission: The Paraguayan Cultural Module of 2011 contains very speci�c infor-
mation about traditional knowledge of medicine and folktales, including inter-generational trans-
mission and language of transmission.
Language: The main language of the respondent (Spanish, Guarani, both or other) was asked in
Paraguay in the 2012 Household Survey.
Race: The percentage of indigenous population is reported by the IBGE for Brazil in 2010.
G. Additional Data
Population Density: Population counts are taken from the 2001 census for Argentina, the 2000
Brazilian census and the 2002 Paraguayan census, and area is as reported previously.
Pre-colonial Population Density: Number of indigenous people per square kilometer, taken from
and described in detail in Maloney and Valencia (2012).
Migration: Data on migration and resident status are reported for Brazil by the IBGE in 2010.
Hours Worked: Total number of hours worked for people 10 and older is taken from the 2010
Brazilian Census and the 2012 Paraguayan Household Survey.
Labor Force Participation: Labor force participation is available for Brazil through IPEA for 2000.
Occupation: From the Paraguayan Household Survey of 2012, I collect information on occupations
including agriculture, manufacturing, commerce and services.
49

Inequality: A Theil index on income is available for Brazil from IPEA for 2000 and for Paraguay
from the World Bank (2008).
Health: A series of health variables including mortality under 5, infant mortality, number of
doctors, and Health Development Indexes are available for Brazil from IPEA for 2000.
Tourism: Data on the prevalence of touristic activities come from the Brazilian Municipal Survey
of 2006.
50

II. Additional Results
I present in this section complementary empirical results. They include a di�erent instrument,
indigenous assimilation as an alternative cultural mechanism and an intensity of treatment robust-
ness speci�cation. I start with proximity to Jesuit martyr sites as an alternative instrument.
A. Instrumental Variables: Jesuit Martyrs
To extend the Instrumental Variables analysis, I use the location of Jesuit martyr deaths as an
alternative instrument. Data come from Pablo Hernandez (1913) and recent work by Cymbalista
(forthcoming).76 As mentioned in the identi�cation section, during the early missionary period,
Jesuit priests explored the Guarani territories with very di�erent results. Some priests, most
notably Antonio Ruiz de Montoya, were very successful in founding several missions, while others
like Diego de Alfaro and Alfonso Arias died in the process. I focus here on such Jesuit martyrs who
died during the early exploratory period before 1650, in the area close to modern day Rio Grande
do Sul.77 These priests were killed by Portuguese bandeirantes or by indigenous inhabitants. The
interpretation is that there is no direct e�ect of martyr sites on modern outcomes and that this
variable only a�ected them through the foundation of nearby Jesuit Missions.
The results of instrumenting missionary distance with distance to the nearest martyr site can be
seen in Table 7. The �rst stage is positive and very signi�cant (F-statistic > 10). The instrumented
coe�cient for income is negative and signi�cant (Column 3) while the one for illiteracy is positively
so (Column 7). The coe�cients are consistent with those estimated before. I also restrict the
sample to nearby municipalities where the identi�cation assumption is more feasible and �nd that
the results (not shown) are preserved.
76I thank Renato Cymbalista for sharing his data.77I �nd seven such cases and I construct a measure of distance to these early martyr sites using ArcGIS.
51

To further explore the robustness of the instrumental variable results, I combine all instruments in
Columns 4 and 8 of Table 7. I restrict the sample to the Brazilian municipalities, to be able to use
the distance to Asuncion instrument. The sign and signi�cance is preserved both for the income
and education results. I cannot reject a Hausman test for income and reject one for education
with the three instruments, which is why I limit the discussion to the two consistent instruments
in the main text.78 Results are robust to estimation with both two stage least squares and limited
information maximum likelihood. This is sensible, as the �rst stage is highly signi�cant throughout.
B. Cultural Mechanisms: Indigenous Assimilation
Another way to see how culture has persisted through time is to look at indigenous assimilation, as
argued by Diaz-Cayeros and Jha (2012) for Mexico. Indigenous inhabitants that attended religious
missions might have had an easier time assimilating into the colonial society when the Jesuits left,
due to the skilled training they acquired. An early indication of this mechanism can be observed
in the 1890 Census.79 In Table A.4 we can see that people reported more mixed marriages (general
mixed and caboclo: European and indigenous) in places closer to religious missions (Columns 1
and 2). No such question was asked in later censuses. Interestingly, they also report being more
Catholic, albeit from a very high base of 93% (Column 3).80
The prevalence of indigenous people in the missionary area can also be observed up until today.
Column 4 in Table A.4 reports results for Brazil. In 2010, more people report being indigenous
the closer they are to a mission. This is interesting, since in Latin America areas with higher
modern indigenous population density have been associated with lower levels of income. The role
of European population and development has been discussed in Acemoglu et al. 2002, Easterly
& Levine, 2012, Putterman & Weil 2010, Valencia & Maloney 2014, and Chanda et al. 2014. A
similar pattern can be found for Paraguay, when focusing on language. Recall that Guarani is one
of the two o�cial languages of Paraguay, along with Spanish, in itself a remarkable testament to
78Of course, this hinges on the assumption of the estimates with one instrument, in this case distance to Asuncion,being consistent.
79Given the small number of observations, I include a reduced set of geographic controls.80I �nd similar results for modern data, not reported.
52
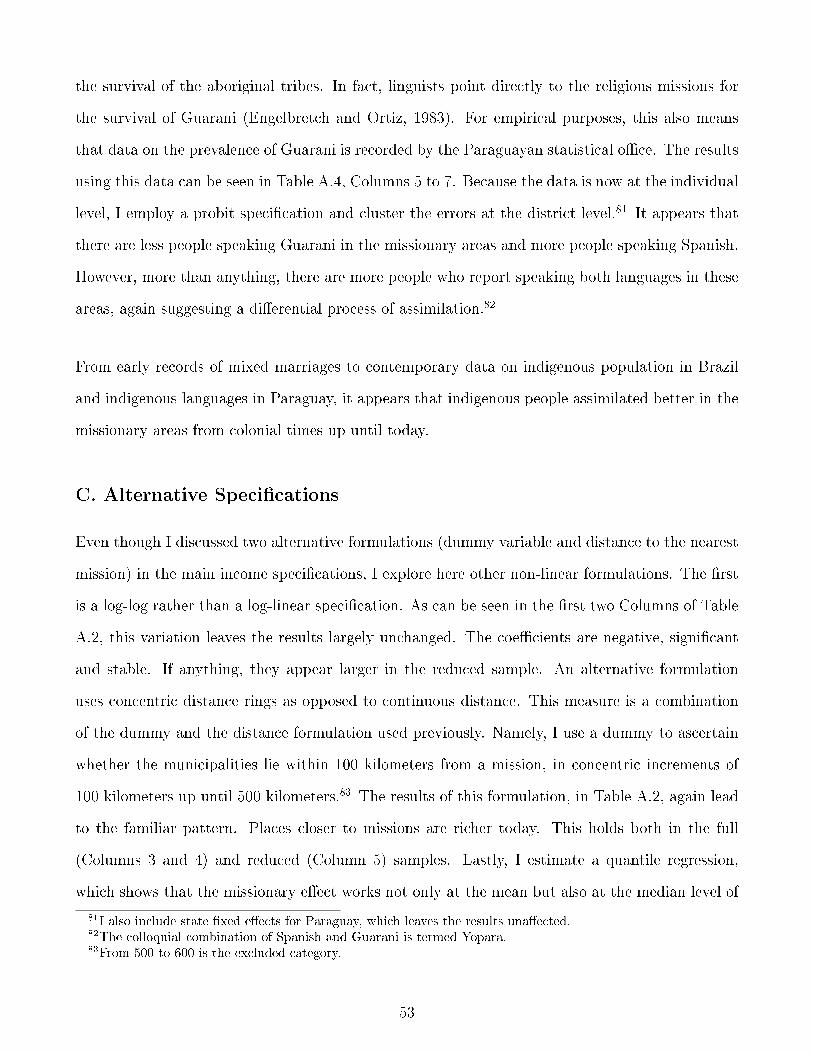
the survival of the aboriginal tribes. In fact, linguists point directly to the religious missions for
the survival of Guarani (Engelbretch and Ortiz, 1983). For empirical purposes, this also means
that data on the prevalence of Guarani is recorded by the Paraguayan statistical o�ce. The results
using this data can be seen in Table A.4, Columns 5 to 7. Because the data is now at the individual
level, I employ a probit speci�cation and cluster the errors at the district level.81 It appears that
there are less people speaking Guarani in the missionary areas and more people speaking Spanish.
However, more than anything, there are more people who report speaking both languages in these
areas, again suggesting a di�erential process of assimilation.82
From early records of mixed marriages to contemporary data on indigenous population in Brazil
and indigenous languages in Paraguay, it appears that indigenous people assimilated better in the
missionary areas from colonial times up until today.
C. Alternative Speci�cations
Even though I discussed two alternative formulations (dummy variable and distance to the nearest
mission) in the main income speci�cations, I explore here other non-linear formulations. The �rst
is a log-log rather than a log-linear speci�cation. As can be seen in the �rst two Columns of Table
A.2, this variation leaves the results largely unchanged. The coe�cients are negative, signi�cant
and stable. If anything, they appear larger in the reduced sample. An alternative formulation
uses concentric distance rings as opposed to continuous distance. This measure is a combination
of the dummy and the distance formulation used previously. Namely, I use a dummy to ascertain
whether the municipalities lie within 100 kilometers from a mission, in concentric increments of
100 kilometers up until 500 kilometers.83 The results of this formulation, in Table A.2, again lead
to the familiar pattern. Places closer to missions are richer today. This holds both in the full
(Columns 3 and 4) and reduced (Column 5) samples. Lastly, I estimate a quantile regression,
which shows that the missionary e�ect works not only at the mean but also at the median level of
81I also include state �xed e�ects for Paraguay, which leaves the results una�ected.82The colloquial combination of Spanish and Guarani is termed Yopara.83From 500 to 600 is the excluded category.
53

the sample (Columns 6 and 7).84 Again, the results are larger at the local level. Taken together,
the results using alternative formulations show the robustness of the Jesuit results for income.
D. Robustness: Intensity of Treatment
As has been discussed throughout the paper, the results presented are robust to alternative de�-
nitions, variables and formulations. In this section I focus instead on the intensity of missionary
treatment. To do so, I estimate alternative econometric speci�cations with interaction e�ects.85
In particular, I exploit historical information on the year of foundation, indigenous population and
a dummy variable for whether the mission moved or not. Instead of only using distance to the
nearest mission as in Equation 1, I interact this variable with the year of foundation and or the
mean of the indigenous missionary population. For all formulations I use information on the near-
est mission as well as geographic and weather results. The results of this empirical exercise can be
seen in Table A.3. In the Distance X Year of Foundation formulation in the �rst Column, the log
coe�cient is negative and signi�cant, re�ecting that not only distance to the nearest mission, but
also how many years it was active, was important. The results are positive and signi�cant when I
use instead the mean of indigenous population divided by distance, again in logs (Column 2). So,
not only the number of years but also the quantity of people treated appears as important. Com-
bining this information, I estimate a model with population interacted with years of missionary
activity normalized by distance. Once again the log coe�cient is positive and statistically signi�-
cant (Column 3). I also interact distance to the nearest mission with distance to the nearest river,
as a proxy for isolation or market access, �nding a negative e�ect (Column 4). Lastly, I explore
whether missions that moved during some point in their history have a di�erential e�ect.86 I �nd
using a dummy variable that indeed such movers had less of an impact (signi�cant at the 10%) in
the long-run (Column 5). Taken together, the results in this section show that the intensity of the
Jesuit treatment also mattered in terms of years of exposure and population size.
84This formulation also allows for testing robustness for outliers. As is standard, I use bootstrapped standarderrors in this formulation. Quantile results for education (not shown) reveal large treatment e�ects for median andbelow median literacy levels.
85I thank Pedro dal Bó and Esteban Aucejo for suggesting these formulations.86Approximately half of the missions moved at some point in their history.
54

Figures
Figure 1. Location of the Guarani Jesuit Missions in Latin America
Note: The map shows the location of the Guarani Jesuit Missions, along with state level boundariesfor Argentina, Brazil and Paraguay, and national level boundaries for the rest of Latin Americancountries.
55

Figure 2. Location of the Guarani Jesuit Missions in Argentina, Braziland Paraguay
Note: The map shows the exact location of the Guarani Jesuit Missions, along with municipal levelboundaries for the states of Corrientes and Misiones (Argentina), Itapua and Misiones (Paraguay)and Rio Grande do Sul (Brazil), and state boundaries for other states in Argentina, Brazil andParaguay.
56
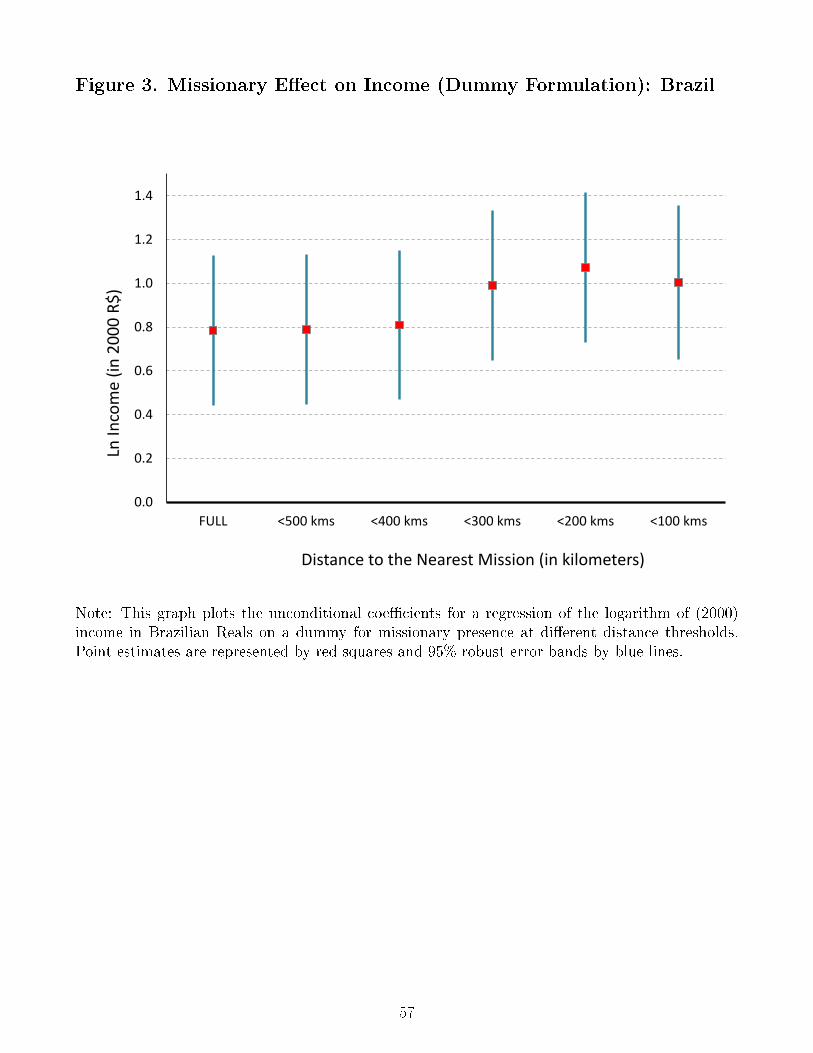
Figure 3. Missionary E�ect on Income (Dummy Formulation): Brazil
0.0
0.2
0.4
0.6
0.8
1.0
1.2
1.4
FULL <500 kms <400 kms <300 kms <200 kms <100 kms
Ln In
com
e (i
n 2
00
0 R
$)
Distance to the Nearest Mission (in kilometers)
Note: This graph plots the unconditional coe�cients for a regression of the logarithm of (2000)income in Brazilian Reals on a dummy for missionary presence at di�erent distance thresholds.Point estimates are represented by red squares and 95% robust error bands by blue lines.
57
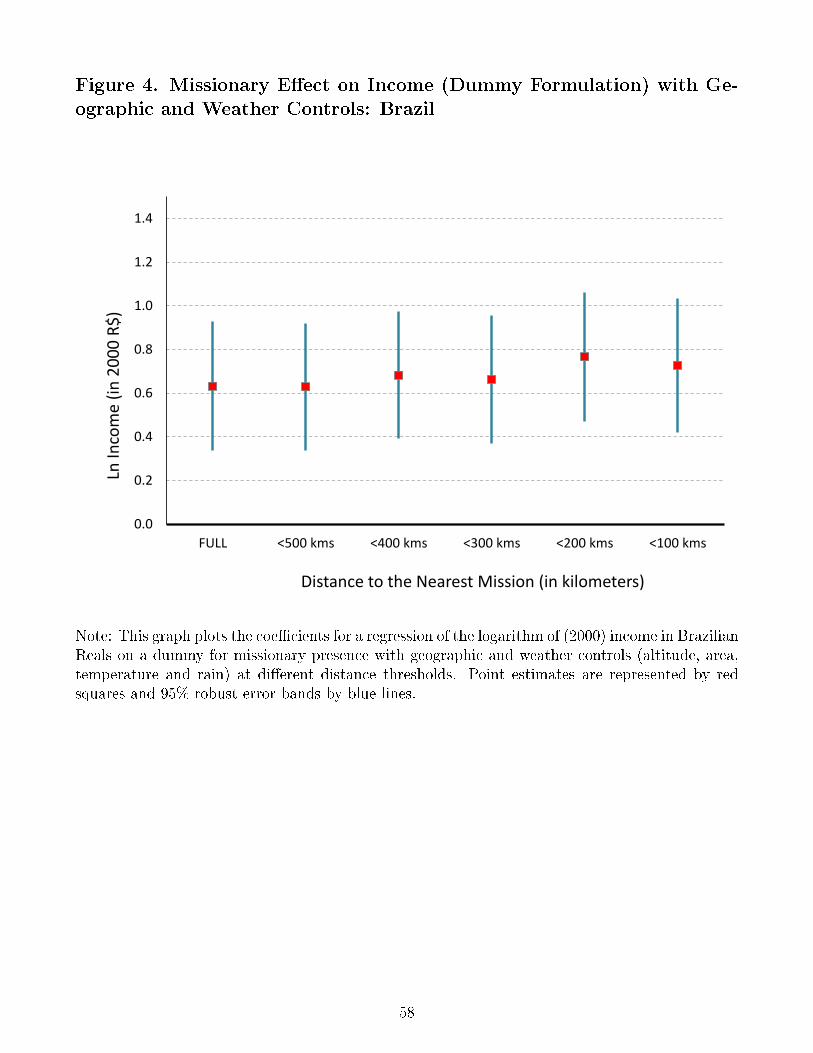
Figure 4. Missionary E�ect on Income (Dummy Formulation) with Ge-ographic and Weather Controls: Brazil
0.0
0.2
0.4
0.6
0.8
1.0
1.2
1.4
FULL <500 kms <400 kms <300 kms <200 kms <100 kms
Ln In
com
e (i
n 2
00
0 R
$)
Distance to the Nearest Mission (in kilometers)
Note: This graph plots the coe�cients for a regression of the logarithm of (2000) income in BrazilianReals on a dummy for missionary presence with geographic and weather controls (altitude, area,temperature and rain) at di�erent distance thresholds. Point estimates are represented by redsquares and 95% robust error bands by blue lines.
58
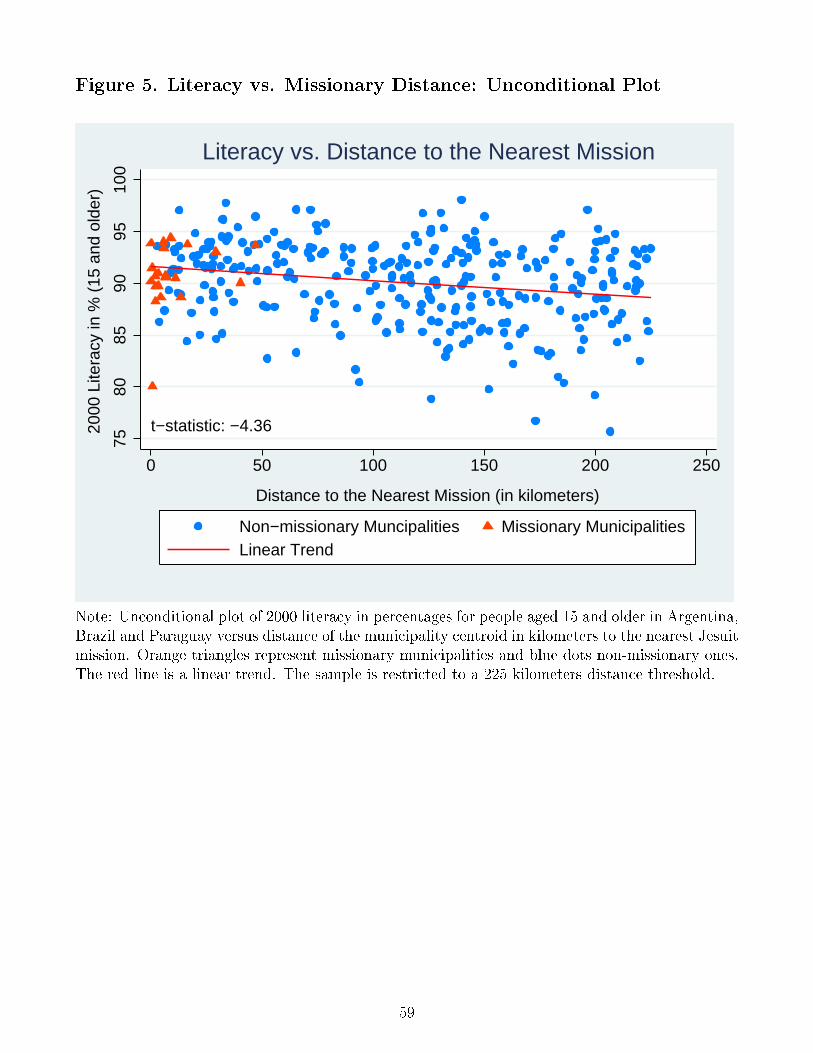
Figure 5. Literacy vs. Missionary Distance: Unconditional Plot
7580
8590
9510
0
2000
Lite
racy
in %
(15
and
old
er)
0 50 100 150 200 250
Distance to the Nearest Mission (in kilometers)
Non−missionary Muncipalities Missionary MunicipalitiesLinear Trend
t−statistic: −4.36
Literacy vs. Distance to the Nearest Mission
Note: Unconditional plot of 2000 literacy in percentages for people aged 15 and older in Argentina,Brazil and Paraguay versus distance of the municipality centroid in kilometers to the nearest Jesuitmission. Orange triangles represent missionary municipalities and blue dots non-missionary ones.The red line is a linear trend. The sample is restricted to a 225 kilometers distance threshold.
59

Figure 6. Historical Population of Jesuit and Franciscan Guarani Mis-sions (1640-1760)
Note: This graph plots average mission population for Jesuit (blue diamonds) and Franciscan (reddots) Missions from 1640 to 1760.
60

Figure 7. Map of Rio Grande do Sul with the Direction of the JesuitMissions from Asuncion
Note: The map shows the location of Asuncion, the Guarani Jesuit Missions, along with municipallevel boundaries for the state of Rio Grande do Sul (Brazil), and national level boundaries forArgentina and Paraguay.
61

Figure 8. Latin America Map with Tordesillas Line
Note: Map of Latin America with state level boundaries for Argentina, Brazil and Paraguay, andnational level boundaries for the rest of Latin American countries along with the Tordesillas line,dividing the Spanish and Portuguese empires.
62

Figure 9. Hours Worked vs. Missionary Distance: Brazil
.1.2
.3.4
.515
− 3
9 ho
urs
per
wee
k in
201
0
0 200 400 600Distance to the Nearest Mission
95% CI Fitted valuesMunicipality
t−statistic: −10.01
Hours Worked vs. Distance to the Nearest Mission
Note: Plot of weekly hours worked (15 to 39 hours) in 2010 versus distance to the nearest Jesuitmission in kilometers. Municipalities in green circles, blue linear �t with gray 95% con�dencebands.
63

Tables
Table 1. Summary Statistics
CATEGORY VARIABLES N Mean SD Median MIN MAX
INCOME Ln Income 506 5.67 0.85 5.50 4.44 9.17
Individual Poverty Index 82 43.36 13.55 41.48 20.84 75.85
Household Poverty Index 82 42.46 16.53 40.97 17.70 76.97
EDUCATION Median Years of Education 467 5.08 0.83 4.95 3.27 8.96
Literacy 549 90.87 4.00 91.45 75.68 98.41
Illiteracy 549 9.09 1.60 8.46 4.01 24.32
MISSION Mission Dummy 578 0.04 0.19 0.00 0.00 1.00
Distance to the Nearest Mission 549 195.89 123.28 194.77 0.12 567.02
GEO CONTROLS Latitude 549 -28.73 1.23 -28.69 -33.69 -25.88
Longitude 549 -53.17 1.92 -52.84 -59.26 -49.73
Area 578 716.95 1214.67 265.40 27.70 9588.00
Temperature 577 190.56 12.70 190.17 145.67 225.71
Altitude 577 325.99 226.07 290.50 3.00 1156.80
Rainfall 577 1624.71 189.14 1671.67 1049.55 1994.50
Ruggedness 577 52468.65 40858.47 37132.30 6335.47 173076.00
Slope 577 1455.60 1183.19 1130.62 31.88 6739.00
Distance to River 577 0.24 0.26 0.17 0.00 1.27
Distance to Coast 577 2.51 1.67 2.32 0.00 7.01
Landlocked 578 0.96 0.20 1.00 0.00 1.00
64
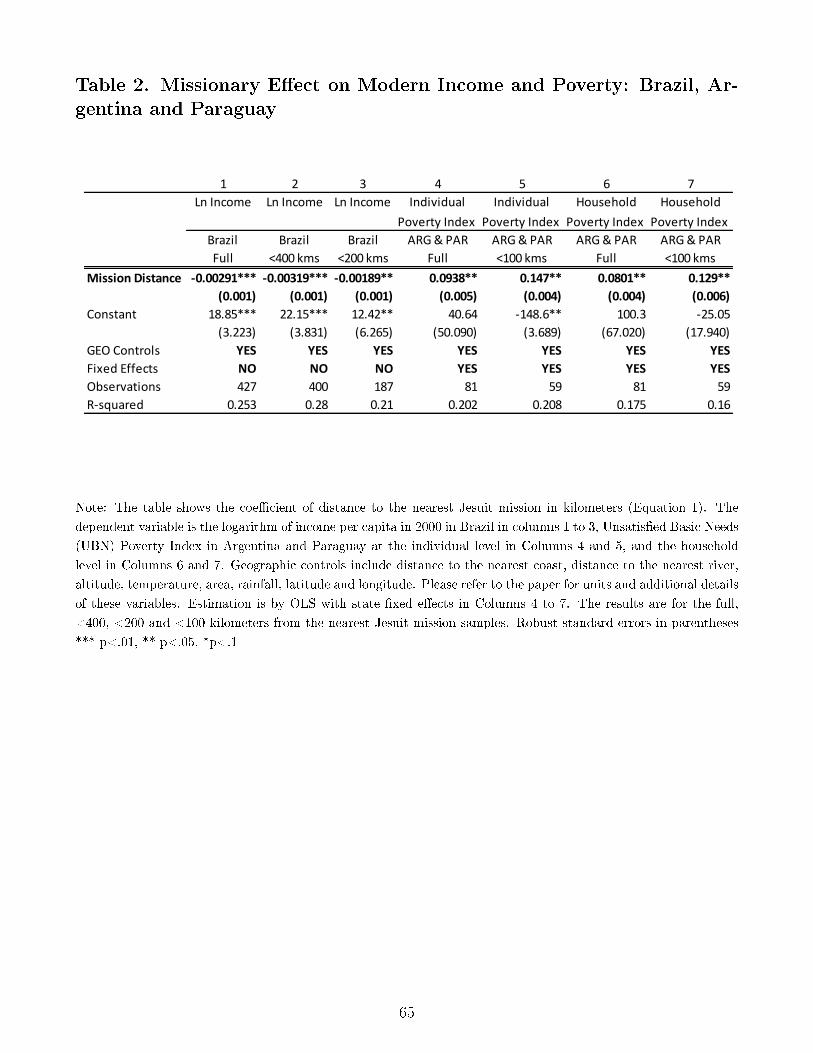
Table 2. Missionary E�ect on Modern Income and Poverty: Brazil, Ar-gentina and Paraguay
1 2 3 4 5 6 7
Ln Income Ln Income Ln Income Individual Individual Household Household
Poverty Index Poverty Index Poverty Index Poverty Index
Brazil Brazil Brazil ARG & PAR ARG & PAR ARG & PAR ARG & PAR
Full <400 kms <200 kms Full <100 kms Full <100 kms
Mission Distance -0.00291*** -0.00319*** -0.00189** 0.0938** 0.147** 0.0801** 0.129**
(0.001) (0.001) (0.001) (0.005) (0.004) (0.004) (0.006)
Constant 18.85*** 22.15*** 12.42** 40.64 -148.6** 100.3 -25.05
(3.223) (3.831) (6.265) (50.090) (3.689) (67.020) (17.940)
GEO Controls YES YES YES YES YES YES YES
Fixed Effects NO NO NO YES YES YES YES
Observations 427 400 187 81 59 81 59
R-squared 0.253 0.28 0.21 0.202 0.208 0.175 0.16
Note: The table shows the coe�cient of distance to the nearest Jesuit mission in kilometers (Equation 1). The
dependent variable is the logarithm of income per capita in 2000 in Brazil in columns 1 to 3, Unsatis�ed Basic Needs
(UBN) Poverty Index in Argentina and Paraguay at the individual level in Columns 4 and 5, and the household
level in Columns 6 and 7. Geographic controls include distance to the nearest coast, distance to the nearest river,
altitude, temperature, area, rainfall, latitude and longitude. Please refer to the paper for units and additional details
of these variables. Estimation is by OLS with state �xed e�ects in Columns 4 to 7. The results are for the full,
<400, <200 and <100 kilometers from the nearest Jesuit mission samples. Robust standard errors in parentheses
*** p<.01, ** p<.05, *p<.1
65

Table 3. Missionary E�ect on Modern Education: Brazil, Argentina andParaguay
1 2 3 4 5 6
Med. Years Edu. Med. Years Edu. Med. Years Edu. Illiteracy Illiteracy Illiteracy
Brazil Brazil Brazil ARG BRA PAR ARG BRA PAR ARG BRA PAR
Full <400 kms <200 kms Full <400 kms <200 kms
Mission Distance -0.00665*** -0.00797*** -0.00444** 0.0112** 0.00942* 0.0253***
(0.002) (0.002) (0.002) (0.005) (0.005) (0.007)
Constant 44.10*** 58.62*** 18.39 -53.74* -85.83** -3.996
(10.30) (10.16) (16.49) (32.50) (34.49) (34.18)
GEO Controls YES YES YES YES YES YES
Fixed Effects NO NO NO YES YES YES
Observations 427 400 187 548 514 281
R-squared 0.172 0.189 0.231 0.073 0.101 0.133
Note: The table shows the coe�cient of distance to the nearest Jesuit mission in kilometers (Equation 2). The
dependent variable is median years of schooling in Brazil in Columns 1 to 3 and illiteracy for people aged 15 years
and older in 2000 in percentages for Argentina, Brazil and Paraguay in Columns 4 to 8. Geographic controls
include distance to the nearest coast, distance to the nearest river, altitude, temperature, area, rainfall, latitude
and longitude. Please refer to the paper for units and additional details of these variables. Estimation is by OLS
with state �xed e�ects in Columns 4 to . The results are for the full, <400 and <200 kilometers from the nearest
Jesuit mission samples. Robust standard errors in parentheses *** p<.01, ** p<.05, *p<.1
66

Table 4. Missionary E�ect on Historical Education: Argentina (1895)and Brazil (1920)
1 2 3 4 5 6 7 8
Illiteracy Illiteracy Illiteracy Illiteracy Literacy Literacy Literacy Literacy
Total Males Females Foreigners Total 7-14 years 15+ years Foreigners
ARG 1895 ARG 1895 ARG 1895 ARG 1895 BRA 1920 BRA 1920 BRA 1920 BRA 1920
Full Full Full Full <200 kms <200 kms <200 kms <200 kms
Mission Distance 0.0414*** 0.0580*** 0.0982*** -0.0329*** -0.115** -0.0311*** -0.0834** -0.0542
Robust SE (0.0150) (0.0124) (0.0179) (0.0068) (0.0388) (0.0086) (0.0347) (0.1050)
Bootstrap SE (0.0159) (0.0125) (0.0186) (0.0073) (0.0677) (0.0154) (0.0405) (0.1340)
Constant 12.91*** 18.77*** 20.85*** 10.29*** 796.3*** 215.3** 571.5** 1,034*
(2.15) (2.04) (3.30) (1.14) (220.30) (71.10) (190.10) (509.40)
GEO Controls NO NO NO NO YES YES YES YES
Observations 32 33 34 33 18 18 18 18
R-squared 0.189 0.338 0.317 0.264 0.553 0.43 0.568 0.36
Note: The table shows the coe�cient of distance to the nearest Jesuit mission in kilometers (Equation 2). The
dependent variable is illiteracy in percentages in Argentina in 1895 in Columns 1 to 4 and in Brazil in 1920 in
Columns 5 to 8. Geographic controls include distance to the nearest coast, distance to the nearest river, altitude,
temperature, area, rainfall, latitude and longitude. Please refer to the paper for units and additional details of these
variables. Estimation is by OLS. The results are for the full sample for Argentina and the <200 kilometers from
the nearest Jesuit mission sample for Brazil. Robust and bootstrap standard errors in parentheses *** p<.01, **
p<.05, *p<.1
67

Table 5. Placebo E�ect of Abandoned Jesuit Missions on Modern Incomeand Education
1 2 3 4 5 6 7 8
Ln Income Ln Income Ln Income Ln Income Literacy Literacy Literacy Literacy
BRA & PAR BRA & PAR BRA & PAR BRA & PAR ARG BRA PAR ARG BRA PAR ARG BRA PAR ARG BRA PAR
Full Full Full Full Full Full Full Full
Alto Parana Mission Distance 0.000317 0.011 0.0120*** 0.013
(0.001) (0.007) (0.004) (0.024)
Guayra Mission Distance -0.00129 -0.00403 0.00298 -0.0384***
(0.003) (0.004) (0.008) (0.013)
Itatin Misision Distance -0.000122 -0.0189 0.0253*** 0.0298
(0.003) (0.015) (0.008) (0.044)
Constant (11.10) (15.93) (10.87) (22.88) 115.1*** 112.0** 113.9*** (29.06)
(7.92) (13.62) (7.83) (16.44) (25.22) (43.49) (25.02) (52.58)
GEO Controls YES YES YES YES YES YES YES YES
Fixed Effects YES YES YES YES YES YES YES YES
Observations 506 506 506 506 548 548 548 548
R-squared 0.398 0.399 0.398 0.401 0.078 0.065 0.081 0.095
Note: The table shows the coe�cient of distance to the nearest abandoned mission in kilometers. The dependent
variables are the logarithm of income in 2000 for Brazil and Paraguay and literacy for people aged 15 years and
older in 2000 in percentages for Argentina, Brazil and Paraguay. Geographic controls include distance to the nearest
coast, distance to the nearest river, altitude, temperature, area, rainfall, latitude and longitude. Please refer to the
paper for units and additional details of these variables. Estimation is by OLS with state �xed e�ects. Robust
standard errors in parentheses *** p<.01, ** p<.05, *p<.1
68

Table 6. Franciscan and Jesuit Missionary E�ect on Modern Income andEducation
1 2 3 4 5 6
Ln Income Literacy Ln Income Literacy Theil Index Mortality
BRA & PAR ARG BRA PAR BRA & PAR ARG BRA PAR BRA & PAR BRA & PAR
Full Full Full Full Full Full
Franciscan Mission Distance -0.00010 0.00772 0.00356*** 0.0342*** -0.126*** -0.0296
(0.001) (0.008) (0.001) (0.011) (0.038) (0.029)
Jesuit Mission Distance -0.00356*** -0.0214*** 0.0603*** 0.0417***
(0.001) (0.006) (0.023) (0.014)
Constant 0.862 77.89** 6.317 91.76** 0.03 -73.32
(3.54) (30.82) (3.87) (41.53) (133.00) (96.460)
GEO Controls YES YES YES YES YES YES
Fixed Effects YES YES YES YES YES NO
Observations 506 548 506 548 506 467
R-squared 0.872 0.067 0.879 0.082 0.448 0.107
Note: The table shows the coe�cient of distance to the nearest Franciscan and Jesuit missions in kilometers. The
dependent variables are the logarithm of income in 2000 for Brazil and Paraguay; literacy for people aged 15 years
and older in 2000 in percentages for Argentina, Brazil and Paraguay; and a Theil inequality index for income in
Brazil and Paraguay in 2000. Geographic controls include distance to the nearest coast, distance to the nearest
river, altitude, temperature, area, rainfall, latitude and longitude. Please refer to the paper for units and additional
details of these variables. Estimation is by OLS with state �xed e�ects. Robust standard errors in parentheses ***
p<.01, ** p<.05, *p<.1
69

Table 7. Instrumental Variables E�ect of Jesuit Missions on ModernIncome and Education
1 2 3 4 5 6 7 8
Ln Income Ln Income Ln Income Ln Income Illiteracy Illiteracy Illiteracy Illiteracy
Asuncion IV Tordesillas IV Martyrs IV All Asuncion IV Tordesillas IV Martyrs IV All
BRA BRA & PAR BRA & PAR BRA BRA ARG BRA PAR ARG BRA PAR BRA
Mission Distance -0.00199*** -0.00771** -0.00505*** -0.00446** 0.0215** 0.0524** 0.0578*** 0.0511***
(0.001) (0.003) (0.001) (0.002) (0.011) (0.024) (0.010) (0.012)
Constant 10.61** 29.67*** 28.15*** 10.40 -97.75 -91.32** -217.6*** -260.5***
(4.15) (8.76) (6.74) (13.74) (64.43) (44.76) (43.18) (78.30)
GEO Controls YES YES YES YES YES YES YES YES
Fixed Effects NO YES YES NO NO YES YES NO
First Stage F Stat. 98.8 32.4 111.9 289.9 98.8 28.4 162.6 289.9
Observations 467 506 506 467 467 548 548 467
R-Squared 0.262 0.356 0.867 0.393 0.143 0.075 0.799 0.13
Note: The table shows the instrumented coe�cient of distance to the nearest Jesuit mission in kilometers. The
instrumental variables are distance to the Tordesillas line, proximity to martyr sites and distance to Asuncion. The
dependent variables are the logarithm of income in 2000 for Brazil and Paraguay and illiteracy for people aged 15
years and older in 2000 in percentages for Argentina, Brazil and Paraguay. Geographic controls include distance to
Sao Paulo, distance to the nearest coast, distance to the nearest river, altitude, temperature, area, rainfall, latitude
and longitude. Please refer to the paper for units and additional details of these variables. Estimation is by two
step least squares with state �xed e�ects (except in 3 and 6). Robust standard errors in parentheses *** p<.01, **
p<.05, *p<.1
70
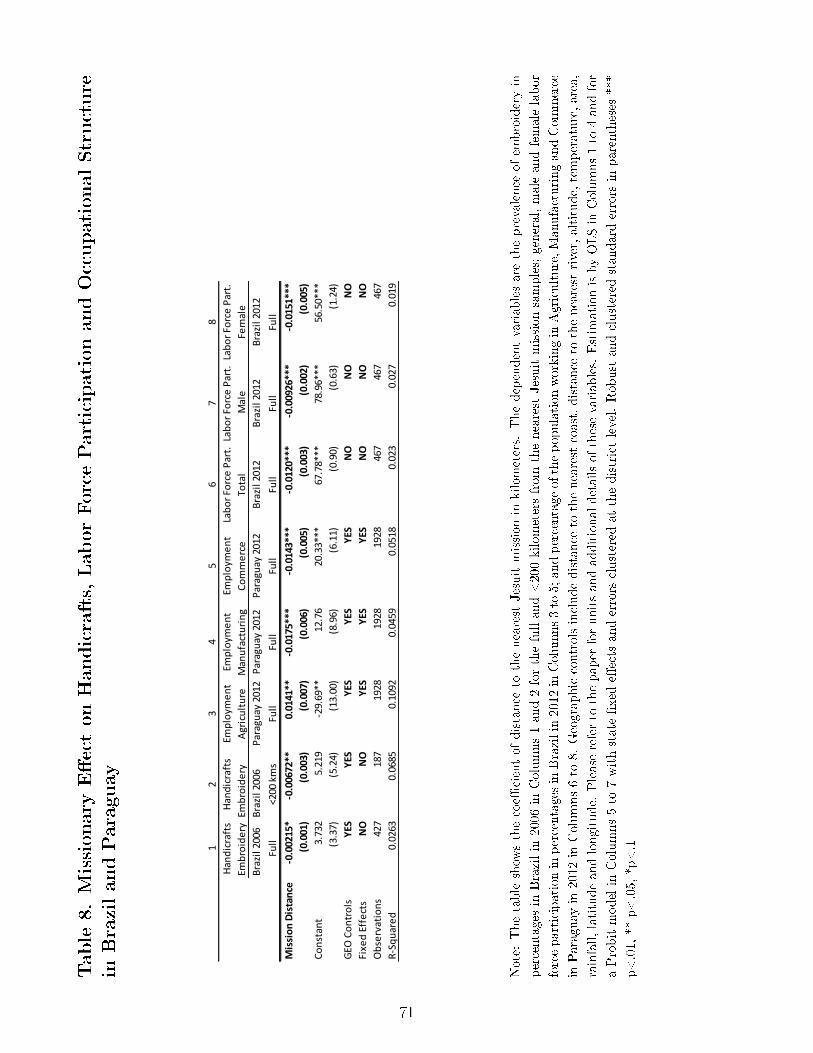
Table8.Missionary
E�ectonHandicrafts,LaborForceParticipationandOccupationalStructure
inBrazilandParaguay
12
34
56
78
Han
dic
raft
sH
and
icra
fts
Emp
loym
en
tEm
plo
yme
nt
Emp
loym
en
tLa
bo
r Fo
rce
Par
t.La
bo
r Fo
rce
Par
t.La
bo
r Fo
rce
Par
t.
Emb
roid
ery
Emb
roid
ery
Agr
icu
ltu
reM
anu
fact
uri
ng
Co
mm
erc
eTo
tal
Mal
eFe
mal
e
Bra
zil 2
006
Bra
zil 2
006
Par
agu
ay 2
012
Par
agu
ay 2
012
Par
agu
ay 2
012
Bra
zil 2
012
Bra
zil 2
012
Bra
zil 2
012
Full
<200
km
sFu
llFu
llFu
llFu
llFu
llFu
ll
Mis
sio
n D
ista
nce
-0.0
0215
*-0
.006
72**
0.01
41**
-0.0
175*
**-0
.014
3***
-0.0
120*
**-0
.009
26**
*-0
.015
1***
(0.0
01)
(0.0
03)
(0.0
07)
(0.0
06)
(0.0
05)
(0.0
03)
(0.0
02)
(0.0
05)
Co
nst
ant
3.73
25.
219
-29.
69**
12.7
620
.33*
**67
.78*
**78
.96*
**56
.50*
**
(3.3
7)(5
.24)
(13.
00)
(8.9
6)(6
.11)
(0.9
0)(0
.63)
(1.2
4)
GEO
Co
ntr
ols
Y
ESY
ESY
ESY
ESY
ESN
ON
ON
O
Fixe
d E
ffe
cts
NO
NO
YES
YES
YES
NO
NO
NO
Ob
serv
atio
ns
427
187
1928
1928
1928
467
467
467
R-S
qu
are
d0.
0263
0.06
850.
1092
0.04
590.
0518
0.02
30.
027
0.01
9
Note:
The
tableshow
sthecoe�
cientof
distance
tothenearestJesuitmission
inkilometers.
The
dependent
variablesaretheprevalence
ofem
broidery
in
percentages
inBrazilin
2006
inColum
ns1and2forthefulland<200kilometersfrom
thenearestJesuitmission
samples;general,maleandfemalelabor
forceparticipationinpercentagesinBrazilin2012
inColum
ns3to
5;andpercentageofthepopulationworking
inAgriculture,M
anufacturing
andCom
merce
inParaguayin
2012
inColum
ns6to
8.Geographiccontrolsinclud
edistance
tothenearestcoast,distance
tothenearestriver,altitude,temperature,area,
rainfall,
latitude
andlongitud
e.Pleasereferto
thepaper
forun
itsandadditionaldetails
ofthesevariables.
Estim
ationisby
OLSin
Colum
ns1to
4andfor
aProbitmodelin
Colum
ns5to
7withstate�xed
e�ects
anderrors
clusteredat
thedistrict
level.Robustandclusteredstandard
errors
inparentheses***
p<.01,
**p<
.05,
*p<.1
71

Table 9. Missionary E�ect Inter-generational Knowledge Transmissionand Skills in Paraguay
1 2 3 4 5 6 7
Medicine Medicince Tales Tales Accounting Diary Library
Knowledge Transmission Knowledge Transmission Practice Usage Visits
PAR 2011 PAR 2011 PAR 2011 PAR 2011 PAR 2011 PAR 2011 PAR 2011
Full Full Full Full Full Full Full
Mission Distance -0.00546** -0.00523** -0.00757*** -0.00582*** -0.00791** -0.0104*** -0.0238***
(0.0026) (0.0023) (0.0018) (0.0017) (0.0032) (0.0036) (0.0073)
Constant 0.790*** 0.327*** 0.282** -0.464*** -0.532*** -0.832*** -1.188***
(0.09) (0.11) (0.12) (0.10) (0.18) (0.17) (0.15)
Fixed Effects YES YES YES YES YES YES YES
Observations 904 904 904 904 904 904 904
R-Squared 0.0085 0.0065 0.0129 0.01 0.0156 0.0217 0.0684
Note: The table shows the coe�cient of distance to the nearest Jesuit mission in kilometers. The dependent variables
are knowledge of traditional medicine in percentages, parental transmission of medicinal knowledge and language
of medicinal knowledge in Columns 1 to 3; knowledge of traditional folktales in percentages, parental transmission
of folktale knowledge and language of folktale knowledge in Columns 4 to 6; and knowledge of accounting, usage of
a diary and visits to the library all in percentages in Paraguay in 2011. Geographic controls include distance to the
nearest coast, distance to the nearest river, altitude, temperature, area, rainfall, latitude and longitude. Please refer
to the paper for units and additional details of these variables. Estimation is for a Probit model in Columns with
state �xed e�ects and errors clustered at the district level. Clustered standard errors in parentheses *** p<.01, **
p<.05, *p<.1
72
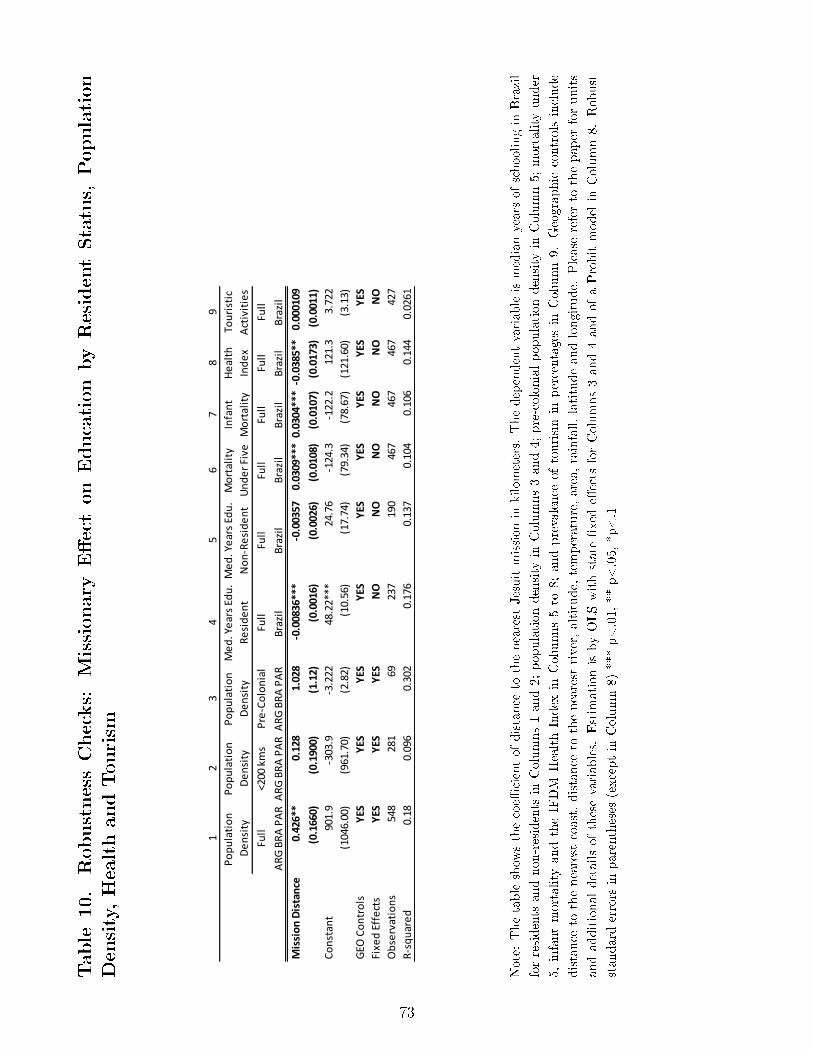
Table
10.RobustnessChecks:
Missionary
E�ectonEducationbyResidentStatus,
Population
Density,HealthandTourism
12
34
56
78
9
Po
pu
lati
on
P
op
ula
tio
nP
op
ula
tio
nM
ed
. Ye
ars
Edu
.M
ed
. Ye
ars
Edu
.M
ort
alit
yIn
fan
tH
eal
thTo
uri
stic
De
nsi
tyD
en
sity
De
nsi
tyR
esi
de
nt
No
n-R
esi
de
nt
Un
de
r Fi
veM
ort
alit
yIn
de
xA
ctiv
itie
s
Full
<200
km
sP
re-C
olo
nia
lFu
llFu
llFu
llFu
llFu
llFu
ll
AR
G B
RA
PA
RA
RG
BR
A P
AR
AR
G B
RA
PA
RB
razi
l B
razi
lB
razi
lB
razi
lB
razi
lB
razi
l
Mis
sio
n D
ista
nce
0.
426*
*0.
128
1.02
8-0
.008
36**
*-0
.003
570.
0309
***
0.03
04**
*-0
.038
5**
0.00
0109
(0.1
660)
(0.1
900)
(1.1
2)(0
.001
6)(0
.002
6)(0
.010
8)(0
.010
7)(0
.017
3)(0
.001
1)
Co
nst
ant
901.
9-3
03.9
-3.2
2248
.22*
**24
.76
-124
.3-1
22.2
121.
33.
722
(104
6.00
)(9
61.7
0)(2
.82)
(10.
56)
(17.
74)
(79.
34)
(78.
67)
(121
.60)
(3.1
3)
GEO
Co
ntr
ols
YES
YES
YES
YES
YES
YES
YES
YES
YES
Fixe
d E
ffe
cts
YES
YES
YES
NO
NO
NO
NO
NO
NO
Ob
serv
atio
ns
548
281
6923
719
046
746
746
742
7
R-s
qu
are
d0.
180.
096
0.30
20.
176
0.13
70.
104
0.10
60.
144
0.02
61
Note:
The
tableshow
sthecoe�
cientof
distance
tothenearestJesuitmission
inkilometers.
The
dependent
variableismedianyearsof
schoolingin
Brazil
forresidentsandnon-residentsin
Colum
ns1and2;
populationdensityin
Colum
ns3and4;
pre-colonial
populationdensityin
Colum
n5;
mortalityun
der
5,infant
mortalityandtheIFDM
HealthIndexin
Colum
ns5to
8;andprevalence
oftourism
inpercentages
inColum
n9.
Geographiccontrolsinclud
e
distance
tothenearestcoast,distance
tothenearestriver,altitude,temperature,area,rainfall,
latitude
andlongitud
e.Pleasereferto
thepaper
forun
its
andadditional
details
ofthesevariables.
Estim
ationisby
OLSwithstate�xed
e�ects
forColum
ns3and4andof
aProbitmodelin
Colum
n8.
Robust
standard
errors
inparentheses(exceptin
Colum
n8)
***p<
.01,
**p<
.05,
*p<.1
73

Appendix Figures
Figure A.1. Historical Population of the Guarani Jesuit Missions (1650-1780)
0
20000
40000
60000
80000
100000
120000
1650 1670 1690 1710 1730 1750 1770
Population
Year
Note: Total contemporary Guarani Jesuits Missions population counts from surviving records. Thered line represents 1767, which corresponds to the expulsion of the Jesuits from Latin America.
74

Figure A.2. Historical Blueprint of a Guarani Jesuit Mission
Note: Urban blueprint of the Jesuit Mission of San Ignacio de Miní taken in 1899 by Juan Queirel,taken from Hernandez (1913).
75
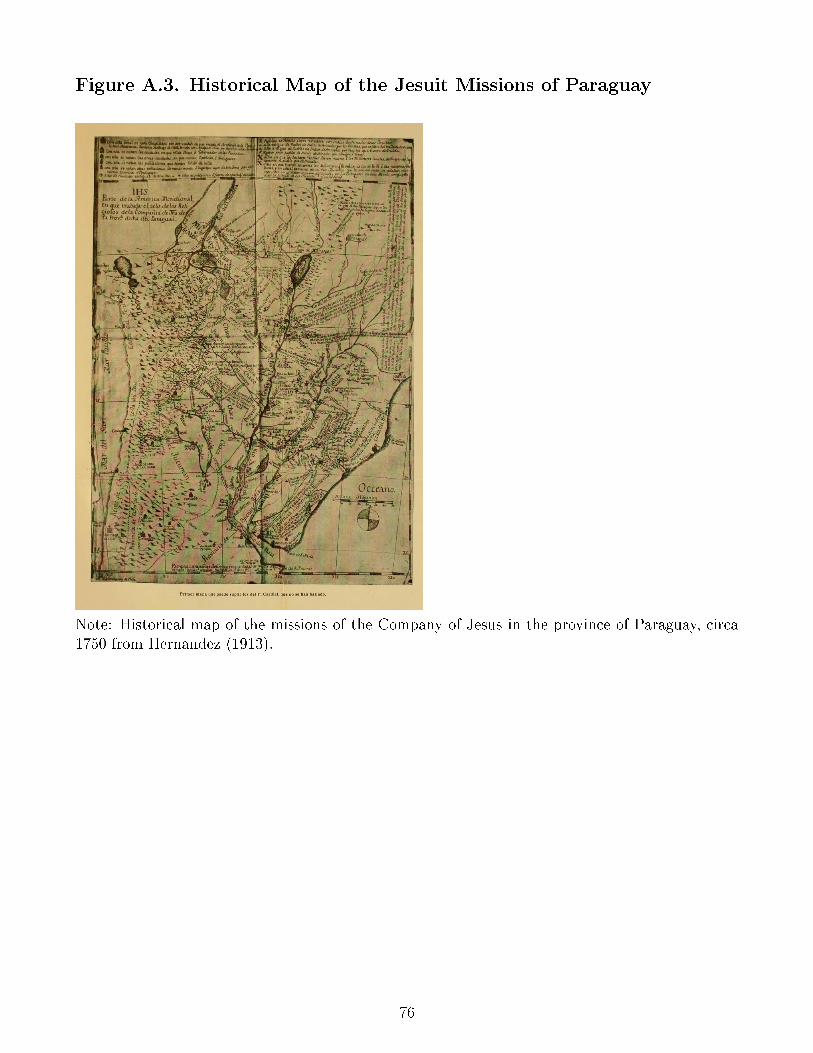
Figure A.3. Historical Map of the Jesuit Missions of Paraguay
Note: Historical map of the missions of the Company of Jesus in the province of Paraguay, circa1750 from Hernandez (1913).
76

Figure A.4. Modern vs. Historical Literacy in Argentina, Brazil andParaguay: Unconditional Plots
Bella−Vista
San Antonio
Corrientes
Concepción
Curuzú−Cuatiá
EmpedradoEsquinaCaá−Catí
GoyaItatí
Ituazingó
Lavalle
Mburucuyá
Mercedes
Monte−CaserosPaso de los Libres
Saladas
San Cosme
San Luis.
La Cruz
San Miguel.San Roque
Santo−Tomé
Sauce
Apóstoles
Campo Grande
Candelaria
Posadas
Concepción
La FronteraMonteagudo
San Ignacio
San Javier
San Pedro
8590
9510
020
00 L
itera
cy in
% (
15 a
nd o
lder
)
10 20 30 40 501895 Literacy in %
Historical Municipality Fitted values
t−statistic: 4.65
Slope: .237
Modern Literacy vs. Historical Literacy in Argentina
Alegrete
Alfredo Chaves
Antonio Prado
Arroio Grande
Bage
Bento Goncalves
Bom Jesus
Cacapava
Cachoeira
Cangussu
Caxias
Conceicao do Arroio Cruz Alta
Dom Pedrito
Dores de Camaquam
Encantado
Encruzilhada
Erechim
EstrellaGaribaldiGravatahy
Guapore
Herval
Ijuhy
Itaquy JaguaraoJulio de Castilhos
Lageado
Lagoa Vermelha
Lavras
Livramento (Sant’ Anna do) Montenegro (Sao Joao do)
Palmeira
Passo Fundo Pelotas
Pinheiro Machado
Piratiny
Porto Alegre
QuarahyRio Grande
Rio PardoRosario
Santa CruzSanta Maria
Santa Victoria do Palmar
Santiago do Boqueirao
Santo Amaro
Santo Angelo
Santo Antonio da Patrulha
Sao Borja
Sao Francisco de Assis
Sao Francisco de Paula
Sao GabrielSao JeronimoSao Joao de Camaquam
Sao Jose do Norte
Sao Leopoldo
Sao Lourenco
Sao Luiz Gonzaga
Sao Sebastiao do Cahy
Sao SepeSao Vicente
Soledade
Taquara
Taquary
Torres
Triumpho
UruguayanaVaccaria
Venancio AiresViamao
7580
8590
9520
00 L
itera
cy in
% (
15 a
nd o
lder
)
20 30 40 50 601920 Literacy in %
Historical Municipality Fitted values
t−statistic: 6.06
Slope:.193
Modern Literacy vs. Historical Literacy in Brazil
77

Santiago
Hohenau
Jesús
Encarnación
San Patricio
Santa Rosa Santa María
Cambyretá
San Cosme y Damián
Coronel Bogado
San MiguelSan Ignacio
General Delgado General Artigas
Ayolas
Capitán MezaCarmen del Paraná
Villa Florida
San Pedro del Paraná
San Juan Bautista
8486
8890
9294
2000
lite
racy
in %
(15
and
old
er)
65 70 75 80 851950 literacy in %
Municipality Fitted values
t−statistic: 2.33
Slope: .217
Modern Literacy vs. Historical Literacy in Paraguay
Note: Unconditional plots of 2000 literacy in percentages for people aged 15 years and older inArgentina and Brazil on 1895 literacy in percentages in Argentina, 1920 in Brazil, and 1950 inParaguay. Blue dots represent municipalities with historical names and red lines are linear trends.
78

Appendix Tables
Table A.1. Guarani Jesuit Missions: 1609-1767
# Mission Name Year of Country Mean Number Mean Number
Foundation of Inhabitants of Families
1 San Ignacio Guazú 1609 Paraguay 2,610 635
2 Loreto 1610 Argentina 3,797 915
3 San Ignacio de Miní 1611 Argentina 2,464 611
4 Santiago 1615 Paraguay - -
5 Encarnación o Itapua 1615 Paraguay 4,239 918
6 Concepción 1620 Argentina 3,867 906
7 Corpus 1622 Argentina 3,209 690
8 Santa María la Mayor 1626 Argentina 2,480 623
9 San Nicolás 1626 Brazil 4,692 1,070
10 Yapeyú 1626 Argentina 4,202 1,003
11 Candelaria 1627 Argentina 2,361 568
12 San Javier 1629 Argentina 3,000 743
13 San Carlos 1631 Argentina 2,854 674
14 San Miguel 1632 Brazil 3,870 921
15 Apóstoles 1632 Argentina 2,999 689
16 Santo Tomé 1632 Argentina - -
17 San José 1633 Argentina 2,391 518
18 San Cosme y Damián 1634 Paraguay 1,611 393
19 Santa Ana 1638 Argentina 3,409 776
20 Mártires 1638 Argentina 2,554 646
21 Santa María de Fe 1647 Paraguay - -
22 La Cruz 1657 Argentina - -
23 Jesús 1685 Paraguay 1,719 353
24 San Luis Gonzaga 1687 Brazil 3,765 911
25 San Juan Bautista 1687 Brazil 3,310 773
26 San Borja 1690 Brazil 2,960 665
27 San Lorenzo 1691 Brazil 3,067 766
28 Santa Rosa 1698 Paraguay 3,195 743
29 Trinidad 1706 Paraguay 2,459 518
30 Santo Ángel 1707 Brazil 3,614 890
79

Table A.2 Missionary E�ect on Modern Income, Alternative Formula-tions: Brazil and Paraguay
1 2 3 4 5 6 7
Ln Income Ln Income Ln Income Ln Income Ln Income Ln Income Ln Income
Q-Reg. Q-Reg.
BRA & PAR BRA & PAR BRA & PAR BRA & PAR BRA & PAR BRA & PAR BRA & PAR
Full <200kms Full Full <200kms Full <200kms
Ln Mission Distance -0.237*** -0.283***
(0.08) (0.08)
Mission Distance (<100 kms) 0.363** 1.278** 0.482***
(0.16) (0.60) (0.16)
Mission Distance (Q-reg) -0.00364** -0.00508**
(0.001) (0.002)
Dist (100-200 kms) 0.88
(0.57)
Dist (200-300 kms) 0.844
(0.54)
Dist (300-400 kms) 0.904*
(0.53)
Dist (400-500 kms) 0.224
(0.53)
Constant 26.49*** 20.8 -3.462 -1.113 -2.068 28.09*** 16.83*
(8.47) (15.11) (2.32) (2.31) (3.48) (8.32) (9.57)
GEO Controls YES YES YES YES YES YES YES
Observations 506 245 506 506 245 506 245
R-squared 0.313 0.354 0.393 0.404 0.448 0.2559 0.3184
Note: The table shows the coe�cient of the logarithm of distance to the nearest Jesuit mission in kilometers in
Columns 1 and 2, a dummy for whether a municipality is within 100 kilometers of a Jesuit mission in Columns 3
to 5 and distance to the nearest Jesuit mission in kilometers in Columns 6 and 7. The dependent variables are the
logarithm of income in 2000 for Brazil and Paraguay. Geographic controls include distance to the nearest coast,
distance to the nearest river, altitude, temperature, area, rainfall, latitude and longitude. Please refer to the paper
for units and additional details of these variables. Estimation is by OLS, except for the quantile regressions in
Columns 6 and 7. Robust standard errors in parentheses and bootstrapped standard errors in Columns 6 and 7
*** p<.01, ** p<.05, *p<.1
80

Table A.3. Intensity of Treatment E�ect of Jesuit Missions on Income:Brazil and Paraguay
1 2 3 4 5
Ln Income Ln Income Ln Income Ln Income Ln Income
BRA & PAR BRA & PAR BRA & PAR BRA & PAR BRA & PAR
Full Full Full Full Full
Ln (Mission Distance X Foundation) -0.337***
(0.0887)
Ln (Population / MissionDistance) 0.373***
(0.1010)
Ln (Population X Years Active) 0.380***
Mission Distance (0.1060)
Ln (Mission Distance X River Distance) -0.00532***
(0.0015)
Mission Moved -0.0984*
(0.0585)
Constant 1.831 8.099 -17.38 25.40*** 0.186
(11.92) (9.97) (12.39) (7.39) (2.34)
GEO Controls YES YES YES YES YES
Observations 506 498 498 506 506
R-squared 0.51 0.51 0.55 0.388 0.873
Note: The table shows the coe�cient of the logarithm of distance to the nearest Jesuit interacted with year of
foundation, mean population and distance to the nearest river in Columns 1 to 4. Mission moved is a 0/1 for
whether or not the nearest Jesuit mission moved. The dependent variable is the logarithm of income in 2000
for Brazil and Paraguay. Geographic controls include distance to the nearest coast, distance to the nearest river,
altitude, temperature, area, rainfall, latitude and longitude. Please refer to the paper for units and additional details
of these variables. Estimation is by OLS. Robust standard errors in parentheses *** p<.01, ** p<.05, *p<.1
81

Table A.4. Missionary E�ect on Indigenous Assimilation: Marriage, Pop-ulation and Language in Brazil and Paraguay
1 2 3 4 5 6 7
Mixed Caboclo Percentage Percentage Guarani Spanish GUA & SPA
Marriage Marriage Catholic Indigenous Language Language Language
BRA 1890 BRA 1890 BRA 1890 BRA 2010 PAR 2012 PAR 2012 PAR 2012
Full Full Full Full Full Full Full
Mission Distance -0.0911*** -0.0401*** -0.0353* -0.302** 0.0218*** -0.0172*** -0.00778**
Robust SE (0.0175) (0.0096) (0.0185) (0.1360) (0.0066) (0.0063) (0.0038)
Bootstrap SE (0.0155) (0.0116) (0.0209)
Constant 158.0** 35.22 178.9*** 153.0*** -5.059 11.66 -8.521
(63.07) (31.83) (63.35) (46.73) (9.97) (8.59) (5.60)
GEO Controls YES YES YES NO YES YES YES
Fixed Effects NO NO NO NO YES YES YES
Observations 63 63 63 467 1928 1928 1928
R-squared 0.582 0.661 0.229 0.006 0.1273 0.1447 0.0291
Note: The table shows the coe�cient of distance to the nearest Jesuit mission in kilometers. The dependent variables
are the percentage of mixed and caboclo marriages in Brazil in 1890 in Columns 1 and 2 and percentage Catholic
in Column 3; percentage of indigenous population in 2010 in Column 4; and percentage of Guarani, Guarani and
Spanish, and Spanish speakers in Paraguay in 2012 in Columns 5 to 7. Geographic controls include area, altitude,
temperature and rainfall in Columns 1 to 3 and additionally distance to the nearest coast, distance to the nearest
river, latitude and longitude in Columns 4 to 7. Please refer to the paper for units and additional details of these
variables. Estimation is by OLS in Columns 1 to 4 and for a Probit model with state �xed e�ects in Columns 5
to 7 with errors clustered at the district level. Robust, bootstrap and clustered standard errors in parentheses ***
p<.01, ** p<.05, *p<.1
82