the missing pro ts of nations
TRANSCRIPT

The Missing Profits of Nations∗
Thomas Tørsløv (Kraka)Ludvig Wier (Danish Ministry of Finance)Gabriel Zucman (UC Berkeley and NBER)
August 10, 2021
Abstract
By exploiting new macroeconomic data known as foreign affiliates statistics, we showthat affiliates of foreign multinational firms are an order of magnitude more profitablethan local firms in a number of low-tax countries. Leveraging this differential profitability,we estimate that 36% of multinational profits are shifted to tax havens globally. U.S.multinationals shift twice as much profit as other multinationals relative to the size oftheir foreign earnings. We analyze how the location of corporate profits would change ifshifted profits were reallocated to their source countries. Domestic profits would increaseby about 20% in high-tax European Union countries, 10% in the United States, and5% in developing countries, while they would fall by 55% in tax havens. We provide anew international database of GDP, trade balances, and factor shares corrected for profitshifting. In contrast to the picture painted by official statistics, our results suggest thatthe corporate capital share has increased not only in North America but also in high-taxEuropean countries. Capital is making a comeback globally, but its rise is obscured by thetax-avoidance strategies of multinational companies.
∗Thomas Tørsløv: [email protected]; Ludvig Wier: [email protected]; Gabriel Zucman: [email protected]. We thank the Editor, five anonymous referees, Alan Auerbach, Johannes Becker, OlivierBlanchard, David Bradbury, Richard Bolwijn, Iain Campbell, Kimberly Clausing, Alex Cobham, Mihir Desai,Michael Devereux, Fritz Foley, Maya Forstater, Teresa Fort, Roger Gordon, Martin Hearson, Niels Johannesen,Petr Jansky, Michael Keen, Edward Kleinbard, Claus Kreiner, Paul Krugman, Gaetan Nicodeme, MitchellPetersen, Thomas Piketty, Nadine Riedel, Dani Rodrik, Emmanuel Saez, Juan Carlos Suarez Serrato, FelixTintelnot, John Van Reenen, Eric Zwick, and numerous seminar and conference participants for helpful com-ments and reactions. Zucman acknowledges financial support from the Stone Foundation, Arnold Ventures, andthe FRIPRO program of the Research Council of Norway. The authors retain sole responsibility for the viewsexpressed in this research. An appendix, data, and code are available online at http://missingprofits.world.

1 Introduction
One of the most striking development in global tax policy since the 1980s has been the decline
in corporate income tax rates. Between 1985 and 2018, the global average statutory corporate
tax rate fell by about half, from 49% to 24%. One reason for this decline is international tax
competition. By cutting their tax rates, countries can attract capital and profits from abroad
(see Keen and Konrad, 2013, for a survey). Yet despite the prominence of tax competition in the
academic literature and the public debate, we do not currently have comprehensive estimates of
how much profit each country loses or attracts because of international differences in corporate
tax rates.
Our paper attempts to fill this gap by drawing on new data. Since the beginning of the 2010s,
the statistical institutes of most developed countries—including the major tax havens—have
started releasing macroeconomic data known as foreign affiliates statistics. Following interna-
tional guidelines, these data record the wages and profits of foreign firms, defined as firms more
than 50%-owned by foreign shareholders (i.e., typically subsidiaries of foreign multinationals).
These statistics greatly improve our ability to observe where multinational companies operate
and book profits, in particular the amounts they book in tax havens.
Using these data, we propose a simple method to infer profit shifting by multinationals to
low-tax countries. By combining foreign affiliates statistics with national accounts data (which
cover all firms—foreign plus local—incorporated in a given country) we estimate the profitability
of foreign vs. local firms within each tax haven. This exercise reveals that foreign firms are
much more profitable than local firms in tax havens. Leveraging this differential profitability,
we provide bounds for the amount of profits shifted by multinationals in each haven. Using new
bilateral balance of payments data, we then re-allocate these shifted profits to the countries
where the profits have been made, or where the multinationals’ parents are headquartered.
The specificity of our approach—its global and bilateral nature—sheds light on key aspects of
globalization. First, it allows us to estimate comprehensive profit losses for individual countries.
For instance, we can estimate the amount of profits shifted out of, say, Germany, a computation
that requires global data since all multinationals (not only those headquartered in Germany)
can shift profits out of Germany. This improves our ability to quantify the losses of tax rev-
enue caused by profit shifting. Our global perspective also allows us to compare profit losses
for developed and developing economies—and to contrast these losses with the gains of tax
havens—providing insights into the redistributive effects of globalization. Third, we can com-
pare the profit-shifting intensity of multinationals headquartered in different countries (whether,
1

for instance, U.S. multinationals make a more extensive use of tax havens than European multi-
nationals), a relevant piece of information to study the determinants of corporate tax avoidance.
Last, our methodology generates bilateral estimates of profit shifting, i.e., amounts of profits
shifted out of, say, France to Luxembourg, or Germany to the Netherlands. This allows us to
address questions such as: are profits shifted out of European Union countries primarily shifted
to other EU countries (shifting that might be hard to regulate given EU treaties guaranteeing
the free movement of capital within the European Union) or to non-EU tax havens? And do
profits initially shifted to other EU countries ultimately end up in non-EU havens, with EU
havens acting as mere conduits?
Our main findings can be summarized as follows. In our preferred estimate we find that
36% of multinational profits—defined as profits made by multinationals outside of the country
where their parent is located—were shifted to tax havens globally in 2015. We establish that
U.S. multinationals shift comparatively more profits: in 2015, U.S. firms shifted more than
half of their multinational profits, as opposed to about a quarter for other multinationals. The
governments of high-tax European Union countries appear to be the prime losers of global profit
shifting, with a reduction in domestic profit of about 20%, as opposed to 10% in the United
States and 5% in developing countries. While most profit shifting out of the European Union is
done initially to EU tax havens, our bilateral data reveal that about half of the profits shifted out
of the European Union ultimately end up in non-EU tax havens. In sum: quantitatively a key
pattern that emerges from our analysis is large profit shifting out of EU high-tax countries, often
by U.S. multinationals, first to European tax havens such as Luxembourg or the Netherlands,
then eventually to non-EU offshore centers such as Bermuda. The governments of tax havens
derive sizable benefits from this phenomenon: by taxing the large amount of profits they attract
at low rates, they generate more tax revenue, as a fraction of their national income, than the
countries that have higher rates.
These findings have important implications for the measurement of headline economic in-
dicators and in turn for core issues in macroeconomics. The flip side of the profits shifted to
tax havens is that output, net exports, and profits recorded in non-haven countries are too low.
Adding back the profits shifted out of high-tax countries increases the corporate capital share
significantly. Because EU high-tax countries appear to be the most affected by profit shifting,
it is in these countries that the adjustment is the largest. In the official statistics of most EU
countries, the corporate capital share seems to have increased little, especially after removing
activities related to real estate (Gutierrez and Piton, 2020; Cette, Koehl and Philippon, 2019).
2

This has led to a view that the rise of the capital share is a North-American specificity, casting
doubts on most technological explanations for the decline of the labor share. Our findings,
by contrast, suggest that the rise of the capital share is more widespread: after correcting for
profit shifting, the capital share of corporate value added rose by about 4 points in high-tax
EU countries over the 1985–2015 period. This lends support to theories highlighting the role of
international trends like globalization and technological change—as opposed to country-specific
shocks—in the dynamic of factor shares, such as declining relative prices of capital (Karabar-
bounis and Neiman 2014), capital-biased technical change and automation (e.g., Acemoglu
and Restrepo 2018), the rise of super-star firms (Autor et al., 2020), or capital accumulation
(Piketty and Zucman, 2014). Capital is making a comeback globally, but its rise is obscured by
the tax-avoidance strategies of multinational companies.
Our analysis proceeds in three steps. We start by documenting a simple but striking fact:
in tax havens, foreign firms are hugely more profitable than local firms. More precisely, in
tax havens the ratio of pre-tax profits to wages is around 30%–40% for local firms, but it is
an order of magnitude larger for foreign firms. For example, foreign firms in Ireland have a
profits-to-wage ratio of 800%: for $1 of wage paid to Irish employees, foreign multinationals
book $8 in pre-tax profits in Ireland.1 This huge excess profitability of foreign firms is specific
to tax havens. In high-tax countries, foreign firms are slightly less profitable than local firms:
the profits to wages ratio is typically around 30%–40% for local firms as opposed to 20%–30%
for foreign firms.
In the second step of the analysis, we construct bounds for the amount of profit shifted into
each tax haven. The excess profitability of foreign firms relative to local firms in tax havens
could in principle be due to a number of factors: foreign firms in these countries may be more
capital intensive than local firms; they may operate in different sectors; they may be larger, or
more R&D intensive. Exploiting the most detailed foreign affiliates statistics available where
sectors, capital intensity, and R&D expenditures can be observed, and building on the literature
about multinational firms, we bound the excess profitability of foreign firms in havens that can
be attributed to true economic differences with local firms.
Because the excess profitability of foreign haven firms is huge, only a small fraction of it
turns out to be attributable to true economic differences with local haven firms. Differences
in capital intensity, in particular, cannot explain more than 10% of the excess profitability of
foreign haven firms, even under conservative assumptions about the elasticity of substitution
1This corresponds to a capital share of corporate value-added of 80%–90% in foreign firms operating inIreland, vs. around 25% in local Irish firms.
3

between capital and labor. Globally, our preferred estimate for the amount of profits shifted—
36% of multinational profits—is sizable, but it appears well founded empirically. We find the
same magnitudes using two fully independent methodologies and data sources: our benchmark
“excess profitability” methodology, based on the high profits-to-wage ratios of foreign haven
firms recorded in foreign affiliates statistics, and an “excess cross-border transactions” method-
ology, based on the high exports of services and receipts of intra-group interest recorded in the
balances of payments of tax havens.
In the third step of the analysis, we re-allocate the shifted profits to the countries where they
have been made, or to the countries where the multinationals’ ultimate parents are headquar-
tered. In both cases, we exploit new bilateral balance of payments data. To assess where the
shifted profits come from, we follow the origin of intra-group interest received by tax havens and
the destination of some of their exports, specifically those that have been found in the literature
to be conducive of profit shifting, such as exports of the right to use intellectual property and
management advice. In our second allocation, we follow the ultimate destination of the direct
investment income payments made by tax haven subsidiaries. About half of the profits globally
shifted to tax havens ultimately accrue to parents located in the United States and slightly more
than 25% to parents in the European Union. This allocation is highly relevant for policymakers,
since it makes it possible to assess the revenue potential of a minimum tax collected by each
parent country on the profits booked by its multinationals in tax havens—a minimum tax to
which more than 130 countries have agreed to in June 2021 (OECD, 2021).
The rest of this paper proceeds as follows. In Section 2 we relate our work to the literature.
Section 3 outlines our conceptual framework and methodology, and Section 4 describes the data.
We present our estimates of the amount of profits shifted to tax havens in Section 5, before
analyzing the implications of this phenomenon for the geography of global profits in Section 6.
Section 7 discusses our corrected estimates of factor shares and Section 8 concludes. This paper
is supplemented by an Online Appendix that enables the reader to reproduce all our estimates
step by step starting from publicly available data.
2 Related Literature
2.1 Microeconometric Estimates of Profit Shifting
A body of work studies profit shifting using accounting micro-data, collected in the Orbis
database of Bureau van Dijk (see Kalemli-Ozcan et al., 2015, for a presentation of these data).
4

Profit shifting is estimated by running regressions of the form:
log(πic) = α + β(τp − τc) + δF irmi + γCountryc + εic (1)
where πic denotes the pre-tax profits booked by company i in country c, τc the tax rate in
country c, τp the tax rate in the parent’s country (or the average tax rate of other subsidiaries),
and Firmi and Countryc firm and country controls.2 A positive β is interpreted as evidence of
profit shifting, and the global amount of shifted profits is extrapolated from the estimated β.
The OECD (2015) uses this methodology for its official estimate of the size of base erosion and
profit shifting (Johansson et al., 2017).
In contrast to this line of work, we rely on macro data capturing the profits booked in tax
havens, namely foreign affiliates statistics. The advantage of these macro data is that they
are more comprehensive than Orbis. To record the profits made by multinationals in their
various subsidiaries, Orbis relies on information in public business registries. However, in many
countries public registries either do not exist (e.g., Bermuda), or contain no income information
(e.g., United States, Switzerland). Profits booked by multinationals in these countries are not
visible in Orbis. By contrast, statistical authorities have access to much more information to
compile their foreign affiliates statistics, including private income statements and balance sheets.
To illustrate the limits of Orbis, Figure 1 compares the consolidated global profits of each
multinational in Orbis to the sum of its subsidiary-by-subsidiary profits. In 2012, only 17%
of the global profits of multinationals could be traced in Orbis. That is, 83% were booked in
subsidiaries unknown to Orbis, or for which no profits data was available. For example, Orbis
correctly reports that the worldwide consolidated profits of Apple were 55.3 billion euros in
2016. If one adds up all the profits recorded in Orbis by all of Apple’s subsidiaries throughout
the world, however, then one finds only 2.0 billion euros. None of the profits made by Apple in
the United States or in tax havens are visible.
Relatedly, Bilicka (2019) finds that accounting data underestimate the true size of profit
shifting outside of the United Kingdom relative to more comprehensive tax data. Comparing
reported taxable profits to assets for UK affiliates of foreign multinationals and comparable UK
firms with no affiliates abroad, Bilicka (2019) finds that foreign multinationals shifted about 50%
of their profits out of the UK during the period 2000–2014. Our findings (36% of multinational
2Heckemeyer and Overesch (2017) give an overview of 26 studies using this approach; see also de Mooij andEderveen (2008), Riedel (2018), Wier and Reynolds (2018), and Beer, de Mooij and Liu (2019). A number ofstudies (e.g., Egger et al. 2010) use the Bureau van Dijk Amadeus database, which is the European subset ofOrbis.
5

profits shifted to tax havens globally and 43% in our upper bound scenario) are consistent with
this order of magnitude.
2.2 Macroeconomic Estimates of Profit Shifting
A nascent literature takes a macro perspective to study profit shifting. Most of this literature
uses U.S. statistics and focuses on U.S. multinationals (Clausing, 2009, 2016; Gravelle, 2009;
Wright and Zucman, 2018; Guvenen et al., 2021).3 In this paper by contrast we take a global
perspective: we estimate profit shifting by all the world’s multinationals and the implications
of this phenomenon for each OECD country, the main emerging economies, and tax havens. A
global perspective is valuable to estimate profit shifting even in countries where detailed data
exist about the global operations of domestic multinationals, because both domestic and foreign
multinationals can shift profits out of any given country.
In the case of the United States, our results are consistent with the important study by
Guvenen et al. (2021) who estimate that $158.3 billion (0.9% of U.S. GDP) was shifted by
U.S. multinationals out of the United States in 2015, and an additional $3.5 billion by 127
technology-intensive multinationals headquartered outside of the United States. This lines up
well with our estimate of $143 billion (0.8% of GDP) in profit shifted out of the United States
by U.S. plus non-U.S. multinationals.
Two recent studies, Crivelli, de Mooij and Keen (2015) and Bolwijn et al. (2018), use global
macro data to study profit shifting. These studies do not rely on foreign affiliates statistics or
attempt to infer profit shifting from the differential profitability of foreign vs. local firms in tax
havens, the key features of our methodology. Crivelli, de Mooij and Keen (2015) infer revenue
losses due to tax avoidance from the correlation between corporate tax revenue collected and
the statutory tax rates of other countries in a panel model.4 Bolwijn et al. (2018) rely on
the foreign direct investment statistics of non-haven countries, while our work focuses on what
happens within tax havens.5 An advantage of our approach is that it produces estimates of
profit shifting that can be tracked by policymakers annually. Moreover, the bilateral balance
of payments we use enable us to provide bilateral estimates of profit shifting, a key input to
calibrate quantitative models of multinational production with profit shifting (e.g., Wang, 2018).
3See also Grubert (2013) Dowd, Landefeld and Moore (2017) and De Simone, Mills and Stomberg (2017) forstudies of profit shifting by U.S. multinationals using IRS data.
4Using their methodology, Cobham and Jansky (2018) estimate country-level tax revenue losses.5Our estimate of the global amount of profits shifted offshore ($616 in our preferred scenario in 2015) is
comparable in size to the one obtained by Bolwijn et al. (2018), $700 billion in 2012. See Appendix Section Dfor a detailed comparison.
6

3 Conceptual Framework and Methodology
This Section presents our baseline methodology to infer profit shifting. We define our key
statistics of interest, present the assumptions underlying our approach, and validate it in the
case of U.S. multinationals for which particularly detailed data are available.
3.1 Profitability Ratios
Definition of profitability. Throughout this article our measure of profitability is the profits-
to-wage ratio. At the country level, we denote it by π and define it as follows. Using standard
notations, we denote by Y the corporate output (or value-added) of a country, obtained by
combining effective labor AL and capital K.6 We include in the corporate sector all resident
corporations, both non-financial and financial. Part of corporate output is paid to workers; the
rest, operating surplus, accrues to the owners of capital: Y = F (K,AL) = rK + wL. In this
framework, r includes both the normal return to corporate capital and any above-normal return
(i.e., r is not necessarily equal to the marginal product of capital). The capital share of corporate
output is α = rK/Y and the ratio of operating surplus to wages is α/(1−α). Corporations pay
p percent of their operating surplus rK in net interest. We define (pre-tax) corporate profits as
(1−p)·rK. The profit-to-wage ratio π measures the amount of profit made by resident firms per
dollar of wage paid: π = (1 − p) · α/(1 − α).7 We subtract net interest paid from corporations’
operating surplus because interest payments are typically deductible from the corporate tax base
while interest received (e.g., by banks) is typically taxable. At the country level, net interest
paid by corporations is generally small (interest paid by non-financial corporations is offset by
interest received by financial corporations), so π is usually close to α/(1−α). We also subtract
capital depreciation from profits, because depreciation is deductible from taxable profits. Thus
Y , α, r, and π are all net of capital depreciation. This paper focuses on the corporate sector:
we do not attempt to measure factor shares or profitability in non-corporate businesses, which
are not subject to the corporate income tax.
Profitability for foreign vs. local firms. We define the profits-to-wage ratio of foreign
firms (πf ) and local firms (πl) analogously to π. That is, πf is equal to the pre-tax profits (after
net interest payments) made by foreign firms divided by the wages paid by these firms:
6Here and in what follows we consider output at factor cost, i.e., before indirect taxes.7Our measure of wage always include non-wage employee compensation (such as retirement benefits, health
benefits, payroll taxes, etc.). That is, “wage” in this article always refers to what is called “employee compen-sation” in the national accounts (SNA code D.1).
7

πf = (1 − pf ) · αf/(1 − αf ) (2)
where αf is the net-of-depreciation capital share of the net value-added of foreign firms, and
1 − pf net interest received relative to operating surplus. In the data (described in Section 4.2
below), following international guidelines foreign firms include all firms where foreign investors
own more than 50% of shares with voting rights. This condition is sufficient but not necessary:
there are a few other ways firms can be classified as “foreign-controlled” (see Eurostat, 2012).
Local firms are all firms that are not foreign. In addition to domestic firms with no foreign
operations, local firms include domestic multinationals. By definition, at the country level
π = s · πf + (1 − s) · πl, where s is the share of wages paid by foreign firms.
We are mainly interested in how πf differs from πl within tax havens. The recorded πf in
tax havens reflects inward profit shifting and other factors (including all economic determinants
of true profitability):
πf = f(shift, other)
There are three forms of profit shifting (see Heckemeyer and Overesch, 2017, for a survey),
and each affects the recorded profit-to-wage ratio. First, multinational groups can manipulate
intra-group exports and import prices: subsidiaries in high-tax countries can try to export goods
and services at low prices to related firms in low-tax countries, and import from them at high
prices.8 Such transfer price manipulations increase the recorded πf in tax havens. Second,
multinationals can shift profits using intra-group interest payments (see, e.g., Huizinga, Laeven,
and Nicodeme, 2008): affiliates in high-tax countries can borrow money (potentially at relatively
high interest rates) from affiliates in low-tax countries, which again increase πf in tax havens.
Last, multinationals can move intangibles—such as trademarks, patents, logos, algorithms, or
financial portfolios—produced or managed in high-tax countries to affiliates in low-tax coun-
tries.9 These affiliates then receive royalties, interest, or payments from final customers, which
boost πf .
Definition of tax havens. We include 41 countries and territories in our list of tax havens:
5 OECD countries (Belgium, Ireland, Luxembourg, Netherlands, and Switzerland) and 36 non-
8See, e.g., Bernard, Jensen and Schott (2006); Vicard (2015); Cristea and Nguyen (2016); Liu, Schmidt-Eisenlohr and Guo (2020).
9See Faulkender et al. (2017) for evidence suggestive of profit shifting by U.S. multinationals through therelocation of intangibles in low-tax countries. See Langenmayr and Reiter (2017) for evidence of profit shiftingby German banks through the strategic relocation of financial portfolios in tax havens.
8

OECD countries or territories.10 Our list of tax havens is taken from Hines and Rice (1994), with
the additional inclusion of the Netherlands, Belgium, and Puerto Rico. The Netherlands was
not considered as a tax haven by Hines and Rice (1994) because U.S. multinationals reported
paying high tax rates there in 1982, but their effective tax rate has fallen since then to 12%
in 2015 (see Appendix Table A.11). Belgium is a borderline case: it is a conduit country that
receives large flows of cross-border payments found in the literature to be conducive of profit
shifting and is sometimes considered a tax haven (e.g., because of the deductibility of notional
interest on equity), although its effective tax rate (19%) is the same as the world average in
2015. Belgium accounts for 2% of our baseline estimate of the amount of profit shifted globally.
Excluding it from our list of tax haven would not make any significant difference to our results.
Puerto Rico is a U.S. territory which is not subject to the U.S. federal corporate income tax.
A number of papers study income shifting by U.S. multinationals to Puerto Rico (e.g., Grubert
and Slemrod, 1998; Suarez-Serrato, 2019). Puerto Rico is not part of the United States for
GDP statistics. As a result, if a U.S. multinational shifts profit to this territory, this shifting
reduces the officially measured U.S. GDP and capital share of U.S. corporate value added, just
as when a U.S. multinational shifts profit to Bermuda. Because we are interested in how profit
shifting affects the measurement of GDP and the capital share, including Puerto Rico as a haven
separate from the United States is pertinent for our purposes.
To illustrate our classification choices, Figure 2 plots the difference between the profits-to-
wage ratio of foreign firms (πf ) and local firm (πl) against the effective corporate income tax
rate for the countries and territories we consider in our analysis (tax havens, OECD countries,
and a number of developing economies). The countries and territories included in our list of tax
havens (in red) have both low effective corporate income tax rates (below 15% except in two
cases) and πf > πl, often hugely so. By contrast, the countries we classify as non-havens have
πf ≤ πl, with the exception of a small number of borderline cases (in blue). Because in these
countries the excess of πf over πl is relatively small, including these countries in our list of tax
havens would not materially affect our results.
10Andorra, Anguilla, Antigua and Barbuda, Aruba, The Bahamas, Bahrain, Barbados, Belize, Bermuda, theBritish Virgin Islands, the Cayman Islands, Cyprus, Gibraltar, Grenada, Guernsey, Hong Kong, the Isle of Man,Jersey, Lebanon, Liechtenstein, Macau, Malta, Marshall Islands, Mauritius, Monaco, the Netherlands Antilles,Panama, Puerto Rico, Samoa, Seychelles, Singapore, St. Kitts and Nevis, St. Lucia, St. Vincent & Grenadines,Turks and Caicos, Vanuatu.
9

3.2 Inferring Profit Shifting: Baseline Assumptions
To form our baseline estimate of the amount of profits shifted to tax havens, we set πf equal
to the observed πl in each tax haven. That is, we compute the aggregate amount of profit
that foreign firms in, e.g., Ireland would make if they were as profitable as local Irish firms,
and similarly in each other tax haven. One merit of this procedure is that it is simple and
transparent. Here we explain the conditions under which it delivers accurate estimates of profit
shifting. Section 3.3 provides support for this procedure and Section 5.2 relaxes our assumptions
to construct bounds for the amount of profit shifted into each tax haven.
Assume that there are two types of firms in tax havens, local and foreign.11 Both types of
firms face the same homogeneous labor supply but different capital supplies (for foreign firms
capital is supplied by the rest of the world; for local firms it is supplied domestically). In a world
without profit shifting, the profit-to-wage ratio of foreign firms πf is equal to capital intensity
in the foreign sector times the rate of return to capital rf ,
πf =( KwL
)f·MPKf · (1 + µf )︸ ︷︷ ︸
=rf
(3)
where MPK denotes the marginal product of capital and µ any return to capital ownership
in excess (or below) the marginal product of capital, reflecting market power in the factor market
or in the product market.
Three assumptions are sufficient to infer that within tax havens, the excess of πf over πl
reflects profit shifting: (i) the elasticity of substitution between capital and labor is equal to 1
in both local and foreign firms, (ii) the degree of competition is the same in foreign and local
firms (same µ), (iii) profit shifting does not affect the reported profitability of local firms.
Assumption 1: Elasticity of substitution σ = 1. As is well known, with an elasticity of
substitution between capital and labor equal to 1 (Cobb-Douglas production), capital intensity
does not affect the capital share, because any increase in the capital stock is perfectly offset by
a corresponding fall in the marginal product of capital. This means that although local and
foreign haven firms may have different capital intensities (e.g., foreign firms may be more capital
intensive, as multinationals may chose to locate capital in low-tax countries), if σ = 1 these
differences do not create a gap between πl and πf . For example, if both local and foreign firms
11To simplify the exposition, in this sub-section we disregard interest payments (pf in Equation 2 is assumedto be zero). Results discussed in Section 5.1 show that interest income plays a minor role in profit shiftingglobally.
10

have the same Cobb-Douglas production function Y = Kα(AL)1−α, competition is perfect, and
the Cobb-Douglas coefficient α = 25%, then both types of firms have π = 33% no matter what
their capital stock is, and any deviation of the recorded profits-to-wage ratio from this value
reflects profit shifting. Importantly, we do not need to assume that foreign and local firms have
the same capital intensity.
In the more general case where firms have a constant elasticity of substitution production
function, the effect of the capital stock on the profits-to-wage ratio is ambiguous. The profits-
to-wage ratio varies with the capital stock depending on the value of the capital-labor elasticity
of substitution σ. If σ > 1, then firms with a high capital intensity have high profit-to-wage
ratios. Conversely, if σ < 1, then firms with high capital intensity have low π, as the marginal
product of capital becomes very low. In Section 5.2 we consider a range of assumptions about
the value of the elasticity of substitution σ to infer what fraction of the high πf of tax havens
can be attributed to high capital intensities.
Assumption 2: Same degree of competition for foreign & local firms within coun-
tries. Our baseline estimates assume that the degree of competition (on both the factor and the
product market) is the same for foreign firms and local firms within tax havens. Two remarks
are in order. First, we do not need to assume perfect competition. For example, we allow for
the possibility that corporations located in tax havens may have structurally high profitability
due, e.g., to rents generated by financial secrecy or lax regulation.12 However to the extent
that deviations from perfect competition exist, they must be the same for foreign and local
firms. Second, we do not assume that the degree of competition is the same across countries.
Our methodology allows for the possibility that there may be more competition in high-income
havens (such as Switzerland) than in lower-income havens (such as Puerto Rico).
Assumption 3: No inward shifting in local sector. Last, we assume that the reported
profitability of local firms in tax havens πl is not inflated by inward profit shifting. Local haven
firms include companies that are not part of a multinational group, but also multinationals that
are headquartered in tax havens. The latter might shift profits inward. Our baseline procedure
assumes that such shifting, if it exists, has negligible effect on πl. Ideally we would like to be
able to compare the foreign firms of tax havens to local firms without foreign affiliates. Existing
foreign affiliates statistics, however, do not currently make it possible to decompose local firms
into firms with affiliates abroad vs. firms with only domestic operations.
12Relatedly, we allow for a real effect of profit shifting on the economic activity in tax havens (e.g., higherdemand for legal or accounting services), to the extent that this demand benefits both local and foreign firms.
11

In practice, there are a number of reasons why these assumptions may not hold. The
elasticity of substitution may differ from 1. Foreign firms in tax havens may operate in different
sectors with different degrees of competition than local haven firms; they may be larger, have
more market power, extract larger rents, and be more R&D intensive.
3.3 Validation Test of Baseline Methodology
We provide support for our baseline methodology by applying it to the case of U.S. multination-
als. The Bureau of Economic Analysis has compiled outward foreign affiliates statistics, based
on annual surveys of the foreign operations of U.S. multinationals, since 1982. Benchmark
surveys are conducted every five years. Detailed tabulations by country are available annually
since 1982 and by country × industry since 1994. Earlier surveys were conducted in 1966, 1970,
and 1977. We collected all these data to study the evolution of the profits-to-wage ratio of U.S.
affiliates. We estimate specifications of the following model:
πcti = αt + β1tt · ln(Kcti) + β2tt · ln(RDcti) + γtt ·Xct + δtt ·Haven+ εcti (4)
where πcti denotes the profits-to-wage ratio, Kcti the net plant, property and equipment, and
RDcti the research and development expenditures of affiliates in country or territory c, in year t,
and industry i; Xct denotes time-varying country controls (GDP in US$ using purchasing power
parity exchange rates, and population); Haven is a dummy for being in our list of tax havens;
and αt are year fixed effects. The coefficient of interest, δt, captures the excess profitability
of subsidiaries in tax havens relative to subsidiaries in non-havens in year t. Controlling for
economic development in host countries (GDP and population) ensures that results are not
confounded by the fact that the markups of U.S. multinationals may be lower in high-income
countries (Keller and Yeaple, 2020). Capital stocks, research and development, and country
controls are all interacted with year dummies to flexibly capture any potential change in the
shape of the production function or in how country characteristics affect profitability. All
regressions are weighted by compensation of employees.
To visualize the results, we first plot the evolution of the raw profits-to-wage ratio of haven
and non-haven affiliates, without controls. We then show the profits-to-wage ratio of haven
affiliates obtained by adding the estimated δt to the raw profits-to-wage ratio of non-haven
affiliates, for three different specifications of equation 4. In the first specification, equation 4 is
estimated at the country level and without controlling for R&D expenditures (which are only
observed in benchmark survey years, 1999, 2004, 2009, and 2014). This allows us to go as far
12

back as 1982. We then move to the country × industry level. Our second specification still
excludes R&D expenditures but include industry × year fixed effects. The last specification
includes industry × year fixed effects and R&D expenditures. Figure 3 shows the results. A
number of remarkable results emerge.
Starting with the raw series, we can see that the haven affiliates of U.S. multinationals are
an order of magnitude more profitable than their non-haven affiliates. In 2015, the profits-to-
wage ratio of haven affiliates is close to 350%, as opposed to about 50% for non-haven affiliates.
In the 1960s and 1970s, the profitability of both types of affiliates was the same. Since then,
the profitability of haven affiliates has surged while that of non-haven affiliates has flatlined.
Consistent with the patterns displayed in Figure 2 aboves for all (U.S. and non U.S.) affiliates,
U.S. affiliates in Ireland, Luxembourg, Bermuda, and the Caribbean tax havens are particularly
profitable, with profits-to-wage ratios above 500%.
Second, the excess profitability of haven affiliates remains when adding controls in all speci-
fications. This implies that this excess profitability cannot be explained by differences in capital
intensity, R&D expenditures, productivity in home countries, or industry composition effects.
In particular, adding industry × year fixed effects has relatively little effects on the excess prof-
itability of haven affiliates. This is consistent with Appendix Figure L.1, which shows that U.S.
affiliates in tax havens have a profit-to-wage ratio one order of magnitude larger than U.S. non-
haven affiliates within sector. Profit shifting is not limited to just a few sectors of the economy,
such as information and communication technology: it appears to be an across-the-board phe-
nomenon.13 Similarly, controlling for R&D expenditures has little effect on profitability. This
is consistent with the counts of employees engaged in R&D reported in the BEA benchmark
surveys. Only 8% of the R&D workers of affiliates of U.S multinationals were employed in tax
havens in 2014, as opposed to 92% in non-haven countries. The high profitability of haven affil-
iates cannot be explained by local R&D, which by and large is conducted in high-tax countries.
Altogether these results lend support to our baseline methodology.
3.4 How we Allocate the Shifted Profits
Allocation to source countries. We allocate the shifted profits to the countries where they
have been made by tracking the cross-border payments conducive of profit shifting received by
13There are several potential explanations for this finding. Firms across all industries may shift profits byusing intra-group trade and borrowing. It could also be that multinationals in all sectors can create firm-specificintangibles (such as logos), book these in low-tax places, and charge royalties to high-tax subsidiaries for theright to use these intangibles.
13

tax havens, proceeding in three steps. We first define high-risk service exports x as the exports
of the specific types of service found in the literature to be most conducive of profit shifting:
exports of the rights to use intellectual property (patents and trademarks), headquarter services
(administration, management and advertising), information and communication technology ser-
vices, and financial and insurance services (Hebous and Johannesen, 2016). We disregard goods
exports, which according to the literature seem to be less important than other profit shifting
channels (see Appendix D). Using bilateral balances of payments, we observe the amounts xij
of high-risk services exported from haven i to country j. Second, we compute excess high-risk
exports xij from i to j as the difference between the recorded and the predicted value of such
exports, where predicted exports are projected based on the gross national income of haven i.14
Third, we similarly compute the excess intra-group interest gij received by haven i from country
j. Excess cross-border transactions tij are computed as xij + gij and the shifted profits received
by haven i are allocated to source countries j proportionally to tij.
For a given haven i, summing the excess cross-border transactions tij across destination
countries j gives an estimate of profits shifted into i which is independent of our baseline
estimate (based on the excess profitability πf − πl in haven i). As we shall see in Section 5.1,
these two estimates, despite being based on different data, line up well at the haven level.
Our procedure to allocate shifted profits to source countries is consistent with how profit
shifting is perceived by policy-makers. Many countries have anti-avoidance policies whereby
specific cross-border transactions (typically certain service exports and interest flows) are pre-
sumed to be motivated by tax avoidance and taxed accordingly.15 Our approach does not
involve the use of an apportionment formula. We keep the current international tax system
of subsidiary-by-subsidiary accounting and arm’s length pricing as is, and consider how the
geography of global profits would change if incentives to shift profits disappeared, for instance
if all countries applied the same effective corporate income tax rate. We do not, however, view
our measurements as the counterfactual outcome of a perfect international tax harmonization,
which would generate endogenous responses by firms which we would need to model.16
14Predicted high-risk service exports from i to j are computed as xij · (xEU/GNIEU )/(xi/GNIi) wherexEU/GNIEU is the average export of high-risk services as a fraction of gross national income in non-haven EUcountries, and GNIi is haven’s i gross national income.
15For example, residence countries of multinational companies typically have controlled foreign company rulesthat tax certain forms of income (such as royalties and interest) reported in havens by their multinationals. In2017, the United States introduced a “base-erosion anti-abuse tax” (BEAT) that presumes that certain servicestransactions by multinational firms with related parties are motivated by tax avoidance.
16Another approach to allocate the shifted profits would involve trying to figure where production has “truly”taken place. However in many cases, it is impossible to determine where production takes place (e.g., the creationof intangibles occurs through the cooperation and interaction of subsidiaries in various countries). See Devereux
14

Our procedure to allocate shifted profits to source countries is also consistent with Clausing
(2009), who estimates the fraction of U.S. multinationals’ offshore profits which is shifted out
of the United States by apportioning these profits proportionally to the amount of affiliate
intra-firm transactions that occur with the United States.17
Allocation to parent countries. We also allocate shifted profits to the countries where
the ultimate parents of haven subsidiaries are incorporated. In effect, this allocation tracks the
location of the parents who receive dividends paid by haven subsidiaries or to whom the retained
earnings of these subsidiaries accrue. To do so, we use the bilateral direct investment statistics
on an ultimate ownership basis compiled by Damgaard and Elkjaer (2017). This allocation
allows us to study whether, for instance, U.S. multinationals make a more extensive use of tax
havens than E.U. multinationals.
4 Data Sources and Global Summary Statistics
This section describes our three main data sources: national accounts data, foreign affiliates
statistics, and balance of payments data. All the data sources, references and step-by-step
computations are described in a detailed manner in Appendix A (national accounts and foreign
affiliate statistics) and B (balance of payments data); here we focus on the main conceptual and
practical issues.
4.1 National Accounts Data
We compute π in all tax havens, all OECD countries, and the main developing countries using
harmonized national accounts data that follow the 2008 System of National Accounts (United
Nations, 2009). The basic data source is the OECD’s detailed national accounts by sector (Table
14A). This source covers all OECD countries (which includes prominent corporate tax havens:
Ireland, Luxembourg, Netherlands, Belgium, and Switzerland) and a number of developing non-
OECD countries (Brazil, China, Colombia, Costa Rica, India, Russia, and South Africa). We
extend the OECD database to non-OECD tax havens (such as Singapore, Hong Kong, and
Puerto Rico) by manually collecting the official national accounts published by tax havens’
statistical institutes and central banks.
and Vella (2017) for a discussion.17We generalize this approach in three ways: (i) we apportion the profits shifted by all (not only U.S.)
multinationals; (ii) we use balance of payments data which capture all cross-border transactions (not onlytransactions within divisions of multinationals); (iii) we focus on the transactions identified in the literature asbeing particularly conducive of shifting.
15

The OECD national accounts include the inputs needed to compute the profits-to-wage
ratio π: corporate operating surplus rK, net interest payments p, and wages paid wL, for both
financial and non-financial corporations. A few countries only provide gross-of-depreciation
operating surplus series, in which case we impute depreciation based on the average depreciation
rates (as a percent of corporate value-added) observed in OECD and non-OECD countries
separately.18 Some countries also do not isolate the corporate sector from other sectors of the
economy (government and households). In that case, we impute the share of domestic wages paid
by corporations, also based on the average share observed in OECD and non-OECD countries.19
4.2 Foreign Affiliates Statistics
We compute the profitability of foreign firms (πf ) using foreign affiliates statistics (FATS) dis-
seminated by Eurostat, the OECD, and national statistical agencies. These statistics are based
on exhaustive or quasi-exhaustive census-type surveys of multinational enterprises. There are
both inward and outward FATS. The inward FATS of, say, France record the value-added Y ,
operating surplus rK, compensation of employees wL (among other indicators) of foreign firms
operating in France and are tabulated by country of the foreign parent company.20 The out-
ward FATS of France record these same statistics but for the affiliates of French multinationals
operating abroad, and are tabulated by country of affiliate.21 Firms report confidentially to
domestic statistical authorities, which then publish tabulated statistics.
Once we have π (based on national accounts data) and πf (based on inward FATS), we
compute the profitability of local firms πl as a residual using the fact that π = s · πf + (1 −s) · πl, where s is the share of wages paid by foreign firms. This computation delivers accurate
results because following international guidelines (Eurostat, 2012), variables in foreign affiliates
statistics are defined and constructed just like in the national accounts, the only difference being
that inward FATS only capture foreign-controlled firms, while the national accounts capture
18See Appendix Section A.2.2. Capital depreciation amounts to around 15% of corporate gross value-addedwith relatively little variation across countries, see Appendix Table A.2.
19See Appendix Section A.2.1 and Appendix Table A.1. By definition all profits originate from the corporatesector so generally speaking no imputation is required for profits (see, however, Section 4.2 below for the caseof Ireland, Netherlands, and Luxembourg).
20Other indicators include, e.g., turnover, number of employees, investments flows, R&D expenditure, and insome countries (such as the United States) tangible capital stocks. When capital stocks are not available, weestimate them by cumulating past investment flows; see Appendix E.
21This is in contrast to direct investment income statistics that are tabulated by country of the immediatecounterpart. For instance, if a French parent owns a German affiliate through a holding company in Luxembourg,direct investment income received by the French parent is recorded as coming from Luxembourg in the Frenchbalance of payment (OECD 2008, Paragraph 218). FATS, by contrast, are tabulated by country of affiliates’primary activity. In the above example, profits are recorded as made in Germany (not Luxembourg).
16

all resident corporations. We have checked that the residual πl is reliable: the labor share
in the local sector is consistent with available estimates of the corporate labor share (e.g.,
Karabarbounis and Neiman, 2014; Cette, Koehl and Philippon, 2019; Gutierrez and Piton,
2020); see Appendix Table A.4. A number of additional points are worth noting about foreign
affiliates statistics.
Double-counting issues. Although in most European countries the publication of foreign
affiliates statistics started only around 2010, as we have seen in Section 3.3 in the United
States outward FATS (called “Activities of US Multinational Enterprises”) have been published
annually since 1982 by the Bureau of Economic Analysis (BEA).
A concern with some of these BEA data is that they double-count foreign income (Blouin and
Robinson, 2019). More precisely, “net income” as reported in the BEA Income Statement tables
(D1–D13) double-counts the income of US affiliates going through chains of holding companies.
However, we do not use “net income” in this paper. We use the BEA Value Added tables
(F1–F9), which are the tables that report our statistics of interest as defined in Section 3.1: the
value-added Y , employee compensation wL, operating surplus rK, net interest paid p · rK, and
pre-tax profits (1− p) · rK of the majority-owned affiliates of US multinationals abroad (always
net of depreciation). Pre-tax profit in the BEA Value Added Tables (called “profit-type return”
by the BEA) does not double-count profits, because in contrast to “net income” it does not
count as profit equity income received. The foreign affiliates statistics compiled internationally
and used in this paper are the analogue of the BEA Value Added Tables. Pre-tax profit in these
statistics excludes equity income received and does not-double count profits.22
Imputations for missing countries. The main OECD economies including key havens (such
as Ireland, Luxembourg, the Netherlands, and Switzerland) publish foreign affiliates statistics.
For these countries, we compute πf using their inward FATS. For the countries that do not
publish FATS yet (which is the case for smaller, non-OECD havens, e.g., Bermuda, the Cayman
Islands, Hong Kong), we impute the profits and wages of foreign firms in two steps.
First, we estimate the pre-tax profits of foreign firms using the amount of inward direct
investment income reported in balance of payments statistics. Almost all countries and ter-
ritories publish direct investment statistics (disseminated by the IMF), which follow common
international guidelines codified in OECD (2008). Direct investment income is closely related
22Paragraph 1.3.4 of the Eurostat (2012) FATS manual states: “Income and expenditure classified as financialin company accounts according to the 4th Accounting Directive (78/660) is excluded from value added.”
17

to the pre-tax profits of foreign firms studied in this paper. Direct investment income is the
net-of-depreciation, net-of-corporate income tax profits of firms that are more than 10% owned
by foreign investors, pro-rated by the ownership stake of the foreign investor. Pre-tax profits
in FATS is the net-of-depreciation, gross-of-corporate-income-tax profit of firms that are more
than 50% owned by foreign investors, with no pro-rating. Wright and Zucman (2018) present a
detailed comparison in the U.S. case showing that both line up closely.23 When the amounts of
inward direct investment income reported by tax havens are lower than the mirror amounts of
outward income reported by OECD and EU countries, we correct the haven data so that they
match the partner countries’.24
Second, we estimate the wages paid by foreign firms by applying the wage/profit ratio seen
in the outward FATS of counterpart countries. We rely on the outward FATS of the United
States which provide data on the foreign operations of US multinationals in small tax havens
in isolation, such as Barbados, Bermuda, and Panama. We have checked that our procedure
closely approximates the true amount of foreign profits and wages by implementing it for the
sample of tax havens that publish inward FATS.
Bilateral discrepancies. If foreign affiliates statistics were perfect, the inward FATS of host
countries (where affiliates are located) would be fully consistent with the mirror outwards FATS
of partner countries (where parents are headquartered). We conducted a systematic comparison
of the available data to assess the consistency of existing FATS.25 While inward and outward
data are generally consistent, there is one notable discrepancy. In the inward FATS of European
tax havens—most importantly Ireland, the Netherlands, and Luxembourg—one finds less profit
made by US affiliates than in the mirror outwards FATS of the United States. A comparable
gap is observed in bilateral balance of payments data, where less direct investment income is
paid to the United States by affiliates located in Ireland, Netherlands, and Luxembourg than
received by the United States from these havens.
There are two possible reasons for this discrepancy. First, European tax havens may under-
23For instance in 2014 (the latest benchmark year for U.S. outward FATS), after-tax profit in the U.S. outwardFATS is $421.1 while direct investment equity income is $447.8 billion (Wright and Zucman, 2018, AppendixTable A.1, cols. 1 and 4).
24For instance, the Cayman Islands excludes the offshore sector from its balance of payments statistics, leadingto inward direct investment income that is below the outward direct investment income earned in the CaymanIslands by OECD and EU countries. We replace the inward data reported by the Cayman Islands by the mirroroutward data reported by OECD and EU countries; see Appendix Section A.3 for a step-by-step description ofthese computations.
25See Appendix A.4.1 (results summarized in Appendix Table A.8) and Appendix Section B.3.3 (resultssummarized in Appendix Table B.11).
18

estimate the profits that affiliates of US firms book in their territory. These countries may miss
some of the profits booked in special purpose entities due to a lack of comprehensive enough
corporate registries, non-response to surveys, or other data issues (Angulo and Hierro, 2017;
Damgaard and Elkjaer, 2017). Alternatively, the United States may overestimate the profits
booked by its multinationals in European tax havens. For example, U.S. statisticians may
wrongly assign to Ireland profits that in fact have been booked elsewhere (CSO, 2016).
To investigate the relative reliability of the data reported by the United States, we compare
outward U.S. investments in non-havens (as reported by the United States) to inward invest-
ments from the United States in non-havens (as reported by these countries). As shown by
Appendix Figure N.4, profits recorded by the United States abroad match the data reported
by partner non-haven countries.This suggests that the investment data reported by the United
States are generally reliable. In our central scenario, we therefore upgrade the inward data of
tax havens so that they match the counterpart outward data reported by the United States.
Our procedure ensures that global inward investment income matches global outward invest-
ment income.26 Section 5.2 shows how taking the haven data at face value affects our estimates,
and Section A of the Data Appendix discusses alternative corrections.
Summary statistics. Table 1 presents our database of corporate profits by showing its global
totals. In 2015, global gross value-added (i.e., global GDP) reached $75 trillion and global net
value-added (i.e., after capital depreciation) about $63 trillion. About 54% of global net value-
added was produced by corporations; the rest was produced by governments, households, and
non-corporate businesses. Within corporations, the capital share of net value-added was about
1/3 and the labor share about 2/3. Out of the $11.5 trillion in net-of-depreciation corporate
profits, close to 15% ($1.7 trillion) were made in foreign firms. This $1.7 trillion number—what
we call “multinational profits”—includes all the profits made by, say, Apple in France, Germany,
Ireland, Jersey, etc., but not by Apple in the United States where its headquarter is located.
We estimate that out of these $1.7 trillion in multinational profits, 36% (about $600 billion)
were shifted to tax havens.
26If one takes the inward investment data reported by tax havens at face value, then the profits of US affiliatesabroad recorded by US statisticians in all foreign countries combined (as measured in the US balance of payments)exceed the profits of US affiliates recorded by all foreign countries combined (as measured in their balances ofpayments); see Appendix Figure A.14. In turn, this imbalance is the main driver of the $200 billion imbalancein global direct investment income recorded in the world balance of payments by the IMF in 2015 (AppendixFigure B.3b). As we show in Appendix B by leveraging the bilateral direct investment income data of all theworld’s countries, the bulk of this global direct investment income gap comes from missing profits of US affiliatesin inward statistics.
19

4.3 Bilateral Balances of Payments
To allocate of the shifted profits to source countries, we rely on the bilateral balances of pay-
ments disseminated by the IMF and Eurostat. Following the adoption of the 6th edition of
the IMF (2009) Balance of Payments Manual, most countries have started publishing bilateral
balances of payment including bilateral service trade flows by type of service, and bilateral for-
eign direct investment income (including bilateral intra-group interest payments and receipts).
Among tax havens, the data are particularly good for Switzerland and the European Union tax
havens (Ireland, Luxembourg, Belgium, Netherlands, Malta, and Cyprus) which must report
harmonized statistics to Eurostat.
When two estimates of the same haven-to non-haven flow are available (e.g., exports of
services from Luxembourg to Germany as recorded by Luxembourg, and imports of services
by Germany from Luxembourg as recorded by Germany), we use the statistics reported by
tax havens, because the bilateral data reported by tax havens tend to be more comprehensive
than those recorded by counterpart countries. As shown in Appendix B, the service exports
recorded by the 6 E.U. tax havens (Ireland, Luxembourg, Netherlands, Belgium, Malta, Cyprus)
to the 22 non-haven E.U. countries exceed the recorded imports by more than 30%. One
likely explanation for this gap is that importers’ data miss (at least some of) the services that
are exported by tax-haven corporations directly to foreign customers, such as digital music
subscriptions or ride-sharing services. There is evidence that the typical business structure of
digital services multinationals involves shifting intellectual property to tax haven subsidiaries
and then directly selling services to final customers without involving any non-haven subsidiary
(see, e.g., Pomeroy, 2016). The associated service flows seem at this stage better captured in
the tax havens’ trade statistics than in the customer countries’ statistics.27
5 Estimates of Profits Shifted to Tax Havens
We now present our results on the amount of profit shifted to tax havens. We start by discussing
our baseline results before bounding these estimates.
27When a firm incorporated in Luxembourg directly exports digital services to French customers withoutgoing through a French subsidiary, French statistical authorities cannot rely on corporate income statementsto capture such flows, and have to use other—typically less comprehensive—data sources, such as householdconsumption surveys. Beginning 2014, value-added taxes have started to be imposed in France (and other E.U.countries) on direct foreign-business-to-consumer sales. In principle, VAT returns could be used as inputs tobetter estimate French imports of services. Looking forward, systematically using VAT returns could help fixthe imports-exports service mismatch between havens and non-havens countries.
20

5.1 Baseline Estimates
Profitability in local vs. foreign firms Figure 4 displays our key statistics of interest: the
profits-to-wage ratios for foreign firms (πf ) and local firms (πl). A striking finding emerges:
foreign firms in tax havens are an order of magnitude more profitable than local firms in tax
havens. The reported profitability of foreign firms in tax havens is truly exceptional, with πf
ratios of 800% in Ireland and as high as 1,625% in Puerto Rico in 2015.
Two other results are worth noting. First, while foreign firms are an order of magnitude
more profitable than local firms in tax havens, the opposite is true in high-tax countries: in these
countries foreign firms are slightly less profitable than local firms. For instance, in the United
Kingdom the profits-to-wage ratio is 26% for foreign firms (πf ) vs. 48% for local firms (πl).28
There are several possible reasons for the this finding. Foreign firms may be younger than local
firms, or they could operate in less profitable industries.29 The fact that πf < πl in high-tax
countries while πf >> πl in tax havens suggests that profit shifting is also part of the reason
why foreign firms appear unprofitable in high-tax places. However, inferring profit shifting out
of high-tax countries from the profitability gap observed in these countries is difficult, because
both local and foreign firms can shift profits (e.g., both U.S. affiliates operating in Germany
and German multinationals can shift profit out of Germany). In this paper we do not rely on
the πl−πf gap observed in non-haven countries to infer outward profit shifting; we only use the
πf − πl gap observed in tax havens (to infer inward shifting, which we then allocate to source
countries using balance of payments data).
Second, local firms in tax havens are generally as profitable as local firms in non-haven
countries. Local haven firms do not seem to be abnormally profitable, which could in principle
be the case if the reported profitability of local haven firms was inflated by inward profit shifting.
This suggests that the recorded πl of tax havens are a good reference point to assess what fraction
of the large πf of tax havens can be attributed to profit shifting (Assumption 3 in Section 3.2).
Profits shifted into each haven. The first column of Table 2 reports our baseline estimate
of the amount of profits shifted obtained by setting πf = πl in tax havens. Ireland appears as the
number one shifting destination, with about $100 billion in shifted profits in 2015. Singapore,
the Netherlands, Caribbean tax havens, and Switzerland come next.
28The lower profitability of foreign firms in the United Kingdom compared to local firms, by a factor of about2, is consistent with Bilicka (2019) who finds that foreign multinational subsidiaries in the UK under-report theirtaxable profits by about 50 percent relative to domestic standalone.
29See, e.g., Lupo et al. (1978) and Mataloni (2000) for an analysis of the relatively low profitability of foreignfirms operating in the United States.
21

The second column of Table 2 reports our alternative estimate of profits shifting, based on
the amount of excess cross-border transactions recorded in the balance of payments of tax havens
(Section 3.4). Despite being based on totally different and fully independent data, our baseline
“excess profitability” and this “excess transaction” methodologies deliver consistent results.
Strikingly, the estimates match at the haven level. The fact that the “excess transaction”
methodology yields slightly larger numbers ($646 billion for globally shifted profits) than our
baseline approach ($616 billion) can be explained by the fact the the “excess transaction”
methodology captures profit shifting by multinationals headquartered in tax havens.
Additional results are reported in the Appendix. First, we study the contribution of interest
income to the excess profitability of foreign firms in tax haven, following Equation 3 above.
We find that the high πf of tax havens are driven by their high recorded capital shares, not
by net interest (Appendix Table A.2). The main exception is Luxembourg, where net intra-
group interest receipts are the key driver of the high recorded profitability.30 Overall, 15% of
our estimated amount of profits shifted comes from interest, consistent with the literature that
suggests that debt-shifting is second-order relative to transfer pricing and the strategic location
of intangibles (Heckemeyer and Overesch, 2017).31 We obtain similar results focusing on the
affiliates of U.S. multinationals, using the outward FATS of the United States. Haven affiliates
receive only 1.1 time more interest (relative to operating surplus) than non-haven affiliates in
2015 (Appendix Figure N.5). Second, we compare the amount of shifted profits to total profits
recorded by local and foreign firms combined in tax havens. As reported in Appendix Table
A.12, we find that if profit shifted ended, profits booked in tax havens would fall by 55%, and
by as much as 90% in havens such as Malta and Bermuda.
5.2 Bounding the Amounts of Shifted Profits
Because our baseline estimates of profits shifted are obtained using a simple methodology, it is
easy to asses how changing one, several, or all of our assumptions at the same time affects the
results. There are four margins of uncertainty: profitability differences between local and foreign
30Throughout this article, we exclude offshore mutual funds (i.e., mutual funds with foreign investors andforeign investments) from our π, πf , and πl ratios, because offshore mutual funds otherwise distort the prof-itability of tax havens. By convention mutual funds have an apparently high profitability as defined in our paper(i.e., after net interest payments), but for purely accounting reasons. All income paid by mutual funds to theirshareholders is recorded as dividends in the national accounts, even for mutual funds that only invest in bonds;as a result bond funds are large receivers of net interest. In OECD countries offshore mutual funds are onlysignificant in Luxembourg, Ireland, and to a lesser extent the Netherlands. See Appendix Section A.3.
31Intra-group interest received by tax havens amount to $101 billion in 2015 (15.7%) vs. $545 billion for theexports of services most conducive of profit shifting (84.3%); see Appendix Table C.2.
22

firms unrelated to profit shifting; the elasticity of substitution between capital and labor; inward
shifting into the local firms of tax havens; and bilateral discrepancies in international investment
statistics. For each of these margins, we quantify the uncertainty involved by building on the
most recent literature and then create bounds factoring in all sources of uncertainty.
True profitability differences between foreign & local haven firms. A potential con-
cern with our estimation procedure is that πl may not be a good counterfactual for the prof-
itability of foreign haven firms absent profit shifting. A body of work documents heterogeneity
in markups and capital shares across firms (e.g., Yeaple, 2003; Antras and Yeaple, 2014; Autor
et al., 2020; Kehrig and Vincent, 2021). As we saw in Section 3.3, even after controlling for cap-
ital stocks, R&D expenditures, industry fixed effects, and host-country characteristics, haven
affiliates remain an order of magnitude more profitable than non-haven affiliates. However,
unobserved firm characteristics may still cause πf to differ from πl absent profit shifting.
To bound the fraction of the πf − πl gap that can be due to true profitability differences
between local and foreign firms, we build on Paul and Isaka (2019) who analyze the determinants
of factor shares at the firm level globally. Foreign ownership is associated with a 2 percentage
point increase in the capital share, which, when applied to the global average capital share
of one third computed in Table 1 above, implies an increase in profitability of 4 percentage
points.32 A similar computation implies that moving from the bottom to the top of the firm
size distribution further increases the profits-to-wage ratio by 24 percentage points, and a 50%
rise in total factor productivity by 17 percentage points. These effects obtained in a regression
framework that controls simultaneously for firm size, foreign ownership, and productivity at
the firm level are additive. Therefore in column 3 of Table 2, we consider the implications
of increasing our benchmark profitability by 4 + 24 + 17 = 45 percentage points. Since the
average profitability of local firms in tax havens πl is around 43%,33 this is equivalent to roughly
doubling πl in tax havens—or, equivalently, to assuming that the net-of-depreciation capital
share of foreign firms (absent profit shifting) would be around 47%. The effect is negligible in
havens like Puerto Rico where the profitability of foreign firms is truly enormous (see Figure 4).
It is more significant in Belgium and the Netherlands where the profitability of foreign firms is
only marginally higher than that of local firms.
32Specifically, Paul and Isaka (2019, Table 3) report regressions of labor income shares on a set of firmcharacteristics. We use their results at the firm level (cols. 4–6). The average point estimate for being foreign-owned is 0.02. Starting from a capital share of 33%, the profits-to-wage ratio increases from 0.33/(1 − 0.33) to0.35/(1 − 0.35), i.e., by 4 percentage points.
33This is the unweighted πl of the 8 havens depicted in Figure 4.
23

Elasticity of substitution σ different from 1. In our baseline estimates, the capital/labor
elasticity of substitution σ is assumed to be 1, meaning that differences in capital intensities
between local and foreign firms cannot explain any of the πf−πl gap within tax havens. However,
a micro literature finds σ < 1 (e.g., Lawrence, 2015; Oberfield and Raval, 2021), while a macro
literature finds σ > 1 (e.g., Karabarbounis and Neiman, 2014; Piketty and Zucman, 2014).
To assess the quantitative implications of the assumed σ, in Table 2 we consider capital-labor
elasticities of substitution equal to 0.7 (the aggregate elasticity for the U.S. manufacturing sector
found by Oberfield and Raval, 2021) and 1.3 (the average macro elasticity of Karabarbounis
and Neiman, 2014, Table 1). With σ = 1.3, our baseline estimate of the amount of globally
shifted profit is reduced by 5%. With σ= 0.7, it is increased by 7%. While one may consider an
even broader range of elasticities (as opposed to prioritizing recent studies), quantitatively the
implications would be similar: for plausible values of σ, differences in capital intensities explain
little of the πf − πl gap in tax havens.
Why does σ turn out to have a relatively small impact? To better understand this result, the
top panel of Figure 5 shows the tangible capital stock in foreign vs. local firms within the main
havens and a sample of large high-tax countries. Foreign firms appear to have a relatively high
capital stock in Ireland and Puerto Rico, and a relatively low one in Luxembourg, Switzerland,
and Hong Kong. The differences, however, are small in comparison to the large differences in
profitability between foreign and local firms shown in Figure 4. The bottom panel of Figure 5
shows how applying the capital/labor ratio of foreign firms to local firms would modify the
observed profits-to-wage ratio of local firms πl, for different values of the capital/labor elasticity
of substitution σ. For instance in Ireland, if local firms were as capital intensive as foreign firms,
then with σ = 1.3, πl would equal 100% instead of the observed value of 68%. This would still
be almost an order of magnitude less than the observed πf of 800%. The same conclusion holds
true for each other tax haven.
Inward shifting in local sectors of tax havens. Our preferred estimates assume that πl
in tax havens is not distorted by inward profit shifting. In Column 6 of Table 2 we relax that
assumption. To do so, we identify all listed multinationals headquartered in tax havens using
Compustat Global data. Out of roughly 30,000 listed firms globally, 8% were headquartered in
tax havens in 2015; altogether they made $212 billion in pre-tax income. Assuming that these
firms shifted 36% of their global profits inward, our baseline estimate would understate global
profit shifting by $76 billion (12%). The effect is significant for Hong Kong—where about half of
24

the haven multinationals are located—and to a lesser extent in Singapore and the Netherlands.
Other ways to account for this issue have more modest impacts. First, if we assume that local
firms in tax havens are in reality as profitable as local firms are on average in the OECD (πl =
41%), our estimate of global profit shifting rises by 3% only; see Appendix Table A.7. Second,
as we have seen our “excess transactions” methodology conceptually captures inward shifting
by firms with headquartered in havens, while our baseline “excess profitability” methodology
does not. The difference between the two suggests we may miss 5% of global profit shifting by
ignoring shifting by multinationals with haven headquarters.
Effect of bilateral discrepancies. In our preferred estimate, the inward investment data
of tax havens are upgraded so that they match the outward data of counterpart countries.
Specifically, the true amount of profit made by U.S. multinationals in European tax havens is
assumed to be given by the U.S. outward investment data, not the EU haven inward data; and
when tax havens report low inward investment income in their balance of payments, these data
are replaced by the mirror outward investment data of OECD and European Union countries.
Column 7 of Table 2 shows how our estimates change when we instead take the haven data
at face value. This reduces our preferred estimate of global profit shifting by 18%, with larger
effects in the havens where data quality is more limited (Caribbean tax havens and Bermuda).
Our view is that the haven data must be corrected, however. In a number of cases, it is clear that
these data are incomplete (e.g., the Cayman Islands excludes its large offshore sector from its
balance of payments statistics); and when taking the haven data at face value, there is globally
less direct investment income made by affiliates (as recorded in inward statistics) than earned
by parents (as recorded in outward statistics), which cannot be true.
Lower and upper bounds. The last two columns of Table 2 report lower and upper bounds
for the amount of profit shifted into each haven. The lower bounds start from our baseline
estimates, consider a benchmark profitability of foreign haven firms (absent profit shifting) 45
percentage points higher than the observed profitability of local firms, assume a capital-labor
elasticity of substitution of 1.3, and remove our corrections to the haven data. The upper
bounds assume a capital-labor elasticity of substitution of 0.7 and allow for inward shifting in
the local firms of tax havens. Our preferred estimate of the amount of globally shifted profit is
36% of multinational profit, with a lower bound of 22% and an upper bound of 43%. We stress
that due to the complex structures used by multinationals and to the data limitations discussed
in Section 4.2, allocating the shifted profits to specific jurisdictions involves a margin of error.
25

6 The International Redistribution of Corporate Profits
6.1 Allocating the Shifted Profits
Profit losses in source countries. Table 3 reports our estimates of the profit loss for each
OECD non-haven country and a number of non-OECD economies. We consider three ways to
express losses: in absolute terms, relative to GDP, and relative to domestic corporate profits.
Starting with absolute numbers, in our preferred estimates $143 billion in profit was shifted
out of the United States in 2015 (23% of the global total), $216 billion was shifted out of the
European Union (36% of the global total), $76 billion out of other OECD countries (12% of the
total) and the rest (29%) from non-OECD countries. More than 70% of profit losses originate
from high-income countries.
As noted in Section 2.2 above, our estimate for the amount of profit shifted out of the
United States ($143 billion) lines up well with Guvenen et al. (2021), who find that $158.3
billion was shifted by U.S. multinationals out of the United States in 2015, plus $3.5 billion by
127 non-U.S. technology-intensive multinationals. The slightly lower number (by 0.1% of U.S.
GDP) implied by our methodology can be explained by the fact that Guvenen et al. (2021)
allocate the worldwide profits of U.S. multinationals proportionally to wages and capital stocks,
while we allocate haven profits proportionally to the cross-border payments conducive of profit
shifting. To illustrate the difference, consider the case of a U.S. company with an affiliate in
Bermuda that owns an affiliate in France selling digital services to French customers. The
French affiliate pays royalties to the Bermuda holding for the right to use the firm’s intellectual
property, stripping earnings out of France. If employees and capital are in the United States,
profits are assigned to the United States in the Guvenen et al. (2021) approach, while some are
allocated to France in ours.34 We view both benchmarks as relevant and complementary.
When expressing profit losses as a fraction of GDP (col. 5), a key finding emerges. The
European Union appears as the region most affected by profit shifting, with profit losses reaching
1.5% of GDP, as opposed to 0.8% in the United States, 0.7% in other high-income countries,
and 0.7% in developing countries. As we shall see in Section 7, this has important implications
for the analysis of the dynamic of the labor share.
In column 6, we express shifted profits as a percentage of reported domestic corporate profits
(col. 1), which are the sum of the profits recorded by local firms (col. 2) and foreign firms (col.
34In effect, in our work part of the supernormal profits of multinationals (profits above and beyond factorpayments) are allocated to the destination countries where sales are made. This is consistent with the view thatunderpins the agreement reached by more than 130 countries in June 2021 to allocate some of the supernormalprofits of multinationals to destination countries, the so-called “Pillar One” in OECD (2021).
26

3). Absent profit shifting, according to our baseline estimates, corporate profits would be 17%
higher than they currently are in France, 14% higher in the United Kingdom, and 8% higher in
the United States. Profits in the main developing countries would be around 5% higher, and
profits in Japan only 1% higher. One caveat is that the delimitation of the corporate sector
varies across countries. In principle, the corporate sector should only include corporations, but
a number of countries also include some non-corporate businesses and self-employed workers
in it (Gutierrez and Piton, 2020). As originally pointed out by Pionnier and Guidetti (2015),
the problem is particularly severe in Germany and Italy. Reported domestic profits recorded in
the national accounts of these countries are overstated—and thus the ratio of shifted profits to
reported profits reported in col. 6 is downward biased.35
To address this issue, it is useful to compare the losses of tax revenues caused by profit
shifting to the amounts of corporate tax revenues collected. Taxes collected are not affected
by the delimitation of the corporate sector, since only actual corporations pay the corporate
income tax—not the self-employed or non-corporate businesses.
Tax revenue losses in source countries. Column 7 of Table 3 reports estimates of the tax
revenue losses due to profit shifting, obtained by applying the statutory corporate tax rate to
the amount of profits shifted outward. We checked that using forward-looking effective marginal
tax rates (from Spengel et al., 2019) delivers very similar results in the case of EU countries.36
Consistent with the above discussion, tax losses relative to taxes paid are generally higher than
profit losses relative to recorded profits. This is especially the case in the countries where
recorded profits are most inflated by the income of the self-employed, Germany and Italy.
Overall, profit shifting reduces corporate tax revenues by 18% in the European Union, 14%
in the United States, 5% in other OECD countries, and 5% in developing countries. Within the
European Union, higher-tax countries (such as France and Germany) have higher losses relative
to revenue collected than lower-tax countries (such as Eastern European countries), consistent
35 Even when national accounts data are accurate, the incentives to operate as corporations as opposed to non-corporate businesses vary across countries, with ambiguous implications for our purposes. In the United States,doctors, dentists, and lawyers—which in other countries would often be self-employed—frequently operate ascorporations (so-called S-corporations); their income is included under corporate profits in the national accounts.But large businesses in the financial, real estate, and oil sector—which in other countries would be incorporated—operate as non-corporate partnerships; their profits are excluded from corporate profits (and included undermixed income).
36We used the forward looking effective tax rate estimated by Spengel et al. (2019) for large corporations inthe non-financial sector, computed at the corporate level, for average asset composition and funding sources. In2015, these rates are 28.2% for Germany (vs. a statutory rate of 30%), 38.3% in France (vs. a statutory rate of33.3%), and 21.5% in the United Kingdom (vs. a statutory rate of 20%). Spengel et al. (2019) do not reportestimates for non-EU countries.
27

with the notion that higher corporate tax rates give more incentives to shift.
Two caveats are worth stressing. First, countries attempt to tax profits that are shifted
outward through controlled foreign corporations rules. This means that a dollar of lost profit
does not necessarily translate into τ cents lost in tax revenue, if τ is the statutory (or effective
marginal) corporate tax rate.37 Second, it is possible that with better enforcement there would
be more real responses to taxation, such as more mobility of tangible capital to low-tax places.
Our tax revenue loss computations keep everything else constant, as is standard in the literature
on tax evasion (e.g., Johns and Slemrod, 2010; Alstadsæter et al., 2019).
Heterogeneity in shifting by parent country. Finally, we allocate shifted profits to the
countries where the ultimate parents of the tax haven subsidiaries are located. We find that
about half of the globally shifted profits accrue to U.S. parents and slightly more than 25% to
E.U. parents.
To understand the meaning of these results, it is worth taking a step back. Recall that
our allocation of the shifted profits to source countries (Table 3) shows that 23% of the profits
shifted globally are shifted out of the United States (by U.S. but also European, Chinese, etc.
multinationals). By contrast, when allocating shifted profits to parent countries, 50% of global
profit shifting appears to be done by U.S. multinationals (shifting profits out of the United
States, but also Europe, China, etc.). Figure 6 illustrates this imbalance. For the United States
profit shifting appears to be a tax-avoidance strategy more than a tax revenue loss, while for
other economies, it appears to be a revenue loss more than a tax-saving strategy. Of course, a
complete analysis would take into account heterogeneity within each country: not all economic
actors gain or lose from profit shifting equally.
Further, if we compare the profits shifted by U.S. multinationals to the profit made by these
firms outside of the United States, our estimates imply that U.S. multinationals book 54% of
their foreign profits in tax havens. The corresponding figure for other multinationals is 27%. A
salient—and novel—pattern thus emerges from our analysis. Although multinationals from all
countries shift profit—and all countries lose some tax revenues—US multinationals appear to
shift twice as much profit (relative to the size of their earnings) as EU multinationals, while the
European Union appear to lose twice as much profit (relative to GDP) as the United States.
37A related issue is that high-tax countries require that intangibles be sold by the parent firm to a low-taxsubsidiary at an arm’s length price. We do not have data on the prices charged at the time of the transfer.For our main purpose in that paper—quantifying the international mobility of profits—whether fair prices areenforced at the time of the transfer is not relevant. To quantify the tax revenue implications of profit shiftingthis issue is relevant, however.
28

The higher shifting intensity of U.S. multinationals can be explained by the specific provisions
contained in the U.S. tax code before 2018 and by U.S. policies adopted in the mid-1990s
that facilitated shifting from foreign high-tax countries to tax havens, known as check-the-box
regulations; see, e.g., Wright and Zucman (2018) and Guvenen et al. (2021).38
6.2 The Destination of Shifted Profits
Our bilateral data allow us to track the destination of shifted profits granularly. On an immedi-
ate counterpart basis, 77% of the profits shifted out of the European Union are shifted to E.U.
tax havens, primarily Ireland, Luxembourg, and the Netherlands. The profits shifted out of the
United States are primarily shifted to non-E.U. havens (appendix Figure C.1).
But do profits initially shifted to E.U. havens stay there? By using the bilateral service
exports and interest payments data of tax havens compiled in this project, we can study the
ultimate destination of shifted profits. To do so, we build a reallocation matrix Ω to convert
profits shifted from an immediate to an ultimate destination basis (see Appendix C.3.2). An
entry in this matrix, ωjk, equals the fraction of profits received by haven j that are ultimately
shifted to haven k. Multiplying Ω by the vector a of profits shifted to the k havens by any
country i, we obtain the vector b of profits shifted by i on an ultimate destination basis.39
To illustrate the relevance of this exercise for the European Union, in our application we
consider 8 havens j and k: Belgium, Cyprus, Ireland, Luxembourg, Malta, the Netherlands,
Switzerland, and a non-EU offshore haven aggregate. Figure 7 offers a visualization of the flows
underlying the transformation of shifted profits from an immediate to an ultimate destination
basis. The figure shows the transactions tij (as defined in Section 3.4 above, primarily royalties
and intra-group interest payments) from payee/buyer countries (on the left) to recipient havens.
(on the right). The left panel shows profit shifting on an immediate counterpart basis: high-risk
payments from origin high-tax countries (left) to the immediate counterpart haven (middle).
The right panel shows how havens transact among themselves. Payment from high-tax countries
to a tax haven on an immediate counterpart basis are often further shifted to another tax haven.
For example, Luxembourg receives $88 billion on an immediate basis, but pays back half of this
to non-EU havens such as Bermuda, only keeping $47 billion.
We find that while on an immediate counterpart basis 77% of the profits shifted out of EU
38Using our balance of payments data, we can also estimate that about 60% of the shifted profits were retainedin tax havens in 2015 (and 40% were repatriated). Repatriation does not imply that the shifted profits weretaxed, because in contrast to the United States (before 2018), most countries do not tax repatriated income.For profits shifted by U.S. companies, 72% were retained in tax havens in 2015.
39See Coppola et al. (2021) for a related attempt at redrawing the map of capital flows involving tax havens.
29

high-tax countries go to EU havens, on an ultimate destination basis 46% end up in non-EU
havens. This result is relevant from a legal and policy perspective. EU treaties prohibit member
states from taxing payments (such as intra-group interest or royalties) to other EU countries.
A country like Germany can impose taxes on payments to Bermuda (a classic anti-avoidance
strategy), but not on payments to Luxembourg. By shifting profits first to Luxembourg and
then to Bermuda, a multinational company can avoid the German anti-avoidance rules. Popular
tax planning strategies such as the “double Irish with a Dutch sandwich” (see, e.g., Zucman,
2014, for an analysis in the case of Google Alphabet) and the “green Jersey”40 indeed involve a
set of conduit EU tax havens facilitating shifting to non-EU havens. In practice, to circumvent
anti-avoidance rules, companies must have a minimal level of real activity in conduit EU havens.
7 Implications for Factor Shares
7.1 A Macroeconomic Database Corrected for Profit Shifting
The flip side of the high profits recorded in tax havens is that profits recorded in non-haven
countries are too low. In both cases, core macroeconomic statistics are distorted. In the countries
where shifted profits are booked, GDP, corporate profits, the capital share of corporate value-
added, and trade balances are inflated. In non-haven countries, these indicators are under-
estimated. In this section, we present macroeconomic statistics corrected for the effect of profit
shifting for all OECD countries, all tax havens, and the main emerging economies. Our estimates
are available online in Appendix Tables C.5 and C.5b.
To adjust the official statistics, we proceed as follows. We add the profits shifted through
transfer prices and the strategic location of intangibles (85% of the total) to the recorded
operating surplus rK of their source country. We then correct the full sequence of economic
accounts of the source countries accordingly (i.e., we increase the value-added Y of the corporate
sector, GDP, exports, and the trade balance by the same amount) and compute corrected
corporate capital shares α = rK/Y and labor shares 1−α.41 Profits shifted through the use of
intra-group interest payments (15% of the total) do not affect recorded operating surplus rK
but only the breakdown of operating surplus into corporate profits (1− p) · rK and net interest
payments p; we adjust corporate profits and net interest payments accordingly.
Table 4 presents our estimates of capital shares and trade balances corrected for profit shifting
40See the analysis of Apple based on leaked documents at https://www.nytimes.com/2017/11/06/world/
apple-taxes-jersey.html.41Bruner, Rassier, and Ruhl (2018) discuss how the effect of profit shifting cascades through the economic
accounts and present US macroeconomic statistics corrected for profit shifting; see also Avdjiev et al. (2018).
30

in 2015. A number of results are worth noting. First, accounting for profit shifting increases the
capital share of corporate value-added in non-haven countries significantly.42 Consistent with
our earlier result that EU countries are particularly affected, we find that the capital share is
under-estimated by about 2 to 2.5 percentage points in the main EU countries, vs. 1.1 point
in the United States. One caveat is that because we correct official data, and official data
overstate corporate profits (for the reasons noted in Section 3.4), especially in Germany and
Italy, our adjustments to the corporate capital share are too conservative. Indeed, for the case
of Germany, France, and Italy discussed below, the upward adjustment is 4.4 percentage points.
Profit shifting also has significant effect on trade balances. Japan, the U.K., France, and
Greece turn out to have trade surpluses in 2015, in contrast to the published data that record
trade deficits. According to our estimates, the true trade deficit of the United States was 2.1%
of GDP in 2015, instead of 2.8% in the official statistics. A quarter of the recorded trade deficit
of the United States is an illusion of multinational corporate tax avoidance.43
7.2 Dynamics of the Capital Share
Finally, to illustrate the importance of accounting for profit shifting for the analysis of factor
shares, we present corrected time series of the corporate capital share in Germany, France, and
Italy, three countries that accounted for about 50% of the GDP of the European Union in 2015
and for which high-quality estimates of corporate profits exist (from Gutierrez and Piton, 2020).
The top panel of Figure 8 motivates this analysis by showing the evolution of the aggregate
profit-to-wage ratio π in Ireland. The figure shows a dramatic increase in profitability starting
in the mid-1980s, from 30% up to the early 1980s (the same level as in the United States and
high-tax European countries) to 250% in 2015. In 2015, the profits-to-wage ratios recorded by
Ireland increased particularly strongly. Recorded real GDP grew 26.3%, reflecting transfers of
multinational intangible assets (see e.g., OECD, 2016). Because there was little profit shifting
before the 1980s, official statistics under-state not only the level but also the rise of the capital
share in Ireland’s partner countries.
To adjust the time series of EU high-tax countries, we start from 1 minus the adjusted
gross corporate labor shares of Gutierrez and Piton (2020). This is the best currently available
42Note that it does not necessarily increase the capital share of national income, as the profits of the offshoresubsidiaries that belong to domestic shareholders enter national income in the form of direct investment incomereceived from the rest of the world. We focus here on correcting corporate factor shares (which are the focus ofmost of the literature on the decline of the labor share, e.g., Karabarbounis and Neiman, 2014; Gutierrez andPiton, 2020).
43See Sandholtz (2018) for an estimation based on U.S. bilateral trade data.
31

measure of the gross-of-depreciation corporate capital share in these countries; it excludes the
effect of self-employment and real estate.44 As shown by the blue line in the bottom panel
of Figure 8, by that metric the capital share has not increased since 1985. To account for
profit shifting, we assume that there was no profit shifting before 1985 and that profit losses
(relative to recorded profit) increased linearly from 1985 to 2015. Consistent with our discussion
in Section 6 above, we assume that the fraction of profit shifted outward is given by the loss
of corporate income tax revenues relative to taxes paid. For example, for France we assume
that for any euro of gross corporate profit recorded by Gutierrez and Piton (2020), 21 cents
(corresponding to col. 7 in Table 3 above) was shifted to tax havens in 2015.
While these assumptions are simplified, meaning that results should be seen as merely il-
lustrative, they reveal a novel insight. In contrast to a view according to which the rise of the
capital share is a specifically North-American phenomenon, the corporate capital share is likely
to have increased substantially in high-tax European countries too. In our preferred scenario, it
rose by 4.4 points in the arithmetic average of Germany, France, and Italy over the 1985–2015
period, and by as much as 5.2 points in the upper bound scenario (bottom panel of Figure 8).
This lends support to theories highlighting the role of global trends—as opposed to country-
specific shocks—in the dynamic of factor shares. After our corrections, the rise of the capital
share in Europe becomes closer to the one seen in the United States, albeit still not as large.45
8 Conclusion
Our paper provides a new method to estimate global profit shifting using macroeconomic data.
Foreign affiliates statistics recently made available by many countries show that in tax havens,
foreign firms are much more profitable than local firms. By exploiting this differential prof-
itability as well as new bilateral balance of payments data, we estimate how much each tax
haven gains in profit—and how much each OECD country and the main emerging economies
lose. In our preferred estimate, 36% of multinational profits are shifted to tax havens in 2015.
Non-haven European Union countries appear to be the largest losers from this phenomenon.
Our findings have implications for policy. They can be used to study corporate tax re-
forms such as the move to a formulary apportionment system (e.g., Gordon and Wilson, 1986),
44We do not subtract taxes on production (e.g., property taxes paid by businesses) net of subsidies, which arethus included in our measure of the capital share.
45In the official BEA statistics, the (gross-of-depreciation) corporate capital share rose 5.8 points between1985 and 2015, although a range of alternative estimates exist depending on the treatment of S-corporationsand partnerships (see footnote 35).
32

destination-based corporate taxes (Auerbach, 2010), or minimum country-by-country corporate
taxes (OECD, 2021). Although quantifying the effects of such reforms would require a structural
model of multinational production with profit shifting that falls outside the scope of this re-
search, bilateral estimates of profit shifting are a necessary input to calibrate such models. Our
work can also be used to evaluate the effect of policy efforts aimed at reducing profit shifting.
Our estimates are for the year 2015 and we plan to update them annually,46 making it possible
for researchers to assess the effects of the OECD “base erosion and profit shifting” initiative
(which started in 2016), the U.S. tax reform enacted in December 2017, or an agreement on a
global minimum tax (OECD, 2021).
Our investigation has uncovered statistical gaps that limit our ability to monitor global eco-
nomic activity. To solve the asymmetries in bilateral foreign affiliates and direct investment
statistics, national statistical authorities need to be authorized to exchange micro-data. The
foreign affiliates statistics that we exploited in this paper need to be compiled by more coun-
tries and expanded to include more information, such as interest payments, corporate income
taxes paid, and capital stocks (as the United States, for example, already does). A number of
Caribbean tax havens do not currently publish comprehensive enough national accounts. Last,
many countries—including the United States and a number of tax havens—could improve their
public corporate registries so that all firms are included and profit information is made publicly
available at the subsidiary level.
Our analysis has focused on how differences in corporate tax rates redistribute profits across
countries. In future research, it would be good to introduce the inequality dimension in the
analysis, i.e., to quantify how much the various income and wealth groups in each country have
gained or lost from profit shifting. By our estimates, about half of the globally shifted profits
accrue to the shareholders of U.S. multinationals (many of which, but not all, are Americans).
Because equity ownership is concentrated (see e.g., Saez and Zucman, 2016), profit shifting
reduces the effective tax rate of the wealthy, which may contribute to increasing inequality. A
quantitative analysis of these redistributive effects across income and wealth groups would make
it possible to make progress towards a full-fledged macro-distributional analysis of globalization.
This raises major conceptual and empirical challenges for future research.
46Updated estimates for 2016, 2017, and 2018 are available in Tørsløv et al. (2021).

References
Acemoglu, Daron and Pascual Restrepo. 2018. “Artificial Intelligence, Automation and
Work”. NBER working paper #24196.
Alstadsæter, Annette, Niels Johannesen, and Gabriel Zucman. 2019. “Tax Evasion
and Inequality”. American Economic Review, 109(6): 2073–2103.
Angulo, Emma and Alicia Hierro. 2014. “Asymmetries in the Coordinated Direct Invest-
ment Survey: What Lies Behind?”. IMF working paper.
Antras Pol and Stephen R. Yeaple. 2014. “Multinationals Firms and the Structure of
International Trade.” Handbook of International Economics, vol. 4: 55-130.
Auerbach, Alan J. 2010. “A Modern Corporate Tax.” The Hamilton Project/Center for
American Progress, December.
Autor, David, David Dorn, Lawrence F. Katz, Christina Patterson, and John Van
Reenen. 2020. “The Fall of the Labor Share and the Rise of Superstar Firms”. Quarterly
Journal of Economics, 135(2): 645–709.
Avdjiev Stefan, Mary Everett, Philip R. Lane, and Hyun Song Shin. 2018. “Tracking
the international footprints of global firms”, BIS Quarterly Review, March, p. 47-66.
Beer, Sebastian, Ruud de Mooij and Li Liu. 2019. “International Corporate Tax Avoid-
ance: A review of the channels, magnitudes and blind spots.” IMF Working paper no. 168.
Bernard, Andrew B., J. Bradford Jensen, and Peter K. Schott. 2006. “Transfer
Pricing by U.S. Based Multinational Firms”. NBER working paper #12493.
Bilicka, Katarzyna Anna.. 2019. “Comparing UK Tax Returns of Foreign Multinationals to
Matched Domestic Firms,” American Economic Review, 119(8): 2921–2953.
Blouin, Jennifer and Leslie Robinson. 2019. “Double Trouble: How Much of U.S. Multi-
nationals’ Profits are really in Tax Havens?,” working paper.
Bolwijn Richard, Bruno Casella and Davided Rigo. 2018. “An FDI-driven approach to
measuring the scale and economic impact of BEPS.” Transnational Corporations, 25(2).
Bruner, Jennifer, Dylan G. Rassier, and Kim J. Ruhl. 2018. “Multinational Profit
Shifting and Measures throughout Economic Accounts”, working paper.
Central Statistics Office. 2016. “Explaining Ireland’s FDI Asymmetry with the United
States.” technical paper.
Cette, Gilbert, Lorraine Koehl, and Thomas Philippon. 2019. “Labor Shares in Some
Advanced Economies”. NBER working paper #26136.
Clausing, Kimberly A. 2009. “Multinational firm tax avoidance and tax policy”. National
Tax Journal, 62 (4): 703–725.
Clausing, Kimberly A. 2016. “The Effect of Profit Shifting on the Corporate Tax Base in
the United States and Beyond.” National Tax Journal, 69(4), 905–934.
Cobham, Alex and Petr Jansky. 2018. “Global distribution of revenue loss from corporate
tax avoidance: re-estimation and country results.” Journal of International Development, 30(2),
206–232.
Coppola, Antonio, Matteo Maggiori, Brent Neiman, and Jesse Schreger. 2021.
“Redrawing the Map of Global Capital Flows: The Role of Cross-Border Financing and Tax
Havens”. Quarterly Journal of Economics, 136(3): 1499–1556.
34

Cristea, Anca D. and Daniel X. Nguyen. 2016. “Transfer Pricing by Multinational Firms:
New Evidence from Foreign Firm Ownerships.” American Economic Journal: Economic Policy,
8(3): 170–202.
Crivelli, Ernesto, Ruud de Mooij, and Michael Keen. 2015. “Base Erosion, Profit
Shifting and Developing Countries,” IMF working paper 15/118.
Damgaard Jannick, and Thomas Elkjaer. 2017. “The Global FDI Network: Searching for
Ultimate Investors”, working paper, Danmarks Nationalbank.
de Mooij, Ruud and Sjef Ederveen. 2008. “Corporate Tax Elasticities: A Reader’s Guide
to Empirical Findings.” Oxford Review of Economic Policy 24, 680–697.
De Simone, Lisa, Lillian F. Mills, and Bridget Stomberg. 2017. “Using IRS Data to
Identify Income Shifting to Foreign Affiliates.” Working paper.
Devereux, Michael P. and John Vella. 2017. “Implications of digitalization for interna-
tional corporate tax reform.” Oxford University Center for Business Taxation Working paper
17/07.
Dowd, Tim, Paul Landefeld, and Anne Moore. 2017. “Profit Shifting of U.S. Multina-
tionals.” Journal of Public Economics, 148: 1–13
Eurostat. 2012. “Foreign AffiliaTes Statistics (FATS) Recommendations Manual.”
Egger, Peter, Wolfgang Eggert, and Hannes Winner. 2010. “Saving taxes through
foreign plant ownership,” Journal of International Economics, 81(1): 99–108.
Faulkender, Michael W., Kristine W. Hankins, and Mitchell A. Peterson. 2017.
“Understanding the Rise in Corporate Cash: Precautionary Savings or Foreign Taxes”, NBER
working paper No. 23799
Gordon, Roger H. and John Wilson. 1986. “An Examination of Multijurisdictional Cor-
porate Income Taxes Under Formula Apportionment,” Econometrica, Nov. 1986, 1357–73.
Gravelle, Jane G. 2009. “Tax Havens: International Tax Avoidance and Evasion .” National
Tax Journal, 62(4): 727–753.
Grubert, Harry. 2013. “Foreign taxes and the growing share of U.S. multinational company
income abroad: profits, not sales, are being globalized.” National Tax Journal, 65(2): 247–281.
Grubert, Harry and Joel Slemrod. 1998. “The Effect of Taxes on Investment and Income
Shifting to Puerto Rico.” Review of Economics and Statistics 80(3): 365–73.
Guvenen, Fatih, Raymond J. Mataloni Jr., Dylan G. Rassier, and Kim J. Ruhl.
2021. “Offshore Profit Shifting and Aggregate Measurement: Balance of Payments, Foreign
Investment, Productivity, and the Labor Share”, working paper.
Gutierrez, German and Sophie Piton. 2020. “Revisiting the Global Decline of the (Non-
Housing) Labor Share,” American Economic Review: Insights, 2(3): 321-338.
Heckemeyer, Jost H., and Michael Overesch. 2017. “Multinationals’ Profit Response to
Tax Differentials: Effect Size and Shifting Channels.” Canadian Journal of Economics, 50(4):
965–994.
Hines, James R. Jr and Eric Rice. 1994. “Fiscal Paradise: Foreign Tax Havens and
American Business.” Quarterly Journal of Economics, 109(1): 149-182.
Huizinga, Harry, and Luc Laeven. 2008. “International profit shifting within multination-
als: a multi- country perspective.” Journal of Public Economics, vol. 92, 1164–1182.
35

Huizinga, Harry, Luc Laeven, and Gaetan Nicodeme. 2008. “Capital Structure and
International Debt Shifting,” Journal of Financial Economics, 88(1), 80–118
International Monetary Fund. 2009. “Balance of Payments Manual,” 6th Edition.
Jansky, Peter and Miroslav Palansky. 2019. “Estimating the scale of profit shifting and
tax revenue losses related to foreign direct investment,” International Tax and Public Finance,
26, 1048–1103.
Johansson, Asa, Øystein Bieltvedt Skeie, Stephane Sorbe, and Carlo Menon. 2017.
“Tax Planning by Multinational Firms: Firm-Level Evidence from a Cross-Country Database”,
OECD Economics Department working paper 1355.
Johns, Andrew and Joel Slemrod. 2010. “The Distribution of Income Tax Noncompliance,”
National Tax Journal, 63(3), 397–418.
Kalemli-Ozcan, Sebnem, Bent Sørensen, Carolina Villegas-Sanchez, Vadym Volosovych,
and Sevcan Yesiltas. 2015. “How to Construct Nationally Representative Firm Level Data
from the ORBIS Global Database.” NBER Working Paper No. 21558.
Karabarbounis, Loukas and Brent Neiman. 2014. “The Global Decline of the Labor
Share,” Quarterly Journal of Economics, 129(1): 61-103.
Keen, Michael, and Kai Konrad. 2013. “The Theory of International Tax Competition
and Coordination,” Handbook of Public Economics, vol. 5.
Kehrig, Matthias and Nicolas Vincent. 2021. “The Micro-Level Anatomy of the Labor
Share Decline,” Quarterly Journal of Economics, 136 (2): 1031–1087.
Keller, Wolfgang and Stephen R. Yeaple. 2020. “Multinationals, Markets, and Markups,”
working paper.
Langenmayr, Dominika and Franz Reiter. 2017. “Trading Offshore: Evidence on Banks’
Tax Avoidance,” CESifo Working Paper Series No. 6664.
Lawrence, Robert. 2015. “Recent declines in labor’s share in US income: A preliminary
neoclassical account.” NBER Working Paper #21296.
Liu, Li, Tim Schmidt-Eisenlohr and Dongxian Guo. 2020. “International Transfer Pric-
ing and Tax Avoidance: Evidence from Linked Trade-Tax Statistics in the United Kingdom,”
Review of Economics and Statistics, 102 (4): 766–778.
Lupo, L., Gilbert, A., Liliestedt, M. 1978. “The relationship between age and rate of
return of foreign manufacturing affiliates of U.S. manufacturing parent companies.” Survey of
Current Business, 58, 60-66.
Mataloni Jr., Ray. 2000. “An examination of the low rates of return of foreign-owned U.S.
companies.” Survey of Current Business, 80, 55-73.
Oberfield, Ezra and Davesh Raval. 2021 “Micro data and macro technology,” Economet-
rica, 89(2): 703–732.
Organization for Economic Co-operation and Development. 2008. “OECD Benchmark
Definition of Foreign Direct Investment, Fourth Edition.”
Organization for Economic Co-operation and Development. 2015. “Base Erosion and
Profit Shifting, Final Report.”
Organization for Economic Co-operation and Development. 2016. “Irish GDP up by
26.3% in 2015?”
36

Organization for Economic Co-operation and Development. 2021. “Statement on
a Two-Pillar Solution to Address the Tax Challenges Arising From the Digitalisation of the
Economy.”
Paul, Saumik and Hironobu Isaka . 2019. “Labor Income Share at the Firm Level: Global
Trends.” IZA Discussion Paper No 12852.
Piketty, Thomas, and Gabriel Zucman. 2014. “Capital is Back: Wealth-Income Ratios in
Rich Countries, 1700–2010,” Quarterly Journal of Economics, 129(3), 1255–1310.
Pionnier, Pierre-Alain and Emmanuelle Guidetti. 2015. “Comparing Profit Shares in
Value Added in Four OECD Countries: Towards More Harmonised National Accounts.” OECD
Statistics Directorate Working Paper No. 61.
Pomeroy, James. 2016. “The Rise of the Digital Natives.” HSBC report, September.
Riedel, Nadine. 2018. “Quantifying International Tax Avoidance: A Review of Academic
Literature,” Review of Economics, 69(2), 169–181.
Saez, Emmanuel and Gabriel Zucman. 2016. “Wealth Inequality in the United States
since 1913: Evidence from Capitalized Income Tax Data,” Quarterly Journal of Economics,
131(2), 519–578.
Saez, Emmanuel and Gabriel Zucman. 2019. The Triumph of Injustice: How the Rich
Dodge Taxes and How to Make Them Pay, W.W. Norton.
Sandholtz, William H. 2018. “Corporate Tax Rate Differentials and Transfer Mispricing:
Evidence from Bilateral Trade Data”, working paper.
Spengel, Christoph, Frank Schmidt, Jost Heckemeyer and Katharina Nicolay. 2019.
“Effective Tax Levels Using the Devereux/Griffith Methodology,” Project for the EU Commis-
sion TAXUD/2019/DE/312: Final report 2019.
Suarez Serrato, Juan Carlos. 2019. “Unintended Consequences of Eliminating Tax Havens,”
working paper.
Tørsløv, Thomas, Ludvig Wier, and Gabriel Zucman. 2021. “The Missing Profits of
Nations: 2018 Estimates,” available online at missingprofits.world
United Nations. 2009. “System of National Accounts 2008.”
Vicard, Vincent. 2015. “Profit Shifting through Transfer Pricing: Evidence form French
Firm Level Trade Data.” Banque de France Working Paper no. 555.
Wang, Zi. 2018. “Multinational Production and Corporate Taxes: A Quantitative Assess-
ment”, working paper.
Wier, Ludvig and Hayley Reynolds. 2018. “Big and “Unprofitable”: How 10% of Multi-
national Firms Do 98% of Profit Shifting”, working paper.
Wright, Thomas, and Gabriel Zucman. 2018. ‘The Exorbitant Tax Privilege”, NBER
working paper #24983.
Zucman, Gabriel. 2014. “Taxing Across Borders: Tracking Personal Wealth and Corporate
Profits,” Journal of Economic Perspectives, 28(4), 121–148.
Yeaple, Stephen R. 2003. “The Role of Skill Endowments in the Structure of U.S. Outward
Foreign Direct Investment.” Review of Economics and Statistics, 85(3), 726–734.
Zucman, Gabriel. 2015. The Hidden Wealth of Nations: The Scourge of Tax Havens, Chicago:
University of Chicago Press.
37

Figure 1: Fraction of Global Profits That Can be Observed in Orbis
Note: This graph shows the imperfect coverage in Orbis. For each multinational firm we take the sum of profits made by all subsidiaries registered in
Orbis and divide by the global profits of the same multinal firm. Whenever the share is lower than 1 this means that we only see part of the global
profits in Orbis. .
Weighted average = 0.172
0.1
.2.3
0 .2 .4 .6 .8 1Share of profits found in 2012
Fraction of firms
Weighted average: 0.17
Share of global profits found in 2012
The missing profits in Orbis
0% 20% 40% 60% 80% 100%
30%
20%
10%
0%
Weighted average: 17%
Notes: This graph shows the density of the following ratio. For each multinational firm in Orbis, we compute the sum of the unconsolidated pre-tax profits
of all subsidiaries (code U1), and we divide this sum by the consolidated global profits of the firm (code C1). Whenever the ratio is less than 1, this means
that only part of the global profits of the firm are visible at the subsidiary level in Orbis. In 28% of the cases, no profits are visible at the subsidiary level.
The weighted average of 17% is weighed by profit. Source: authors’ computations using Orbis data.

Figure 2: Excess Profitability vs. Effective Tax Rates
Belgium
Ireland
Switzerland
Luxembourg
Netherlands
Andorra
Anguilla
Antigua and Barbuda
Aruba
Bahrain
Belize
Bermuda
Bonaire
Curacao
Cyprus
Jersey
Grenada
GuernseyGibraltar
Hong Kong
Isle of man
Lebanon
Macau
Malta
Monaco
Sint Maarten
Seychelles
Singapore
St. Kitts and Nevis
St. Lucia
St. Vincent and the Grenadines
Turks and Caicos
Panama
Puerto Rico
-400%
100%
600%
1100%
1600%
2100%
-5% 0% 5% 10% 15% 20% 25% 30% 35%
Prof
it-to
-wag
e ra
tio in
fore
ign
firm
s min
us in
loca
l firm
s
Effective corporate income tax rateNotes: This graph shows the difference between the profits-to-wage ratio of foreign firms (πf ) and local firm (πl), plotted against the effective corporate
income tax rate in 2015. The sample includes OECD countries, a number of developing non-OECD countries (Brazil, China, Colombia, Costa Rica, India,
Russia, and South Africa), and the countries and territories included in our list of tax havens. Bubble sizes are proportional to the excess of πf over πl. In
red are the countries and territories included in our list of tax havens. In blue are the countries not included in our list of havens that have πf larger than
πl (with bubble size proportional to the the excess of πf over πl) . In black are all other non-haven countries (which have πf lower than πl). The effective
corporate income tax rate is proxied by the effective tax rate of the affiliates of U.S. multinational companies, computed as foreign corporate income tax
paid divided by profit-type return in the BEA survey of the foreign activities of U.S. multinationals. Source: authors’ computations.

Figure 3: Profits-to-Wage Ratio of the Foreign Affiliates of U.S. Multinationals
0%
50%
100%
150%
200%
250%
300%
350%
400%
1966 1970 1974 1978 1982 1986 1990 1994 1998 2002 2006 2010 2014 2018
Haven affiliatesHaven affiliates: baseline controlsHaven affiliates: baseline controls, year x industry FEHaven affiliates: baseline controls, year x industry FE, R&D controls
Non-haven affiliates
Notes: This graph shows the profits-to-wage ratio of the affiliates of U.S. multinationals in non-haven countries (blue line), in tax havens (black line),
and in tax havens after controls, following equation 4. See text for description of each specification. R&D expenditures are linearly interpolated between
benchmark surveys. Source: Authors’ computations using tabulations of the the BEA survey of the foreign operations of U.S. multinationals. Profits are
measured as profit-type return (Tables II.F.1). See Online Appendix Section H for additional details on variable construction and methodology. Regression
coefficients with robust standard errors are reported in Appendix Table H.1.

Figure 4: Profitability in Foreign vs. Local Firms
1675%
0%
200%
400%
600%
800%
Puerto
RicoIre
land
Luxem
bourg
Switz
erlan
dSin
gapore
Hong K
ong
Netherl
ands
Belgium
United
State
sAust
ralia
United
King
dom
Spain
Japan
France
German
yIta
lyPr
e-ta
x pr
ofits
/ c
ompe
nsat
ion
of e
mpl
oyee
s
Foreign firms
Local firms
Notes: This figure shows the ratio of pre-tax profits to compensation of employees for local firms (πl) and foreign firms (πf ) in 2015, in 8 tax havens and 8
large non-haven countries. Source: Appendix Table A.7.

Figure 5: Capital Intensities in Tax Havens
0%
100%
200%
300%
400%
500%
600%
700%
800%
Irelan
d
Puerto
Rico
Netherl
ands
Singap
ore
Belgium
Luxem
bourg
Switz
erlan
d
Hong K
ong
United St
ates
Italy
Germany
United K
ingdo
m
Austral
iaSp
ainFran
ceJap
an
Tangible assets(% of compensation of employees)
Foreign firmsLocal firms
1675%
0%
200%
400%
600%
800%
Puerto
RicoIre
land
Luxem
bourg
Switz
erlan
d
Singap
ore
Hong K
ong
Netherl
ands
Belgium US
Austral
ia UKSp
ainJap
anFran
ce
German
yIta
ly
Pre-tax corporate profits (% of compensation of employees)
Foreign firms
Local firms (observed)
Local firms (with K/L of foreign firms and σ = 1.3)
Local firms (with K/L of foreign firms and σ = 0.7)
Notes: The top panel shows the ratio of the tangible capital stock of local and foreign firms to wages paid. In
Ireland, foreign firms have a higher capital stock (relative to wages) than local firms, while the opposite is true
in Switzerland. The bottom panel shows the profit-to-wage ratio in foreign firms and in local firms obtained
by applying the capital intensity of foreign firms, for different assumptions about the elasticity of substitution
between capital and labor σ. Source: Appendix Table E.1 .
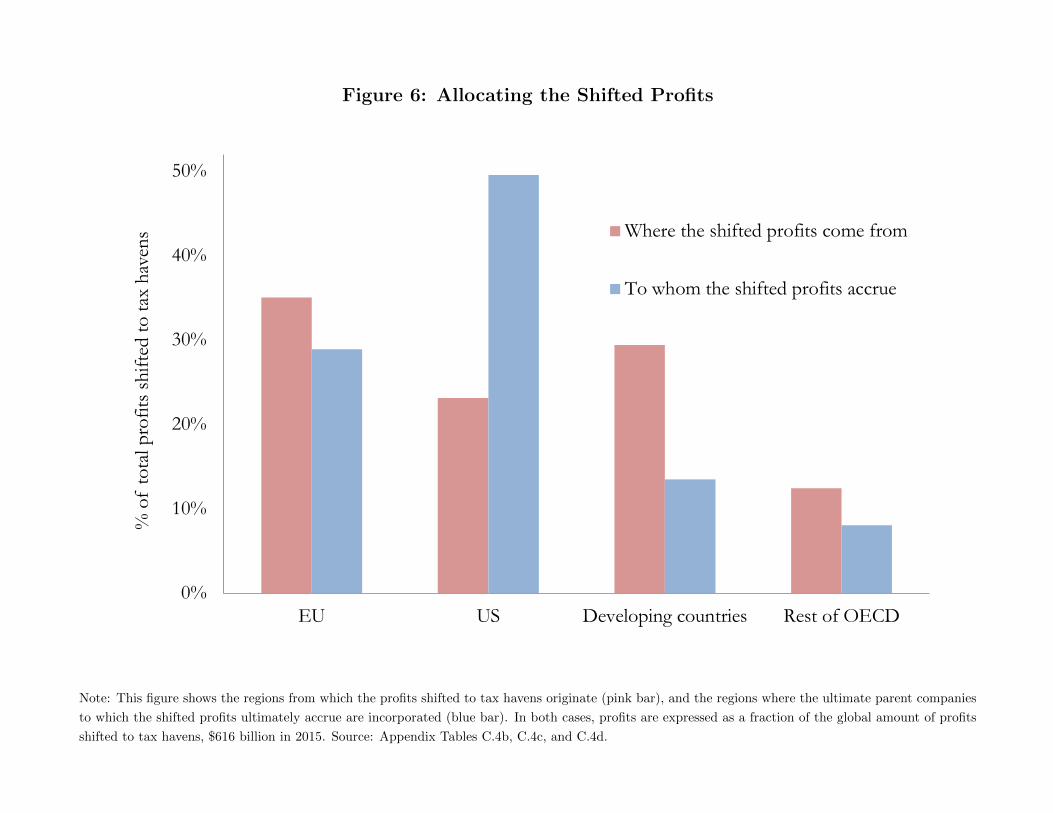
Figure 6: Allocating the Shifted Profits
0%
10%
20%
30%
40%
50%
EU US Developing countries Rest of OECD
% o
f to
tal p
rofit
s shi
fted
to ta
x ha
vens Where the shifted profits come from
To whom the shifted profits accrue
Note: This figure shows the regions from which the profits shifted to tax havens originate (pink bar), and the regions where the ultimate parent companies
to which the shifted profits ultimately accrue are incorporated (blue bar). In both cases, profits are expressed as a fraction of the global amount of profits
shifted to tax havens, $616 billion in 2015. Source: Appendix Tables C.4b, C.4c, and C.4d.

Figure 7: Mapping the Ultimate Destination of Shifted Profits
Notes: This diagram shows intragoup interest payments and exports conducive of profit shifting from payee/buyer countries (on the left) to immediate
recipient havens (in the middle) and ultimate recipient havens (on the right). The left panel visualizes profit shifting on an immediate counterpart basis
(payments from high-tax countries to the immediate counterpart haven) while the right panel visualizes how havens transact among themselves. Offshore tax
havens denote the aggregate of all non-EU havens. An interactive version of this diagram is available at https://public.flourish.studio/story/939975/

Figure 8: The Rise of Profit Shifting: Implications for Factor Shares
0%
50%
100%
150%
200%
250%
1970 1975 1980 1985 1990 1995 2000 2005 2010 2015
Pre-tax corporate profits (% of compensation of employees)
Ireland
United States
25%
30%
35%
40%
1985 1990 1995 2000 2005 2010 2015
Capital shares in the corporate sector (average of Germany, France, Italy)
Corrected for profit shifting
Uncorrected
Notes: the top panel shows the ratio of profits to wages in Ireland and the United States, using national accounts
data. The bottom panel shows the arithmetic average of the gross-of-depreciation corporate capital share (gross
corporate profits relative to gross corporate value-added) in Germany, France, and Italy. The blue line is taken
from Gutierrez and Piton (2020) and the orange line is adjusted for profit shifting; see text. The point estimate
corresponds to our preferred estimate of global profit shifting and the confidence interval is constructed using
the lower and upper bounds for global profit shifting reported in Table 2, cols. 8 and 9.

Table 1: Global Output, Corporate Output, and Corporate Taxes Paid
Billions of current US$
% of net corporate
profitsGlobal gross output (GDP) 75,038
Depreciation 11,940
Net output 63,098
Net corporate output 34,083 296%
Net corporate profits 11,515 100%
Net profits of foreign-controlled corp. 1,703 15%
Of which: shifted to tax havens 616 5%
Net profits of local corporations 9,812 85%
Corporate income taxes paid 2,154 19%
Notes: This table reports the global totals in our database in 2015. Profits of foreign corporations include all the profits made by companies
more than 50% owned by a foreign country; profits of local corporations equal all corporate profits minus the profits of foreign corporations.
Source: Appendix Tables C.5 and A.3.

Table 2: Bounding the Amount of Profits Shifted to Tax Havens
[1] [2] [3] [4] [5] [6] [7] [8] [9]
Baseline estimates (excess
profitability
Alternative estimate (excess
transactions)
45 pp increase in benchmark profitability
Adjustment for capital intensity
with σ = 0.7
Adjustment for capital intensity
with σ = 1.3
Accounting for inward shifting to
haven headquarters
Removing corrections
to haven data
Baseline estimates:
Lower bound
Baseline estimates:
Upper bound
Belgium 13 34 0 16 11 20 12 0 23Ireland 106 89 100 115 102 109 95 84 118Luxembourg 47 88 42 46 47 47 30 26 46Malta 12 4 12 13 12 12 8 7 13Netherlands 57 74 22 70 51 66 48 6 79Caribbean 97 91 95 104 92 97 70 64 105Bermuda 24 22 23 25 23 26 14 13 27Singapore 70 74 52 88 61 75 48 20 93Puerto Rico 42 44 41 42 41 42 42 40 42Hong Kong 39 28 28 41 38 72 35 23 74Switzerland 58 50 50 57 59 75 58 50 74Other havens 51 47 42 45 49 52 47 36 46Total 616 646 506 663 586 693 507 369 740
Notes: This table reports estimates for the amount of profit shifted into tax havens in 2015, in billions of US$. The first column reports our
baseline estimates, obtained by equating the profitability of foreign and local firms within each tax haven. Column 2 reports an alternative
estimate based on the excess cross-border transactions conducive of profit shifting observed in the balances of payments of tax havens. Columns
3 to 7 shows how the baseline estimates from col. 1 are affected when changing one assumption at a time. Finally columns 8 and 9 report
lower and upper bounds for our baseline estimates, obtained by changing all our assumptions at the same (either in the most conservative or
least conservative manner).

Table 3: Profit and Corporate Income Tax Revenue Losses
[1] [2] [3] [4] [5] [6] [7]
Reported domestic
profits
Of which: Local firms
Of which: Foreign firms
Shifted profits
(baseline)
Shifted profits (% reported GDP)
Shifted profits (% reported profits)
Corporate tax loss (%
tax collected)
Australia 179 151 28 13 1.1% 7% 7%Austria 48 37 11 4 0.9% 7% 11%Canada 143 96 47 19 1.2% 13% 10%Chile 68 58 10 5 2.3% 8% 12%Czech Republic 34 16 17 2 0.9% 5% 5%Denmark 52 47 5 3 1.0% 6% 8%Estonia 4 3 1 0 1.1% 6% 10%Finland 25 21 4 3 1.2% 11% 11%France 188 156 32 32 1.3% 17% 21%Germany 553 510 43 55 1.6% 10% 28%Greece 23 21 1 1 0.5% 5% 7%Hungary 21 11 10 2 2.0% 12% 21%Iceland 2 2 0 0 2.6% 20% 22%Israel 54 48 6 1 0.2% 1% 2%Italy 212 199 13 23 1.2% 11% 19%Japan 634 602 32 9 0.2% 1% 2%Korea 248 246 3 5 0.3% 2% 3%Latvia 4 3 1 0 0.7% 5% 7%Mexico 325 302 23 13 1.1% 4% 11%New Zealand 44 37 6 2 0.9% 3% 5%Norway 76 69 7 5 1.3% 7% 8%Poland 88 68 19 4 0.8% 4% 8%Portugal 27 22 5 3 1.3% 10% 9%Slovakia 12 6 5 1 0.7% 5% 5%Slovenia 3 2 1 0 0.5% 7% 6%Spain 159 138 21 14 1.2% 9% 14%Sweden 63 39 24 9 1.7% 13% 13%Turkey 213 209 4 5 0.6% 2% 8%United Kingdom 425 353 72 62 2.1% 14% 18%United States 1,889 1,737 153 143 0.8% 8% 14%
Brazil 274 245 30 14 0.6% 5% 9%China 2,069 1,906 162 61 0.5% 3% 4%Colombia 59 52 7 1 0.5% 2% 2%Costa Rica 13 12 1 1 1.9% 8% 21%India 376 368 8 9 0.4% 3% 9%Russia 290 253 37 12 0.9% 4% 6%South Africa 76 68 9 4 1.2% 5% 6%Other non-havens 1,423 1,309 114 79 0.8% 6% 7%Non-haven total 11,515 9,812 1,703 616 0.8% 5% 9%
OECD countries
Non-OECD countries
Notes: This table shows pre-tax corporate profits in OECD countries and a number of non-OECD
countries other than tax havens, as published in national account statistics. Col. 4 reports our baseline
estimate of the amount of profit shifted out of each of these countries, which is then expressed as a
fraction of reported GDP (col. 5) and reported profits (col. 6). Col. 7 shows the implied corporate
income tax revenue loss, obtained by applying the statutory corporate income tax rate to the amount
of shifted profits reported in col. 4. Amounts are in current billion US$. All data are for 2015. Source:
Appendix Tables A.6., A.7, C.4d, and C.4.

Table 4: Macro Statistics Corrected for Profit Shifting (2015)
Corrected capital share
Difference with published data
Corrected trade balance
Difference with published data
Australia 26% +1.1% -1.4% +0.8%Austria 29% +1.3% 4.1% +0.8%Canada 24% +1.4% -1.4% +0.9%Chile 51% +1.5% 1.8% +1.8%Czech Republic 39% +1.0% 6.5% +0.7%Denmark 31% +1.2% 8.2% +0.8%Estonia 35% +1.1% 5.0% +0.9%Finland 28% +1.6% 0.9% +1.0%France 19% +2.1% 0.4% +1.1%Germany 31% +1.8% 9.2% +1.2%Greece 43% +1.1% 0.3% +0.5%Hungary 39% +2.3% 10.4% +1.5%Iceland 33% +3.4% 9.5% +2.0%Israel 37% +0.2% 3.2% +0.2%Italy 30% +1.9% 3.9% +1.0%Japan 28% +0.8% 0.0% +0.5%Korea 37% +0.4% 8.0% +0.2%Latvia 31% +0.9% -0.5% +0.6%Mexico 71% +0.6% -1.2% +0.9%New Zealand 44% +0.7% 1.4% +0.7%Norway 41% +1.2% 6.5% +1.0%Poland 45% +0.9% 3.7% +0.6%Portugal 33% +1.8% 2.8% +1.1%Slovakia 35% +1.1% 3.4% +0.6%Slovenia 18% +0.9% 9.1% +0.4%Spain 29% +1.6% 3.4% +1.0%Sweden 31% +2.2% 6.3% +1.4%Turkey 55% +0.4% -2.3% +0.5%United Kingdom 31% +2.5% 0.2% +1.8%United States 27% +1.1% -2.1% +0.7%
Brazil 26% +1.0% -0.3% +0.5%China 44% +0.5% 3.7% +0.4%Colombia 54% +0.5% -5.9% +0.4%Costa Rica 45% +1.9% 1.6% +1.7%India 56% +0.5% -2.6% +0.4%Russia 40% +0.8% 8.9% +0.7%South Africa 39% +1.4% 0.0% +1.0%
OECD countries
Main developing countries
Notes: see text for construction of the corrections to the published statistics. Source: Appendix Tables
C.5 and C.5b.