the method detection level (mdl) team of ... - water resources · of regulatory criteria, such as...
TRANSCRIPT

MDL team members:
Robert D. Brock* (lead) National Water Quality LaboratoryBrooke F. Connor National Water Quality LaboratoryWilliam T. Foreman National Water Quality LaboratoryRobert P. Mayer* National Water Quality LaboratoryJeffrey W. Pritt National Water Quality LaboratoryEdward J. Zayhowski National Water Quality LaboratoryGeorge F. Ritz Water-Quality Specialist, Colorado DistrictTerry L. Schertz Office of Water Quality
* No longer affiliated with the U.S. Geological Survey.
The method detection level (MDL) team of the U.S. Geological Survey provided to the National Water Quality Laboratory recommended alternatives for determining MDL’s and setting reporting conventions.

U.S. GEOLOGICAL SURVEY
Open-File Report
By Carolyn J. Oblinger Childress, William T. Foreman, Brooke F. Connor, and Thomas J. Maloney
Reston, Virginia1999
99–193
New Reporting Procedures Based on Long-Term Method Detection Levels and Some Considerations for Interpretations of Water-Quality Data Provided by the U.S. Geological Survey National Water Quality Laboratory

CONTENTS
Abstract ................................................................................................................................................................................. 1Introduction ........................................................................................................................................................................... 1The minimum reporting level................................................................................................................................................ 2
Historical use of the minimum reporting level at the National Water Quality Laboratory ......................................... 2Limitations of the minimum reporting level ............................................................................................................... 2
The method detection limit procedure of the U.S. Environmental Protection Agency......................................................... 3Limitations of the procedure ....................................................................................................................................... 5Use by the National Water Quality Laboratory........................................................................................................... 6
The U.S. Geological Survey’s new reporting procedure based on long-term method detection levels ................................ 6Setting the reporting level ..................................................................................................................................................... 7New reporting conventions.................................................................................................................................................... 8
Information-rich methods............................................................................................................................................ 9Use of the “E” remark code by the National Water Quality Laboratory..................................................................... 10
Planned implementation at the National Water Quality Laboratory ..................................................................................... 10Considerations for data interpretation................................................................................................................................... 11
Effect of censoring on data distribution ...................................................................................................................... 11Data analysis ............................................................................................................................................................... 12
Storing data in the National Water Information System ....................................................................................................... 15Enhancements to remark code in the National Water Information System ................................................................ 15Impact on historical data ............................................................................................................................................. 16
Explanation of the reporting convention for long-term method detection levels for the State annual data reports.............. 16Summary ............................................................................................................................................................................... 16References ............................................................................................................................................................................. 17Abbreviations and definitions ............................................................................................................................................... 19
FIGURES
1. Diagram showing the spike concentration in relation to the expected method detection limit (MDL) ................... 32. Graph showing the frequency distribution of measured concentrations of chlorobenzene spiked at
0.05 microgram per liter .......................................................................................................................................... 43-10. Diagrams showing:
3. Frequency distribution of measured concentrations of method detection limit (MDL) test samples spiked at 1 to 5 times the expected MDL concentration and showing one standard deviation (s) ................... 4
4. Standard deviation in relation to concentration of analyte, showing a region of constant standard deviation at low concentrations .......................................................................................................... 4
5. The frequency distribution of the low-concentration spike measurements is centered on zero concentration to simulate the distribution expected for replicate blank measurements (analyte not present).......................................................................................................................................... 5
6. The U.S. Environmental Protection Agency’s method detection limit (MDL) is set at a concentration to provide a false positive rate of no more than 1 percent ......................................................... 5
7. The long-term method detection level (LT–MDL) compared to the method detection limit (MDL) determined by the U.S. Environmental Protection Agency procedure ............................................................. 6
Contents III

8. False negative probability when a sample contains the analyte at the method detection limit (MDL) concentration..................................................................................................................................................... 7
9. The risk of a false negative (not detecting an analyte when it is present) at the laboratory reporting level (LRL) is no more than 1 percent .............................................................................................. 8
10. New low-concentration reporting conventions showing the reported value and associated qualifying remark code in relation to the long-term method detection level (LT–MDL), the laboratory reporting level (LRL), and the lowest calibration standard (LS)...................................................................................... 9
11. One-dimensional distribution plots of (A) uncensored data and the same data set censored by using (B) the MRL procedure, (C) the new reporting procedure, and (D) the new reporting procedure for information-rich methods ........................................................................................................................................ 12
TABLE
1. Examples of different uses for data and their effect on the required level of certainty and use of qualified data .......................................................................................................................................... 14
IV Contents

U.S. DEPARTMENT OF THE INTERIORBRUCE BABBITT, Secretary
U.S. GEOLOGICAL SURVEY
Charles G. Groat, Director
The use of firm, trade, and brand names in this report is for identification purposes only and doesnot constitute endorsement by the U.S. Geological Survey.
For additional information write to: Copies of this report can be purchased
U.S. Geological SurveyInformation ServicesBox 25286, Federal CenterDenver, CO 80225
from:
Chief, Office of Water QualityU.S. Geological Survey12201 Sunrise Valley Drive, MS 412Reston, VA 20192
Information regarding the U.S. Geological Survey National Water Quality Laboratory is available onthe Internet at URL <http://wwwnwql.cr.usgs.gov>.

New Reporting Procedures Based on Long-Term Method Detection Levels and Some Considerations for Interpretations of Water-Quality Data Provided by the U.S. Geological Survey National Water Quality Laboratory
By Carolyn J. Oblinger Childress, William T. Foreman, Brooke F. Connor, and Thomas J. Maloney
ABSTRACT
This report describes the U.S. Geological Survey National Water Quality Laboratory’s approach for determining long-term method detection levels and establishing reporting levels, details relevant new reporting conventions, and provides preliminary guidance on interpreting data reported with the new conventions. At the long-term method detection level concentration, the risk of a false positive detection (analyte reported present at the long-term method detection level when not in sample) is no more than 1 percent. However, at the long-term method detection level, the risk of a false negative occurrence (analyte reported not present when present at the long-term method detection level concentration) is up to 50 percent. Because this false negative rate is too high for use as a default “less than” reporting level, a more reliable laboratory reporting level is set at twice the determined long-term method detection level. For all methods, concentrations measured between the laboratory reporting level and the long-term method detection level will be reported as estimated concentrations. Non-detections will be censored to the laboratory reporting level.
Adoption of the new reporting conventions requires a full understanding of how low-
concentration data can be used and interpreted and places responsibility for using and presenting final data with the user rather than with the laboratory. Users must consider that (1) new laboratory reporting levels may differ from previously established minimum reporting levels, (2) long-term method detection levels and laboratory reporting levels may change over time, and (3) estimated concentrations are less certain than concentrations reported above the laboratory reporting level. The availability of uncensored but qualified low-concentration data for interpretation and statistical analysis is a substantial benefit to the user. A decision to censor data after they are reported from the laboratory may still be made by the user, if merited, on the basis of the intended use of the data.
INTRODUCTION
Many U.S. Geological Survey (USGS) studies focus on interpretations of low concentrations of chemical constituents. The National Water Quality Laboratory (NWQL) of the USGS has developed a new low-concentration reporting convention that produces an important benefit to these studies by providing estimates of analytes detected at low concentrations. These values are reported rather than being censored at
Abstract 1
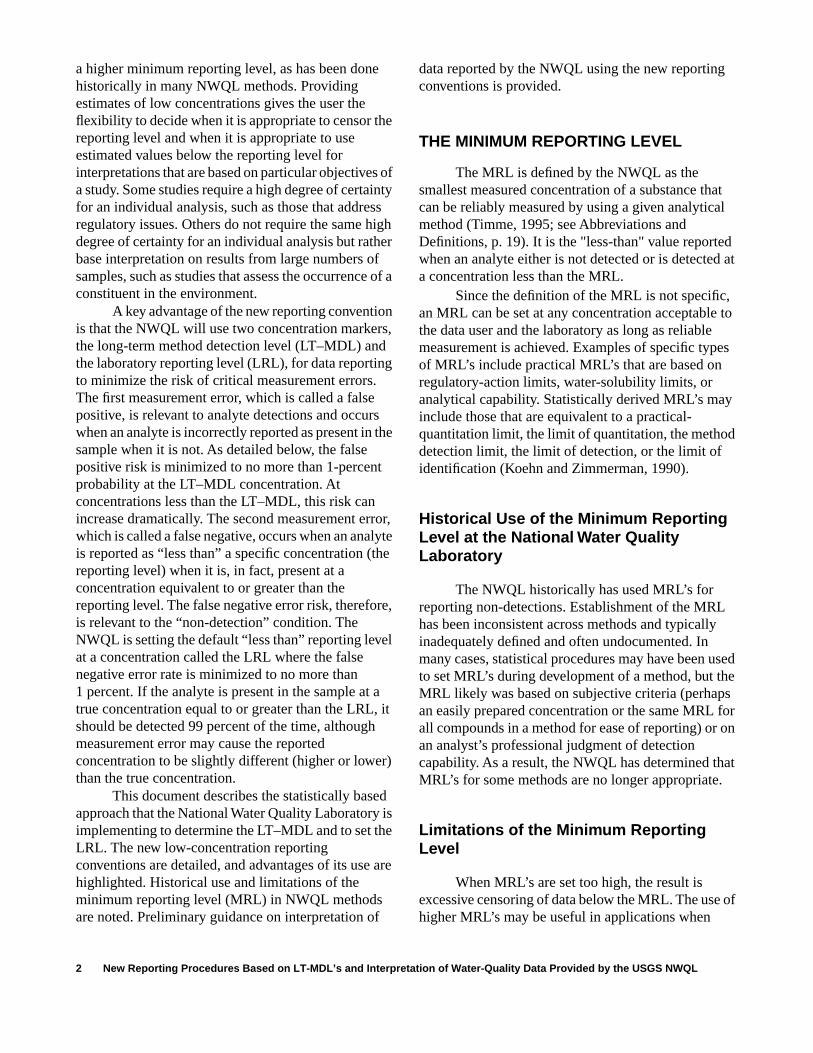
a higher minimum reporting level, as has been done historically in many NWQL methods. Providing estimates of low concentrations gives the user the flexibility to decide when it is appropriate to censor the reporting level and when it is appropriate to use estimated values below the reporting level for interpretations that are based on particular objectives of a study. Some studies require a high degree of certainty for an individual analysis, such as those that address regulatory issues. Others do not require the same high degree of certainty for an individual analysis but rather base interpretation on results from large numbers of samples, such as studies that assess the occurrence of a constituent in the environment.
A key advantage of the new reporting convention is that the NWQL will use two concentration markers, the long-term method detection level (LT–MDL) and the laboratory reporting level (LRL), for data reporting to minimize the risk of critical measurement errors. The first measurement error, which is called a false positive, is relevant to analyte detections and occurs when an analyte is incorrectly reported as present in the sample when it is not. As detailed below, the false positive risk is minimized to no more than 1-percent probability at the LT–MDL concentration. At concentrations less than the LT–MDL, this risk can increase dramatically. The second measurement error, which is called a false negative, occurs when an analyte is reported as “less than” a specific concentration (the reporting level) when it is, in fact, present at a concentration equivalent to or greater than the reporting level. The false negative error risk, therefore, is relevant to the “non-detection” condition. The NWQL is setting the default “less than” reporting level at a concentration called the LRL where the false negative error rate is minimized to no more than 1 percent. If the analyte is present in the sample at a true concentration equal to or greater than the LRL, it should be detected 99 percent of the time, although measurement error may cause the reported concentration to be slightly different (higher or lower) than the true concentration.
This document describes the statistically based approach that the National Water Quality Laboratory is implementing to determine the LT–MDL and to set the LRL. The new low-concentration reporting conventions are detailed, and advantages of its use are highlighted. Historical use and limitations of the minimum reporting level (MRL) in NWQL methods are noted. Preliminary guidance on interpretation of
data reported by the NWQL using the new reporting conventions is provided.
THE MINIMUM REPORTING LEVEL
The MRL is defined by the NWQL as the smallest measured concentration of a substance that can be reliably measured by using a given analytical method (Timme, 1995; see Abbreviations and Definitions, p. 19). It is the "less-than" value reported when an analyte either is not detected or is detected at a concentration less than the MRL.
Since the definition of the MRL is not specific, an MRL can be set at any concentration acceptable to the data user and the laboratory as long as reliable measurement is achieved. Examples of specific types of MRL’s include practical MRL’s that are based on regulatory-action limits, water-solubility limits, or analytical capability. Statistically derived MRL’s may include those that are equivalent to a practical-quantitation limit, the limit of quantitation, the method detection limit, the limit of detection, or the limit of identification (Koehn and Zimmerman, 1990).
Historical Use of the Minimum Reporting Level at the National Water Quality Laboratory
The NWQL historically has used MRL’s for reporting non-detections. Establishment of the MRL has been inconsistent across methods and typically inadequately defined and often undocumented. In many cases, statistical procedures may have been used to set MRL’s during development of a method, but the MRL likely was based on subjective criteria (perhaps an easily prepared concentration or the same MRL for all compounds in a method for ease of reporting) or on an analyst’s professional judgment of detection capability. As a result, the NWQL has determined that MRL’s for some methods are no longer appropriate.
Limitations of the Minimum Reporting Level
When MRL’s are set too high, the result is excessive censoring of data below the MRL. The use of higher MRL’s may be useful in applications when
2 New Reporting Procedures Based on LT-MDL’s and Interpretation of Water-Quality Data Provided by the USGS NWQL

Figure 1.
The spike concentration in relation to the expected method detection limit (MDL).
0
Spike concentration at 1 to 5
times the expected MDL
Expected MDL
CONCENTRATION
analyte concentrations are tested only for exceedance of regulatory criteria, such as drinking-water maximum contaminant levels, or when low-concentration detections are not important. Higher MRL’s increase the probability of providing a true statement that the analyte is present when reported as detected, although it does not necessarily increase the accuracy of the measured value.
When MRL’s are set too low, the result can be data that are misleading. False positives and negatives increase in frequency near the concentration at which the method is unable to distinguish noise from analyte signal. For example, consider two blind samples (meaning an analyst is unaware that they are quality-control samples) that are submitted for analysis using a method where the MRL’s are close to the limit of detection. One sample is a blank and the other sample is a low-concentration spike—spiked at a concen-tration at or just above the low MRL. Multiple analyses of the blank sample occasionally will result in a detection—a false positive—because the distribution of random signal from the instrument occasionally will result in a concentration high enough to be reported at or above the MRL. Multiple analyses of the low-concentration spike sample will result in an occasional non-detection, even though the analytes are present, because the distribution of measured concentrations occasionally will be less than the MRL—a false negative.
A sample with a true concentration at the MRL, if measured multiple times, would result in a distribution of values—some greater than the MRL and thus reported as detected, and some less than the MRL and thus censored and reported as “<MRL.” Not detected does not imply not present. Data users must be aware that this situation exists regardless of the value of the MRL.
THE METHOD DETECTION LIMIT PROCEDURE OF THE U.S. ENVIRONMENTAL PROTECTION AGENCY
The U.S. Environmental Protection Agency (USEPA) method detection limit (MDL) is described as the minimum concentration of a substance that can be measured and reported with 99-percent confidence that the analyte concentration is greater than zero (U.S. Environmental Protection Agency, 1997) and is
The Method Detection Lim
based on the approach of Glaser and others (1981). The MDL protects against incorrectly reporting the presence of a compound at low concentrations in cases when noise and actual analyte signal may be indistinguishable. The MDL concentration does not imply accuracy or precision of the quantitative measurement.
Reporting a detection when there is no substance present is known as a “false positive.” The USEPA MDL is designed to control against false positives at the 99-percent confidence level in an ideal matrix. Reporting the detection of a substance at the MDL concentration in a blank sample or a sample that does not contain the analyte should be rare (less than or equal to 1 percent). Therefore, a signal that represents the presence of a substance in a sample at the MDL concentration is not likely to be false.
The USEPA-prescribed determination of an MDL specifies a minimum of seven replicate (n) spikes prepared at an appropriately low concentration (generally 1 to 5 times the expected MDL) and processed through the entire analytical method (fig. 1). Although the USEPA procedure does not specify the time frame for conducting these measure-ments, analysis of the spike samples commonly is performed over a short period—usually only a few days. The spiked matrix typically is reagent water or, for sediment and tissue samples, clean sand, sodium sulfate, or a well-characterized natural material that does not contain the substance. The best-case condition assumes the use of a clean matrix.
Collection of data points at this spike concentration produces a distribution of measured concentrations. As an example, figure 2 shows the resultant distribution (histogram) of measured concentrations of chlorobenzene obtained from 50 injections of a 0.05-microgram per liter (µg/L)
it Procedure of the U.S. Environmental Protection Agency 3
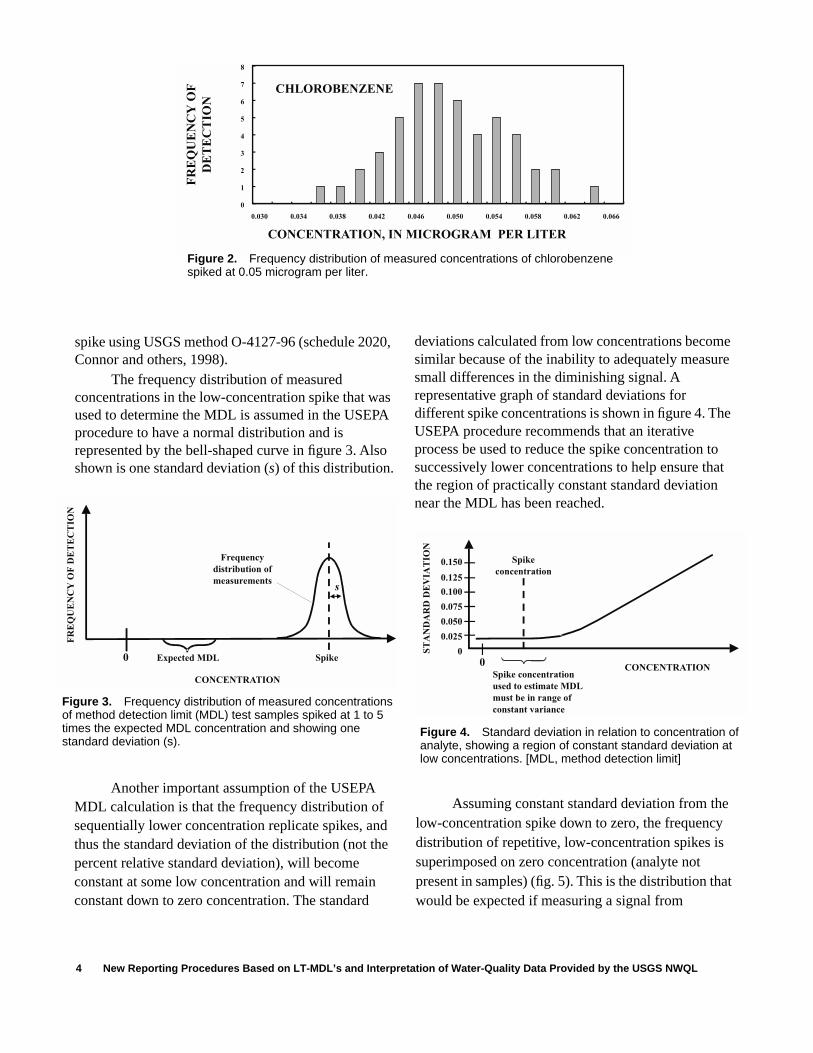
Figure 2.
Frequency distribution of measured concentrations of chlorobenzene spiked at 0.05 microgram per liter.
F
ots
FR
EQ
UE
NC
YO
F
DE
TE
CT
ION
CHLOROBENZENE
0
1
2
3
4
5
6
7
8
0.030 0.034 0.038 0.042 0.046 0.050 0.054 0.058 0.062 0.066
CONCENTRATION, IN MICROGRAM PER LITER
CHLOROBENZENE
spike using USGS method O-4127-96 (schedule 2020, Connor and others, 1998).
The frequency distribution of measured concentrations in the low-concentration spike that was used to determine the MDL is assumed in the USEPA procedure to have a normal distribution and is represented by the bell-shaped curve in figure 3. Also shown is one standard deviation (s) of this distribution.
0Spike concentration
used to estimate MDL
must be in range of
constant variance
ST
AN
DA
RD
DE
VIA
TIO
N
0.150
0.125
0.100
0.075
0.050
0.025
0
Spike
concentration
CONCENTRATION
igure 3. Frequency distribution of measured concentrations f method detection limit (MDL) test samples spiked at 1 to 5 imes the expected MDL concentration and showing one tandard deviation (s).
Figure 4. Standard deviation in relation to concentration of analyte, showing a region of constant standard deviation at low concentrations. [MDL, method detection limit]
Expected MDL
FR
EQ
UE
NC
YO
FD
ET
EC
TIO
N
0
s
Spike
Frequency
distribution of
measurements
CONCENTRATION
Another important assumption of the USEPA MDL calculation is that the frequency distribution of sequentially lower concentration replicate spikes, and thus the standard deviation of the distribution (not the percent relative standard deviation), will become constant at some low concentration and will remain constant down to zero concentration. The standard
4 New Reporting Procedures Based on LT-MDL’s and Interpre
deviations calculated from low concentrations become similar because of the inability to adequately measure small differences in the diminishing signal. A representative graph of standard deviations for different spike concentrations is shown in figure 4. The USEPA procedure recommends that an iterative process be used to reduce the spike concentration to successively lower concentrations to help ensure that the region of practically constant standard deviation near the MDL has been reached.
Assuming constant standard deviation from the low-concentration spike down to zero, the frequency distribution of repetitive, low-concentration spikes is superimposed on zero concentration (analyte not present in samples) (fig. 5). This is the distribution that would be expected if measuring a signal from
tation of Water-Quality Data Provided by the USGS NWQL
1-percent chance of
false positive
0
s � t
FR
EQ
UE
NC
YO
FD
ET
EC
TIO
N
Not drawn to scaleMDL
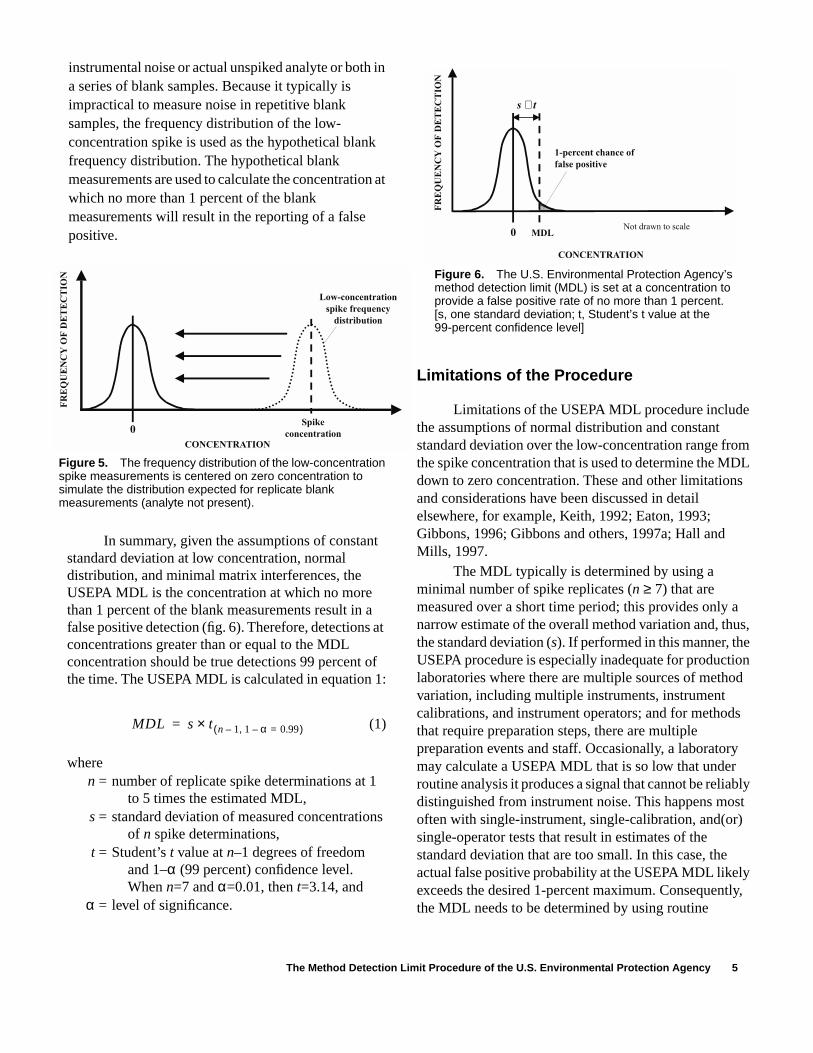
instrumental noise or actual unspiked analyte or both in a series of blank samples. Because it typically is impractical to measure noise in repetitive blank samples, the frequency distribution of the low-concentration spike is used as the hypothetical blank frequency distribution. The hypothetical blank measurements are used to calculate the concentration at which no more than 1 percent of the blank measurements will result in the reporting of a false positive.
Figure 5. The frequency distribution of the low-concentration spike measurements is centered on zero concentration to simulate the distribution expected for replicate blank measurements (analyte not present).
Figure 6. The U.S. Environmental Protection Agency’s method detection limit (MDL) is set at a concentration to provide a false positive rate of no more than 1 percent. [s, one standard deviation; t, Student’s t value at the 99-percent confidence level]
Low-concentration
spike frequency
distribution
0
FR
EQ
UE
NC
YO
FD
ET
EC
TIO
N
CONCENTRATION
Spike
concentration
CONCENTRATION
In summary, given the assumptions of constant standard deviation at low concentration, normal distribution, and minimal matrix interferences, the USEPA MDL is the concentration at which no more than 1 percent of the blank measurements result in a false positive detection (fig. 6). Therefore, detections at concentrations greater than or equal to the MDL concentration should be true detections 99 percent of the time. The USEPA MDL is calculated in equation 1:
(1)
wheren = number of replicate spike determinations at 1
to 5 times the estimated MDL,s = standard deviation of measured concentrations
of n spike determinations,t = Student’s t value at n–1 degrees of freedom
and 1–α (99 percent) confidence level. When n=7 and α=0.01, then t=3.14, and
α = level of significance.
MDL s t n 1– 1 α–, 0.99=( )×=
The Method Detection L
Limitations of the Procedure
Limitations of the USEPA MDL procedure include the assumptions of normal distribution and constant standard deviation over the low-concentration range from the spike concentration that is used to determine the MDL down to zero concentration. These and other limitations and considerations have been discussed in detail elsewhere, for example, Keith, 1992; Eaton, 1993; Gibbons, 1996; Gibbons and others, 1997a; Hall and Mills, 1997.
The MDL typically is determined by using a minimal number of spike replicates (n ≥ 7) that are measured over a short time period; this provides only a narrow estimate of the overall method variation and, thus, the standard deviation (s). If performed in this manner, the USEPA procedure is especially inadequate for production laboratories where there are multiple sources of method variation, including multiple instruments, instrument calibrations, and instrument operators; and for methods that require preparation steps, there are multiple preparation events and staff. Occasionally, a laboratory may calculate a USEPA MDL that is so low that under routine analysis it produces a signal that cannot be reliably distinguished from instrument noise. This happens most often with single-instrument, single-calibration, and(or) single-operator tests that result in estimates of the standard deviation that are too small. In this case, the actual false positive probability at the USEPA MDL likely exceeds the desired 1-percent maximum. Consequently, the MDL needs to be determined by using routine
imit Procedure of the U.S. Environmental Protection Agency 5

Figure 7.
The long-term method detection level (LT–MDL) compared to the method detection limit (MDL) determined by the U.S. Environmental Protection Agency procedure.
Frequency
distribution
for MDL
0 MDL
FR
EQ
UE
NC
YO
FD
ET
EC
TIO
N
LT–MDL
Frequency
distribution
for LT–MDL
conditions and procedures. This means conducting the determination over an extended time period by using all method instrumentation and as many variables as feasible to obtain a more accurate and realistic measurement of the standard deviation near the MDL.
Use by the National Water Quality Laboratory
In 1992, the NWQL began applying the USEPA procedure (U.S. Environmental Protection Agency, 1984, 1997 [Note: Revision 1.11 has remained unchanged since 1984]) for determining MDL’s for two methods developed for the National Water-Quality Assessment Program. These methods were for pesticides in water by C-18 solid-phase extraction with analysis by gas chromatography/mass spectrometry (NWQL analytical schedules 2001/2010; Zaugg and others, 1995) and pesticides in water by Carbopak-B solid-phase extraction with analysis by high performance liquid chromatography with diode array detection (schedules 2050/2051; Werner and others, 1996). For these methods, the reporting level was set equivalent to the MDL determined by using the USEPA procedure for all analytes in schedules 2001/2010 (Zaugg and others, 1995, table 9) and for 20 of the 41 analytes in schedules 2050/2051 (U.S. Geological Survey National Water Quality Laboratory Technical Memorandum 98.03A, 1997). The data-reporting conventions used for these methods were detailed in U.S. Geological Survey National Water Quality Laboratory Technical Memorandum 94.12 (1994). The USEPA procedure was chosen because it was viewed by the NWQL as being a “generally accepted” procedure for determining MDL’s; it is required by USEPA as a test of acceptable performance of analytical method detection capability for laboratories that use USEPA methods. Additionally, the USEPA MDL procedure is a statistically based approach that could be applied consistently across all NWQL methods.
THE U.S. GEOLOGICAL SURVEY’S NEW REPORTING PROCEDURE BASED ON LONG-TERM METHOD DETECTION LEVELS
A team was formed at the NWQL and included District and Office of Water Quality representation.
6 New Reporting Procedures Based on LT-MDL’s and Interpre
The mission of this team was to address the limitations of the USEPA MDL procedure in relation to its use at the NWQL and to recommend an alternative for determining method detection levels and setting reporting conventions.
The MDL team recommended a new approach—the long-term method detection level (LT–MDL)— for the determination of an MDL that is based on a modification of the USEPA MDL procedure. The LT–MDL is designed to capture greater method variability because it
1. Requires a larger number of replicate spike samples—at least 24 per year;
2. Requires data collection over an extended period of time—typically 6 to 12 months; and
3. Incorporates more of the measurement variability that is typical for routine analyses in a production laboratory, such as multiple instruments, operators, calibrations, and sample preparation events.
Because this approach is designed to measure more sources of variability, the LT–MDL is expected to be higher than the MDL obtained by using the USEPA procedure (fig. 7). Although the procedure for determining the LT–MDL captures a more representative measure of method variability, including blank contributions to the variability, it still relies on several key assumptions underlying the USEPA MDL procedure, including
1. Normal frequency distribution,2. Constant standard deviation, and3. Best-case detection condition because LT–
MDL’s typically are determined by using spikes in a clean matrix, for example, reagent water.
tation of Water-Quality Data Provided by the USGS NWQL

Figure 8.
False negative probability when a sample contains the analyte at the method detection limit (MDL) concentration.
CONCENTRATION
0 MDL
s � t 50-percent chance of
false negative
At the LT–MDL concentration, the chance of a false positive detection is statistically limited to ≤1 percent. At concentrations less than the LT–MDL, the risk of false positive detections can increase rapidly. Therefore, for all inorganic and many organic methods, the LT–MDL concentration is the lowest concentration that will be reported by the NWQL, along with an estimated “E” remark code, for a qualitatively detected analyte. Mass spectrometric or photodiode array ultraviolet/visible spectroscopic detectors used for organic methods are classified by the NWQL as “information-rich” methods because they have enhanced analyte identification capabilities. For these methods, the NWQL will report values below the LT–MDL, along with an estimated “E” remark code, because the criteria for identification must be met before quantitative results are reported (see “New Reporting Conventions” section). Although information-rich methods provide enhanced analyte identification capabilities, concentrations reported below the LT–MDL still have an increased risk (>1 percent) of being a false positive. Comparison of sample data relative to field and laboratory blank data is a critical quality-control step when interpreting data, and is particularly important when evaluating the quality of low-concentration data, especially data below the LT–MDL.
SETTING THE REPORTING LEVEL
The USEPA MDL procedure does not address the issue of setting reporting levels. Both the USEPA MDL and the LT–MDL focus exclusively on minimizing the risk of reporting a false positive. At the MDL concentration, however, the risk of a false negative is not adequately limited. A sample with a true concentration equal to the USEPA MDL or LT–MDL has a 50-percent chance of not being detected (Keith, 1992). This is shown in figure 8, where the frequency distribution is centered on the calculated MDL. Assuming that the MDL concentration does, indeed, represent a detection “limit” (that is, the analyte cannot be detected reliably at less than this concentration), then up to 50 percent of the measurements made of a sample having a true concentration equal to the MDL would be less than the MDL (shaded region in fig. 8) and, thus, would result in a false negative. The NWQL views a 50-percent probability of a false negative as
unacceptably high for use of the MDL as a reliable reporting level.
Recognizing the inadequacies of the MDL as a reporting level, laboratories often set quantification limits (operationally minimum reporting levels) at concentrations greater than the determined MDL’s and in a region that supports quantitative determination. For example, the reporting levels might be set at practical quantitation limits (PQL’s) that are 5 or 10 times the MDL (U.S. Environmental Protection Agency, 1985), or at the limit of quantitation (LOQ), which is a concentration 10 standard deviation units above the average blank response (Keith, 1992). More recently, the USEPA has suggested the use of a minimum level (ML), which is 3.18 times the MDL (for n = 7) (U.S. Environmental Protection Agency, 1993). Gibbons and others (1997a, b) recommend use of an alternative minimum level (AML) that is derived from a multiple-concentration calibration procedure that eliminates or minimizes many of the assumptions and limitations of the USEPA MDL and ML procedures.
In establishing the reporting level, the NWQL has set the acceptable rate of false negatives at no more than 1 percent. This requires the use of a different value from the LT–MDL as the reporting level. The laboratory reporting level (LRL) has been devised to meet this requirement and is comparable to the reliable detection level of Keith (1992) when the false positive and false negative rates are set at ≤1 percent. The LRL is calculated from the LT–MDL, as follows:
. (2)LRL 2 LT–MDL×=
Setting the Reporting Level 7

1-
of
As shown in figure 9, multiple measurements of a sample having a true concentration at the LRL should result in the concentration being detected and reported 99 percent of the time. Note that the reported concentration can be lower or higher than the true concentration at LRL. One percent of the measurements of this sample would result in a non-detection (shaded region in figure 9), because the measurements fall below the LT–MDL (again assuming that the LT–MDL represents a true “detection limit”).
Figure 9. The risk of a false negative (not detecting an analyte when it is present) at the laboratory reporting level (LRL) is no more than 1 percent. Note: The reported concentration might be less than or greater than the true concentration at the LRL. [LT–MDL, long-term method detection level]
CONCENTRATION
0
2 � LT–MDL
LT–MDL LRL
percent chance
false negative
For non-detections, reporting <LRL is more reliable than if a lower concentration is used, such as <LT–MDL, because of the increasing risk of a false negative report at decreasing concentration. For any given sample in which the analyte is not detected, there is no indication as to what concentration the analyte might be “less than” for reporting purposes. Therefore, <LRL is reported for non-detections because the risk of a false negative at LRL is no greater than 1 percent. The LRL was chosen as the default “less than” reporting level to protect against false negatives while simultaneously being set as low as practical to provide low-concentration environmental data that are needed for most studies conducted by the USGS.
An additional feature of the new reporting conventions is that, unlike the MRL convention that was used historically by the NWQL, positive detections below the LRL are not censored. Detected analytes with concentrations between the LT–MDL and the LRL are reported as estimated. This is because a detection in this region should have a ≤1-percent probability of being a false positive. Even less censoring occurs in
8 New Reporting Procedures Based on LT-MDL’s and Interpre
information-rich methods where estimated concentrations are provided for analytes detected below the LT–MDL.
NEW REPORTING CONVENTIONS
New reporting conventions were applied to four methods beginning October 1, 1998 (U.S. Geological Survey National Water Quality Laboratory Technical Memorandum 98.07, 1998) and will be applicable to selected high-demand NWQL water methods beginning in fiscal year 2000. For all methods, the new reporting conventions allow reporting of analytes detected at concentrations less than the LRL and as low as the LT–MDL, whereas non-detections are reported as <LRL. [Note: The LRL previously was called the non-detection value, or NDV (Connor and others, 1998; U.S. Geological Survey National Water Quality Laboratory Technical Memorandum 98.07, 1998), a term that is no longer used.]
The new low-concentration reporting conventions are outlined in figure 10. Conventions are shown for situations where the analyte is detected (shading) in the quantitative region and in the semiquantitative region above and, for information-rich methods, below the LT–MDL. Also shown are situations where the instrumental response is in the non-quantitative region where analyte detection is unclear and <LRL is reported. Conventions are shown for methods where the lowest calibration standard (LS) concentration is greater than or less than the LRL. Decreasing shading represents regions of increasing measurement uncertainty.
At concentrations less than the LRL, the risk of a false negative increases rapidly, and calibration standards with concentrations less than the LRL often may not be detected. Therefore, the LS used for quantitation typically will be at a concentration equivalent to or greater than the LRL. Realistically, data users should expect that analyte concentrations much less than LRL would not be consistently detected in samples over time. Additionally, the lower the reported result in relation to the LRL or the LS, the less accurate the measurement is likely to be. For this reason, the NWQL is qualifying all reported concentrations less than the LRL or the LS, whichever is higher, as estimated using an “E” remark code. Reported concentrations that are greater than the highest calibration standard also will receive an “E” remark code. The “E” remark code will be added to all
tation of Water-Quality Data Provided by the USGS NWQL

• Organonitrogen herbicides in water by C-18 solid-phase extraction GC/MS (schedule 1379; Sandstrom and others, 1992),
• Base-neutral/acid extractable compounds by GC-MS (schedule 1383; Wershaw and others, 1987).
2. High performance liquid chromatography with mass spectrometry (HPLC/MS); new methods under development.
3. High performance liquid chromatography with photodiode array ultraviolet/visible spectroscopy (HPLC/DAD); for example,• Pesticides in water by Carbopak-B solid-
phase extraction with analysis by HPLC/DAD (schedules 2050/2051; Werner and others, 1996).
These method types have qualifying information provided by the detector, in addition to signal and retention time matching, that enhance analyte identification. For mass spectral methods, the presence of characteristic mass spectral ions with correct ion ratios augment analyte identification. Characteristic absorption spectra are used to enhance analyte identification in photodiode array detection.
Because qualitative identification is required before a concentration is reported, information-rich methods will not be restricted to censoring all measurements below the LT–MDL. Therefore, information-rich methods will report estimated (“E” remark code) concentrations for all positively identified analytes below the LT–MDL if other quality control criteria, especially laboratory blank-related criteria, are met. Because data below the LT–MDL have an increased risk of false positives, data users should carefully examine these reported concentrations with respect to both laboratory and field blank data.
Additional reasons underlying the reporting changes are detailed in previous sections. The effect of potential yearly changes of LT–MDL’s and LRL’s in the USGS National Water Information System (NWIS) data base are discussed in the sections, “Considerations for Data Interpretation” and “Storing Data in the National Water Information System” that follow.
Use of the “E” Remark Code by the National Water Quality Laboratory
The “E” remark code currently (1999) is used to signify that a measured concentration is estimated by
the NWQL. The availability of remark codes in the NWIS data base is limited. A wide variety of conditions can justify evoking the “E” remark code other than those conditions shown in figure 10. Furthermore, some “E” coded values are more uncertain than others. For example, the “E” code also is used by the NWQL under the following conditions:
• Result was extrapolated above the calibration curve.
• Data quantification was not performed according to method-specific criteria.
• Performance of the analyte does not meet acceptable method-specific criteria. (Analytes that rarely meet criteria are permanently “E” coded.)
• Deviation from the standard operating procedure was required.
• Some moderate losses occurred in sample preparation but were not quantifiable.
• Moderate matrix interference conditions occurred. (Severe matrix interference results in raised reporting levels or deletion.)
PLANNED IMPLEMENTATION AT THE NATIONAL WATER QUALITY LABORATORY
New reporting conventions, described in the previous section, were applied to the four NWQL water matrix methods listed below, effective October 1, 1998. These methods were part of pilot studies testing the LT–MDL process. U.S. Geological Survey National Water Quality Laboratory Technical Memorandum 98.07 (1998) provides specific information regarding LT–MDL’s and reporting levels for the four methods.
1. Low-level volatile organic compounds (VOC’s) by gas chromatography/mass spectrometry (schedules 2020 and 2021),
2. Trace elements in filtered water by inductively coupled plasma–atomic emission spectrometry (ICP–AES),
3. Ammonia plus organic nitrogen (micro-Kjeldahl digestion), and
4. Phosphorus (micro-Kjeldahl digestion).
The NWQL has planned a phased implementation of the new reporting procedure for other methods. The first priority is to implement the procedure for high-demand water matrix methods, including all water matrix methods used by the
10 New Reporting Procedures Based on LT-MDL’s and Interpretation of Water-Quality Data Provided by the USGS NWQL

National Water Quality Assessment (NAWQA) and National Stream Quality Accounting Network (NASQAN) programs. High-demand inorganic chemistry methods are those that have more than 750 samples submitted per year. High-demand organic chemistry methods are those with more than 250 samples submitted per year. There are some analytical methods that do not require assessment by the LT–MDL process; these include regulatory methods and some methods developed to assess high concentrations of constituents. No change in the reporting levels of these analytical methods is planned.
In the next phase (fiscal year 1999) of implementation, LT–MDL’s are being determined for the following high-demand NWQL methods (Timme, 1995). Implementation of the new reporting conventions for these methods is planned for October 1, 1999.
Organic Chemistry Program:
1. Total organic carbon, lab code 114.2. Dissolved organic carbon, lab code 113.3. Gross phenols, lab code 2322.4. Chlorophenoxyacid herbicides, schedules 79
and 1304.5. Organophosphorus pesticides, schedule 1319.6. Organochlorine pesticides, schedule 1324.7. Base/neutral and acid extractable (BNA)
compounds, schedule 1383.8. Pesticides, solid-phase extraction, analysis by
gas chromatography/mass spectrometry, schedules 2001 and 2010.
9. Pesticides, solid-phase extraction, analysis by high performance liquid chromatography, schedules 2050 and 2051.
Inorganic Chemistry Program:
1. Metals, inductively coupled plasma/atomic emission spectrometry, whole water recoverable.
2. Metals, inductively coupled plasma/mass spectrometry methods, filtered- and whole-water recoverable.
3. Metals, graphite furnace atomic absorption spectrometry, filtered- and whole-water recoverable.
4. Ion-chromatography methods.5. All remaining NWQL water-matrix nutrient
methods.
6. Potassium, atomic absorption spectrometry.7. Mercury, cold vapor atomic absorption, filtered-
and whole-water recoverable.8. Silica, colorimetry.
CONSIDERATIONS FOR DATA INTERPRETATION
Adoption of the new reporting procedure places responsibility for using and presenting final data with the user rather than with the laboratory. Moreover, adoption of the new procedure results in significant benefits to the data user. Decisions about whether the intended use of the data merits censoring can be made by the user. If the intended use does not merit censoring, uncensored data are available for interpretation and statistical analysis. Thus, informed use of these data requires knowledge of the project data-quality objectives—the intended data use, the anticipated future uses of the data, and the effect of data certainty on the intended data interpretations.
Effect of Censoring on Data Distribution
A one-dimensional scatterplot shows how the different censoring methods—that is, MRL, LT–MDL, LRL, information rich—affect the distribution of a hypothetical data set (fig. 11). The x-axis scale is concentration, and data are randomly distributed vertically so that overlapping data points are easier to see. The uncensored data set includes values that range from about -3 to 22 (fig. 11A). These are hypothetical uncensored values, including negative values, as they would be read directly from an analytical instrument before reporting criteria have been applied by the laboratory. When data are censored to the MRL by the laboratory, all the values less than the MRL (in this example the MRL=8) are reported as <MRL. These censored concentrations have an unknown distribution less than the MRL as indicated on the graph by symbols with gray shading (fig. 11B). When the data are censored according to the new reporting procedure (in this example, the LT–MDL=3 and the LRL=6), values between the LRL and the LT–MDL are reported as estimated, whereas the values less than the LT–MDL are censored and reported as <LRL (fig. 11C). In essence, what is known about the low end of the concentration distribution is extended compared to what is known about this concentration distribution
Considerations for Data Interpretation 11

A. Uncensored data
B. Data censored to the MRL
C. Data estimated below the LRL and censored below the LT-MDL
D. Information-rich methods: data estimated below the LRL and LT-MDL, if detected
-4 0 LT-MDL LRL MRL 12 16 20 24
EXPLANATION
Estimated
Quantified
Censored
Dat
aar
era
ndom
lydis
trib
ute
dver
tica
lly
topre
ven
tdat
apoin
tsfr
om
over
lappin
g
Figure 11. One-dimensional distribution plots of (A) uncensored data and the same
data set censored using (B) the MRL procedure, (C) the LT MDL procedure, and
(D) the LT MDL procedure for information-rich methods. Censored data are reported
��
CONCENTRATION
Figure 11.
One-dimensional distribution plots of (A) uncensored data and the same data set censored by using (B) the MRL procedure, (C) the new reporting procedure, and (D) the new reporting procedure for information-rich methods. Censored data are reported as less than the censoring level. [MRL, minimum reporting level; LRL, laboratory reporting level; LT–MDL, long-term method detection level]
when data are reported by using the MRL reporting procedure. For information-rich methods, only samples that produce no signal or fail identification criteria (qualitative non-detections) are censored and reported as <LRL. Concentrations of all other qualitatively detected analytes that are less than the LRL are estimated. This extends what is known about the low end of the distribution below the LT–MDL as shown in figure 11D.
Data Analysis
Compared to historical USGS data reported by using the MRL convention, the new low-concentration reporting conventions described in this document result in important differences in the way data are reported to the data user and in the way data and data sets can be used and interpreted. The new low-concentration reporting conventions also require that the user have a
as less than the censoring level.
12 New Reporting Procedures Based on LT-MDL’s and Interpretation of Water-Quality Data Provided by the USGS NWQL

clear understanding of the limitations of analytical detection at low-concentration ranges. Consider that:
1. Low-concentration data are reported to the user in one of three ways—quantified, estimated, or censored—based on the LT–MDL and LRL. The laboratory uses a statistically based procedure to determine at what concentration an analyte can be accurately measured. Put simply, if the concentration is greater than the LRL and LS, the laboratory almost always can measure it accurately. These data are reported to the user uncensored and unqualified. If the concentration is less than the LT–MDL, then the instrument signal cannot be distinguished from blank or background noise and cannot meet identification criteria; these data are censored to the LRL. If the concentration is between the LRL and LT–MDL, the laboratory’s ability to get a reliable measurement depends on factors such as the sample matrix, the instrument condition, and the instrument operator. These concentrations are reported with the qualification that the concentration is estimated (given an “E” remark code). For information-rich methods that have enhanced identification capabilities, estimated concentrations are provided for analytes detected below the LT–MDL (see previous discussion on information-rich methods).
2. The LT–MDL and LRL for each analyte may change as frequently as annually. Although annual changes are unlikely, the LT–MDL and LRL are re-evaluated annually on the basis of continuing quality-control data. Occasionally, an LT–MDL and LRL may change mid year as method changes are implemented or new instrumentation is used. Because of changes in reporting level due to annual re-evaluations and mid-year evaluations, project data collected over a number of years may have multiple LT–MDL’s and LRL’s.
3. It is likely that a significant number of reported values will be qualified. Under the new reporting procedure, the laboratory provides estimated concentrations for low-concentration data that previously would have been censored under the MRL convention.
4. Data that are censored to the LRL by the laboratory are mathematically identical to estimated values below the LRL—both are less
than the LRL. This adds a new level of complexity to data interpretation compared with data that are produced with the MRL reporting procedure. The user cannot assume that a censored value falls between the LRL and zero when performing statistical analysis because this would positively bias the data set. Instead, the user must know the applicable LT–MDL so that the censored value can be assumed, more appropriately, to fall between the LT–MDL and zero. As stated earlier, data reported as <LRL are those that were either not detected, failed identification criteria, or were detected at a concentration less than the LT–MDL where the risk of a false positive exceeds 1 percent.
Given these four conditions that result from the new reporting procedure, users must know and understand the level of data certainty required by project goals in order to appropriately analyze these data to meet project goals. Based on project data-quality objectives and knowledge of the basis for estimated and censored concentrations in the project data base and the effect of concentration qualifiers on planned data interpretations, the user can choose how to use qualified data (table 1). For a data report, data should be listed as reported by the NWQL with no user modification of qualified data. Using the example data set in figure 11, the 14 values that fall between the LRL and LT–MDL were reported as estimated concen-trations, the 9 values that are less than the LT–MDL were reported as <6, and the values greater than the LRL remain unqualified.
When examining an individual concentration as a basis to assess compliance with environmental regulations, a high degree of certainty is needed to account for the possibility of reporting a false positive or false negative concentration. That is, the user does not wish to report that a potential contaminant is present when it is not or that the analyte is absent when, in fact, it is present. The user may choose to increase data certainty by ignoring estimated concentrations and censoring all data at the LRL, at a higher historic MRL, or at any other project-specific level that is greater than the LRL. For example, in table 1, all estimated data in the example data set were censored to <6.
On the other hand, when interpreting large sets of data, either at a single site or at multiple sites, a higher level of uncertainty for any individual value may be acceptable. Many USGS occurrence-type studies fall into this category. Such studies often generate
Considerations for Data Interpretation 13
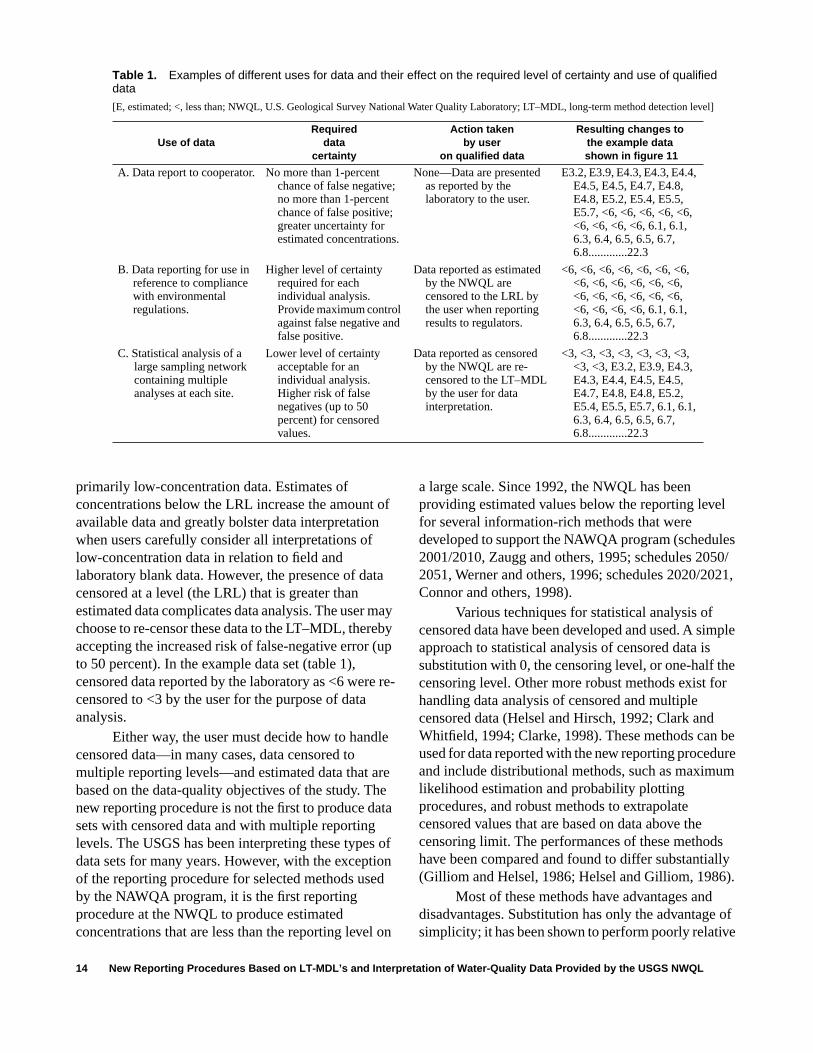
Table 1.
Examples of different uses for data and their effect on the required level of certainty and use of qualified data
[E, estimated; <, less than; NWQL, U.S. Geological Survey National Water Quality Laboratory; LT–MDL, long-term method detection level]
Use of dataRequired
data certainty
Action taken by user
on qualified data
Resulting changes tothe example data
shown in figure 11
A. Data report to cooperator. No more than 1-percent chance of false negative; no more than 1-percent chance of false positive; greater uncertainty for estimated concentrations.
None—Data are presented as reported by the laboratory to the user.
E3.2, E3.9, E4.3, E4.3, E4.4, E4.5, E4.5, E4.7, E4.8, E4.8, E5.2, E5.4, E5.5, E5.7, <6, <6, <6, <6, <6, <6, <6, <6, <6, 6.1, 6.1, 6.3, 6.4, 6.5, 6.5, 6.7, 6.8.............22.3
B. Data reporting for use in reference to compliance with environmental regulations.
Higher level of certainty required for each individual analysis. Provide maximum control against false negative and false positive.
Data reported as estimated by the NWQL are censored to the LRL by the user when reporting results to regulators.
<6, <6, <6, <6, <6, <6, <6, <6, <6, <6, <6, <6, <6, <6, <6, <6, <6, <6, <6, <6, <6, <6, <6, 6.1, 6.1, 6.3, 6.4, 6.5, 6.5, 6.7, 6.8.............22.3
C. Statistical analysis of a large sampling network containing multiple analyses at each site.
Lower level of certainty acceptable for an individual analysis. Higher risk of false negatives (up to 50 percent) for censored values.
Data reported as censored by the NWQL are re-censored to the LT–MDL by the user for data interpretation.
<3, <3, <3, <3, <3, <3, <3, <3, <3, E3.2, E3.9, E4.3, E4.3, E4.4, E4.5, E4.5, E4.7, E4.8, E4.8, E5.2, E5.4, E5.5, E5.7, 6.1, 6.1, 6.3, 6.4, 6.5, 6.5, 6.7, 6.8.............22.3
primarily low-concentration data. Estimates of concentrations below the LRL increase the amount of available data and greatly bolster data interpretation when users carefully consider all interpretations of low-concentration data in relation to field and laboratory blank data. However, the presence of data censored at a level (the LRL) that is greater than estimated data complicates data analysis. The user may choose to re-censor these data to the LT–MDL, thereby accepting the increased risk of false-negative error (up to 50 percent). In the example data set (table 1), censored data reported by the laboratory as <6 were re-censored to <3 by the user for the purpose of data analysis.
Either way, the user must decide how to handle censored data—in many cases, data censored to multiple reporting levels—and estimated data that are based on the data-quality objectives of the study. The new reporting procedure is not the first to produce data sets with censored data and with multiple reporting levels. The USGS has been interpreting these types of data sets for many years. However, with the exception of the reporting procedure for selected methods used by the NAWQA program, it is the first reporting procedure at the NWQL to produce estimated concentrations that are less than the reporting level on
a large scale. Since 1992, the NWQL has been providing estimated values below the reporting level for several information-rich methods that were developed to support the NAWQA program (schedules 2001/2010, Zaugg and others, 1995; schedules 2050/2051, Werner and others, 1996; schedules 2020/2021, Connor and others, 1998).
Various techniques for statistical analysis of censored data have been developed and used. A simple approach to statistical analysis of censored data is substitution with 0, the censoring level, or one-half the censoring level. Other more robust methods exist for handling data analysis of censored and multiple censored data (Helsel and Hirsch, 1992; Clark and Whitfield, 1994; Clarke, 1998). These methods can be used for data reported with the new reporting procedure and include distributional methods, such as maximum likelihood estimation and probability plotting procedures, and robust methods to extrapolate censored values that are based on data above the censoring limit. The performances of these methods have been compared and found to differ substantially (Gilliom and Helsel, 1986; Helsel and Gilliom, 1986).
Most of these methods have advantages and disadvantages. Substitution has only the advantage of simplicity; it has been shown to perform poorly relative
14 New Reporting Procedures Based on LT-MDL’s and Interpretation of Water-Quality Data Provided by the USGS NWQL

to other more theoretically based methods, which result in bias, either high or low depending on the value substituted (Helsel and Hirsch, 1992). Distributional and robust methods have been widely used in the USGS, and some software already exists to perform these methods. Probability plot methods can be computed with standard statistics software. Distributional methods depend, however, on the assumption that the data fit an assumed distribution. In addition, data may be subject to transformation bias. For robust methods, the distribution of data above the censoring level is used to extrapolate values below the censoring level, providing the advantage that the distribution is based on observed data rather than assumed. Both the distributional methods and robust methods work poorly with small sample sizes.
Multiple censoring levels also complicate data analysis. Most simply, data with multiple censoring levels may be set to the highest reporting level in the data set. By use of this simple approach, estimated and quantified concentrations less than the reporting level also would be censored. Assuming that year-to-year changes in the LRL are small and that the LRL’s are not substantially different from the historical MRL, setting quantified data to higher censoring levels may not result in a severe loss of information. However, if the difference between the historical MRL and new LRL is large, if year-to-year changes in the LRL are large, or if many estimated values must be censored, significant loss of information could occur. For these reasons, resetting data to the highest reporting level often is not an appropriate approach.
A unique consideration posed by data produced with the new reporting procedure is that the censoring level (LRL) is greater than the level used to determine when values should be qualified as estimated (LT–MDL). Consequently, the use of distributional or robust methods to extrapolate data censored to the LRL within the range of 0 to the LRL will result in a positive bias. This is because only measurements that are either less than the LT–MDL or non-detections are reported as <LRL. The censoring level must be viewed as a reporting level and should not be used to determine the upper limit for methods of extrapolation. Instead, the user should use the LT–MDL as the appropriate upper limit for extrapolation of censored values when using distributional or robust methods for interpretation of censored data. Improved statistical techniques and new software need to be developed to provide data users
with an easy method to handle this and other multiple reporting-level issues.
STORING DATA IN THE NATIONAL WATER INFORMATION SYSTEM
Establishing the LRL is a continuous process with annual re-determination of the LT–MDL. Year-to-year re-determination results in changes to the LT–MDL and LRL only if a t-test indicates that the standard deviations used to determine the LT–MDL are significantly different at the 95-percent confidence level. These updates, when necessary, are announced by the NWQL at the beginning of each water year (October 1). A significant shift in the LT–MDL and LRL of an analyte will be reflected in a change in data reporting—either to a higher or lower LRL and LT–MDL. Updated LT–MDL’s and LRL’s will not result in changes to historical LT–MDL’s and LRL’s, or any associated sample data, in the data base.
To fully understand and interpret data reported by using the new reporting procedure, one must know the applicable LRL and the LT–MDL in addition to the reported concentration. If the LS exceeds the LRL and the reported value is estimated between the LS and LRL, the concentration of the LS must also be known. The current version of the National Water Information System (NWIS) data base does not have the capability to store this information within the record for a single sample. Until this information can be stored in NWIS, the NWQL will maintain information on established LRL’s and LT–MDL’s for each constituent in published method reports, NWQL technical memoranda, and at the NWQL web page <http://wwwnwql.cr.usgs.gov>. Under the “Technical Information” section on this web page, click on “Long-Term Method Detection Level and Laboratory Reporting Level Information.” Data must be referenced by parameter code, method code, and date of analysis.
Enhancements to Remark Code in the National Water Information System
Until the NWIS data base is revised to include qualification codes, users cannot distinguish between values estimated because of the new reporting procedure and those estimated by use of other analytical considerations, such as matrix interference, extrapolation above the calibration standards, effects of
Storing Data in the National Water Information System 15

sample dilution, and other conditions (see previous discussion on data reporting). Supplemental coding schemes may be available for future versions of NWIS. The capability to associate qualifiers with remark codes will be added. Qualifiers will identify the specific condition that evoked use of the "E" remark code. With this information, for example, the user can determine if a value was estimated because of a problem that occurred during sample preparation or if the value is between the LS and the LRL. Until these enhancements are made to NWIS, information on why the datum was given an “E” remark code will reside in analyst notes at the NWQL.
Impact on Historical Data
The significance of the effect of the current change in reporting conventions on interpretations by using current and historical data depends, in part, on which of the following two outcomes applies to the data being retrieved:
1. The new LRL is less than or close to the historical MRL for a specific analysis, or
2. The new LRL is substantially greater than the historical MRL for a specific analysis.
For the first outcome, no special action is required. Uses or interpretations that require combining historical and new data may require working with multiple reporting levels as described above. For the second outcome, more caution is needed when historical and current data are combined and interpreted. A new reporting level (LRL) that is substantially higher than the historical MRL indicates that the MRL was most likely set too low. Most historical data that are reported substantially below the new LRL should be considered estimated concentrations at best. For information-rich methods, however, detections are considered accurate even if the LRL is substantially higher than the historical MRL. Non-detections that were reported at a lower MRL (reported as <MRL) might be more appropriately censored to the new, higher LRL (<LRL). When project objectives require a high degree of certainty, users may choose to censor all historical data at the new LRL if, for example, the data will be used to determine compliance with environmental regulations at a particular site. These are actions that must be considered and applied by the user after retrieving historical data from the data base. No changes that are
based on new LRL’s will be made to data already stored in the data base.
EXPLANATION OF THE REPORTING CONVENTION FOR LONG-TERM METHOD DETECTION LEVELS FOR THE STATE ANNUAL DATA REPORTS
The following paragraphs should be added to the introduction of each State annual data report as an explanation of the reporting convention used by the NWQL.
The USGS National Water Quality Laboratory collects quality-control data on a continuing basis to evaluate selected analytical methods to determine long-term method detection levels (LT–MDL’s) and laboratory reporting levels (LRL’s). These values are re-evaluated each year on the basis of the most recent quality-control data and, consequently, may change from year to year.
This reporting procedure limits the occurrence of false positive error. The chance of falsely reporting a concentration greater than the LT–MDL for a sample in which the analyte is not present is 1 percent or less. Application of the LRL limits the occurrence of false negative error. The chance of falsely reporting a non-detection for a sample in which the analyte is present at a concentration equal to or greater than the LRL is 1 percent or less.
Accordingly, concentrations are reported as <LRL for samples in which the analyte was either not detected or did not pass identification. Analytes that are detected at concentrations between the LT–MDL and LRL and that pass identification criteria are estimated. Estimated concentrations will be noted with a remark code of “E.” These data should be used with the understanding that their uncertainty is greater than that of data reported without the “E” remark code.
SUMMARY
The National Water Quality Laboratory (NWQL) has implemented new procedures for establishing reporting levels and for reporting low-concentration data that are produced by inorganic and organic methods. Advantages of this implementation include
• A statistically based approach for the determination of long-term method detection
16 New Reporting Procedures Based on LT-MDL’s and Interpretation of Water-Quality Data Provided by the USGS NWQL
levels (LT–MDL’s) that is applied uniformly to most NWQL methods and is determined by using routine production-laboratory conditions.
• The use of the LT–MDL as the lowest reported concentration provided by most methods to help minimize the risk of reporting a false positive (analyte reported present when it actually is not in the sample). The risk of reporting a false positive that has a concentration equal to or greater than the LT–MDL concentration should be no more than 1 percent.
• The reporting of estimated concentrations below the LT–MDL for detected analytes determined by organic methods, such as mass spectrometric or photodiode array ultraviolet/visible spectroscopic detection, that are classified by NWQL as “information-rich methods.”
• Yearly re-determinations of LT–MDL’s to provide a continuous assessment and updating of method detection capability at low concentration.
• Availability of performance information (mean, standard deviation, and 95-percent confidence interval of mean, percent recovered) for low-concentration quality-control spike samples that are used to determine the LT–MDL.
• A documented procedure for establishing the default “less than” reporting level (called the laboratory reporting level [LRL]) that is calculated by using the LT–MDL. [LRL = 2 × LT–MDL]
• A minimized risk of reporting a false negative at the LRL. No more than 1-percent probability of reporting that the analyte is not present when it actually is present at or above the LRL concentration. If the true concentration of the analyte in the sample is equivalent to the LRL concentration, the analyte should be detected and reported 99 percent of the time, although the reported concentration might be greater or less than the true concentration.
• Data-reporting conventions that provide more low-concentration data. Estimated (“E” coded) concentrations are provided for analytes detected in the region from the LRL or lowest calibration standard (LS), whichever is greater, down to the LT–MDL.
Some LT–MDL’s and LRL’s will change over time. Reporting-level changes are scheduled to take effect at the beginning of the water year (October 1).
To interpret data reported under the new conventions, users must know the applicable LRL, LT–MDL, and in some cases, the LS, in addition to the reported concentration. Until this information can be stored with the analyte concentration in NWIS, it will be available to data users at the NWQL web site <http://wwwnwql.cr.usgs.gov>. Under the “Technical Information” section on this web page, click on “Long-Term Method Detection Level and Laboratory Reporting Level Information.”
Adoption of the LT–MDL process places responsibility for using and presenting final data with the user rather than with the laboratory and results in substantial interpretive benefits to the data user. Decisions about whether the intended use of the data merits censoring can be made by the user, although uncensored data are available for interpretation and statistical analysis if that is the intended use. Informed use of these data requires knowledge of how the data will be used, what the anticipated future uses of the data are, and how data certainty affects intended data interpretations.
The effect of this change in reporting conventions on interpretations when using current and historical data depends on whether the new LRL is less than or close to the historical minimum reporting level (MRL) or is substantially greater than the historical MRL. For the former outcome, no special action is required. The latter outcome requires more caution as historical and current data are combined and interpreted because the higher new LRL might indicate that the previous MRL was set too low. Thus, historical data reported below the new LRL might be considered estimated values at a minimum. The user may choose to censor historical data in data reports at the new LRL when a high degree of certainty is required. These are actions that must be applied to the data by the user after retrieving historical data from the data base. No changes will be made to data already stored in the data base based on new LRL’s.
REFERENCES
Clarke, J.U., 1998, Evaluation of censored data methods to allow statistical comparisons among very small samples with below detection limit observations: Environmental Sciences and Technology, v. 32, no. 1, p. 177–183.
References 17

Clark, M.J.R., and Whitfield, P.H., 1994, Conflicting perspectives about detection limits and about the censoring of environmental data: Water Resources Bulletin, v. 30, no. 6, p. 1063–1079.
Connor, B.F., Rose, D.L., Noriega, M.C., Murtagh, L.K., and Abney, S.R., 1998, Methods of analysis by the U.S. Geological Survey National Water Quality Laboratory—Determination of 86 volatile organic compounds in water by gas chromatography/mass spectrometry, including detections less than reporting levels: U.S. Geological Survey Open-File Report 97–829, 78 p.
Eaton, A., 1993, Estimation of interlaboratory MDLs and RQLs: Environmental Lab, v. 5, p. 10–14.
Gibbons, R.D., 1996, The problem with U.S. EPA’s method detection limit: American Environmental Lab, February 1996, p. 4–10.
Gibbons, R.D., Coleman, D.E., and Maddalone, R.F., 1997a, An alternative minimum level definition for analytical quantification: Environmental Science and Technology, v. 31, p. 2071–2077.
———1997b, Response to comment on “An alternative minimum level definition for analytical quantification”: Environmental Science and Technology, v. 31, p. 3729–3731.
Gilliom, R.J., and Helsel, D.R., 1986, Estimation of distributional parameters for censored trace level water quality data, Part 1. Estimation techniques: Water Resources Research, v. 22, p. 135–146.
Glaser, J.A., Foerst, D.L., McKee, G.D., Quave, S.A., and Budde, W.L., 1981, Trace analyses for wastewaters: Environmental Science and Technology, v.15, p. 1426–1435.
Hall, J.R., and Mills, S.A., III, 1997, Detection limits—Where are we going?: Water Environment Laboratory Solutions, December 1997/January 1998, p. 10–13.
Helsel, D.R., and Hirsch, R.M., 1992, Statistical methods in water resources: New York, Elsevier, 529 p.
Helsel, D.R., and Gilliom, R.J., 1986, Estimation of distributional parameters for censored trace level water quality data, Part 2. Verification and applications: Water Resources Research, v. 22, p. 147–155.
Keith, L.H., 1992, Environmental sampling and analysis—A practical guide: Chelsea, Mich., Lewis Publishers, p. 93–119.
Koehn, J.W., and Zimmerman, A.G., 1990, How low can you really go?: Environmental Lab, v. 2, p. 36–50.
Sandstrom, M.W., Wydoski, D.S., Schroeder, M.P., Zamboni, J.L., and Foreman, W.T., 1992, Methods of analysis by the U.S. Geological Survey National Water Quality Laboratory—Determination of organonitrogen herbicides in water by solid-phase extraction and capillary-column gas chromatography/mass spectrometry with selected-ion monitoring: U.S. Geological Survey Open-File Report 91–519, 26 p.
Timme, P.J., 1995, National Water Quality Laboratory 1995 Services Catalog: U.S. Geological Survey Open-File Report 95–352, p. 92.
U.S. Environmental Protection Agency, 1984, Guidelines establishing test procedures for the analysis of pollutants (App. B, Part 209, Definition and procedures for the determination of the method detection limit): U.S. Code of Federal Regulations, Title 49, CFR 49(209):43430.
———1985, U.S. Code of Federal Regulations, Title 50: Washington, D.C., U.S. Government Printing Office, November 13, 1985, 46906.
———1993, Guidance on evaluation, resolution, and documentation of analytical problems associated with compliance monitoring: Washington, D.C., U.S. Government Printing Office, USEPA 821-B-93-001, June 1993.
———1997, Guidelines establishing test procedures for the analysis of pollutants (App. B, Part 136, Definition and procedures for the determination of the method detection limit): U.S. Code of Federal Regulations, Title 40, revised July 1, 1997, p. 265–267.
U.S. Geological Survey, 1994, Description and guide for interpreting low-level data supplied by the NWQL for schedules 2001, 2010, 2050, and 2051: U.S. Geological Survey National Water Quality Laboratory Technical Memorandum 94.12, accessed May 13, 1999, at URL http://water.usgs.gov/admin/memo.
———1997, Changes in reporting levels and data qualifiers for selected pesticides and degradation products in schedules 2050 and 2051: U.S. Geological Survey National Water Quality Laboratory Technical Memorandum 98.03A, accessed May 13, 1999, at URL http://water.usgs.gov/admin/memo.
———1998, Reporting level changes for volatile organic compounds (schedules 2020/2021), inductively coupled plasma-atomic emission spectrometry (ICP-AES), ammonia plus organic nitrogen and phosphorus (micro-Kjeldahl) in water methods at the National Water Quality Laboratory Technical Memorandum 98.07, accessed May 13, 1999, at URL http://water.usgs.gov/admin/memo.
Werner, S.L., Burkhardt, M.R., and DeRusseau, S.N., 1996, Methods of analysis by the U.S. Geological Survey National Water Quality Laboratory—Determination of pesticides in water by Carbopak-B solid-phase extraction and high-performance liquid chroma-tography: U.S. Geological Survey Open-File Report 96–216, 42 p.
Wershaw, R.L., Fishman, M.J., Grabbe, R.R., and Lowe, L.E., 1987, Methods for the determination of organic substances in water and fluvial sediments: U.S. Geological Survey, Techniques of Water-Resources Investigations, book 5, chap. A3, p. 76–80.
18 New Reporting Procedures Based on LT-MDL’s and Interpretation of Water-Quality Data Provided by the USGS NWQL
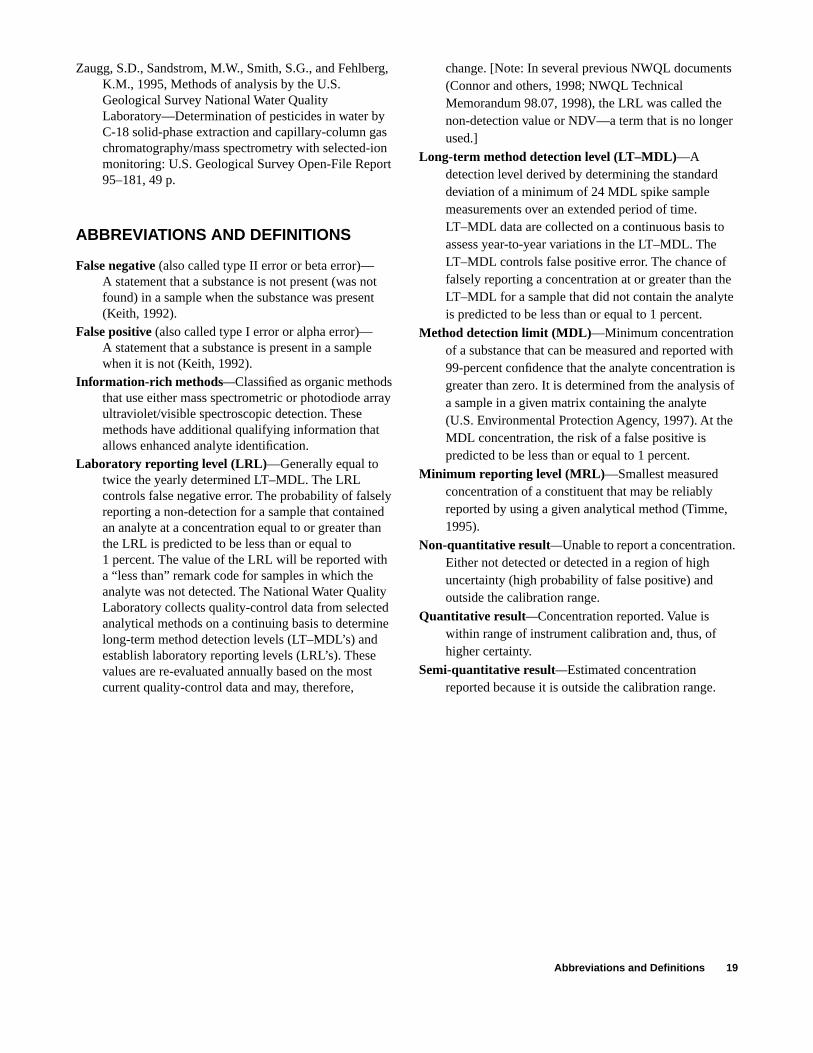
Zaugg, S.D., Sandstrom, M.W., Smith, S.G., and Fehlberg, K.M., 1995, Methods of analysis by the U.S. Geological Survey National Water Quality Laboratory—Determination of pesticides in water by C-18 solid-phase extraction and capillary-column gas chromatography/mass spectrometry with selected-ion monitoring: U.S. Geological Survey Open-File Report 95–181, 49 p.
ABBREVIATIONS AND DEFINITIONS
False negative (also called type II error or beta error)—A statement that a substance is not present (was not found) in a sample when the substance was present (Keith, 1992).
False positive (also called type I error or alpha error)—A statement that a substance is present in a sample when it is not (Keith, 1992).
Information-rich methods—Classified as organic methods that use either mass spectrometric or photodiode array ultraviolet/visible spectroscopic detection. These methods have additional qualifying information that allows enhanced analyte identification.
Laboratory reporting level (LRL)—Generally equal to twice the yearly determined LT–MDL. The LRL controls false negative error. The probability of falsely reporting a non-detection for a sample that contained an analyte at a concentration equal to or greater than the LRL is predicted to be less than or equal to 1 percent. The value of the LRL will be reported with a “less than” remark code for samples in which the analyte was not detected. The National Water Quality Laboratory collects quality-control data from selected analytical methods on a continuing basis to determine long-term method detection levels (LT–MDL’s) and establish laboratory reporting levels (LRL’s). These values are re-evaluated annually based on the most current quality-control data and may, therefore,
change. [Note: In several previous NWQL documents (Connor and others, 1998; NWQL Technical Memorandum 98.07, 1998), the LRL was called the non-detection value or NDV—a term that is no longer used.]
Long-term method detection level (LT–MDL)—A detection level derived by determining the standard deviation of a minimum of 24 MDL spike sample measurements over an extended period of time. LT–MDL data are collected on a continuous basis to assess year-to-year variations in the LT–MDL. The LT–MDL controls false positive error. The chance of falsely reporting a concentration at or greater than the LT–MDL for a sample that did not contain the analyte is predicted to be less than or equal to 1 percent.
Method detection limit (MDL)—Minimum concentration of a substance that can be measured and reported with 99-percent confidence that the analyte concentration is greater than zero. It is determined from the analysis of a sample in a given matrix containing the analyte (U.S. Environmental Protection Agency, 1997). At the MDL concentration, the risk of a false positive is predicted to be less than or equal to 1 percent.
Minimum reporting level (MRL)—Smallest measured concentration of a constituent that may be reliably reported by using a given analytical method (Timme, 1995).
Non-quantitative result—Unable to report a concentration. Either not detected or detected in a region of high uncertainty (high probability of false positive) and outside the calibration range.
Quantitative result—Concentration reported. Value is within range of instrument calibration and, thus, of higher certainty.
Semi-quantitative result—Estimated concentration reported because it is outside the calibration range.
Abbreviations and Definitions 19