the measurement of socioeconomic inequality and social class in australia: a review of past...
TRANSCRIPT

COMMUNITY HEALTH STUDIES VOLUME XII, NUMBER I , 1988
THE MEASUREMENT OF SOCIOECONOMIC INEQUALITY A N D SOCIAL CLASS IN AUSTRALIA: A REVIEW OF PAST PRACTICES A N D RECENT DEVELOPMENTS
Jake M . Najman
University of Queensland and Australian lnstirure of Health
Abstract Recent findings have pointed to an association
between socioeconomic status and health in Australia but have, in the process, raised important questions about the validity of various methods of determining a respondent’s location within the hierarchy. While some of the problems associated with the use of the Australian Bureau of Statistics classification were known, the full extent of these deficiencies was not.
This paper reviews past and present methods of measuring socioeconomic inequality in Australia. After pointing to the criteria which should be applied to determine the adequacy of any method of socioeconomic classifrcation, the paper reviews the main strengths and weaknesses of the methods of classification used in health-related research in Australia.
Introduction A concern with the extent of inequality in society
and its consequences has characterised a great deal of overseas and some Australian research. Australian studies have identified substantial socioeconomic (SES) differences in both m~r ta l i ty”~ and morbidity.“’ One remarkable aspect of the overseas and Australian research has been the use of varying measures of socioeconomic status. Indeed though conceptually distinct, the terms social or occupational class appear to be frequently used interchangeably with SES. Further, it is not uncommon to see a single study employing independent indicators of SES, reporting apparently contradictory or conflicting The tendency to dismiss the less favoured result and seize upon the significant and stronger associations is understandable, but may have undesirable consequences. These include directing attention away from poor measures which need refinement, or inconsistencies in findings which are meaningful and should be further analysed. Such inconsistencies might reflect an inadequate conceptualization of SES or class variables, a lack of reliable measurement of these variables or real differences in health or health related lifestyles.
This paper reviews the most common measures of SES and class used by researchers in Australia. It
NAJMAN 31
begins with a discussion of the criteria which should be used in selecting a measure of socioeconomic inequality and then considers the census coding of occupations (past and current) and the extent to which these satisfy the requisite criteria. It then examines the use of status hierarchies, of such SES indicators as income and education level and also the use of composite scales. Finally, it discusses some recent developments in the analysis of class and the ways these have been incorporated into items on a questionnaire.
On the desired qualities for a class/SES scale Whether implicitly or explicitly, occupational
class measures have been included in numerous studies, most commonly to test the proposition that socioeconomic inequalities, directly or indirectly, are associated with lifestyle or life chances.
From a sociological perspective, concepts such as class and status are generally associated with an elaborate theoretical framework and the aim of the research is to test the adequacy of a predetermined theoretical model. Adequacy, in the above context, has been determined either by the theoretical coherence of the model or the amount of variance in behaviour or health circumstance accounted for by the model.
From an epidemiological perspective the interest in class is directed to a variety of alternative methods of measuring the concept, rather than its conceptual underpinnings. Epidemiologists are likely to emphasise the importance of three characteristics of a satisfactory method of measurement of class. They would need to be satisfied that the method of measurement chosen meets some important statistical criteria (e.g. reliability, validity); they are likely to prefer criteria of class which are of practical or public health significance; and there is a concern not only with class itself but with the causal sequence, including the biological process, which explains why class differences in say, morbidity or mortality, are observed.
Whether the research is sociological or epidemiological in orientation, a number of theoretical and measurement concerns underlying the selection of an occupation code should be
COMMUNITY HEALTH STUDIES
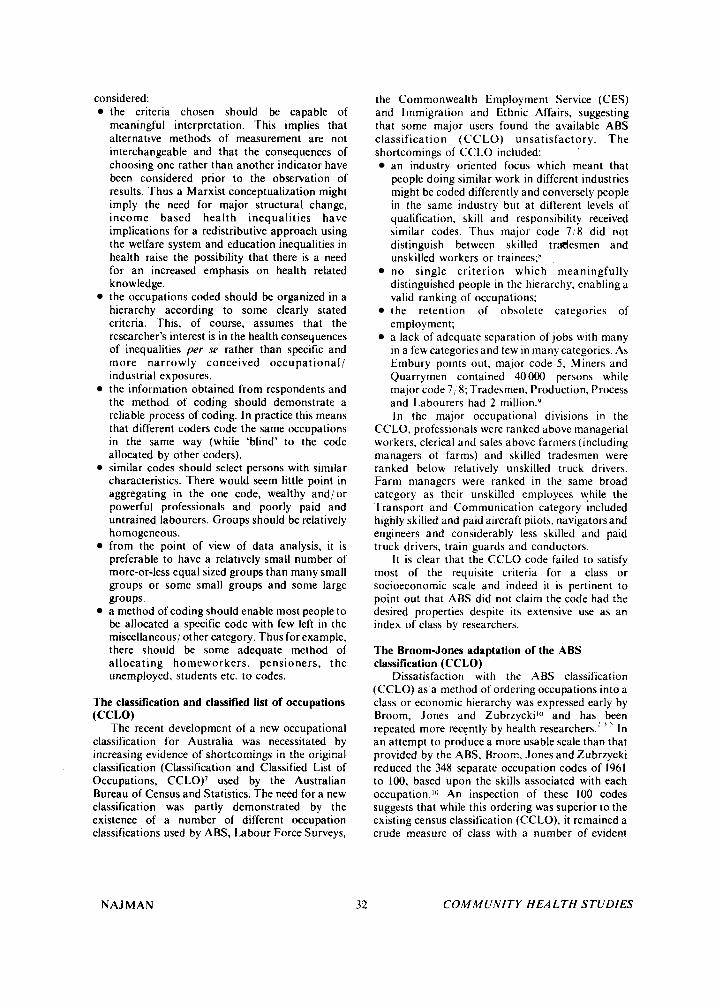
considered: the criteria chosen should be capable of meaningful interpretation. This implies that alternative methods of measurement are not interchangeable and that the consequences of choosing one rather than another indicator have been considered prior to the observation of results. Thus a Marxist conceptualization might imply the need for major structural change, income based health inequalities have implications for a redistributive approach using the welfare system and education inequalities in health raise the possibility that there is a need for an increased emphasis on health related know ledge. the occupations coded should be organized in a hierarchy according to some clearly stated criteria. This, of course, assumes that the researcher's interest is in the health consequences of inequalities per se rather than specific and more narrowly conceived occupational/ industrial exposures. the information obtained from respondents and the method of coding should demonstrate a reliable process of coding. In practice this means that different coders code the same occupations in the same way (while 'blind' to the code allocated by other coders). similar codes should select persons with similar characteristics. There would seem little point in aggregating in the one code, wealthy and/or powerful professionals and poorly paid and untrained labourers. Groups should be relatively homogeneous. from the point of view of data analysis, it is preferable to have a relatively small number of more-or-less equal sized groups than many small groups or some small groups and some large groups. a method of coding should enable most people to be allocated a specific code with few left in the miscellaneous/ other category. Thus for example, there should be some adequate method of allocating homeworkers, pensioners, the unemployed, students etc. to codes.
The classification and classified list of occupations
The recent development of a new occupational classification for Australia was necessitated by increasing evidence of shortcomings in the original classification (Classification and Classified List of Occupations, CCLO)' used by the Australian Bureau of Census and Statistics. The need for a new classification was partly demonstrated by the existence of a number of different occupation classifications used by ABS, Labour Force Surveys,
(CCLO)
NAJMAN
the Commonwealth Employment Service (CES) and Immigration and Ethnic Affairs, suggesting that some major users found the available ABS classification (CCLO) unsatisfactory. The shortcomings of CCLO included:
an industry oriented focus which meant that people doing similar work in different industries might be coded differently and conversely people in the same industry but at different levels of qualification, skill and responsibility received similar codes. Thus major code 718 did not distinguish between skilled trrdesmen and unskilled workers or trainees;n no single criterion which meaningfully distinguished people in the hierarchy, enabling a valid ranking of occupations; the retention of obsolete categories of employment; a lack of adequate separation of jobs with many in a few categories and few in many categories. As Embury points out, major code 5 , Miners and Quarrymen contained 40 000 persons while major code 7 ; 8; Tradesmen, Production, Process and Labourers had 2 million.y In the major occupational divisions in the
CCLO, professionals were ranked above managerial workers, clerical and sales above farmers (including managers of farms) and skilled tradesmen were ranked below relatively unskilled truck drivers. Farm managers were ranked in the same broad category as their unskilled employees while the Transport and Communication category included highly skilled and paid aircraft pilots. navigators and engineers and considerably less skilled and paid truck drivers, train guards and conductors.
It is clear that the CCLO code failed to satisfy most of the requisite criteria for a class or socioeconomic scale and indeed it is pertinent to point out that ABS did not claim the code had the desired properties despite its extensive use as an index of class by researchers.
The Broom-Jones adaptation of the ABS classification (CCLO)
Dissatisfaction with the ABS classification (CCLO) as a method of ordering occupations into a class or economic hierarchy was expressed early by Broom, Jones and Zubrzyckil" and has been repeated more recently by health researchers.: ' ' In an attempt to produce a more usable scale than that provided by the ABS, Broom, Jones and Zubrzycki reduced the 348 separate occupation codes of 1961 to 100, based upon the skills associated with each occupation.lo An inspection of these 100 codes suggests that while this ordering was superior to the existing census classification (CCLO), it remained a crude measure of class with a number of evident
COMMUNITY HEALTH STUDIES

anomalies. Thus senior public servants, department heads and company managers were ranked below nurses, and wool classers and unskilled labourers were ranked above foremen in related industries." The authors were not unaware of these anomalies but were limited by the need to retain the major categories of the census classification (CCLO) intact to allow comparisons of population and survey data.
Australian Standard Classification of Occupations (ASCO)*
Following the results of user surveys which identified major levels of dissatisfaction with the then existing ABS Occupation Classification code, work on a new coding scheme began in late 1978.
The new classification jointly developed by the ABS and the Department of Employment and Industrial Relations (DEIR) is intended to meet a number of needs identified following consultation with user groups (e.g. CES, labour market analysts, manpower management and planning personnel, educators).'?
I n this context it is relevant to note that while the new categories are more homogeneous, more clearly defined and partly arranged in a hierarchy of skills, their u x by health and welfare policy researchers is incidental to their use in the labour market arena.
The new coding scheme was devised following user surveys in 1979 and 1983, which indicated that most users preferred a classification based upon skill rather than social standing or prestige. The skills- based classification is consistent with the
International Standard Classification of Occupa- tions (ISCO) and with British, Canadian and Ameri- can approaches to occupational classifications.
In ASCO the concept of occupational skill involves two criteria. Firstly, occupations are hierarchically subdivided into eight major groups according to their skill level (Table I ) . They are subsequently further divided using nominal categories. into minor groups and then unit groups according to the criterion of skill specialization.
The skill level of an occupation is defined as ". . . the range and complexity of the set of tasks involved"lJ and is measured by the level of formal education. on-the-job training and previous experience an individual should have in order to obtain a particular job, though it does not follow that all persons in a job will have this skill level. Two major assumptions underlie this categorisation: that there is at least an ordinal relationship in terms of skill level among categories of occupation and that occupations which require higher levels of skill also demand higher educational qualifications. training and/ or experience. 'The ASCO classification relies upon labour market entry criteria and does not flow from empirical research or objective data demonstrating a relationship between task
* This discussion is based upon a paper by Ernburp and an interview with Dr Graerne Vaughan. both of whom have been responsible for the development of the new classification.
TABLE 1
Australirin Standard Classification of Occupation (ASCO)
Major Groups: eight arranged in a skills hierarchy 1. Managers and Administrators 2. Professionals 3. Para-professionals 4. Tradespersons 5 . Clerks 6. Salespersons and Personal Service Workers 7. Plant and Machine Operators and Drivers 8. Labourers and Related Workers
within each major group there are a variable number of minor groups, categorized by skill specialisation but not arranged in any defined order
specific task-based occupation categories which span industries but involve common or similar tasks
Minor Groups:
Unit Groups:
Occupations: sets of jobs with a high degree of commonality or similarity in tasks
Source: ASCO (1986)
NAJMAN 33 COMIMUNITY HEALTH STUDIES
performance and skill level. Judgements about skill levels were based upon a series of discussions which took place between ABS staff and employer organisations, professional associations, trade unions and industry representatives amongst others, to determine the usual level of educational qualifications, on-the-job training and previous experience associated with a specific job.
The categories within ASCO are then based upon informed judgements about the relative skill of managers, professionals etc; judgements which some may dispute. For example in contrast to the ASCO classification, the British 1980 occupational classification places professionals ahead of managers, and clerical workers ahead of tradesmen/ women.14 Here it is important to note however, that the ASCO classification defines managers in terms which limit this category to those who determine, direct or co-ordinate policy in organisations while the ‘clerks’ code is limited to
persons who “gather, record, order, transform, store or transmit information”.’5 Thus British and other international classifications may use similar labels for groups composed of somewhat different occupational categories. The resulting aggregations are not directly comparable internationally and the validity of these classifications remains to be assessed quantitatively.
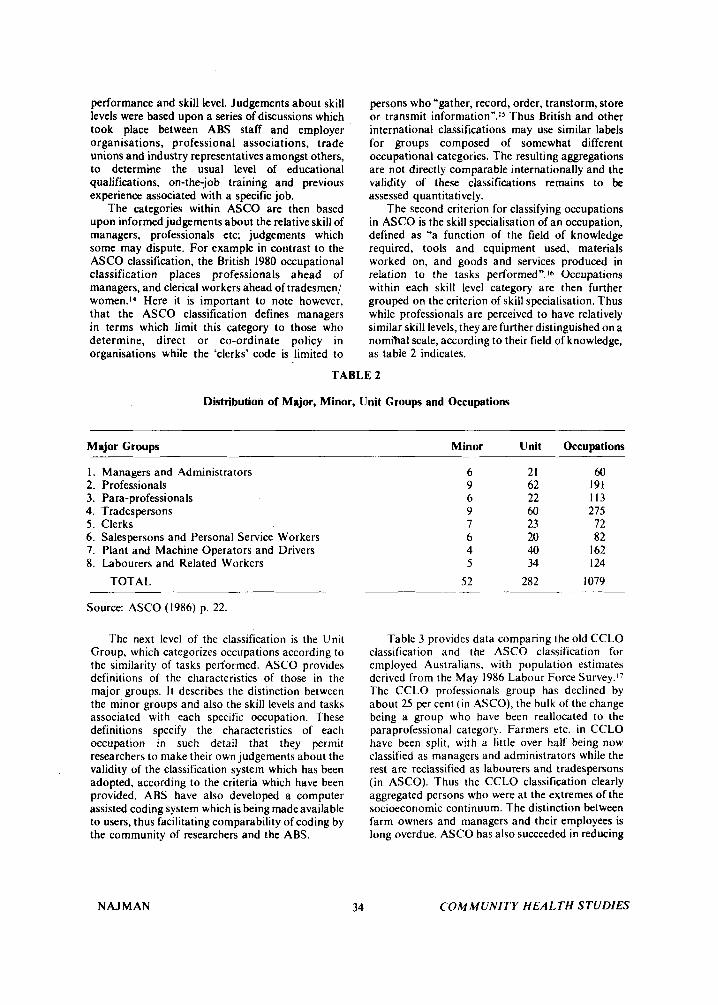
The second criterion for classifying occupations in ASCO is the skill specialisation of an occupation, defined as ‘‘a function of the field of knowledge required, tools and equipment used, materials worked on, and goods and services produced in relation to the tasks performed”.Ib Occupations within each skill level category are then further grouped on the criterion of skill specialisation. Thus while professionals are perceived to have relatively similar skill levels, they are further distinguished on a nomihal scale, according to their field of knowledge, as table 2 indicates.
TABLE 2
Distribution of Major, Minor, Unit Groups and Occupations
Major Groups Minor Unit Occupations
I . 2. 3. 4. 5 . 6. 7. 8.
Managers and Administrators Professionals Para-professionals Trades persons Clerks Salespersons and Personal Service Workers Plant and Machine Operators and Drivers Labourers and Related Workers
TOTAL
6 9 6 9 7 6 4 5
52
21 62 22 60 23 20 40 34
282
60 191 I I3 275
72 82
I62 I 24
I079
Source: ASCO (1986) p. 22.
The next level of the classification is the Unit Group, which categorizes occupations according to the similarity of tasks performed. ASCO provides definitions of the characteristics of those in the major groups. I t describes the distinction between the minor groups and also the skill levels and tasks associated with each specific occupation. These definitions specify the characteristics of each occupation in such detail that they permit researchers to make their own judgements about the validity of the classification system which has been adopted, according to the criteria which have been provided. ABS have also developed a computer assisted coding system which is being madeavailable to users, thus facilitating comparability of coding by the community of researchers and the ABS.
NAJMAN 34
Table 3 provides data comparing the old CCLO classification and the ASCO classification for employed Australians, with population estimates derived from the May 1986 Labour Force S ~ r v e y . 1 ~ The CCLO professionals group has declined by about 25 per cent ( in ASCO), the bulk of the change being a group who have been reallocated to the paraprofessional category. Farmers etc. in CCLO have been split. with a little over half being now classified as managers and administrators while the rest are reclassified as labourers and tradespersons (in ASCO). Thus the CCLO classification clearly aggregated persons who were at the extremes of the socioeconomic continuum. The distinction between farm owners and managers and their employees is long overdue. ASCO has also succeeded in reducing
COMMUNITY HEALTH STUDIES

TABLE 3
Employed Persons: Comparison of ASCO’ Classification of Occupations and
<:CLOh Classification of Occupations, May 1986 (’000)
OCCUPATION (ASCO)”
SakS- persons Plant &
Managers Para- &pe& machine Labourers Total & admin- Roles- prole- Trades- S E N ~ C C operators & related istntors sionals sionals persons Clerks workers & drivers workers
Professional. technical etc. Adminiitrative, execu1Ive
C‘ le r ica I Sales Farmers, Fishermen. Timber-
Miners. quarrymen & related
1-ransport & communication Tradesmen. production-process
workcrs & labourers. n.e.c. Service. sport & recreation
& managerial
getlrrs. elc.
workcrs
. r o r A ~
23.8
361.5 20.6 41.6
265.4
* 5.x
19.0 8.2
746.2
721.0 24X.6 18.4 25.5 36.5
10.6 12.3 18.9 26.9 47.3 29.3 13.5 * 1.072.6 130.9
4.1 9.2 8.1 7.8 542.1
* 4.7 61.4 *
* 1
13.2 * 53.7 14.6
16.1 38.5 958.9 16.0 5.5 16.0 60.9 90.6 4.3 179.0
800.2 401.8 1.161.1 1.2095 956.4
. 12.5
5.3 8.9 3.9 4.5
18.2
6.9 137 7
10.4 22.0 224.8 23.0
2X6.7 557.1 12.6 333.2
552.3 1.117.1
. 1.086.8
491 6 I .27X. 1
632.3
479.2
14.x 239 2
1.897.X 704.8
6.944.5
’ Occupation classified by Australian Standard Classification of Occupations (ASCO). 1986 ” Occupation classified by Classificatlon and Classified Lisl of Occupations (CCLO). Revised November 19x0
* Asterisks represent cell s i m insufficient to permit reliable calculations; these however, are added to the totals.
Source: The Labour Force, Australia. August (1986).
the imbalance in numbers in each of the occupational groups. Thus in CCLO tradesmen etc. comprised 27 per cent of all employed persons while miners and quarrymen were only .005 per cent of workers. In ASCO, clerks are the most common group comprising 17.4 per cent of employed persons and paraprofessionals the least common with 5.8 per cent of employed persons.
Table 4 provides mean income comparisons for . the ASCO major codes, disaggregated by sex.18 I t is
clear that, on income criteria. there is no clear hierarchy, with tradespersons being ranked above clerks but earning less and plant and machine operators having the fourth (males) or fifth(fema1es) highest mean incomes but being ranked seventh on the ASCO scale. However, the availability of mean income data for ASCO major and minor codes provides researchers with the option of rearranging the occupational groups according to their mean income.
Some disadvantages of the new classification are already evident and more may become apparent as ASCO usage increases. Supervisors of and trainees in occupations are placed in the same unit group as the occupation involved. There is still no systematic
NAJMAN 35
data on the reliability of the coding process, though a recent paper suggests that if two occupational questions are asked, 90 per cent of occupations are reliably coded.8 It is difficult, at a conceptual level, to directly relate skill differentials t o such commonly used concepts as class, socioeconomic status and occupational status. Further, there is likely to be a lack of comparability not only between previously and currently collected data, but also between different areas in which ABS provide the relevant statistics (e.g. census occupation da ta and occupation as recorded at death certification). Such inconsistencies flow from the additional information now obtained at the census but which may not be available either on a death certificate or which may not be known to a person reporting another person’s occupation. In Appendix A, the two relevant ABS occupation questions are reproduced. It is clear that the detailed information required may simply not be available to some informants and in some circumstances.
Some of these disadvantages are not beyond redress. For example, if one restricts one’s interest to the major ASCO groups or even the minor groups, then it may be possible to obtain a reasonable
C O M M U N I T Y H E A L T H STUDIES

TABLE 4
Distribution of Mean Weekly Earnings by ASCO Major Croup Code by Sex, May 1986
(Source: Distribution and Composition of Employee Earnings and Hours - Australia, 1987)
Major Croups: Males Females s s
I . 2. 3. 4.
Managers and Administrators Professionals Para-professionals Trades persons
5 . Clerks 6. Sales Workers 7. Plant and Machine Operators 8. Labourers etc.
6 10.90 557.70 5 13.60 387.70 405.80 326.10 433.10 336.90
443.30 424.50 346.20 248.50 289.20 204.80 275.10 215.30
reconciliation between different data sources. Generally, the new ASCO classification appears
to be arranged according to carefully defined and publicly available criteria, it provides a hierarchy of occupational categories at the major group level. However details relating to the reliability of coding and the validity of the coding format have yet to appear. Finally, while the ASCO classification is likely to be related to other SES and class characteristics of an individual, the specific strength and nature of this relationship remains to be determined.
The new classification, while not providing a socioeconomic ranking of occupations, at least removes most of the anomalies which existed in the previous classification. The arrangement of occupations in a skills hierarchy should be of interest and can be associated with some key skill-related criteria, such as income and education. Further, it may prove more possible to rearrange the 282 homogenous unit groups into status, class or income groups than was the case when only the industry, based ABS classification was used.
Status hierarchies Social status or prestige is conceptualised as the
honour, reputation or eminence generally attributed to a person in a particular occupational category. Its measurement is predicated on the belief that a person's position on a prestige hierarchy is a good predictor of that person's total 'lifestyle'.
In response to the inadequacies of the CCLO method of occupation classification and the demand for a sociologically meaningful ranking of occupations, a number of studies, modelled in part on the U.S. National Opinion Research Centre (NORC) studies of occupational prestige, were undertaken in Australia.Io The best known of these are by Congalton,"' ? ' whose work has been recently
NAJMAN 36
updated by Daniel.?? In one attempt to reconcile census and status
criteria Broom and Jones applied status rankings to their reorganised 100 census occupations and produced a hierarchy of 16 occupations( based upon the average prestige of a category) which could be reduced to 6 or 3 more general categories (non- manual, farm, manual)." However, such approaches which involve modifications of the census codes have not been used widely, presumably because the modifications leave many of the inadequacies of the census scale unaltered. In general, health researchers have tended to use the original 10 point census codes' or adopt the status code.' '
The use of a status or prestige hierarchy can be defended on a number ofgrounds. One advantage of a status/ prestige hierarchy is that it can be treated as an interval scale which permits statistical manipulations not possible using the CCLO approach. Another advantage of status hierarchies are that they provide a ranking of occupations based upon a single criterion and that they represent broadly and consistently held conceptions about the worthiness of persons who have particular jobs. Daniel submitted her occupational groups to 17 different samples and found a high level of agreement between them.24 Studies which have compared the status rankings of occupations in countries with apparently different cultures and economic and po!itical systems have also found a reasonable level of correspondence.25 Occupations do vary in the status attributed to them over time22 and there are some interesting differences in these rankings between communist and capitalist countries,*6 but within the one socio-political system and time period, these rankings appear to be consistently held by most groups in that society.
It is, however, not clear what such rankings mean
C O M M U N I T Y HEALTH STUDIES

in terms of differences in lifestyle and other characteristics of the individual. Some studies suggest that these rankings reflect the observer's perceptions of the income level. education and authority associated with a job (1.e. power see Daniel),*4 but much work remains to be done before we clearly understand why occupations are so consistently ranked.
Other measures of socio-economic inequality Perhaps partly in response to the problems
associated with occupational rankings and partly on theoretical grounds, a variety of indicators of social class have come into general usage. These warrant some discussion.
Incomr Income questions appear to be relatively well
answered by respondents if these are presented in categorical form, and they provide data for both males and females as well as the unemployed, students etc.lY At least three forms of the income measure appear to be in general use. Total gross or net family income is used asan S ES indicator; family income adjusted for the number of persons in the family may be derived; and a number of very
interesting, health pertinent. findings have come from studies which have used estimates of how far above or below an agreed-upon poverty level a family may fall.' '
Few indicators of SES inequality are likely to have a higher level of face validity than do income differentials. Income differentials provide a clear and simple-to-understand estimate of inequality. Research on such inequalities has identified specific health-related behaviours which are likely to be a consequence of these inequalities.
Table 5 is derived from the 1984 Australian Household Expenditure Survey.27 It shows both the average weekly expenditure in dollars as a proportion of total expenditure, for those in the bottom, middle and top income groups in the community. Thus the lowest income group spends only $24.2 per week on housing compared to the $70.1 per week spent by the highest income group. Yet the former is spending 17 per cent of their total income on housing while the latter only 10 per cent. A similar pattern is evident when one compares other basic commodities and services for example, fuel and power, food. The wealthy spend more both in absolute and percentage terms on alcohol, clothing, transport and recreation. In light of the
'
TABLE 5
Average Weekly Household Gross Income, Dollars Spent Per Week (Per Cent of Weekly Expenditures)
Bottom Fifth TOP Decile Decile Decik
Of Of Of Income Income Income $0-113 $315.387 $861+ $ % $ % $ %
Current housing costs Fuel and power Food Alcohol Tobacco Clothing and footwear Household furnishings Medical care, health Transport Recreation
TOTAL1
24.2 (17) 48.1 (15) 70.1 (10)
32.9 123) 65.2 20) 122.8 (18) 6.4 (5) 10.5 (3) 15.5 (2)
(3) 26.3 (4) 3.4 '(2j 2.6 (2) 7.0 (5) 8.7 (6) 5.8 (4)
14.2 (10) 15.1 ( 1 1 )
140.8
10.0 5.8
18.7 22.5 13.9 53.4 34.4
326.4
(2) 7.4 ( 1 ) (6) 53.5 (8) (7) 51.0 (7) (4) 24.4 (4) 16) 117.9 (17) 1 1 ) %.8 (14)
687.0
Source: Household Expenditure Survey, Australia (1986) Includes following items not on list: household services and operation, personal care, miscellaneous commodities and services.
NAJ MAN 37 COMMUNITY HEALTH STUDIES

above it seems reasonable to suggest that 'lifestyle' options may be predicated upon a particular income level.
The identification of income-related health inequalities is also of policy significance because such data ,at least points to some ameliorative responses, through the redistributive potential of the welfare system.
Education Measures of educational level are generally
somewhat more difficult to interpret than are income derived measures. Some persons may pass t h rough o n- t he-j o b ter t iary q ual i f ica t i o n s (apprenticeships) without necessarily obtaining a high school pass. There are many post-school qualifications which may be difficult to rank and interpret (for example secretarial qualifications) and it may be difficult to distinguish diploma-type college or TAFE tertiary qualifications from what are, presumably, more highly ranked university ones. To a large extent this problem reflects a lack of clarity and consensus about the appropriate dimensions for ranking and categorising educatiop. In some instances the length of training is of interest, in others the skills which are acquired( both level and type), and 'experience' while not usually of interest may have significant educational implication. In addition many of those whose formal qualifications are modest are older persons who may have ability and considerable achievements but who did not have the opportunity to obtain better qualifications when they were proceeding through the education system. On the positive side educational differences may be derived for most groups enabling almost all to be allocated a score in a hierarchy.
Despite the deficiencies of the variable 'education level', the finding of an association between education and health raises the possibility of education based remedial initiatives. Many health researchers have demonstrated such association.
Composite SES Score Some researchers have argued that occupation,
income and education variations are three elements of what might, more appropriately, be labelled an individual's social class and restrict their use of this term to instances when composite scores are derived. This is often done by creating distributions for occupational class, income and education, giving respondents a score based on their position in the distribution and then simply adding together an individual's score on each of the three (or more) criteria.
Other approaches using factor analysis and applying factor loadings to the component variables have also been used.
NAJMAN
Composite scales appear attractive because they provide an interval type variable, and they appear to have theoretical support (class is conceptualised as the common denominator of income, education and occupation). Such an approach also has the advantage of providing an SES score for non- employed women.28 In addition, this approach dilutes some of the deficiencies of each of the constituent indicators. However, in practice the use of composite scores has not proved advantageous. In our research, stronger associations have generally been found, with more specific SES indicators than with a composite index, though others report the contrary experience.28 Further, once one identifies an association between health and a composite indicator, i t is often necessary todecompose theSES or class scores into their components in order to facilitate interpretation.
Other Indicators of's ES A wide variety of additional measures of
inequality in society have been used including subjective beliefs about one's class membership, interviewer rankings of the house and respondents appearance, number of persons per room, race, ethnicity and so on." "'
Some might suggest that the decision about which indicator to select is somewhat academic as they are likely to be correlated with each other and they are likely to produce much the same results. This argument is only partly correct. Table 6 compares five SES indicators." While they are all significantly correlated, these correlations are modest and the variables are clearly measuring substantially different characteristics. This matrix is relatively typical of such data.
In practice the substantial degree of variation between SES indicators is likely to be of moderate importance when a strong health association exists but it may be positively misleading if the health effects are modest or weak, particularly if researchers choose to report only 'significant' findings.
New approaches to the measurement of class Some health researchers have criticised what
they perceive as the narrowness of such class indicators as occupational skill, status, income etc. They suggest that there is a need for additional indicators which focus on the relationships in the work environment and the circumstances surrounding the work process.
This includes theorists and researchers such as Wright'' '' who suggest, amongst other things, that there is a need to measure the extent to which individuals have:
ownership and control over investments and the
'
38 COMMUNITY HEALTH STUDIES
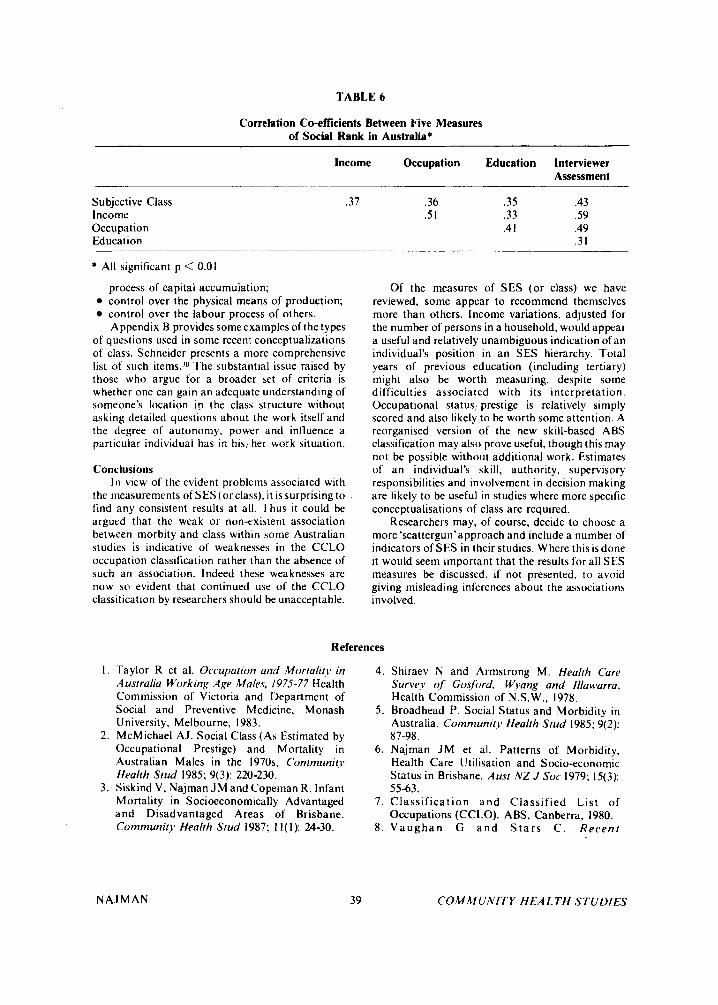
TABLE 6
Correlation Co-efficients Between Five Measures of Social Rank in Australia*
Income Occupation Education Interviewer Assessment
._~~___
Subjective Class Income Occupation Education
.37 .36 .35 .43 .5 I .33 .59
.4 I .49 .3 I
* All significant p < 0.01
process of capital accumulation; control over the physical means of production; control over the labour process of others. Appendix B provides some examples of the types
of questions used in some recent conceptualizations of class. Schneider presents a more comprehensive list of such items.'" The substantial issue raised by those who argue for a broader set of criteria is whether one can gain an adequate understanding of someone's location in the class structure without asking detailed questions about the work itself and the degree of autonomy, power and inlluence a particular individual has in his, her work situation.
Conclusions In view of the evident problems associated with
the measurements of SES (or class), it is surprising to find any consistent results at all. 1-hus it could be argued that the weak or non-existent association between morbity and class within some Australian studies is indicative of weaknesses in the CCLO occupation classification rather than the absence of such an association. Indeed these weaknesses are now s o evident that continued use of the CCLO classification by researchers should be unacceptable.
Referen
I . Taylor R et al. Occupation and Mortality in Australia Working Age Males, 1975-77 Health Commission of Victoria and Department of Social and Preventive Medicine, Monash University, Melbourne, 1983.
2. McMichael AJ. Social Class (As Estimated by Occupational Prestige) and Mortality in Australian Males in the 1970s, Community
3. Siskind V, Najman J M a n d Copeman R . Infant Mortality in Socioeconomically Advantaged and Disadvantaged Areas of Brisbane. Community Health Stud 1987; 1 I ( I ): 24-30.
Health Stud 1985; 9(3): 220-230.
NAJMAN 39
Of the measures of SES (or class) we have reviewed, some appear t o recommend themselves more than others. Income variations, adjusted for the number of persons in a household, would appear a useful and relatively unambiguous indication of an individual's position in an SES hierarchy. Total years of previous education (including tertiary) might also be worth measuring, despite some difficulties associated with its interpretation. Occupational status, prestige is relatively simply scored and also likely to be worth some attention. A reorganised version of the new skill-based ABS classification may also prove useful, though this may not be possible without additional work. Estimates of an individual's skill, authority, supervisory responsibilities and involvement in decision making are likely to be useful in studies where more specific conceptualisations o f class are required.
Researchers may, of course, decide to choose a more 'scattergun'approach and include a number of indicators of SES in their studies. Where this is done it would seem important that the results for all SES measures be discussed, if not presented, to avoid giving misleading inferences about the associations involved.
ices
4. Shiraev N and Armstrong M. Health Care Survey of Gosford, Wvang and Illawarra, Health Commission of N.S.W., 1978.
5 . Broadhead P. Social Status and Morbidity in Australia. Community Health Stud 1985; 9(2):
6. Najman J M et al. Patterns of Morbidity, Health Care Utilisation and Socioeconomic Status in Brisbane. Ausr NZ J Soc 1979; 15(3): 55-63.
7. C las s i f i ca t ion a n d Classif ied List of Occupations (CCLO). ABS, Canberra, 1980.
8. V a u g h a n G a n d S t a r s C . Recent
87-98.
C O M M U N I T Y H E A L T H STUDIES

9.
10.
1 1 .
12.
13.
14.
15.
16.
17.
18.
19.
20.
21.
Developments in Statistical Data on (Iccupa- lion. Roneod paper presented to the 1987 Conference of the Sociological Association of Australia and New Zealand, 1987. Embury BL. The CIassiJcation qf Occupa- tions According to their Intrinsic Properries. Paper delivered to the Sociology Section, 1983 ANZAAS Conference, Perth, 1983. Broom L, Jones FL and Zubrzycki J . An Occupational Classification of the Aus- tralian Workforce. Aust NZ J Soc 1965; Supplement: 1-16. Broom L and Jones FL. Opportunity and Atlainment in Australia. ANU Press, Canberra, 1976. Australian Standard Classification of Occupa- tions (ASCO). ABS, Canberra, 1986. Australian Standard Classification of Occupa- tions (ASCO). ABS, Canberra, 1986; 5-6. M c D o w a l l M . M e a s u r i n g women's occupational mortality. Population Trends, Office of Population Censuses and Surveys, Great Britain 1983; 34 (25-29). Australian Standard Classification of Occupa- tions (ASCO). ABS, Canberra, 1986; 155. Australian Standard Classification of Occupa- tions (ASCO). ABS, Canberra, 1986; 8. The Labour Force-Australia August. AGPS, Canberra, 1986. Distribution and Composition of Employee Earnings and Hours - Australia AGPS, Canberra, 1987. Broom L, Jones FL and Zubrzycki J. Social Stratification in Australia, in Jackson JJ (ed) Social Stratification, Cambridge; Cambridge University Press, 1968; 212-33. Congalton AA. Occupationof Siatus in Australia, Studies in Sociology, No. 3. University of N.S.W. Sydney, 1963. Congalton AA. Status and Prestige in
NAJMAN
22.
23.
24.
25.
26.
27.
28.
29.
30.
31.
32.
33.
40
Australia, Melbourne; Cheshire, 1969. Daniel A. Pobtvr. Privilege and Prestige: Occu- pations in Australia. Melbourne; Longman Cheshire, 1983. Powles J . S o c i o - E c o n o m i c Heal th Determinants in Working-Age Males, paper delivered at conference on: The Impact of Environment and LiJesf)de on Human Health, ANU, September 2-4, 1976; 1-12. Daniel A. The Measurement of Social Class, Community Health Stud 1984; 8(2): 2 18-222. Garnsey E. Occupational Structure i n lndustrialised Societies: Some Notes on the Convergence Thesis in the Light of Soviet Experience. Sociology 1975; 9: 437-58. Babushkina TA and Shubkin VV. The Statics and Dynamics of Occupational Prestige in The Social Structure ofthe U S S R by M. Y anowitch (ed), M.E. Sharpe; Armonk, New York, 1986; 81-103. Household Expenditure Survey. Australia 1984 ABS: Canberra, 1986. Osborn AF and Morris TC. The Rationale for a Composite Index of Social Class and its Evaluation. Br J Sociol 1979; 30( I): 39-60. Abramson J H et al. Indicators of Social Class. Soc Sci Med 1982; 16: 1739-1746. Schneider JA. Rewriting the SES: Demo- graphic Patterns and Divorcing Families. Soc Sci Med 1986; 23(2): 21 1-222. Broom L, Jones PL and Zubrzycki J . Social Stratification in Australia; in Jackson JJ (ed) Social Stratfficaiion, Cambridge; CUP, 1968; 230. Wright EO. Class Boundaries in Advanced Capitalist Societies. New Left Review 1976; 98: 3 4 1 . Wright EO. Class, Crisis and the Stare, London; New Left Books, 1978.
COMMUNITY HEALTH STUDIES

APPENDIX A
1986 Census - Occupation Questions
429. In the main job held last week what was the person’s occupation? * Give full title
430. What are the main tasks or duties that the person usually performs in that occupation? * Describe as fully as possible.
APPENDIX B
Job Autonomy Can you decide when to come to work and when to leave work? Can you decide on your own to introduce a new task or work . . .?
Supervision How many people do you direct or supervise? Can you influence the granting of a pay rise or promotion to a subordinate?
Decision Making (Control Over Investments) Are you personally involved in decisions to increase or decrease the total number of people employed in the
Do you participate in general policy decisions about the distribution of funds . . . where you work?
Source: Western, J.S. and Clegg, S. The Social structure of Australia Project Questionnaire.
place where you work?
NAJMAN 41 COMMUNITY HEALTH STUDIES