the measurement of noise inside cars
TRANSCRIPT
THE MEASUREMENT OF NOISE INSIDE CARS
R. D. FORD,* G. M. HUGHESt and D. J. SAUNDERS*
(Received: 22 September, 1969)
SUMMARY
A panel of subjects assessed the noisiness of six cars at four constant speeds. The sound pressure levels existing in the vehicles were measured in one-third octave bands from 25 to 10,000 Hz, and also using the A and B weighting networks. From the band levels estimates were made of single figure parameters to describe the noise environment, i.e. Zwicker Phons, Stevens Phons, Noise Criterion, Noise Rating Number and Speech Interference Level
Good correlation was found between subjective assessment and Zwicker Phons, Stevens Phons, dB(A) and dB(B). Less good correlation was obtained between the subjective assessment and Noise Criterion, Noise Rating Number and Speech Interference Level.
The experiment indicates that subjective response to internal car noise can adequately be measured using the A weighting network.
INTRODUCTION
The steady increase of long-distance motorway driving has accelerated the need to look critically at the noise levels inside motor vehicles. A noise environment in which it is possible without strain to listen to the radio or hold a conversation is desirable, and some manufacturers have used in their advertisements loosely worded claims about quietness, e.g. 'silence is golden at 60 mph in the . . . . '
* Acoustics Group Department of Pure and Applied Physics, University of Salford, Salford, Lanes, Great Britain.
t Consumers" Association. 69
Applied Acoustics (3) (1970)---O Elsevier Publishing Company Lid, England--Printed in Great Britain
70 R. 1). FOR[) . G. M. H U G H E S , D. J . SAUNDERS
It therefore seems reasonable that measurements of the noisiness of cars should form an integral part of any car test. The original suggestion that a basis for such measurements should be laid down came from the Consumers" Association and the following investigation was carried out jointly by the University of Salford and the Consumers' Association.
Earlier work I suggested that an octave band analysis of the noise is sufficient to describe the internal acoustic environment, but comparison of analyses from different cars is difficult, usually involving skilled subjective interpretation. This is clearly unsuitable for presentation to consumers and a single figure method would be preferable provided that it adequately describes the situation. There are several single figure objective methods currently in use for describing noise and the problem is to establish which of the units best correlates with the 'noisiness 'o f cars. Ideally, the correlation should be high under all possible conditions but since long-distance driving is normally carried out at steady cruising speeds, the experiments reported here were all carried out under steady conditions. It is appreciated that this investi- gation does not represent a complete range of possible noise spectra. However. it represents conditions frequently encountered in present-day motoring.
At this stage it is not intended that different cars should be compared nor is it suggested that any particular noise level is unacceptable. The sole aim is to establish a measuring procedure and when that is done further experiments will be required to establish a satisfaction scale.
CARS USED A N D TEST C O N D I T I O N S
Six cars were used in the investigation~ five of which were supplied by the Consumers ' Association and one by a member of the department.
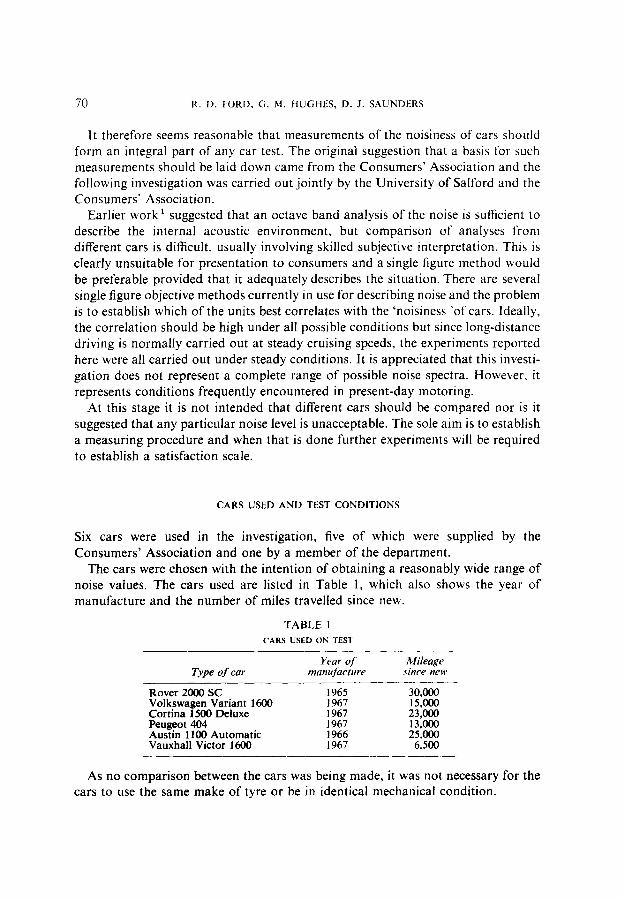
The cars were chosen with the intention of obtaining a reasonably wide range of noise values. The cars used are listed in Table 1. which also shows the year of manufacture and the number of miles travelled since new.
T A B L E 1
CARS USED ON TEST
Year o f Mileage Type o f car manufacture since new
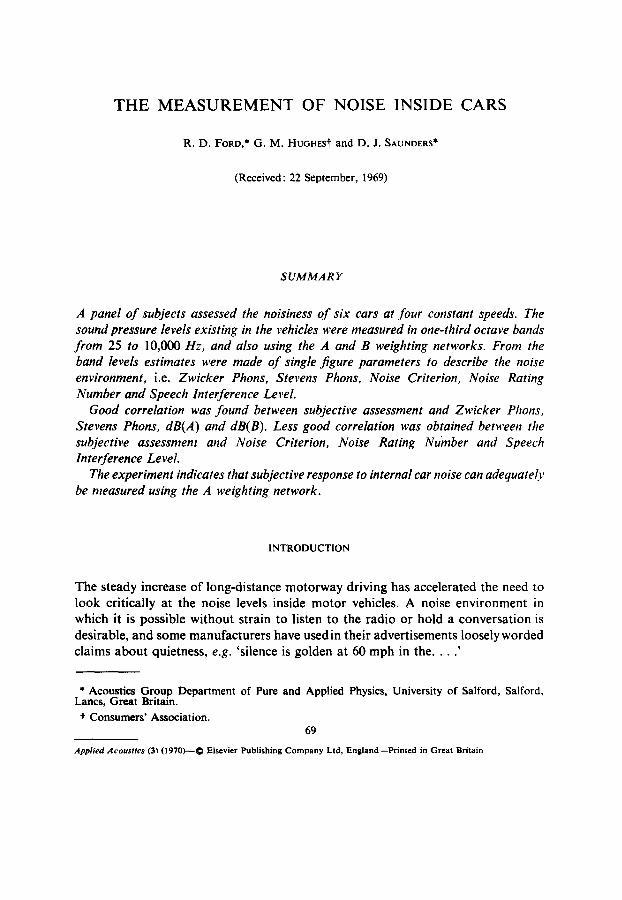
Rover 2000 SC 1965 30,000 Volkswagen Variant 1600 1967 15,000 Cortina 1500 Deluxe 1967 23,000 Peugeot 404 1967 13,000 Austin 1100 Automatic 1966 25.000 Vauxhall Victor 1600 1967 6,500
As no comparison between the cars was being made, it was not necessary for the cars to use the same make of tyre or be in identical mechanical condition.

THE MEASUREMENT OF NOISE INSIDE CARS 71
The tests were pe r fo rmed on a sect ion o f the M6, south o f the K n u t s f o r d service s ta t ion. The sect ion was app rox ima te ly 30 miles long, included no severe gradients and had a un i fo rm r o a d surface. A n y effects o f adverse weather condi t ions were e l imina ted by m a k i n g measurements only on fine days. To e l iminate as far as poss ib le effects due to the prevai l ing wind direct ion, ha l f of the object ive measure- ments were pe r fo rmed with the cars t ravel l ing south and ha l f with the cars t ravel l ing nor th . Also , the cars were a lways dr iven with all windows and air vents closed. Measu remen t s were made only with the cars t ravel l ing at s teady speeds. Each car a lways con ta ined two people plus the equ ipmen t dur ing the object ive tests, and three peop le dur ing the subject ive tests.
40 50 60 70
Front 2 3 5 6 Rover 2000
Rear 3 5 5 7
Front 5 6 7 7.5 Cortina 1500
Rear 5 6 6 7
Front 4 5.5 6 7 Volkswagen 1600
Rear 5 5-5 6 7
Front 3 5 6 7-5 Peugeot 404
Rear 2 3 5 7
Front 4.5 5"5 6"5 7.5 Austin 1100
Rear 4 4"5 6 6.5
Front 5 6 7 8 Victor 1600
Rear 4.5 5.5 6.5 7.5
1 2 3 4 5 6 7 8 9 Very Fairly Average Fairly Very quiet quiet noisy noisy
Your rating should refer only to these six cars. No account should be taken of any other vehicle you have ever travelled in, nor should it reflect the comfort, vibration level, the speed at which you are travelling or any other aspect except noise. Indicate your impression with a number. Halves, e.g. 6{, 8½ may be used if desired. If any aspect is particularly noticeable, e.g. wind noise, road noise, body boom, engine, etc., please comment.
Fig. 1. A typical rating chart completed by a subject.

72 R. D. FORD, G. M. HUGHES, D. J. SAUNDERS
SUBJECTIVE ASSESSMENTS
Twelve subjects were used and each was required to judge 48 different situations. This large number eliminated the comparative rating method, in which a subject is asked to judge between two different situations, since to rank 48 in this manner would have required 1128 decisions from each subject. Instead it was decided that the subject should assess the car according to his own standards.
R o v e r 40 50
60
70
P e u g e o t 40
50
60
70
V o L k s w a g e n ~o
50
60
7O
A u s t i n 40
SO
60
70
Cortina 4o 50
60
70
V i c t o r 40
5O
60
70
Fig. 2.
-- nll -n /
- l l I
-=11 " I I
i
F R F R F R F R F R F R F R F R F R F R F R F R F R F R F R F R F R F R F R F R F R F R F R F R
I I II II I o 5
M e d i a n s u b j e c t i v e r a t i n g
The median subjective ratings for the test vehicles and conditions.
10
The simplest form of subjective scale is the 3-point scale: quiet, average, and noisy. This may be extended by inserting, for example, moderately quiet, very quiet, moderately noisy and very noisy. Alternatively, an ordinal scale may be used where certain values are assigned to the categories, quiet, average, noisy, etc., and the subject may then select any number which he considers appropriate. It

THE MEASUREMENT OF NOISE INSIDE CARS 73
should be remembered, however, that numbers have only been introduced to increase the number of permissible categories and that the ordinal scale is not an equal-interval scale. The scale chosen for these tests ranged from 1 (very quiet) to 9 (very noisy) with the provision for halves, e.g. 4½, 6½, to be used if a subject so wished.
At the start of the day, in order to give some idea of the range of noise levels which would be experienced, all twelve subjects were taken for a short ride in each car at 60 mph, then two subjects were taken as passengers in each car, one in the
90
~E
z
x N
,= m
~u
u3
t~
" o
g 0 O3
80
70
6C
50
40 M,F'H
60 M.I~H.
70 1_
50 I t ~ K 31 63 125 250 5001000 2000
50 MP.H.
J-L
311 63
?OM I~H.
125 250 500 1000 2000
Cen t re f r equency of o c t a v e bands , Hz
Fig. 3. Typical one-third octave band spectra of internal car noise.
front and one in the rear, and they were driven for one minute at 40 mph, one minute at 50 mph, one minute at 60 mph, and one minute at 70 mph, in one continuous run. The two passengers then changed positions and the sequence was repeated on the return run. So each subject independently made eight judge- ments in each of the six cars, giving the total of 48 judgements in all. It took about 20 minutes for the two runs to be made in a car and a rest of about 15 minutes was allowed after each return journey.
The subjects were supplied with standard forms and a typical completed example is shown in Fig. 1. It must be ¢mphasised that the ratings refer only to the six cars used for the test, and that no attempt was made to devise a satisfaction scale.

7 4 R. D. FORD, G. M. HUGHES, D. J. SAUNDERS
The twelve complete sets of results were used to determine a median subjective rating for each set of conditions. Parametric statistics are not applicable so standard deviations cannot be computed, but the scatter was not large and the median ratings are both consistent and sensible. The results are presented graphically in
ROVER FRONT 40 ROVER REAR 40 PEUGEOT FRONT 60 ROVER FRONT 50 PEUGEOT REAR 40 ROVER REAR 50 AUSTIN FRONT 40 PEUGEOT REAR 50 PEUGEOT FRONT 50 VOLKSWA~N FRONT 40 AUSTIN REAR 40 CORTINA FRONT 40 CORTINA REAR 40 ROVER FRONT 60 VO L KSWAG~N REAR 40 VOLKSWAGEN FRONT 50 ROVER REAR 60 VICTOR REAR 40 VICTOR FRONT 40 AUSTIN REAR 50 AUSTIN FRONT 50 PEUGEOT FRONT 60 PEUGEOT REAR 60 VOL RSWAG~N REAR ,50 CORTINA FRONT 50 CORTINA REAR 50 ROVER REAR 70 ROVER FRONT 70 VOLKSWAG~ FRONT 60 PEUGEOT REAR 70 VICTOR FRONT 50 VOLKSWAC~N REAR 60 AUSTIN REAR 60 PEUGEOT FRONT 70 VICTOR REAR 50 CORTINA REAR 60 CORTINA FRONT 60 AUSTIN FRONT 60 VOLRSWAG4N FRONT 70 VICTOR REAR 60 AUSTIN REAR 70 V/CTOR FRONT 60 VOLKSWAGEN REAR 70 AUSTIN FRONT 70 CORTINA REAR 70 CORTINA FRONT 70 VICTOR REAR 70 VlC TOR FRONT ?0
Fig. 4.
! I
II I III II 0 5 10
Median subjective rating The median subjective ratings in order of subjective preference from quiet to noisy.
Figure 2, although it is again emphasised that the scale is not necessarily equal- interval. Comments concerning the noise source were requested but few were, in fact, received, and any attempt to summarise them would achieve nothing.
OBJECTIVE MEASUREMENTS
An initial investigation was carried out, using the Cortina, to determine a pro- cedure for measuring the noise environment inside the cars. It was hoped that a

THE MEASUREMENT OF NOISE INSIDE CARS 75
recording technique could have been employed as this would have reduced the time required to collect the data and consequently have reduced the cost of the tests. Recording the noise conditions would also have permitted the use of portable battery-powered equipment. To this end, a Briiel & Kjaer precision sound level meter, fitted with a one-inch condenser microphone, was used in conjunction with a
Fig. 5.
80 gO I00 Zwicker phons
The noise levels in Zwicker Phons in order of subjective preference from quiet to noisy.
Uher 4000 Report L tape recorder. Using the linear channel of the meter a con- tinuous recording of the noise was made. Unfortunately, when analysed, the recordings were found to be unsatisfactory as they were marred by random but frequent distortion. Further investigation showed that this was caused by a surging movement of the air in the car, which produced a large low-frequency pressure fluctuation at the microphone. The large signal produced by the microphone overloaded the preamplifier of the sound level meter causing distortion of the

76 R. D. FORD, G. M. HUGHES, D. J. SAUNDERS
recorded signal. If sufficient attenuation was introduced before the amplifier to prevent the large amplitude signal from overloading the system, much of the required signal was lost in the noise floor, This movement of the air occurred every time the car hit an irregularity in the road surface and is analogous to the lapping motion of water in a gently rocked bucket.
ROVER FRONT 60 ROVER REAR 40 PEUGEOT FRONT 40 PEUGEOT REAR 40 ROVER FRONT 50 ROVER REAR 50 PEUGEOT FRONT SO AUSTIN FRONT 40 PEUGEOT REAR 50 VOLKSWAGEN FRONT 60 CORTINA FRONT 40 AUSTIN REAR 40 CORTINA REAR 60 ROVER FRONT 60 VOLKSWAGEN FRONT 50 VOLKSWAGEN REAR 40 ROVER REAR 60 PEUGEOT FRONT 60 PEUGEOT REAR 60 AUSTIN REAR 50 VICTOR FRONT 4D AUSTIN FRONT 50 CORTINA FRONT 50 VICTOR REAR 40 VOLKSWAGEN REAR 50 CORTINA REAR 50 ROVER FRONT 70 ROVER REAR 70 VOLKSWAGBN FRONT 60 PEUGEOT REAR ?0 VICTOR FRONT 50 VOLKSWAGEN REAR 70 AUSTIN REAR 60 PEUGEOT FRONT 70 CORTINA FRONT 60 CORTINA REAR 60 VICTOR REAR 50 AUSTIN FRONT 60 VOL K SWAG~N FRONT 70 VICTOR REAR 60 AUST(N REAR 70 VICTOR FRONT 60 VOLKSWAGgN REAR 70 AUSTIN FRONT 70 CORTINA REAR 70 CORTINA FRONT 70 VICTOR FRONT 70 VICTOR REAR 70
80 90 Stevens phons
Fig. 6. The noise levels in Stevens Phons in order of subjective preference from quiet to noisy.
The problem was, to some extent, alleviated by recording the noise in third- octave bands rather than recording the total noise environment. This procedure, however, required an operator to change the filters and it was found that it was more convenient for the operator to read the sound pressure levels directly from a B & K microphone amplifier than to record the signal and analyse it later in the laboratory. Therefore, the final system used consisted of a one-inch condenser microphone connected to a Briiel & Kjaer microphone amplifier and filter set. The

THE MEASUREMENT OFNOISE,INSIDE CARS 77
power to drive this system was obtained by the use of a stationary dc/ac inverter which was run off the car battery. The stationary type of inverter was used, as its noise output was considerably less than that from inverters using mechanical moving choppers. Calibration of the system was effected by the use of a piston- phone. Frequent checks were made during measurement.
Fig. 7.
70 80 dB[A)
The noise levels in dB(A) in order of subjective preference from quiet to noisy.
The microphone was suspended above the front and rear seats of each car at a height corresponding to the position of the head of an average passenger. Care was taken to ensure that its position was not altered during the measurements. The sound pressure levels in the one-third octave bands from 25 Hz to l0 KHz were measured and also the dB(A) and dB(B) levels.
Typical one-third octave band spectra are shown in Fig. 3. All the cars gave peaks of the measured sound pressure level in the frequency bands corresponding
78 R. D. FORD, G. M. HUGHES, D. J. SAUNDERS
to multiples of the piston firing frequency. The most prominent peaks occurred at one and four times the firing frequency.
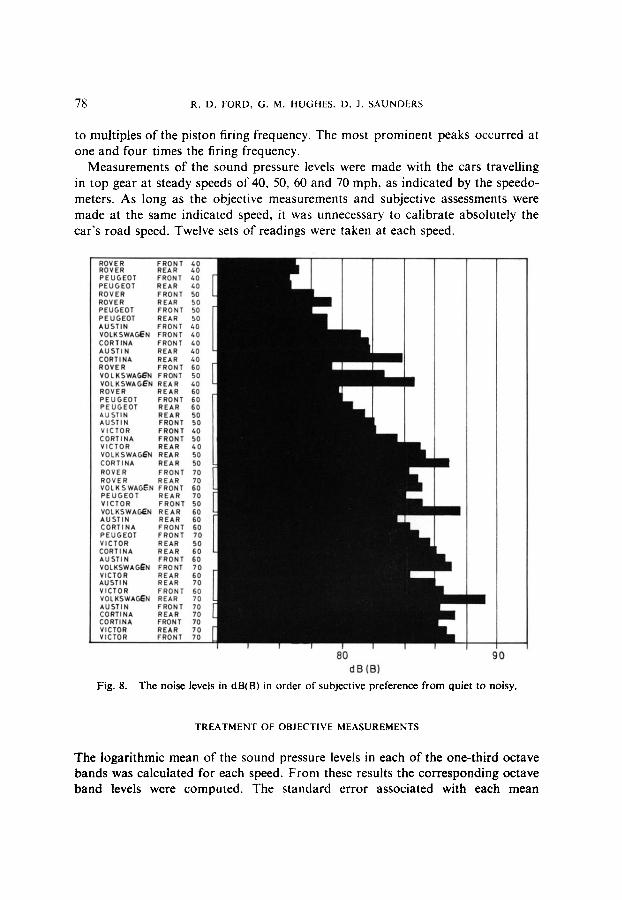
Measurements of the sound pressure levels were made with the cars travelling in top gear at steady speeds of 40, 50, 60 and 70 mph, as indicated by the speedo- meters. As long as the objective measurements and subjective assessments were made at the same indicated speed, it was unnecessary to calibrate absolutely the car's road speed. Twelve sets of readings were taken at each speed.
ROVER FRONT 40 ROVER REAR A0 PEUGEOT FRONT A0 PEUGEOT REAR 40 ROVER FRONT 50 ROVER REAR 50 PEUGEOT FRONT 50 PEUGEOT REAR 50 AUSTIN FRONT 40 VOLKSWAC~N FRONT 40 CORTINA FRONT &0 AUSTIN REAR 40 CORTINA REAR 40 ROVER FRONT 60 VO L K SWAG~'N FRONT 50 VOL KSWA G~N REAR 40 ROVER REAR 60 PEUGEOT FRONT 60 PEUGEOT REAR 60 AUSTIN REAR 50 AUSTIN FRONT 50 VICTOR FRONT 40 CORTINA FRONT 50 VICTOR REAR 40 VO LK SWAG6N REAR 50 EORTINA REAR 50 ROVER FRONT 70 ROVER REAR 70 VOLKSWAGEN FRONT 60 PEUGEOT REAR 70 VICTOR FRONT 50 VOL K$WAC~N REAR 60 AUSTIN REAR 60 CORTINA FRONT 60 PEUGEOT FRONT ?0 VICTOR REAR 50 CORTINA REAR 60 AUSTIN FRONT 60 VOLKSWAGEN FRONT 70 VICTOR REAR 60 AUSTIN REAR 70 VICTOR FRONT 60 VOL KSWAC~N REAR 70 AUSTIN FRONT 70 CORTINA REAR 70 CORTINA FRONT 70 VICTOR REAR 70 VICTOR FRONT 70
Fig. 8.
,, ' II 'IIII
1! °,,111 ~ q
11 IIIII II I ~m~ III
80 90 dB(B)
The noise levels in dB(B) in order of subjective preference from quiet to noisy.
TREATMENT OF OBJECTIVE MEASUREMENTS
The logarithmic mean of the sound pressure levels in each of the one-third octave bands was calculated for each speed. From these results the corresponding octave band levels were computed. The standard error associated with each mean
THE MEASUREMENT OF NOISE INSIDE CARS 7 9
octave and one-third octave level was also calculated. It was estimated that the error, including instrumental error, was of the order of _ 1 dB in all cases.
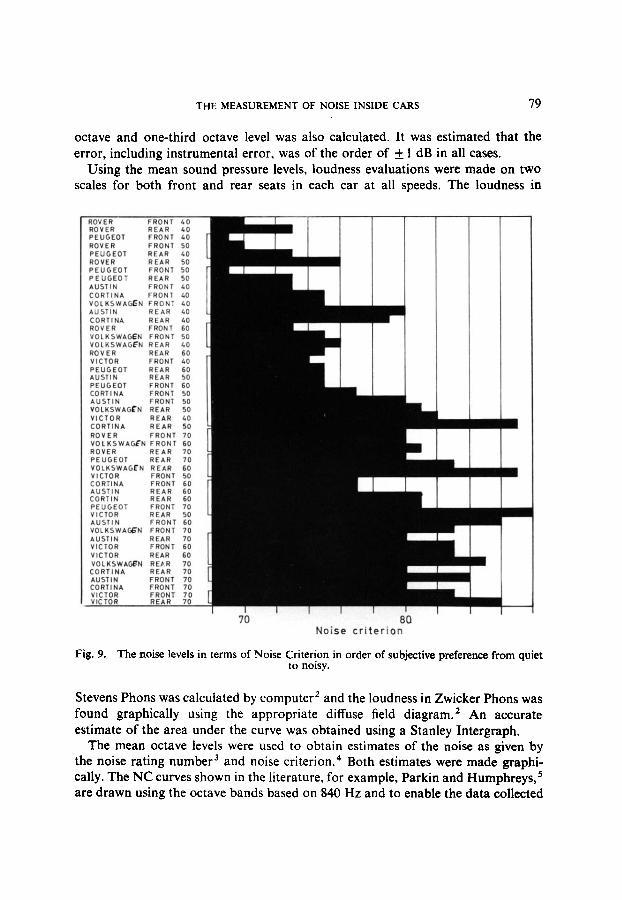
Using the mean sound pressure levels, loudness evaluations were made on two scales for both front and rear seats in each car at all speeds. The loudness in
ROVER FRONT 40 ROVER REAR 40 PEUGEOT FRONT 40 ROVER FRONT 50 PEUGEOT REAR 40 ROVER REAR 50 PEUGEOT FRONT 50 PEUGEOT REAR 50 AUSTIN FRONT 40 CORTINA FRONT 40 VOLKSWAGEN FRONT 40 AUSTIN REAR 40 CORTINA REAR &0 ROVER FRONT 60 VOLKSWAGEN FRONT 50 VOLKSWAGEN REAR &0 ROVER REAR 60 VICTOR FRONT &0 PEUGEOT REAR 60 AUSTIN REAR 50 PEUGEOT FRONT 60 CORTI NA FRONT 50 AUSTIN FRONT S0 VOLKSWAGEN REAR 50 VICTOR REAR 40 CORTINA REAR 50 ROVER FRONT 70 VOLKSWAGEN FRONT 60 ROVER REAR ?0 PEUGEOT REAR 70 VOLKSWAGE'N REAR 60 VICTOR FRONT 50 CORTINA FRONT 60 AUSTIN REAR 60 CORTIN REAR 60 PEUGEOT FRONT 70 VICTOR REAR 50 AUSTIN FRONT 60 VOLKSWAC~N FRONT 70 AUSTIN REAR ?0 VICTOR FRONT 60 VICTOR REAR 60 VO L KSWAC~N REAR 70 CORTINA REAR 70 AUSTIN FRONT 70 CORTINA FRONT 70 VICTOR FRONT 70 VICTOR REAR 70
Fig. 9.
--l"I/ -mat . . , m . l q
"ili i
"nilll "-- ' l l iUl
I II II 70 80
N o i s e c r i t e r i o n
The noise levels in terms of Noise Criterion in order of subjective preference from quiet to noisy.
Stevens Phons was calculated by computer 2 and the loudness in Zwicker Phons was found graphically using the appropriate diffuse field diagram. 2 An accurate estimate of the area under the curve was obtained using a Stanley Intergraph.
The mean octave levels were used to obtain estimates of the noise as given by the noise rating number 3 and noise criterion. 4 Both estimates were made graphi- cally. The NC curves shown in the literature, for example, Parkin and Humphreys, s are drawn using the octave bands based on 840 Hz and to enable the data collected

80 R. D. FORD, G. M. HUGHES, D. J. SAUNDERS
in this investigation to be used they were redrawn using octave bands based on 1000 Hz. Both the noise rating and noise criterion numbers are determined pri- marily by the large low-frequency component of the noise, and consequently it is to be anticipated that they will not reflect adequately the subjective response to the noise conditions. Speech interference levels 4 were also calculated from the mean o f the three octave bands centred on 1000. 2000 and 4000 Hz.
ROVER FRONT 40 ROVER REAR 40 PEUGEOT FRONT 40 PEUGEOT REAR 40 ROVER FRONT 50 ROVER REAR 50 AUSTIN FRONT 40 VO LK S WA G,~ N FRONT 40 AUSTIN REAR 40 PEUGEOT FRONT 50 PEUGEOT REAR 50 CORTI NA FRONT 40 CORTINA REAR 40 VOLKSWAGEN REAR 40 ROVER FRONT 60 VOL KSWAG~N FRONT 50 ROVER REAR 60 VICTOR FRONT 60 VICTOR REAR 40 AUSTIN FRONT b0 AUSTIN REAR 50 PEUGEOT FRONT 60 PEUGEOT REAR 60 VOLKSWAG~'N REAR 50 CORTINA FRONT 50 CORTI NA REAR 50 ROVER REAR 70 ROVER FRONT 70 VOL KSWAG~N FRONT 60 VICTOR FRONT 50 PEUGEOT REAR 70 VOL K SWA GE'N REAR 60 VICTOR REAR 50 AUSTIN REAR 60 PEUGEOT FRONT 70 CORTINA REAR 60 CORTINA FRONT 60 AUSTIN FRONT 60 VOLRSWAGFN FRONT 70 VICTOR REAR 60 VICTOR FRONT 60 AUSTIN REAR 70 VOLKSWAGEN REAR 70 AUSTIN FRONT 70 CORTINA REAR 70 CORT INA FRONT 70 VICTOR REAR 70 VICTOR FRONT 70
Fig. 10.
50 60 70 Speech interference fever
The noise levels in terms of Speech Interference Level in order of subjective preference from quiet to noisy.
CORRELATION OF RESULTS
For the purpose o f correlating the objective measurements with the subjective impressions, the 48 mean values have all been used together. N o attempt has been made to consider each car separately, for example, because 8 results would be too

THE MEASUREMENT OF NOISE INSIDE CARS 81
few and anyway the requirement is for a measuring method for all cars. The Spearman Rank Correlation Coefficient has been calculated for each objective unit and the results are summarised in Table 2. The significance level is less than 0-001 in all cases.
ROVER FRONT 40 ROVER REAR 40 PEUGEOT FRONT 40 ROVER FRONT 50 PEUGEOT REAR LO ROVER REAR 50 PEUGEOT FRONT 50 PEUGEOT REAR 50 AUSTIN FRONT 40 VOLKSWAG£'N FRONT &O CORTINA FRONT &0 AUSTIN REAR 40 CORTINA REAR 40 ROVER FRONT 60 VOLKSWAGEN REAR 40 VOLKSWAGEN FRONT 50 ROVER REAR 60 VICTOR FRONT 40 PEUGEOT REAR 60 PEUGEOT FRONT 60 AUSTIN REAR 50 VICTOR REAR &0 AUSTIN FRONT 50 VOL KSWAC~N REAR .50 CORTINA FRONT 50 CORTINA REAR 50 VOLKSWAGEN FRONT 60 ROVER FRONT 70 ROVER REAR 70 PEUGEOT REAR 70 VOL KSWAGF.N REAR 60 VICTOR FRONT 50 AUSTIN REAR 60 CORTI NA FRONT 60 CORTINA REAR 60 PEUGEOT FRONT 70 VICTOR REAR 50 AUSTIN FRONT 60 VOLKSWAG~'N FRONT 70 VICTOR REAR 60 AUSTIN REAR 70 VICTOR FRONT 60 VOL K SWAG~N REAR 70 CORTINA REAR 70 AUSTIN FRONT 70 CORTI NA FRONT 70 VICTOR REAR 70 VICTOR FRONT 70
= q "Rill
m
I
"' 'I I
Fig. 11.
60 70 80 N o i s e r a t i n g n u m b e r
The noise levels in terms of Noise Rating Number in order of subjective preference from quiet to noisy.
The Fisher test has been applied to the correlation coefficients and there is no meaningful difference between Zwicker Phons, Stevens Phons, dB(A) and dB(B), nor is there any meaningful difference between Noise Criterion, Speech Interference Level and Noise Rating Number.
To give some visual indication of the correlation, the median subjective ratings have been put in order going from the quietest to the noisiest. This is illustrated in Fig. 4. There are quite a large number of equalities, e.g. there are nine with a rating of 5, and within such groups there is no preference in order. Each set of objective

82 R. D. FORD, G. M. HUGHES, D. J. SAUNDERS
TABLE 2 CORRELATION BETWEEN SUBJECTIVE RATINGS
AND OBJECTIVE UNITS
Objective unit Spearman Rank Correlation Coefficient
Zwicker Phons 0-89 Stevens Phons 0.86 dB(A) 0-86 dB(B) 0.86 Noise Criterion 0.79 Speech Interference Level 0.78 Noise Rating Number 0.77
03
2
~_ 90
r,4
9 5 -
85
" C -
Key : R Rover C Co r t i na V V ic to r W V o l k s w a g e n A Aus t i n P Peugeo t
A r C C /
W A~
A~ P P
f A R = g 7 % V
R P
65 i J , I
60 70 75 80 dBA leve ls
Fig. 12. The correlation between Zwicker Phons and dB(A).
measurements has been similarly ranked, i.e. from subjectively quiet to subjectively noisy, and there are shown in Figs. 5-11. Within the subjectively equal groups, the objective measurements have been ranked from low to high, and the order is not necessarily the same in each figure. If the correlation were perfect between an objective unit and the subjective rating, the shape of the two diagrams would be very similar. Equalities would occur in the same places and, going from top to bottom, there would never be a decrease in the objective value. So the smoothness of the
THE MEASUREMENT OF NOISE INSIDE CARS 83
silhouette becomes, to some extent, an indication of correlation. Certainly, it is easy tO see that Zwicker Phons, Stevens Phons, dB(A) and dB(B) are superior to the rest, and many individuals have picked out the Zwicker Phon diagram as being the best.
The irregularities in the objective unit diagrams are remarkably consistent, suggesting that there is very strong correlation between them. A comparison between Zwicker Phons, taking that as the best unit, and dB(A), the most widely used unit, is made in Fig. 12. Normal parametric statistics give a product-moment correlation coefficient of 0.97, which is indeed very high. It seems unlikely that all the different systems could miss some subjectively vital element of the noise, so the possibility arises that the subjective ratings are not as perfect as has been assumed.
CONCLUSIONS
The cars used for the test were probably representative of the majority of cars currently on British roads in that they covered the range of internal noise levels most likely to be encountered. On any of the seven objective measuring systems, this range is covered by only about 20 units, which is really quite small. It is therefore all the more remarkable that the twelve subjects could be so perceptive when rating the different cars under the different conditions. Although some of them were rather sceptical before the tests started, at the end they were all confident that they had been able to judge the noise reasonably fairly and easily. It is possible that the range, although small, is an important one in that at the top end, conversation is difficult and perhaps the noise leads to nervous tension, while at the bottom end, conversation is easy and the occupants feel more relaxed. Whatever the reason, it is clear that noise is an important criterion and that some objective measure of internal noise level should be quoted along with all the normal performance figures.
The numerical correlations between the subjective rating and the four objective units, dB(A), dB(B), Zwicker Phons and Stevens Phons, are all equally high and there is little to choose between them. Comparing the diagrams, which take into account the objective values in addition to the rank ordering, it might be argued that Zwicker Phons are marginally better. There is clearly very little difference, however, since the correlation between Zwicker Phons and dB(A) is 0"97. The general shape of the four diagrams is very similar in each case, and it must either be that all four objective units miss something vital, which seems unlikely, or that the subjective ratings are not perfectly accurate. No consistent error is observ- able, e.g. subconscious allowances made for comfort or speed, and it can only be supposed that a greater subjective sample should be tested over a greater variety of conditions. It seems safe to conclude that only Zwicker Phons and dB(A) need be considered in any subsequent tests.
84 R. D. FORD, G. M. HUGHES, D. J. SAUNDERS
No at tempt was made to establish any acceptability criterion, and this should be done so as to provide a target. Nevertheless, it is possible to measure the noise inside vehicles under set condi t ions and to make a comparison, al though it is doubtful whether differences of fewer than 3 units are important .
REFERENCES
1. J. R. BRISTOW, Noise in private cars, lnst. Mech. Engrs., Automobile Div., Proc. 1951-52, Part I, pp. 9-22.
2. B.S. 4198:1967. Method for calculating loudness. 3. C. M. KOSTEN and G. J. VAN OS, The control of noise, NPL Syrnp. No. 12, HMSO, 1962. 4. L. L. BE/O, NIEK, Noise Reduction, McGraw-Hill, New York, 1960. 5. P. H. PARKIN and H. R. HUMPHREYS, Acoustics Noise and Buildings, Faber, London, 1958.