the measurement of ionic conductivities and mobilities of certain less common organic ions needed...
TRANSCRIPT

ELS%TER Journal of Neuroscience Methods 56 (1995) 37-41
The measurement of ionic conductivities and mobilities of certain less common organic ions needed for junction potential corrections
in electrophysiology
Ben Ng, Peter H. Barry * School o,f Physiology and Pharmacology, Unir:ersity of New South Wales, Sydney NS W 2M2, Aurtraliu
Received 4 February 1994; revised 19 May 1994; accepted 19 May 1994
Abstract
Junction potential corrections are often required in electrophysiological measurements, particularly when using the patch- clamp technique. The ionic conductivities and mobilities of certain less common organic ions were measured for use in junction potential corrections in electrophysiological measurements. The mobilities of these ions relative to K+ were: aspartate (0.30), choline (0.50, gluconate (0.33), glutamate (0.261, HEPES (0.30), isethionate (0.521, MES (0.371, MOPS (0.351, N-methyl-n- glucamine (0.331, and Tris (0.40). In addition, junction potentials were directly measured for a number of typical simplified patch-clamp solutions containing these ions. The measured junction potentials generally agreed well with the values calculated using the Generalized Henderson Equation with the appropriate ionic mobility. The accuracy of the measurements is discussed.
Keywords: Ion mobility; Conductivity; Junction potential; Patch-clamp; Organic ion ..--__l
1. Introduction
Liquid junction potentials, which arise whenever solutions of different ionic composition are in contact, are almost invariably always present in electrophysio- logical measurements (e.g., in epithelial, intracellular microelectrode and patch-clamp measurements). In particular, the advent of the patch-clamp technique has especially highlighted the need for appropriate correc- tions, since they tend to be much larger in patch-clamp measurements than in other situations, mainly because of the high concentrations of less common ions used in patch-clamp measurements and the fact that such ions often have very different mobilities. In contrast to typical intracellular recordings with high concentration KCI-filled microelectrodes in which the junction poten- tiaIs are small (about 2 mV> and relativeIy independent
Abbreuiations: NMDG, N-methyl-n-glucamine; Tris, tris[hydroxy- methyllaminomethane; HEPES, N-12-hydroxyethyllpiperazine-N’-[2- ethanesulfonic acid]; MOPS, 3-[N-morpholinolpropanesulfonic acid; and MES. 2-l N-morpholinolethanesulfonic acid.
* Corresponding author. Tel.: (61) 2-385-2566; Fax: (61) 2-385-1059.
01650270/95/$09.50 0 1995 Elsevier Science B.V. All rights reserved SSDI 0165-0270(94)00087-W
of the solutions into which the electrode is placed, the patch-clamp corrections often have liquid junction po- tentials of up to 10 mV or more (for a detailed discus- sion see Barry and Lynch, 1991). The standard practice of zeroing the patch-clamp amplifer prior to forming a seal, using the patch-clamp technique, does NOT elim- inate this junction potential, and failure to compensate for the effects of junction potentials can introduce significant errors in the analysis of the results (Barry and Lynch, 1991: Neher, 1992, 1994).
in order to compensate for the effects of junction potentials, their magnitudes can be directly measured and the appropriate corrections applied (Neher, 3992, 1994). However, it should be stressed that even junc- tion potential measurements themselves require addi- tional corrections. It is therefore often simpler to cal- culate the full junction potential correction directly. A program, JPCalc, has been developed which aids in calculating junction potential corrections in patch- clamp (excised, whole-cell, celi-attached, perforated patch configurations) and other electrophysioiogical measurements (Barry, 1994). Nevertheless, any such calculations require the ionic mobilities of the ions present in the different solutions to be known or at
38 B. Ng, P.H. Barry /Journal of Neuroscience Methods 56 (1995) 37-41
least able to be reasonably estimated. While the mobil- ities of the more common ions have been published (e.g., Barry and Lynch, 1991; see also limiting equiva- lent conductance data of Robinson and Stokes, 1965), the mobilities of other less common ions are either unknown, or their measurements are not easily traced. In this study, we have measured the mobilities of some of these previously unknown ions, many of which are often now commonly used in patch-clamp experiments, including gluconate, glutamate, choline, aspartate, isethionate, NMDG, Tris, HEPES, MOPS and MES. Where limiting equivalent conductivities of a few of these (choline, gluconate, isethionate, NMDG and pro- pionate) have previously been measured (Robinson and Stokes, 1965; Zuidema et al., 1985), we have compared our results with those values. In addition, we have also directly measured the junction potentials for some typical simplified patch-clamp solutions and com- pared their corrected values with the theoretical pre- dictions of the Generalised Henderson Equation. This equation may be shown to be given by (e.g., Morf, 1981; Barry and Lynch, 1991):
ES - EP = (RT/F) S, In e zzui$‘/ 5 .zfuiap i=l i=l i
where
and where ES - EP represents the potential of the solution (S) with respect to the pipette (P) or electrode and u, a and z represent the relative mobility, activity and valency (including sign) of each ion species (i); R is the gas constant, T is the temperature in K and F is the Faraday, so that RT/F In = 58.2 log,, at a tem- perature of 20°C.
A preliminary account of some of these results has been presented elsewhere (Ng and Barry, 1994).
2. Methods
2.1. Measurement of ionic mobilities
Relative ionic mobilities were calculated from mea- surements of the limiting equivalent conductivities of the ions. The limiting equivalent ionic conductivity was measured using a conductivity meter (Radiometer CDM 83, Copenhagen). The Onsager relationship:
A,=A,+mG (2) which is expected to describe the relationship between equivalent conductivity and concentration at very low concentrations (MacInnes, 1961), was fitted by linear regression to the measured equivalent conductivities at concentrations of 1, 3, 5 and 10 mmol/l, where A, is
the equivalent conductivity at a molar concentration c, m (the gradient of the line; see also Discussion) is a constant independent of concentration, and A, is the limiting equivalent conductivity (see Fig. 2). The con- ductivity of each concentration was measured on 3 separate occasions, and the standard deviation (SD) of A, calculated. The reference temperature to which all measurements were referred was 25°C. To calibrate the conductivity meter, the published data for NaCl and KC1 were used. To obtain single ion conductivities, the limiting equivalent conductivity of Na+, Kf or Cl- (50.10, 73.50, or 76.35, respectively) was subtracted from the limiting equivalent conductivity of the salt, The single ion conductivity was then divided by the conductivity of K+ to obtain its mobility relative to K+. All salts were at least of analytical grade. Chloride salts of NMDG and Tris, and sodium salts of HEPES, MES and MOPS, were titrated to pH 7 with HCl and NaOH, respectively. The NaCl and KC1 salts were obtained from UNIVAR-AIAX Chemicals (Auburn, NSW, Aus- tralia) and BDH Chemicals (Kilsyth, VIC, Australia) respectively and all the others, of high purity, were obtained from Sigma (St. Louis, MO). All solutions were made using double-distilled water.
Temperature compensation for temperatures be- tween a fairly small range of temperatures between about 21.6”C and 23°C to a reference temperature of 25°C was made using the following temperature com- pensation function that is built in to the conductivity meter:
A fref=At/[l +a(t - tref)] (3)
where tref is the temperature to which the conduc- tance (A,,,,, i.e., 25°C) is to be referred and A, is the conductance at the sample temperature, t. Generally, a standard temperature coefficent, (r, of 0.019 was used,
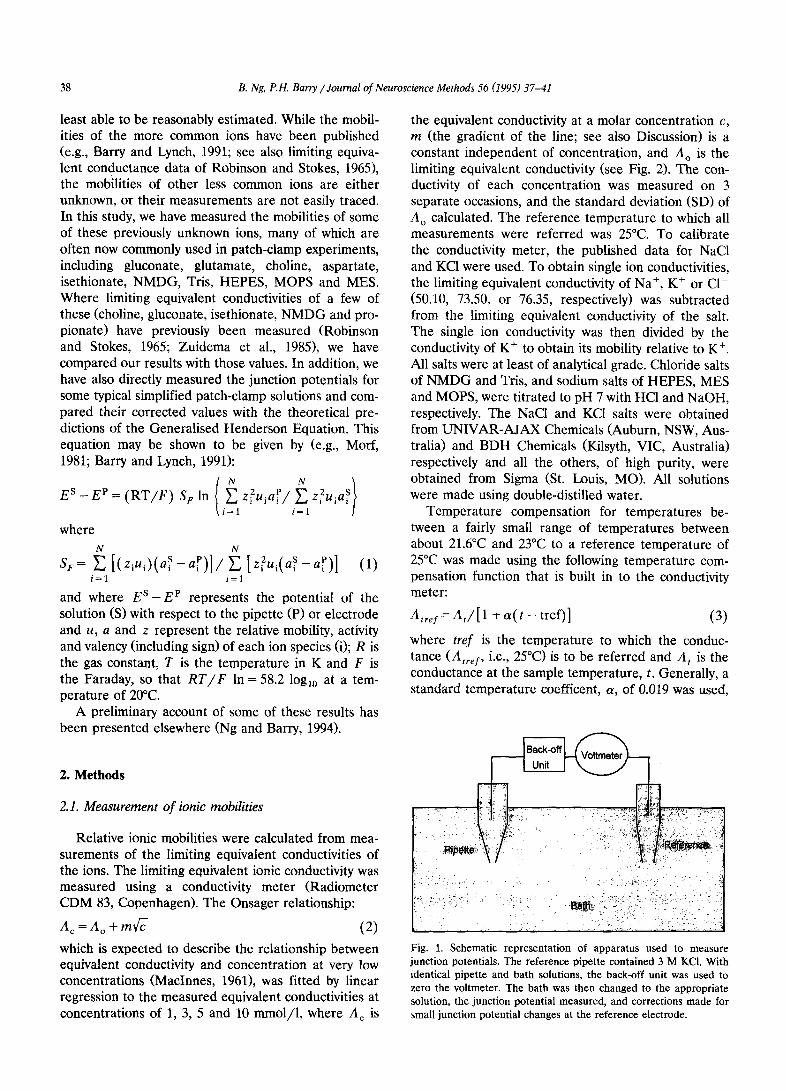
Fig. 1. Schematic representation of apparatus used to measure junction potentials. The reference pipette contained 3 M KCI. With identical pipette and bath solutions, the back-off unit was used to zero the voltmeter. The bath was then changed to the appropriate solution, the junction potential measured, and corrections made for small junction potential changes at the reference electrode.

E. NgT P. H. Barry /Journal of Neuroscience Me&o& 56 i I!+951 3 7-41 w
based on published data for KC1 in Robinson and Stokes (1965).
2.2. Measurement of junction potentials
The technique used to measure junction potentials is shown diagramatically in Fig. 1. Wide bore patch pipettes (average tip resistance: 14.2 MW) were pulled on a pipette-puller (Flaming-Brown, Model P87, Sutter instrument, USA) and connected to a back-off unit and high input impedance digital voltmeter (MX51, ITT Instruments, Metrix, Annecy, France; input im- pedance > 1 Go>, with the electrodes being Ag/AgCl wires. carefully chlorided (see Barry and Diamond, 1970). After zeroing the voltmeter with identical bath and pipette solutions, the bath was changed to the appropriate solution and the junction potential mea- sured at a laboratory temperature of 20°C. The refer- ence pipette contained 3 M KCl. New pipettes were used for each separate measurement.
3. Results
As illustrated in Fig. 2 for sodium aspartate, the relationship between the molar equivalent conductivity (‘4,) and 6 is well fitted by a straight line for concen- trations in the range l-10 mmol/l. The same relation- ship applied for each of the other salts whose mobili- ties were measured (data not shown).
Table 1 lists the mobility of the ions measured, relative to K +. Except for sodium gluconate and sodium isethionate, the values obtained here were comparable
.Table 1 tonic conductivity and mobility of ions
-I
Equivalent conductivity
(cm2S equiv-I)
Square root of (molar concentration x 1000) Fig. 2. Equivalent conductivity of sodium aspartate. Each point represents a separate conductivity measurement at the indicated concentration. The line was fitted by linear regression to the function ,,I, = ,I,, + &. The intersection of the fine with the t :rxi\ gives the limiting equivalent conductivity ( ,t,,)
to other quoted values where these existed. The dis- crepancy between the values for sodium gluconate (?I,, = 74.56) and sodium isethionate (:I,, := 88.02) quoted here, and those quoted by Zuidema et al. (1985; il, = 77.9 and 91.3, respectively) is difficult to explain. How- ever, it should be noted, in support of our measure- ments, that the mobilities of gluconate we obtained by measuring both sodium gluconate and potassium glu- conate agreed very well In addition. our measure-
__.-. .--_-_--.- .__ Salt Limiting equivalent SD Other quoted Conductivity Mobility of ion pH range
conductivity values of ion (relative to K ’ ) -__- _-- .-._ - -__ _ ..~ __... ~____.. - NaCI 126.29 0.20 126.45 a KC1 150.04 0.17 149.85 a NaPropionate 84.54 0.11 x5.9 c Na-Aspartate 70.31 0.11 n/a 20.21 0.27 .;.4%5.5V K-Aspartate 97.19 0.23 n/a 23.69 0.32 4.37.5.46 CholineCl 113.59 0.15 114.4 h 37.24 0.51 NaGluconate 74.56 0.12 77.9 h 24.46 0.33 h LO-677 K-Gluconate 07.40 0.05 n/a 23.90 0.33 6 I-L-6.62 Na-Glutamate 69.17 0.10 n/a 19.07 13.26 h..y-6.Y’ NaHEPES 72.45 0.10 n/a IL__. 77 75 0.30 h.YY-7.0-l Na-Isethionate xx.02 0.10 91.3 h 37.92 0.52 6.3X-X.hI NaMES 76.94 0.07 n/a 26.84 0.37 h.YY-7.(f! NaMOPS 75.83 0.16 n/a 25.73 0.35 6.W7.01 NMDG-Cl 100.40 0.12 100.1 h 24.05 0.33 6.38-7.42 TrisCl 105.55 0.11 n/a 29.213 0.40 h.Yh-7.06
- Units of conductivity are cm’. S. equiv- ‘. Allowing for some error in the individual ion limiting equivalent conductivites for Na -. K- and Cl 1 subtracted from the salt values, the estimated error in the relative mobilities was considered to be less than about 0.005. See text lor other details. a Robinson and Stokes, lY59. h Zuidema et al.. 1985. ’ Dean, IYS5.

40 3. Ng, P.H. Barry /JournaI of Neuroscience Methods 56 (1995) 37-41
ments also agreed with an unpublished estimate (1 measurement) of 0.32 obtained for gluconate by S. Kleene and R. Gesteland (1994; personal communica- tion). Other unpublished relative mobility estimates for choline and NMDG (S. Kleene and R. Gesteland, 1994; personal communication) were 0.47 and 0.28, respectively, and an initial estimate for methanesul- fonate was 0.58, all these values being relative to K+.
Table 2 shows the junction potentials measured (and appropriately corrected) for some test solutions and typical simplifed patch-clamp solutions. These values were compared with the theoretical predictions ob- tained using the Generalized Henderson Equation. The first part of the table shows the data for some simple univalent salts. The second part of the table shows data for solutions involving the organic ions, whose mobilities have now been measured, with the theoretical predictions calculated using the mobility data in Table 1. In the last part of the table, junction potentials for some divalent salts are shown.
4. Discussion
The relationship between equivalent conductivity and concentration (Eq. 2) was derived by Onsager (e.g., MacInnes, 1961, pp. 322-334). Strictly, the more com- plete equation is:
n=n,-[en,+& (4)
where 0 is a constant inversely related to the 3/2 power of the dielectric constant of water times the temperature in “K and u is a constant inversely related to the l/2 power of the dielectric constant of water times the temperature in “K and also inversely related to the viscosity of the solution. However, this expres- sion is only really expected to be valid for very dilute solutions and under such conditions, Eq. 2 has been shown to be obeyed empirically by strong electrolytes. For all the electrolytes tested in this present study, even the more exotic salts, the data fitted Eq. 2 well (e.g., Fig. 2, for sodium aspartate), thus allowing us to determine the limiting equivalent conductivity, A,, from the extrapolation of that relationship to the value at zero concentration. Although the slope parameter m is expected to vary between electrolytes and may even be dependent on pH, this would not be expected to change the conductivity-concentration relationship nor the extrapolated value of the limiting equivalent con- ductivity, A,.
Following determination of limiting equivalent con- ductivities, the ionic mobility of some less common, but now frequently used, organic ions were determined. With the exception of gluconate and isethionate, there was good agreement between the values obtained and previously published values, where these existed. This indicates that the technique used was valid and accu- rate.
As shown in Table 2, for simple univalent salts the measured and predicted junction potentials agreed in
Table 2 Corrected junction potentials measured for some typical simplified patch-clamp solutions (mean f SEM; number of separate measurements in parenthesis), compared with their theoretical predictions using the Generalized Henderson Equation (T = 20°C)
Pipette (mmol/l)
Bath (mmol/l)
Junction potentials (mV)
Measured values Theoretical values
Univalent NaCl50 NaCl150 NaCl50
‘Exotic’ NaCl50 NaCll50 NaCl50 NaCl 150 CholineCll50 CSCI 150 NaCl 150 NaCl 100 NaCll50 NaCl 100 NaCl 100 NaCl 100 NaCl 100
Divalent NaCl 100 CaCI, 100 KC1 lOO/CaCl, 2 CaCI, 50/MgCI, 50
KC1 50 KC1 150 CSCI 50
NaGluconate 50 NaGluconate 150 NaGlutamate 50 NaGlutamate 150 NaCll50 CholineCl 150 NaAspartate 150 NaHEPES 100 Nalsethionate 150 NaMES 100 NaMOPS 100 NMDG-Cl 100 TrisCl 100
MgCI, 100 MgCl, 100 LiCl lOO/CaCl, 2 LiCl 100
- 4.3 rt 0.04 (10) -4.3 - 4.2 + 0.06 (16) -4.3 - 4.6 + 0.04 (16) -4.9
- 13.4 f 0.2 (16) - 14.4 + 0.1 (16) - 12.9 + 0.1 (28) - 14.0 f 0.09 (16)
- 2.5 f 0.07 (161 +7.6 f 0.13 (12)
- 12.8 f 0.2 (12) - 15.2 * 0.15 (12) - 10.2 f 0.08 (16) - 13.3 f 0.15 (12) - 13.9 k 0.16 (12)
+ 5.3 f 0.1 (12) +5.1 f 0.04 (12)
- 13.4 - 13.4 - 15.3 - 15.3 - 2.7 +7.6
- 14.2 - 14.1 -9.2
- 12.6 - 12.9 +5.8 +4.6
+ 11.1 f 0.04 (10) + 0.9 f 0.05 (16) + 6.6 f 0.1 (16) - 9.2 zt 0.06 (16)
+ 10.0 + 0.6 + 6.4 -8.2

B. Ng P.H. Barr?, /Journal of Neuroscience Methods 56 (1995) .V-41 41
most cases to within 0.5 mV. This (1) indicates that the technique used to measure junction potentials was accurate, and (2) reinforces the success with which the Generalized Henderson Equation predicts junction po- tentials for univalent salts.
The second part of Table 2 shows junction poten- tials for solutions involving the organic ions whose mobilities have now been measured. The measured junction potentials agreed well with the theoretical predictions calculated using the mobility data. This suggests that the measured mobilities are at worst a reasonable estimate of the true values. It has already been noted (Barry and Diamond, 1970) that slightly better agreement between predictions and measure- ments of junction potentials was obtained for inorganic ions if activities rather than concentrations were used. This may even be more significant for some of the organic ions, which are weak acids or bases. Unfortu- nately, the activity coefficients of these rather ‘exotic’ ions are not known.
Finally, some uncertainty exists as to how success- fully the Generalized Henderson Equation predicts junction potentials where there are high concentrations of polyvalent ions involved. The last part of Table 2 indicates that, at least for simple solutions containing high concentrations of divalent ions, measured junction potentials agreed fairly well (e.g., to within 1.5 mV) with values predicted by the Generalized Henderson Equation.
Acknowledgements
much appreciated, as was the support of the i\ustralian Research Council.
References
Barry, P.H. (1994) JPCalc, a software package tar calculating liquid junction potential corrections in patch-clamp, intracellular, ep- ithelial and bilayer measurements and for correcting junction potential measurements. J. Neurosci. Methods. 51: 107-I 16.
Barry, P.H. and Diamond, J.M. (1970) Junction potentials, electrode standard potentials, and other problems in interpreting electrical properties in membranes. J. Membrane Biol.. 3: 93.-122.
Barry, P.H. and Lynch, J.W. (1991) Topical Review. Liquid junction potentials and small cell effects in patch-clamp analysis. J. Mem- brane Biol.. 121: 101.-117.
Dean, J.A. (Ed.) (1985) Lange’s Handbook of (‘hemistry, 13th edn., McGraw-Hill, New York.
Maclnnes, D.A. (1961) The Principles of Electrochemistry. Dover Publ., New York.
Morf. W.E. (1981) The Principles of Ion-Selective Electrodes and of Membrane Transport, Elsevier, Amsterdam.
Neher, E. (1992) Correction for liquid junction potentials in patch- clamp experiments. Ion Channels. Methods Enzym., 207: 12% 131.
Neher, E. (1994) Voltage offsets in patch clamp experiments. In: B. Sakmann and E. Neher (Eds.). Single Channel Recording, 2nd edn., Plenum, New York.
Ng, B. and Barry. P.H. (1994) Measurement ot additional ionic mobilities for use in junction potential corrections in patch- clamping and other electrophysiological measurements. Proc Aust. Nrurosci. Sot.. 5: 141.
Robinson, R.A. and Stokes. R.H. (1965) Electrolyte Solutions. 2nd edn. revised, Butterworth’s, London.
Zuidema, T.. Dekker. K. and Siegenbeek van Heukelom.. J. (1985) The influence of organic counterions on junction potentials and measured membrane potentials. Bioelectrochcm. Bioenerget.. 14: 479-494.
The help of Elaine Bonnet and Mervat Hallani, particularly in the early stages of this project, was