the mcat exam: year at a glance 2015 · pdf filethe mcat exam: year at a glance 2015. 2 what...
TRANSCRIPT

©2015 AAMC. May be reproduced and distributed with attribution and
without alteration by and within AAMC member organizations only.
The MCAT Exam:
Year at a Glance
2015
2
What we will talk about today?
1. How is the new MCAT exam different from the old?
2. What are the characteristics of students who took the new exam?
3. How did examinees prepare for the new test?
4. How well did the new score scales work?
5. How well did examinees score on the new test?
6. Which 2015 examinees applied for 2016 admission?
7. What information is available about the predictive validity of scores from the new exam?
8. What else will we learn about the impact, use, and validity of the new exam?

3
How is the new MCAT exam different from the old?

4
New MCAT shifts the focus from testing what students know to testing how well they use what they know.
• Asks students to apply knowledge by solving scientific problems and reasoning about research and data
• Requires broader preparation
• Gives attention to behavioral and sociocultural aspects of health
• Incorporates the latest science on information processing

5
It tests new concepts and skills.
Content New MCAT Exam Old MCAT
Exam
Biology
Chemistry
Physics
Verbal reasoning
Biochemistry
Psychology
Sociology

6
The new exam has four sections.

7
What are the characteristics of students who took the new exam?

8
Students took the new exam in the same proportions as they took the old exam.
Percentage of Examinees Taking the New MCAT Exam by Gender, Race/Ethnicity, Fee Assistance Status, Testing Condition, and Repeater Status
(N=59,996)
46%54%
48%11%11%
26%1%<1%
4%
94%6%
99%1%
93%7%
0% 10% 20% 30% 40% 50% 60% 70% 80% 90% 100%
MaleFemale
WhiteBlack
HispanicAsian
American Indian/Alaska NativeNative Hawaiian/Pacific Islander
Other
Did Not ReceiveReceived
StandardNonstandard
Non-RepeaterRepeater
Race/Ethnicity1,2
Fee Assistance
Testing Condition3
Repeater Status4

9
How did examinees prepare for the new test?

10
Higher percentages of examines took biochemistry, psychology, sociology, and statistics courses than in the past.
Percentage of Examinees Taking the New MCAT Exam Who Completed College Coursework in the Natural, Behavioral, and Social Sciences or MCAT
Preparation Courses (N=59,996)
77%
79%
43%
37%
76%
91%
83%
95%
91%
7%
43%
0% 10% 20% 30% 40% 50% 60% 70% 80% 90% 100%
Biochemistry
Psychology
Sociology
Research Methods
Statistics
Biology
General Chemistry
Organic Chemistry
Physics
From a university/medical school
Commercial
Coursework1
MCATPreparation Courses
11
How well did the new scorescales work?

12
The new test needs new scores.
• New and old exam test different knowledge and skills, requiring a new score scale
• New score reports pair scores with percentile ranks that help attach new meaning to scores
• Percentile ranks for 2015 scores were calculated by weighting the data from early examinees to reflect a typical testing year

13
The distribution of scores from the full testing year was similar to the distribution of weighted scores for early examinees.
472 476 480 484 488 492 496 500 504 508 512 516 520 524 528
Full Year (mean = 499.6; N = 64,504)
472 476 480 484 488 492 496 500 504 508 512 516 520 524 528
0.0%
0.5%
1.0%
1.5%
2.0%
2.5%
3.0%
3.5%
4.0%
Early Examinees(mean = 500.0; N = 11,251)
MCAT Total Score MCAT Total Score
14
How well did examinees score on the new test?

15
For every group, there was wide variation in scores.
Ne
w M
CA
T T
ota
l S
co
res
fo
r 2
01
5 E
xa
min
ees
Ov
era
ll a
nd
by
Ge
nd
er,
Ra
ce
/Eth
nic
ity,
Fe
e
As
sis
tan
ce S
tatu
s,
Te
sti
ng
Co
nd
itio
n,
an
d
Re
pea
ter
Sta
tus (
N=
64
,504
)1
472 476 480 484 488 492 496 500 504 508 512 516 520 524 528
Repeater - 2nd attempt (mean = 497.4; N = 4,423)
Repeater - 1st attempt (mean = 495.4; N = 4,423)
Non-repeater (mean = 500.1; N = 55,573)
Nonstandard (mean = 500.9; N = 465)
Standard (mean = 499.6; N = 64,039)
Received (mean = 495.0; N = 3,685)
Did Not Receive (mean = 499.9; N = 60,819)
Native Hawaiian or Other Pacific Islander (mean = 496.6; N =…
American Indian or Alaska Native (mean = 496.4; N = 614)
Asian (mean = 500.8; N = 15,765)
Hispanic (mean = 494.8; N = 6,793)
Black or African American (mean = 492.6; N = 6,895)
White (mean=501.6; N = 29,217)
Female (mean = 498.3; N = 35,240)
Male (mean = 501.2; N = 29,125)
Total (mean = 499.6; N = 64,504)
Gender
Race/Ethnicity2
Fee Assistance
Testing Condition3
RepeaterStatus4
Total

16
Which 2015 examinees applied for 2016 admission?

17
The median score of 2016 applicants is slightly higher than that of 2015 examinees
New MCAT Total Scores for 2015 Examinees and 2016 Applicants

18
What information is available about the predictive validity of scores from
the new exam?

19
Scores from the Psychological, Social, and Biological Foundations of Behavior section prototype correlate well with grades in several types of courses.
20
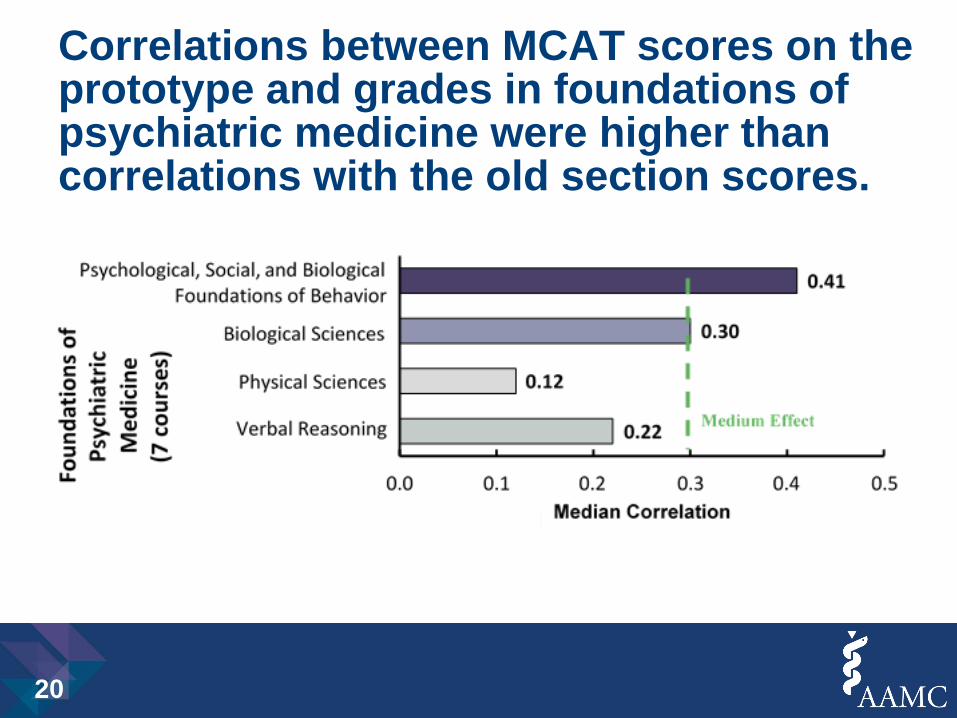
Correlations between MCAT scores on the prototype and grades in foundations of psychiatric medicine were higher than correlations with the old section scores.

21
What else will we learn about the impact, use, and validity of
the new exam?

22
The validity research is just beginning.
Admissions officers and researchers from 18 medical are starting a validity research program
• Determine how well scores from new exam predict performance in medical school
• Examine how students prepare for the exam
• Determine whether there are ways to improve information and resources available
• Study how scores are used with other information in admissions decision making
Fairness will play a key role. Results will be reported annually.


24
Applicants with old and new scores
• 34% who took the new exam also took the old
• Applicants who took both had higher percentiles on the new exam than the old.
• Why?
1) Repeaters start with lower scores.
2) Repeater percentile ranks on old and new tests were similar in size.
3) Examinees with higher percentile ranks ultimately apply to medical school.

25
Distributions of section scores on the new MCAT Exam