the massive expansion of western fast-food restaurants and
TRANSCRIPT
The Massive Expansion of Western Fast-food Restaurants
and Children’s Weight in China
Nancy Kong and Weina Zhou∗
February 27, 2018
Abstract
Does Western fast-food contribute to the emerging global epidemic of obesity? This
paper examines its impact in China where the number of KFCs exceeds the number in
the US. Utilizing community-year level data on the presence of McDonald’s, KFC, and
Pizza Hut outlets, and controlling for individual and year fixed effects, we find that the
presence of a fast-food restaurant increases children’s likelihood of being overweight/obese
by 6 percentage points. Different from developed countries, the effect in China, where
fast food is not yet considered to be an unhealthy diet, is stronger among middle-high
income families.
(JEL: I12, J13, L83)
Keywords: Child obesity; Fast food; China
∗Nancy Kong, The Centre for the Business and Economics of Health, The University of Queensland, 20 Corn-wall Street, Woolloongabba, Queensland, Australia ([email protected], +61-7-334-61955); Weina Zhou, Depart-ment of Economics, Dalhousie University, 6214 University Avenue, Halifax, NS, Canada ([email protected],+1-902-494-6999).
1
1 Introduction
It is widely reported that Western fast-food chains, McDonald’s, KFC, or Pizza Hut, for exam-
ple, are dramatically expanding their territory in developing countries such as Mexico, India,
Brazil, and Ghana. The speed of expansion is particularly unprecedented in China. In the
early 1990s, Western fast-food outlets were almost nonexistent in China; by 2013, the number
of KFC outlets in China exceeded the number of outlets in the US.
Many studies in the US suggest that the supply of fast-food chains has a direct impact on
individual’s weight, especially among children (Currie et al., 2010; Alviola et al., 2014; Powell,
2009). Outside of the US, it is unclear whether the expansion of Western fast food has had
any impact on countries like China, where the food culture is centuries old, with problems
of obesity having been of little or no concern until the last two decades. However, there is
reason for concern. Public awareness of the potential negative impact of fast food is very
limited in those countries. To date, there does not exist any regulations in China restricting
the location of fast food restaurants or stipulating that the fast-food industry make nutritional
values available to the public; nor do McDonald’s, KFC, or Pizza Hut list any calorie-related
information in their restaurants in China.1 Evidence reveals that the majority of Chinese young
people actually think Western fast food is healthy. In a survey which asks young people whether
they agreed that “KFC food is healthy for you,” using a 7-point scale (7=strongly agree), the
Chinese sample indicated a mean of 4.68 (SD=1.73) as opposed to a mean of 2.72 (SD=1.6) in
the US sample (Witkowski et al., 2003).
Marketing strategies target children and adolescents: in particular, portraying fast-food
culture as being “fun” and “trendy” (Guo, 2000). As a result, children flood into McDonald’s,
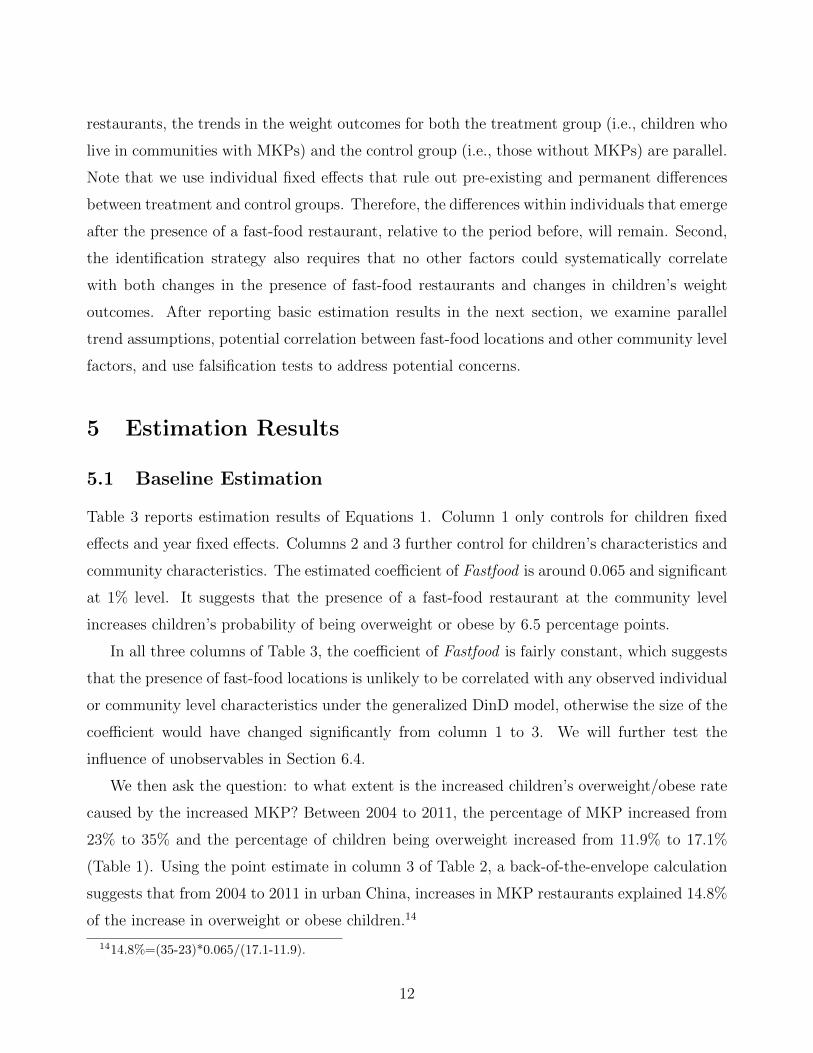
KFC, and Pizza Hut as their after-school clubs, leisure centers, or birthday party venues. Figure
1 reports the proportion of children who are overweight/obese along with the total number of
McDonald’s, KFC, or Pizza Hut outlets in China. Both children’s overweight/obese rate and
the number of fast-food restaurants increased dramatically in the 2000s.
This paper investigates the consequences of the massive expansion of Western fast-food
restaurants on children’s weight outcomes in urban China. We use an individual level panel
data, the China Health and Nutrition Survey (CHNS) that documents the presence of McDon-
ald’s, KFC, or Pizza Hut outlets in its community survey between 2004 and 2011. Note that
1McDonald’s only list nutrition value on its website.
2

McDonald’s, KFC, and Pizza Hut play dominant roles in the Western fast-food market, and
contribute the most influence in China, we will focus on the three giants in the rest of the
paper, and use MKP to denote McDonald’s, KFC, and Pizza Hut.2
We find a significant effect: the presence of fast-food restaurants at the community level
cause children to be 6 percentage points more likely to be overweight or obese. The effect
diminishes as the restaurant’s distance from the community increases. A simple calculation
suggests that from 2004 to 2011 in urban China, increases in fast-food restaurants explained 15%
of the increase in overweight or obese children. This paper is one of the first papers providing
causal evidence that the massive expansion of the Western fast-food industry contributes to
the overweight/obesity problem among children in emerging economies. As MKPs use similar
marketing strategies across developing countries (Witkowski, 2007), it is likely that we will
observe a similar pattern of results in other developing countries as well.
As opposed to North America where fast food mainly affects individuals with low income, we
show MKPs in China mainly affect children in the middle-high income families. Western fast-
food chains add attractive cultural value to their brands in non-Western nations, like China,
where fast food is not yet considered to be an unhealthy diet by the majority of the public.
As a result, MKPs charge relatively high prices, targeting mainly middle-high income families.
Due to the massive popularity and high profit margin, over half of KFC’s world-wild operating
profits came from China (KFC annual report, 2011). As middle-high income families are able
to choose alternative healthier food, the lack of public awareness regarding fast food’s negative
impact on health could be a key reason.
There are two main challenges in identifying the impact of the presence of fast-food restau-
rants on children’s weight outcomes in China. First, the expansion of fast-food restaurants in
an emerging economy, such as China’s, is often accompanied by economic growth and changes
in the social welfare structure, which could also affect children’s health outcomes. Second, the
location of a fast-food restaurant is not chosen at random, and it may be correlated with certain
community characteristics, such as a demand for fast food.
We use a generalized differences-in-differences (DinD) strategy (controlling for individual
and year fixed effects) to estimate the impact of the presence of fast-food restaurants. The strat-
egy disentangles the effect of the growing number of fast-food restaurants from the impact of
2Restaurants from other Western fast-food brands are limited in China. Subway has 411 stores; Burger Kinghad 86 stores in China by 2012; and to date, Wendy’s do not exist in China.
3
changes in other macro-level factors, such as social welfare structures, that affect both commu-
nities with fast-food restaurants introduced during the study period and communities without.
The strategy also allows us to control for any pre-existing and time-invariant characteristics
that may cause differences among communities or individuals.
The identification strategy relies on the assumption that no other time-variant factors could
systematically correlate with both changes in the presence of a fast-food restaurant and changes
in children’s weight outcomes. The main concern is that there could still exist time-variant
factors related to how a fast-food chain chooses communities to locate its outlets. We conduct
the following exercises to examine this assumption. We first examine if there are any pre-
existing trends in the community that are concurrent with (or even causing) the opening of a
fast-food restaurant. We find no such trends. Additionally, we find evidence that before the
opening of the fast-food restaurant, the demand for fast food is similar across both the treated
communities and the control communities.
Second, we use a falsification test to examine the effect of Chinese restaurants on children’s
weight outcomes, which tests whether the results are driven by other factors, such as the
demand for dining out. We further test if the presence of fast-food restaurants could have
an impact on outcomes which are potentially related to children’s health but should have no
linkage to fast-food restaurants: alcohol consumption, smoking, hours spent watching television
or surfing the Internet. We show that fast-food restaurants only affect children’s BMI, and no
other outcomes are affected by the presence of fast-food restaurants.
Third, MKPs mainly choose their locations based on geographic accessibility (Zhu, 2011).
The identification strategy relies on the assumption that the changes in geographic accessibility
over the study period are similar across both the treated and the control communities. We
specifically control for variables reflecting those strategies and add into the regression a rich set
of variables that potentially correlate with both the population density of the community and
children’s weight.
Fourth, we find that once the DinD strategy is used, the coefficient on our key variable of
interest (presence of a fast-food restaurant) remains mostly unchanged regardless of the number
of community level or individual level controls we add into the regression. The stability of
estimates also provides evidence that the presence of fast-food is unlikely to be correlated with
time-variant community or individual characteristics. Using a method developed by Altonji
4
et al. (2005) and Oster (2014), we find that the unobservables have to be 5 times as important
as the observables to make the effect of fast-food restaurants disappear, which is highly unlikely.
Our findings contribute to the growing debate about the impact of the supply of fast-food
on individual’s weight outcomes. Previous studies provide mixed evidence. Currie et al. (2010)
and Davis and Carpenter (2009) find that fast-food outlets near schools increase children’s
obesity rates in California. Using NLSY data, Powell (2009) suggests that the price of fast
food has a significant effect on students’ weight outcomes. Alviola et al. (2014) use school
proximity to highway ramps in Arkansas as an instrumental variable and find that the distance
to fast-food restaurants increases the school-level aggregate obesity rate. On the other hand,
using variation in the effective price of restaurants, Anderson and Matsa (2011) find no causal
link between restaurant consumption and obesity. Dunn (2010) finds that fast-food restaurants
in rural areas do not affect white population; Dunn et al. (2012) only find significant effect
on Hispanic and black population. Chen et al. (2013) find a small relationship between the
availability of fast-food restaurants and adults’ obesity rate in Indiana. Outside of the US,
Johar et al. (2017) finds that the location of fast-food outlets has no effect on Chinese adults.3
Two review papers, Cawley (2015) and Rosenheck (2008), conclude that the effects of fast food
restaurants on obesity are less clear.
Our paper is one of few study that able to provide evidence outside of US. To our best
knowledge, this paper is the first study to draw causal effect of Western fast-food restaurants
and child obesity in emerging economies and developing countries. Furthermore, different to
most of the existing studies that only use cross sectional data, this paper uses longitudinal data
to control for individual fixed effects (and therefore geographical fixed effects)— factors that
are likely to cause major differences in both health outcomes at individual level and presence of
fast food at geographical level. The other study that was able to do so is Powell (2009) which
uses US county level variation in fast-food. Compared to Powell (2009), we draw variation from
a much smaller geographical division: the median size of communities is only 2 km2. Therefore,
it allows us to obtain more precise estimates.
This paper also provides important policy implications for children’s weight issues in de-
veloping countries. The sudden increase in overweight/obesity rates among urban children in
recent decades has become such an alarming fact as to draw the attention of many researchers
3We also found no effects on adults. The results are not reported in the paper, but they are available uponrequest.
5

(Morgan, 2014; Nie et al., 2015; Fu and Land, 2015; Qin and Pan, 2016; Gao and Shen, 2017).
To date, 40 million children in China are categorized as overweight or obese (Report on Child-
hood Obesity in China, 2017). The direct costs of this obesity are estimated to reach 49 billion
RMB (7.6 billion USD) by 2030 (Report on Childhood Obesity in China, 2017). This paper
provides supporting evidence that the massive expansion of Western fast food directly causes
a substantial portion of the global overweight/obesity epidemic.
The rest of the paper is organized as follows. Section 2 discusses the expansion of fast-
food restaurants in China. Section 3 describes the data used in the paper. The identification
strategy is demonstrated in Section 4, followed by the estimation results in Section 5. Section
6 examines the robustness of the results. We present heterogeneous effects in Section 7 and
conclude in Section 8.
2 Background
2.1 Massive Expansion of Fast-food Industry in China
The first KFC outlet in China was opened in Beijing in 1987. McDonald’s and Pizza Hut
followed right after, opening their first outlets in the 1990s. The initial development of Western
fast-food restaurants was relatively slow, centered mainly in a few metropolitan cities in China.
But in the 2000s, MKPs expanded at an exponential rate in the Chinese market (Figure 1).
During our study period (2004-2011), the leading fast-food chain KFC opened, on average, 356
new outlets every year, expanding from 184 cities to over 700 cities in China (KFC annual
report, 2011; Shen and Xiao, 2014). McDonald’s and Pizza Hut also increased their outlets
from 700 to 1464 and from 171 to 626, respectively. According to data collected in Beijing
and Linyi, 15% of children in urban areas consumed Western fast food at least once a week in
2011.4
4Data were collected by Song et al. (2015) from the cities of Beijing and Linyi. In their sample, 80% ofchildren are urban residents, with the remainder being rural residents; children are defined as preschool andelementary school students.
6
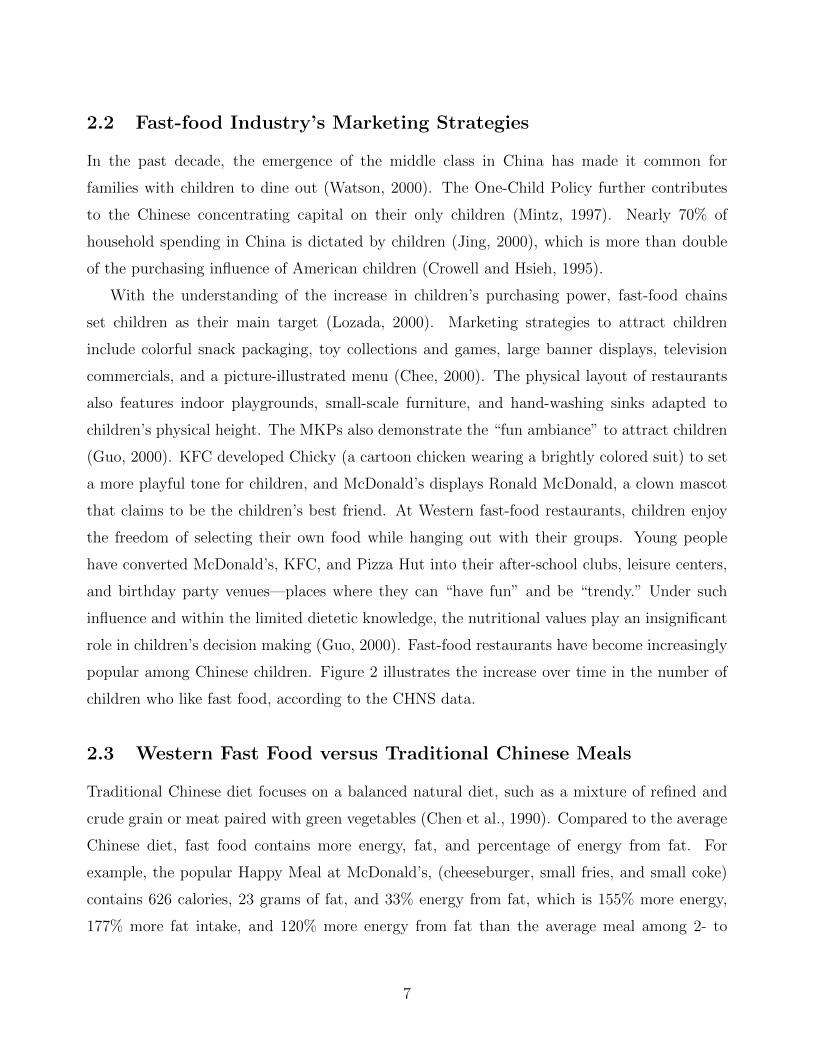
2.2 Fast-food Industry’s Marketing Strategies
In the past decade, the emergence of the middle class in China has made it common for
families with children to dine out (Watson, 2000). The One-Child Policy further contributes
to the Chinese concentrating capital on their only children (Mintz, 1997). Nearly 70% of
household spending in China is dictated by children (Jing, 2000), which is more than double
of the purchasing influence of American children (Crowell and Hsieh, 1995).
With the understanding of the increase in children’s purchasing power, fast-food chains
set children as their main target (Lozada, 2000). Marketing strategies to attract children
include colorful snack packaging, toy collections and games, large banner displays, television
commercials, and a picture-illustrated menu (Chee, 2000). The physical layout of restaurants
also features indoor playgrounds, small-scale furniture, and hand-washing sinks adapted to
children’s physical height. The MKPs also demonstrate the “fun ambiance” to attract children
(Guo, 2000). KFC developed Chicky (a cartoon chicken wearing a brightly colored suit) to set
a more playful tone for children, and McDonald’s displays Ronald McDonald, a clown mascot
that claims to be the children’s best friend. At Western fast-food restaurants, children enjoy
the freedom of selecting their own food while hanging out with their groups. Young people
have converted McDonald’s, KFC, and Pizza Hut into their after-school clubs, leisure centers,
and birthday party venues—places where they can “have fun” and be “trendy.” Under such
influence and within the limited dietetic knowledge, the nutritional values play an insignificant
role in children’s decision making (Guo, 2000). Fast-food restaurants have become increasingly
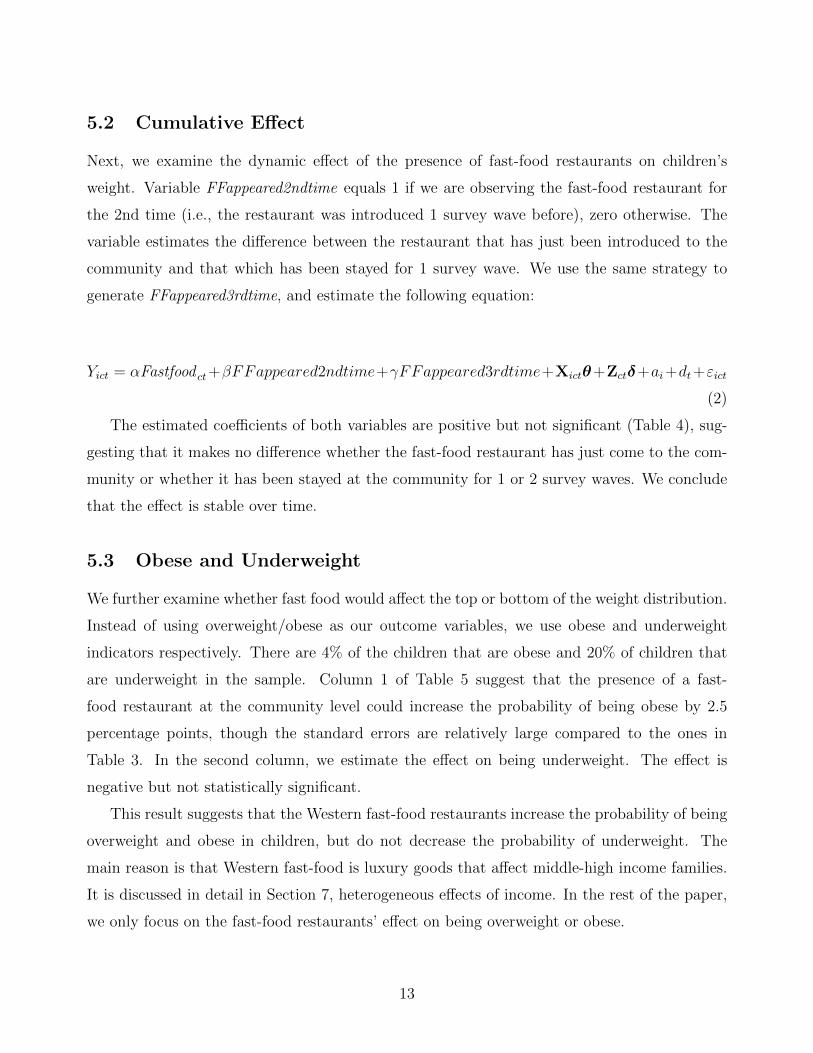
popular among Chinese children. Figure 2 illustrates the increase over time in the number of
children who like fast food, according to the CHNS data.
2.3 Western Fast Food versus Traditional Chinese Meals
Traditional Chinese diet focuses on a balanced natural diet, such as a mixture of refined and
crude grain or meat paired with green vegetables (Chen et al., 1990). Compared to the average
Chinese diet, fast food contains more energy, fat, and percentage of energy from fat. For
example, the popular Happy Meal at McDonald’s, (cheeseburger, small fries, and small coke)
contains 626 calories, 23 grams of fat, and 33% energy from fat, which is 155% more energy,
177% more fat intake, and 120% more energy from fat than the average meal among 2- to
7
6-year-old children in China.5 For school-aged children, the difference between fast food and
the average Chinese diet is even larger. A typical fast-food meal (using one of the most popular
McDonald’s meals in China, crispy chicken leg burger, medium fries, and medium coke) contains
949 calories, 41 g fat, and 39% energy from fat. Compared to the average meal of Chinese 6-
to 18-year-old children, fast food has 166% more energy intake, 241% more fat, and 150%
more energy from fat. Thus, Western fast food provides more “fattening” composition than
traditional Chinese meals.6
2.4 Policy and Regulations on Fast-food Restaurants
Internationally, policy makers regulate fast-food restaurants to combat obesity through two
channels. First approach is to alter consumers’ behaviour, which include nutritional labelling,
restraining junk-food advertising, dietary knowledge campaign, and taxing unhealthy food.7
Second approach is to restrict the availability of fast-food restaurants. The policies US, for ex-
ample, include banning fast-food outlets or drive-through services, restricting fast-food restau-
rants locations around school or residential areas, limiting the number of fast-food outlets or
densities, and setting up the minimum distance from other uses (Mair et al., 2005).
Unlike the developed countries, government policy on fast-food restaurants in China are at
an infant stage. To date, none of the regulations discussed above, such as nutritional labelling,
or location limitations, have been found in China.8 The concern for obesity is rarely discussed
in legislation.
3 Data and Descriptive Statistics
3.1 Data
The data used in this paper is the China Health and Nutrition Survey (CHNS). It is a large
scale longitudinal data set collected by the University of North Carolina and the Chinese Center
5Authors’ calculations using CHNS sample during the study period (2004-2011)6Authors’ calculations using CHNS sample during the study period (2004-2011).7For example, the U.S., Canada, Australia have mandatory calorie posting in the fast-food restaurants, and
such policy reduces consumers’ calorie intakes (Downs et al., 2009; Bollinger et al., 2011).8There are policies to ensure food hygiene by regulating food handling and storage, sanitary cooking envi-
ronment, ingredients free from diseases etc. However, such regulations apply to the entire food industry andare not specific to the fast-food industry.
8
for Disease Control and Prevention. The CHNS has 9 waves in total, from 1989 to 2011. This
paper uses the data in the 2004, 2006, 2009, and 2011 waves because consistent fast-food-
restaurant data for the three brands of McDonald’s, KFC, and Pizza Hut are available only
in those years. Nine provinces are covered in each wave between 2004 and 2011: Liaoning,
Heilongjiang, Jiangsu, Shandong, Henan, Hubei, Hunan, Guanxi, and Guizhou.9 The CHNS
adopts a multistage, random cluster process to draw the samples surveyed in each of the
provinces.
The novelty of the CHNS data for this study is the availability of not only the individual and
household level data but also the community level data. The community survey is answered
by administrative officers at the community head offices, who report the presence of and the
distance from nearby fast-food restaurants. The median size of communities in urban areas
in the survey is 2 km2 in a rectangular or square shape, with 3700 residents. Communities in
urban areas are usually divided by main roads, with the closest main roads usually forming the
community’s boundaries.
Our sample includes children 2 to 18 years old. We dropped all the observations in rural
areas because fast-food restaurants in rural areas are rare in China.10 In the CHNS, only 1.7%
of the rural communities reported having a fast-food restaurant close to their community. There
are 96 communities and 497 children in the sample. We have 37 children observed 4 times,
110 children observed 3 times, and 350 children observed twice. The large sample attrition is
mainly due to the fact that children’s weight is being measured on site during the interview (it
requires the presence of children). The other reason is that children naturally grow out of the
sample when reaching 18-years-old. In Appendix A, we report sample attrition in the CHNS
data and use inverse probability weighting to address potential concerns related to attrition.
3.2 Children’s Weight Outcomes
We use the International Obesity Task Force (IOTF) BMI cut-offs for underweight, overweight,
and obese children. The IOTF measure uses samples constructed from 6 countries: the US,
9In addition to those 9 provinces, CHNS added another three provinces, Beijing, Shanghai, and Chongqing,in 2011. Those three provinces are not used in the paper because they are not able to form longitudinal data.
10The community survey in the CHNS reports communities’ administrative urban-rural division: urban,suburban (jiao qu), county town (xian cheng), or rural. The rural areas in this paper are defined as thecommunity is reported as rural in the administrative urban-rural division. Urban, suburban, county town aredefined as urban in the paper.
9
the UK, the Netherlands, Brazil, Singapore, and Hong Kong (China). The IOTF developed
smoothed age-sex-specific BMI curves for children by linking the well-established BMI cut-off
values for adults to child centiles.11 The cut-off values of underweight (thinness degree I),
overweight, and obese at 18 years are 18.5, 25, and 30 (kg/m2 ), respectively. Compared
to children’s weight measures developed by the WHO, the IOTF measure is said to be more
suitable to analyzing children’s weight issues in China because the IOTF sample includes two
regions in Asia that resemble population in mainland China, while the WHO includes only
India.12
Table 1 reports the percentage of children that are overweight or obese in the CHNS urban
sample. The percentage increased from 11.9% in 2004 to 17.1% in 2011. On average, there are
14.5% of children that are overweight or obese between 2004 to 2011.
3.3 Presence of a Fast-food Restaurant
From the 2004 wave, the community survey of the CHNS provides consistent measures of the
availability of Western fast-food restaurants: McDonald’s, KFC, and Pizza Hut. The survey
asks community officers: “Are there any fast-food restaurants such as McDonald’s or KFC
near your community?” If the answer to the above question is yes, the survey then further
asks the availability of each of McDonald’s, KFC, or Pizza Hut. The survey also asks whether
the nearest fast-food restaurant (McDonald’s, KFC, or Pizza Hut) is located inside or outside
the community boundary, and if located outside, its distance from this community. We define
presence of a fast-food restaurant at community level as a community having McDonald’s,
KFC or Pizza Hut inside or near the community. Note that a restaurant located farther than
3 km away is considered not near the community.13 In the CHNS urban sample, the mean
of the percentage of communities reported having a McDonald’s, KFC or Pizza Hut inside
or near the community is 25.6, with standard deviation of 43.7. Panel B of Table 1 further
presents year-by-year averages in the sample. The number of communities that have access
to fast-food restaurants increases by more than 65% between 2004 and 2011, from 23.2% in
2004 to 35.4% in 2011. We further calculate the distance from the community to the nearest
11The IOTF cut-offs can be downloaded at https://www.worldobesity.org/data/.12The WHO’s samples are constructed from six countries: USA, Oman, Norway, Brazil, Ghana, and India.13Section 5.4 shows that the effect of fast-food restaurant disappear if the nearest fast-food restaurant is
located more than 2.53 km away. Therefore, we conclude that treating communities with the nearest fast-foodoutlets located more than 3 km away as not having a fast-food restaurant nearby is plausible.
10
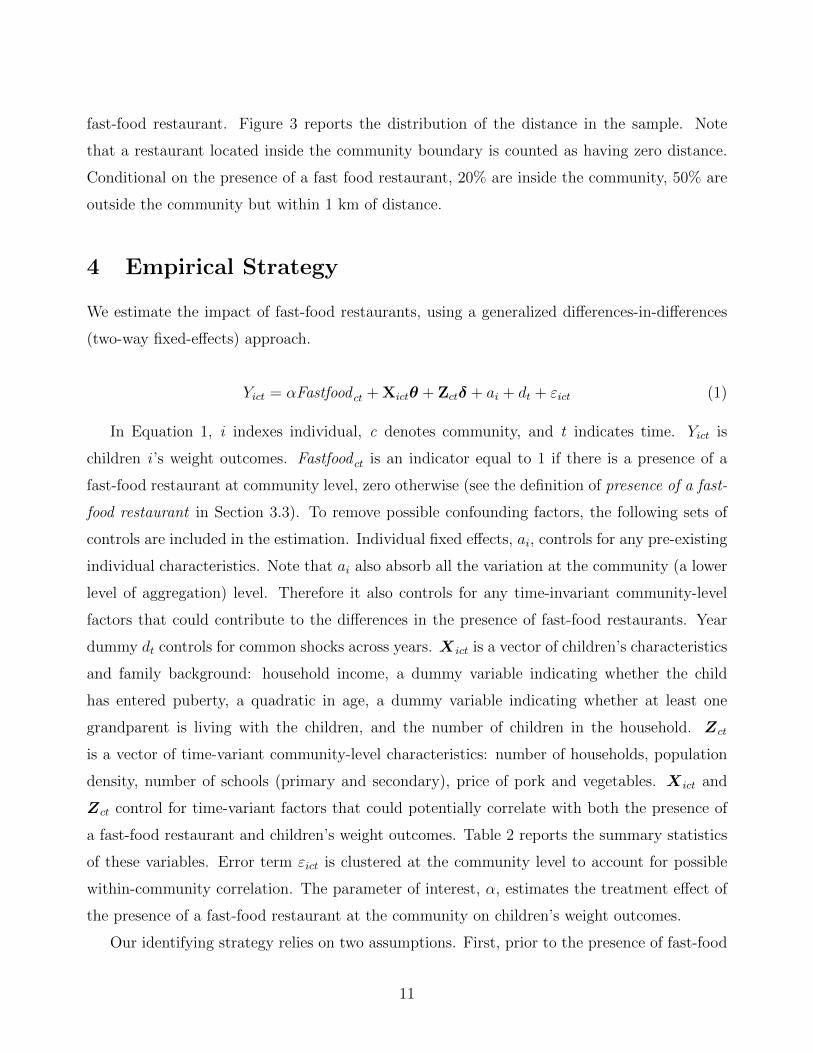
fast-food restaurant. Figure 3 reports the distribution of the distance in the sample. Note
that a restaurant located inside the community boundary is counted as having zero distance.
Conditional on the presence of a fast food restaurant, 20% are inside the community, 50% are
outside the community but within 1 km of distance.
4 Empirical Strategy
We estimate the impact of fast-food restaurants, using a generalized differences-in-differences
(two-way fixed-effects) approach.
Yict = αFastfood ct + Xictθ + Zctδ + ai + dt + εict (1)
In Equation 1, i indexes individual, c denotes community, and t indicates time. Yict is
children i ’s weight outcomes. Fastfood ct is an indicator equal to 1 if there is a presence of a
fast-food restaurant at community level, zero otherwise (see the definition of presence of a fast-
food restaurant in Section 3.3). To remove possible confounding factors, the following sets of
controls are included in the estimation. Individual fixed effects, ai, controls for any pre-existing
individual characteristics. Note that ai also absorb all the variation at the community (a lower
level of aggregation) level. Therefore it also controls for any time-invariant community-level
factors that could contribute to the differences in the presence of fast-food restaurants. Year
dummy dt controls for common shocks across years. X ict is a vector of children’s characteristics
and family background: household income, a dummy variable indicating whether the child
has entered puberty, a quadratic in age, a dummy variable indicating whether at least one
grandparent is living with the children, and the number of children in the household. Zct
is a vector of time-variant community-level characteristics: number of households, population
density, number of schools (primary and secondary), price of pork and vegetables. X ict and
Zct control for time-variant factors that could potentially correlate with both the presence of
a fast-food restaurant and children’s weight outcomes. Table 2 reports the summary statistics
of these variables. Error term εict is clustered at the community level to account for possible
within-community correlation. The parameter of interest, α, estimates the treatment effect of
the presence of a fast-food restaurant at the community on children’s weight outcomes.
Our identifying strategy relies on two assumptions. First, prior to the presence of fast-food
11
restaurants, the trends in the weight outcomes for both the treatment group (i.e., children who
live in communities with MKPs) and the control group (i.e., those without MKPs) are parallel.
Note that we use individual fixed effects that rule out pre-existing and permanent differences
between treatment and control groups. Therefore, the differences within individuals that emerge
after the presence of a fast-food restaurant, relative to the period before, will remain. Second,
the identification strategy also requires that no other factors could systematically correlate
with both changes in the presence of fast-food restaurants and changes in children’s weight
outcomes. After reporting basic estimation results in the next section, we examine parallel
trend assumptions, potential correlation between fast-food locations and other community level
factors, and use falsification tests to address potential concerns.
5 Estimation Results
5.1 Baseline Estimation
Table 3 reports estimation results of Equations 1. Column 1 only controls for children fixed
effects and year fixed effects. Columns 2 and 3 further control for children’s characteristics and
community characteristics. The estimated coefficient of Fastfood is around 0.065 and significant
at 1% level. It suggests that the presence of a fast-food restaurant at the community level
increases children’s probability of being overweight or obese by 6.5 percentage points.
In all three columns of Table 3, the coefficient of Fastfood is fairly constant, which suggests
that the presence of fast-food locations is unlikely to be correlated with any observed individual
or community level characteristics under the generalized DinD model, otherwise the size of the
coefficient would have changed significantly from column 1 to 3. We will further test the
influence of unobservables in Section 6.4.
We then ask the question: to what extent is the increased children’s overweight/obese rate
caused by the increased MKP? Between 2004 to 2011, the percentage of MKP increased from
23% to 35% and the percentage of children being overweight increased from 11.9% to 17.1%
(Table 1). Using the point estimate in column 3 of Table 2, a back-of-the-envelope calculation
suggests that from 2004 to 2011 in urban China, increases in MKP restaurants explained 14.8%
of the increase in overweight or obese children.14
1414.8%=(35-23)*0.065/(17.1-11.9).
12
5.2 Cumulative Effect
Next, we examine the dynamic effect of the presence of fast-food restaurants on children’s
weight. Variable FFappeared2ndtime equals 1 if we are observing the fast-food restaurant for
the 2nd time (i.e., the restaurant was introduced 1 survey wave before), zero otherwise. The
variable estimates the difference between the restaurant that has just been introduced to the
community and that which has been stayed for 1 survey wave. We use the same strategy to
generate FFappeared3rdtime, and estimate the following equation:
Yict = αFastfood ct+βFFappeared2ndtime+γFFappeared3rdtime+Xictθ+Zctδ+ai+dt+εict
(2)
The estimated coefficients of both variables are positive but not significant (Table 4), sug-
gesting that it makes no difference whether the fast-food restaurant has just come to the com-
munity or whether it has been stayed at the community for 1 or 2 survey waves. We conclude
that the effect is stable over time.
5.3 Obese and Underweight
We further examine whether fast food would affect the top or bottom of the weight distribution.
Instead of using overweight/obese as our outcome variables, we use obese and underweight
indicators respectively. There are 4% of the children that are obese and 20% of children that
are underweight in the sample. Column 1 of Table 5 suggest that the presence of a fast-
food restaurant at the community level could increase the probability of being obese by 2.5
percentage points, though the standard errors are relatively large compared to the ones in
Table 3. In the second column, we estimate the effect on being underweight. The effect is
negative but not statistically significant.
This result suggests that the Western fast-food restaurants increase the probability of being
overweight and obese in children, but do not decrease the probability of underweight. The
main reason is that Western fast-food is luxury goods that affect middle-high income families.
It is discussed in detail in Section 7, heterogeneous effects of income. In the rest of the paper,
we only focus on the fast-food restaurants’ effect on being overweight or obese.
13
5.4 Distance Effect
To take into account the distance from the community to the nearest fast-food restaurant, we
further add Fastfood−dist ct into Equation 1.
Yict = αFastfood ct + βFastfood−dist ct + Xictθ + Zctδ + ai + dt + εict (3)
Fastfood−dist ct is the distance from the community to the closest fast-food restaurant if
the fast-food restaurant is in a nearby community. Note that if there is a fast-food restaurant
inside the community, this value is assigned zero. The same as in Equation 1, the base group
is the communities that never had fast-food restaurants (Fastfood ct = 0 and Fastfood−dist ct =
0). If the closest fast-food restaurant is located inside the community (Fastfood ct = 1 and
Fastfood−dist ct = 0), the effect is α. The effect of the presence of a fast-food restaurant outside
the community is α + βFastfood−dist ct.
Table 6 reports the estimation results of Equation 3. The coefficient of Fastfood becomes
0.109; the coefficient of Fastfood−dist , which has an opposite sign to the coefficient of Fastfood ,
is -0.043. Both coefficients are statistically significant at least at 5% level. It suggests that the
effect of a fast-food restaurant outside the community diminishes as the distance of its location
from the community increases; and the effect disappears when the location is more than 2.53
km away (divide 10.9 by 4.3).
6 Robustness Checks
6.1 Pre-existing Trends
The main concern in the identification strategy is that in any given community there may
exist underlying trends that are concurrent with (or even causing) the appearance of fast-food
restaurants. We examine the parallel pre-treatment trend assumption following Jacobson et al.
(1993). Unlike the standard DinD model where the timing of starting the treatment is the same
across the treated units, the timing of having treatment in this paper (i.e. the introduction of
a fast-food location into the community) is different across communities.
14
Yict =k=3∑k=1
δk ·Dkct + αFastfood ct + Xictθ + Zctδ + ai + dt + εict (4)
We add∑k=3
k=1 δk ·Dkct into Equation 1. Dk
ct = 1 if k survey wave(s) after year t a fast-food
location is observed inside/near community i for the first time, and zero otherwise.15 The
base group in Equation 4 is the control group (communities where fast-food outlets were not
introduced during the survey years). The parameter of interest, δk, tests whether the treatment
affects outcome k waves before the fast-food locations were introduced. δk = 0 for k = 1, 2, 3,
would suggest that the leads of the treatment have no impact on the outcome; in other words,
there are no pre-existing trends in the treated group.
Column 1 of Table 7 reports the estimation results. δk are not statistically different from
zero for all k. Thus, we conclude that the pre-treatment trend in both treated and control
communities are similar.
One may still have a concern that fast-food restaurants choose their locations with increas-
ing demand for fast food. To address this concern, we further test for whether the trend of
demand for fast food in the treated group is different from that in the control group. We use
LikeFast Food as the outcome variable in Equation 3. LikeFast Food equals 1 if a respon-
dent likes or somewhat likes fast food, and zero if a respondent is indifferent to, dislikes, much
dislikes, or doesn’t eat fast food. The estimation results reported in column 2 of Table 7 suggest
that prior to the introduction of fast-food restaurants in the treated group, the preference for
fast food between the treated and the control group is similar. We thus conclude that commu-
nities with no fast-food locations can serve as a suitable control group for communities with
fast-food presence.
6.2 Falsification Test
The underlying hypothesis in this paper is that Western fast food contains more calories than
traditional Chinese food does; therefore, exposure to fast food could increase the risk of one
becoming overweight or obese. One confounding factor is the demand for dining out. MKPs
may choose their locations in communities with higher demand for dining out. If there is
15Note that Dkct = 0 if the fast-food location was introduced into the community j wave(s) after year t where
j 6= k.
15
high demand for dining out, the population may have a tendency for obesity regardless of the
Western fast-food location.
To rule out such concern, we test the effects of number of Chinese restaurants in replace-
ment of presence of MKP in Equation (1). The number of Chinese restaurants should not
affect children’s weight outcomes. If Chinese restaurants were to also affect children’s weight
outcomes, it would suggest that demand for dining out could confound the results. In the
sample, 88% of the children live in communities that have at least one Chinese restaurant; the
median number of Chinese restaurants is 13. Column 1 of Table 8 reports the results. The
coefficient of Chinese restaurants is not statistically significant from zero. We therefore rule
out the demand for dining out confounding the results.
We further test whether the presence of fast-food restaurants could have an impact on other
outcomes which could potentially relate to children’s health but should have no linkage to fast-
food restaurants: alcohol consumption, smoking, hours spent watching television or surfing the
Internet. Our hypothesis is based on the assumption that the presence of fast-food restaurants
affects children’s weight only through the channel of consumption of fast food. Therefore, fast-
food restaurants should have no impact on smoking or hours watching television; otherwise,
it may suggest there are other factors confounding the results. The estimates reported in the
column 2 to 5 of Table 8 are all insignificant. We therefore rule out such concerns.
6.3 Control for Other Factors that Could Potentially Correlate with
the Location of Fast Foods
Both McDonald’s and the Yum! brand company (KFC and Pizza Hut) use similar strategies
to choose locations as they target the same customers (Zhu, 2011). MKPs mainly choose their
location based on geographic accessibility—in other words, on the number of people who would
potentially pass by (Zhu, 2011).16 A typical way for MKPs to choose their locations is to use
a point system. For example, a potential location has a higher score if it is closer to a public
transit hub, in a larger business center, or at a busier supermarket/shopping mall. Based on the
location strategies used by MKPs, we add the presence of a bus stop, supermarket/shopping
mall at the community level into the regression. We also add the following variables that
16Unlike in the U.S., MKP do not cluster by the highways in China. Highways in China are highly controlledby the governments and allotted only to state-owned restaurants.
16
potentially correlate with both the crowdedness of the community and children’s weight: avail-
ability of gyms, parks, or playgrounds at the community level, and an individual level variable:
the number of hours doing exercise outside of school. Note that population density is already
controlled in the baseline estimation. The point estimates in Table 9 are essentially unchanged
and are all statistically significant. Thus, we rule out the concern that characteristics of the
location other than the presence of MKPs have effects on child weight.
6.4 Access Bias from Unobservables
Despite our identification strategy and the above robustness checks, one may remain concerned
that some unobservable factors may systematically correlate with both changes in the presence
of fast-food restaurants and changes in children’s weight outcomes. For this reason, we examine
the extent to which unobservables could bias our results by using a method introduced by Al-
tonji et al. (2005) and further developed by Oster (2014). Both papers suggest that observables
in a model provide a guide to the amount of selection on the unobservables. Altonji et al.
(2005) essentially provide a measure to access how much stronger selection on unobservables,
compared to existing controls, must be to explain away the full estimated effect. The insight
of their method is that the movements of point estimates with the inclusion of controls speaks
to selection on observables; under the assumption that the relationship between the observ-
ables and the treatment is informative of the relationship between the unobservables and the
treatment, the movements in point estimates also carries information of the effect comes from
unobservables. In our estimation, the coefficient of fastfood barely changed regardless of the
amount of controls we added in the regression (Table 3). This provides a first evidence that
unobservables are unlikely to largely bias the results. Oster (2014) further suggests that the
movements in R-squared are equally important. Oster’s methods rely on the value of R max ,
where R max = p R . Following her suggestion, we set p =1.3.17 Using their method, we find
that the unobservables have to be 5.5 times as important as the observables to make a equal
to zero, which is highly unlikely given the number of observables we control.
17Oster (2014) analyzes all randomization design papers published in AER, QJE, JPE, Econometrica, andAEJ and applied during the period 2008-2013. Oster finds that setting π=1.3 allows 90% of those randomizedresults to persist. Our results remain econometrically significant to a wide range of π.
17
7 Effect of Fast Food among Middle-High Income Fam-
ilies
In North America, fast food is considered unhealthy and the price of fast food is low. By
contrast, with the high demand of Western fast food and the lack of nutrition knowledge,
the price of fast food is quite high in China. The median annual income in urban China
is equivalent to the price of 1,344 Big Macs, while the median annual income in the US is
equivalent to as many as 7,535 Big Macs.18 It is likely that only middle- and high-income
families can afford to purchase fast food frequently. Therefore, family income can be used
as an additional measure of accessibility to fast food. We divide children into two groups.
A child belongs to the middle-high income group if the average family income is equal to or
higher than 30,000RMB;19otherwise, the child belongs to the middle-low income group. The
estimation results for each group are reported in Table 10. The estimated effect of fast-food in
the middle-high income group becomes larger than the baseline estimation: 0.079 compared to
0.064. The estimates in middle-low income group are all insignificant. We conclude that the
fast-food location only affects middle-high income individuals and has no significant effect on
middle-low income individuals.
This finding highlights the difference between the health effects of fast-food restaurants in
developed countries and developing countries. In developed countries, MKPs are viewed as
cheap eats that affect the health of low-income people, who are constrained by their disposable
income. The negative health effect is harder to mitigate. In developing countries, like China,
MKPs are considered trendy; they signal high socioeconomic status of the consumers. Thus,
the health effects are mainly found on the wealthy group, and the choice is voluntary. The
negative effects on health is easier to alleviate if policy makers advocate nutritional awareness.
18Authors’ calculations based on price in 2009. The average price of a Big Mac is 12.5RMB in China,3.57USD in the US. The median annual per capita income is 16,800RMB in urban China and 26,900USD inthe US. Chinese data source: National Bureau of Statistics of China. US data source: United States CensusBureau.
19Note that family incomes in each survey year are adjusted to 2006 equivalent value.
18
8 Conclusion
This paper finds a sizable effect of Western fast-food restaurants in China. Utilizing community-
year level data on the presence of McDonald’s, KFC, and Pizza Hut, and controlling for indi-
vidual fixed effects and year fixed effects, we find that the presence of a fast-food restaurant at
the community level increases children’s likelihood of being overweight or obese by 6 percentage
points. As fast-food restaurants have been expanding more rapidly since the study period of
this paper (2004-2011), we are expecting fast food to be affecting more children in China. The
effect is also likely to exist in other emerging economies as well, such as India, Brazil, or Mexico.
This paper also provides alarming evidence of a lack of public awareness towards fast food in
emerging economics. The absence of regulations on fast food industry in those counties, such as
mandatory calorie posting and fast-food restaurant location restrictions, could potentially be an
important reason. Introducing nutritional knowledge at schools, limiting fast-food advertising
to children could also be alternative policies to better children’s health.
19
References
Altonji, J. G., T. E. Elder, and C. R. Taber (2005). Selection on observed and unobserved
variables: Assessing the effectiveness of Catholic schools. Journal of political economy 113 (1),
151–184.
Alviola, P. A., R. M. Nayga, M. R. Thomsen, D. Danforth, and J. Smartt (2014). The effect
of fast-food restaurants on childhood obesity: a school level analysis. Economics & Human
Biology 12, 110–119.
Anderson, M. L. and D. A. Matsa (2011). Are restaurants really supersizing america? American
Economic Journal: Applied Economics 3 (1), 152–188.
Bollinger, B., P. Leslie, and A. Sorensen (2011). Calorie posting in chain restaurants. American
Economic Journal: Economic Policy 3 (1), 91–128.
Cawley, J. (2015). An economy of scales: A selective review of obesity’s economic causes,
consequences, and solutions. Journal of health economics 43, 244–268.
Chee, B. W. (2000). Eating snacks and biting pressure: only children in Beijing. Feeding
China’s little emperors: food, children, and social change, 48–70.
Chen, J., T. C. Campbell, J. Li, R. Peto, J. Boreham, Z. Feng, and L. Youngman (1990). Diet
life-style and mortality in China: a study of the characteristics of 65 Chinese counties.
Chen, S. E., R. J. Florax, and S. D. Snyder (2013). Obesity and fast food in urban markets: a
new approach using geo-referenced micro data. Health Economics 22 (7), 835–856.
Crowell, T. and D. Hsieh (1995). Little emperors: is China’s One-Child Policy creating a
society of brats. Asiaweek 21 (48), 44–50.
Currie, J., S. DellaVigna, E. Moretti, and V. Pathania (2010). The effect of fast food restaurants
on obesity and weight gain. American Economic Journal: Economic Policy 2 (3), 32–63.
Davis, B. and C. Carpenter (2009). Proximity of fast-food restaurants to schools and adolescent
obesity. American Journal of Public Health 99 (3), 505–510. PMID: 19106421.
20
Downs, J. S., G. Loewenstein, and J. Wisdom (2009). Strategies for promoting healthier food
choices. American Economic Review 99 (2), 159–64.
Dunn, R. A. (2010). The effect of fast-food availability on obesity: An analysis by gender, race,
and residential location. American Journal of Agricultural Economics 92 (4), 1149–1164.
Dunn, R. A., J. R. Sharkey, and S. Horel (2012). The effect of fast-food availability on fast-food
consumption and obesity among rural residents: an analysis by race/ethnicity. Economics &
Human Biology 10 (1), 1–13.
Fu, Q. and K. C. Land (2015). The increasing prevalence of overweight and obesity of children
and youth in China, 1989–2009: An age–period–cohort analysis. Population Research and
Policy Review 34 (6), 901–921.
Gao, P. and J. Shen (2017). An empirical analysis on the determinants of overweight and
obesity in China. Applied Economics 49 (20), 1923–1936.
Guo, Y. (2000). Family relations: The generation gap at the table. Feeding China’s little
emperors: Food, children and social change, 94–113.
Jacobson, L. S., R. J. LaLonde, and D. G. Sullivan (1993). Earnings losses of displaced workers.
The American Economic Review , 685–709.
Jing, J. (2000). Feeding China’s little emperors: Food, children, and social change. Stanford
University Press.
Johar, M., S. Maruyama, and J. Truong (2017). The contribution of western fast food to
fast-growing body mass in China. Applied Economics 49 (8), 797–811.
Lozada, E. P. (2000). Globalized childhood? Kentucky fried chicken in Beijing. Standford, CA:
Standford University Press.
Mair, J. S., M. W. Pierce, and S. P. Teret (2005). The use of zoning to restrict fast food outlets:
A potential strategy to combat obesity.
Mintz, S. (1997). Golden Arches East: McDonald’s in East Asia, Chapter Afterword: Swal-
lowing Modernity. Stanford: Stanford University Press.
21
Morgan, S. L. (2014). Growing fat on reform: obesity and nutritional disparities among China’s
children, 1979–2005. The China Quarterly 220, 1033–1068.
Nie, P., A. Sousa-Poza, and X. He (2015). Peer effects on childhood and adolescent obesity in
China. China Economic Review 35, 47–69.
Oster, E. (2014). Unobservable selection and coefficient stability: Theory and evidence. Journal
of Business & Economic Statistics .
Powell, L. M. (2009). Fast food costs and adolescent body mass index: evidence from panel
data. Journal of Health Economics 28 (5), 963–970.
Qin, X. and J. Pan (2016). The medical cost attributable to obesity and overweight in China:
estimation based on longitudinal surveys. Health Economics 25 (10), 1291–1311.
Rosenheck, R. (2008). Fast food consumption and increased caloric intake: a systematic review
of a trajectory towards weight gain and obesity risk. Obesity Reviews 9 (6), 535–547.
Shen, Q. and P. Xiao (2014). Mcdonald’s and KFC in China: Competitors or companions?
Marketing Science 33 (2), 287–307.
Song, C., K. Goto, M. Hu, and C. Wolff (2015). The impact of social and cultural factors
on the consumption of western fast food among chinese children. Community Development
Journal 50 (4), 709–723.
Watson, J. L. (2000). Food as a lens: the past, present, and future of family life in China.
Feeding China’s little emperors: Food, children, and social change, 199–212.
Witkowski, T. H. (2007). Food marketing and obesity in developing countries: analysis, ethics,
and public policy. Journal of Macromarketing 27 (2), 126–137.
Witkowski, T. H., Y. Ma, and D. Zheng (2003). Cross-cultural influences on brand identity
impressions: KFC in China and the United States. Asia Pacific Journal of Marketing and
Logistics 15 (1/2), 74–88.
Zhu, Y. (2011). KFC zai zhong guo fa zhan de zhan lue yan jiu [Market strategy of KFC
development in China]. Zhong Guo Zheng Quan Qi Huo [Securities & Futures of China] (3),
77–78.
22
Figure 1. Total Number of Fast-food Outlets by Brand and Percentage of Children Who are
Overweight or Obese
Note: KFC and McDonald’s data before 2004 were collected by Shen and Xiao (2013); data after 2007 were
collected from Yum! Brand annual reports and McDonald’s annual reports. Pizza Hut data were all collected
from Yum! Brand annual reports. Overweight or obesity rate is calculated using children aged 2 to 18 in the
CHNS urban sample (1991 to 2011). The International Obesity Task Force (IOTF) BMI cut-offs for children are
used to define overweight and obese. CHNS sample size: 13,657.

Figure 2. Self-reported Preference for Western Fast Food among Children
Note: The graph reports the percentage of children who answered “Like” or “Somewhat Like” to the CHNS survey question “How much do you like fast food (KFC, Pizzas, or burgers), very much, somewhat like, not very much, not at all, do not eat:” Sample is limited to urban children aged 2 to 18. Sample size: 2,422.
Figure 3: Distribution of the Nearest Fast-food Restaurant
Note: The figure reports the distance between the nearest fast-food restaurant and the community,
conditional on the community's report that there is a fast-food restaurant inside/near the community. If the
nearest fast-food outlet is inside the community, the distance is counted as zero. Communities with no fast-
food outlet or where the nearest fast-food outlet is beyond 3 km are excluded from the calculation. The data
unit is at community-year level.
0
5
10
15
20
25
30
0 0.1 0.2 0.3 0.4 0.5 0.6 0.7 0.8 1 1.2 1.5 1.8 2 2.5 2.9 3
km
Table 1. Children's Weight and Percentage of Communities with a Fast-food Restaurant in the CHNS data
Panel A. Children Being Overweight or Obese
Mean 0.119 0.133 0.149 0.171 0.145
Std Dev (0.332) (0.34) (0.356) (0.373) (0.352)
Panel B. Presence of Fast-food Restaurant
Mean 0.232 0.292 0.329 0.354 0.305
Std Dev (0.425) (0.458) (0.473) (0.481) (0.462)
Number of Communities 82 65 88 96 96
Note: CHNS urban area samples are used.
2004 2006 2009 2011 2004-2011
Table 2. Summary Statistics
Children Characteristics:
Mean S.D. Mean S.D.
Age 10.963 (3.982) 10.378 (3.938)
Puberty 0.463 (0.499) 0.375 (0.481)
Grandparent 0.559 (0.497) 0.504 (0.500)
Family Income (in 2006 RMB) 48286 (47327) 37703 (44114)
Exercise 1.296 (3.062) 1.812 (5.395)
Number of Children in the Household 1.317 (0.554) 1.379 (0.613)
Community Characteristics:
Number of Households 1906 (1411) 1343 (1123)
Population Density 7619 (8964) 3428 (5641)
Number of Schools (primary and secondary) 0.750 (0.433) 0.765 (0.425)
Price of (a Typical Chinese) Vegetable 3.082 (1.718) 2.261 (1.397)
Price of Pork 20.864 (5.679) 20.319 (5.404)
Number of Chinese Restaurants/100 0.285 (0.335) 0.210 (0.270)
Bus stop 0.793 (0.406) 0.705 (0.457)
Number of Supermarket/Shopping Mall 6.496 (8.632) 5.629 (11.949)
Gym 0.892 (0.310) 0.553 (0.498)
Park 0.978 (0.148) 0.825 (0.381)
Playground 0.945 (0.228) 0.676 (0.468)
Number of Children
Observations 516 662
MKP Communities Non-MKP Communities
220 277
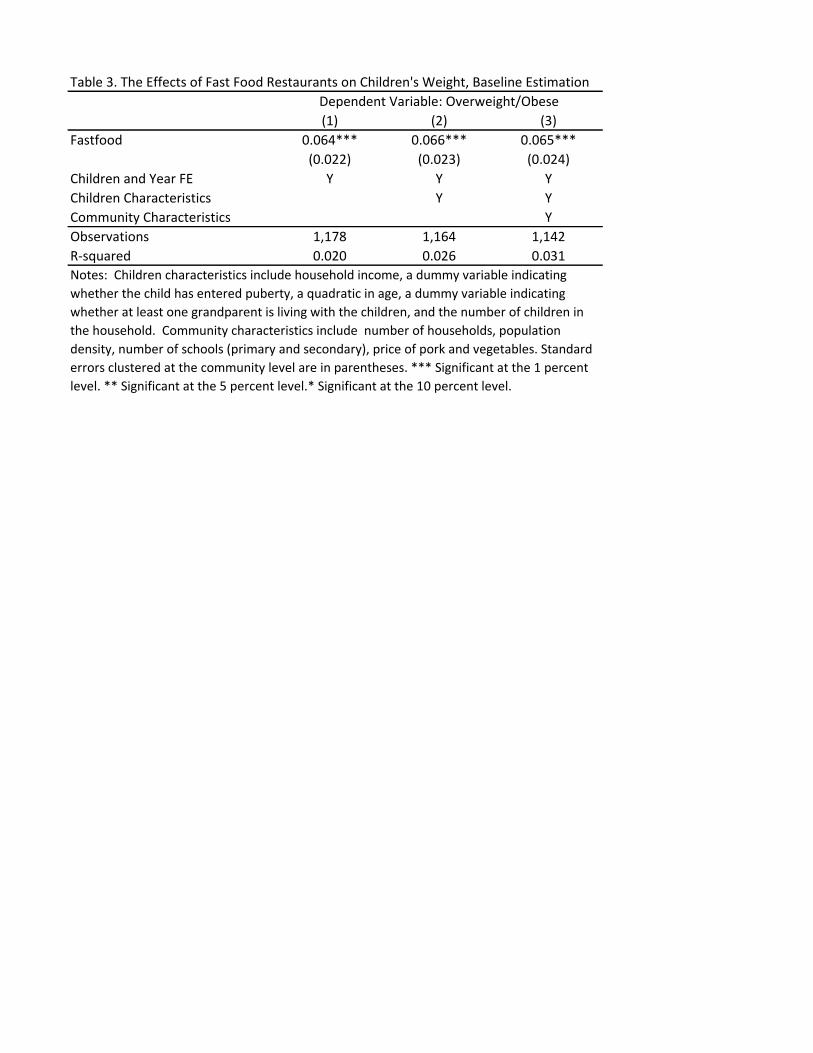
Table 3. The Effects of Fast Food Restaurants on Children's Weight, Baseline Estimation
(1) (2) (3)
Fastfood 0.064*** 0.066*** 0.065***
(0.022) (0.023) (0.024)
Children and Year FE Y Y Y
Children Characteristics Y Y
Community Characteristics Y
Observations 1,178 1,164 1,142
R-squared 0.020 0.026 0.031
Dependent Variable: Overweight/Obese
Notes: Children characteristics include household income, a dummy variable indicating
whether the child has entered puberty, a quadratic in age, a dummy variable indicating
whether at least one grandparent is living with the children, and the number of children in
the household. Community characteristics include number of households, population
density, number of schools (primary and secondary), price of pork and vegetables. Standard
errors clustered at the community level are in parentheses. *** Significant at the 1 percent
level. ** Significant at the 5 percent level.* Significant at the 10 percent level.
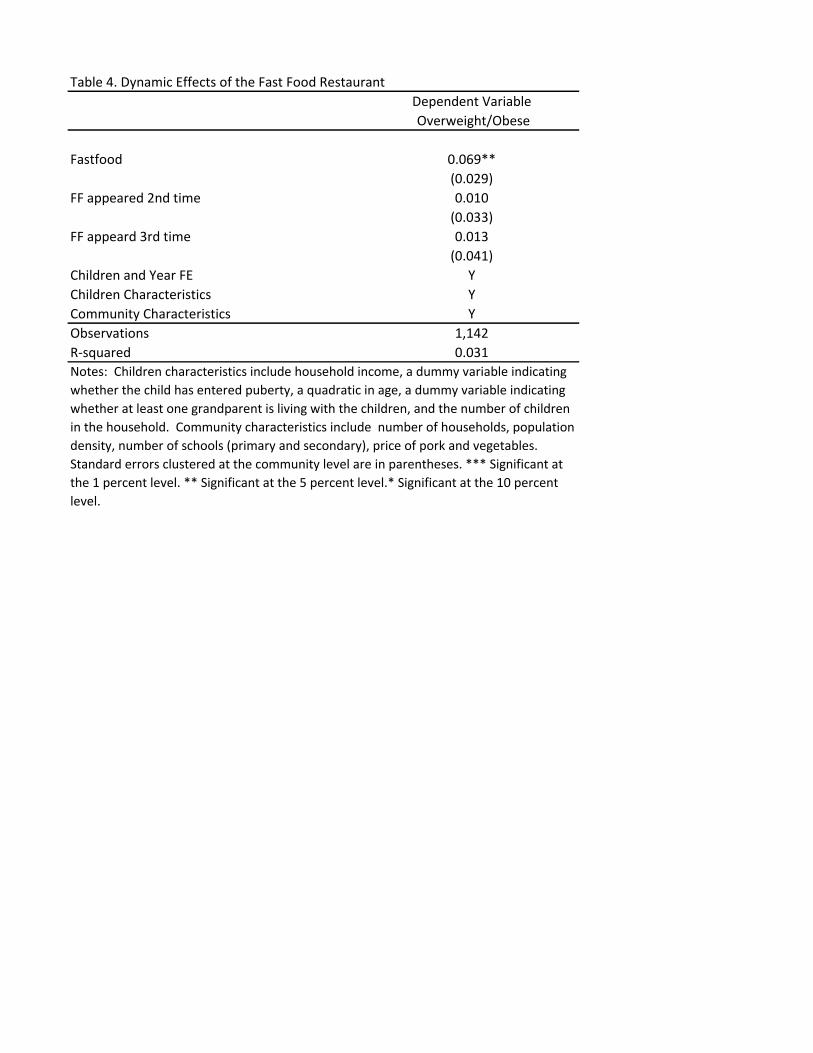
Table 4. Dynamic Effects of the Fast Food Restaurant
Dependent Variable
Overweight/Obese
Fastfood 0.069**
(0.029)
FF appeared 2nd time 0.010
(0.033)
FF appeard 3rd time 0.013
(0.041)
Children and Year FE Y
Children Characteristics Y
Community Characteristics Y
Observations 1,142
R-squared 0.031
Notes: Children characteristics include household income, a dummy variable indicating
whether the child has entered puberty, a quadratic in age, a dummy variable indicating
whether at least one grandparent is living with the children, and the number of children
in the household. Community characteristics include number of households, population
density, number of schools (primary and secondary), price of pork and vegetables.
Standard errors clustered at the community level are in parentheses. *** Significant at
the 1 percent level. ** Significant at the 5 percent level.* Significant at the 10 percent
level.
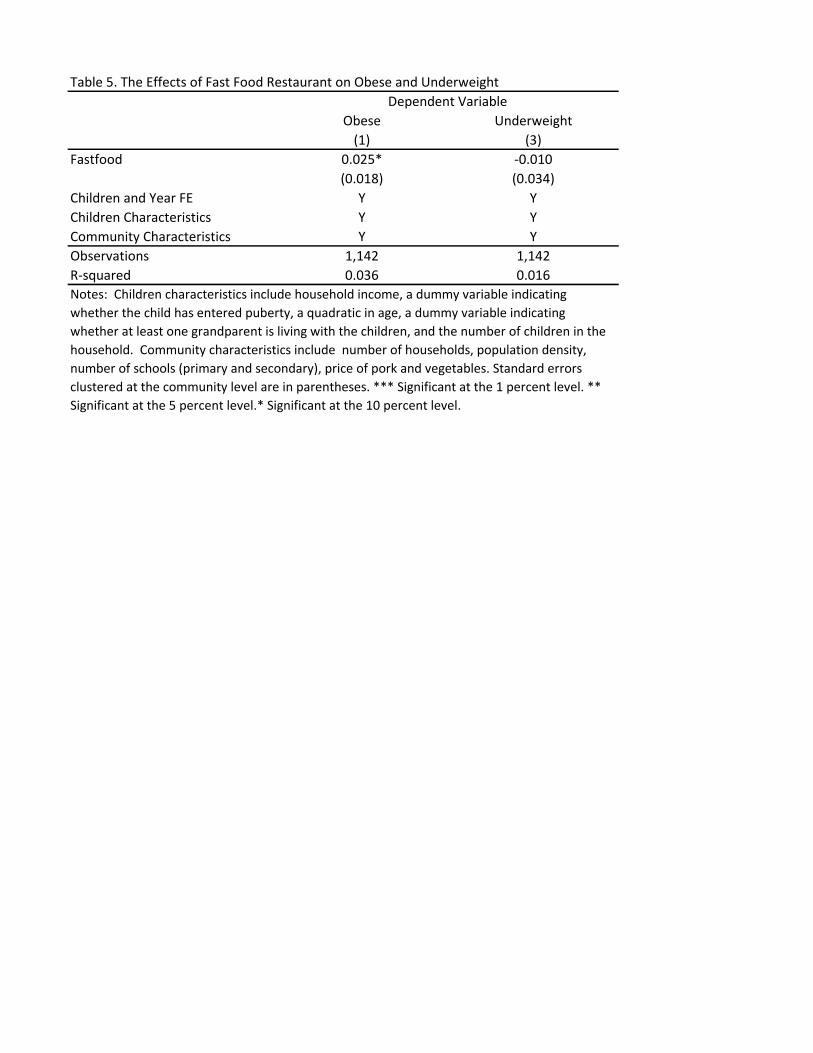
Table 5. The Effects of Fast Food Restaurant on Obese and Underweight
Obese Underweight
(1) (3)
Fastfood 0.025* -0.010
(0.018) (0.034)
Children and Year FE Y Y
Children Characteristics Y Y
Community Characteristics Y Y
Observations 1,142 1,142
R-squared 0.036 0.016
Notes: Children characteristics include household income, a dummy variable indicating
whether the child has entered puberty, a quadratic in age, a dummy variable indicating
whether at least one grandparent is living with the children, and the number of children in the
household. Community characteristics include number of households, population density,
number of schools (primary and secondary), price of pork and vegetables. Standard errors
clustered at the community level are in parentheses. *** Significant at the 1 percent level. **
Significant at the 5 percent level.* Significant at the 10 percent level.
Dependent Variable
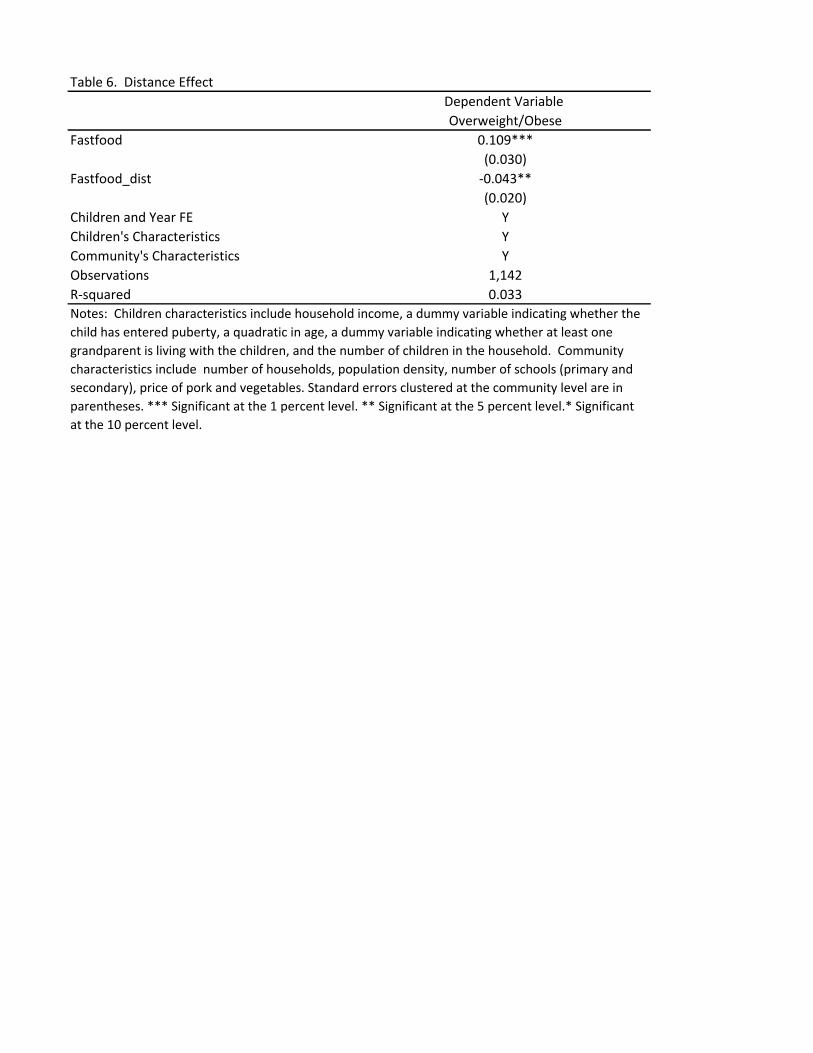
Table 6. Distance Effect
Dependent Variable
Overweight/Obese
Fastfood 0.109***
(0.030)
Fastfood_dist -0.043**
(0.020)
Children and Year FE Y
Children's Characteristics Y
Community's Characteristics Y
Observations 1,142
R-squared 0.033
Notes: Children characteristics include household income, a dummy variable indicating whether the
child has entered puberty, a quadratic in age, a dummy variable indicating whether at least one
grandparent is living with the children, and the number of children in the household. Community
characteristics include number of households, population density, number of schools (primary and
secondary), price of pork and vegetables. Standard errors clustered at the community level are in
parentheses. *** Significant at the 1 percent level. ** Significant at the 5 percent level.* Significant
at the 10 percent level.
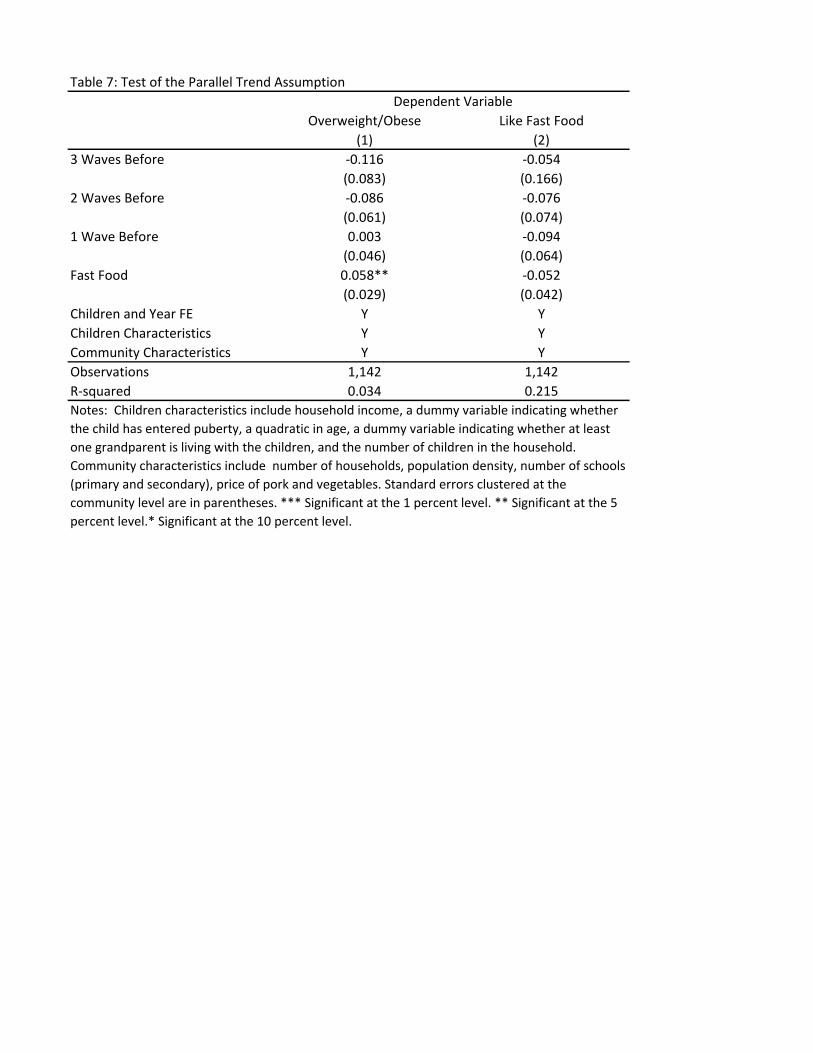
Table 7: Test of the Parallel Trend Assumption
Overweight/Obese Like Fast Food
(1) (2)
3 Waves Before -0.116 -0.054
(0.083) (0.166)
2 Waves Before -0.086 -0.076
(0.061) (0.074)
1 Wave Before 0.003 -0.094
(0.046) (0.064)
Fast Food 0.058** -0.052
(0.029) (0.042)
Children and Year FE Y Y
Children Characteristics Y Y
Community Characteristics Y Y
Observations 1,142 1,142
R-squared 0.034 0.215
Dependent Variable
Notes: Children characteristics include household income, a dummy variable indicating whether
the child has entered puberty, a quadratic in age, a dummy variable indicating whether at least
one grandparent is living with the children, and the number of children in the household.
Community characteristics include number of households, population density, number of schools
(primary and secondary), price of pork and vegetables. Standard errors clustered at the
community level are in parentheses. *** Significant at the 1 percent level. ** Significant at the 5
percent level.* Significant at the 10 percent level.
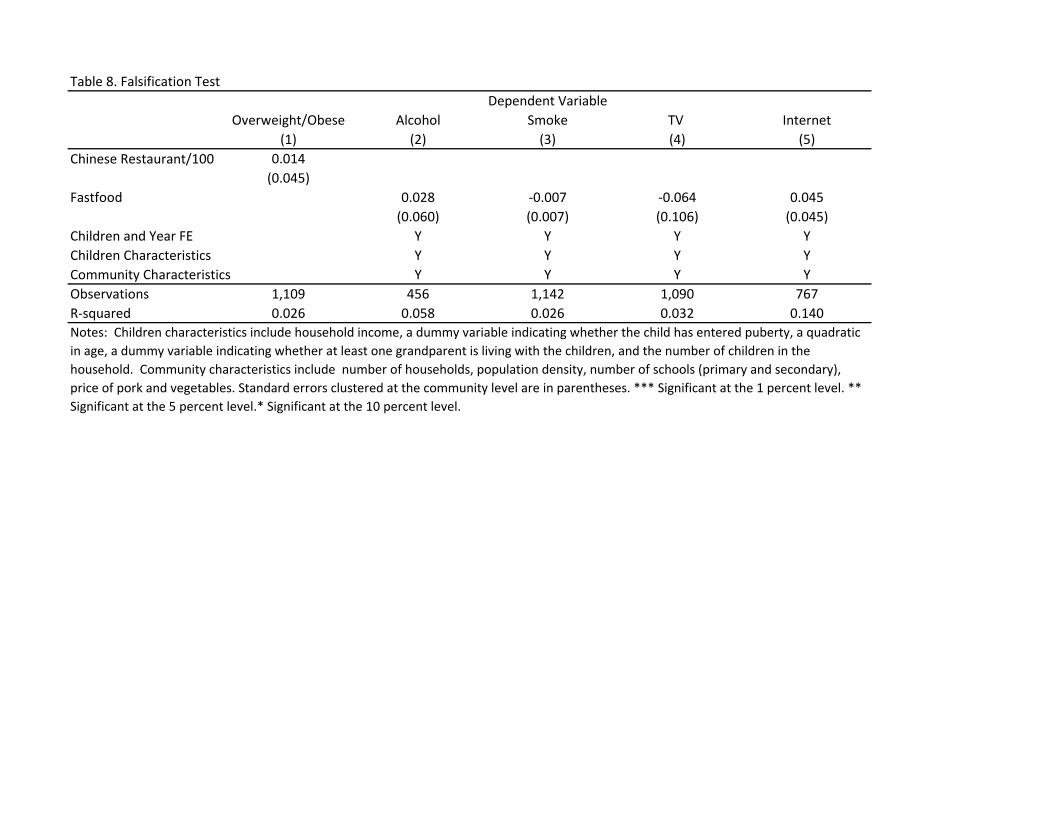
Table 8. Falsification Test
Overweight/Obese Alcohol Smoke TV Internet
(1) (2) (3) (4) (5)
0.014
(0.045)
Fastfood 0.028 -0.007 -0.064 0.045
(0.060) (0.007) (0.106) (0.045)
Children and Year FE Y Y Y Y
Children Characteristics Y Y Y Y
Community Characteristics Y Y Y Y
Observations 1,109 456 1,142 1,090 767
R-squared 0.026 0.058 0.026 0.032 0.140
Dependent Variable
Chinese Restaurant/100
Notes: Children characteristics include household income, a dummy variable indicating whether the child has entered puberty, a quadratic
in age, a dummy variable indicating whether at least one grandparent is living with the children, and the number of children in the
household. Community characteristics include number of households, population density, number of schools (primary and secondary),
price of pork and vegetables. Standard errors clustered at the community level are in parentheses. *** Significant at the 1 percent level. **
Significant at the 5 percent level.* Significant at the 10 percent level.
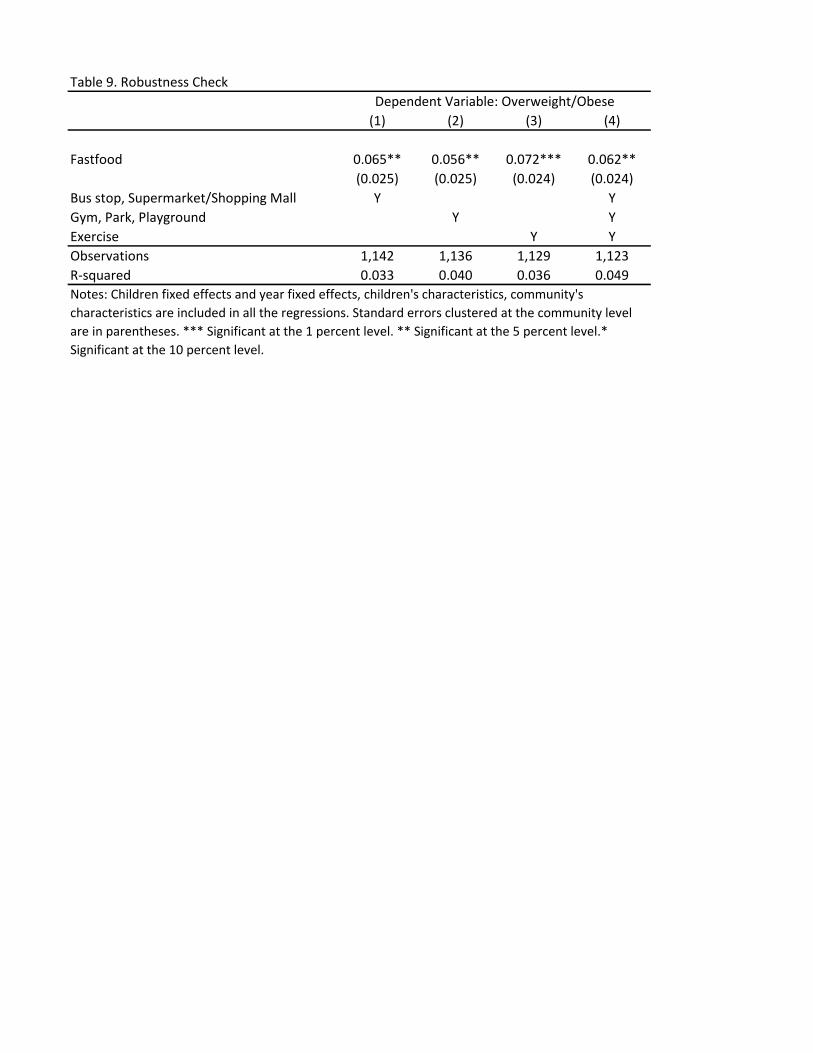
Table 9. Robustness Check
(1) (2) (3) (4)
Fastfood 0.065** 0.056** 0.072*** 0.062**
(0.025) (0.025) (0.024) (0.024)
Bus stop, Supermarket/Shopping Mall Y Y
Gym, Park, Playground Y Y
Exercise Y Y
Observations 1,142 1,136 1,129 1,123
R-squared 0.033 0.040 0.036 0.049
Notes: Children fixed effects and year fixed effects, children's characteristics, community's
characteristics are included in all the regressions. Standard errors clustered at the community level
are in parentheses. *** Significant at the 1 percent level. ** Significant at the 5 percent level.*
Significant at the 10 percent level.
Dependent Variable: Overweight/Obese
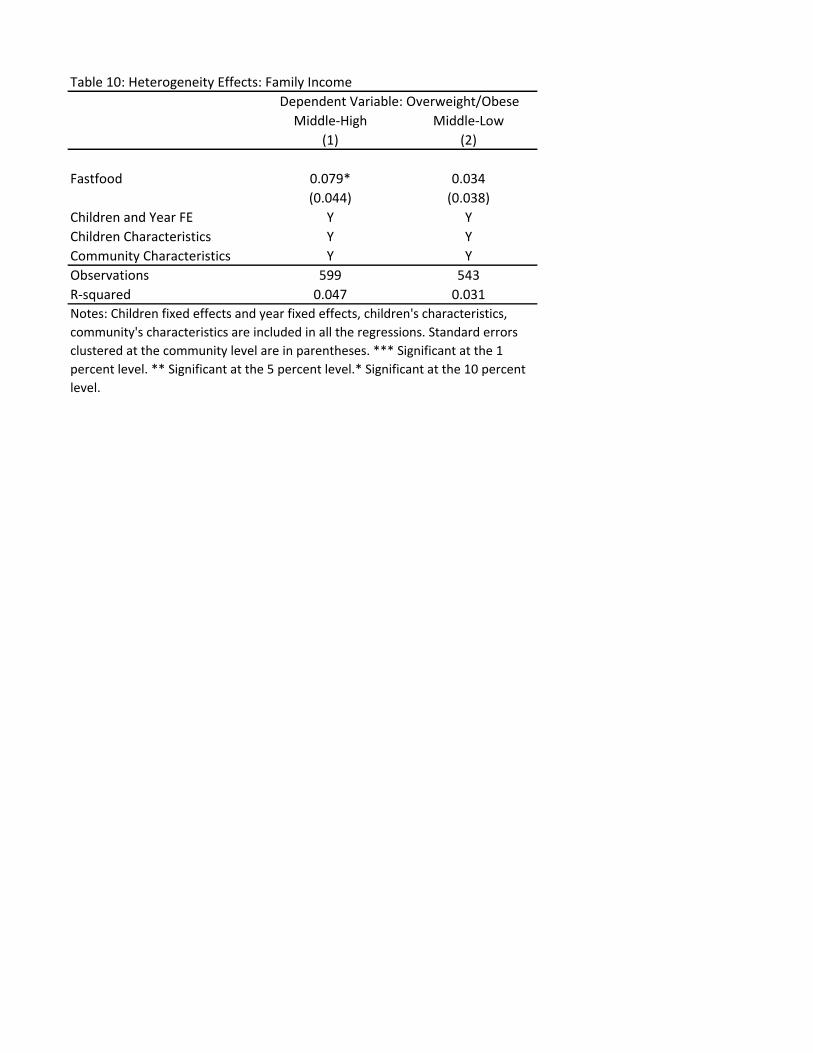
Table 10: Heterogeneity Effects: Family Income
Middle-High Middle-Low
(1) (2)
Fastfood 0.079* 0.034
(0.044) (0.038)
Children and Year FE Y Y
Children Characteristics Y Y
Community Characteristics Y Y
Observations 599 543
R-squared 0.047 0.031
Dependent Variable: Overweight/Obese
Notes: Children fixed effects and year fixed effects, children's characteristics,
community's characteristics are included in all the regressions. Standard errors
clustered at the community level are in parentheses. *** Significant at the 1
percent level. ** Significant at the 5 percent level.* Significant at the 10 percent
level.