the market for federal funds* - st. louis fed · fed- eral reserve regulation d delineates specific...
TRANSCRIPT

THE MARKET FOR FEDERAL FUNDS* Seth P. Maerowitz
The market for the most liquid of money market instruments-Federal funds-evolved as borrowers and lenders sought to exploit opportunities through trading in reserve deposit funds. Trading in Federal funds began in the 1920s and involved only a few Federal Reserve member banks located in New York
City. Today, the market includes over 14,000 com- mercial banks and a wide range of nonbank financial institutions.1 The characteristics of Federal funds as
well as the mechanics of their purchase and sale
reflect the needs of today’s market participants.
What Are Federal Funds?” Federal funds are short-term loans of immediately available funds, i.e., funds that can be transferred or withdrawn during one business day. Such immediately available funds include deposits at Federal Reserve Banks and col- lected liabilities of commercial banks and other de- pository institutions. Federal funds are exempt from
reserve requirements and the vast majority are un- secured. Most Federal funds are “overnight money” -funds lent out on one day and repaid the following
morning. Loans of longer maturity, known as term
Federal funds are not uncommon, however. The law requires, for purposes of monetary con-
trol, that all depository institutions maintain reserves as prescribed by the Federal Reserve System. Fed- eral Reserve Regulation D delineates specific classes of liabilities which are subject to Federal Reserve requirements. Commercial banks, thrift institutions; U. S. branches and agencies of foreign banks, and Edge Act corporations must hold set percentages of these liabilities in a combination of vault cash and noninterest-earning reserve balances at a Federal Reserve Bank. The opportunity cost of holding re- serve balances, which yield no return, provides the incentive to depository institutions to minimize their
* This article was written for Instruments of the Money Market, 5th ed., Federal Reserve Bank of Richmond.
1 Thomas D. Simpson, The Market for Federal Funds and Repurchase Agreements (Washington: Board of Governors of the Federal Reserve System, 1979), p. 20.
2 The term “Federal funds” is occasionally used in a broader sense than that described in this article. Some- times, members of the financial community will consider all funds which are immediately available and not subject to reserve requirements to be Federal funds. Repurchase agreements, included under this broad definition, are excluded from this discussion.
holdings of excess reserves. The Federal funds market provides the primary avenue for doing so.
Ordinary banking activities give rise to variations in a bank’s asset and liability holdings. These changes
in the balance sheet result in corresponding fluctu- ations in a bank’s reserve position. Consequently, on any given day some institutions hold reserves above their desired reserve position while others are
below their desired position. An institution holding excess reserves can earn interest on its funds by loaning them to others in need of reserves. Such a transaction is considered a Federal funds purchase by the borrowing institution, and a Federal funds sale by the lending institution.
The Mechanics of Federal Funds Transactions
Federal funds transactions can be initiated by either a funds lender or a funds borrower. An institution
wishing to sell (buy) Federal funds locates a buyer (seller) either directly through an existing banking relationship or indirectly through a Federal funds
broker located in New York City. Federal funds brokers maintain frequent telephone contact with ac-
tive buyers and sellers of Federal funds. Brokers
match Federal funds purchase and sale orders in re- turn for a commission on each completed transaction.
At the center of the Federal funds market are financial institutions that maintain reserve accounts
at Federal Reserve Banks. These institutions use the FederaI Reserve communications system, or Fed-
wire, to carry out rapid transfer of funds nationwide. The Federal Reserve communications system links
all Federal Reserve Banks and branches. Private financial institutions and government agencies are able to gain access to the wire network either through direct (on-line) links to Federal Reserve computers or through telephone or telegraph (off-line) contact with their Federal Reserve Bank.
When transfers are conducted within a Federal Reserve district, the institution transferring funds authorizes the district Federal Reserve Bank to debit
its reserve account, and to credit the reserve account of the receiving institution. Interdistrict transactions are only slightly more complicated but are best clari-
fied by an example. Suppose a thrift institution in Richmond (the Fifth Federal Reserve District) wishes to transfer funds to a bank in New York (the Second Federal Reserve District). The thrift initi-
FEDERAL RESERVE BANK OF RICHMOND 3

ates the transaction. The Federal Reserve Bank of Richmond debits the account of the thrift and credits
the account of the Federal Reserve Bank of New York. Finally, the Federal Reserve Bank of New York debits its own account and credits the reserve account of the receiving commercial bank. This
series of accounting entries is carried out instan- taneously.
Overnight Federal Funds In a typical Federal funds transaction the lending institution with reserve funds in excess of its reserve requirements authorizes a transfer from its reserve account to the reserve
account of the borrowing institution. The following day, the transaction is reversed. The borrower pays back the loan through a transfer of funds from its reserve account to the lender’s reserve account for an
amount equal to the value of the original loan plus an interest payment. The size of the interest pay-
ment is determined by market conditions at the time the loan is initiated.
Numerous institutions that buy and sell Federal funds do not maintain accounts at the Federal Re- serve. Instead, these institutions buy and sell funds through a correspondent bank. Correspondent banks
will often agree to purchase on a continuing basis all Federal funds that a respondent has available to sell. Typically, the respondent institution holds a demand deposit account with the correspondent. To initiate a
Federal funds sale, the respondent bank simply noti- fies the correspondent by telephone of its intentions.
The correspondent purchases funds from the respon- dent by reclassifying the respondent’s liability from a
demand deposit to Federal funds purchased. Upon maturity of the contract, the respondent’s demand deposit account is credited for the total value of the loan plus an interest payment for use of the funds. The rate paid to respondents on Federal funds is usually based on the nationwide effective Federal funds rate for the day.
Alternatives to Overnight Federal Funds The
different needs of participants in the Fed funds mar- ket and the wide range of financial environments in which they operate have resulted in the development of alternatives to overnight Federal funds. These alternatives include term and continuing contract Federal funds. According to the results of a 1977
survey, approximately 7.5 percent of all Federal funds transactions have maturities longer than over- night.3 Banks contract for term Federal funds when
3 Board of Governors, Repurchase Agreements and Other Nonreservable Borrowings in Immediately Available Funds. Report giving results of a 1977 survey, 1978, p. 4.
they foresee their borrowing needs lasting for several days and/or believe that the cost of overnight Federal funds may rise in the immediate future. Like over- night Fed funds, term Fed funds are not subject to
reserve requirements. For this reason, term Fed funds are often preferred to other purchased liabilities of comparable maturity. The majority of term Fed- era1 funds sold have maturities of 90 days or less but term Federal funds of much longer maturity are purchased occasionally.
Federal funds sold through a correspondent bank- ing relationship are sometimes transacted under a continuing contract. Continuing contract Federal funds are overnight Federal funds that are auto- matically renewed unless terminated by either funds
lender or borrower. In a typical continuing contract. arrangement, a correspondent will purchase over- night Federal funds from a respondent institution.
Unless notified by the respondent, the correspondent will continually roll over overnight Federal funds, creating a longer term instrument of open maturity. The interest payments on continuing contract Fed- eral funds are computed from a formula based on each day’s Federal funds quotations. The specific
formula used varies from contract to contract.
Secured and Unsecured Federal Funds Most
Federal funds transactions are unsecured, i.e., the lender does not receive collateral to insure him against the risk of default by the borrower. In some
cases, however, Federal funds transactions are se- cured. In a secured transaction, the purchaser places
government securities in a custody account for the seller as collateral to support the loan. The purchaser retains title to the securities, however.4 Upon com- pletion of the Federal funds contract, custody of the securities is returned to the owner. Secured Federal funds transactions are sometimes requested by the lending institution, or encouraged by state regula- tions requiring collateralization of Federal funds
sales.
The History and Evolution of Market Structure The Federal funds market of the 1920s developed out of the common interests of a few Federal Reserve member banks operating in New York City that often found themselves with temporary shortages or sur- pluses of reserves. Before the emergence of the Fed- eral funds market, banks having a deficiency of reserves had to borrow from the discount window,
4 The crucial difference between a secured Federal funds transaction and a repurchase agreement is that in a Federal funds transaction title to the security is not transferred. RPs are available to a wider range of mar- ket participants than Federal funds.
4 ECONOMIC REVIEW, JULY/AUGUST 1981

while banks with a surplus of reserves had no profit- able use for their excess reserve deposits. A market in reserve deposits was formed that benefited both deficient reserve and surplus reserve institutions. Banks that borrowed in the new market found Fed- eral funds to be an inexpensive substitute for the discount window, while banks that lent funds were pleased to receive a liquid earning asset to replace their nonearning excess reserve balances.
By 1929, the daily trading volume in Federal funds had expanded to over $250 million, but with the stock market crash of October 1929 and the economic contraction that followed, the Federal funds market
disintegrated.5 The contraction and the large num- ber of bank and industrial failures that accompanied
it led to great uncertainty about the safety of most
earning assets except U. S. Government securities. It resulted in a market preference for cash, reflected in the large increase in excess reserve balances main-
tained by commercial banks in the period. The dis- interest in Federal funds trading by potential lenders
was matched by the diminished needs of potential borrowers. Weak loan demand and large gold in-
flows throughout most of the early and midthirties left few institutions in need of borrowings to meet their reserve requirements.
The market revived briefly in 1941 in response to financial pressures resulting from World War II.6 The revival was short-lived, however; Federal Re- serve pegging of Treasury bill prices from 1942 to 1951 rendered the funds market superfluous. With the price of Treasury bills fixed, banks made adjust- ments in their reserve balances through trading Trea- sury bills free of market risk. The funds market
remained dormant until securities prices were un-
pegged by the Treasury-Federal Reserve Accord of 1951. Since trading in Treasury bills was now sub- ject to the risk of securities price fluctuations, Federal funds trading became the preferred mode of reserve adjustment. Furthermore, the higher market rates
of interest prevailing after the Treasury-Federal Reserve Accord increased the opportunity cost of holding sterile balances, making more frequent re- serve adjustments desirable. Consequently, the vol-
ume of aggregate trading in Federal funds grew sharply.
Improvements in banking technology and the
5 Marcos T. Jones, Charles M. Lucas, and Thorn B. Thurston, “Federal Funds and Repurchase Agreements,” Federal Reserve Bank of New York, Quarterly Review 2 (Summer 1977): 39.
6 Parker B. Willis, The Federal Funds Market, Its Origin and Development (Boston: Federal Reserve Bank of Boston, 1970), p. 15.
growth of correspondent banking during the sixties brought about important changes in the nature of Federal funds trading. Large correspondent banks intentionally began to run down their reserve posi- tions, substituting Federal funds as a new source of loanable funds. Smaller regional banks specializing in retail banking, with a large inflow of deposits but few lending opportunities, sold Federal funds to the larger institutions. Banking relationships developed such that large correspondents stood ready to pur- chase all the funds that their smaller respondent banks had available to sell.
In this environment, the Federal funds market took on a broader role, beyond that of reserve adjustment
borrowing. Large banks began to depend on Federal funds as a semi-permanent source of nondeposit funds while smaller respondents recognized Fed funds to
be a profitable, liquid investment. In 1963, the Comptroller of the Currency eliminated capital ade-
quacy restrictions on Federal funds purchases and sales, and in 1964, the Federal Reserve Board ruled that member banks could purchase Federal funds from nonmember respondents. These two rulings increased the supply of Federal funds to the pur- chasing banks,. further augmenting market growth.
The Federal Funds Rate and the Discount Rate The Federal Reserve limits most borrowing at the discount window to banks facing temporary shortages of reserves. Prior to the mid-1960s, the Federal funds rate rarely rose above the discount rate. Fed- eral funds were viewed primarily as a substitute for discount window borrowing. Since banks only used the discount window occasionally, they were gener- ally not constrained by Federal Reserve discount window policies. Temporary borrowing needs were easily met at the discount window leaving little in- centive to purchase funds at a rate exceeding the discount rate.
By late 1964 the practice of liabilities management had become widespread. In this environment incen- tives existed for banks practicing liabilities manage- ment to borrow from the discount window on a con- tinuing basis. Discount window administration poli- cies, however, remained oriented towards providing funds to banks facing temporary reserve deficiencies, thus preventing banks from using the window as a continual source of funds. Since access to the dis- count window was limited, banks in need of addi- tional funds were willing to pay a premium above the discount rate for Federal funds. In late 1964, the Federal funds rate rose above the discount rate re- flecting a demand for overnight funds exceeding the supply available at the discount window.
FEDERAL RESERVE BANK OF RICHMOND 5

During the “credit crunch” of 1966 regional bank-
ing institutions without well developed networks of
funds suppliers often found Federal funds difficult to obtain.7 Problems of funds availability soon subsided,
however, and the funds market continued to grow rapidly throughout the late 1960s. Banks willing to purchase Federal funds at the market rate found them to be expensive, but readily available. The
Federal funds rate rose rapidly towards the end of the 1960s and reached a peak of 9.2 percent in Au- gust of 1969. Many banks were squeezed in the short run by the rapid increase in the cost of funds. Over the long run, however, they adjusted by de- veloping flexible asset management and loan pricing policies in order to deal more effectively with vari- ation in the cost of nondeposit funds.
In 1970, approximately 60 percent of all member banks were active buyers or sellers of Federal funds.8
Despite questions of funds price and availability, the Federal funds market had grown dramatically throughout the sixties. In 1960 daily average gross
interbank Federal funds purchases of 46 money market banks were $1.1 billion.9 By 1970 daily
average purchases of this group had soared to $8.3 billion.10 The rapid growth in Federal funds trading throughout this period reflected the expanded role
of the Federal funds market as a source of purchased liabilities, as well as its value as a tool of member
bank reserve adjustment.
The Market in Recent Years11 The Federal funds market of the 1970s was characterized by further
7 S. M. Duckworth, Problems in Liability Management: Case Studies of Attitudes at Seven Banks (Boston: Fed- eral Reserve Bank of Boston, 1974), pp. 20-22. This discussion is drawn from interviews of bankers in the First Federal Reserve District.
8 Willis, The Federal Funds Market, p. 52.
9 Federal Reserve Bulletin (August 1964), table, “Basic Reserve Position,’ and Federal Funds and Related Trans- actions of 46 Major Reserve City Banks”, p. 954; same table in various issues of 1970, 1971.
10 Ibid
11 The analysis of the Federal funds market of the 1970s and ’80s is complicated by the development of the re- purchase agreement. Repurchase agreements gained rapid acceptance by bankers as a near perfect substitute for Federal funds. Data on Federal funds sales and purchases were, and continue to be, reported in aggregate with data on repurchase agreements. According to studies by the Federal Reserve Board of Federal funds and RPs supplied to 45 large member banks, Federal funds accounted for 89.4 percent of gross nonreservable borrowinns of immediately available funds from deposi- tory institutions and U. S: Government agencies on De- cember 7, 1977. Since Federal funds hive remained the predominant money market instrument for borrowing immediately available funds among banking institutions, an analysis of the Federal funds market in the ’70s can still be made on the basis of the available data.
growth spurred on by regulatory change. Prior to
1970 borrowings from nonbank financial institutions were subject to reserve requirements, and conse-
quently, nonbanks were not active in the Federal funds market. In 1970 an amendment to Regulation D exempted borrowings from savings and loan asso- ciations, mutual savings banks, and U. S. Govern- ment agencies from reserve requirements. Following
the 1970 ruling, the nonbank institutions assumed a role in the Federal funds market very similar to that of small commercial banks. Savings and loan asso- ciations and mutual savings banks found sales of Federal funds to be a profitable and liquid alternative to purchases of Treasury securities. In recent years, nonbank depository institutions supplied 35 percent of the Federal funds purchased by the 45 large weekly reporting banks.12
The funds market of the 1970s continued to reflect
the patterns of growth which had developed in earlier years. During periods of high short-term interest
rates, the Federal funds market expanded as small
financial institutions sought to economize on their cash and reserve balances while large banks prac- ticing liabilities management demanded Federal funds
to meet the needs of their loan customers. In times of low short-term interest rates and slack loan de- mand, growth in the Federal funds market was less rapid. The Federal funds market, however, was not subject to large declines in trading volume, as were other markets for purchased liabilities such as large certificates of deposit.13
The Federal Funds Market and Monetary Policy The Federal Reserve exerts control over the money supply primarily influencing the level of nonborrowed reserves available to the banking system. The Fed- eral funds rate reflects the cost of interbank borrow- ing, in essence the price of nonborrowed reserve deposit funds. If the supply of nonborrowed reserves
is reduced, the immediate effect will be an increase in the Federal funds rate ; conversely, an increase in the supply of nonborrowed reserves will bring about a fall in the funds rate. Following a rise in the funds
rate, banks will slow the growth of their loan port- folios and/or increase the rates charged on new loans to reflect the higher cost of nondeposit funds. Hence,
12 Board of Governors, Repurchase Agreements and Other Nonreservable Borrowings, p. 4. A data series consisting of 46 large banks was begun by the Federal Reserve System in 1964. In March 1980, the sample group was expanded to include 121 large member banks. The figure is based upon a special survey of the original 46 bank group, conducted on December 7, 1977.
13 CDs were subject to a rapid runoff in 1975 and 1977. (See Summers [15]).
6 ECONOMIC REVIEW, JULY/AUGUST 1981

the Federal funds market acts as an integral part of the transmission process for monetary policy.
Throughout the 1970s, the Federal Reserve used the Federal funds rate as its principle operating tar- get of monetary policy. When money growth was above the desired growth path, the Federal funds rate target was raised. The Open Market Desk was directed to sell government securities and drain re-
serves from the banking system until the desired funds rate target was met. If more rapid monetary
growth was desired, the funds rate target was low- ered, and reserves were added to the banking system.
Funds traders formed their expectations of the funds rate based on what they believed the Federal Re- serve’s target rate to be; under usual procedures,
whenever the funds rate rose 1/8 to 3/16 percentage points above its target level, the Federal Reserve provided reserves through the purchase of govern- ment securities (via overnight RPs), and whenever the rate dropped 1/8 to 3/16 points below target, the Federal Reserve absorbed reserves through the sale of securities. Market participants soon came to de- pend on such signals of Federal Reserve intentions,
which provided important information for forecasting Federal funds rate movements.
The inflation of recent years and the tendency of the Federal Reserve to overshoot its money supply targets raised serious questions about the efficacy of the Federal funds rate as an operating target for monetary policy. On October 6, 1979, a major policy shift was announced. The Federal Reserve would now focus more attention on nonborrowed reserves and less attention on day-to-day fluctuations in the Federal funds rate.
The impact of the new policy on the market was immediate and dramatic. Variation in the funds rate increased from a daily trading band of approximately
2 percentage points during the month preceding Oc- tober 6th to a daily trading band of approximately 5 percentage points during the month following Oc- tober 6th.14 Despite greater variation in the funds rate, trading volume continues to be strong, reflecting the importance of Federal funds as a short-term money market instrument.
Conclusion The Federal funds market of today is the evolutionary result of changes in general eco- nomic conditions, Federal and state regulations, and financial innovation. From its beginnings as a mar- ket limited to the purchase and sale of excess reserve
14 Federal Reserve Bank of New York, “Composite Closing Quotations for U. S. Government Securities,” September 4, 1979 - November 9, 1979.
deposits among member banks, the Federal funds market has undergone tremendous expansion. Active liabilities management practices of the past two dec- ades created new demand for Federal funds, and less restrictive regulations brought the funds market to a new group of financial institutions. Today, Federal funds are an important purchased liability for large banks, a profitable liquid investment for a wide range
of market participants, and a valuable reserve ad- justment tool.
1.
2.
3.
4.
5.
6.
7.
8.
9.
10.
11.
12.
13.
14.
15.
16.
References
Board of Governors of the Federal Reserve System. Repurchase Agreements and Other Nonreservable Borrowings in Immediately Available Funds. 1978.
Board of Governors of the Federal Reserve System. Selected Interest Rates and Bond Prices. Wash- ington, D. C.: 1969.
Brandt, Harry. “The Discount Rate Under the Federal Reserve’s New Operating Strategy.” Eco- nomic Review, Federal Reserve Bank of Atlanta 6 (March/April 1980) : 6-15.
Depamphilis, Donald Michael. A Microeconomic Econometric Analysis of the Short-Term Commer- cial Bank Adjustment Process. Boston: Federal Reserve Bank of Boston, 1974.
Duckworth. S. M. Problems in Liability Manage- ment: Cask Studies of Attitudes at Seven Banks. Boston: Federal Reserve Bank of Boston, 1974.
Federal Reserve Bank’ of New York. “Monetary Policy and Open Market Operations in 1979.” Quarterly Review, Federal Reserve Bank of New York 5 (Summer 1980) : 50-64.
Fieldhouse, Richard C. “The Federal Funds Mar- ket.” Money Market Memo. New York: Garvin, Bantel & Co., October, November 1964.
Gambs, Carl M., and Kimball, Ralph C. “Small Banks and the Federal Funds Market.” Economic Review, Federal Reserve Bank of Kansas City 64 (November 1979) : 3-12.
Jones, Marcos T.; Lucas, Charles M.; and Thur- ston, Thorn B. Agreements.”
“Federal Funds and Repurchase Quarterly Review, Federal Reserve
Bank of New York 2 (Summer 1977) : 33-48.
Kaufman, Herbert M., and Lombra, Raymond E. “Commercial Banks and the Federal Funds Mar- ket : Recent Developments and Implications.” Economic Inquiry 16 (October 1978).
Kimball, Ralph C. “Wire Transfer and the De- mand for Money.” New England Economic Reviev, Federal Reserve Bank of Boston (March/April 1980), pp. 5-22.
Monhollon, Jimmie R. “Federal Funds.” Instru- ments of the Money Market. 4th ed. Edited by Timothy Q. Cook. Richmond : Federal Reserve Bank of Richmond, 1977.
Simpson, Thomas D. The Market for Federal Funds and Repurchase Agreements. Washington, D. C.: Board of Governors of the Federal Reserve System, 1979.
Stigum, Marcia. The Money Market Myth, Reality, and Practice. Homewood: Dow Jones-Irwin, 1978.
Summers, Bruce J. Deposit.”
“Negotiable Certificates of Economic Review, Federal Reserve Bank
of Richmond 66 (July/August 1980) : 8-19.
Willis, Parker B. The Federal Funds Market, Its Origin and Development. Boston: Federal Reserve Bank of Boston, 1970.
FEDERAL RESERVE BANK OF RICHMOND 7

MONETARY POLICY AND ECONOMIC PERFORMANCE,
SUMMER 1976-NOVEMBER 1980: AN OVERVIEW*
Robert E. Weintraub
In May 1975, pursuant to House Concurrent Resolution 133, passed in March 1975, the Federal Reserve began to set and disclose in Congressional
hearings that were held four times a year money
supply growth targets for the four quarters immedi- ately ahead. Now, under the Hawkins-Humphrey
Act, the hearings are held only twice a year-Febru- ary and July. In July, preliminary targets are dis-
closed for the next calendar year. Also in July, and in February as well, the targets are set (or, if desired,
revised) for the current calendar year.
Initially, May 1975, plans were announced to increase what was then the basic measure of the nation’s supply of exchange media or money, Ml,
between 5 and 7½ percent per year. The lower end of the range was reduced to 4½ percent effective beginning in the fourth quarter of 1975. The upper end of the range was reduced to 7 percent effective the following quarter, and further reduced to 6½ percent effective in the summer or third quarter of 1976.
Early 1975 to Late 1976: Recovery with Declin- ing Inflation In association with lowering its sights, the Federal Reserve kept Ml growth at the bottom or below the planned ranges until the third quarter of 1976. During the year and a half from March 1975 through the third quarter of 1976, mea- sured between the same quarters from one year to
the next, Ml growth ranged between 4.5 and 5.2
percent. (Later, beginning with our discussion of events from late 1976 on, M1B is used to measure the nation’s supply of exchange media or money. Here, it suffices to note that its growth ranged be-
* Extracted from the author’s report
The Impact of the Federal Reserve System’s Monetary Policies on the Nation’s Economy, (Second Report), Staff Report of the Subcommittee on Domestic Mone- tary Policy of the Committee on Banking, Finance and Urban Affairs, House of Representatives, 96th Con- gress, Second Session, December 1980,
presented at a research seminar at the Federal Reserve Bank of Richmond, April 17, 1981. The views expressed herein are those of the author and not necessarily those of the Federal Reserve Bank of Richmond or of the Board of Governors of the Federal Reserve System.
tween 5.0 and 5.8 percent during the earlier period now under discussion.)
In retrospect, the economy performed exceptionally
well during the early 1975 to late 1976 period.
l The recession that began late in 1973 ended in
the second quarter of 1975. The nation’s out-
put, measured by constant dollar GNP, in-
creased 6.5 percent between the second quarter of 1975 and the second quarter of 1976 and 4.7
percent between the third quarter of 1975 and the third quarter of 1976. Unemployment fell
from the recession peak of 8.9 percent in May 1975 to 7.7 percent in September 1976.
l Inflation, measured by the rise in the GNP deflator dropped from 11.6 percent in the four quarters ending with the first quarter of 1975
to 4.8 percent in the four quarters ending with the third quarter of 1976.
Few believed, in early 1975, that our economy could achieve vigorous recovery of production from the 1973-1975 slide, and realize a substantial decline in unemployment, if money growth was held below
6 percent per year. And not many persons believed that this could happen while at the same time the rate of inflation fell sharply. Rather, it was widely be- lieved that money growth substantially higher than 6 percent per year was essential to a strong recovery,
and that a strong recovery was sure to prevent infla- tion from falling sharply. However, the events of 1975-1976 contradicted both beliefs. First, vigorous recovery of production took place even though money growth measured over 12-month periods was main- tained near the economy’s long run growth potential, which is estimated to be 3½ to 4 percent yearly. Second, inflation dropped nearly 60 percent together with the recovery of growth of constant dollar GNP.
Recovery The recovery of 1975-1976 was made possible by (and indeed required) the erosion and elimination of the forces that caused the 1973-1975 recession. The recession resulted from a combination of factors. The acceleration of domestic inflation be- ginning in 1973, the quadrupling of imported oil
8 ECONOMIC REVIEW, JULY/AUGUST 1981
prices between the end of 1972 and the spring of
1974, and the cutback of fiscal stimulus in 1973 and the first half of 1974 all played important parts in depressing production in 1973-1975. The sharp de-
celeration of money growth that began in mid-1973 and was speeded up in the second half of 1974 was another contributing factor. All of these forces had eroded or were eliminated by the spring of 1975. Their erosion and elimination acted to halt the decline in the nation’s output. The recovery was then able to start.
Beginning in the spring of 1975, constant dollar GNP grew strongly. It was propelled upward by the natural resiliency of the economy’s private sector, a
modest boost in the 12-month rate of money growth from the low reached in the recession, and the input in 1975 of strong incremental fiscal stimulus. In- creased money growth was only one of several con- tributing factors. It was hardly crucial. However, it
was crucial that the sharp decline of Ml growth that began in mid-1973 and speeded up in the second half of 1974 be stopped, and that the 12-month rate of Ml growth be maintained at or near a rate commen-
surate with the economy’s long run potential to in- crease constant dollar GNP. And this much was done.
The Decline of Inflation There remains the ques-
tion of the decline of the rate of inflation that oc- curred together with the rise of constant dollar GNP and the corollary fall of unemployment in 1975 and 1976. Many attribute it to the lagged effects of the loosening of labor and other input markets and easing
of cost pressures that accompanied the 1973-1975 recession, including the leveling-off of imported oil
prices after the spring of 1974. However, the reces- sion and leveling-off of imported oil prices were not unrelated to the course of money growth. The view that we hold is that the sharp deceleration of the rate of growth of the money supply that began in mid-
1973 and continued until early- 1975 was a common cause of (1) the 1973-1975 recession, (2) the leveling-off of imported oil prices after the middle of
1974, and (3) the decline of the rate of inflation in 1975-1976. It played a crucial role in the slowing of inflation.
This is not to say that inflation is always and everywhere a purely monetary phenomenon. Cer- tainly, in periods as short as a year it is not. Mea- sured quarter to quarter, over four-quarter periods, or year on year, and even over longer periods, infla- tion can be triggered or worsened by any of a large number of events. An occasion of severe inflation was initiated in the United States by the buying spree
that followed the invasion of South Korea in June
1950. A temporary inflationary impact was given by the OPEC oil price increases of late 1973 and early 1974 and again in 1979. Because of the influences of
such shocks, any particular rate of growth of the money supply is not related with mathematical pre- cision to the accompanying or following rate of infla- tion. But it is a basic and demonstrable reality that in the post-Korean War era in the United States the rate of inflation measured over four-quarter periods, or year on year, and over longer periods, has been profoundly affected by the rate of growth of the money supply.
However, it is past money growth, not the accom-
panying growth of the money supply, that matters most. Changes in money growth can change the rate of growth in expenditures on assets and even GNP goods and services relatively rapidly. Rates of rise of some prices (financial and other asset prices, com-
modity prices, and prices of shelf goods) adjust
quickly, but a number of factors combine to slow the
adjustment of the rate of rise of prices in general.
To begin with, there is no assurance that regulated prices, including rents and utilities, will be allowed to
rise quickly and commensurately in the wake of an acceleration of money growth and corollary rise in
the growth of spending on GNP goods and services. Also, it is a sticky problem to raise prices that have been advertised or “established” such as tuition, hotel
room rates, brand-name product prices, doctors’ fees, and theater ticket prices. In the event of declines in
the growth rates of the money supply and spending
on GNP goods and services, it is equally sticky to cancel or scale down planned price increases of ad- vertised goods. And it is highly unlikely that re- quests for increases of regulated prices will be with- drawn quickly in such case.
Further, price adjustments to changes in economic conditions often are delayed by agreements reached in the past under different conditions. Wage rates are set ahead by collective bargaining in important economic sectors. Forward contract prices are the norm in the provision of such financial services as term loans and insurance, and in the supply of di- verse raw materials and energy. Price and wage increases contracted for in the past ordinarily are put into effect whether new conditions warrant scaling them down, or up. Finally, the post-1932 tradition of using monetary and fiscal stimulus to end reces- sions acts to deter adjusting wage and price demands downward in renegotiating contracts to conform to current recession conditions. This is because, in the post-1932 tradition, ongoing declines in spending or
FEDERAL RESERVE BANK OF RICHMOND 9
its growth are expected to be reversed reasonably
soon by new monetary and fiscal stimulus.
As a result of these diverse factors it takes time
for changes in money growth to change the rate of
rise of the general level of prices, i.e., the rate of inflation. However, by 1975 and 1976, enough time had elapsed for the rate of inflation to substantially
adjust to the slowdown of money growth that began in mid-1973 and continued to early 1975.
Late 1976 to October 1979: Money Growth Ac- celerates As was noted in discussing events from early 1975 to late 1976, during the year and a half from March 1975 through the third quarter of 1976,
measured between the same quarters from one year to the next, Ml growth ranged between 4.5 and 5.2 percent. Because Ml growth was kept at the bottom of the Federal Reserve’s planned ranges for Ml growth, and because the target ranges had been re- duced, we had high hopes in 1976 that inflation would be permanently checked and that another recession could be avoided. Unfortunately, Ml growth was accelerated sharply beginning in the fourth quarter
of 1976. Quarter-to-quarter Ml growth, which had been
kept between 2.9 and 5.8 percent per year and aver- aged 4.4 percent per year in the four quarters ending
with the third quarter of 1976, was suddenly in- creased to 7 percent per year in the fourth quarter of 1976. In 1977, it ranged between 6 and 8.8 percent per year and averaged 7.5 percent per year.
The story is virtually the same for M1B. Quarter- to-quarter M1B growth ranged between 3.2 and 6.3 percent per year and averaged 4.8 percent per year in the four quarters ending with the third quarter of 1976. It was increased to 7.6 percent per year in the fourth quarter of 1976. In 1977, it was allowed to range between 6.5 and 9.3 percent per year and aver-
aged 7.9 percent per year.
MlB is one of the Federal Reserve’s two new mea- sures of the supply of exchange media, replacing M 1. The other is MlA. The two series were first pub- lished in February 1980. They were constructed to start in 1959. They can be extended back in time by assuming they are identical to the old Ml series in years before 1959. MlA excludes the demand de- posits of foreign banks and official institutions in U. S. banks, but otherwise is identical to old Ml. MlB equals MlA plus commercial bank ATS ac- counts and checking accounts in depository institu- tions other than commercial banks. (See Glossary.) Reasonably accurate data have been available on ATS accounts and checkable accounts in depository institutions other than commercial banks as they
grew. Thus it is legitimate to use the MlB series
for years before 1980, when the series was first pub-
lished. It also is logically correct to count all check-
able accounts in all depository institutions as ex-
change media. Accordingly, MlB is used to measure
the U. S. money supply in this article from here on.
MlB growth remained high in 1978 and through the summer or third quarter of 1979, just before the October 6, 1979 change in the Federal Reserve’s focus which is discussed later. Quarter-to-quarter MlB growth ranged between 4.8 and 10.7 percent per year and averaged 8.2 percent per year during this period.
Charting the Year-on-Year Relation of Inflation to Money Growth In the wake of the acceleration of money growth, inflation, which had been checked and reduced, increased again. The GNP price de- flator increased 6.2 percent in the four quarters end- ing with the fourth quarter of 1977, 8.2 percent in
the four quarters ending with the fourth quarter of 1978, 8.9 percent in the four quarters ending with
the fourth quarter of 1979, and 9.6 percent in the four
quarters ending with the third quarter of 1980.
The 1977-1980 record confirms the evidence ac- cumulated since the Korean War ended. Specifically,
by and large and on average, the four-quarter rate of inflation follows closely the rate of money growth two years earlier. The relation of the four-quarter rate of inflation to the four-quarter rate of MlB growth two years earlier during the post-Korean War period is
mapped in Chart 1.
The chart maps percentage increases, measured between the same calendar quarters from one year to the next, in the GNP deflator and MlB. The solid line maps the percentage rise of the deflator; the dashed line maps MlB percentage growth. To cap-
ture the lag between changes in money growth and changes in the rate of inflation, the growth of MlB, which is represented by the height of any point on the
dashed line, refers to the percentage growth that occurred in the four quarters ending two years earlier than the date shown directly below that point on the horizontal axis. For example, the height of the dashed line directly above the first quarter of 1956 on the horizontal axis shows the percentage growth of MlB from the first quarter of 1953 to the first quarter of 1954. Unlike this lagged mode of timing, the rate of inflation, which is represented by the height of any point on the solid line, refers to the percentage change in the GNP deflator in the four quarters ending in the quarter indicated by the date directly below this point on the horizontal axis.
10 ECONOMIC REVIEW, JULY/AUGUST 1981

Chart 1
YEAR-TO-YEAR PERCENT CHANGES
MEASURED BETWEEN THE SAME QUARTERS FROM ONE YEAR TO THE NEXT
Inspection of the solid and dashed lines mapped in Mathematically, Chart 1 shows that, measured over four-quarter
periods, percentage increases in the GNP price de- 1) the percent change in MlB
flator from 1956 to the third quarter of 1980, closely +2) the percent change in MlB’s velocity
track percentage increases in MlB two years earlier. =3) the percent change in the dollar value of
However, this visual approximation of the relation- GNP.l
ship of inflation to money’ growth in the U. S. since 1956 captures only part of the power of changes in
MlB growth to change the GNP rate of inflation. Only the part that is centered on price behavior two years after the change in MlB growth is captured.
The Long-Run Adjustment Changes in the dollar value of the economy’s GNP always can be attributed
to changes in MlB or its velocity or turnover in relation to the dollar value of GNP. This proposition has nothing to do with economics. It is a matter of arithmetic. As a useful approximation, the percent- age change in the dollar value of GNP in any given time period can be expressed as the sum of the same period’s percentage changes in MlB and its velocity.
Because percentage changes. in velocity can vary from period to period, percentage changes in MlB
will not result in proportional changes in the dollar value of GNP in the same period, except by accident. Thus, a crucial question is: How do percentage changes in MlB’s velocity vary?
Measured from one quarter to the next, percentage changes in MlB’s velocity vary substantially. How- ever, as the unit of time used to group the data is
1 The exact relationship is: (l+(the percent change in M1B/100))
x(l+(the percent in MlB’s velocity/100)) -1 =the percent change in the dollar value of
GNP/100.
FEDERAL RESERVE BANK OF RICHMOND 11

lengthened, the variance falls. For example, in the twelve years from 1956 to 1967, on average, velocity
increased 3.45 percent measured year on year. In the next 12 years, from 1968 to 1979, the year-on-
year or yearly increase of velocity averaged 2.97 percent, a difference of less than ½ percentage point.
Table I sets forth yearly average percentage
changes of-
l MlB’s velocity in relation to the dollar value of GNP,
l the dollar value of GNP, and
l M1B
for eight consecutive nonoverlapping 3-year periods
in the post-Korean War era, beginning with 1956- 1958 and ending with 1977-1979. The data show
that in the post-Korean War period, measured as
yearly averages for 3-year periods, percentage changes in velocity have been fairly stable. Over the full twenty-four years from 1956 to 1979, velocity
increased, on average, 3.2 percent per year. In the eight 3-year periods into which 1956-1979 divides, the average yearly percentage increase in velocity
never exceeded 4 percent or fell below 1.62 percent, a range of only 2.4 percentage points. Except for the
1968-1970 period, the average yearly 3-year increase was well within 1 percentage point of the full 24-year
period average rise. In 1968-1970, it was 1.58 per- centage points below the full-period average rise.
In sharp contrast to the rate of rise in velocity, 3- year percentage changes in both MlB and dollar spending on GNP varied considerably in the 1956- 1979 period. Measured as yearly averages for 3-year periods, percentage changes in MlB ranged from a low of 0.97 percent to a high of 7.81 percent, or nearly 7 percentage points, and changes in the dollar value of GNP ranged between 4 and 11.58 percent,
a range of more than 7½ percentage points.
Moreover, grouped in the 3-year periods into which 1956-1979 divides, there is no relationship between the yearly rate of rise in velocity and either the yearly rate of rise in MlB or the year-on-year growth of the dollar value of GNP. However, 3-year average yearly percentage changes in the dollar value of GNP closely match 3-year averages of yearly per- centage changes in MlB. The relationship between the two is depicted in Chart 2.
For each 3-year period, the chart relates the aver-
age yearly percentage growth of MlB, which is mea- sured on the horizontal axis, and the average yearly percentage rise in the dollar value of GNP, which is measured on the vertical axis. The chart shows that
Table I
3-YEAR YEARLY AVERAGE PERCENTAGE CHANGES
IN VELOCITY, NOMINAL GNP AND MlB,
NONOVERLAPPING PERIODS
1956-1979
Yearly average percentage change in
Period Velocity Nominal GNP M1B
1956 to 1958 3.00 4.00 0.97
1959 to 1961 3.90 5.27 1.32
1962 to 1964 3.48 6.71 3.13
1965 to 1967 3.41 7.81 4.25
1968 to 1970 1.62 7.27 5.55
1971 to 1973 2.74 9.98 7.04
1974 to 1976 4.00 9.23 5.02
1977 to 1979 3.56 11.58 7.81
the two are very closely related. For the 3-year periods into which 1956-1979 divides, changes in MlB are matched by nearly proportional concurrent changes in- the dollar value of GNP. As a conveni- ence, the least squares regression equation of the 3-year average yearly percentage change in the dollar value of GNP regressed on the 3-year average yearly
percentage change in MlB is drawn in the chart, and
its relevant statistics provided below. Accelerations in the growth of dollar spending on
Chart 2
ANNUAL PERCENTAGE CHANGE OF MlB
AND CURRENT DOLLAR GNP FOR 3-YEAR NONOVERLAPPING PERIODS,
1956-79
12 ECONOMIC REVIEW, JULY/AUGUST 1981

GNP goods and services which accompany accele- rated money growth can result in faster inflation,
accelerated output growth, or some combination of the two. A short-lived increase in the growth of output is likely in the short run. However, over the long haul, accelerated money growth tends to be fully dissipated in faster inflation. This is the fundamental lesson of the data.
There is nothing mysterious about this conclusion. Money facilitates production only when it is intro-
duced into a market. Unlike in the cases of labor and material input, increases in the input of money (in full-fledged money economies such as ours) do not increase the potential to produce. In the long run, measured real GNP growth is neutral with respect to money growth.2 This does not mean living standards are unaffected ; via inflation, rapid money
growth generates deadweight losses in real GNP.
Because the limits on production cannot be changed by changing money growth, the acceleration of spend- ing that results from accelerating money growth ulti- mately is registered in faster inflation. It is only a question of how long it takes.
The longer term relationships between money growth rates and rates of constant dollar GNP growth and inflation are pictured in Chart 3. The top panel of Chart 3 relates MlB growth to the growth of constant dollar GNP; the lower panel relates MlB growth to the rate of rise in the GNP deflator. The data are again grouped in the eight consecutive, nonoverlapping 3-year periods that com- prise the 1956-1979 period.
For each 3-year period, the top panel relates the average yearly percentage growth of MlB, which is
measured on the horizontal axis, to the average yearly percentage increase in constant dollar GNP, which is measured on the vertical axis. The lower panel relates average yearly MlB percentage growth, again measured on the horizontal axis, to the aver- age yearly percentage increase in the GNP price deflator, which is measured on the vertical axis. The chart shows that the long-run growth of constant dollar GNP or output is essentially independent of the rate of rise in MlB, while the rate of inflation is closely related to MlB growth. Again for conve- nience, regression equations fitting rates of rise of constant dollar GNP and the GNP deflator, respec- tively, to MlB growth are drawn in the appropriate
2 This statement is valid assuming full employment only at the start of the run. It need not be assumed at points in the run. What happens is that shortfalls in output growth during recessions are matched by output growth above full employment potential growth in recovery periods.
Chart 3
ANNUAL PERCENTAGE CHANGE OF Ml B
AND CONSTANT DOLLAR GNP FOR
3-YEAR NONOVERLAPPING PERIODS,
1956-79
ANNUAL PERCENTAGE CHANGE OF MlB
AND THE GNP DEFLATOR FOR
3-YEAR NONOVERLAPPING PERIODS.
1956-79
panels of Chart 3, and their relevant statistics pro- vided alongside.
Finally, because, as was earlier discussed, the rate of inflation changes in response to changes in money growth only with a lag, which in the post-Korean War period has averaged two years, we also have mapped, in Chart 4, the 1956-1979 3-year relation-
FEDERAL RESERVE BANK OF RICHMOND 13

ships of average yearly constant dollar GNP growth and the average yearly rate of rise in the GNP de- flator, respectively, against earlier average year-on- year MlB growth. This evidence confirms that in
the longer run, constant dollar GNP growth is un- affected by MlB growth. It also confirms that the rate of inflation is powerfully influenced by Ml B growth, and that, on average, changes in the rate of GNP inflation have lagged changes in MlB growth by about two years in the post-Korean War period.
In view of the evidence described and discussed above, it was a dreadful mistake to accelerate money growth beginning in October 1976. The question that is examined next is why the Federal Reserve
did this.
Late 1976 to Late 1979: What Went Wrong The acceleration of MlB growth that began in
October 1976 and led inexorably to the acceleration of inflation, and’ in turn to the recession that now afflicts the economy, does not appear to have resulted from a deliberate decision to accelerate money growth. The Federal Reserve’s targets for money
growth were not raised when the acceleration began. They were not raised later. What happened was not planned or even projected. However, given the Fed- eral Reserve’s policy, it was a predictable event. The acceleration of MlB growth that began in October
1976 was the predictable corollary of the Federal Reserve’s deemphasizing money supply control and placing more emphasis on resisting changes in inter- est rates beginning around April 1976.
Federal Reserve monetary policy is reviewed and determined roughly once a month by the System’s Open Market Committee. The Committee is com- prised of the seven members of the Board of Gover- nors of the Federal Reserve System and five of the twelve Reserve Bank presidents who, apart from the
president of the New York Reserve Bank, who serves as a permanent Open Market Committee member, serve in rotation. At its monthly or near-monthly
meetings, the Committee sets inter-meeting or im-
mediate targets for both money growth and the Fed- eral funds rate (see Glossary). These targets are
used to guide and constrain the manager of the System’s open market accounts in the New York Reserve Bank until the next Open Market Com- mittee meeting. From March 1975 through March 1976, the manager usually (12 out of 13 times) was directed to keep per year money growth within a
band 2½ to 4 percentage points wide and the Federal funds rate within a band 1 to 1¼ percentage points wide.
However, beginning in April 1976, the Open
Chart 4
ANNUAL PERCENTAGE CHANGE OF Ml B LAGGED 2 YEARS AND CONSTANT DOLLAR GNP
FOR 3-YEAR NONOVERLAPPING PERIODS, 1956-79
ANNUAL PERCENTAGE CHANGE OF MlB LAGGED 2 YEARS AND THE GNP DEFLATOR FOR 3-YEAR NONOVERLAPPING PERIODS,
Market Committee narrowed the band in which the manager was instructed to keep the Federal funds rate and widened the inter-meeting target range for
money growth. Thereby, the Committee deempha- sized control of the money supply as an operating goal and increased the importance of resisting inter- est rate movements. Money growth subsequently
14 ECONOMIC REVIEW, JULY/AUGUST 1981

emerged primarily as the incidental corollary of the Committee’s Federal funds interest rate goals. The pertinent policy record is presented in Table II.
The results of this mode of operating proved to be
unwelcome. Strong credit demands put upward pressure on the Federal funds rate almost contin- uously from April 1976 until early 1980. These pres- sures should have been allowed to dissipate by keep- ing money growth and hence spending on GNP goods and services from rising. Instead, they were fueled. Given its policy of resisting short-term changes in interest rates, the Federal Reserve was obliged to supply banks with increasing input of reserves. This input provided the base for accelerated money growth and ultimately resulted in faster inflation and weak- ness of the dollar on foreign exchange markets. With faster inflation, credit demands and interest rates rose higher and higher. The Federal funds rate climbed from a daily average of 4.82 percent in April 1976 to a daily average of 10.29 percent in June 1979.
In the summer of 1979, the rise of interest rates
became intolerably difficult to contain even between
Open Market Committee meetings. At its July 1979 meeting, the Open Market Committee set the inter- meeting Federal funds rate target at 9¾ to 10½ percent. However, it proved necessary to raise the upper limit to 10¾ percent before the August meet- ing. At its August meeting, market conditions com- pelled the Committee to set the inter-meeting Federal funds rate at 10¾ to 11¼ percent, but before the September meeting it became necessary to raise the
upper limit to 11½ percent. At the September Open
Market Committee meeting, conditions compelled
still another boost in the targeted range to 11¼ to
11¾ percent. By the end of September it was clear,
even inside the Federal Reserve, that interest rates
had not been kept from rising by focusing open mar-
ket operations on keeping them from rising, and sub- ordinating control of money growth to that end. A new approach was needed.
From October 6, 1979 Until November 1980 On October 6, 1979, the Open Market Committee an- nounced an historic change in the object and method of open market operations. First, control of the
growth of the monetary aggregates was made the primary object. Second, to achieve better control of the growth of the monetary aggregates, the Com- mittee shifted the method of open market operations “to an approach placing emphasis on supplying the volume of bank reserves estimated to be consistent with the desired rates of growth in monetary aggre- gates, while permitting much greater fluctuations in the Federal funds rate than heretofore.” Immedi- ately, the Committee instructed the Manager of the System’s open market account “to restrain expansion of bank reserves to a pace consistent with growth from September to December at an annual rate on the order of 4½ percent in Ml . . . . provided that in the period before the next regular meeting the Fed- eral funds rate remained generally within a range of 11½ to 15½ percent.”
Table II
SPREAD IN PERCENTAGE POINTS OF INTER-OPEN MARKET COMMITTEE MEETING
TARGET RANGES FOR Ml GROWTH AND THE FEDERAL FUNDS RATE
APRIL 1976 TO SEPTEMBER 1979
1976
Funds rate range
1977 1978 1979
Ml growth target range
1976 1977 1978 1979
January February
March April
May
June July
August September
October November December
. . . . 0.75 0.50 (1) . . . . 4 5.0 (1)
... .75 .50 (2) . . . . 4 5.0 4
... 1.00 .50 0.75 ... 4 4.0 4 0.75 .75 .75 .75 4.0 4 4.5 5
.75 .50 .50 .75 3.5 4 5.0 5
.50 .50 .50 (1) 4.0 4 5.0 (1) 1.00 .50 .25 .75 4.0 4 4.0 4
.50 .50 .50 .50 4.0 5 4.0 4
.75 .50 .50 .50 4.0 5 4.0 5
.75 .50 .50 . . . . 4.0 5 6.5 ...
.75 .50 .25 ____ 4.0 6 5.0 ...
.75 .50 .75 . . . . 4.0 6 4.0 ...
1 No meeting.
2 No range was specified. The Committee directed that the Federal funds rate be maintained “at about the current level (10 percent).”
FEDERAL RESERVE BANK OF RICHMOND
The Summary Records of the Committee’s meet- ings since October 6, 1979 display policy statements indicating a continuing commitment to achieving close control of the growth of the monetary aggre-
gates and considerable willingness to allow wide fluc- tuations in the Federal funds rate. The immediate or inter-meeting target range for the Federal funds
rate has been at least 4 percentage points wide and as much as 8½ percentage points wide in the period
since October 1979. In the case of money growth, the immediate target, which was expressed in terms of per annum growth of Ml until January 1980 and
MlB from then on, was specified-
l in October 1979 as “on the order of 4½ per- cent” for the September-December 1979 period,
l in November 1979 as “about 5 percent” for the November-December 1979 period,
l in January 1980 (there was no December 1979 meeting) as “between 4 and 5 percent” over the first quarter of 1980,
l in February 1980 as “(about 5 percent” over the first quarter,
l in March and April 1980 as “5 percent . . . or somewhat less” over the first half of 1980,
l in May 1980 as “7½ to 8 percent” until the
next meeting,
l in July 1980 (there was no June meeting) as “8 percent” until the next meeting, except that “in view of the shortfall in monetary growth over the first half of the year, moderately faster growth would be accepted if it developed in response to a strengthening in the public’s de- mand for money balances (i.e., falling velocity rates). . . .”, and
l in August 1980 as “9 percent” until the next
meeting.
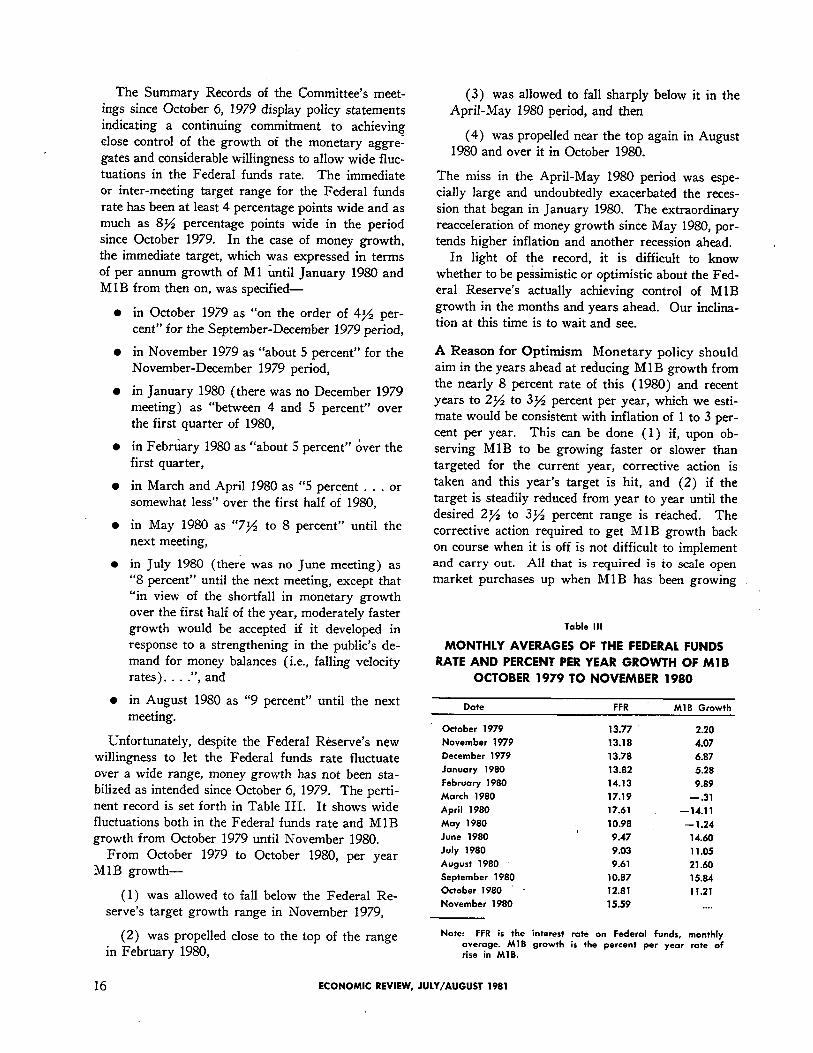
Unfortunately, despite the Federal Reserve’s new willingness to let the Federal funds rate fluctuate over a wide range, money growth has not been sta- bilized as intended since October 6, 1979. The perti- nent record is set forth in Table III. It shows wide
fluctuations both in the Federal funds rate and MlB growth from October 1979 until November 1980.
From October 1979 to October 1980, per year M1B growth-
(1) was allowed to fall below the Federal Re- serve’s target growth range in November 1979,
(2) was propelled close to the top of the range
in February 1980,
(3) was allowed to fall sharply below it in the
April-May 1980 period, and then
(4) was propelled near the top again in August 1980 and over it in October 1980.
The miss in the April-May 1980 period was espe- cially large and undoubtedly exacerbated the reces- sion that began in January 1980. The extraordinary reacceleration of money growth since May 1980, por-
tends higher inflation and another recession ahead. In light of the record, it is difficult to know
whether to be pessimistic or optimistic about the Fed-
eral Reserve’s actually achieving control of MlB growth in the months and years ahead. Our inclina- tion at this time is to wait and see.
A Reason for Optimism Monetary policy should aim in the years ahead at reducing MlB growth from the nearly 8 percent rate of this (1980) and recent years to 2½ to 3½ percent per year, which we esti- mate would be consistent with inflation of 1 to 3 per-
cent per year. This can be done (1) if, upon ob- serving MlB to be growing faster or slower than targeted for the current year, corrective action is
taken and this year’s target is hit, and (2) if the target is steadily reduced from year to year until the desired 2½ to 3½ percent range is reached. The corrective action required to get MlB growth back on course when it is off is not difficult to implement and carry out. All that is required is to scale open market purchases up when MlB has been growing
Table III
MONTHLY AVERAGES OF THE FEDERAL FUNDS
RATE AND PERCENT PER YEAR GROWTH OF MlB
OCTOBER 1979 TO NOVEMBER 1980
Date
October 1979 November 1979 December 1979 January 1980 February 1980
March 1980 April 1980
May 1980 June 1980 July 1980 August 1980 September 1980 October 1980 November 1980
FFR MlB Growth
13.77 2.20 13.18 4.07 13.78 6.87 13.82 5.28 14.13 9.89 17.19 -.31 17.61 - 14.11 10.98 -1.24 9.47 14.60 9.03 11.05 9.61 21.60
10.87 15.84 12.81 11.21 15.59 . . . .
Note: FFR is the interest rate on Federal funds, monthly average. MlB growth is the percent per year rate of rise in MlB.
16 ECONOMIC REVIEW, JULY/AUGUST 1981

too slowly, and down when it has been growing too fast, and to persist until it is brought back on track; if one scalar doesn’t work another will.
The saw-tooth pattern of MlB growth from Oc- tober 1979 to October 1980 described above provides some reason for believing that the Federal Reserve now takes its announced target for MIB growth seri- ously; that deviations engender responses designed to hit it. In December 1979, the Federal Reserve acted promptly to accelerate MlB growth because it had been growing too slowly in the October- November 1979 period. In March 1980, actions were
taken to slow money growth because it had grown too rapidly in the December 1979-February 1980
period. As a result of these actions, MlB growth
was stopped completely in March 1980; it actually fell $100 million. The following month, April 1980, it fell $4.6 billion. Measured from September 1979, MlB growth moved below the target range, in April 1980. It dropped even further below in May 1980. Once again, the Federal Reserve moved to change course. By June 1980, MlB was again growing rapidly and it continued to grow at very rapid rates in the July-November 1980 period. Now there are signs that the Federal Reserve is again moving to reduce MlB growth.
In summary, since October 1979, MlB growth has not been allowed to careen up and down for very long, as was the case in past years, and most recently from October 1976. to September 1979. This pro- vides a reason for optimism.
Reasons for Pessimism We would be more opti- mistic about the future if the Federal Reserve com-
pletely stopped trying to minimize short-run fluctu- ations in the Federal funds rate, and revised its regu-
lations with respect to the assessment of reserve requirements. Currently the assessment is delayed two weeks so that required reserves are matched against deposit liabilities of two weeks ago.
The events of 1980 show the damage that can be done, at least in the short run, by the combination of lagged reserve accounting and the setting of short- run ceilings and floors, no matter how far apart, for the Federal funds rate.
Beginning in late March the public suddenly and substantially increased its demand for coin and cur- rency vis-a-vis demand (checking) accounts. This was not an accident. Switching from checking ac- counts to currency was impelled by the higher costs of using credit cards that were imposed by new regu- lations that were issued by the Federal Reserve pur- suant to the President’s invoking of the Credit Con- trol Act of 1969 on March 14, 1980. Currency and
credit cards are easily and commonly used in dis-
charging on-the-spot payments obligations. Check- ing deposits are not so easily or commonly used for this purpose. As a result, deposits were drawn down, and banks were subjected to a loss of reserves which forced a sharp contraction of the money stock-i.e., negative money growth for a time. MlB fell $6.6 billion from the four weeks ending March 12, 1980
to the four weeks ending May 14, 1980, or at an annual rate of nearly 10 percent.3
No harm would have resulted, indeed the money
supply would have continued to grow, if the Federal Reserve had made open market purchases in suffi-
cient volume to replace the reserves that banks lost at this time because of the currency drain that re- sulted from the higher costs of using credit cards.
But until late May the Federal Reserve failed to re- place the reserves that were drained as a result of the imposition of credit controls. It did not supply replacement reserves because it was afraid that doing so would cause the Federal funds rate to fall precip-
a To capture the impact of the imposition of credit con- trols on the public’s demand for coin and currency, the 4-week moving average series of the public’s holdings of coin and currency measured as a percent of its checking deposits (including NOW accounts et al.) was regressed on an internally generated time scale for the period from the twenty-seventh week of 1979 to the eleventh week of 1980, just before the imposition of credit controls, and the values of the regression equation’s predictions were compared to actual 4-week moving average values of coin and currency expressed as a percent of checking deposits. The regression equation is-
Coin and currency as a percent of checking deposits =37.347+.0280 time scale
(.037)(.0017)
The standard error of the regression equation is .110 percent. data are seasonally adjusted.
Between the twenty-seventh week of 1979 and the eleventh week of 1980, just before credit controls were imposed, the value of the regression equation’s prediction of coin and currency measured as a percent of checking deposits averaged .02 percent less than the actual value. The two were never more than .23 percent apart. In the eleventh week of 1980, the predicted value was .08 percent below the actual value. In the fifteenth week, four weeks after credit controls were imposed, the predicted value was .19 percent higher than the actual value. In subse- quent weeks the gap widened to .30 percent, .46 percent, .86 percent, 1.06 percent, 1.18 percent, and 1.22 percent. This latter is more than eleven times larger than the regression’s standard error. The gap then drifted down to .85 percent, still nearly eight times larger than the standard error, in the twenty-seventh week of 1980-i.e., about the same time that credit controls were relaxed and eliminated. By the thirty-seventh week of 1980, the pre- dicted value was only .02 percent higher than the actual value and since then it has fallen below the actual value. In the forty-fifth week it was .37 percent less than the actual value.
The results strongly support the contention that the imposition of credit controls caused the public to sud- denly and substantially increase its demand for coin and currency relative to its demand for check money, thereby paving the way for the sharp contraction in the money supply which occurred last spring (1980).
FEDERAL RESERVE BANK OF RICHMOND 17

itously. As put by Federal Reserve Board Governor, Emmet J. Rice, in a New York City speech on
May 7, 1980-
With the aggregates registering growth sub- stantially below their target ranges, we could, of course, increase reserves by an amount sufficient to bring them within the announced target ranges. However, the increment in reserves necessary to achieve this could imply a federal funds rate that is far lower than seems prudent under present conditions.
Such a provision of reserves would run the risk of creating too much liquidity too soon. Moreover, it might be interpreted by market analysts as indicating an abrupt shift by the Federal Reserve towards monetary ease, possibly thereby encour- aging inflationary expectations.
Given its lagged reserve accounting system, the
Federal Reserve’s fear was not unfounded. In a two- week lagged reserve accounting regime, if deposits
fell two weeks ago, required reserves necessarily must fall this week. In turn, this means that if total re-
serves are increased this week or even kept un- changed from the total of two weeks ago, excess reserves will rise and cause a sharp drop in the Fed- eral funds rate. The banking system cannot easily eliminate excess reserves, but most banks with excess reserves will try to do so. Banks with excess reserves sell them in the Federal funds market, and the Fed- eral funds rate tends to fall with these sales.
Because the Federal Reserve chose to put a floor under the Federal funds rate, reserves were allowed
to fall and M1B growth became negative (-10 per- cent per year) in the mid-March to May 1980 period. This greatly aggravated the recession then underway. It need not have happened. It wouldn’t have hap- pened if the Federal Reserve had not put a floor under the Federal funds rate at the time and focused on controlling MlB growth.
The Federal Reserve also continues to set ceilings
on the Federal funds rate and keeps the discount rate
below market interest rates when market rates are rising. In combination with lagged reserve account- ing, the ceilings often produce explosive money growth. This is because, in periods when the econ- omy and deposits are growing, the Federal Reserve, to avoid reserve deficiencies and increases in interest rates, provides new reserves regardless of the impli- cations for money growth. The June-November 1980 period shows that explosive money growth can result if this is done, despite the best intentions. As stated by Federal Reserve Board Governor, Lyle E. Gram- ley, in a Denver, Colorado speech on July 17, 1980-
. . . during the earlier phase of economic recoveries, growth in supplies of money and credit has often begun to accelerate because the Federal Reserve
did not let credit markets tighten sufficiently while unemployment and excess capacity were still rela- tively high. That is the mistake we must be par- ticularly careful to avoid when the current reces- sion bottoms out and recovery begins again.
The record shows that the same mistake was made again this year. In the six months ending in No- vember 1980, MlB grew at an annual rate of 15 per- cent, the highest in any six-month period since World War II. And the events of the past 25 years warn, in turn, that explosive money growth results in time in the acceleration of inflation, elevation of the Fed- eral funds rate ceiling, and recession.
Conclusion Clearly, it would help in the manage- ment of M 1B growth if the Federal Reserve did not
subordinate achievement of planned MlB growth to minimizing fluctuations in the Federal funds rate (or in the value of the dollar on foreign exchange mar-
kets) even for a week or a day. Widening of the Federal funds rate control band, as was done begin- ning in October 1979, is not enough. When the Fed- eral funds rate is bumping the top of the control band, it doesn’t matter whether the interval from the top of the band to the bottom is one percentage point or eight. What matters is that the Federal funds rate is not allowed to rise any further, or alternatively, pressure on the Federal funds rate is relieved by keeping the discount rate constant and the discount
window open wide. As a result, the input of reserves, whether through open market purchases or discount- ing, must be accelerated. In turn, this accelerates money growth. The end results are faster inflation and, ironically, even higher interest rates than would
occur if there were no Federal funds rate control band whatever.
In the same way, when the Federal funds rate is pressing the floor of the control band, it doesn’t
matter how high the top of the control band is. Pre- venting the floor from being broken requires slowing
MlB growth, and the end result is recession and lower interest rates than would occur in the absence
of any Federal funds rate constraint.
It also would help in the management of MlB growth if required reserves were matched against current deposit liabilities. In this case the Federal Reserve could supply or withdraw reserves consistent with achieving its money growth plans without hav- ing to worry about creating excess reserves or a reserve deficiency, and thereby providing pressure for sharp changes in the Federal funds rate. The Report from which this article is extracted empha- sizes the importance of achieving close continuing control of MlB growth.
18 ECONOMIC REVIEW, JULY/AUGUST 1981

GLOSSARY
Money - Money is defined conventionally, as the dollar quantity of exchange media.
Measures of the supply of exchange media:
MI - Ml was used to measure the supply of exchange media until 1980. It was comprised of (1) checkable (demand) deposit liabilities of commercial banks other than domestic interbank and U. S. Government less cash items in the process of collection and Federal Reserve float; (2) foreign demand deposits in Federal Reserve Banks ; and (3) coin and currency outside the Treasury, Federal Reserve Banks, and vaults of commercial banks. In essence, Ml measured holdings by the public (other than commercial banks), and by state and local governments, and foreign banks and official institutions of demand deposits in commercial banks, coin and cur- rency, and foreign demand deposits in Federal Reserve Banks.
MIA - MlA is one of the two measures which the Federal Reserve adopted in 1980 to replace Ml in measuring the supply of exchange media. MlA equals Ml less the demand deposits of for- eign banks and official institutions. Through 1979, year-to-year percentage changes of Ml A tracked those of Ml except in 1959 when, following the restoration of convertibility of pounds and francs into dollars, there was a large input of demand deposits by foreign banks.
M1B - MlB is the other measure adopted in 1980 to replace Ml. MlB equals MlA plus auto- mated transfer service and negotiable order of withdrawal accounts and other checkable de- posits in depository institutions, including commercial banks, credit unions, savings and loans, and mutual savings banks.
Federal funds rate-The Federal funds rate is the interest rate charged on inter-bank loans. Banks short of reserves can and do borrow from banks with excess reserves. Usually the loans are repaid the next business day. Because the funds involved are deposits in Federal Reserve Banks, they are called Federal funds, and the interest rate on transactions of Federal funds is called the Federal funds rate.
Monetary or current dollar GNP - The current dollar value of Gross National Product is the eco- nomic cost of producing the nation’s output in a given year plus certain adjustments. cifically, it equals the year’s sum of
Spe-
l wages, salaries and supplements,
l corporate profits (before taxes),
l rental income,
l net interest, and
l proprietary income;
l plus business transfers, indirect business taxes, subsidies less surpluses accruing to government enterprises, and depreciation allowances.
Constant dollar or real GNP-Real GNP is the inflation-adjusted or deflated value of current dollar GNP.
GNP deflator-This is the price measure used in this article. The GNP deflator is the index of the prices of all the goods and services that make up the Gross National Product. It is used instead of the Consumers’ Price Index because it measures the inflation rate for domestically produced goods and services. marginally.
The prices of imports, including oil, affect it only indirectly and Using the GNP deflator allows us to focus on inflation born and bred here at
home. In addition, consistency with using constant dollar GNP to measure the nation’s pro- duction or output requires its use.
Velocity - Velocity is simply the dollar value of GNP divided by stock of money however defined. Every monetary aggregate has its own velocity. MlB’s velocity equals the average dollar value of GNP in a given period divided by the average amount of MlB outstanding in the same period.
FEDERAL RESERVE BANK OF RICHMOND 19