the mantle beneath the slave craton (canada): composition and
TRANSCRIPT
The Mantle beneath the Slave Craton (Canada):
Composition and Architecture
Suzanne Y. O'Reilly1, W.L. Griffin1,2, Yvette Poudjom Djomani1, L.M. Natapov1, N.J. Pearson1,
R.M. Davies1, B.J. Doyle3 and K. Kivi4
1. GEMOC ARC National Key Centre, Department of Earth and Planetary Sciences, Macquarie
University, NSW 2109, Australia (www.es.mq.edu.au/GEMOC/)2. CSIRO Exploration and Mining, North Ryde, NSW 2113, Australia3 Kennecott Canada Exploration Ltd., Vancouver, B.C., Canada4 Kennecott Canada Exploration Ltd., Thunder Bay, Ontario, Canada
Introduction
The Slave Province in Canada is a natural laboratory for the integration of geochemical, tectonic
and geophysical data to map major lithospheric domains. The Slave craton is a small Archean nucleus
within the larger North American craton. We have used robust geochemical methods based on mantle-
derived xenoliths, heavy mineral concentrates from over 25 kimberlite intrusions, and representative
diamond populations and their inclusions to construct rock-type sections of the lithospheric mantle that
delineate the composition, structure and thermal state of the lithospheric mantle across the Slave Craton
and in particular detail beneath the Lac de Gras region. Global compilations of topography and gravity
data allow the examination of geological patterns at a regional scale, and have allowed us to map
variations in the gravity/topography relationships across the Slave Province. In so doing, we delineate
discrete tectonic domains within the Slave Province, areas with similar thermal and mechanical
properties for the crust and uppermost mantle sections.
Geochemical results: composition and structure
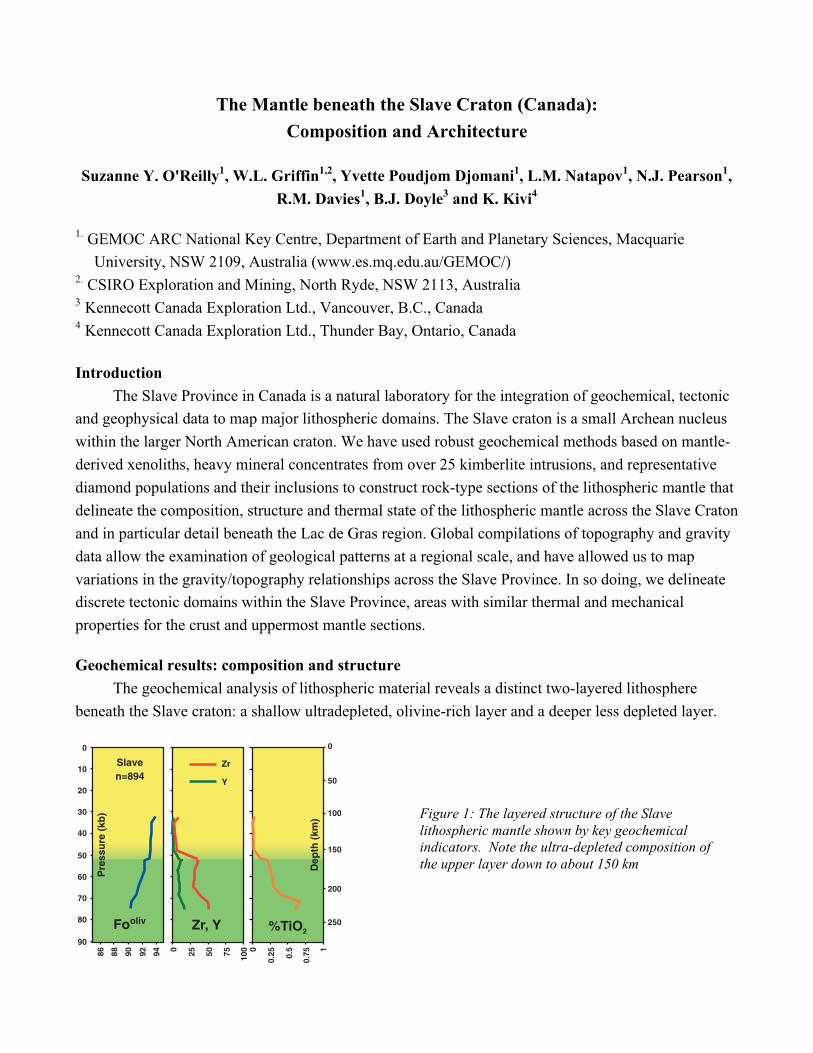
The geochemical analysis of lithospheric material reveals a distinct two-layered lithosphere
beneath the Slave craton: a shallow ultradepleted, olivine-rich layer and a deeper less depleted layer.
Pre
ssu
re (
kb)
0
10
20
30
40
50
60
70
80
90
Slaven=894
86 88 90 92 94
Fooliv
0 25 50 75 100
Y
Zr
Zr, Y
10
0.25 0.
5
0.75
Dep
th (
km)
50
100
150
200
250
0
%TiO2
Figure 1: The layered structure of the Slavelithospheric mantle shown by key geochemicalindicators. Note the ultra-depleted composition ofthe upper layer down to about 150 km
The two layers are separated by a sharp boundary at 140-150 km depth that is clearly defined by
several geochemical parameters including olivine composition and the Zr, Y and Ti contents of
garnets from mantle peridotites (Fig 1); the lithosphere-asthenosphere boundary lies at 200-220 km
depth. Xenolith data and garnet compositions indicate that the shallow layer is more magnesian (Fo
92-94) than the deeper layer (Fo 91-92), and both layers are more olivine-rich than average South
African or Siberian Archean peridotite xenoliths. Relative abundances of garnet types indicate that the
shallow layer consists of ≈60% (clinopyroxene-free) harzburgite and 40 % highly depleted lherzolite,
while the deeper layer contains 15-20% harzburgite and 80-85% lherzolite, most of which is relatively
less depleted. Temperature estimates on eclogite xenoliths show that all were derived from the deeper
layer. High-Ca, Al eclogites are concentrated near the bottom of the section, and are the source of
most of the dominant eclogite-paragenesis diamonds (Pearson et al., 1999; Davies et al., 1999).
Paleogeotherms derived from both xenoliths and concentrates lie near a 35 mW/m2 conductive model
at T ≤900 °C, and near a 38 mW/m2 model at higher T, implying a marked change in thermal
conductivity near the major lithosphere boundary, and/or a thermal transient.
The two-layered structure extends over an area of ≥9000 km2, from south of Lac de Gras to the
Ranch Lake pipe. In the southern, northern and western parts of the craton, the deeper layer appears
to rise to depths of ≤100 km and the ultradepleted upper layer is absent or thinned. Lithospheric
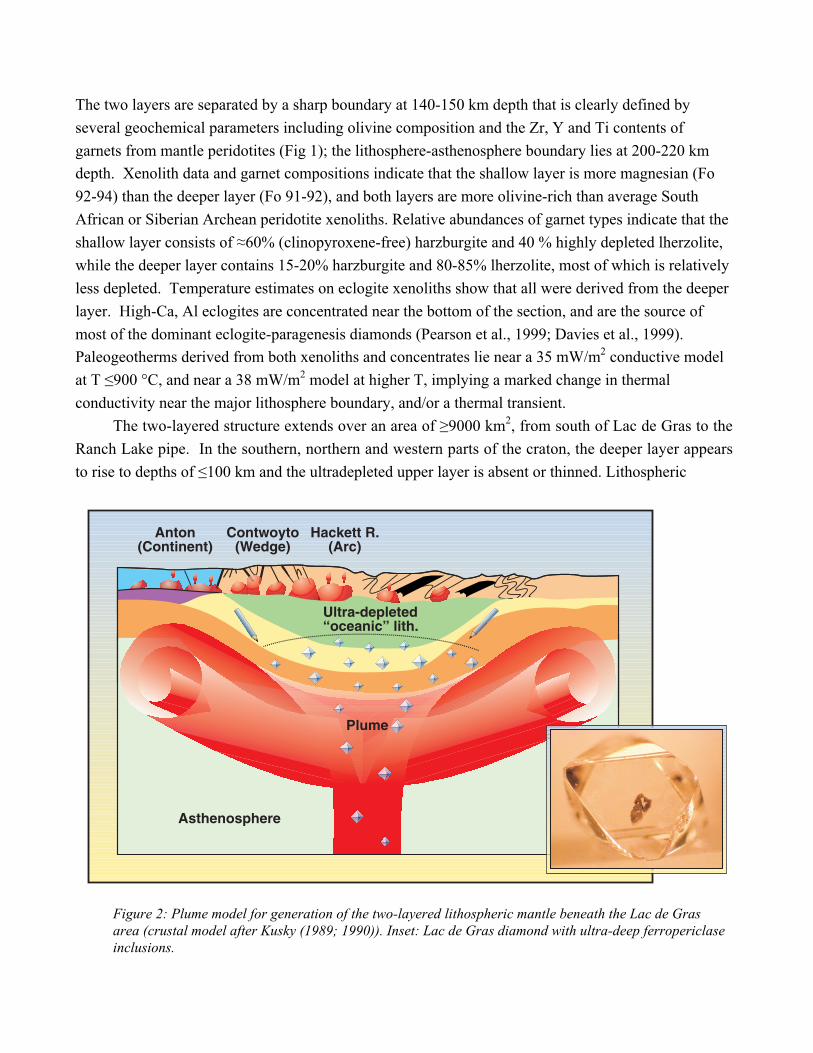
Anton(Continent)
Contwoyto(Wedge)
Hackett R.(Arc)
Asthenosphere
Ultra-depleted“oceanic” lith.
Plume
Figure 2: Plume model for generation of the two-layered lithospheric mantle beneath the Lac de Grasarea (crustal model after Kusky (1989; 1990)). Inset: Lac de Gras diamond with ultra-deep ferropericlaseinclusions.
mantle of typical Proterozoic character is sampled by the Torrie and Jericho pipes (eg Kopylova et al.,
1998), and may reflect Proterozoic rifting associated with the Kilohigok Basin. Similar mantle is
found further north on Victoria Island, and on the SW margin of the craton; the latter may reflect
Proterozoic reworking.
Griffin et al. (1999) interpreted the lower layer as plume material accreted from the lower
mantle (Fig. 2). This interpretation is consistent with the recognition that a high proportion of the
diamonds contain evidence of an ultra-high pressure (lower-mantle) origin, in the form of inclusions
of ferropericlase, Ca- and Mg-silicate perovskite and majoritic garnet (Davies et al., 1999). Some
eclogites may have been part of this mantle plume but the more calcic varieties may have been
emplaced near the base of the cratonic root during Proterozoic subduction events (Wopmay orogen).
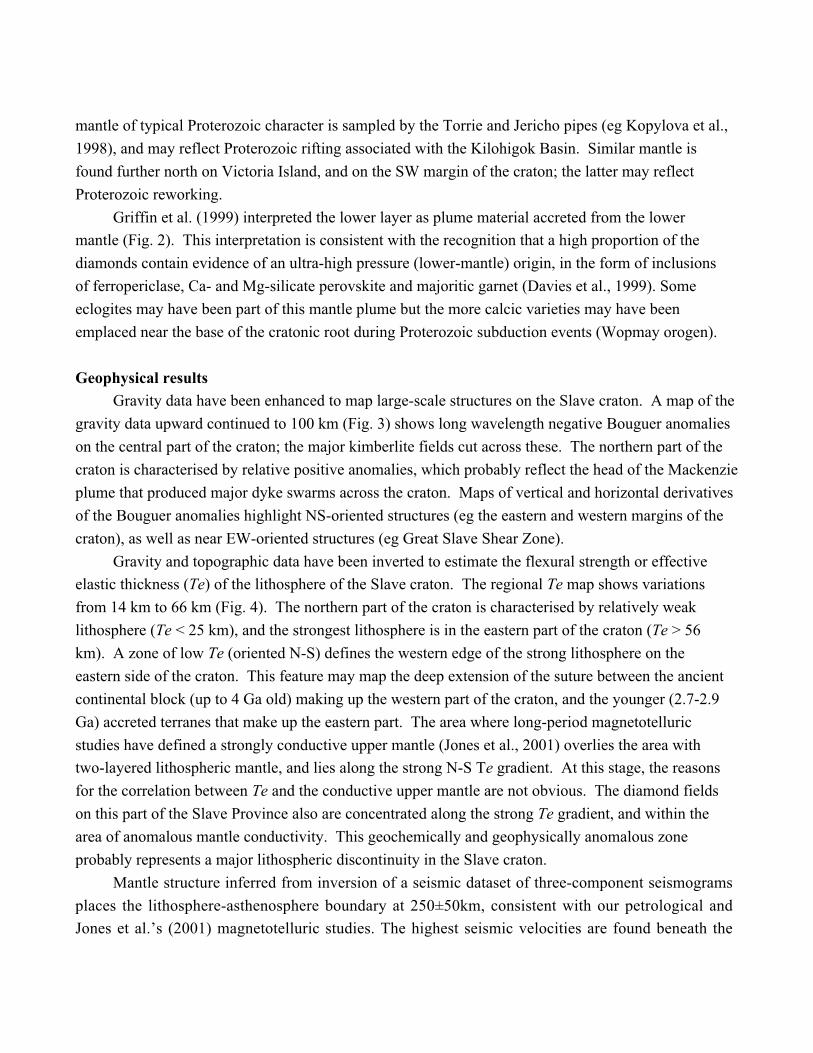
Geophysical resultsGravity data have been enhanced to map large-scale structures on the Slave craton. A map of the
gravity data upward continued to 100 km (Fig. 3) shows long wavelength negative Bouguer anomalies
on the central part of the craton; the major kimberlite fields cut across these. The northern part of the
craton is characterised by relative positive anomalies, which probably reflect the head of the Mackenzie
plume that produced major dyke swarms across the craton. Maps of vertical and horizontal derivatives
of the Bouguer anomalies highlight NS-oriented structures (eg the eastern and western margins of the
craton), as well as near EW-oriented structures (eg Great Slave Shear Zone).
Gravity and topographic data have been inverted to estimate the flexural strength or effective
elastic thickness (Te) of the lithosphere of the Slave craton. The regional Te map shows variations
from 14 km to 66 km (Fig. 4). The northern part of the craton is characterised by relatively weak
lithosphere (Te < 25 km), and the strongest lithosphere is in the eastern part of the craton (Te > 56
km). A zone of low Te (oriented N-S) defines the western edge of the strong lithosphere on the
eastern side of the craton. This feature may map the deep extension of the suture between the ancient
continental block (up to 4 Ga old) making up the western part of the craton, and the younger (2.7-2.9
Ga) accreted terranes that make up the eastern part. The area where long-period magnetotelluric
studies have defined a strongly conductive upper mantle (Jones et al., 2001) overlies the area with
two-layered lithospheric mantle, and lies along the strong N-S Te gradient. At this stage, the reasons
for the correlation between Te and the conductive upper mantle are not obvious. The diamond fields
on this part of the Slave Province also are concentrated along the strong Te gradient, and within the
area of anomalous mantle conductivity. This geochemically and geophysically anomalous zone
probably represents a major lithospheric discontinuity in the Slave craton.
Mantle structure inferred from inversion of a seismic dataset of three-component seismograms
places the lithosphere-asthenosphere boundary at 250±50km, consistent with our petrological and
Jones et al.’s (2001) magnetotelluric studies. The highest seismic velocities are found beneath the
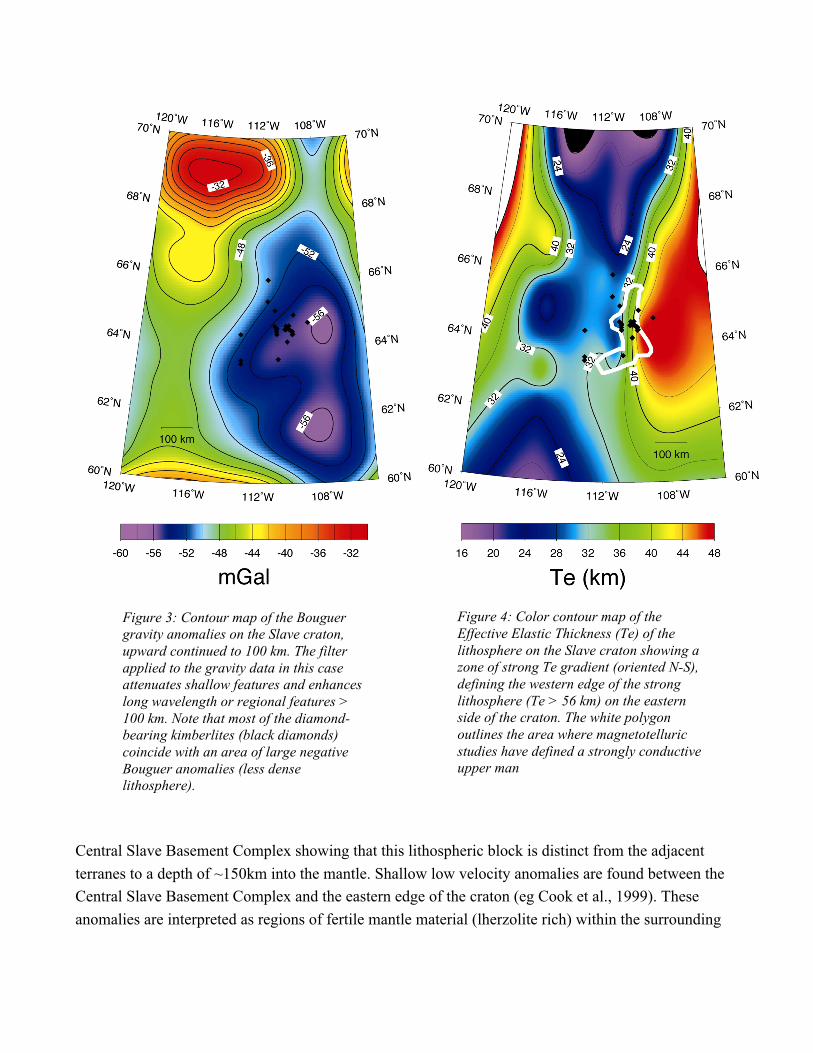
Figure 3: Contour map of the Bouguergravity anomalies on the Slave craton,upward continued to 100 km. The filterapplied to the gravity data in this caseattenuates shallow features and enhanceslong wavelength or regional features >100 km. Note that most of the diamond-bearing kimberlites (black diamonds)coincide with an area of large negativeBouguer anomalies (less denselithosphere).
Figure 4: Color contour map of theEffective Elastic Thickness (Te) of thelithosphere on the Slave craton showing azone of strong Te gradient (oriented N-S),defining the western edge of the stronglithosphere (Te > 56 km) on the easternside of the craton. The white polygonoutlines the area where magnetotelluricstudies have defined a strongly conductiveupper man
Central Slave Basement Complex showing that this lithospheric block is distinct from the adjacent
terranes to a depth of ~150km into the mantle. Shallow low velocity anomalies are found between the
Central Slave Basement Complex and the eastern edge of the craton (eg Cook et al., 1999). These
anomalies are interpreted as regions of fertile mantle material (lherzolite rich) within the surrounding
harzburgitic lithosphere. No xenolith data are so far available from this area that could be used to test
this interpretation.
Jaupart et al. (1998) used heat flow and radioactive heat production data to estimate the crustal
heat production and the mantle heat flow on the Canadian shield. Their results give an average mantle
heat flow of 13mW/m2 on the craton. Considering a thermally stable lithosphere, this heat flow value
requires a compositionally defined lithosphere to be less than 240 km thick.
Summary and global context
The mantle lithosphere beneath the Lac de Gras area has a structure and composition that are
unique within our limited knowledge of Archean mantle sections, which currently is dominated by
studies of xenoliths from the Kaapvaal craton and from the Udachnaya kimberlite pipe in Siberia.
However, the strongly layered structure seen in the Slave Craton lithospheric mantle is also observed
in other regions where ultra-deep diamond inclusions have been documented (eg Gawler craton,
southern Australia and the Limpopo Belt, southern Africa). This emerging evidence of sub-cratonic
lithosphere showing both layering and the presence of ultra-deep diamonds may indicate a globally
repetitive mechanism of growth for some lithospheric mantle regions by plume subcretion.
References
Bostock, M.G., 1998. Mantle stratigraphy and evolution of the Slave province, J. Geophys. Res., 103, 21183-21200.
Cook, F.A., A.J. van der Velden, K.W. Hall and B.J. Roberts, 1999. Frozen subduction in Canada’s Northwest territories:
Lithoprobe deep lithospheric reflection profiling of the western Canadian shield, Tectonics, 18(1), 1-24.
Davies, R.M., Griffin, W.L., Pearson, N.J., Andrew, A.S., Doyle, B.J. and O'Reilly, S.Y., 1999. Diamonds from the deep:
pipe DO-27, Slave Craton, Canada Proceedings 7th International Kimberlite Conference, Cape Town, Red Roof Design,
Cape Town. Volume 1, 148-155.
Griffin, W.L., B.J. Doyle, C.G. Ryan, N.J. Pearson, S.Y. O’Reilly, R.M. Davies, K. Kivi, E. van Achterbergh and L.M.
Natapov, 1999a. Layered mantle lithosphere in the Lac de Gras area, Slave Craton: Composition, Structure and
Origin. Jour. Petrol., 40, 705-727.
Griffin, W.L., B.J. Doyle, C.G. Ryan, N.J. Pearson, S.Y. O’Reilly, L. Natapov, K. Kivi., U. Kretschmar and J. Ward,
1999b. Lithosphere Structure and Mantle Terranes: Slave Craton, Canada. Proc. 7th Int. Kimberlite Conf., Red Roof
Design, Cape Town, volume 1, pp. 299-306.
Jaupart, C., J.C. Mareschal, L. Guillou-Frottier, and A. Davaille, 1998. Heat flow and thickness of the lithosphere in the
Canadian shield, J. Geophys. Res., 103, 15269-15286.
Jones A.G., Ferguson I.J., Chave A.D., Evans R.L. and McNeice G.W., 2001, The electric lithosphere of the Slave Craton.
Geology, 29, 423-426.
Kopylova, M.G., J.K. Russell and H. Cookenboo, 1998. Upper-mantle stratigraphy of the Slave craton, Canada: insights
into a new kimberlite province, Geology, 26, 315-318.
Kusky, T.M., 1989. Accretion of Archean Slave Province, Geology, 17, 63-67.
Kusky, T.M., 1990. Evidence for Archean ocean opening and closing in southern Slave Province, Tectonics, 9, 1533-
1566.