the manitowoc company, inc.€¦ · led by proven executive management team company overview....
TRANSCRIPT

September 10, 2019 Las Vegas, NVDave Antoniuk – SVP & Chief Financial Officer
Ion Warner – VP, Marketing & Investor Relations
The Manitowoc Company, Inc.

2
Forward- Looking Statements
Safe Harbor StatementAny statements contained in this presentation that are not historical facts are “forward-looking statements.” These statements are based on the current expectations of the management of the company, only speak as of the date on which they are made, and are subject to uncertainty and changes in circumstances.
We undertake no obligation to update or revise forward-looking statements, whether as a result of new information, future events, or otherwise. Forward-looking statements include, without limitation, statements typically containing words such as “intends,” “expects,” “anticipates,” “targets,” “estimates,” and words of similar import. By their nature, forward-looking statements are not guarantees of future performance or results and involve risks and uncertainties because they relate to events and depend on circumstances that will occur in the future.
There are a number of factors that could cause actual results and developments to differ materially from those expressed or implied by such forward-looking statements. For a list of factors that could cause actual results to differ materially from those discussed or implied, please see the company’s periodic filings with the SEC, particularly those disclosed in “Risk Factors” in the company’s Form 10-K for the fiscal year ended December 31, 2018. Any “forward-looking statements” in this presentation are intended to qualify for the safe harbor from liability under the Private Securities Litigation Reform Act of 1995.
Non-GAAP MeasuresThe company uses certain non-GAAP measures in discussing the company’s performance. The company believes that these non-GAAP financial measures provide important supplemental information to both management and investors regarding financial and business trends used in assessing its results of operations; however, these measures are not substitutes for GAAP financial measures. The reconciliation of those measures to the most comparable GAAP measures is detailed in Manitowoc’s press release for the second-quarter of 2019, which is available at www.manitowoc.com, together with this presentation.
3
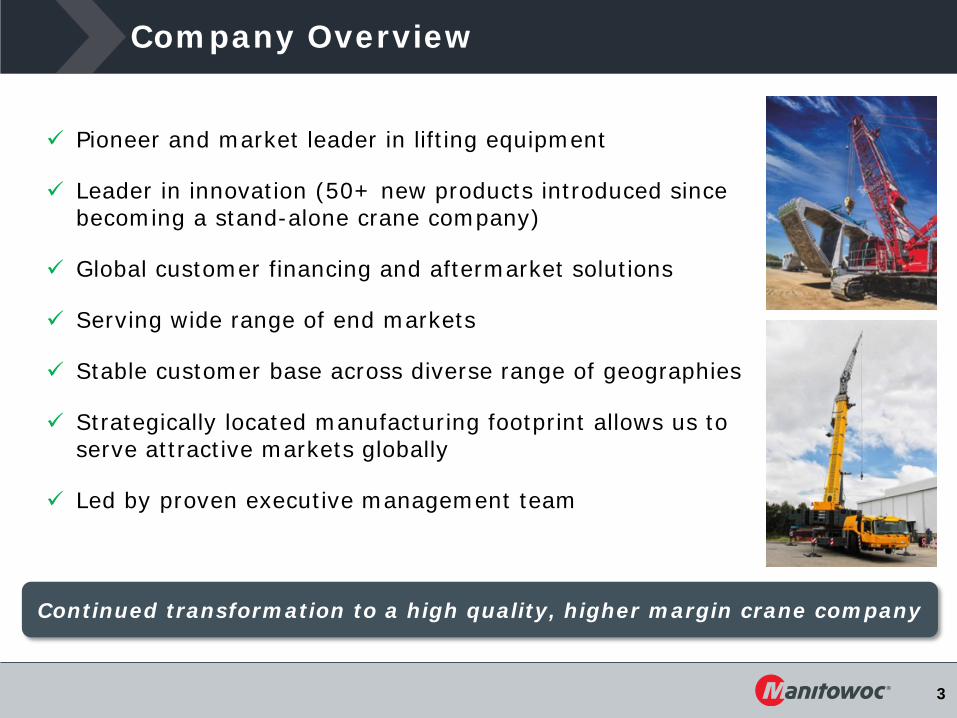
Pioneer and market leader in lifting equipment
Leader in innovation (50+ new products introduced since becoming a stand-alone crane company)
Global customer financing and aftermarket solutions
Serving wide range of end markets
Stable customer base across diverse range of geographies
Strategically located manufacturing footprint allows us to serve attractive markets globally
Led by proven executive management team
Company Overview
Continued transformation to a high quality, higher margin crane company

4
Leading Brands in every category
Lattice crawlers
Tower cranes
Rough-terraincranes
Boom Trucks / Industrial
cranes
All-terraincranes
Truck-mountedcranes
Telescoping crawler cranes

5
Aftermarket Business
~144,000Global CraneInstalled Base
Highly differentiated global aftermarket solutions and services
6
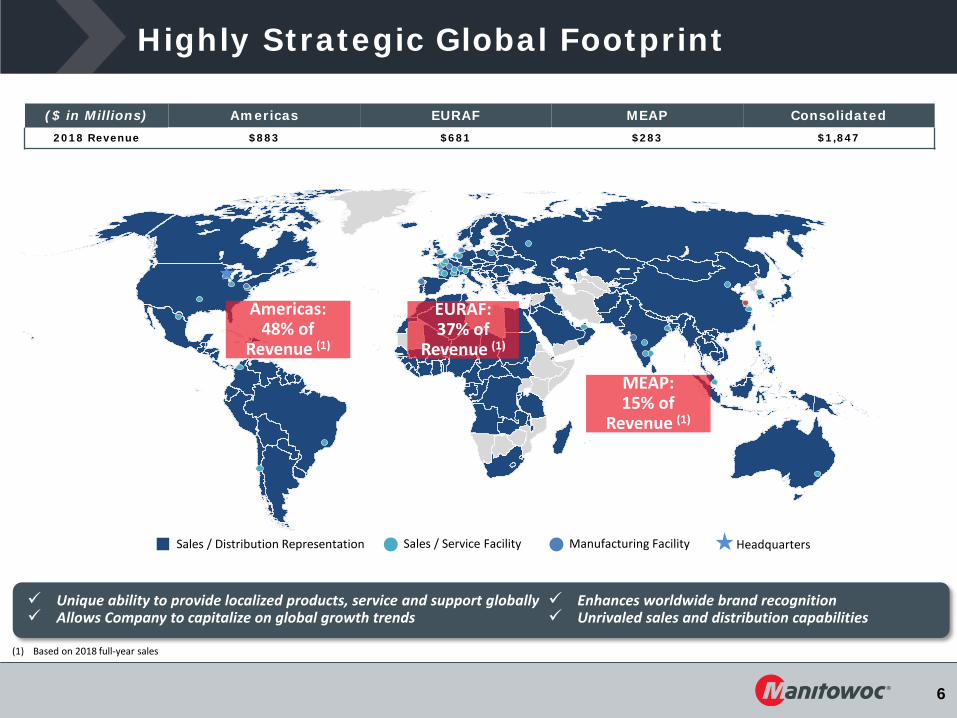
Enhances worldwide brand recognition Unrivaled sales and distribution capabilities
Highly Strategic Global Footprint
MEAP:15% of
Revenue (1)
EURAF: 37% of
Revenue (1)
Americas: 48% of
Revenue (1)
Sales / Distribution Representation Manufacturing FacilitySales / Service Facility Headquarters
($ in Millions) Americas EURAF MEAP Consolidated2018 Revenue $883 $681 $283 $1,847
Unique ability to provide localized products, service and support globally Allows Company to capitalize on global growth trends
(1) Based on 2018 full-year sales

7
The Manitowoc Way
Customers
Shareholders Employees
VelocityInnovation
1. Margin Expansion
2. Growth
3. Innovation
4. Velocity

8
Strategic Priorities
• Strengthen channel management• Increase market share• Aftermarket margin expansion using new tools• Refinance debt to enable financial flexibility
• Optimize global capacity • Increase manufacturing agility• Improve productivity• Pricing to offset material cost increases
• Implement VOC process in new product development• Leverage advanced manufacturing technologies & techniques
Margin Expansion
Growth
Innovation
Velocity• Implement The Manitowoc Way• Re-invigorate the Company culture• Strengthen balance sheet by better working capital mgmt.

9
State of the Business
Managing through the Crane Cycle• Greater agility to maximize the peak while mitigating trough cycles
• Continually drive operational improvements
Renewed Focus on Quality and Reliability• Embed quality prior to new product delivery
• Winning back customers
Well Accepted New Products• Voice of the Customer mindset
• Continue NPD pipeline Six new products at 2019 bauma trade show
Balance Sheet Focus• Sufficient liquidity – Recapitalized debt structure
• Cash flow focus
14% CAGR in 2018 adjusted EBITDA on $20M less revenue from 2015

10
9.9x
26.9x
22.3x
5.1x 3.7x 3.0x 2.7x 2.5x 2.3x 2.7x 2.2x
Q4 2016 Q1 2017 Q2 2017 Q3 2017 Q4 2017 Q1 2018 Q2 2018 Q3 2018 Q4 2018 Q1 2019 Q2 2019
Gross Leverage Ratio
Improving Financial Performance
Gross leverage ratio= (ST Debt + LT Debt)/ TTM Adjusted EBITDA
-6.0%
-4.0%
-2.0%
0.0%
2.0%
4.0%
6.0%
8.0%
10.0%
12.0%
$-
$100
$200
$300
$400
$500
$600
Q1 2016 Q2 2016 Q3 2016 Q4 2016 Q1 2017 Q2 2017 Q3 2017 Q4 2017 Q1 2018 Q2 2018 Q3 2018 Q4 2018 Q1 2019 Q2 2019
Revenue & Adjusted EBITDA % by Quarter
Revenue Adj EBITDA %
$(1.50)
$(1.00)
$(0.50)
$-
$0.50
$1.00
$1.50
Q12016
Q22016
Q32016
Q42016
Q12017
Q22017
Q32017
Q42017
Q12018
Q22018
Q32018
Q42018
Q12019
Q22019
Adjusted Diluted Earnings Per Share by Quarter
$-
$100
$200
$300
$400
$500
$600
$700
$-
$100
$200
$300
$400
$500
$600
$700
$800
Q12016
Q22016
Q32016
Q42016
Q12017
Q22017
Q32017
Q42017
Q12018
Q22018
Q32018
Q42018
Q12019
Q22019
Ord
ers
Back
log
Backlog & Orders by Quarter
Ending Backlog Orders
11
www.manitowoc.com