the management of the logistical supply chain drivers in
TRANSCRIPT
i
The management of the logistical supply chain drivers in
Sowetan small businesses
by
Themari Eicker
submitted in accordance with the requirements for the degree of
Master of Commerce
in the subject of
Business Management
at the
University of South Africa
Supervisor: Dr JO Cilliers
October 2016

ii
Declaration
I declare that this dissertation entitled “The management of the logistical supply chain drivers in
Sowetan small businesses” is my own work and that all the sources I have used or quoted have
been indicated and acknowledged by means of complete references. I further declare that I have
not submitted this work, or part of it, for examination at Unisa for another qualification or at any
other higher education institution.
21/10/2016
SIGNATURE (Ms Themari Eicker)
DATE

iii
Acknowledgements
Before I thank the following people for their support and assistance in completing my dissertation,
I would like to thank God for giving me the capability, courage and strength to complete my study.
My supervisor, Dr Orpha Cilliers, not only were you my supervisor and mentor, but you have also
become a close friend. Thank you for always having an open door and allowing me to pop in and
out of your office whenever I had a question. You went above and beyond to assist me throughout
this process. You always encouraged me to perform to the best of my abilities. I can only hope to
follow in your footsteps.
Dr Marthi Pohl, thank you for the assistance with the statistical aspect of my dissertation. Thank
you for your patience and willingness to explain concepts to me. I have learned so much from you.
Dr Chrissie Steyn, thank you for the excellent editing and willingness to read my dissertation
numerous times. I appreciate your hard work.
My colleagues and friends, Alicia, Elsabe, Nadia and Adele thank you for lending me your ears. You
were always prepared to listen and give advice when I needed it.
Lastly, and most importantly, my family - Ma, Pa, Albie and Ursula, you were my pillars during this
process. The love and support that you have shown me during this process is indescribable. Thank
you for listening, supporting and encouraging me. I am blessed to have you in my life. I love you
with my whole heart.

iv
Abstract:
The performance of small businesses contribute substantially to the South African economy. In
recent years the South African Government has prioritised the development of township retail
industries by implementing numerous initiatives. The primary objective of this study was to
determine how formal independent small retail businesses in Soweto manage their logistical
supply chain drivers, namely facilities, inventory and transportation, in terms of responsiveness
and cost-efficiency in order to survive. The logistical supply chain drivers should not only be
managed as a cohesive unit, but also be aligned with the orientation of the selected supply chain
strategy, in terms of responsiveness and cost-efficiency. During 2014, a quantitative survey was
conducted among 650 formal independent small Sowetan businesses of which the responses of
556 retailers were analysed in terms of responsiveness and cost-efficiency. The study also
investigated the role of the relevant industry group in the management of the logistical supply
chain drivers by the business owners. The data was analysed and tested by the Kruskal-Wallis test,
the Pearson Chi-square test and factor analyses were performed. Two binary logistic regression
models were developed to determine the influence of the management of the logistical supply
chain drivers on the small retailers’ odds of survival. The results showed that the small retailers
manage facilities and inventory focused more towards responsiveness, whereas transportation is
managed focused on either cost-efficiency or responsiveness. The study concluded that age and
growth in income can predict the odds of survival for small businesses.
Keywords:
Responsiveness, cost-efficiency, logistical supply chain drivers, facilities, inventory, transportation
small retailers, Soweto, townships.
v
Contents
Chapter 1 .............................................................................................................................................. 1
Introduction to the study ..................................................................................................................... 1
1.1 Introduction .............................................................................................................................. 1
1.2 Background: SCM key concepts related to this study .............................................................. 1
1.2.1 A generic supply chain ....................................................................................................... 2
1.2.2 The different supply chain members within a generic Sowetan retail supply chain ........ 3
1.2.2.1 The focal business ..................................................................................................... 3
1.2.2.2 The downstream customers ...................................................................................... 4
1.2.2.3 The upstream suppliers ............................................................................................. 4
1.2.3 The influence of business strategies on supply chain management ................................. 5
1.2.3.1 The different strategic levels .................................................................................... 6
1.2.3.2 The different strategic levels of a small business ..................................................... 6
1.2.3.3 Responsive and cost-efficient supply chain strategies ............................................. 7
1.3 Problem statement ................................................................................................................... 9
1.4 Research objectives ................................................................................................................ 14
1.5 Research methodology ........................................................................................................... 15
1.5.1 Phase one: literature study ............................................................................................. 15
1.5.2 Phase two: empirical research......................................................................................... 16
1.5.2.1 Research design ....................................................................................................... 16

vi
1.5.2.2 Questionnaire and pre-testing ................................................................................ 16
1.5.2.3 Survey population and data collection .................................................................... 17
1.5.2.4 Data analysis ............................................................................................................ 18
1.6 Contribution of the study ........................................................................................................ 20
1.7 Outline of the chapters ........................................................................................................... 20
Chapter 2 ............................................................................................................................................ 23
Selecting appropriate competitive and supply chain strategies ....................................................... 23
2.1 Introduction ............................................................................................................................ 23
2.2 Achieving a strategic fit between a competitive strategy and a supply chain strategy ........ 24
2.3 Competitive advantage and competitive strategies ............................................................... 26
2.3.1 Porter’s generic competitive strategy framework .......................................................... 27
2.3.2 Porter’s three competitive strategies .............................................................................. 28
2.3.3 The focus competitive strategy ....................................................................................... 30
2.3.3.1 Focus differentiation competitive strategy ............................................................. 30
2.3.3.2 Focus low-cost competitive strategy ....................................................................... 34
2.3.3.3 Drawbacks of a focus competitive strategy ............................................................ 36
2.3.3.4 Comparison between focus differentiation and focus low-cost competitive
strategies ………………………………………………………………………………………………………………………….. 37
2.4 Supply chain strategies ........................................................................................................... 39
2.4.1 Different supply chain strategies ..................................................................................... 41
vii
2.4.1.1 Selecting a supply chain strategy based on product characteristics ....................... 41
2.4.1.2 Selecting a supply chain strategy based on customer and supplier uncertainties . 43
2.4.1.3 Selecting a supply chain strategy based on customer buying behaviour ................ 46
2.4.1.4 Additional factors to consider when selecting a supply chain strategy ................... 48
2.4.2 Orientation of supply chain strategies ............................................................................ 51
2.5 Conclusion ............................................................................................................................... 51
Chapter 3 ............................................................................................................................................ 55
The logistical supply chain drivers ..................................................................................................... 55
3.1 Introduction ............................................................................................................................ 55
3.2 Logistics: a South African small business perspective ............................................................ 56
3.2.1 State of logistics in South Africa as a developing country ............................................... 57
3.2.2 Logistics management in small businesses ..................................................................... 59
3.2.3 The four logistical linkages within a small retail business ............................................... 60
3.3 Facilities as a logistical supply chain driver ............................................................................. 61
3.3.1 Components of facilities decisions .................................................................................. 63
3.3.1.1 Function of the facility ............................................................................................. 63
3.3.1.2 Location of the facility .............................................................................................. 65
3.3.1.3 Capacity of the facility ............................................................................................. 67
3.3.2 Management of facilities by small retailers .................................................................... 68

viii
3.4 Inventory as a logistical supply chain driver ........................................................................... 71
3.4.1 Components of inventory decisions ................................................................................ 72
3.4.1.1 Cycle inventory ........................................................................................................ 72
3.4.1.2 Safety inventory ...................................................................................................... 73
3.4.1.3 Seasonal inventory .................................................................................................. 73
3.4.2 Management of inventory by small retailers .................................................................. 74
3.5 Transportation as a logistical supply chain driver .................................................................. 77
3.5.1 Components of transportation decisions ........................................................................ 78
3.5.1.1 Transportation routes ............................................................................................. 79
3.5.1.2 Mode of transportation ........................................................................................... 80
3.5.2 Management of transportation by small retailers .......................................................... 83
3.6 Conclusion ............................................................................................................................... 85
Chapter 4 ............................................................................................................................................ 89
Research Methodology ...................................................................................................................... 89
4.1 Introduction ............................................................................................................................ 89
4.2 Determining the need for research ........................................................................................ 89
4.3 Research process .................................................................................................................... 93
4.3.1 Research problem ............................................................................................................ 94
4.3.2 Research objectives ......................................................................................................... 95
ix
4.3.3 Research design ............................................................................................................... 97
4.3.4 Identifying information types and sources to be used during the research process ...... 98
4.3.4.1 Secondary research .................................................................................................. 99
4.3.4.2 Primary research ...................................................................................................... 99
4.3.5 Developing the sample plan and designing the research instrument ........................... 105
4.3.5.1 Developing the sample plan ................................................................................... 106
4.3.5.2 Designing the research instrument ........................................................................ 109
4.3.6 Collecting, coding and capturing of data ....................................................................... 112
4.3.7 Analysis of data .............................................................................................................. 112
4.3.7.1 Descriptive statistical analyses ............................................................................... 113
4.3.7.2 Inferential statistical analyses ................................................................................ 114
4.3.7.3 Validity, reliability and practicality ......................................................................... 118
4.3.8 Presentation of research findings and future research ................................................. 120
4.3.9 Ethical considerations .................................................................................................... 120
4.4 Conclusion ............................................................................................................................. 122
Chapter 5 .......................................................................................................................................... 124
Empirical findings on the logistical supply chain drivers ................................................................. 124
5.1 Introduction .......................................................................................................................... 124
5.2 Notes regarding the statistical analyses of the data ............................................................ 124
x
5.3 Empirical findings related to facilities as a logistical supply chain driver ............................. 125
5.3.1 Descriptive analyses of the data pertaining to facilities ............................................ 125
5.3.1.1 Proximity of the business to customers ................................................................ 126
5.3.1.2 Proximity of the business to public transport ....................................................... 126
5.3.1.3 Providing customers with fast checkout ............................................................... 127
5.3.1.4 Capacity of the facility ........................................................................................... 127
5.3.1.5 Accessibility of excess inventory ........................................................................... 128
5.3.2 Inferential analyses of the data pertaining to facilities ............................................. 128
5.3.2.1 Hypothesis 1 ........................................................................................................... 129
5.3.2.2 Hypothesis 2 .......................................................................................................... 130
5.4 Empirical findings related to inventory as a logistical supply chain driver ........................... 132
5.4.1 Descriptive analyses of the data pertaining to inventory .......................................... 132
5.4.1.1 Average rate of purchasing inventory ................................................................... 132
5.4.1.2 Quantity of inventory purchased ......................................................................... 134
5.4.2 Inferential analyses of the data pertaining to inventory ........................................... 137
5.4.2.1 Hypothesis 3 .......................................................................................................... 137
5.4.2.2 Hypothesis 4 .......................................................................................................... 139
5.4.2.3 Hypothesis 5 .......................................................................................................... 143
5.4.2.4 Hypothesis 6 .......................................................................................................... 144

xi
5.5 Empirical findings related to transportation as a logistical supply chain driver................... 145
5.5.1 Descriptive analyses of the data pertaining to transportation.................................. 145
5.5.1.1 Direct delivery of inventory by suppliers .............................................................. 146
5.5.1.2 Payment for direct delivery ................................................................................... 147
5.5.1.3 Higher payment than competitors for faster delivery .......................................... 147
5.5.1.4 Collection of inventory with own car .................................................................... 148
5.5.1.5 Collection of inventory by using a transportation opportunity ............................ 149
5.5.1.6 Collaborating with other retailers to collect inventory ......................................... 149
5.5.1.7 Willingness to wait longer for inventory in order to pay less ............................... 150
5.5.1.8 Willingness to pay a supplier more to receive inventory sooner ......................... 150
5.5.2 Inferential analyses of the questions pertaining to transportation .......................... 151
5.5.2.1 Hypothesis 7 ........................................................................................................... 151
5.5.2.2 Hypothesis 8 .......................................................................................................... 155
5.6 Conclusion ............................................................................................................................. 156
Chapter 6 .......................................................................................................................................... 161
Predicting the survival of Sowetan small retailers through binary logistic regression models ....... 161
6.1 Introduction .......................................................................................................................... 161
6.2 Binary logistic regression model: an overview ..................................................................... 161
6.2.1 Selecting the dependent variable for each binary logistic regression model ............... 162

xii
6.2.2 Selecting the independent variables used in both binary logistic regression models .. 162
6.3 Binary logistic regression model with the dependable variable age .................................... 166
6.4 Binary logistic regression with the dependent variable growth ........................................... 170
6.5 Conclusion ............................................................................................................................. 173
Chapter 7 .......................................................................................................................................... 175
Conclusions and recommendations ................................................................................................. 175
7.1 Introduction .......................................................................................................................... 175
7.2 The primary and secondary research objectives addressed in this study ............................ 175
7.3 Overview of chapters 2, 3, 5 and 6 ....................................................................................... 177
7.3.1 Chapter 2 – Selecting appropriate competitive and supply chain strategies ............... 177
7.3.2 Chapter 3 – The logistical supply chain drivers ............................................................. 177
7.3.3 Chapter 5 – Empirical findings on the logistical supply chain drivers ........................... 178
7.3.4 Chapter 6 – Predicting the survival of Sowetan small retailers through binary logistic
regression models ........................................................................................................................ 179
7.4 Conclusions and recommendations related to each secondary research objective ............ 179
7.4.1 Secondary research objective 1 ..................................................................................... 180
7.4.2 Secondary research objectives 2 and 3 ......................................................................... 181
7.4.2.1 Facilities as a logistical supply chain driver ........................................................... 182
7.4.2.2 Inventory as a logistical supply chain driver ......................................................... 183
7.4.2.3 Transportation as a logistical supply chain driver ................................................. 185

xiii
7.4.3 Secondary research objective 4 ..................................................................................... 187
7.4.3.1 Influence of the industry group on the management of facilities ......................... 187
7.4.3.2 Influence of the industry group on the management of inventory ....................... 187
7.4.3.3 Influence of the industry group on the management of transportation ............... 188
7.4.4 Secondary research objective 5 .................................................................................... 188
7.5 Linking secondary research objectives to questions in the questionnaire, literature and
empirical findings, conclusions and recommendations .................................................................. 190
7.6 Limitations of the study ........................................................................................................ 193
7.7 Future research identified .................................................................................................... 193
7.8 A final word ........................................................................................................................... 194
Bibliography ..................................................................................................................................... 195
Appendix A – Soweto 2014 Questionnaire ...................................................................................... 208
Appendix B - Ethical Clearance Certificate ....................................................................................... 224
Appendix C – SPSS Data Outputs ..................................................................................................... 225

xiv
List of Tables
Table 1.1 Summary of the empirical research methodology used during this study .................... 19
Table 2.1 Comparison between focus differentiation and focus low-cost strategies ................... 38
Table 2.2 Supply chain strategies - classified according to their orientation ................................ 41
Table 2.3 Characteristics of the orientation of supply chain strategies ........................................ 51
Table 2.4 Literature findings in chapter 2 .................................................................................... 533
Table 3.1 Components of decisions on facilities by retailers – depending on their focus ............ 69
Table 3.2 Components of decisions on inventory by retailers – depending on their focus .......... 75
Table 3.3 Components of decisions on transportation by retailers – depending on their focus .. 84
Table 3.4 Literature findings in chapter 3 ...................................................................................... 86
Table 4.1 Determining whether to conduct research for this study .............................................. 91
Table 4.2 Primary and secondary research questions and objectives ........................................... 96
Table 4.3 Comparison of self-administrated, computer-aided and interviewer-administrated
surveys…………………………………………………………………………………………………………………………………….102
Table 4.4 Summary of the sample plan ........................................................................................ 108
Table 4.5 Characteristics of close-ended responses .................................................................... 110
Table 4.6 Form and scale of measurement for the supply chain management, sustainability and
biographical questions in the 2014 Soweto study ....................................................................... 111
Table 4.7 Classification of respondents in the 2014 Soweto study ............................................. 113
Table 4.8 Two forms of validity .................................................................................................... 118
Table 4.9 General ethical principles considered in this study...................................................... 120

xv
Table 4.10 Summary of the research methodology for this study .............................................. 122
Table 5.1 Respondents’ importance rating of the different aspects relating to facilities ........... 126
Table 5.2 Respondents’ rating on facility statements .................................................................. 127
Table 5.3 Kruskal-Wallis test results on hypothesis 1 .................................................................. 129
Table 5.4 Kruskal-Wallis test results on hypothesis 2 .................................................................. 130
Table 5.5 Mean ranks for hypothesis 2 ........................................................................................ 131
Table 5.6 Type of supplier from whom respondents purchase inventory ................................... 132
Table 5.7 Respondents’ rating on obtaining more inventory from suppliers .............................. 133
Table 5.8 Respondents’ rate of purchasing inventory ................................................................. 133
Table 5.9 Respondents’ ratings on inventory statements ........................................................... 134
Table 5.10 Respondents’ level of agreement with the inventory statements ............................ 136
Table 5.11 Respondents’ importance rating of the different aspects relating to inventory ....... 136
Table 5.12 Kruskal-Wallis test results on hypothesis 3 ................................................................ 138
Table 5.13 Mean ranks for hypothesis 3 ...................................................................................... 138
Table 5.14 Kruskal-Wallis test results on hypothesis 4 ................................................................ 140
Table 5.15 Mean ranks for hypothesis 4 ...................................................................................... 142
Table 5.16 Kruskal-Wallis test results on hypothesis 5 ................................................................ 143
Table 5.17 Kruskal-Wallis test results on hypothesis 6 ................................................................ 144
Table 5.18 Respondents’ agreement with statements on transportation .................................. 146
xvi
Table 5.19 Delivery of inventory .................................................................................................. 150
Table 5.20 Kruskal-Wallis test results on hypothesis 7 ................................................................ 152
Table 5.21 Mean ranks for hypothesis 7 ...................................................................................... 154
Table 5.22 Pearson Chi-Square test results on hypothesis 8 ....................................................... 155
Table 5.23 Empirical findings in chapter 5 ................................................................................... 157
Table 6.1 Results of the principle component analyses conducted on the different items ........ 164
Table 6.2 Independent variables in the equation for the binary logistic regression model with the
dependent variable age ............................................................................................................... 168
Table 6.3 Independent variables in the equation for the binary logistic regression model with the
dependent variable growth .......................................................................................................... 171
Table 6.4 Literature and empirical findings in chapter 6 ............................................................. 174
Table 7.1 Linking the research objectives to the questionnaire, findings, conclusions and
recommendations ........................................................................................................................ 191
xvii
List of Figures
Figure 1.1 A generic supply chain with the upstream and downstream flows ................................ 2
Figure 1.2 A simplified supply chain for formal independent small retail businesses operating in
Soweto .............................................................................................................................................. 5
Figure 1.3 The responsiveness/cost-efficiency continuum .............................................................. 8
Figure 1.4 Linking the competitive and supply chain strategies ...................................................... 9
Figure 2.1 Illustration of the literature covered in chapter 2 ........................................................ 23
Figure 2.2 Porter’s three generic competitive strategies .............................................................. 29
Figure 2.3 Trade-off between the level of responsiveness and cost-efficiency ............................ 40
Figure 2.4 Matching the type of product with a specific supply chain .......................................... 43
Figure 2.5 Supply chain strategies based on demand and supply uncertainty .............................. 44
Figure 2.6 A supply chain that combines cost-efficient and responsive strategies ....................... 49
Figure 3.1 Overview of the literature covered in chapter 3........................................................... 55
Figure 3.2 South Africa’s logistics performance index ratings for 2007-2016 ............................... 57
Figure 3.3 Cost components of South Africa’s logistics costs for the period 2013 – 2015 in
percentage ...................................................................................................................................... 58
Figure 4.1 Determining whether research should be conducted .................................................. 90
Figure 4.2 Graphic illustration of the research process ................................................................. 94
Figure 4.3 Seven steps in developing a sample plan .................................................................... 106
1 © University of South Africa
Chapter 1
Introduction to the study
1.1 Introduction
This study focuses on the way in which formal independent small retail businesses manage
the logistical supply chain drivers of transportation, facilities and inventory based on their
selected supply chain strategy. At the end of the study recommendations are made to assist
small retail business owners or managers in the South Western Township (hereafter referred
to as Soweto) in managing the logistical supply chain drivers in order to survive. This chapter
provides background information on selected key concepts in the discipline of supply chain
management (SCM) that are relevant to this study, as well as a description of formal
independent small retail businesses operating within the boundaries of the Soweto
township. The discussion is structured to include the problem statement, research
questions, research objectives and research methodology used to conduct this study.
1.2 Background: SCM key concepts related to this study
Globalisation and the rapid development of technologies have led to a shift from businesses
competing against each other to supply chains competing against each other (Simon, Serio,
Pires & Martins, 2015:28; Alfalla-Luque, Mendina-Lopez & Dey, 2013:800; Qrunfleh and
Tarafdar, 2013:571). Therefore, to operate successfully and achieve a competitive advantage
in today’s business environment, businesses are compelled to become more involved with
their customers and suppliers (Wisner, Tan & Leong, 2016:8). Success depends on building
relationships and processes beyond the boundaries of a business in order to assist in the
design, production and delivery of goods and services according to customers’ demands
(Fawcett, Ellram & Ogden, 2007:6). Fawcett et al. (2007:6) further explain that developing
such relationships and processes within the supply chain will enable businesses to enhance
their capabilities. A generic supply chain for products consists of three or more businesses,
called supply chain members and are linked through the upstream and downstream flow of
products, information and finances. The different supply chain members must be managed

2 © University of South Africa
as a coordinated and cohesive singular competing unit in order to satisfy the needs of end-
customers (Monczka, Handfield, Giunipero & Patterson, 2016:13; Wisner et al., 2016:8;
Alfalla-Luque et al., 2013:800). A generic supply chain for services entails a network of
service providers, customers and the supporting units that perform the functions required to
produce services, to transform resources into supporting and core services, and to deliver
services to downstream customers (Sakhuj and Jain, 2012:216).
The following section will provide an overview of SMC by explaining the way in which the
different supply chain members interact within a generic supply chain, whereafter the
discussion will continue on the different members of a generic supply chain with regard to
this study.
1.2.1 A generic supply chain
All customers, whether they are end-customers (final customers who use or consume the
end product) or supply chain members, receive products or services via some kind of supply
chain. The different flows of products and services, information and finances between the
different supply chain members are depicted in figure 1.1.
Figure 1.1 A generic supply chain with the upstream and downstream flows
Source: Wisner et al. (2016:8); Fawcett et al. (2007:7)
Referring to the generic supply chain in figure 1.1, both the downstream customer and
upstream supplier can trigger the three flows within the chain. Although a basic supply chain
with only three members (the upstream supplier, the focal business and the downstream
customer), is depicted in figure 1.1, it is important to note that supply chains are usually
3 © University of South Africa
more complex, with numerous members and interconnections (Wisner et al., 2016:8). A
supplier can trigger the three flows by anticipating a customer’s demand (also referred to as
a push-based process), whereas a customer can trigger the three flows by requiring a
product or service (also referred to as a pull-based process) (Chopra and Meindl, 2016:22).
The information of a customer’s order will trigger the downstream flow of products and
services from a supplier, as well as the upstream flow of finances from the customer (Taylor,
2004:26). In the event that the customer is not satisfied, a reverse flow is activated whereby
the product is returned to the supplier; the product then flows back (upwards) and a refund
is made to the customer (Kilic, Cebeci & Ayhan, 2015:120). When a customer is dissatisfied
with a service, he or she can either demand a refund or request that the service be rectified.
1.2.2 The different supply chain members within a generic Sowetan retail supply chain
For the purpose of this study, a clear distinction between the different supply chain
members within a generic Sowetan retail supply chain is required. This section provides a
description of each supply chain member in terms of this study.
1.2.2.1 The focal business
The focal business in this study refers to any formal independent small retail business
operating within the boundaries of Soweto. For the purpose of this study the definition of a
small business as defined by the National Small Business Amendment Act of 2004 is
accepted. It reads that a small business is “a separate and distinct business entity, together
with its branches or subsidiaries, if any, including co-operative enterprises and non-
governmental organisations, managed by one owner or more which, including its branches
or subsidiaries, if any, is predominantly carried on in any sector or subsector of the economy
and which can be classified as a micro-, a very small, a small or medium enterprise” (South
Africa, 2004). A small business can form part of a supply chain, either as a supplier,
manufacturer, distributor or customer, and is not always the focal business within the supply
chain (Koh, Demirbag, Bayraktar, Tatoglu & Zaim, 2007:103). In this study, formal
independent small retail businesses, for example restaurants, general stores, grocery stores,
automotive stores, hardware stores, hairdressers and undertakers are viewed as focal
businesses within the supply chain.
4 © University of South Africa
1.2.2.2 The downstream customers
For the purpose of this study a downstream customer refers to a customer who purchases
from the formal independent small retail businesses operating within the boundaries of
Soweto, irrespective of whether the customer purchases the product or service for own
consumption (for example, a customer who purchases bread to eat or receives a haircut), or
to resell to another downstream customer (for example, another retailer purchasing
inventory), or to use within the customer’s own business (for example, a customer who
purchases a hammer to use in his or her plumbing business).
1.2.2.3 The upstream suppliers
In this study an upstream supplier refers to a supplier from whom the formal independent
small retail businesses in Soweto purchase inventory or a service. A supplier can be another
retailer, a wholesaler or a manufacturer who operates in or outside the boundaries of
Soweto. The formal independent small retail business purchases inventory from an
upstream supplier with the purpose of reselling the inventory in its own store, or purchases
a service that will assist the business in conducting its trade. An example could be the
purchasing of washing powder from another retailer to resell to a customer, or paying a
supplier to install a refrigerator.
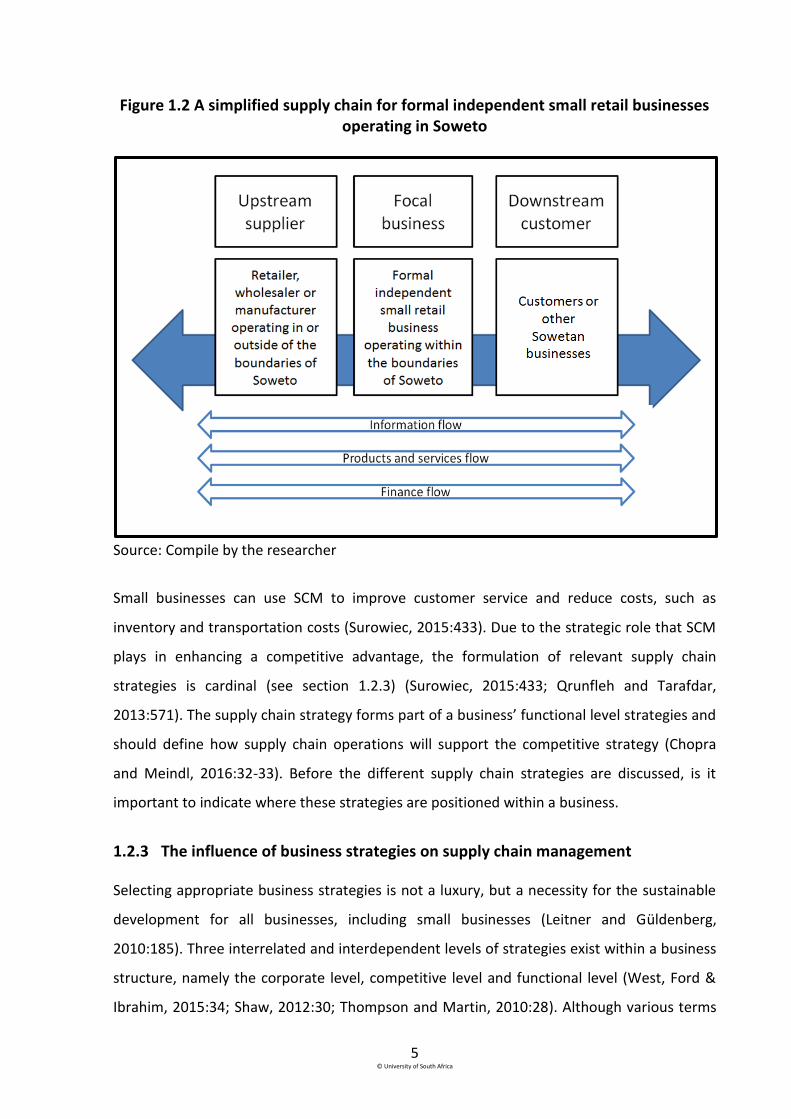
Taking into consideration the generic supply chain with the upstream and downstream flows
(figure 1.1), as well as the earlier discussion on the different supply chain members with
regard to this study, a simplified supply chain for formal independent small retail businesses
operating in Soweto is depicted in figure 1.2.
5 © University of South Africa
Figure 1.2 A simplified supply chain for formal independent small retail businesses operating in Soweto
Source: Compile by the researcher
Small businesses can use SCM to improve customer service and reduce costs, such as
inventory and transportation costs (Surowiec, 2015:433). Due to the strategic role that SCM
plays in enhancing a competitive advantage, the formulation of relevant supply chain
strategies is cardinal (see section 1.2.3) (Surowiec, 2015:433; Qrunfleh and Tarafdar,
2013:571). The supply chain strategy forms part of a business’ functional level strategies and
should define how supply chain operations will support the competitive strategy (Chopra
and Meindl, 2016:32-33). Before the different supply chain strategies are discussed, is it
important to indicate where these strategies are positioned within a business.
1.2.3 The influence of business strategies on supply chain management
Selecting appropriate business strategies is not a luxury, but a necessity for the sustainable
development for all businesses, including small businesses (Leitner and Güldenberg,
2010:185). Three interrelated and interdependent levels of strategies exist within a business
structure, namely the corporate level, competitive level and functional level (West, Ford &
Ibrahim, 2015:34; Shaw, 2012:30; Thompson and Martin, 2010:28). Although various terms
6 © University of South Africa
are used to refer to these strategic levels in the literature, the discussion that follows will
refer to corporate, competitive and functional levels.
1.2.3.1 The different strategic levels
The corporate level strategy provides the strategic direction for the entire business, mainly
through the mission and vision statements encapsulating the long-term goals of the entire
business (Salavou, 2015:81). Competitive strategies, as the second level of strategies, are
concerned with the creation and maintenance of a sustainable competitive advantage by
identifying a unique position within the market in an effort to outperform rivals (Salavou,
2015:81; Jooste, Strydom, Berndt & Du Plessis, 2012:230; Thompson and Martin, 2010:28;
Louw and Venter, 2011:19). Competitive strategies are translated into functional strategies,
which represent the third level of strategies within a business structure. These functional
strategies specify the necessary actions to support the competitive strategies. Functional
strategies include, for example the marketing strategy, production strategy, supply chain
strategy, finance strategy and the human resource strategy (West et al., 2015:34). The
corporate, competitive and functional strategies should be aligned, coherent and congruent
with each other in order to ensure business success (Chopra and Meindl, 2016:32-33; Hines,
2013:41).
1.2.3.2 The different strategic levels of a small business
As most large businesses provide more than one product or service to one or more market
segments, managers can structure each product and service into a strategic business unit
(SBU). Since each SBU is responsible for developing, manufacturing and marketing their
product or service, each SBU will have a specific competitive strategy with its relevant
functional strategies. A functional strategy is concerned with the short-term goals of each
functional area within each SBU (Salavou, 2015:81).
Aykan, Aksoylu & Sönmez (2013:939) state that small businesses differ from larger
businesses with regard to managerial and organisational structure, mainly because of the
variances resulting from financial aspects, production or service sourcing, internal
capabilities and competitive power. Therefore, the strategies deployed by small and large
7 © University of South Africa
businesses will also differ. Since small businesses generally compete with only one product
or service, or in one market segment, they do not have different SBUs within their business
structures (Thompson and Martin, 2010:28) and so, the corporate and competitive
strategies will be synonymous. Consequently, small businesses will usually have only one
competitive strategy with several functional strategies for the entire business (Thompson
and Martin, 2010:28).
The supply chain strategy as a functional strategy defines how operations in the supply chain
will support the overall competitive strategy (Ambe, 2012:126). The strategy stipulates the
specific plan of action that will be used to integrate suppliers, manufacturers, warehouses
and stores, to ensure that inputs (raw materials, semi-finished products or finished products)
are purchased; products are produced and then distributed in the correct quantities, at the
right time, and to the right location. The plan of action is followed in order to minimise
system-wide costs (being cost-efficient), while satisfying customers’ service-level
requirements (being effective) (Qrunfleh and Tarafdar, 2013:571). In the literature the
concepts, “effectiveness” and “efficiency”, are often used interchangeably, but for this study
a distinction will be made between these concepts. “Effectiveness” will refer to the extent to
which a customer’s needs are met (this will subsequently be referred to as responsiveness),
while “efficiency” will refer to whether the customer’s needs are met economically (will be
referred to as cost-efficiency from here on) (Lai and Cheng, 2003:153). Soni and Kodali
(2011:73-74) examined the literature regarding supply chain strategies and concluded that
most authors describe a supply chain strategy as being orientated either towards
responsiveness or cost-efficiency.
1.2.3.3 Responsive and cost-efficient supply chain strategies
Supply chain responsiveness refers to the flexibility required by the supply chain to react to
the demand of a customer; while cost-efficiency refers to the cost incurred when reacting to
this demand (Lee, 2002:113-114). Several factors (such as the product characteristics; the
level of demand and supply uncertainties placed on the supply chain; customer’s buying
behaviour; the position of the supply chain member within the supply chain; order winners
and order qualifiers; and the production process) need to be considered before an
appropriate supply chain strategy can be selected (see detailed discussion in section 2.4).
8 © University of South Africa
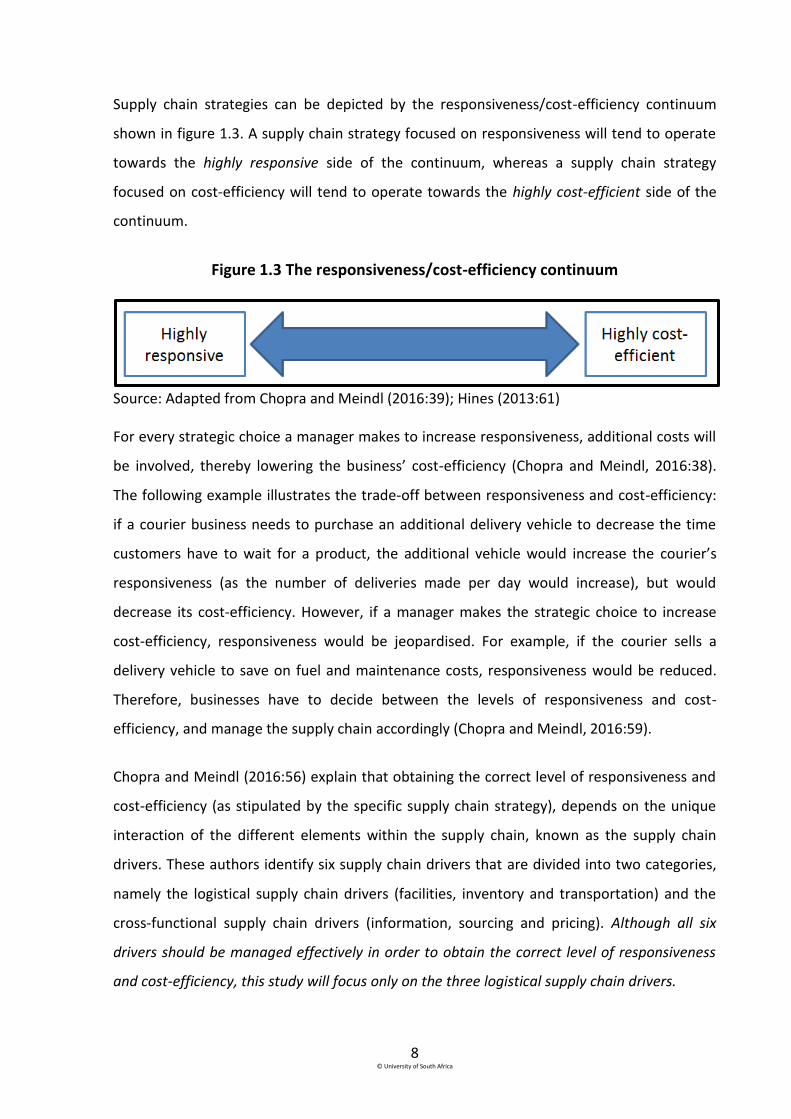
Supply chain strategies can be depicted by the responsiveness/cost-efficiency continuum
shown in figure 1.3. A supply chain strategy focused on responsiveness will tend to operate
towards the highly responsive side of the continuum, whereas a supply chain strategy
focused on cost-efficiency will tend to operate towards the highly cost-efficient side of the
continuum.
Figure 1.3 The responsiveness/cost-efficiency continuum
Source: Adapted from Chopra and Meindl (2016:39); Hines (2013:61)
For every strategic choice a manager makes to increase responsiveness, additional costs will
be involved, thereby lowering the business’ cost-efficiency (Chopra and Meindl, 2016:38).
The following example illustrates the trade-off between responsiveness and cost-efficiency:
if a courier business needs to purchase an additional delivery vehicle to decrease the time
customers have to wait for a product, the additional vehicle would increase the courier’s
responsiveness (as the number of deliveries made per day would increase), but would
decrease its cost-efficiency. However, if a manager makes the strategic choice to increase
cost-efficiency, responsiveness would be jeopardised. For example, if the courier sells a
delivery vehicle to save on fuel and maintenance costs, responsiveness would be reduced.
Therefore, businesses have to decide between the levels of responsiveness and cost-
efficiency, and manage the supply chain accordingly (Chopra and Meindl, 2016:59).
Chopra and Meindl (2016:56) explain that obtaining the correct level of responsiveness and
cost-efficiency (as stipulated by the specific supply chain strategy), depends on the unique
interaction of the different elements within the supply chain, known as the supply chain
drivers. These authors identify six supply chain drivers that are divided into two categories,
namely the logistical supply chain drivers (facilities, inventory and transportation) and the
cross-functional supply chain drivers (information, sourcing and pricing). Although all six
drivers should be managed effectively in order to obtain the correct level of responsiveness
and cost-efficiency, this study will focus only on the three logistical supply chain drivers.
9 © University of South Africa
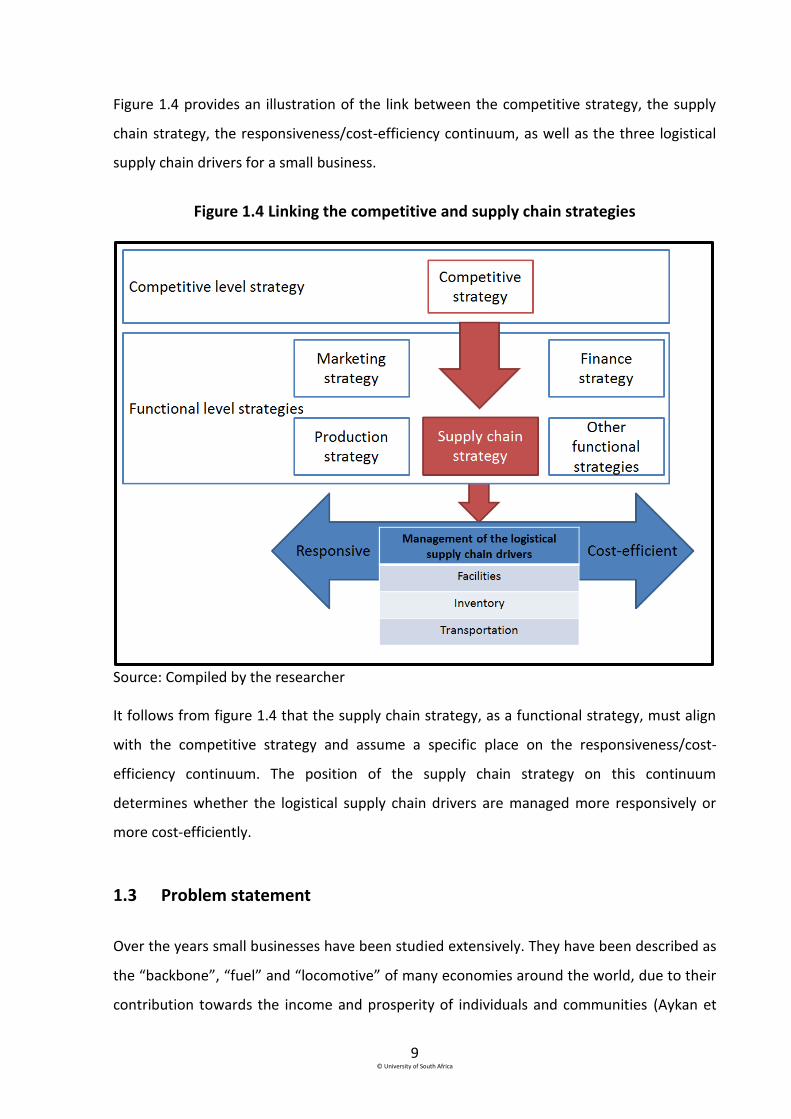
Figure 1.4 provides an illustration of the link between the competitive strategy, the supply
chain strategy, the responsiveness/cost-efficiency continuum, as well as the three logistical
supply chain drivers for a small business.
Figure 1.4 Linking the competitive and supply chain strategies
Source: Compiled by the researcher
It follows from figure 1.4 that the supply chain strategy, as a functional strategy, must align
with the competitive strategy and assume a specific place on the responsiveness/cost-
efficiency continuum. The position of the supply chain strategy on this continuum
determines whether the logistical supply chain drivers are managed more responsively or
more cost-efficiently.
1.3 Problem statement
Over the years small businesses have been studied extensively. They have been described as
the “backbone”, “fuel” and “locomotive” of many economies around the world, due to their
contribution towards the income and prosperity of individuals and communities (Aykan et

10 © University of South Africa
al., 2013:939; Katz and Green, 2012:14; Mbonyane and Ladzani, 2011:550; Abor and
Quartey, 2010:218). In South Africa too, small businesses are seen as a way to create
employment and to ensure a more equal distribution of income to citizens; to promote the
general economic welfare of citizens; to improve local markets and to assist in allocating
scarce resources. Since small businesses can enhance the economic growth of a country, any
research conducted in this field will not only benefit the businesses, but also promote the
economic growth of the country (Nkosi, Bounds & Goldman, 2013:1). In the National
Development Plan of 2030, the continued commitment of the South African government to
prioritise the development of small businesses, is reflected in their ambitious goal for the
small business sector to create 90% of the employment opportunities within South Africa by
2030 (South Africa, National Planning Commission, 2012). To achieve this goal, the South
African government realised that small businesses should not only be developed, but that
the owners and managers must be equipped with the necessary managerial skills (South
Africa, National Planning Commission, 2012). One of the focus areas of the National
Development Plan of 2030 is the development of small businesses in townships and the
development of the owners and managers of these businesses (South Africa, National
Planning Commission, 2012).
Over the past two decades several studies have been conducted on the previously
disadvantaged townships of South Africa and particularly on their development. These
studies focused on key issues, such as challenges faced by township entrepreneurs and the
support of the government for them (Olawale and Garwe, 2010); the status of township
businesses and entrepreneurs within Gauteng (Strydom, 2015); the survival of formal small
businesses in Soweto (Badenhorst-Weiss and Cilliers, 2014); the unique market offering by
formal independent retail and wholesale small businesses in Soweto (Badenhorst-Weiss,
Cilliers & Eicker, 2014); and the skills required for the management of black-owned small
enterprises in Soweto (Nkosi et al., 2013). The continuous study of these businesses can be
ascribed to the drastic changes in the business environment of the townships. Townships
have been transformed from unplanned business infrastructures to state-of-the-art
shopping malls; thereby influencing the way in which these businesses are operated and
managed (Nkosi et al., 2013:4).
11 © University of South Africa
During the apartheid years, townships were characterised by rows of uniform houses and a
lack of infrastructure, such as roads, sanitation, water and electricity (World Bank, 2014:4).
Townships had only basic retail infrastructure, such as the production of goods and services,
because of restricted economic activities within the townships post-1994 (Strydom,
2011:151). Soweto’s retail sector was clustered in small formal neighbourhood centres and
the majority of businesses were classified as general retailers, which included spaza shops
(retailers operating from a room in a house), shebeens (retailers selling beer and other
liquor) and hawkers (retailers selling mainly perishable products) (Strydom, 2011:152).
In the post-apartheid period (after 1994), the new South African government immediately
prioritised the development of black-owned businesses as part of developing the South
African small business economy, which included the development of small businesses in
townships (Rogerson and Rogerson, 1997:33). In 2001 Soweto was incorporated into the
Greater Johannesburg Metropolitan area and the priority of the City of Johannesburg to fully
integrate Soweto and to stimulate its economic activity were the reasons for formulating the
Soweto Retail Strategy in 2005 and The 5 Year Soweto Economic Development Plan 2008 –
2013.
In 2005 the Soweto Retail Strategy reported that the total demand for retail goods by
residents of Soweto was R4.2 billion, but of this, only R1.05 billion was spent at retail
businesses operating within Soweto (City of Johannesburg, 2005:2). The Soweto Retail
Strategy aimed to provide retail businesses with a business environment in which these
businesses could operate effectively, and to increase the amount spent at Sowetan retail
businesses to R2.1 billion within five years (City of Johannesburg, 2005:2-3). The Soweto
Retail Strategy included the development of 70 000 square meters of retail space between
2004 and 2009. This space had to consist of large retail and smaller neighbourhood shopping
centres. It was deemed important to balance the development of shopping centres,
individual street-front shops (a shop with its entrance facing the street), and the informal
sector’s retail activities (City of Johannesburg, 2005:4).
In 2008 the City of Johannesburg implemented a second initiative aimed at developing
Soweto, namely The 5 Year Soweto Development Plan 2008 – 2013 (also referred to as the
Soweto Development Plan). The purpose of this plan was to provide Soweto with a
12 © University of South Africa
framework to build the township into a productive and competitive regional economy (City
of Johannesburg, 2008:4). Subsequently, public, private and community sectors within
Soweto were provided with an outline of priorities, and businesses were informed on how to
structure their efforts and investments in order to build such an economy. During this time
the disposable income of township consumers increased and retailers redirected their
growth strategies towards the new and expanding township markets (Tustin and Strydom,
2006:48). Therefore, the four large shopping centres that were built between 2005 and 2007
(Grant, 2010:601; Zondi, 2011:4) housed well-known national retail chains to address the
increase in consumer needs (Tustin and Strydom, 2006:49). The development of the retail
industry in Soweto has had a positive impact on the township and its citizens in terms of
increasing employment opportunities and stimulating economic growth (Gauteng Quarterly
Bulletin, 2012:26).
Although Soweto has moved from unplanned, scattered, formal and informal businesses to a
township with modern shopping centres by 2012, research done by Strydom (2013:2870) to
determine the patronage of Sowetan retailers, established that high-value items were still
mainly bought outside the township by the high-income group. The individuals who shopped
within the boundaries of the township formed part of the middle- to lower-income groups. It
therefore seems that the retailers located within Soweto have mainly been serving price-
sensitive customers within the boundaries of this township (Strydom, 2011:2870).
In 2014 the Gauteng Department of Economic Development (2014:4) announced a
revitalisation strategy aimed to further develop the economies of townships through a
Township Economy Revitalization Action Plan. Although the Gauteng Department of
Economic Development acknowledged that government had implemented numerous
initiatives and development plans aimed at developing townships into liveable and vibrant
economic centres, they stated that townships were unfortunately still characterised by low
levels of entrepreneurial activities, low survival rate for small businesses and a lack of
business skills by the owners or managers of these businesses (Gauteng Department of
Economic Development, 2014: 4-5).
In 2014, the World Bank conducted a study in the Diepsloot township in order to
understand, among others, the structure of a township’s economy. This study found that the

13 © University of South Africa
difficult economic conditions under which entrepreneurs operated, could be attributed
primarily to the high unemployment rate and the underdeveloped linkages between local
supply chains and formal supply chains or production networks (World Bank, 2014:10). The
World Bank (2014:19) also found that the weak linkages of township businesses with formal
supply chains were preventing the business environment of townships from reaching their
full potential. Three quarters of the total spending within townships were on products
produced outside the township and retailed though a formal or informal supply chain (World
Bank, 2014:13). The report stressed that supply chains had to be strengthened for township
economies to improve (World Bank, 2014:22-23).
When considering the main issues highlighted throughout section 1.3, namely the limited
success of the Gauteng Department of Economic Development in developing the economies
of townships; the lack of owners’ business skills; the low levels of entrepreneurial activities
within townships; the low survival rate of township businesses; and the underdevelopment
of the linkages between local and formal supply chains, along with the strategic importance
of SCM as discussed in section 1.2; the research problem of this study can be identified as
how small business owners can increase their odds of survival by using SCM. The primary
research question (PRQ) is therefore formulated as follows:
PRQ: How can formal independent small retail businesses in Soweto manage their
logistical supply chain drivers in terms of responsiveness and cost-efficiency in
order to survive?
Based on the primary research question the following secondary research questions (SRQ)
are posed:
SRQ 1: How do small businesses achieve a strategic fit between their competitive and
supply chain strategies?
SRQ 2: How, according to the literature, are the three logistical supply chain drivers
managed by small businesses in terms of responsiveness and cost-efficiency,
based on the orientation of the selected supply chain strategy?
14 © University of South Africa
SRQ 3: How do formal independent small retail businesses operating within Soweto
manage their logistical supply chain drivers in terms of responsiveness and
cost-efficiency?
SRQ 4: Does the industry group in which the Sowetan formal independent small
retail businesses operate, influence the management of the logistical supply
chain drivers in terms of responsiveness and cost-efficiency?
SRQ 5: Can the management of the logistical supply chain drivers increase the odds
of the formal independent small retail businesses operating within Soweto to
survive?
In the next section the primary and secondary research objectives of this study are clarified.
1.4 Research objectives
The research objectives of the study are divided into primary (PRO) and secondary research
objectives (SRO). The primary research objective of the study is:
PRO: To determine how formal independent small retail businesses in Soweto
manage their logistical supply chain drivers in terms of responsiveness and
cost-efficiency in order to survive.
The secondary research objectives are:
SRO 1: To discuss how small businesses achieve a strategic fit between their
competitive and supply chain strategies.
SRO 2: To establish how, according to the literature, small businesses manage the
three logistical supply chain drivers in terms of responsiveness and cost-
efficiency, based on the orientation of the selected supply chain strategy.
SRO 3: To determine how formal independent small retail businesses operating in
Soweto manage their logistical supply chain drivers in terms of
responsiveness and cost-efficiency.
15 © University of South Africa
SRO 4: To investigate whether the industry group in which the Sowetan formal
independent small retail businesses operate, influences the management of
the logistical supply chain drivers in terms of responsiveness and cost-
efficiency.
SRO 5: To determine whether the management of the logistical supply chain drivers
increases the odds of the formal independent small retail businesses
operating within Soweto to survive.
In the next section the research methodology for the study is discussed.
1.5 Research methodology
The research design is the blueprint for solving the research problem and achieving the
research objectives. In order to address the research problem and achieve the research
objectives of this study, a literature study (phase one) and empirical research (phase two)
were conducted.
1.5.1 Phase one: literature study
Phase one of this study is presented as a comprehensive literature review and is divided into
two sections, namely the different competitive and supply chain strategies that small
businesses can select from, and the management of the three logistical supply chain drivers.
Secondary data, such as textbooks, conference papers, governmental reports and journal
articles by authors specialising in the relevant fields, were reviewed. In 2014 the World Bank
did an intensive study on the economies of South African townships. As this study is
regarded by the Gauteng Department of Economic Development (2014:9) as the most
intensive study on South African townships to date, the findings of the World Bank is
presented throughout this study to elucidate the environment in which these township
businesses operate and how township businesses are typically managed.
The findings of the literature study are discussed in chapters 2 and 3. Chapter 2 provides the
theoretical foundation of the different competitive and supply chain strategies that small
businesses can select from, and examines how a strategic fit can be achieved between these
16 © University of South Africa
strategies. In chapter 3 the focus shifts to the management of the logistical supply chain
drivers in terms of obtaining the desired level of responsiveness and cost-efficiency,
depending on the orientation of the selected supply chain strategy.
1.5.2 Phase two: empirical research
Phase two of the study required empirical research to be conducted. A short description of
the empirical research methodology for the study is provided below. A more detailed
discussion of the research methodology is provided in chapter 4.
1.5.2.1 Research design
In general, the research design is considered to be a plan or blueprint of how the research
problem and objectives will be addressed and for this study a descriptive research approach
was followed (Saunders, Lewis & Thornhill, 2012:159).
1.5.2.2 Questionnaire and pre-testing
Quantitative research usually involves the collection of primary data from a large number of
individuals with the intention of projecting the results to a wider population (Quinlan, Babin,
Carr, Griffin & Zikmund, 2015:399). The data of this study was collected by means of
interviewer-administrated surveys. These surveys were personal face-to-face interviews that
involved asking respondents questions and recording their answers. As proposed by Cooper
and Schindler (2014:225), respondents were selected to form part of a sample and were
interviewed in person by trained interviewers. The questionnaire used in the survey
consisted of close-ended questions using both nominal and ordinal measurement scales.
Other specialised researchers in the field of business management, as well as a statistician,
evaluated the questionnaire in order to identify possible shortcomings and provided
valuable feedback.

17 © University of South Africa
1.5.2.3 Survey population and data collection
A list of 650 formal independent small businesses operating within the boundaries of Soweto
was compiled by The Bureau of Market Research (BMR) in 20121. This list was used as the
sample frame for this study. “Formal” small businesses are defined as businesses that
operate within purpose-built shops and form part of the registered business infrastructure of
South Africa; they pay taxes and other levies to different levels of government (Strydom,
2015:464; Ligthelm, 2013:59; Du Plessis, Strydom & Jooste, 2012:56). The majority of small
businesses operating within Soweto are classified as formal businesses (Njiro, Mazawai &
Urban, 2010:3) and the focus of many previous studies conducted within townships was
primarily on these formal businesses (Strydom, 2015; Badenhorst-Weiss et al., 2014; Nkosi
et al., 2013; Strydom, 2013; Olawale and Garwe, 2010). According to Ligthelm (2013:73),
informal small businesses operating within townships are not regarded as the foundation of
successful and productive township small businesses. Due to these reasons, the focus of this
study is only on formal small businesses operating within Soweto.
The initial purpose of the 2014 Soweto study was to conduct a longitudinal study based on
the data gathered by the BMR in the 2012 Soweto study. Therefore the following businesses
were excluded from the 2014 Soweto study as they were also excluded from the 2012
Soweto study: branches of chain stores, franchises, street vendors on pavements, home-
based businesses (such as spazas and tuck shops), professional and business services and
transport businesses (passenger busses and taxis). The BMR coordinated the fieldwork for
the collection of the 2014 data. In terms of sample selection, the fieldworkers were
instructed that if a business had closed down during the two year period since the previous
survey in 2012, any business in the same residential area that complied with all the
requirements could be included as a substitute (see section 4.3.5.1). All the data was
gathered by five fieldworkers within 7 weeks (July – August 2014). As each formal
independent small business in the survey population had the same probability of being
1 The Bureau was founded as a research institute operating within the University of South Africa (Unisa) and is
involved in socioeconomic research and investigation, and maintains a database in a variety of fields (Unisa Website, 2015).
18 © University of South Africa
selected, the sampling method used in this study can be classified as probability sampling
using a stratified sampling method (see section 4.3.5.1).
1.5.2.4 Data analysis
Cooper and Schindler (2014:655) explain that data analysis is a process that helps to
understand the data. In this study the researcher performed the statistical analyses, using
the SPSS statistical programme (version 23); after which the data was analysed and the
findings used to provide recommendations to the small retail businesses on how to manage
their logistical supply chain drivers in order to increase their odds of survival (see chapter 7).
Before any analyses were done, the data was filtered to include only formal independent
small businesses operating in the retail sector, as this study is focused only on formal
independent small retail businesses. The 650 formal independent small businesses were
divided into different industries that operated in the different categories identified in the
2014 Standard Industrial Classification (SIC) to distinguish between the manufacturing,
construction, wholesale and retail businesses. Eventually, 556 relevant retail businesses
operating within six different retail groups, were identified. The retail groups are: grocery
stores (209); hardware stores (42); general stores (88); retail services, such as hairdressers
and undertakers (142); eating and drinking places (39); and sale, maintain and repair of
vehicles and retail auto (36).2 Both descriptive and inferential analyses were conducted on
the data obtained from the 556 respondents. These analyses included frequency
distributions, the Kruskall-Wallis test, the Pearson Chi-Square test, principal component
analyses (factor analyses) and two binary logistic regression models. Table 1.1 provides a
summary of the empirical research methodology used during this study.
2 When reporting on the results of the retail group termed ‘sale, maintain and repair of vehicles and retail auto’
in chapters 5 and 6, this group will be referred to as ‘retail auto’.

19 © University of South Africa
Table 1.1 Summary of the empirical research methodology used during this study
Empirical research aspect Description of empirical research aspect
Survey area Defined business areas in Soweto.
Survey population Formal independent small businesses located within
business areas/stands across Soweto. These included
businesses situated in shopping malls, large shopping areas
(outside shopping malls), smaller shopping areas, stand-
alone businesses and industrial areas with 2-5, 6-10 and 10
plus surrounding businesses.
Primary data collection
method
Quantitative data collected by interviewer-administrated
surveys. Personal face-to-face interviews with the owners
or managers of the small businesses.
Sample frame List of 650 formal independent small businesses operating
within the boundaries of Soweto compiled in 2012 by the
BMR.
Sample size 650 formal independent small businesses.
Sampling method Probability sampling using a stratified sampling method
Research instrument Structured interviewer-completed questionnaires
consisting of close-ended questions, using nominal and
ordinal measurement scales (refer to appendix A).
Collecting coding and
capturing of data
Fieldwork was coordinated by the BMR and gathered in
the period July – August 2014. Data was captured on Excel
and SPSS (version 23).
Analysis of data Both descriptive and inferential analyses.
Ethical considerations Fieldwork was conducted within the directives of the
ethical policy of the University of South Africa (refer to
appendix B for the ethical clearance certificate).
Source: Compiled by the researcher
20 © University of South Africa
1.6 Contribution of the study
Considering the challenges that small businesses in townships face (as discussed in section
1.3) and the increasing importance of SCM (as discussed in section 1.2), the contribution of
the study can be stated as follows:
This study provides the owners or managers of formal independent small retail businesses
with information on how to increase the odds of their small businesses’ survival through
SCM. The knowledge provided to the owners or managers specifically focuses on the
management of the small retailers’ three logistical supply chain drivers, based on the
orientation of the selected supply chain strategy. Increasing the odds of survival for formal
independent small retail businesses operating within Soweto, will contribute to both the
economic development of townships and to South Africa’s overall economic growth.
1.7 Outline of the chapters
This dissertation consists of seven chapters. Chapter 1 served as an outline for the research
and provided background information on the research topic. The research problem was
identified and the research questions and objectives were formulated. The chapter also
provided a brief overview of the research design and methodology used to conduct the
research.
Chapter 2 provides an in-depth literature review of the different competitive and supply
chain strategies. The chapter starts by explaining the importance of a strategic fit between
the competitive and supply chain strategies, and considers how this strategic fit can be
achieved. Porter’s generic competitive strategy framework is identified as the best
framework for small businesses to use when selecting a competitive strategy. The different
supply chain strategies are reviewed in terms of their orientation towards responsiveness or
cost-efficiency, based on: product characteristics; the level of demand and supply
uncertainties placed on the supply chain; customer’s buying behaviour; the position of the
supply chain member within the supply chain; order winners and order qualifiers; and the
production process.
21 © University of South Africa
Chapter 3 focuses on the literature regarding the management of the three logistical supply
chain drivers, namely transportation, facilities and inventory, in terms of responsiveness and
cost-efficiency. The chapter begins by providing an overview of logistics in general, and
specifically within South Africa as a developing country. The focus is then shifted to the
management of logistics within small businesses, before each logistical supply chain driver is
discussed individually. Each logistical supply chain driver is discussed in terms of the
different decision components that managers need to consider, since these decision
components influence the level of responsiveness and cost-efficiency that the particular
supply chain driver can achieve.
Chapter 4 describes the research methodology decided on to answer the primary research
question. The chapter begins by identifying the need for research, after which the discussion
focuses on the research process. This process formed the foundation for establishing the
research questions; the research objectives; the research design and the identification of
data sources; the development of the sample plan; and the design of the research
instrument. The discussion also elaborates on how the data was collected, coded and
captured, as well as on the different statistical techniques that were used for analysing the
data.
In chapter 5 the empirical findings on the data gathered from the responses of the 556
formal independent small retail businesses operating within Soweto with regard to the three
logistical supply chain drivers, are discussed. Both the descriptive and inferential statistical
results are examined. The descriptive findings are presented in frequency distributions and
the inferential statistical findings by using the Kruskal-Wallis test or the Pearson Chi-Square
test.
In chapter 6 two binary logistic regression models are developed in order to predict the odds
of survival for the formal independent small retail businesses operating within Soweto in
terms of age and growth. Twelve independent variables are identified using principal
component analyses.
Chapter 7 completes the study by drawing conclusions on how the small retailers operating
within Soweto manage their three logistical supply chain drivers in terms of responsiveness

22 © University of South Africa
and cost-efficiency and proposes recommendations on the management of the three
logistical supply chain drivers by the small retailers in order to increase their odds of survival.
These conclusions and recommendations are based on the two literature chapters (chapters
2 and 3) and the empirical results reported on in chapters 5 and 6. Each chapter is reviewed
by identifying the secondary research objective(s) addressed within the specific chapter, the
steps taken by the researcher to address the secondary research objective(s) and the
findings (literature or empirical) made within the chapter. Thereafter, recommendations on
how the formal independent small retail businesses can manage their logistical supply chain
drivers (based on the orientation of their supply chain strategy) in order to survive, are
made. The chapter concludes by reflecting on the limitations of the study and identifying
areas for future research.
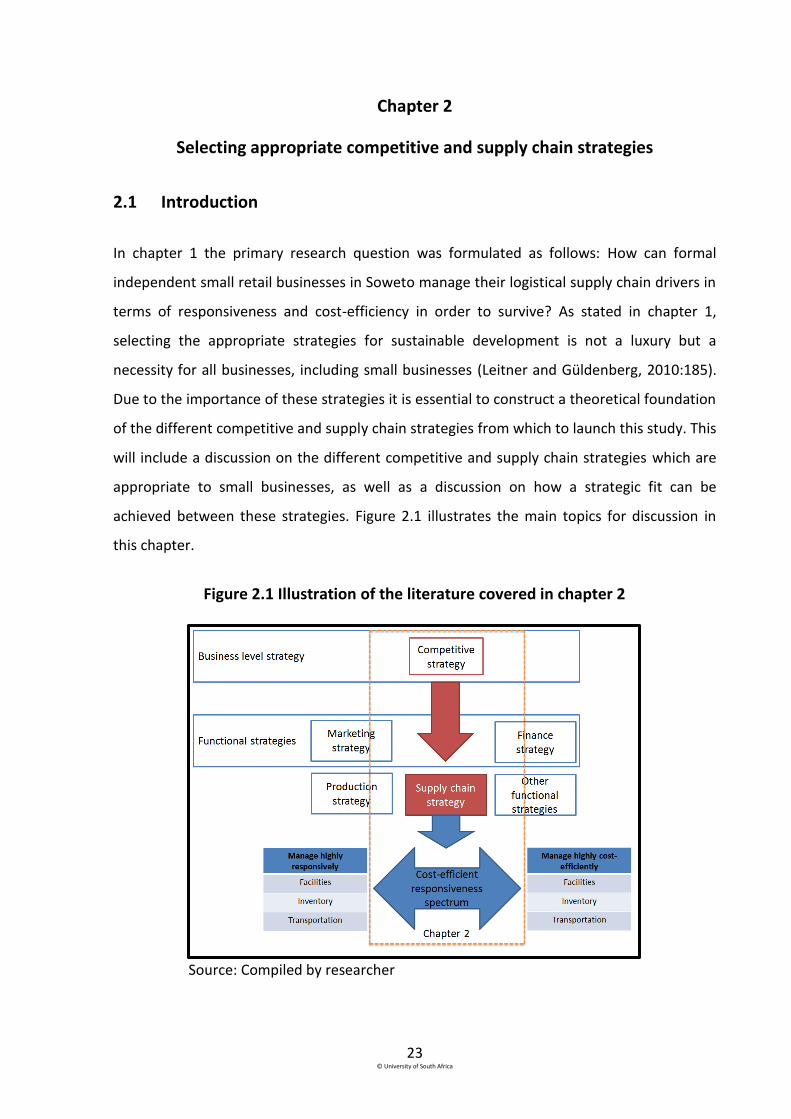
23 © University of South Africa
Chapter 2
Selecting appropriate competitive and supply chain strategies
2.1 Introduction
In chapter 1 the primary research question was formulated as follows: How can formal
independent small retail businesses in Soweto manage their logistical supply chain drivers in
terms of responsiveness and cost-efficiency in order to survive? As stated in chapter 1,
selecting the appropriate strategies for sustainable development is not a luxury but a
necessity for all businesses, including small businesses (Leitner and Güldenberg, 2010:185).
Due to the importance of these strategies it is essential to construct a theoretical foundation
of the different competitive and supply chain strategies from which to launch this study. This
will include a discussion on the different competitive and supply chain strategies which are
appropriate to small businesses, as well as a discussion on how a strategic fit can be
achieved between these strategies. Figure 2.1 illustrates the main topics for discussion in
this chapter.
Figure 2.1 Illustration of the literature covered in chapter 2
Source: Compiled by researcher
24 © University of South Africa
Referring to figure 2.1, the chapter starts by clarifying how a strategic fit can be achieved
between the competitive and functional strategies (section 2.2). Michael Porter’s (2008)
generic competitive strategy framework forms the basis for the discussion on the different
competitive strategies in section 2.3. In section 2.4 the different supply chain strategies, in
terms of their orientation towards responsiveness or cost-efficiency, are discussed. The eight
literature findings from this chapter are numbered LF1 to LF8. The chapter concludes by
identifying the competitive and supply chain strategies from which a small business can
select the most appropriate.
2.2 Achieving a strategic fit between a competitive strategy and a supply
chain strategy
In section 1.2.3.2 it was established that small and large businesses differ in terms of their
managerial and organisational structures, and therefore the strategies deployed within them
will also differ in terms of scope and complexity (Burns, 2011:18). It was concluded in section
1.2.3.2 that small businesses generally only have one competitive strategy with relevant
functional strategies for the entire business. In order for any business to succeed, all its
interrelated functional strategies related to marketing, production, finance and supply chain,
must support the competitive strategy (Qrunfleh and Tarafdar, 2013:573; Hoejmose,
Brammer & Millington, 2012:589; Borella and Padula, 2010:47). In the literature, the
alignment of the goals of the interrelated functional strategies with the goals of the selected
competitive strategy, is referred to as a strategic fit or strategic alignment (Soni and Kodali,
2011:71). Although all functional strategies must be aligned with the competitive strategy,
this study focuses on the alignment of the supply chain strategy with the competitive
strategy (Wagner, Grosse-Ruyken & Erhun, 2012:1).
As mentioned in section 1.2.3.2, a supply chain strategy defines the specific plan of action
that is followed in order to integrate suppliers, manufacturers, warehouses and stores. This
plan of action ensures that inputs (raw materials, semi-finished products or finished
products) are purchased; products are produced and distributed (in the right quantities, at
the right time and to the right location); and system-wide costs are minimised (being cost-
efficient), while customers’ service level requirements are satisfied (being effective)
25 © University of South Africa
(Qrunfleh and Tarafdar, 2013:571). A competitive strategy involves all activities necessary to
satisfy customers’ needs and to gain a competitive advantage within a specific market
(Ehlers and Lazenby, 2010:178; Thompson and Martin, 2010:785; Soni and Kodali, 2011:71).
Based on their extensive research on how a strategic fit can be achieved between the
competitive and supply chain strategies, Chopra and Meindl (2016:33) recommend that the
following three aspects should be in place before a strategic fit can be achieved:
Overall coordinated strategy: The functional strategies and the competitive strategy
must form an overall coordinated strategy. The functional strategies must support
each other and enable the business to achieve its competitive strategic goal.
Implementation of functional strategies: The different functional areas of a business
(such as marketing, production, finance and supply chain) should structure their
processes and resources in such a manner that their respective functional strategies
can be successfully implemented.
Supply chain design: The supply chain strategy should be aligned with the overall
supply chain design. For example, if the overall supply chain (referring to all the
members within the specific supply chain) is orientated towards meeting customers’
needs responsively, the supply chain strategy should also be orientated towards
responsiveness. On the other hand, if the overall supply chain design is orientated
towards meeting customers’ needs at the lowest possible cost, the supply chain
strategy should also be orientated towards cost-efficiency.LF1
Many businesses have failed due to a lack of strategic fit and/or because the supply chain
design, resources and processes did not provide the necessary capabilities to support the
desired strategic fit (Chopra and Meindl, 2016:33; Borella and Padula, 2010:44). The
following example will illustrate how a lack of strategic fit can lead to failure: A small
plumbing business aims to create a competitive advantage by claiming the ability to assist
customers within two hours after receiving report of a problem. This business is focused on
providing a faster service than its competitors, and has chosen to focus on being responsive
as its competitive advantage. However, if the same business had only one vehicle in order to
save on transportation costs, its competitive and supply chain strategy goals would obviously
26 © University of South Africa
not align (since having only one vehicle would make it difficult to assist customers within two
hours). Managers should therefore ensure that their supply chains have the capabilities in
terms of responsiveness and cost-efficiency, in order to satisfy the targeted customers’
needs as specified in the competitive strategy (Chopra and Meindl, 2016:35-37; Nel,
2010:78).
To provide more detail on how small businesses can achieve a strategic fit between their
competitive and supply chain strategies, these strategies are considered individually in the
subsequent sections. Section 2.3, first considers the importance of a competitive advantage,
and secondly, reflects on how a competitive strategy can create a competitive advantage.
2.3 Competitive advantage and competitive strategies
The purpose of a competitive strategy is to guide a business in dealing with competition.
Competition is healthy and can directly result in improving the efficiency of a business,
mainly by reducing costs and/or increasing sales (Jooste et al., 2012:231; Porter, 2008:1). In
general, a competitive strategy is concerned with creating a competitive advantage for each
strategic business unit (SBU) within a larger business (Salavou, 2015:81; Soni and Kodali,
2011:73). Small businesses generally do not have different SBUs and compete in the market
with only one competitive strategy (see section 1.2.3.2). The success of any business,
including a small business, relies among others, on identifying a competitive advantage; and
before managers can select the appropriate competitive strategy, the competitive advantage
should be identified (Hatten, 2012:11; Jooste et al., 2012:231).
A competitive advantage is that differentiating factor (or a combination of factors) that
drives customers to purchase from a specific business rather than from their competitors
(Scarborough, 2011:89; Porter, 2008:1; Kotler, 1997:53). Therefore, managers must manage
processes and valuable resources (which include tangible and intangible assets) in order to
create a unique set of core capabilities that competitors do not have and will find difficult to
duplicate (Adeniran and Johnston, 2012:4090; Thompson and Martin, 2010:785). The core
capabilities of small businesses relate to the advantages of being small; and to ensure
success, small businesses should use their size as a source of competitive advantage, for
27 © University of South Africa
example by cultivating close relationships with their customers (Hatten, 2012:11). All
businesses, regardless of their size, should consider their products, their services, the
manner in which they sell these products or services, and the prices they charge, before
deciding on a competitive advantage (Scarborough, 2011:89-90). Scarborough (2011:99)
explains that in order to identify a source of competitive advantage, managers should have
thorough knowledge of the market environment or industry, as well as the customers and
competitors operating in these areas.
After selecting a competitive advantage, it must be sustained by developing and maintaining
a set of core capabilities which will enable the business to better serve its selected
customers over a significant period of time (Jooste et al., 2012:230; Scarborough, 2011:89;
Thompson and Martin, 2010:791). When the processes and resources of a business are rare
and hard to imitate, a sustainable competitive advantage can be obtained; and only then can
a superior financial performance (over the long run) be achieved (Banker, Mashruwala &
Tripathy, 2014:873).
2.3.1 Porter’s generic competitive strategy framework
Porter’s generic competitive strategy framework is the dominant framework for competitive
strategies within strategic management (Salavou, 2015:81; Lazenby, 2014:160; Hsieh and
Chen, 2011:14; Ehlers and Lazenby, 2010:179). Leitner and Güldenberg (2010:171) state that
Porter designed this framework with both large and small businesses in mind. Although
developed in 1980, recent research indicates that Porter’s strategy framework is still
relevant in the modern business environment (Banker et al., 2014:873). It remains one of the
most commonly used competitive strategy frameworks in empirical literature with regard to
small businesses (Leitner and Güldenberg, 2010:170). Although concerns (Salavou, 2015:86;
Hsieh and Chen, 2011:13) about the simplicity of Porter’s framework have been raised, it still
captures the essence of more complex competitive strategies, as it forms the foundation on
which these complex strategies were developed. Considering the influence of Porter’s
framework on the development of competitive strategies, Porter’s framework will form the
foundation for this study.
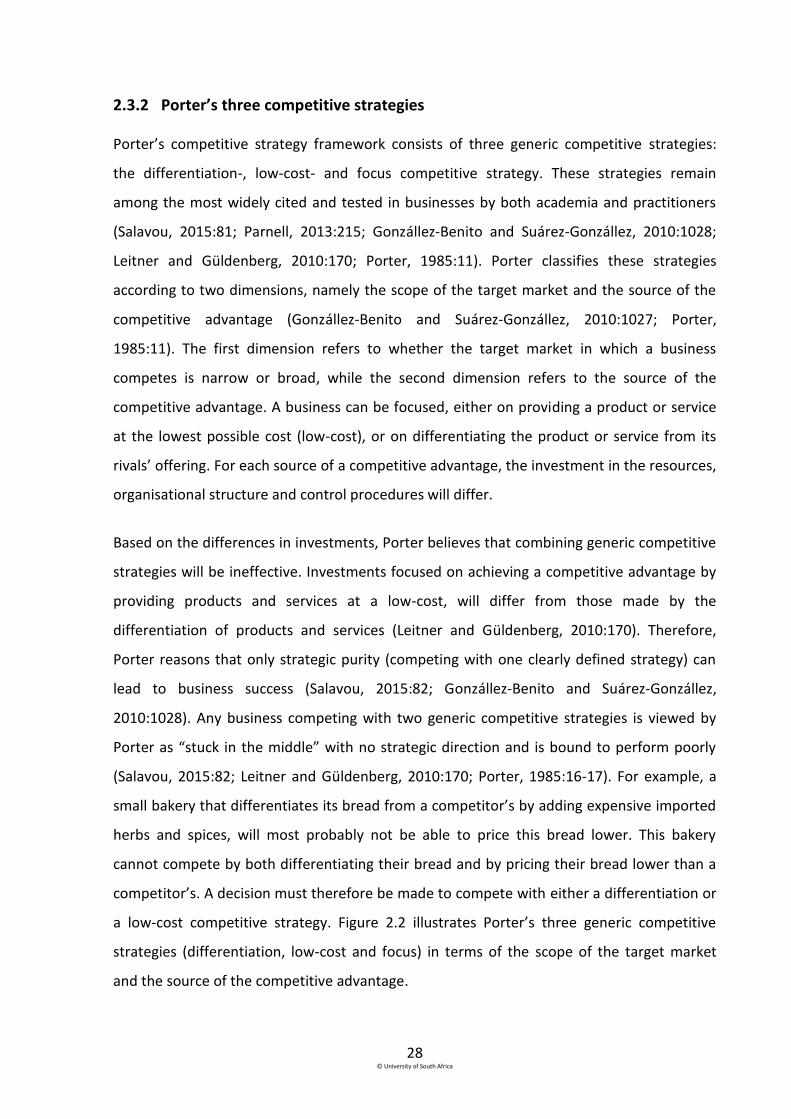
28 © University of South Africa
2.3.2 Porter’s three competitive strategies
Porter’s competitive strategy framework consists of three generic competitive strategies:
the differentiation-, low-cost- and focus competitive strategy. These strategies remain
among the most widely cited and tested in businesses by both academia and practitioners
(Salavou, 2015:81; Parnell, 2013:215; Gonzállez-Benito and Suárez-Gonzállez, 2010:1028;
Leitner and Güldenberg, 2010:170; Porter, 1985:11). Porter classifies these strategies
according to two dimensions, namely the scope of the target market and the source of the
competitive advantage (Gonzállez-Benito and Suárez-Gonzállez, 2010:1027; Porter,
1985:11). The first dimension refers to whether the target market in which a business
competes is narrow or broad, while the second dimension refers to the source of the
competitive advantage. A business can be focused, either on providing a product or service
at the lowest possible cost (low-cost), or on differentiating the product or service from its
rivals’ offering. For each source of a competitive advantage, the investment in the resources,
organisational structure and control procedures will differ.
Based on the differences in investments, Porter believes that combining generic competitive
strategies will be ineffective. Investments focused on achieving a competitive advantage by
providing products and services at a low-cost, will differ from those made by the
differentiation of products and services (Leitner and Güldenberg, 2010:170). Therefore,
Porter reasons that only strategic purity (competing with one clearly defined strategy) can
lead to business success (Salavou, 2015:82; Gonzállez-Benito and Suárez-Gonzállez,
2010:1028). Any business competing with two generic competitive strategies is viewed by
Porter as “stuck in the middle” with no strategic direction and is bound to perform poorly
(Salavou, 2015:82; Leitner and Güldenberg, 2010:170; Porter, 1985:16-17). For example, a
small bakery that differentiates its bread from a competitor’s by adding expensive imported
herbs and spices, will most probably not be able to price this bread lower. This bakery
cannot compete by both differentiating their bread and by pricing their bread lower than a
competitor’s. A decision must therefore be made to compete with either a differentiation or
a low-cost competitive strategy. Figure 2.2 illustrates Porter’s three generic competitive
strategies (differentiation, low-cost and focus) in terms of the scope of the target market
and the source of the competitive advantage.
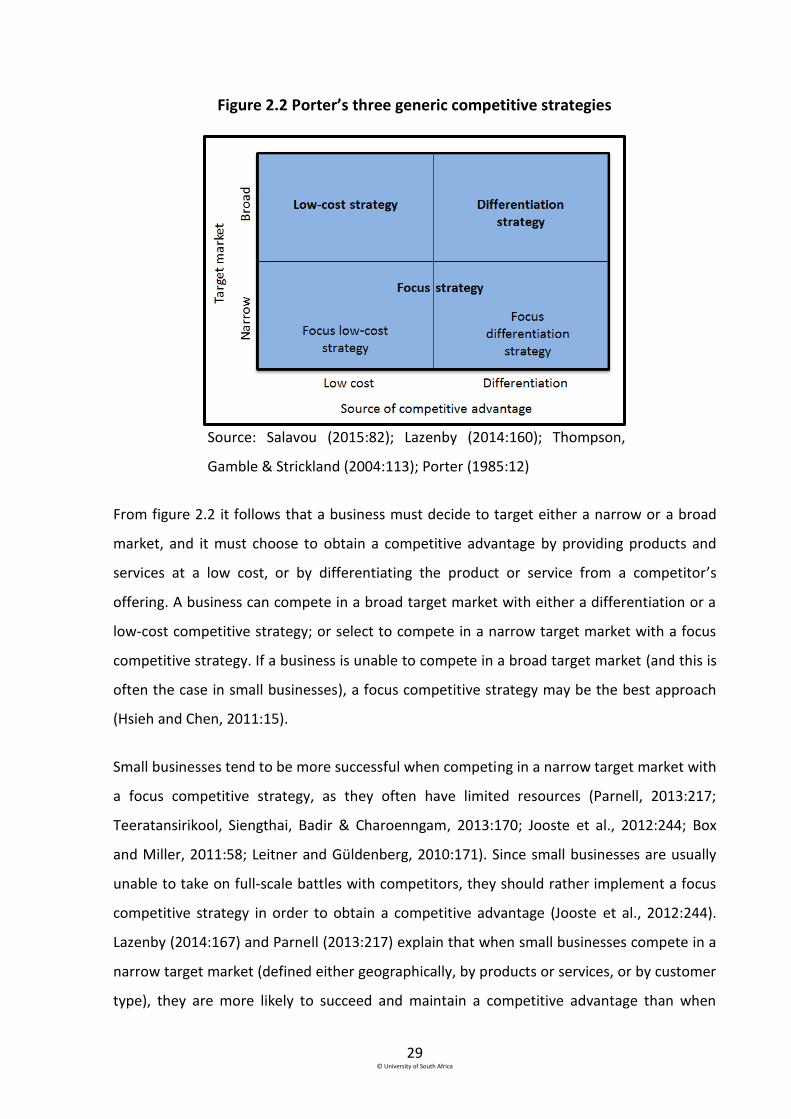
29 © University of South Africa
Figure 2.2 Porter’s three generic competitive strategies
Source: Salavou (2015:82); Lazenby (2014:160); Thompson,
Gamble & Strickland (2004:113); Porter (1985:12)
From figure 2.2 it follows that a business must decide to target either a narrow or a broad
market, and it must choose to obtain a competitive advantage by providing products and
services at a low cost, or by differentiating the product or service from a competitor’s
offering. A business can compete in a broad target market with either a differentiation or a
low-cost competitive strategy; or select to compete in a narrow target market with a focus
competitive strategy. If a business is unable to compete in a broad target market (and this is
often the case in small businesses), a focus competitive strategy may be the best approach
(Hsieh and Chen, 2011:15).
Small businesses tend to be more successful when competing in a narrow target market with
a focus competitive strategy, as they often have limited resources (Parnell, 2013:217;
Teeratansirikool, Siengthai, Badir & Charoenngam, 2013:170; Jooste et al., 2012:244; Box
and Miller, 2011:58; Leitner and Güldenberg, 2010:171). Since small businesses are usually
unable to take on full-scale battles with competitors, they should rather implement a focus
competitive strategy in order to obtain a competitive advantage (Jooste et al., 2012:244).
Lazenby (2014:167) and Parnell (2013:217) explain that when small businesses compete in a
narrow target market (defined either geographically, by products or services, or by customer
type), they are more likely to succeed and maintain a competitive advantage than when

30 © University of South Africa
competing in a broad target market. Larger businesses usually overlook specific market
segments that do not fall within the mainstream market; thereby enabling smaller
businesses to compete (Scarborough, 2011:249). It can therefore be concluded that a focus
strategy will allow small businesses to compete against larger businesses by focusing only on
a specific target market. As this study is focused on small retail businesses, specifically
operating within the boundaries of Soweto, it can be concluded from the literature that
Porter’s focus competitive strategy is the most appropriate competitive strategy for these
small businesses.LF2
2.3.3 The focus competitive strategy
A focus competitive strategy aims to create a sustainable competitive advantage by focusing
only on customers’ needs within a specific market segment (target market) usually with a
limited product range (Salavou, 2015:82; Louw and Venter, 2011:301). With a focus
competitive strategy a narrow target market is selected within an industry, and a specialised
strategy is developed to serve the needs of customers in that specific target market (Hsieh
and Chen, 2011:14-15). From figure 2.2 it follows that the focus competitive strategy
concentrates on a narrow target market with either differentiation or low-cost as the source
of the competitive advantage. A focus differentiation strategy entails that a small business
will focus on a specific segment in the market where customers require unique and different
products; whereas a focus low-cost strategy entails that a small business will focus on a
specific segment in the market where customers’ needs are less costly to satisfy (Salavou,
2015:82; Louw and Venter, 2011:301). Managers of small businesses should ensure that the
selected market segment is large enough to be profitable and that it offers opportunities for
growth (Lazenby, 2014:168-169). The two sources of competitive advantage, when using the
focus competitive strategy, are discussed below.
2.3.3.1 Focus differentiation competitive strategy
Differentiation as a source of competitive advantage for a focus competitive strategy can be
defined as the activities that small businesses undertake to add value to products and
services in order to distinguish them from the competition (Thompson and Martins,
2010:198). These differences should be unique and valued by customers (Teeratansirikool et
31 © University of South Africa
al., 2013:170; Hsieh and Chen, 2011:14). The more unique the product or service, the more
sustainable the competitive advantage becomes (Thompson and Martin, 2010:202).
Products and services must be differentiated to such an extent that customers will be willing
to pay more for these offerings (Jooste et al., 2012:231). The purpose of differentiating a
product or service is to generate brand or customer loyalty that will establish price-inelastic
demand (Salavou, 2015:82; Hsieh and Chen, 2011:14); which means that an increase in price
will have a minimal effect on the quantity demanded by customers. Price-inelastic demand
leads to higher profit margins, as customers are not sensitive to price increases and will not
refrain from purchasing the product or service when the price escalates (Salavou, 2015:82).
Businesses competing with a focus differentiation strategy can enjoy success, as long as the
unique features of the product or service are constantly upgraded to create new
differentiating features (Porter, 2008:14).
a) Factors that influence the success of the focus differentiation competitive strategy
Louw and Venter (2011:299) identify several factors that influence the success of
differentiating products or services, namely whether a business has a clear understanding of
its customers’ and competitors’ behaviour, knowing what customers deem as valuable and
to what extent customers are willing to pay for the differentiated products or services. Both
the market environment and the characteristics of the product or service must be
considered before managers can decide to use differentiation as a source of competitive
advantage. Differentiation is best suited when:
the market is characterised by diverse customer needs,
there are a small number of competitors in the market who follow a similar strategy,
the entry barriers to the market are high,
customers are less price-sensitive,
brand loyalty exists and customers will not readily change to a different brand,
customers value the unique characteristics and features of the product or service
(Lazenby, 2014:166).
Therefore, differentiation is best suited for a dynamic and uncertain environment that
involves new technologies, and unpredictable customer demand and competitor behaviour.
32 © University of South Africa
In a dynamic and uncertain environment, managers should emphasise flexibility to ensure
that the business can adapt to change (Parnell, 2013:217; Hsieh and Chen, 2011:14). Leitner
and Güldenberg (2010:169) studied the performance of small businesses that implemented
Porter’s generic competitive strategies and found that for these businesses, the most
suitable competitive advantage was the ability to respond flexibly to market needs. Many
researchers (Parnell, 2013:217; Bressler, 2012:3; Box and Miller, 2011:58; Leitner and
Güldenberg, 2010:171) agree that due to the limited resources and flexibility of small
businesses, they should compete by employing a focus differentiation strategy. Therefore,
when competing against large businesses, a small businesses’ competitive advantage more
often lies in its ability to be flexible, rather than to gain on economies of scale.
b) Methods to differentiate products and services
According to Porter (2008:14), numerous methods can be used by small businesses to
differentiate their products and services. These methods mainly include superior quality,
branding, distribution channels and other unique characteristics, such as the latest
technology (Hsieh and Chen, 2011:14; Thompson and Martin, 2010:197; Flint and Golicic,
2009:845). The quality of a product or service is usually evaluated through performance,
durability and reliability, and these characteristics are difficult to evaluate when a customer
is purchasing the product or service (Thompson and Martin, 2010:197). Having a reputation
for high quality products and services is a method of creating a competitive advantage (Su,
Linderman, Schroeder & Van de Ven, 2014:429). Customers evaluate the quality of the
product, based on their perception of the product. If the product appears to be of high
quality, customers usually assume that the performance, durability and reliability will be of
an acceptable standard - and as a result they are willing to pay a higher price (Jooste et al.,
2012:232). Services can be differentiated in terms of quality through superior staff skills,
friendliness and helpfulness (Lazenby, 2014:165). A small business can differentiate its
offering from the competition by ensuring that their products and services are of a higher
quality, for example, a small retail clothing store that specialises in creating traditional
African wear and uses only 100% cotton. Such a store differentiates itself from its
competition by its use of high quality material.

33 © University of South Africa
Branding is another method of differentiation. This entails that businesses name their
products or services in order to gain an identity and project an image, and to ultimately
position such offerings in the minds of customers (Louw and Venter, 2011:300). Through
branding, competitive products or services are distinguished from others and are provided
with specific symbolic value. Thus, the competitive advantage achieved lies in the image of
the product or service (Flint and Golicic, 2009:845). For example, a small plumbing business
known for its ability to fix complex plumbing problems, is likely to be the first choice of
customers when they experience a plumbing problem. By providing excellent service and
being able to repair the majority of problems, such a business can build a good reputation
and so differentiate itself from its competitors.
The distribution channel can also be used to differentiate a business from its rivals.
Businesses can select a distribution channel that is focused on providing customers with
products swiftly, or providing products at the lowest possible cost. A business can gain a
competitive advantage by employing either a more responsive or a more cost-efficient
distribution channel (Thompson and Martin, 2010:197; Flint and Golicic, 2009:845). For
example, if a small courier business strives to differentiate itself by providing customers with
the shortest possible delivery time, the courier must ensure that its distribution channel is
equipped to be responsive, which can be achieved by selecting the fastest mode of
transport.
Unique characteristics as a way to differentiate a business from its competitors, refer to
products or services that have distinguishable characteristics or features compared to those
offered by competitors. The unique characteristics of the product or service may even justify
a higher price (Jooste et al., 2012:235). However, maintaining a sustainable competitive
advantage through unique characteristics (and features) is difficult, as competitors are quick
to imitate such unique features (Jooste et al., 2012:234; Thompson and Martin, 2010:197).
With reference to the previous example of the small bakery that adds expensive imported
herbs and spices to its bread (section 2.3.2); it is almost certain that some competitors will
promptly imitate the unique product.
34 © University of South Africa
Small businesses can use one or a combination of the above methods of differentiation to
create a competitive advantage. In the next section the second source of competitive
advantage for a focus competitive strategy, namely low-cost, is discussed.
2.3.3.2 Focus low-cost competitive strategy
Low-cost as a source of competitive advantage in a focus competitive strategy can be
defined as providing products or services more cost-efficiently than competitors. Businesses
that select a focus low-cost competitive strategy, seek above-average returns over their
competitors by lowering overall costs and pricing products or services lower than their
opponents (Salavou, 2015:82). Gaining a competitive advantage through lower prices is
usually associated with standardised or functional products or services, and exploits scale
and cost advantages. Small businesses that compete with lower priced products or services
could increase sales by targeting price-sensitive customers with no brand loyalty, or
customers with low switching costs (Hsieh and Chen, 2011:14). According to Lazenby
(2014:163), low-cost, as a source of a competitive advantage, is best suited to a market
environment:
that is stable and predictable,
where new competitors enter the market with lower priced products,
that has opportunities to reduce cost through economies of scale,
where buyers have more bargaining power over the businesses that are selling the
products.
Lower prices can also be achieved by managing the internal processes of a business more
efficiently than its competitors. This can be done by eliminating unnecessary activities and
managing high-cost production processes more efficiently (Ehlers and Lazenby, 2010:181).
Furthermore, Jooste et al. (2012:239) state that a low-cost strategy is based on the interplay
of production costs, profit margins and market shares. This means that to ensure
profitability in the case of a manufacturing small business, the business should either have
lower profit margins, with a higher market share, or lower production costs with higher
profit margins. In the case of a small retail business, profitability could be ensured through
35 © University of South Africa
lower profit margins with a higher market share, or lower inventory carrying costs with
higher profit margins.
Cost drivers are factors that, when combined, determine the cost of a specific activity within
a business. The management of these cost drivers forms an important part of the success of
the focus low-cost competitive strategy (Porter, 2008:70). Cost drivers include economies of
scale; no-frills products or services; low-cost distribution; location cost advantages;
experience and learning-curve effects; and technological advances (Jooste et al., 2012:240-
241; Box and Miller, 2011:55; Hsieh and Chen, 2011:14). These cost drivers are discussed
briefly.
Economies of scale arise when a business can perform activities more efficiently in larger
numbers. Economies of scale exist in a manufacturer when the average cost of a product is
lower at a higher level of production (Celli, 2015:110). For example, the more units a
business produces, the more the cost per unit declines. In a retail business, economies of
scale exist when the average cost of goods (usually inventory) is lower when a larger
quantity of goods is purchased. Thus, economies of scale can be employed to keep costs low
and so create a source of competitive advantage by providing products and services at a
lower-cost. Economies of scale are more difficult to obtain by small businesses because of
their limited resources (Celli, 2015:110; Parnell, 2013:217).
Removing all nonessential items and accessories from products to create no-frills products
and services, is a basic approach to a competitive strategy focused on low-cost (Porter,
2008:13). By removing these nonessentials, costs are kept to the minimum, which is in line
with the low-cost strategy. For example, a small fast food business that does not offer free
delivery can sell food at a lower price, since no delivery costs are incurred (lower
transportation costs).
The distribution channel that a business employs to distribute products to customers,
impacts the cost of the product directly. Costs can be kept down when a low-cost
distribution channel is selected (Lazenby, 2014:162). The small fast food business mentioned
above, could keep, for example, transportation costs (as part of distribution costs) low by
rather making deliveries with a motorcycle that requires less fuel, than a van.
36 © University of South Africa
The location of a business impacts the logistical costs, such as transportation, facilities and
inventory costs. Businesses closer to upstream suppliers normally have lower inbound
logistical costs, but higher outbound logistical costs, and vice versa (Jooste et al., 2012:420-
241). When implementing a focus low-cost strategy, the location of the business should be
considered in order to minimise all logistical costs. For example, a small general retail store
that relies on the deliveries from wholesalers, might pay less for the delivery service if it was
located close to the wholesaler.
Experience and the learning-curve effect can positively influence a focus low-cost strategy.
When employees learn how to use technology better over time, costs can decrease due to
their improved experience (Banker et al., 2014:873; Hsieh and Chen, 2011:14). For example,
if a small bakery employs an inexperienced baker, his or her increased experience over time
could result in higher efficiency (less wasted ingredients) and increased production (making
the dough faster), which could ultimately lower costs.
By investing in cost-saving technology, the cost per unit can be reduced significantly (Banker
et al., 2014:873). Reducing costs through technological advances is often associated with
manufacturing activities, but cost-saving technology only provides a temporary cost
advantage, as competitors can easily obtain the same technology (Banker et al., 2014:875).
For example, if a small business that performs basic financial transactions purchases a
financial software program with appropriate financial functions, it could eliminate the need
for a bookkeeper (leading to cost-savings in terms of the bookkeeper’s salary) and ultimately
this could lead to a reduction in the price of the product or service, since some of the fixed
costs of the business would decline.
When small business owners or managers select the focus competitive strategy, regardless
of whether the source of competitive advantage is differentiation or low-cost, they must be
aware of the possible drawbacks in employing a focus competitive strategy.
2.3.3.3 Drawbacks of a focus competitive strategy
In this section some drawbacks that owners or managers of small businesses must consider
before implementing a focus competitive strategy, are noted below.

37 © University of South Africa
Although a focus competitive strategy may provide a business with an initial
competitive advantage, it is unlikely to provide a basis for sustainable long-term
growth as it is easy for a competitor, especially a larger competitor with more
resources, to duplicate the specific competitive advantage (Jooste et al., 2012:247).
Markets need to keep up with the changing needs and preferences of customers.
Such changes could influence a small business competing with a focus strategy
negatively, as customers in the specific market segment may prefer to purchase
products or services from other popular large suppliers in a broader target market
(Burns, 2011:179).
The risk of a competitor entering the market with a lower price or a more unique
product or service, may change the preference of customers in the specific market
segment and customers would more likely purchase the less expensive or more
unique product (Burns, 2011:179).
A small business succeeding in a specific market segment may attract competitors
(small or large) to the market segment, consequently increasing competition
(Scarborough, Wilson & Zimmerer, 2009:79).
A business competing with a focus competitive strategy serves a narrow market
segment and would usually purchase small quantities of inputs. The smaller the
quantity purchased, the less the small business’ bargaining power and the less the
cost advantage gained through economies of scale (Butler, 2006:261).
2.3.3.4 Comparison between focus differentiation and focus low-cost competitive
strategies
Although both focus differentiation and focus low-cost competitive strategies are deployed
in a narrow target market, these strategies differ in terms of the source of competitive
advantage, the market environment, the type of products or services, as well as customer
demand. The differences between these strategies are listed in table 2.1. The focus
differentiation competitive strategy is best suited for businesses that provide innovative
products characterised by uncertain and unpredictable customer demand within an unstable
and dynamic market environment; whereas a focus low-cost competitive strategy is best
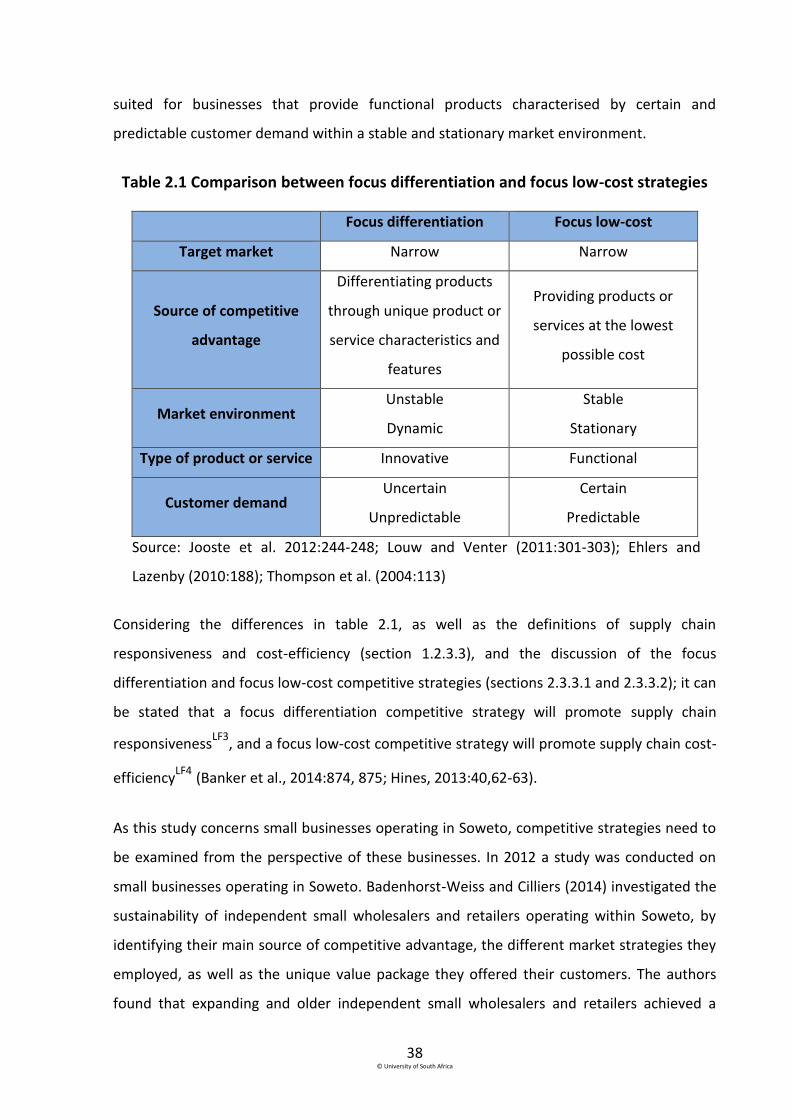
38 © University of South Africa
suited for businesses that provide functional products characterised by certain and
predictable customer demand within a stable and stationary market environment.
Table 2.1 Comparison between focus differentiation and focus low-cost strategies
Focus differentiation Focus low-cost
Target market Narrow Narrow
Source of competitive
advantage
Differentiating products
through unique product or
service characteristics and
features
Providing products or
services at the lowest
possible cost
Market environment Unstable
Dynamic
Stable
Stationary
Type of product or service Innovative Functional
Customer demand Uncertain
Unpredictable
Certain
Predictable
Source: Jooste et al. 2012:244-248; Louw and Venter (2011:301-303); Ehlers and
Lazenby (2010:188); Thompson et al. (2004:113)
Considering the differences in table 2.1, as well as the definitions of supply chain
responsiveness and cost-efficiency (section 1.2.3.3), and the discussion of the focus
differentiation and focus low-cost competitive strategies (sections 2.3.3.1 and 2.3.3.2); it can
be stated that a focus differentiation competitive strategy will promote supply chain
responsivenessLF3
, and a focus low-cost competitive strategy will promote supply chain cost-
efficiencyLF4 (Banker et al., 2014:874, 875; Hines, 2013:40,62-63).
As this study concerns small businesses operating in Soweto, competitive strategies need to
be examined from the perspective of these businesses. In 2012 a study was conducted on
small businesses operating in Soweto. Badenhorst-Weiss and Cilliers (2014) investigated the
sustainability of independent small wholesalers and retailers operating within Soweto, by
identifying their main source of competitive advantage, the different market strategies they
employed, as well as the unique value package they offered their customers. The authors
found that expanding and older independent small wholesalers and retailers achieved a
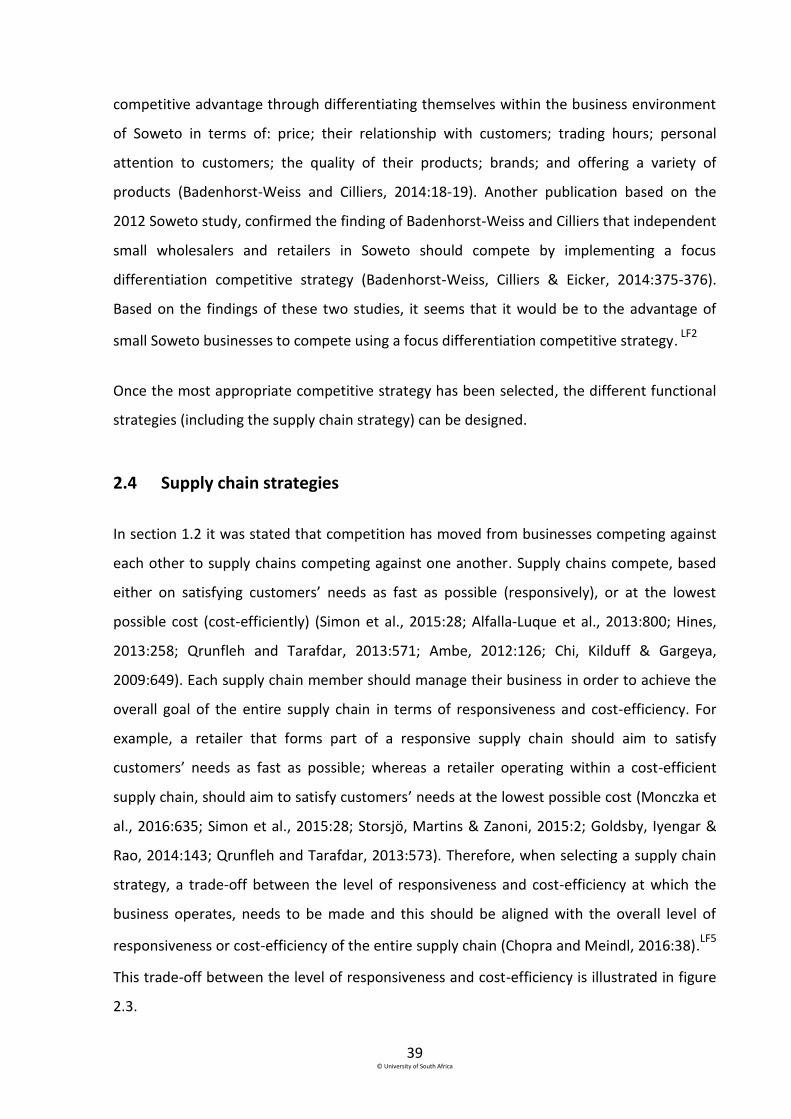
39 © University of South Africa
competitive advantage through differentiating themselves within the business environment
of Soweto in terms of: price; their relationship with customers; trading hours; personal
attention to customers; the quality of their products; brands; and offering a variety of
products (Badenhorst-Weiss and Cilliers, 2014:18-19). Another publication based on the
2012 Soweto study, confirmed the finding of Badenhorst-Weiss and Cilliers that independent
small wholesalers and retailers in Soweto should compete by implementing a focus
differentiation competitive strategy (Badenhorst-Weiss, Cilliers & Eicker, 2014:375-376).
Based on the findings of these two studies, it seems that it would be to the advantage of
small Soweto businesses to compete using a focus differentiation competitive strategy. LF2
Once the most appropriate competitive strategy has been selected, the different functional
strategies (including the supply chain strategy) can be designed.
2.4 Supply chain strategies
In section 1.2 it was stated that competition has moved from businesses competing against
each other to supply chains competing against one another. Supply chains compete, based
either on satisfying customers’ needs as fast as possible (responsively), or at the lowest
possible cost (cost-efficiently) (Simon et al., 2015:28; Alfalla-Luque et al., 2013:800; Hines,
2013:258; Qrunfleh and Tarafdar, 2013:571; Ambe, 2012:126; Chi, Kilduff & Gargeya,
2009:649). Each supply chain member should manage their business in order to achieve the
overall goal of the entire supply chain in terms of responsiveness and cost-efficiency. For
example, a retailer that forms part of a responsive supply chain should aim to satisfy
customers’ needs as fast as possible; whereas a retailer operating within a cost-efficient
supply chain, should aim to satisfy customers’ needs at the lowest possible cost (Monczka et
al., 2016:635; Simon et al., 2015:28; Storsjö, Martins & Zanoni, 2015:2; Goldsby, Iyengar &
Rao, 2014:143; Qrunfleh and Tarafdar, 2013:573). Therefore, when selecting a supply chain
strategy, a trade-off between the level of responsiveness and cost-efficiency at which the
business operates, needs to be made and this should be aligned with the overall level of
responsiveness or cost-efficiency of the entire supply chain (Chopra and Meindl, 2016:38).LF5
This trade-off between the level of responsiveness and cost-efficiency is illustrated in figure
2.3.
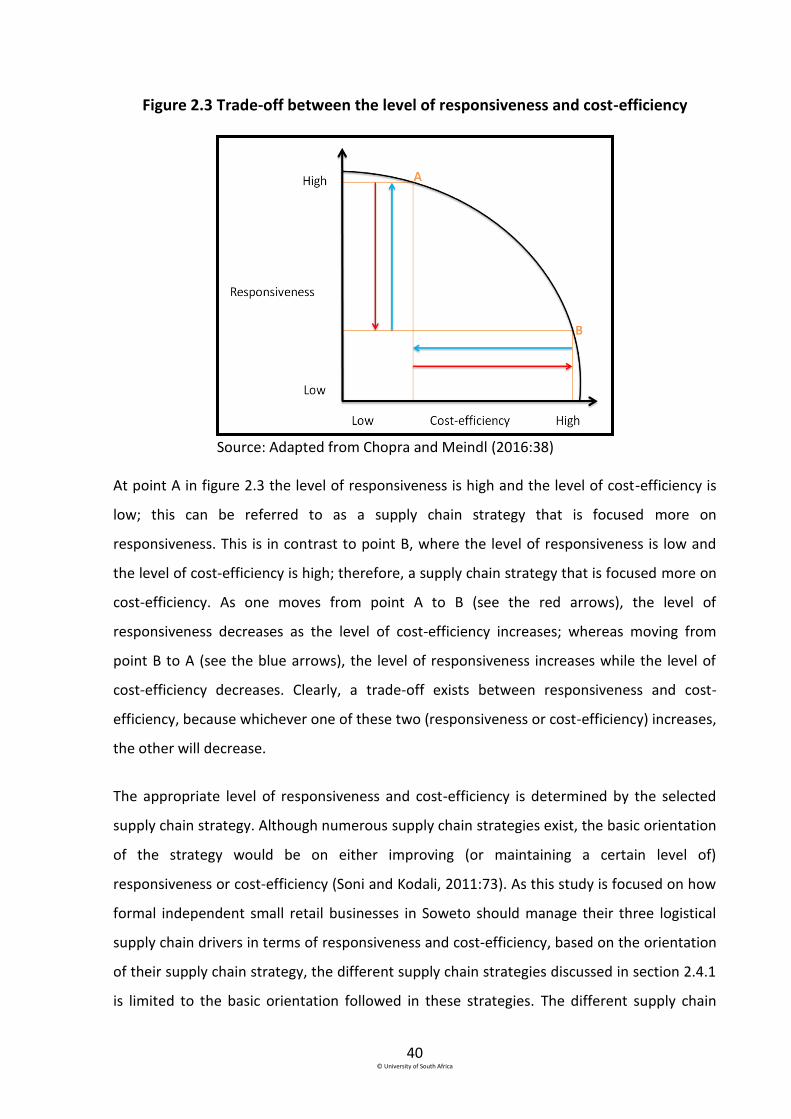
40 © University of South Africa
Figure 2.3 Trade-off between the level of responsiveness and cost-efficiency
Source: Adapted from Chopra and Meindl (2016:38)
At point A in figure 2.3 the level of responsiveness is high and the level of cost-efficiency is
low; this can be referred to as a supply chain strategy that is focused more on
responsiveness. This is in contrast to point B, where the level of responsiveness is low and
the level of cost-efficiency is high; therefore, a supply chain strategy that is focused more on
cost-efficiency. As one moves from point A to B (see the red arrows), the level of
responsiveness decreases as the level of cost-efficiency increases; whereas moving from
point B to A (see the blue arrows), the level of responsiveness increases while the level of
cost-efficiency decreases. Clearly, a trade-off exists between responsiveness and cost-
efficiency, because whichever one of these two (responsiveness or cost-efficiency) increases,
the other will decrease.
The appropriate level of responsiveness and cost-efficiency is determined by the selected
supply chain strategy. Although numerous supply chain strategies exist, the basic orientation
of the strategy would be on either improving (or maintaining a certain level of)
responsiveness or cost-efficiency (Soni and Kodali, 2011:73). As this study is focused on how
formal independent small retail businesses in Soweto should manage their three logistical
supply chain drivers in terms of responsiveness and cost-efficiency, based on the orientation
of their supply chain strategy, the different supply chain strategies discussed in section 2.4.1
is limited to the basic orientation followed in these strategies. The different supply chain
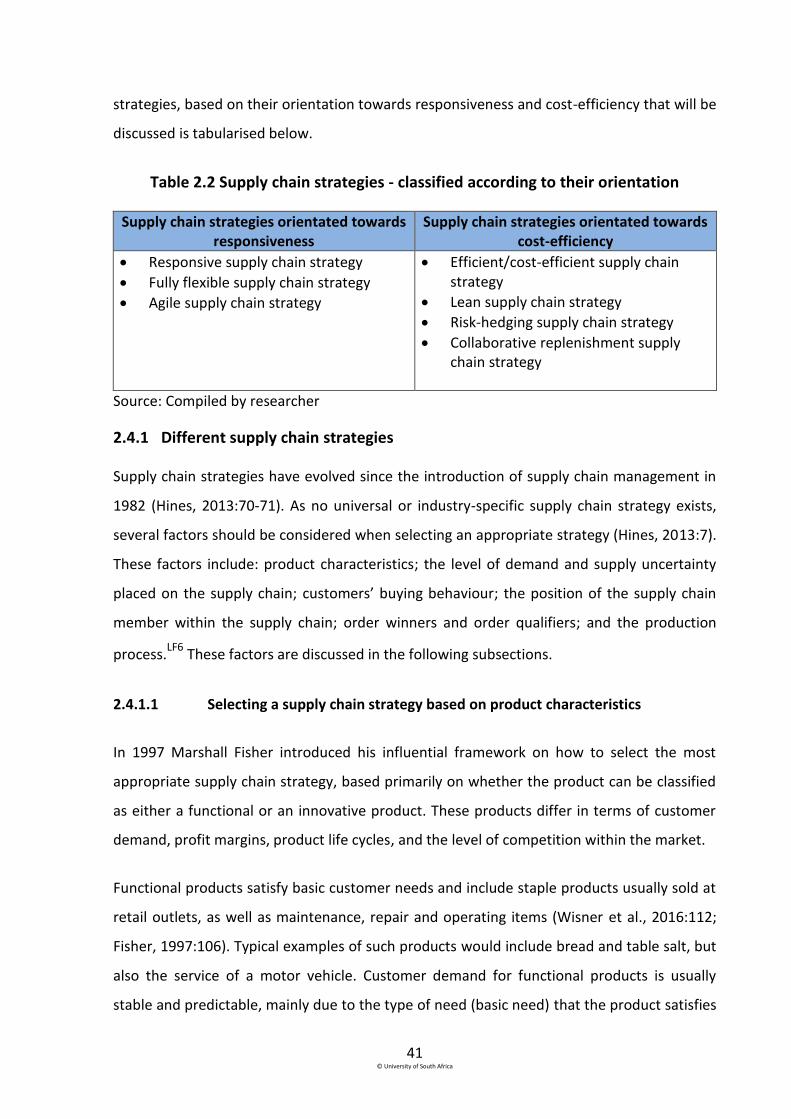
41 © University of South Africa
strategies, based on their orientation towards responsiveness and cost-efficiency that will be
discussed is tabularised below.
Table 2.2 Supply chain strategies - classified according to their orientation
Supply chain strategies orientated towards responsiveness
Supply chain strategies orientated towards cost-efficiency
Responsive supply chain strategy
Fully flexible supply chain strategy
Agile supply chain strategy
Efficient/cost-efficient supply chain strategy
Lean supply chain strategy
Risk-hedging supply chain strategy
Collaborative replenishment supply chain strategy
Source: Compiled by researcher
2.4.1 Different supply chain strategies
Supply chain strategies have evolved since the introduction of supply chain management in
1982 (Hines, 2013:70-71). As no universal or industry-specific supply chain strategy exists,
several factors should be considered when selecting an appropriate strategy (Hines, 2013:7).
These factors include: product characteristics; the level of demand and supply uncertainty
placed on the supply chain; customers’ buying behaviour; the position of the supply chain
member within the supply chain; order winners and order qualifiers; and the production
process.LF6
These factors are discussed in the following subsections.
2.4.1.1 Selecting a supply chain strategy based on product characteristics
In 1997 Marshall Fisher introduced his influential framework on how to select the most
appropriate supply chain strategy, based primarily on whether the product can be classified
as either a functional or an innovative product. These products differ in terms of customer
demand, profit margins, product life cycles, and the level of competition within the market.
Functional products satisfy basic customer needs and include staple products usually sold at
retail outlets, as well as maintenance, repair and operating items (Wisner et al., 2016:112;
Fisher, 1997:106). Typical examples of such products would include bread and table salt, but
also the service of a motor vehicle. Customer demand for functional products is usually
stable and predictable, mainly due to the type of need (basic need) that the product satisfies

42 © University of South Africa
(Fawcett et al., 2007:228). Since the stable and predictable demand for functional products
attracts large numbers of competitors, these products are characterised by low-profit
margins, long life-cycles and high levels of competition (Wisner et al., 2016:112; Hong and
Jeong, 2006:296; Lee, 2002:106; Fisher, 1997:106). The fact that customers are price-
sensitive towards functional products implies that the ideal supply chain strategy for these
products is a cost-efficient strategy which is focused on keeping costs low by advocating
economies of scale and optimisation techniques (see section 2.3.3.2). Economies of scale
and optimisation techniques are aimed at ensuring the best capacity utilisation throughout
the production and distribution processes (Monczka et al., 2016:636; Qrunfleh and Tarafdar,
2013:573; Fawcett et al., 2007:228).
Innovative products consist of new products, such as the latest fashion items or
technological devices (Wisner et al., 2016:112). In contrast to functional products, customer
demand for innovative products is unstable and unpredictable; and they are characterised
by high-profit margins, short life-cycles and lower levels of competition (Fawcett et al.,
2007:228; Lee, 2002:106; Fisher, 1997:106). Therefore, serving a market with innovative
products necessitates flexibility in order to meet customers’ unstable and unpredictable
demands. As a result, the ideal supply chain strategy for innovative products would be a
responsive strategy that is focused on flexibility and speed. This strategy will enable the
business to adapt rapidly to market changes, but it will wait until a customer’s need
becomes known, before reacting to it (Morita, Machuca, De los Rios & Flynn, 2015:2;
Qrunfleh and Tarafdar, 2013:573; Wieland and Wallenburg, 2012:890; Merschmann and
Thonemann, 2011:43; Fawcett et al., 2007:228). For example, a small restaurant should have
all the ingredients to prepare the meals listed on its menu on hand, but only once a
customer orders an item, will the demand become known and will the restaurateur act on
the demand. Considering the differences between functional and innovative products, Fisher
(1997:106) argues that a cost-efficient supply chain strategy is best suited for functional
products, and a responsive supply chain strategy for innovative products. Figure 2.4
illustrates Fisher’s framework in terms of matching the appropriate type of supply chain
(cost-efficient or responsive) with the product classification (functional or innovative).
43 © University of South Africa
Figure 2.4 Matching the type of product with a specific supply chain
Functional products Innovative products
Cost-efficient supply chain Match Mismatch
Responsive supply chain Mismatch Match
Source: Fisher (1997:109)
The main shortcoming of Fisher’s framework is that only the uncertainty that customer
demand places on the supply chain is considered when selecting a strategy, and not the
uncertainties involving the supply process, such as the ability of a contractor to supply a
product or service (Lee, 2002:107). In an attempt to address the limitations of Fisher’s
framework, Lee (2002) developed an “uncertainty framework” to assist managers in the
selection of supply chain strategies. This framework includes the uncertainties that both the
customer and the supplier place on the supply chain.
2.4.1.2 Selecting a supply chain strategy based on customer and supplier
uncertainties
Lee agrees with Fisher that customer demand is influenced by the type of product required,
but argues that the uncertainties that the supply chain’s capabilities place on the chain (such
as technology and the reliability of suppliers), should also be considered when selecting the
most appropriate supply chain strategy (Chopra and Meindl, 2016:36; Qrunfleh and
Tarafdar, 2013:573). In terms of supply uncertainties and the capabilities of a supply chain, a
supply process can be classified either as stable or evolving (Lee, 2002:107). A product with
predictable customer demand and a stable or evolving supply process cannot be managed in
the same way as a product with unpredictable customer demand and a stable or evolving
supply process; different supply chain strategies are required (Lee, 2002:105).
Within a stable supply process mature technology is usually implemented, limited capacity
constraints exist and dependable lead-times are present. A stable supply process tends to be
highly automated, simple and manageable, and has an established supplier base where long-
term supply contracts can be formed (Lee, 2002:107). On the other hand, an evolving supply
process is often subjected to breakdowns, has capacity constraints, has undependable lead-
times and usually implements technology that is rigid or still in the developmental stage. The
supplier base in an evolving supply process is typically small, inexperienced and unreliable,
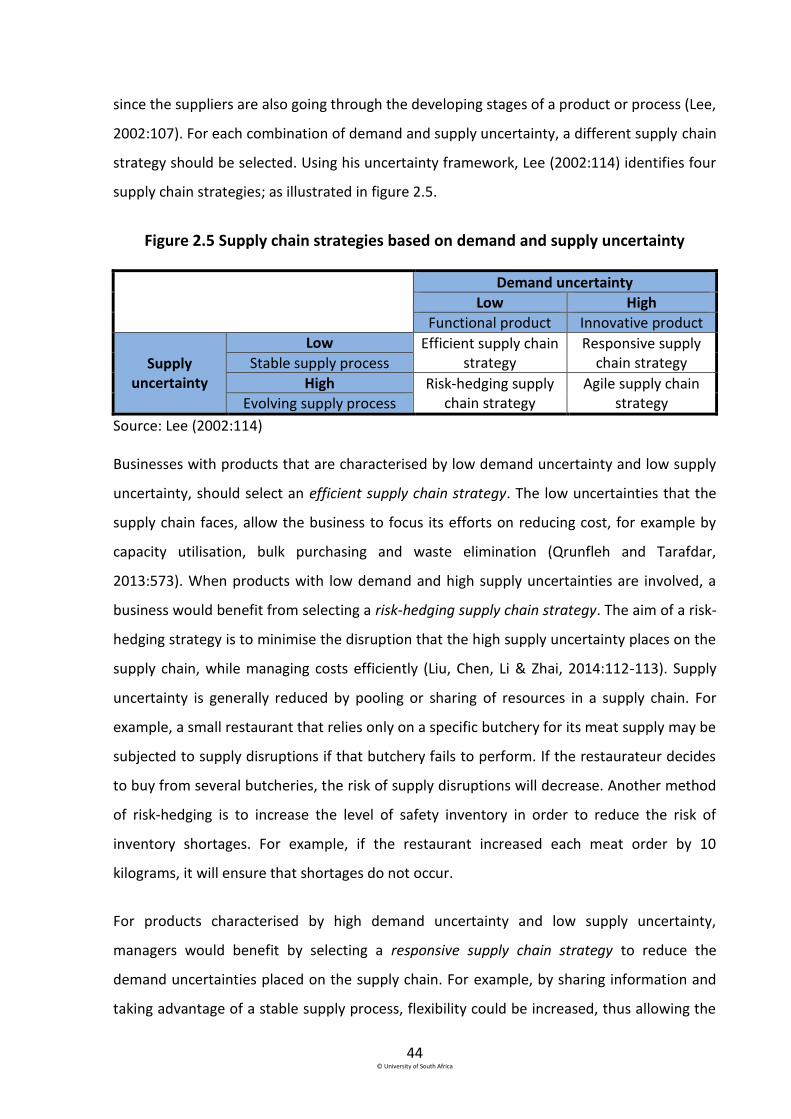
44 © University of South Africa
since the suppliers are also going through the developing stages of a product or process (Lee,
2002:107). For each combination of demand and supply uncertainty, a different supply chain
strategy should be selected. Using his uncertainty framework, Lee (2002:114) identifies four
supply chain strategies; as illustrated in figure 2.5.
Figure 2.5 Supply chain strategies based on demand and supply uncertainty
Demand uncertainty
Low High
Functional product Innovative product
Supply uncertainty
Low Efficient supply chain strategy
Responsive supply chain strategy Stable supply process
High Risk-hedging supply chain strategy
Agile supply chain strategy Evolving supply process
Source: Lee (2002:114)
Businesses with products that are characterised by low demand uncertainty and low supply
uncertainty, should select an efficient supply chain strategy. The low uncertainties that the
supply chain faces, allow the business to focus its efforts on reducing cost, for example by
capacity utilisation, bulk purchasing and waste elimination (Qrunfleh and Tarafdar,
2013:573). When products with low demand and high supply uncertainties are involved, a
business would benefit from selecting a risk-hedging supply chain strategy. The aim of a risk-
hedging strategy is to minimise the disruption that the high supply uncertainty places on the
supply chain, while managing costs efficiently (Liu, Chen, Li & Zhai, 2014:112-113). Supply
uncertainty is generally reduced by pooling or sharing of resources in a supply chain. For
example, a small restaurant that relies only on a specific butchery for its meat supply may be
subjected to supply disruptions if that butchery fails to perform. If the restaurateur decides
to buy from several butcheries, the risk of supply disruptions will decrease. Another method
of risk-hedging is to increase the level of safety inventory in order to reduce the risk of
inventory shortages. For example, if the restaurant increased each meat order by 10
kilograms, it will ensure that shortages do not occur.
For products characterised by high demand uncertainty and low supply uncertainty,
managers would benefit by selecting a responsive supply chain strategy to reduce the
demand uncertainties placed on the supply chain. For example, by sharing information and
taking advantage of a stable supply process, flexibility could be increased, thus allowing the

45 © University of South Africa
supply chain to operate more successfully (Lee, 2002:108). When products with high
customer demand and high supply uncertainties are involved, a business would benefit from
selecting an agile supply chain strategy. This would ensure flexibility and responsiveness to
uncertain customer demand, while reducing the risks of supply uncertainties (Gligor and
Holcomb, 2012:438-439; Merschmann and Thonemann, 2011:43). An agile supply chain
strategy combines the strengths of both a risk-hedging and a responsive strategy. It
decreases supply uncertainties while meeting customer demand efficiently (increased
flexibility) (Qrunfleh and Tarafdar, 2013:579). For example, a small electronics vendor who
sells the latest cell phones, sound systems and television sets, would benefit from an agile
supply chain strategy, since the supply and customer demand uncertainties faced by the
retailer is high. An agile supply chain strategy would enable the retailer to respond to the
changing needs of customers through increased flexibility and by reducing the risk of supply
uncertainties. This can be achieved, for example by either retaining more than one supplier
for a product, or by increasing the level of safety inventory.
Although Lee (2002:113-114) identifies four supply chain strategies, the orientation of each
strategy remains towards either responsiveness (responsive and agile supply chain
strategies) or cost-efficiency (efficient and risk-hedging supply chain strategies).
Another option open to managers when selecting an appropriate supply chain strategy, is to
consider the influence of customers' buying behaviour on the uncertainties that the supply
chain faces. For example, customers who rush to fill-up their cars when there are reports of
a pending strike will increase the demand and supply uncertainties for fuel (Gattorna,
2010:39-40). Normally fuel is classified as having low demand and supply uncertainties, but
due to the buying behaviour of users, both the demand and supply uncertainties increase
when more fuel is demanded by customers and more fuel needs to be provided by suppliers.
Therefore, when selecting an appropriate supply chain strategy, the influence of customer
buying behaviour should be borne in mind to enable a business to meet customer demand
(Christopher and Gattorna, 2005:118).
46 © University of South Africa
2.4.1.3 Selecting a supply chain strategy based on customer buying behaviour
The literature describes numerous ways in which customers can be segmented, for example
by geography, size, revenue, price point, product characteristics, profitability and revenue
(Gattorna, 2010:36). However, Gattorna (2010:36) considers these segmentations as
irrelevant, since they interpret only transactional data, which is usually gathered over long
periods of time. Customers’ preferences and needs change on a regular basis, as stated by
Gattorna (2010:36) and therefore faster and better ways of keeping up with these
preferences and needs are necessary. He argues that behavioural data should be considered
when segmenting customers, since buying behaviours identify the evolvement of customers’
preferences and needs. According to Gattorna (2003:31), four buying behaviours are
pertinent, namely collaborative, efficient, demanding and innovative behaviours.
a) Customers with collaborative buying behaviour
In collaborative buying behaviour, suppliers aim to create a close working relationship with
customers. Suppliers and customers collaborate by sharing information, forming strategic
partnerships and building trustworthy relationships (Gattorna, 2010:169). A supply chain
strategy developed for customers with this type of behaviour, entails that the different
supply chain members focus on providing a stable source of supply and satisfying the end-
customers’ demands in the most cost-efficient way and is referred to as a collaborative
replenishment supply chain strategy (Christopher and Gattorna, 2005:119-120; Gattorna,
2003:31-33). For example, a supplier who provides a hairdresser with a specific range of
colouring products could benefit from selecting a collaborative replenishment supply chain
strategy as a trustworthy relationship between the hairdresser and the supplier could lead
to sharing of information (such as demand forecasts) and ultimately could reduce costs.
b) Customers with efficient buying behaviour
Suppliers serving customers with efficient buying behaviour should focus on providing
products or services at the lowest possible cost. Efficient buying behaviour customers are
characterised by their predictable demand, their price-sensitivity and their regular purchases
from a specific supplier. Suppliers should focus on reducing any supply uncertainties by
47 © University of South Africa
ensuring that ample products are available at the lowest possible cost. A supply chain
strategy for customers with efficient customer behaviour should focus on economies of scale
through synergy and low-cost processes; and this is referred to as a lean supply chain
strategy (Christopher and Gattorna, 2005:119-120; Gattorna, 2003:31-33). For example, a
small tavern providing beer to customers at a low cost would benefit from implementing a
lean supply chain strategy as the predictable customer demand and low supply uncertainty
of beer, would enable the tavern to respond cost-efficiently to customer demand.
c) Customers with demanding buying behaviour
Customers with demanding buying behaviour require that a supplier responds rapidly to
their demands. Demanding customers usually purchase on an ad-hoc basis and they value
suppliers’ responsiveness and flexibility more than a long-term relationship and cost-
efficiency. Therefore, an agile supply chain strategy that is focused on responding rapidly to
unpredictable customer demand and uncertain supply conditions, is required (Qrunfleh and
Tarafdar, 2013:573; Christopher and Gattorna, 2005:119-120; Gattorna, 2003:31-33). A small
business retailing an innovative product characterised by unpredictable customer demand
and uncertain supply, such as the latest high-tech cell phones, would benefit by selecting an
agile supply chain strategy. Selecting an agile supply chain strategy would allow the business
to adapt to unpredictable customer demand and uncertainties in supply of the high-tech cell
phones.
d) Customers with innovative buying behaviour
Customers with innovative buying behaviour are characterised by unpredictable demand.
They require innovative products and solutions from suppliers within a short time-frame.
The implementation of a hedging or deployment strategy, referred to as a fully-flexible
supply chain strategy, would allow suppliers to be flexible and to offer these customers new
products more frequently (Merschmann and Thonemann, 2011:44; Christopher and
Gattorna, 2005:119-120; Gattorna, 2003:31-33). A fully-flexible supply chain strategy is often
referred to as an “emergency supply chain” as it focuses on developing the capabilities
required in order to operate in the face of unforeseen and unplanned events and is
therefore more suitable for governmental institutions (Gattorna, 2010:252). For example, to

48 © University of South Africa
execute a relief mission after a natural disaster, suppliers who are highly flexible should be
used.
To summarise, the different supply chain strategies that can be employed, based on
customer buying behaviour, would be orientated towards either cost-efficiency or
responsiveness. Collaborative replenishment and lean supply chain strategies are orientated
towards achieving cost-efficiency; whereas agile and fully-flexible supply chain strategies are
orientated towards responsiveness.
2.4.1.4 Additional factors to consider when selecting a supply chain strategy
Various authors (Ambe, 2012; Duarte and Machado, 2011; Martinez-Olvera and Shunk,
2006; Christopher and Towill, 2002) identify additional factors that managers should
consider when selecting an appropriate supply chain strategy. These factors include the
position of the supply chain member within the supply chain; whether the product is a
market winner or qualifier; as well as the type of production process that is implemented.
The influence of these factors on the type of supply chain strategy will differ depending on
the industry in which the business operates. The influence of the different factors on the
selected supply chain, as identified above, is discussed briefly below.
a) The position of the supply chain member within the supply chain
Thus far supply chains and the different supply chain strategies have been discussed in terms
of their orientation towards responsiveness or cost-efficiency; but in reality is it possible for
a supply chain to combine both, and then it is referred to as a leagile supply chain (Towill
and Christopher, 2002:299). Within a leagile supply chain, certain members can be focused
on cost-efficiency, while others can be focused on responsiveness. Figure 2.6 illustrates such
a supply chain.

49 © University of South Africa
Figure 2.6 A supply chain that combines cost-efficient and responsive strategies
Source: Compiled by researcher
A leagile supply chain consists of both push-based and pull-based processes. A push-based
process uses demand forecasts to predict future customer demand, and supplies products
accordingly at the lowest possible cost. A pull-based process, on the other hand, reacts only
once a customer’s need is known, and therefore requires a supply chain that can react to
this need in a timeous manner. A pull-based process can also be referred to as a “wait-and-
see” approach, since a business only commits to produce or source a product once the
customer’s demand becomes known (Qrunfleh and Tarafdar, 2013:573). Therefore, a push-
based supply chain requires a strategy focused on cost-efficiency, whereas a pull-based
supply chain requires a strategy focused on responsiveness (Ambe, 2012:135-136; Simchi-
Levi, Kaminsky & Simchi-Levi, 2003:190).
With a leagile supply chain it is important to determine at what point the supply chain
should be managed cost-efficiently and where it should be managed responsively. This point,
where the one supply chain strategy is replaced with the other, is known as the decoupling
point (see figure 2.6) (Hines, 2013:258). Leagile supply chains are mainly associated with
manufacturing supply chains, such as in the automotive industry (Christopher, 2011:99-100).
Since this study is focused on formal independent small businesses operating within the
retail sector, a leagile supply chain strategy is not applicable to this study.
50 © University of South Africa
b) Classification of the product or service as either a market winner or a market
qualifier
Products or services can be classified as either market winners or market qualifiers. Market
qualifiers refer to the minimum requirements, such as price or quality, that products or
services should have in order to compete within a specific market; whereas market winners
refer to products or services with characteristics in excess of market qualifiers (Martinez-
Olvera and Shunk, 2006:4513; Mason-Jones, Naylor & Towill, 2000:4061). Depending on the
minimum requirements (in the case of a market qualifier) and the additional features (in the
case of a market winner) the supply chain strategy should be focused on either cost-
efficiency or responsiveness (Mason-Jones et al., 2000:4063; Rahimnia and Moghadasian,
2010:801). If the market qualifier or winner is low-cost the supply chain strategy should be
focused on cost-efficiency, whereas if the market qualifier or winner is the additional
features of the product the supply chain strategy should be focused on responsiveness. In a
market where a low price is a necessity, any business that prices its product or service in line
with that of its competitors will be classified as a market qualifier, but a business that
provides its product or service at a higher quality and price, will be classified as a market
winner. For example, if the market winner is low cost, a small bakery would benefit by
selecting a supply chain strategy orientated toward cost-efficiency in order to provide
customers with the lowest priced products.
c) Type of production process
Production processes and their manufacturing environments are designed for either mass
production or mass customisation. Within a mass production process the ability to
accurately forecast demand is a necessity, as mass production usually focuses on reducing
costs through synergies and economies of scale. On the other hand, a mass customisation
production process is designed to customise products according to customer demand. A
mass production process requires an efficient supply chain strategy, whereas a mass
customisation process requires a responsive supply chain strategy (Zhang and Chen,
2006:668). As this study is focused on small businesses operating within the retail sector,
production processes as a factor that influences the selection of an appropriate supply chain
strategy is not considered further.
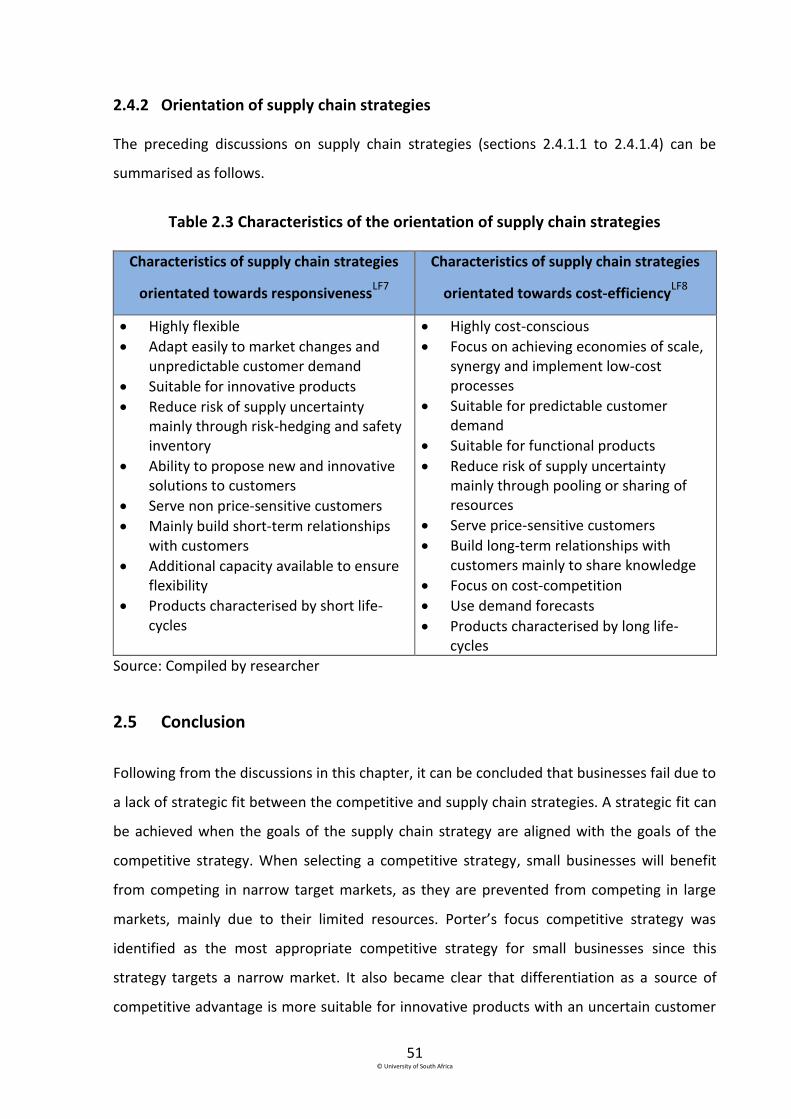
51 © University of South Africa
2.4.2 Orientation of supply chain strategies
The preceding discussions on supply chain strategies (sections 2.4.1.1 to 2.4.1.4) can be
summarised as follows.
Table 2.3 Characteristics of the orientation of supply chain strategies
Characteristics of supply chain strategies
orientated towards responsivenessLF7
Characteristics of supply chain strategies
orientated towards cost-efficiencyLF8
Highly flexible
Adapt easily to market changes and unpredictable customer demand
Suitable for innovative products
Reduce risk of supply uncertainty mainly through risk-hedging and safety inventory
Ability to propose new and innovative solutions to customers
Serve non price-sensitive customers
Mainly build short-term relationships with customers
Additional capacity available to ensure flexibility
Products characterised by short life-cycles
Highly cost-conscious
Focus on achieving economies of scale, synergy and implement low-cost processes
Suitable for predictable customer demand
Suitable for functional products
Reduce risk of supply uncertainty mainly through pooling or sharing of resources
Serve price-sensitive customers
Build long-term relationships with customers mainly to share knowledge
Focus on cost-competition
Use demand forecasts
Products characterised by long life-cycles
Source: Compiled by researcher
2.5 Conclusion
Following from the discussions in this chapter, it can be concluded that businesses fail due to
a lack of strategic fit between the competitive and supply chain strategies. A strategic fit can
be achieved when the goals of the supply chain strategy are aligned with the goals of the
competitive strategy. When selecting a competitive strategy, small businesses will benefit
from competing in narrow target markets, as they are prevented from competing in large
markets, mainly due to their limited resources. Porter’s focus competitive strategy was
identified as the most appropriate competitive strategy for small businesses since this
strategy targets a narrow market. It also became clear that differentiation as a source of
competitive advantage is more suitable for innovative products with an uncertain customer

52 © University of South Africa
demand, operating in an unstable and dynamic market environment, and when less price-
sensitive customers are served. Small business managers using the focus differentiation
competitive strategy, should ensure that they are equipped to operate in this unstable and
dynamic market environment, by being flexible. They should implement appropriate
functional strategies in order to adapt easily to changes in the market and fluctuating
customer demand. In other words, these strategies must be managed to be responsive. It
was established that the focus low-cost competitive strategy is more suitable for functional
products with certain customer demand, operating in stable and stationary markets and
serving price-sensitive customers. Small businesses competing with a focus low-cost
competitive strategy should concentrate on lowering costs, for example by taking advantage
of economies of scale. After selecting an appropriate competitive strategy, the different
functional strategies should be developed, and this includes the supply chain strategy.
When selecting a supply chain strategy, each business should consider the trade-off between
the level of responsiveness and cost-efficiency at which they operate; and this should be
aligned with the overall level of responsiveness and cost-efficiency of the entire supply
chain. Although many factors (such as product characteristics; the level of demand and
supply uncertainties placed on the supply chain; customers’ buying behaviour; the position
of the supply chain member within the supply chain; order winners and order qualifiers; and
the production process), influence the selected supply chain strategy, the strategy will be
orientated towards either responsiveness or cost-efficiency. In the remainder of the chapter,
different supply chain strategies were discussed with specific reference to the orientation of
the strategy. The chapter was concluded by presenting the characteristics of a supply chain
strategy orientated towards responsiveness, as well as a supply chain strategy orientated
towards cost-efficiency. The eight literature findings (LF) made within the chapter are listed
in table 2.4.

53 © University of South Africa
Table 2.4 Literature findings in chapter 2
Literature findings within the chapter
LF1 : Three aspects should be in place before a strategic fit can be achieved between the
competitive and supply chain strategy:
a) The goals of the competitive strategy must be aligned with the goals of the supply chain strategy to form an overall coordinated strategy.
b) The processes and resources of each functional area should be structured so that the functional area’s strategy can be implemented successfully.
c) The business’ supply chain strategy must be aligned with the orientation of the overall supply chain (refer to section 2.2).
LF2: Porter’s focus competitive strategy is the most appropriate competitive strategy
for small businesses (refer to section 2.3).
LF3: The focus differentiation competitive strategy emphasises flexibility and therefore
promotes supply chain responsiveness (refer to sections 2.3 and 2.3.3.4).
LF4: The focus low-cost competitive strategy emphasises cost savings and therefore
promotes supply chain cost-efficiency (refer to sections 2.3 and 2.3.3.4).
LF5: When selecting a supply chain strategy, a trade-off between the level of
responsiveness and cost-efficiency at which the business operates, needs to be
made and should be aligned with the overall level of responsiveness or cost-
efficiency of the entire supply chain (refer to section 2.4).
LF6: Several factors, such as product characteristics, the level of demand and supply
uncertainties placed on the supply chain, customer buying behaviour, the position
of the supply chain member within the supply chain, order winners and order
qualifiers and the production process should be considered before selecting an
appropriate supply chain strategy (refer to section 2.4).
LF7: A supply chain strategy orientated toward responsiveness is characterised by:
a) high flexibility, b) adapting easily to market changes and unpredictable customer demand, c) being suitable for innovative products,
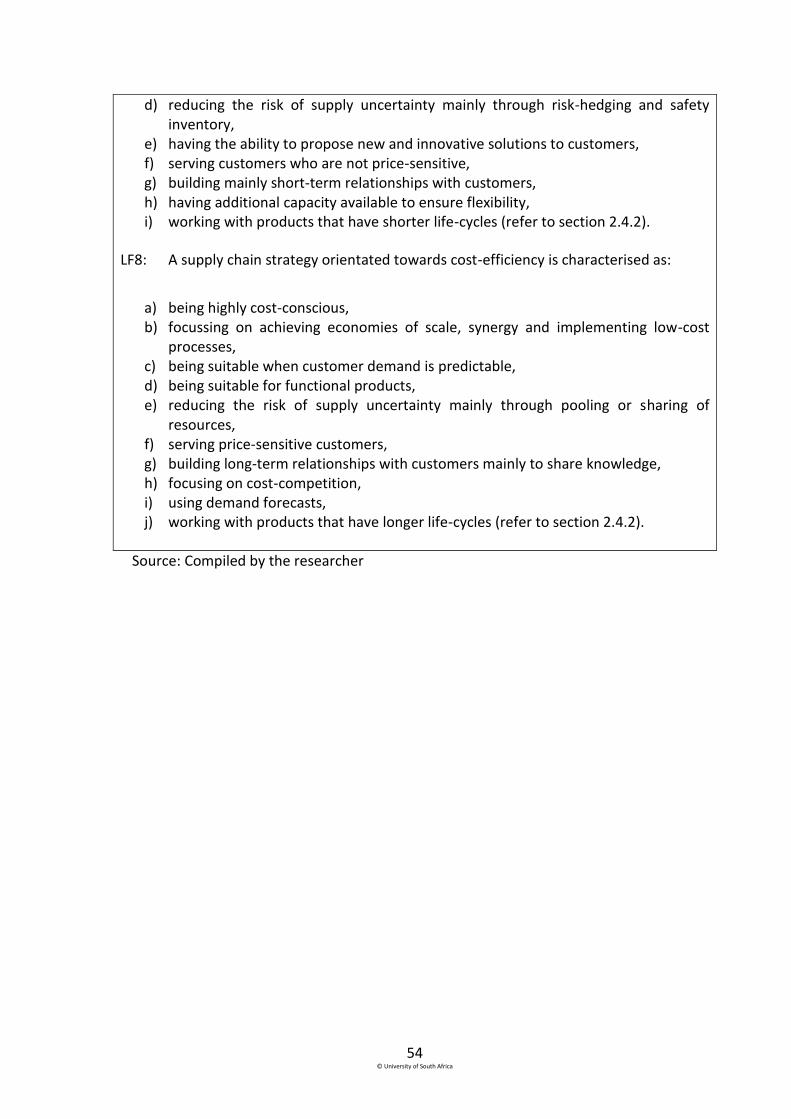
54 © University of South Africa
d) reducing the risk of supply uncertainty mainly through risk-hedging and safety inventory,
e) having the ability to propose new and innovative solutions to customers, f) serving customers who are not price-sensitive, g) building mainly short-term relationships with customers, h) having additional capacity available to ensure flexibility, i) working with products that have shorter life-cycles (refer to section 2.4.2).
LF8: A supply chain strategy orientated towards cost-efficiency is characterised as:
a) being highly cost-conscious, b) focussing on achieving economies of scale, synergy and implementing low-cost
processes, c) being suitable when customer demand is predictable, d) being suitable for functional products, e) reducing the risk of supply uncertainty mainly through pooling or sharing of
resources, f) serving price-sensitive customers, g) building long-term relationships with customers mainly to share knowledge, h) focusing on cost-competition, i) using demand forecasts, j) working with products that have longer life-cycles (refer to section 2.4.2).
Source: Compiled by the researcher
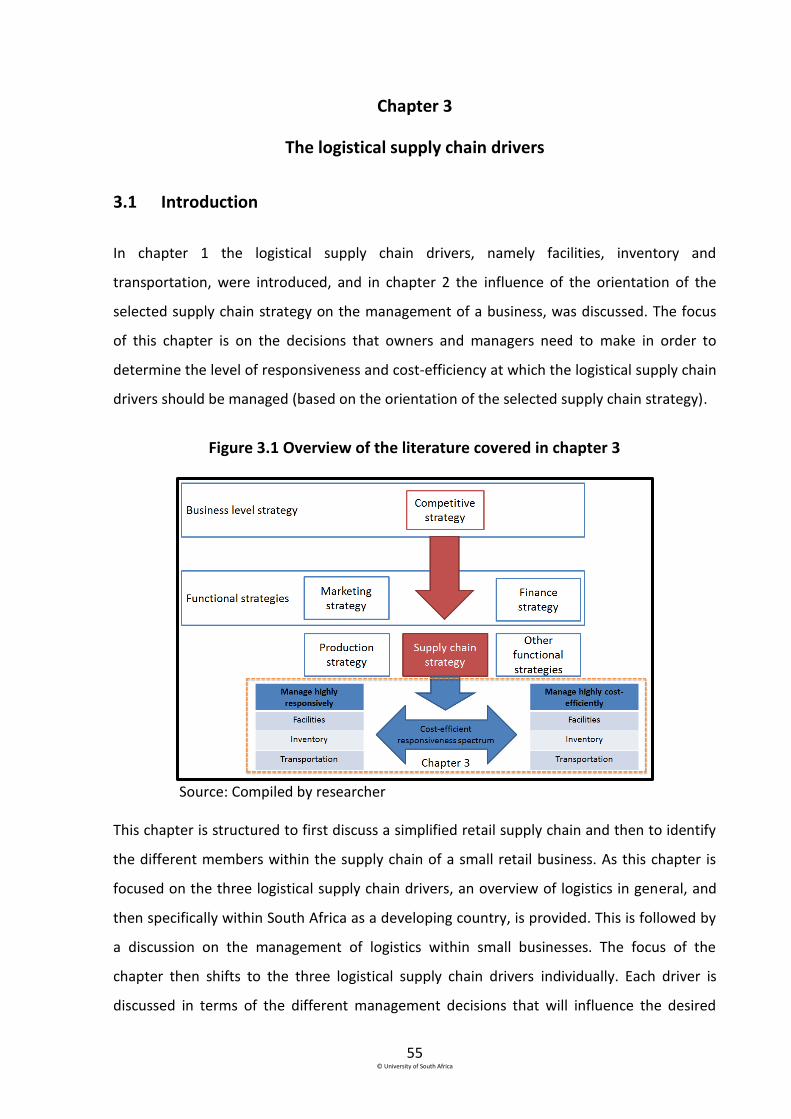
55 © University of South Africa
Chapter 3
The logistical supply chain drivers
3.1 Introduction
In chapter 1 the logistical supply chain drivers, namely facilities, inventory and
transportation, were introduced, and in chapter 2 the influence of the orientation of the
selected supply chain strategy on the management of a business, was discussed. The focus
of this chapter is on the decisions that owners and managers need to make in order to
determine the level of responsiveness and cost-efficiency at which the logistical supply chain
drivers should be managed (based on the orientation of the selected supply chain strategy).
Figure 3.1 Overview of the literature covered in chapter 3
Source: Compiled by researcher
This chapter is structured to first discuss a simplified retail supply chain and then to identify
the different members within the supply chain of a small retail business. As this chapter is
focused on the three logistical supply chain drivers, an overview of logistics in general, and
then specifically within South Africa as a developing country, is provided. This is followed by
a discussion on the management of logistics within small businesses. The focus of the
chapter then shifts to the three logistical supply chain drivers individually. Each driver is
discussed in terms of the different management decisions that will influence the desired

56 © University of South Africa
level of responsiveness and cost-efficiency. In this chapter the next fourteen literature
findings are made and indicated by the abbreviation LF. The findings in this chapter, along
with the previous literature findings in chapter 2 and the empirical findings in chapters 5 and
6, are used in chapter 7 to make recommendations on how formal independent small retail
businesses in Soweto should manage their logistical supply chain drivers, based on the
selected supply chain strategy, in order to survive.
In section 1.2.1 a simplified supply chain for small retail businesses was illustrated. A retailer,
as a supply chain member, is involved with the vending of goods and services to final
customers, but relies on suppliers to obtain these products and services (Fernie and Sparks,
2014:4). Since this study is focused on how these small retailers manage their logistical
supply chain drivers, an in-depth analysis of the different tiers of the supply chain will not be
conducted. The following discussions will focus on the retailer’s first-tier suppliers and
customers. Any supplier from whom a retailer purchases directly, will be referred to as the
retailer’s first-tier supplier; and any customer who purchases directly from the retailer, will
be referred to as the retailer’s first-tier customer.
3.2 Logistics: a South African small business perspective
The term ”logistics” refers to the movement of the right product, at the right time, to the
right location, at the lowest possible cost - as agreed upon by both suppliers and customers
(Bowersox, Closs, Cooper & Bowersox, 2013:33). Geographically, logistics is a network that
spans the globe, and the growth in international commerce has increased the complexity
and extent thereof (Bowersox et al., 2013:28-29). Logistics is one of the most complex areas
of business operations, as it creates and manages the flow of goods and services between
the different supply chain members (Wisner et al., 2016:301).
This section is structured to consider three aspects: first, logistics within South Africa as a
developing country; secondly, the management of logistics within small businesses; and
finally the different logistical linkages within a retail business.
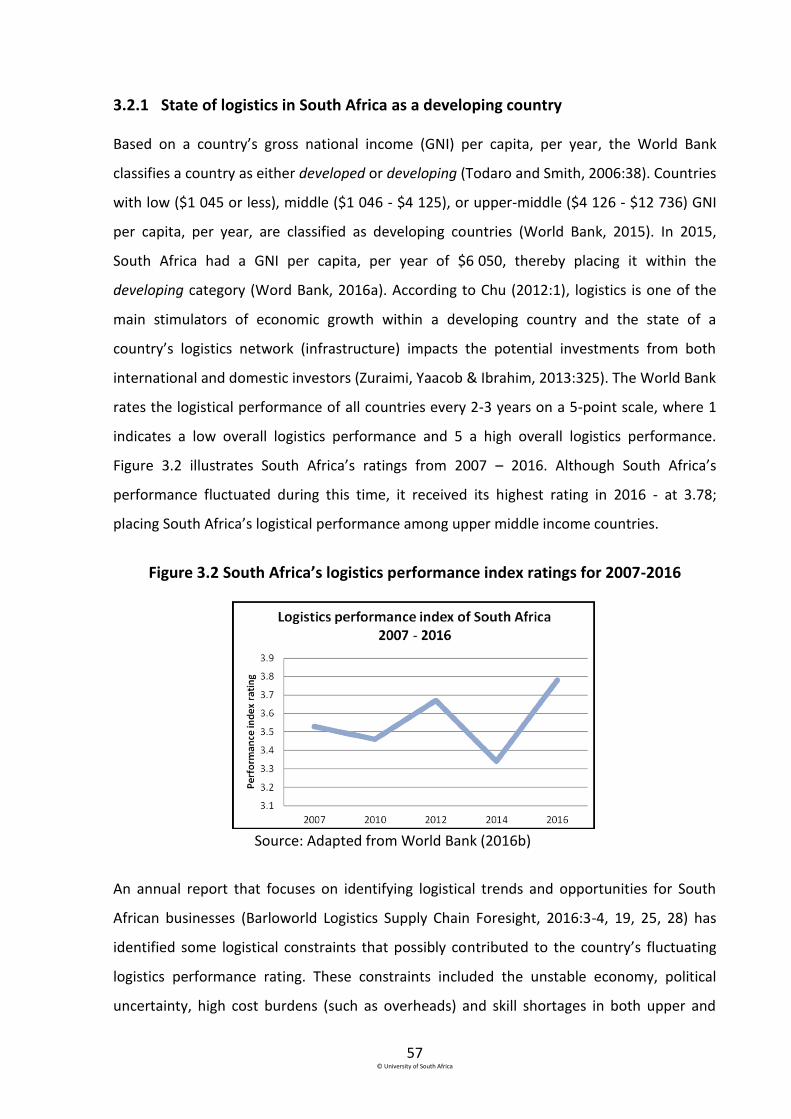
57 © University of South Africa
3.2.1 State of logistics in South Africa as a developing country
Based on a country’s gross national income (GNI) per capita, per year, the World Bank
classifies a country as either developed or developing (Todaro and Smith, 2006:38). Countries
with low ($1 045 or less), middle ($1 046 - $4 125), or upper-middle ($4 126 - $12 736) GNI
per capita, per year, are classified as developing countries (World Bank, 2015). In 2015,
South Africa had a GNI per capita, per year of $6 050, thereby placing it within the
developing category (Word Bank, 2016a). According to Chu (2012:1), logistics is one of the
main stimulators of economic growth within a developing country and the state of a
country’s logistics network (infrastructure) impacts the potential investments from both
international and domestic investors (Zuraimi, Yaacob & Ibrahim, 2013:325). The World Bank
rates the logistical performance of all countries every 2-3 years on a 5-point scale, where 1
indicates a low overall logistics performance and 5 a high overall logistics performance.
Figure 3.2 illustrates South Africa’s ratings from 2007 – 2016. Although South Africa’s
performance fluctuated during this time, it received its highest rating in 2016 - at 3.78;
placing South Africa’s logistical performance among upper middle income countries.
Figure 3.2 South Africa’s logistics performance index ratings for 2007-2016
Source: Adapted from World Bank (2016b)
An annual report that focuses on identifying logistical trends and opportunities for South
African businesses (Barloworld Logistics Supply Chain Foresight, 2016:3-4, 19, 25, 28) has
identified some logistical constraints that possibly contributed to the country’s fluctuating
logistics performance rating. These constraints included the unstable economy, political
uncertainty, high cost burdens (such as overheads) and skill shortages in both upper and
3.1
3.2
3.3
3.4
3.5
3.6
3.7
2010 2012 2014
Pe
rfo
rman
ce in
de
x ra
tin
g
Logistics performance index of South Africa 2010 - 2014
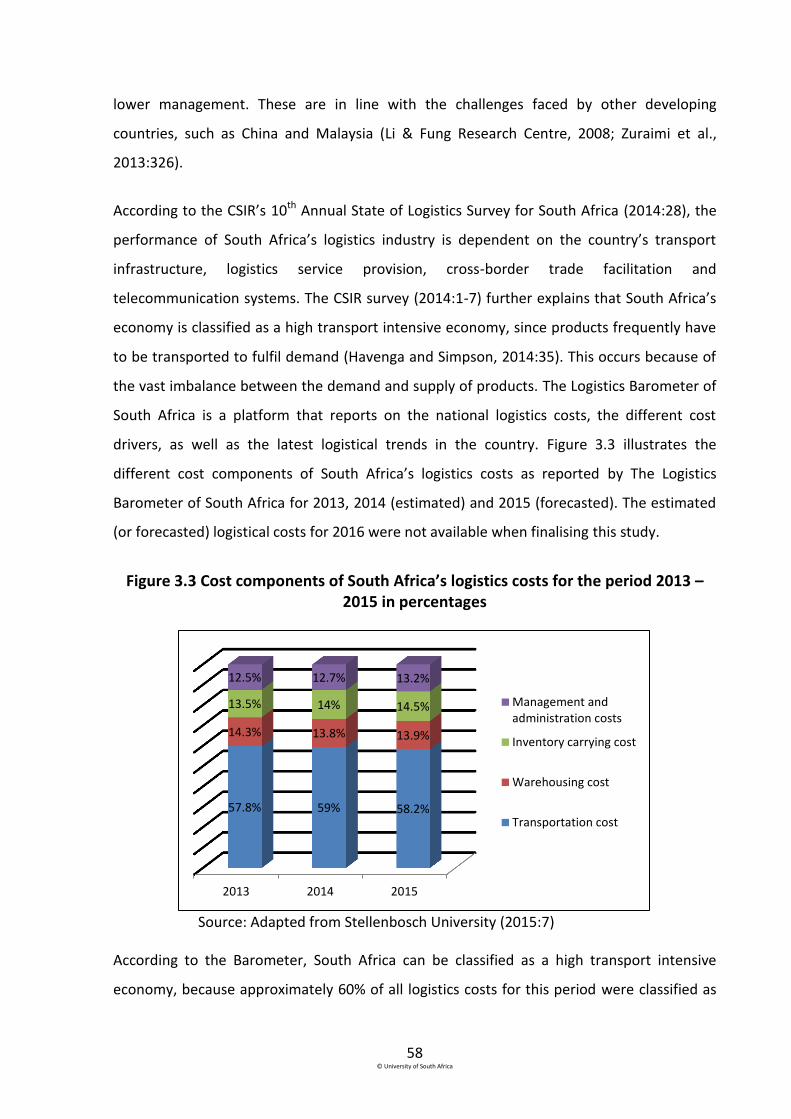
58 © University of South Africa
lower management. These are in line with the challenges faced by other developing
countries, such as China and Malaysia (Li & Fung Research Centre, 2008; Zuraimi et al.,
2013:326).
According to the CSIR’s 10th Annual State of Logistics Survey for South Africa (2014:28), the
performance of South Africa’s logistics industry is dependent on the country’s transport
infrastructure, logistics service provision, cross-border trade facilitation and
telecommunication systems. The CSIR survey (2014:1-7) further explains that South Africa’s
economy is classified as a high transport intensive economy, since products frequently have
to be transported to fulfil demand (Havenga and Simpson, 2014:35). This occurs because of
the vast imbalance between the demand and supply of products. The Logistics Barometer of
South Africa is a platform that reports on the national logistics costs, the different cost
drivers, as well as the latest logistical trends in the country. Figure 3.3 illustrates the
different cost components of South Africa’s logistics costs as reported by The Logistics
Barometer of South Africa for 2013, 2014 (estimated) and 2015 (forecasted). The estimated
(or forecasted) logistical costs for 2016 were not available when finalising this study.
Figure 3.3 Cost components of South Africa’s logistics costs for the period 2013 – 2015 in percentages
Source: Adapted from Stellenbosch University (2015:7)
According to the Barometer, South Africa can be classified as a high transport intensive
economy, because approximately 60% of all logistics costs for this period were classified as
2013 2014 2015
57.8% 59% 58.2%
14.3% 13.8% 13.9%
13.5% 14% 14.5%
12.5% 12.7% 13.2%
Management andadministration costs
Inventory carrying cost
Warehousing cost
Transportation cost
59 © University of South Africa
transportation costs. Warehousing costs range between 13% – 14% of total logistics costs
and inventory carrying costs between 13% – 15% of total cost during the period 2013 – 2015.
South Africa’s estimated cost of logistics as a percentage of gross national income for 2014
and 2015, was 11.4% and 11.7% respectively, which is in line with other developing countries
(Stellenbosch University, 2015:4, 7).
3.2.2 Logistics management in small businesses
Managing logistics within a business in order to create an effective logistical network can be
the differentiating factor that distinguishes a business from its competitors (Wisner et al.,
2016:301; Nichols, 2010). The performance of a small business is directly influenced by
logistics and can be enhanced by reducing overall logistics costs, for example by reducing
inventories and managing transportation efficiently (Orfanos, Mylonakis & Evripiotis,
2010:21, 26). Although small businesses are more simply structured in terms of the number
of employees, annual turnover, capital assets and the managerial involvement of its owners,
than larger businesses (Erasmus, Strydom & Rudansky-Kloppers, 2013:52; Töyli, Häkkinen,
Ojala & Naula, 2008:61), the logistical challenges they face do not differ, as the essential
components, such as facilities, inventory and transportation of the logistical function, are
still present (Zowada, 2013:116).LF9
Small businesses are normally characterised by the lack of ability to manage their logistics
(Soinio, Tanskanen & Finne, 2012:33) and therefore, generally, they contract outside service
providers (Zowada, 2013:115). A logistics service provider (referred to as a third-party
logistics provider) is an external business that performs the whole or part of the logistical
function on behalf of a business. Small businesses may also find it more cost-efficient to hire
a logistics service provider than to manage this function themselves (Zowada, 2013:112;
Petty, Palich, Hoy & Longenecker, 2012:467).LF10
Zowada (2013:112,114) reports that 84% of
small and medium-sized businesses operating in Silesia, Poland use a logistic service provider
to increase their flexibility, and secondly, the managers prefer to focus their efforts on the
core activity of the business instead of on the logistical function. Small and medium-sized
businesses that use one or two logistics service providers, usually form partnerships with the
aim to reduce logistics costs. These businesses strive to be independent and to increase their
flexibility (Zowada, 2013:113).
60 © University of South Africa
Generally, small businesses only use the transportation services offered by the logistical
service providers (Zowada, 2013:117; Soinio et al., 2012:33).LF10
According to Zowada
(2013:117), this can be ascribed to the fact that these small businesses find it difficult to
maintain a transport facility of their own and that transportation costs contribute the most
towards their total logistical costs.LF11
3.2.3 The four logistical linkages within a small retail business
The logistics activity synchronises the supply chain by linking its members with one another
(Bowersox et al., 2013:4, 29). The four logistical linkages can be classified as inbound
logistics, intra-organisational movements, outbound logistics and reverse logistics (Monczka
et al., 2016:659). Inbound logistics consist of the transportation and warehousing of raw
materials or semi-finished products from a supplier. From a business’ point of view, inbound
logistics will include all activities related to acquiring (purchasing) and storing materials from
suppliers, for example a small fast food restaurant that collects and stores potatoes in order
to make chips (Monczka et al., 2016:659-661; Lee, Cho & Jung, 2014:1001). Intra-
organisational movements refer to the flow and storage of raw materials or semi-finished
products within the precincts of the business and are often referred to as production
logistics (Monczka et al., 2016:659-661; Lee et al., 2014:1001). For example, if a small garage
services cars at a specific location, but stores the spare parts at a different location, a spare
part is transported from the storage unit to the location where the car is serviced. Outbound
logistics represent the link between the business and its customers and entails the delivery
of finished products to customers (Monczka et al., 2016:659-661; Lee et al., 2014:1001), for
example, a small florist shop delivering bouquets to customers. Reverse logistics include that
part of logistics that is focused on the movement and management of inventory or
resources, after a sale and delivery have been made to the customer. Reverse logistics is also
referred to as the process whereby the return of products by customers is managed (Wisner
et al., 2016:534; Badenhorst, 2013:2) for example, when a customer returns milk that has
turned sour to the small retail grocer from which it was purchased.
To conclude section 3.2 on the state of logistics within South Africa, the management of
logistics within a small business, and the four logistical linkages within a small retail business,
it can be summarised as follows:
61 © University of South Africa
The logistical performance of South Africa is influenced by a number of constraints.
South Africa is classified as a transport intensive economy.
Transportation, facilities and inventory contribute significantly to South Africa’s total
logistical costs.
Small businesses face the same challenges as larger businesses.
Small businesses generally use a third-party logistics service provider, due to the high
cost of transportation and the difficulty in maintaining a transport facility.
The four logistical linkages synchronise the supply chain by linking the different
members.
All four logistical linkages are present within the logistics function of small retail
businesses.
Although the three logistical supply chain drivers cannot be managed in isolation (Chopra
and Meindl, 2016:57), each driver is presented separately in sections 3.3 to 3.5 for
discussion purposes. The discussion will consider the role of each supply chain driver within
a retail supply chain; the different management decisions related to each supply chain
driver; and the different decisions management need to make regarding the business’
orientation towards responsiveness and cost-efficiency.
3.3 Facilities as a logistical supply chain driver
Facilities provide supply chain services that include the storage of inventory, customer order
fulfilment, and assembling of different parts of a product. If these services are managed and
designed effectively, it can result in improved customer service through increased
responsiveness (Wisner et al., 2016:318). When facility decisions are aligned with the
orientation of the selected supply chain strategy, businesses tend to be more successful
(Chopra and Meindl, 2016:59). Businesses can use facilities as a source of a competitive
advantage, based on reducing either cost or lead-times (Graungaard Pedersen, Zachariassen
& Stentoft Arlbjørn, 2012:354).
Traditionally, the functionality of facilities has only been regarded as a place to store
products, but more recently its functionality includes the mixing and modifying of products
62 © University of South Africa
according to customer’s orders (Wisner et al., 2016:319). Facilities can be classified
according to their function as a production facility, where inventory is assembled,
manufactured, modified or fabricated; as a storage facility where inventory is stored; as a
distribution centre where inventory is cross-docked; as the premises from which a retailer
operates; or as a service facility where a service is rendered to a customer by using an
inventory component (Bowersox et al., 2013:37; Lawrence, Sivakumar & Arivarignan,
2013:4771). A service facility could, for example be used by an accountant or an undertaker.
The accountant’s office or the funeral parlour would be classified as the service facility, since
it is the place where the inventory is used to render a service.
Facilities, as a logistical supply chain driver, are present in all four supply chain linkages
(discussed in section 3.2.3) as inventory is transported between the different facilities of the
supply chain members. For example, a retail grocery store receives inventory from a supplier
at the supplier’s loading bay (inbound logistics) and moves the inventory from the loading
bay into storage or directly to the retailer’s shop (intra-organisational movements) where a
customer can purchase and remove the inventory (outbound logistics). In the event that the
customer is dissatisfied with the product, the customer would return the product to the
retailer’s facility and the retailer would return the product back to the supplier’s facility
(reverse logistics). At each stage of this example, inventory is moved from one supply chain
member’s facility to the next.
In terms of this study, facilities refer to the facilities where formal independent small retail
businesses receive and store inventory that is purchased from first-tier suppliers, as well as
facilities where small retailers sell inventory to first-tier customers. If a small retailer renders
a service, the premises from which the service is rendered is classified as the small retailer’s
facility. According to the World Bank (2014: 46), most township entrepreneurs have the
necessary start-up capital to purchase (or rent) a facility from which to operate their
businesses, but find it difficult to acquire facilities (regardless of the function) due to the
general lack of retail space within townships.LF12
If a business owner is able to rent a facility,
the average cost is between R1000 and R2000 per month, which some owners find difficult
to afford (World Bank, 2014: 157, 171).
63 © University of South Africa
Designing a facility network entails decisions related to the function, location and capacity of
the facility, which will impact supply chain performance in terms of the level of
responsiveness and cost-efficiency (Horn, Badenhorst-Weiss, Cook, Heckroodt, Howell,
Phume & Strydom, 2014:15). The different management decisions related to facilities are
discussed in the next section.
3.3.1 Components of facilities decisions
Managers must ensure that the appropriate facility network, in terms of function, location
and capacity is designed depending on the logistical operations of the business (Bowersox et
al., 2013:37). For example, a retail business selling consumer products should design a
facilities network that is able to serve the selected target market, while bearing in mind costs
and responsiveness (Chopra and Meindl, 2016: 59; Bowersox et al., 2013:37). The
management decisions relating to the function, location and capacity of facilities are
discussed in the following sections. Each management decision is first considered from a
general perspective and secondly, from the perspective of a small retailer selling a final
product or a retailer rendering a service.
3.3.1.1 Function of the facility
As stated in section 3.3, a facility can be classified according to the facility’s function as a
production facility, a storage facility, a distribution centre, the premises from which a retailer
operates or a service facility.
Within a production facility, raw-materials or semi-finished products are received from
suppliers and transformed into final products that are sold to customers, for example a car
manufacturing plant that receives different components (raw-materials or semi-finished
products) to build its cars. Production facilities can be designed to be either dedicated and to
produce a specific number of products, or to be flexible and produce a variety of products
(Chopra and Meindl, 2016:60). Dedicated production facilities are usually more cost-
efficient, since the facility can take advantage of economies of scale and streamline the
production of products (Christopher, 2011:174; Hasan, Sarkis & Shankar, 2012:900). On the
other hand, flexible production facilities have the ability to produce a variety of products
according to customer demand and can respond faster to the needs of customers
64 © University of South Africa
(Christopher, 2011:174; Hasan et al., 2012:898). As production facilities are generally
associated with the manufacturing sector, and the focus of this study is on small businesses
operating in the retail sector, production facilities fall outside the scope of this study.
A storage facility can be used to hold several types of inventory, for example safety or
seasonal inventory in preparation for fluctuating customer demand (Richards, 2014:9; Baker
and Canessa, 2009:425). Generally, large businesses store products at a storage facility
situated away from retail outlets, until a customer’s demand becomes evident and then it is
transported to the retail outlet (Monckza et al., 2016:20). For example, a large hardware
retailer who stockpiles steel beams at a facility situated away from the retail outlet until a
customer places an order for steel beams. The steel beams would only be transported from
the storage facility to either the retail outlet or directly to the customer once the customer’s
order has been placed. Smaller retailers are known to use a storage facility (or room) at their
shops to store inventory (Fernie and Sparks, 2014:4). Any facility that a small retail business
uses to store inventory received from first-tier suppliers, is considered to be a storage
facility. The inventory can be stored either at the premises from which the business is
operated or at a facility located elsewhere. The World Bank reports (2014:207) that business
owners in townships indicated that there is a lack of storage space within townships,
especially for those businesses operating within the “make, process, or repair” industry. The
lack of storage space influences the amount of inventory that these retailers purchase
(World Bank, 2014:207).
Generally, large retailers use cross-docking distribution centres to break large orders down
into smaller batches and then send them to different retail outlets (Vincent, Jewpanya, &
Redi, 2016:1117). For example, when Pick n Pay places a large order for Tastic rice from Tiger
Brands, the latter will deliver the order to Pick n Pay’s cross-docking centre, where it will be
broken down into smaller batches and sent to different retail outlets (or franchises). Thus,
the inventory is transported directly to the retail outlets and is not stored until customer
demand arises. Not only do businesses that utilise cross-docking distribution centres save on
transportation costs (due to large shipments, transported less frequently, to the cross-
docking distribution centre), but they also save on inventory costs as they receive discount
on bulk purchasing (Agustina, Lee & Piplani, 2014:29). Small retailers who do not form part
65 © University of South Africa
of a retail group, such as Pick n Pay, or a franchise such as McDonald’s, generally do not
make use of a cross-docking distribution centre; they receive their inventory directly from
first-tier suppliers.
The retail premises are the facility from which a retailer sells products to customers, for
example the Woolworths retail outlet where a customer purchases groceries. Managers
should bear in mind their target market when designing or selecting the premises for their
retail outlet. Factors, such as product variety and level of shopping convenience, will
influence the size and layout of the retail premises (Kotler, Burton, Deans, Brown &
Armstrong, 2013:435). For example, a small retailer who strives to provide customers with a
fast shopping experience would focus on obtaining retail premises that are designed for fast
and convenient shopping.
A service facility is a facility where a service is rendered to a customer and includes an
inventory component, for example when a panel beater installs a bumper on a customer’s
car, the facility from which he operates is the service facility and the bumper is the inventory
item (Berman and Sapna, 2002:464; Berman and Sapna, 2001:430). Service retailers must
aim to balance the optimal rate at which a service is provided and the cost of providing the
service (Berman and Sapna, 2001:429). An increase in the rate of providing the service will
increase cost, such as overheads and storing costs, as the retailer has to ensure that
inventory and staff are available; whereas a decrease in the rate of providing customers with
a service will lead to a decrease in costs, as less inventory can be kept and less staff
employed. Managing service facilities to reduce customers’ waiting periods (lead-times) will
increase, not only the retailer’s level of responsiveness, but also profit, as more customers
can be assisted (Berman and Sapna, 2001:429).
3.3.1.2 Location of the facility
According to Chopra and Meindl (2016:59), the most important factor to consider with
regard to the location of a facility, is the decision to use a centralised or decentralised facility
system. When using a centralised facility system, a business will have fewer facilities than
with a decentralised facility system. The advantages of a centralised facility system lie in
lower facility costs (for example administration costs) and increased efficiency of the facility
66 © University of South Africa
through economies of scale (decreasing the facility cost per unit) (Graungaard Pedersen et
al., 2012:353). The disadvantages of a centralised facility system are increased
transportation costs and delivery times, due to the increased distances that the inventory
travels between suppliers, customers and the facility. Therefore, a centralised facility system
can increase the cost-efficiency (if the cost advantage gained from economies of scale
outweighs the increase in transportation costs) at the expense of the level of responsiveness
(due to longer distances travelled). Gaining the advantages of economies of scale (by
purchasing in large quantities) when using a centralised facility system, may prove to be
more difficult for smaller businesses with their limited resources (Graungaard Pedersen et
al., 2012:366).
Alternatively, when using a decentralised facility system, a business will have more facilities
available. The advantages of using a decentralised facility system lie in the shorter distances
and delivery times of inventory between the suppliers, customers and facilities (Schmitt,
Sun, Snyder & Shen, 2015:202). Holding inventory closer to customers allows a retailer to
reduce transportation costs and meet customers’ needs faster (Richards, 2014:20).
According to the World Bank (2014:153), the owners and managers of businesses in the
Diepsloot township are aware that being located close to their customers is an advantage,
since their customers mainly reside in the neighbourhood and generally walk to the retailer
from their homes or on their way from a taxi rank. The World Bank (2014:163) reports that
these owners and managers indicated that instead of expanding their current shops
(facilities) they would rather open more shops at different locations (decentralising) in order
to be close to more customers. The disadvantage of using a decentralised facility system is
that the number of facilities that needs to be managed will increase, and therefore costs,
such as administration costs, will escalate (Wisner et al., 2016:321). The advantage of
gaining economies of scale by purchasing in bulk is more difficult to obtain when using a
decentralised facility system, as each facility can only handle a specify number of inventory
items. Consequently, businesses need to weigh the cost benefits associated with a
centralised facility, against the benefits of responsiveness associated with decentralised
facilities when deciding on the type of facility system required (Coyle, Langley, Novack &
Gibson, 2013:474).
67 © University of South Africa
In terms of this study, a small retailer who stores inventory (including the inventory that a
retailer uses to render a service) or produces a product at their premises, and not at a facility
located elsewhere, is implementing a centralised facility system. Thus, first-tier suppliers will
deliver inventory to the same premises that first-tier customers will purchase a product from
or obtain a service, such as a haircut. A small retailer who stores inventory (including the
inventory that a retailer uses to render a service, for example a plumber) or produces
products at a different location than where the first-tier customers purchase the products,
will have a decentralised facility system.
The next management decision component is the facility’s capacity.
3.3.1.3 Capacity of the facility
The capacity of a facility refers to a number of issues, such as the maximum average rate at
which inventory can flow through the system; the rate at which a service can be rendered;
or the available storage space at a facility (Wisner et al., 2016:527; Bowersox et al.,
2013:103). The available capacity of a facility influences business performance in terms of
responsiveness and cost-efficiency (Chopra and Meindl, 2016:60). Having excess capacity will
increase costs, but will enable the business to respond swiftly to changes in customer
demand (Kamath and Roy, 2007:336). Excess storage capacity will allow a business to store
additional inventory and have the items on hand whenever customer demand arises.
Additional capacity for service retailers will entail, for example, an accountant having
sufficient time to take on additional clients, or a plumber having free time to assist an
existing customer with an additional problem. Although excess capacity can increase the
level of responsiveness, cost-efficiency will decrease, as idle capacity does not generate
revenue and also increases facility costs (Hugos, 2006:10-11). On the other hand, by not
having excess capacity available, the level of cost-efficiency increases (due to a decrease in
facility costs) at the expense of the level of responsiveness, as any change in customer
demand cannot be met timeously.
Small retailers must decide whether they prefer to make provision for fluctuations in
customer demand by having additional capacity (thus increased responsiveness at higher
cost), or whether they would rather wait until a first-tier customer’s demand is known. This
68 © University of South Africa
will allow them to purchase the appropriate level of inventory from first-tier suppliers, and
so eliminate the need for excess capacity (thus increasing cost-efficiency at the expense of
responsiveness) (Chopra and Meindl, 2016:60-61).
3.3.2 Management of facilities by small retailers
The purpose of this section is to summarise the literature and the results of previous studies
conducted in townships (section 3.3.1), on the ways in which the different components of
facility decisions are generally managed; based on a small retail business’ (including service
retailers) orientation towards either responsiveness or cost-efficiency, as aligned with its
supply chain strategy.

69 © University of South Africa
Table 3.1 Components of decisions on facilities by retailers – depending on their focus
Supply chain driver
Components of decisions related to facilities
Management decision when focused on responsiveness
Management decision when focused on cost-
efficiency Relevent authors
Related section in discussion
Facilities
Classification
as storage,
retail or
service facility
Facility characteristics: Excess inventory (safety or seasonal) is purchased and stored, either in-store or at a storage facility situated
away from the retailer.LF13
Facility characteristics: Excess inventory (safety or seasonal) is not purchased and therefore there is no need for a storage facility.
LF14
Richards 2014:9 Bowersox et al. 2013:37 Kotler et al. 2013:435 Lawrence et al. 2013:4771 Berman and Sapna 2001:429, 430
3.3 3.3.1.1
Retail facility (premises) is designed to increase the customer’s level of shopping convenience. Ample storage space is available at the retail premises to store
additional inventory. LF13
A smaller retail facility (premises) is selected as limited or no excess
inventory is held. LF14
Service facility is managed to reduce the time that customers wait to receive the specific service (lead-time). Facility is flexible - by holding sufficient inventory and staff to perform the
service. LF13
Service facility is managed to focus on reducing costs by not holding excess inventory and employing only the necessary number
of staff. LF14
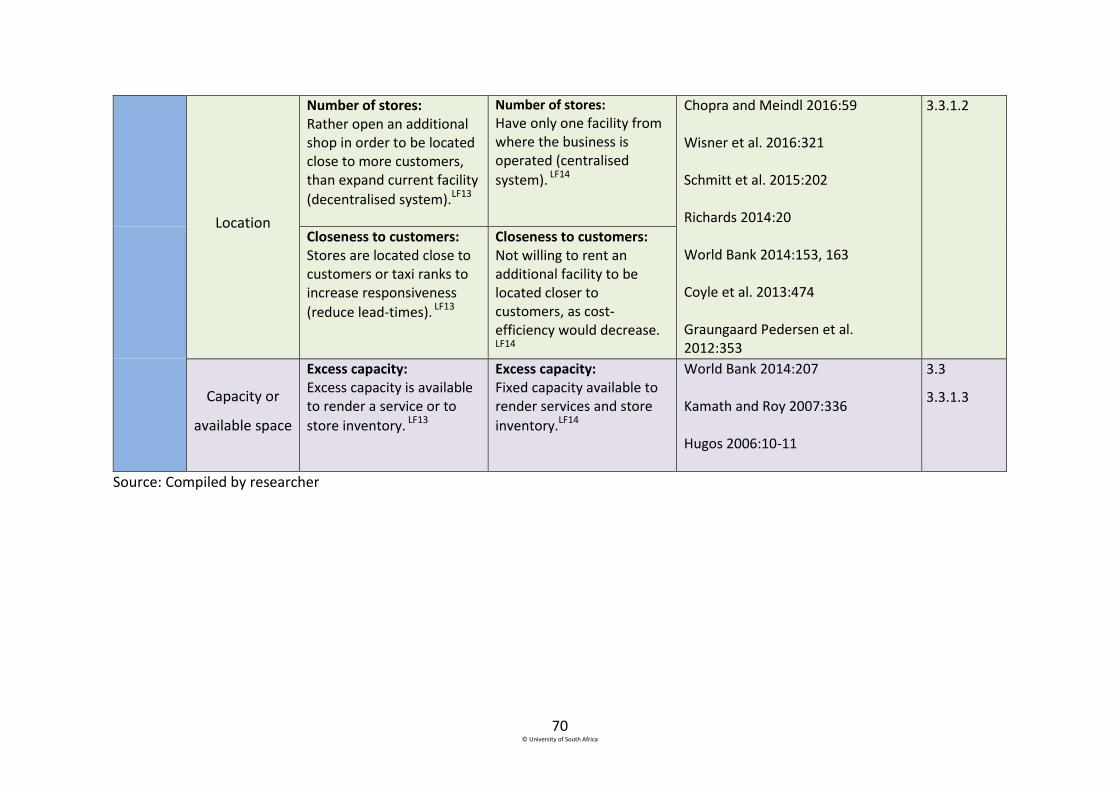
70 © University of South Africa
Location
Number of stores: Rather open an additional shop in order to be located close to more customers, than expand current facility
(decentralised system).LF13
Number of stores:
Have only one facility from where the business is operated (centralised
system). LF14
Chopra and Meindl 2016:59 Wisner et al. 2016:321 Schmitt et al. 2015:202 Richards 2014:20 World Bank 2014:153, 163 Coyle et al. 2013:474 Graungaard Pedersen et al. 2012:353
3.3.1.2
Closeness to customers: Stores are located close to customers or taxi ranks to increase responsiveness
(reduce lead-times). LF13
Closeness to customers: Not willing to rent an additional facility to be located closer to customers, as cost-efficiency would decrease.
LF14
Capacity or
available space
Excess capacity: Excess capacity is available to render a service or to
store inventory. LF13
Excess capacity: Fixed capacity available to render services and store
inventory.LF14
World Bank 2014:207 Kamath and Roy 2007:336 Hugos 2006:10-11
3.3
3.3.1.3
Source: Compiled by researcher

71 © University of South Africa
In the next section the logistical supply chain driver inventory is discussed. The section is
structured to first, discuss the relevant aspects to consider when making decision on inventory,
followed by the management of inventory, depending on the business’ orientation towards
responsiveness or cost-efficiency.
3.4 Inventory as a logistical supply chain driver
Inventory includes all goods in motion and at rest within a supply chain, which can consist of raw
materials, semi-finished products (also referred to as intermediate products) and finished
products (Coyle et al., 2013:636). Raw materials refer to low-value, unfinished products that are
used to produce finished products (Monczka et al., 2016:622-624; Pienaar and Vogt, 2012:221),
for example, the flour purchased by a small bakery from a first-tier supplier to bake bread (the
finished product).
Semi-finished inventory has not yet been transformed into a final product and includes all
inventories that are idle and waiting to be transported to another process or station within a
production process (Monczka et al., 2016:622-624). Semi-finished inventory is more valuable than
raw materials, but less valuable than finished products (Pienaar and Vogt, 2012:221). An example
of semi-finished products is the different ingredients of a menu item that can be converted into
the final product (dish) at a later stage.
Finished products are inventory items sold to customers for different uses (Monczka et al.,
2016:623). Although the business selling the finished product can view the product as a finished
product, the customer may view the product as either a semi-finished or a finished product,
depending on the purpose of the product. A haberdashery will, for example, view fabric as a final
product, whereas the customer who purchases the fabric with the purpose of making a quilt, will
view the fabric as a semi-finished product. As this study is focused on small retailers, the products
that they purchase from first-tier suppliers can either be semi-finished goods that they will convert
into finished products (such as the ingredients used by a small bakery), or finished products that
they will sell directly to their first-tier customers (such as a hammer sold by a hardware store).
Inventory is kept in a supply chain to address the imbalance between the supply and demand of
products (Chopra and Meindl, 2016:61). A retailer will, for example, carry additional inventory in
72
anticipation of future customer demand or in preparation for an event, such as a sale or the
holiday season. Retailers who deliver a service will view the products that they use to perform the
service, as inventory, for example the electrical cables that an electrician installs at a house
(Berman and Sapna, 2001;430). The challenge lies in finding the right balance between the amount
of inventory that businesses should carry to satisfy unpredictable customer demand, and the cost
of carrying additional inventory (Ehrenthal, Honhon & Van Woensel, 2014:527; Pienaar and Vogt,
2012:218). Within many businesses, inventory is the most expensive asset and should be managed
effectively (Monczka et al., 2016:621-622; Wisner et al., 2016:209). Effective inventory
management implies that the right amount of inventory is purchased to support the business’ day
to day activities, whereas ineffective inventory management can lead to excess inventory and a
waste of resources (Wisner et al., 2016:209). Generally, small township businesses do not find it
difficult to purchase inventory, since these businesses can select from multiple first-tier suppliers
and even search for first-tier suppliers with the lowest prices (World Bank, 2014:172).LF15
The
different decisions managers have to make with regard to inventory are discussed in the next
section.
3.4.1 Components of inventory decisions
Managers classify inventory as cycle, safety or seasonal inventory, depending on the purpose of
the inventory. Each of the classifications is discussed in sections 3.4.1.1 to 3.4.1.3 below.
3.4.1.1 Cycle inventory
Cycle inventory is the average amount of inventory that is purchased or produced in order to
satisfy customer demand within a specific cycle (weekly/monthly/annually) (Horn et al., 2014:80).
On average, small retailers purchase inventory every two weeks (World Bank, 2014:153, 155, 172).
LF16 Within the retail sector, cycle inventory will include products that retailers sell to first-tier
customers, products that a service provider uses to render the service to first-tier customers, as
well as products that retailers use to produce other products. According to the World Bank
(2014:173, 175), small businesses in townships in Gauteng usually purchase inventory from
Marabastad (a market situated in Pretoria), large wholesalers (for example Makro), or business
associates (for example Muslim retailers often purchase from others in the Muslim community).
These retailers usually search for the lowest prices among the different suppliers, as purchasing

73
inventory at a lower price allows them to price their products lower than their competitors (World
Bank, 2014:173).
When ordering cycle inventory, managers must first consider the amount and frequency of
inventory that is required (Islam, Meier, Aditjandra, Zunder & Pace, 2013:3-4). Businesses that
purchase cycle inventory in large batches, do so to take advantage of economies of scale; as this
will lead to a decrease in the costs of production, transportation, ordering and purchasing.
Although purchasing cycle inventory in large batches decreases costs, managers should be aware
of the cost increase in carrying a large amount of inventory (Chopra and Meindl, 2016:62, 280).
Some township businesses are known to coordinate when purchasing inventory in bulk, in order to
gain the advantage of economies of scale (World Bank, 2014:173); something they would not be
able to do on their own.
3.4.1.2 Safety inventory
Any additional inventory held above cycle inventory is classified as safety inventory. The purpose
of safety inventory is to prevent a loss of sales due to stock-outs (Coyle et al., 2013:324).
Therefore, safety inventory buffers a business against unpredictable customer demand (Bowersox
et al., 2013:48; Baker and Canessa, 2009:425). Managers should carefully determine the amount
of safety inventory items to hold, because if a surplus is held, a mark-down may be required in
order for it to be sold. Not only will income be lost (because of the mark-downs), but the carrying
cost will decrease cost-efficiency (Graungaard Pedersen et al., 2012:354). On the other hand,
insufficient safety inventory may result in decreased responsiveness, and a consequent loss in
sales (Baily, Farmer, Crocker, Jessop & Jones, 2008:164). The managers or owners of small retail
businesses should determine the level of safety inventory depending on their orientation towards
cost-efficiency or responsiveness. According to the World Bank (2014:207), almost 20% of
business owners in townships reported that they cannot purchase excess (safety) inventory as
they do not have space to store it.
3.4.1.3 Seasonal inventory
Inventory that is accumulated to counter predictable seasonal customer demand is called seasonal
inventory. A business will produce or purchase additional inventory in times when customer
74
demand is low, in preparation for times when demand is high (Chopra and Meindl, 2016:63;
Ehrenthal et al., 2014:527). For example, a small bakery will bake additional rusks in summer or a
small retail grocery store will purchase additional hot chocolate (when the demand for rusks and
hot chocolate are lower) in preparation for the increase in demand during winter. Deciding
whether or not to produce seasonal inventory usually depends on the flexibility of the production
process. If the production process can be adapted easily and cost-efficiently to increase the
production rate, the business may not consider it necessary to hold seasonal inventory. However,
if changing the production process in order to produce more is expensive, it would be wise to
rather produce at a constant rate and build up seasonal inventory (Wisner et al., 2016:211). Then
again, if inventory is produced at a constant rate, it will deprive the business of the opportunity to
save costs by halting the production line during periods of low customer demand. The decision to
purchase seasonal inventory depends mainly on whether the small retailer views the increase in
carrying cost worth having the products available when customer demand is higher. Therefore,
purchasing seasonal inventory will increase the retailer’s level of responsiveness at the expense of
the level of cost-efficiency (Chopra and Meindl, 2016:63).
In section 3.4.2 the different components of inventory decisions are summarised in terms of the
retailer’s focus on responsiveness or cost-efficiency.
3.4.2 Management of inventory by small retailers
In this section, the findings from the literature and the results of previous studies conducted in
townships (as discussed in section 3.4.1) are summarised in order to provide an overview of the
management of the components of inventory decision by small retailers (including service
retailers) based on the orientation of their supply chain strategy.
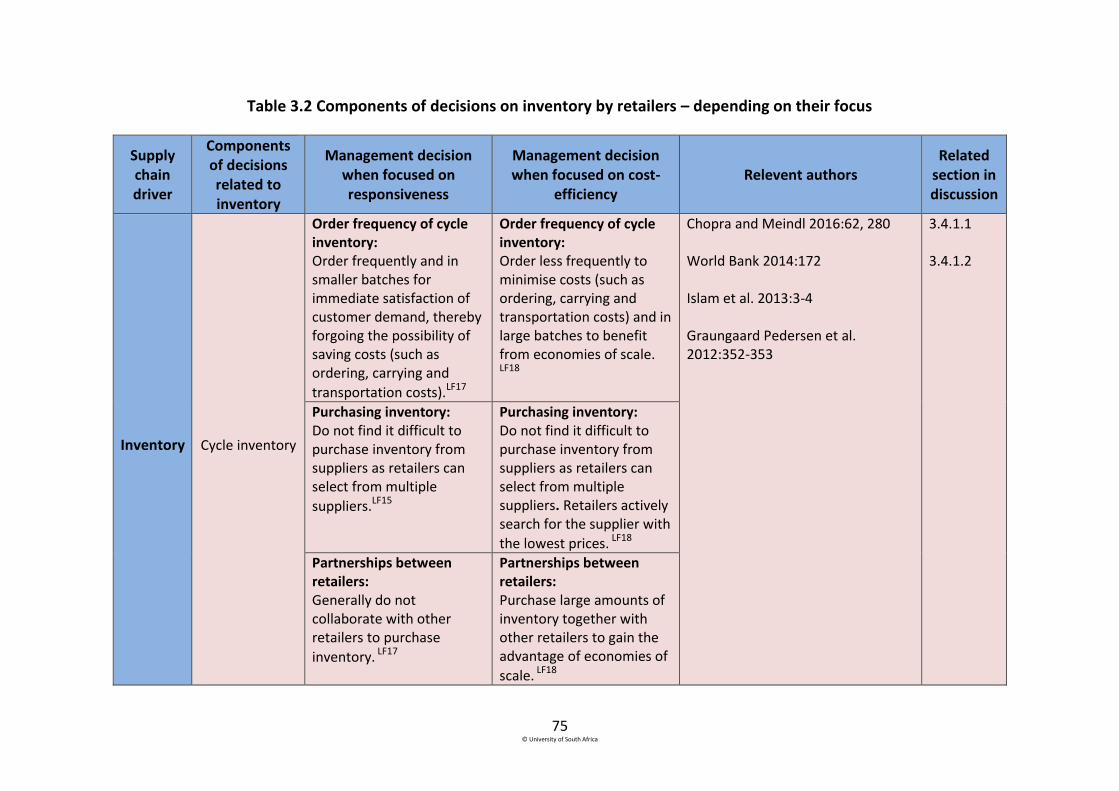
75 © University of South Africa
Table 3.2 Components of decisions on inventory by retailers – depending on their focus
Supply chain driver
Components of decisions related to inventory
Management decision when focused on responsiveness
Management decision when focused on cost-
efficiency Relevent authors
Related section in discussion
Inventory Cycle inventory
Order frequency of cycle inventory: Order frequently and in smaller batches for immediate satisfaction of customer demand, thereby forgoing the possibility of saving costs (such as ordering, carrying and
transportation costs).LF17
Order frequency of cycle inventory: Order less frequently to minimise costs (such as ordering, carrying and transportation costs) and in large batches to benefit from economies of scale.
LF18
Chopra and Meindl 2016:62, 280 World Bank 2014:172 Islam et al. 2013:3-4 Graungaard Pedersen et al. 2012:352-353
3.4.1.1 3.4.1.2
Purchasing inventory: Do not find it difficult to purchase inventory from suppliers as retailers can select from multiple
suppliers.LF15
Purchasing inventory: Do not find it difficult to purchase inventory from suppliers as retailers can select from multiple suppliers. Retailers actively search for the supplier with
the lowest prices. LF18
Partnerships between retailers: Generally do not collaborate with other retailers to purchase
inventory. LF17
Partnerships between retailers: Purchase large amounts of inventory together with other retailers to gain the advantage of economies of
scale. LF18
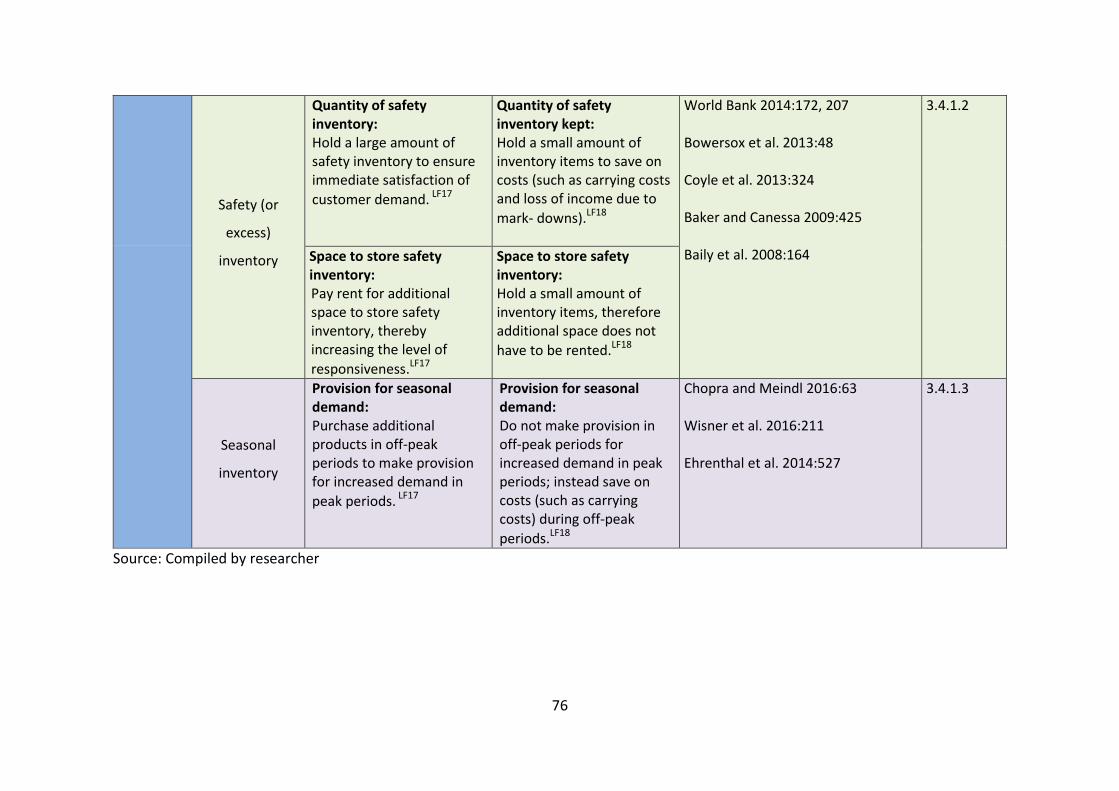
76
Safety (or
excess)
inventory
Quantity of safety inventory: Hold a large amount of safety inventory to ensure immediate satisfaction of
customer demand. LF17
Quantity of safety inventory kept: Hold a small amount of inventory items to save on costs (such as carrying costs and loss of income due to
mark- downs).LF18
World Bank 2014:172, 207 Bowersox et al. 2013:48 Coyle et al. 2013:324 Baker and Canessa 2009:425 Baily et al. 2008:164
3.4.1.2
Space to store safety inventory: Pay rent for additional space to store safety inventory, thereby increasing the level of
responsiveness.LF17
Space to store safety inventory: Hold a small amount of inventory items, therefore additional space does not
have to be rented.LF18
Seasonal
inventory
Provision for seasonal demand: Purchase additional products in off-peak periods to make provision for increased demand in
peak periods. LF17
Provision for seasonal demand: Do not make provision in off-peak periods for increased demand in peak periods; instead save on costs (such as carrying costs) during off-peak
periods.LF18
Chopra and Meindl 2016:63 Wisner et al. 2016:211 Ehrenthal et al. 2014:527
3.4.1.3
Source: Compiled by researcher

77 © University of South Africa
In the next section the logistical supply chain driver transportation is discussed. The section is
structured to first discuss the relevant components of transportation decisions, followed by the
management of transportation by small retail businesses in terms of their orientation towards
responsiveness or cost-efficiency.
3.5 Transportation as a logistical supply chain driver
Transportation is an important part of logistics and is a key driver within supply chain
management (Monczka et al., 2016:659). It can be described as the movement of inventory from
one point to another, since products are seldom produced, sold and consumed at the same
location (Goldsby et al., 2014:4-5; Nwaogbe, Omoke, Ubani & Ukaegbu, 2013:1). Transportation
does not only refer to transporting inventory, but also to the delivery of a service to a customer,
for example when a plumber needs to drive to a customer to repair a problem. Transportation
reduces the business’ financial resources through costs for, among others, labour, fuel, vehicles
and vehicle maintenance (Bowersox et al., 2013:187). Transportation is present in all four supply
chain linkages discussed in section 3.2.3 (Monczka et al., 2016:659) and can influence the success
of a supply chain (Chopra and Meindl, 2016:431).
Transportation should be managed effectively and cost-efficiently, since it generally forms the
largest logistical expense for any business (Bowersox et al., 2013:187). Effective transportation
management refers to the extent that transportation contributes to meeting customer needs;
whereas cost-efficient transportation management measures how economically transportation
can be used to meet customer needs (see section 1.2.3.2). Holter, Grant, Ritchie and Shaw
(2008:22) identify two reasons for the importance of transportation management, particularly in
small businesses. First, transportation is a process that is repeated numerous times throughout
the supply chain and secondly, transportation is the most costly logistical activity for many small
businesses (see section 3.2.2). Through the effective and cost-efficient management of
transportation, customers’ expectations can easily be met (Bowersox et al., 2013:187). In a study
by the World Bank (2014:153) small retailers within townships indicated that they find it easy to
transport their inventory and that keeping transportation costs low provides a competitive
advantage. If the owner or manager of a small business in a township collects inventory from a
supplier themselves, the average transportation costs is between R300 and R350 per trip (World
78 © University of South Africa
Bank, 2014:153, 172).LF19 Township retailers who purchase inventory in large quantities from
wholesalers do not have any transportation costs, as the wholesalers usually provide free delivery
to these customers.LF20 Many small businesses in Gauteng townships purchase inventory from
markets (such as Marabastad in Pretoria) and other small businesses that do not offer delivery
services (World Bank, 2014:151-153, 172-173, 206).
Regardless of the type of product being transported, four crucial participants are involved and
have to work together to ensure that transportation is managed effectively and cost-efficiently.
These participants are shippers, carriers, owners of transport infrastructures and the relevant
governing bodies (Chopra and Meindl, 2016: 413). A shipper moves a product or service from one
point in the supply chain to another with the aim of minimising the cost of transportation, while
bearing in mind the desired level of responsiveness. The carrier is contracted by the shipper to
move a specific product or service to an allocated site. The task of a carrier includes investing in
transportation equipment and making operating decisions (Bowersox et al., 2013:188-190). South
Africa’s transport infrastructures are mainly publicly owned and are managed by Transnet and the
South African National Road Agency. The Department of Transport, including the nine provincial
transport departments, are responsible for formulating transportation policies that are used as
guidelines for the amount of resources that the government should spend on improving and
maintaining infrastructure. Small retail businesses must adhere to all policies, rules and
regulations promulgated by these governing bodies.
For small retailers, transportation in the supply chain will entail collecting or receiving inventory
from a first-tier supplier, and delivering inventory to first-tier customers (if a delivery service is
offered). The different management decisions regarding transportation are discussed in the next
section.
3.5.1 Components of transportation decisions
The different modes and routes, by which inventory is transported to different locations, are
referred to as the transportation network. A well-designed transportation network will assist a
supply chain to achieve the desired level of responsiveness at the lowest possible cost (Chopra and
Meindl, 2016:64).

79 © University of South Africa
3.5.1.1 Transportation routes
When designing a transportation network, managers should consider two aspects; first, whether
the inventory will be transported directly from the supplier to the customer and secondly,
whether the inventory will pass through an intermediate site, such as a cross-docking distribution
centre (see section 3.3.1.1) (Chopra and Meindl, 2016:64). These two aspects are discussed below.
a) Direct transportation of inventory
Direct shipment of inventory indicates that inventory does not go through an intermediate storage
site, but is directly transported from a supplier to a customer. This means that the coordination
between the different supply chain members is relatively easy in many ways, for example, the
scheduling of delivery times. Direct delivery will minimise the time that inventory spends in transit
(Chopra and Meindl, 2016:64-65). In terms of this study, direct transportation will entail the direct
delivery of inventory from a first-tier supplier to the small retailer, as well as the direct delivery
from the small retailer to a first-tier customer. For example, if a small hardware store ordered
inventory from Builders Warehouse and the inventory is delivered directly by Builders Warehouse
to the small hardware store, direct delivery took place. According to the World Bank (2014:206),
some owners and managers of small retail businesses in townships use their own private vehicles
to deliver inventory to customers.
b) Transportation of inventory through an intermediate site
Inventory can be transported through an intermediate site before delivery to a customer. When a
cross-docking distribution centre is used, a supplier will send a truck containing several customers’
inventory to the centre to be combined with inventory from other suppliers. By coordinating and
sharing transportation, the inbound costs can be lowered. An outbound truck will combine the
inventory from several suppliers destined for one customer (Chopra and Meindl, 2016:423; Yu and
Egbelu, 2013:168).
In a storage facility, inventory from a supplier is received and stored until a customer needs the
inventory. Inbound transportation costs decrease since suppliers can benefit from economies of
scale by sending large shipments of inventory to the storage facility. Normally the outbound
80 © University of South Africa
transportation costs are low, as the storage facility centre is located close to customers when
using a decentralised facility system (Chopra and Meindl, 2016:423).
The next component within the transportation network that should be considered is the mode of
transportation.
3.5.1.2 Mode of transportation
The mode of transportation describes the type of transportation that is used to move products
from one point to another in the supply chain. Pienaar and Vogt (2012:334) identify three basic
forms of transportation, namely land, water and air. Land transportation can be divided into road,
rail and pipeline transportation; whereas water transportation can be divided into sea and in-land
water transportation. Since in-land water transport is only common in European countries, this is
not included in the discussion below. The sections below are structured to discuss each mode of
transportation in terms of its relevance to this study.
a) Rail transportation
Rail transportation has the advantage of transporting large volumes of goods, and is therefore one
of the most cost-efficient modes of transportation (Goldsby et al., 2014:25). A disadvantage of
using rail transport is long transit times (Langley, Coyle, Gibson, Novack & Bardi, 2009:279).
Transnet Freight Rail (TFR), a state-owned business in South Africa, is responsible for all rail freight
transport activities within the country. In 1938 the TFR network coverage was already 95%
completed, and 40% of the network had electrified traction. Unfortunately, investment and
maintenance have been limited until 2005, and it was only in 2013 that TRF invested R16.2 billion
for the maintenance of the existing infrastructure (CSIR, 2014:28-29). In South Africa, rail
transportation is mainly used for low-value raw materials travelling over long distances, such as
agricultural products (Stellenbosch University, 2015:13). When using rail transportation, the level
of cost-efficiency increases at the expense of responsiveness. Since rail transportation is generally
associated with large volumes, and small retailers operating in townships generally purchase
inventory in smaller quantities, rail transportation is not a viable option for these retailers.
81 © University of South Africa
b) Pipeline transportation
For businesses that move large volumes of liquids, pipeline transportation will form an important
part of its supply chain (Goldsby et al., 2014:37). In South Africa, Transnet Pipeline is the primary
provider and operator of pipelines and it transported 16.7 billion litre of liquid fuel and 494 million
metric tons of gas in the 2012/2013 financial year (CSIR, 2014:35). For example, Sasol transports
jet fuel through the 60 km pipeline from Natref refinery in Sasolburg to OR Tambo International
Airport (CSIR, 2014:35). For the purpose of this study, pipeline transportation is disregarded since
the relevant businesses do not deal in large volumes of liquids.
c) Water transportation
Water transportation, also known as port transportation, is the oldest mode of transportation and
includes both inland and ocean going vessels. Usually these vessels transport low-value items in
large quantities (Bowersox et al., 2013:198). This is a less expensive mode of transportation, but
has limited flexibility and is slow in speed (Monczka et al., 2016:671). South Africa has eight
commercial ports under the Transnet National Ports Authority and each port has specific
operations, for instance Saldanha handles mostly iron ore and Mossel Bay off-shore oil and gas
(CSIR, 2014:33-34). Port transportation is typically used by businesses purchasing large quantities
of goods or raw materials from international suppliers (Monczka et al., 2016:671). Water
transportation is not a viable option for the small retailers in this study since they are situated
inland.
d) Air transportation
Air transportation is a fast, but expensive mode of transportation and is mainly used for time-
sensitive and high-value items (Chopra and Meindl, 2016: 412). Air carriers that specialise in cargo
transportation will use the full capacity of the aircraft and focus on long distance routes. Some
passenger airlines allow cargo to be carried in the lower cargo hold (Goldsby et al., 2014:36). The
Airports Company of South Africa invested approximately R20 billion in all ten airports, but this
investment was focused on improving only the passenger handling infrastructure (CSIR, 2014:36).
When using air transportation, the level of responsiveness increases at the expense of cost-
efficiency. Air transportation is a possible, but unlikely mode of transportation for the small
82 © University of South Africa
retailers, because of the expense involved. In the event of a small retailer requiring a product
urgently, for example a specific car part, the auto retailer could turn to a first-tier supplier who
uses air transport. The first-tier customers of the Soweto retailers would normally not require such
a service from these retailers.
e) Road transportation
Road transportation is viewed as the most popular mode of transportation as it is fast and reliable
(Monczka et al., 2016:671; Goldsby et al., 2014:17). Different vehicles, from small delivery vans to
large trucks are used to move inventory from its point of origin to its final destination in the supply
chain. The available highway networks enable trucks to reach nearly every shipping and receiving
location (Coyle et al., 2013:405-406). The ability of road transportation to deliver door-to-door
makes it the most flexible mode of transportation. This flexibility comes at a cost, since
transportation by road is more expensive than by rail and water (Monczka et al., 2016:669).
In South Africa, the managing, financing, improving and maintenance of South African roads are
the responsibility of the South African National Road Agency Limited, known as SANRAL. According
to the 10th Annual State of Logistics Survey of South Africa, the comprehensive road network of
the country consists of 535 000 km proclaimed roads, including 366 872 km non-urban roads
(CSIR, 2014:31). Although road transportation is more expensive than other modes of
transportation, the advantage of easy access to the final location normally outweighs the
additional costs (Chopra and Meindl, 2016:416). The World Bank (2014:206) reports that small
businesses operating within townships primarily use road transportation when collecting
inventory for their stores. Retailers who purchase smaller quantities of inventory have to travel to
wholesalers that are located within a reasonable distance from their stores, by using public
transport (taxis in the form of mini-busses), or by hiring a small truck (referred to as a bakkie)
(World Bank, 2014:151-153, 172-173). This is in line with Goldsby et al. (2014:24) who state that
small businesses primarily use road transportation by selecting small trucks and motor vehicles to
transport inventory. Road transportation will increase a retailer’s level of responsiveness, but at
the same time decrease the level of cost-efficiency (Hugo and Badenhorst-Weiss, 2011:179–180).
83 © University of South Africa
f) Intermodal transportation
Intermodal transportation involves more than one mode of transportation (road, rail, water and
air) to move inventory from its origin to its final destination within the supply chain (Coyle et al.,
2013:405). It aims to take advantage of the inherent economies of each mode of transportation in
order to ultimately provide an integrated transportation service at a lower cost (Bowersox et al.,
2013:188-190).
The most common intermodal transportation method is the combination of road and rail
transportation (Chopra and Meindl, 2016: 417). The flexibility of road transportation for shorter
distances is combined with the cost-efficiency of rail for longer distances (Bowersox et al.,
2013:201). Intermodal transportation goes beyond the first-tier supplier(s) and first-tier
customer(s) of a supply chain. In a typical retail supply chain, intermodal transportation will entail
the moving of raw materials from a supplier to a manufacturer using rail transportation;
whereafter the manufacturer will transfer the semi-finished or finished product to a wholesaler,
using road transportation.
In South Africa the move from road, back to rail transportation, is high on both the private and
public sectors’ agendas. The main reason for this sought-after shift is to preserve roads and lower
logistics costs. It is hoped that this rail-friendly policy will also increase South Africa’s
competitiveness (CSIR, 2014:39). This shift to rail and intermodal transportation on the whole, is
however unlikely to directly impact the small retail businesses in Soweto, since they will continue
to transport inventory by road.
3.5.2 Management of transportation by small retailers
The findings from the literature and the results of previous studies conducted in townships (as
discussed in section 3.5.1) are summarised in this section. An overview of the components of the
different transportation decision by small retailers, based on the orientation of their supply chain
strategy, is provided in table 3.3.

84 © University of South Africa
Table 3.3 Components of decisions on transportation by retailers – depending on their focus
Supply chain driver
Components of decisions related to
transportation
Management decision when focused on responsiveness
Management decision when focused on cost-
efficiency Relevant authors
Related section in chapter
Transportation
Routes
Delivery of inventory: Use direct delivery of inventory from and to first-tier suppliers and customers in order to minimise transit time and to increase the level of
responsiveness.LF21
Delivery of inventory: Retailers order large quantities of inventory to qualify for free delivery from suppliers. Larger retailers may have inventory delivered to an intermediate site to lower inbound transportation
costs.LF22
Chopra and Meindl 2016:64-65
World Bank 2014:151-153, 172-173, 206).
Yu and Egbelu 2013:168
3.5.1.1
Mode
Mode of transportation: Use fastest and most flexible modes to transport inventory between suppliers and
customers. LF21
Availability of transportation: Transportation of inventory is effortless and most often a car is used or a small truck is hired to
increase flexibility. LF19
Mode of transportation: Use slowest and cheapest mode to transport inventory between suppliers and customers.
LF22
Availability of transportation: Transportation of inventory is effortless and most often a car is used or a small truck is hired to save on
transportation costs. LF22
Monczka et al. 2016:671
World Bank 2014:151-153, 172-173, 206
Goldsby et al. 2014:17
Hugo and Badenhorst-Weiss 2011:179–180
3.5.1.2
Source: Compiled by researcher

85 © University of South Africa
3.6 Conclusion
Chapter 3 focused on the three logistical supply chain drivers identified in chapter 1, namely
facilities, inventory and transportation. It was established that within a retail supply chain,
products are moved between the different supply chain members through the four supply chain
linkages, namely inbound logistics, intra-organisational movements, outbound logistics and
reverse logistics. The three logistical supply chain drivers are present within each of these linkages,
and therefore must be managed as a cohesive unit.
It was established that South Africa, as a developing country, faces certain logistical constraints
and can be classified as a transport intensive economy. Facilities, inventory and transportation
contribute significantly to the total logistical costs of the country. It was concluded that small
businesses generally make use of third-party logistics service providers to perform their logistical
functions.
Facilities, inventory and transportation were discussed in terms of the different components that
managers need to consider when deciding on the management of the three logistical supply chain
drivers. The management of the three logistical supply chain drivers in terms of the level of
responsiveness and cost-efficiency that are aimed for, should be aligned with the level of
responsiveness and cost-efficiency stipulated by the selected supply chain strategy. Each
component influences the level of responsiveness and cost-efficiency that the business aims for.
Managing facilities when orientated towards responsiveness will entail that the business
implements a decentralised system with excess capacity; while managing facilities when
orientated towards cost-efficiency, will entail that the small retailer implements a centralised
system with the minimum excess capacity.
A retailer orientated towards responsiveness will order cycle inventory on a frequent basis, hold
large amounts of safety inventory, and prepare for seasonal changes in demand. However, when
a retailer is orientated towards managing inventory cost-efficiently, the retailer will order cycle
inventory on an ad-hoc basis, hold small amounts of safety inventory and will not prepare for
seasonal changes in demand.
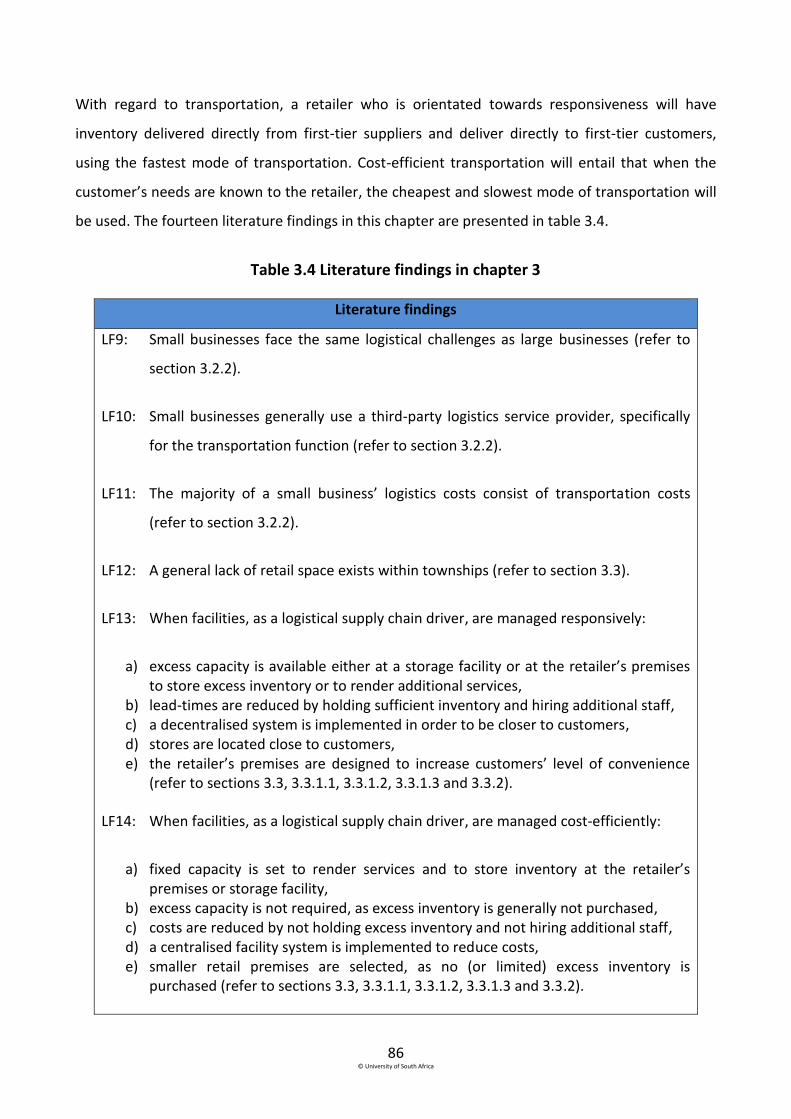
86 © University of South Africa
With regard to transportation, a retailer who is orientated towards responsiveness will have
inventory delivered directly from first-tier suppliers and deliver directly to first-tier customers,
using the fastest mode of transportation. Cost-efficient transportation will entail that when the
customer’s needs are known to the retailer, the cheapest and slowest mode of transportation will
be used. The fourteen literature findings in this chapter are presented in table 3.4.
Table 3.4 Literature findings in chapter 3
Literature findings
LF9: Small businesses face the same logistical challenges as large businesses (refer to
section 3.2.2).
LF10: Small businesses generally use a third-party logistics service provider, specifically
for the transportation function (refer to section 3.2.2).
LF11: The majority of a small business’ logistics costs consist of transportation costs
(refer to section 3.2.2).
LF12: A general lack of retail space exists within townships (refer to section 3.3).
LF13: When facilities, as a logistical supply chain driver, are managed responsively:
a) excess capacity is available either at a storage facility or at the retailer’s premises to store excess inventory or to render additional services,
b) lead-times are reduced by holding sufficient inventory and hiring additional staff, c) a decentralised system is implemented in order to be closer to customers, d) stores are located close to customers, e) the retailer’s premises are designed to increase customers’ level of convenience
(refer to sections 3.3, 3.3.1.1, 3.3.1.2, 3.3.1.3 and 3.3.2).
LF14: When facilities, as a logistical supply chain driver, are managed cost-efficiently:
a) fixed capacity is set to render services and to store inventory at the retailer’s premises or storage facility,
b) excess capacity is not required, as excess inventory is generally not purchased, c) costs are reduced by not holding excess inventory and not hiring additional staff, d) a centralised facility system is implemented to reduce costs, e) smaller retail premises are selected, as no (or limited) excess inventory is
purchased (refer to sections 3.3, 3.3.1.1, 3.3.1.2, 3.3.1.3 and 3.3.2).
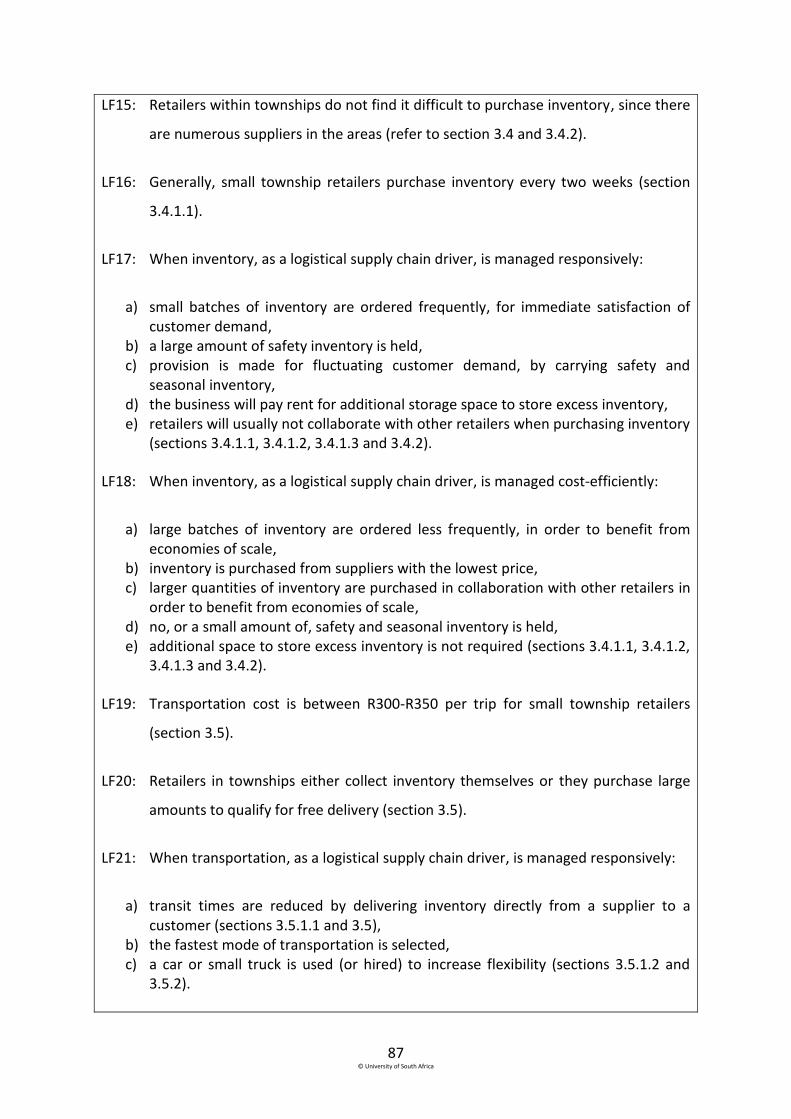
87 © University of South Africa
LF15: Retailers within townships do not find it difficult to purchase inventory, since there
are numerous suppliers in the areas (refer to section 3.4 and 3.4.2).
LF16: Generally, small township retailers purchase inventory every two weeks (section
3.4.1.1).
LF17: When inventory, as a logistical supply chain driver, is managed responsively:
a) small batches of inventory are ordered frequently, for immediate satisfaction of customer demand,
b) a large amount of safety inventory is held, c) provision is made for fluctuating customer demand, by carrying safety and
seasonal inventory, d) the business will pay rent for additional storage space to store excess inventory, e) retailers will usually not collaborate with other retailers when purchasing inventory
(sections 3.4.1.1, 3.4.1.2, 3.4.1.3 and 3.4.2).
LF18: When inventory, as a logistical supply chain driver, is managed cost-efficiently:
a) large batches of inventory are ordered less frequently, in order to benefit from economies of scale,
b) inventory is purchased from suppliers with the lowest price, c) larger quantities of inventory are purchased in collaboration with other retailers in
order to benefit from economies of scale, d) no, or a small amount of, safety and seasonal inventory is held, e) additional space to store excess inventory is not required (sections 3.4.1.1, 3.4.1.2,
3.4.1.3 and 3.4.2).
LF19: Transportation cost is between R300-R350 per trip for small township retailers
(section 3.5).
LF20: Retailers in townships either collect inventory themselves or they purchase large
amounts to qualify for free delivery (section 3.5).
LF21: When transportation, as a logistical supply chain driver, is managed responsively:
a) transit times are reduced by delivering inventory directly from a supplier to a customer (sections 3.5.1.1 and 3.5),
b) the fastest mode of transportation is selected, c) a car or small truck is used (or hired) to increase flexibility (sections 3.5.1.2 and
3.5.2).
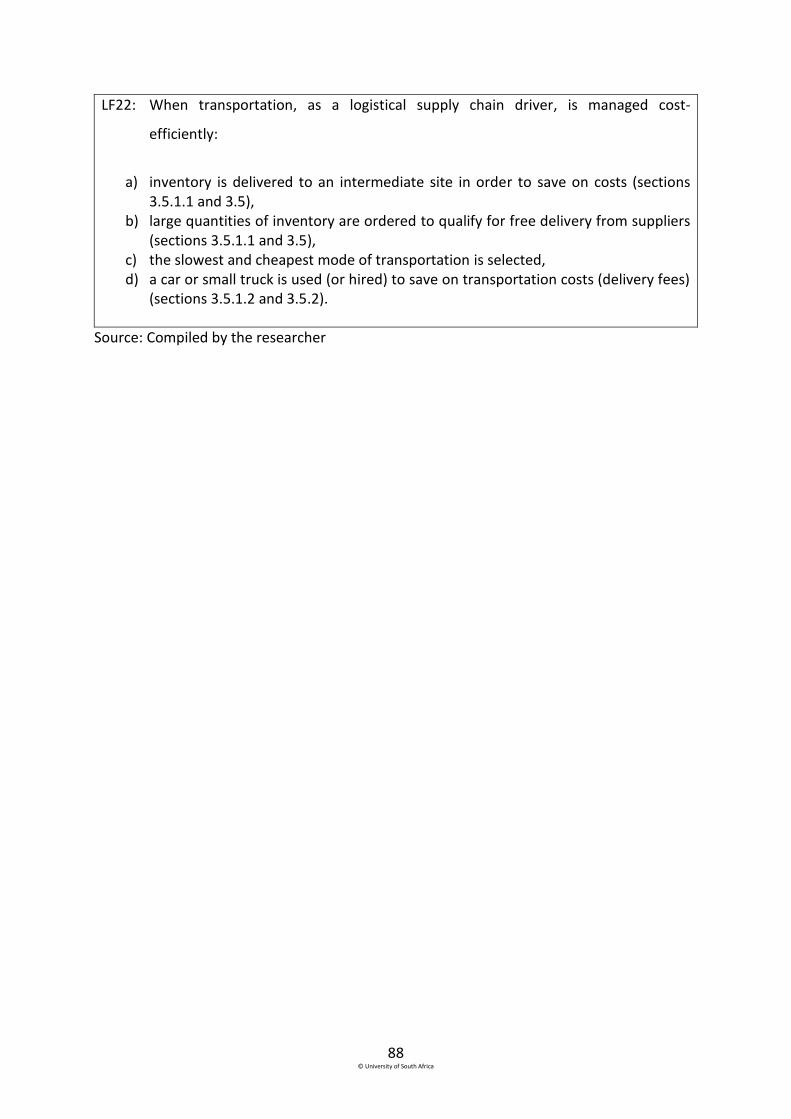
88 © University of South Africa
LF22: When transportation, as a logistical supply chain driver, is managed cost-
efficiently:
a) inventory is delivered to an intermediate site in order to save on costs (sections 3.5.1.1 and 3.5),
b) large quantities of inventory are ordered to qualify for free delivery from suppliers (sections 3.5.1.1 and 3.5),
c) the slowest and cheapest mode of transportation is selected, d) a car or small truck is used (or hired) to save on transportation costs (delivery fees)
(sections 3.5.1.2 and 3.5.2).
Source: Compiled by the researcher
89 © University of South Africa
Chapter 4
Research Methodology
4.1 Introduction
Research can be defined as any action that a person takes to obtain data in a systematic way in
order to ultimately increase knowledge (Saunders et al., 2012:5). During the research process data
is collected and interpreted in order to answer a specific research question (Quinlan et al.,
2015:2). This chapter describes the research methodology used to answer the primary research
question: how can formal independent small retail business in Soweto manage their logistical
supply chain drivers in terms of responsiveness and cost-efficiency in order to survive? This
chapter begins by determining the need for research, whereafter the discussion focuses on the
research process. This process was used as a foundation for establishing the research problem;
research objectives; research design and identifying the data sources; developing the sample plan;
and designing the research instrument for this study. The discussion will also touch on how the
data was collected, coded and captured, as well as on the different statistical techniques that were
used for analysing the data. Before the process is discussed in detail it is important to provide
some background with regard to research in general.
4.2 Determining the need for research
Although data and information are required to answer a research question, not all research
questions can be investigated due to, for example time constraints, the availability of current data,
the nature of the benefit to be obtained and the benefits of the research as opposed to the cost of
conducting the research (Cooper and Schindler, 2014:18).
Figure 4.1 illustrates the decision-making process in order to determine whether research should
be conducted or not. Only when the answers to the questions regarding time constraints, the
availability of data, the nature of the benefits and the cost of conducting the research, are known,
would a researcher be able to determine whether research should be conducted or not.
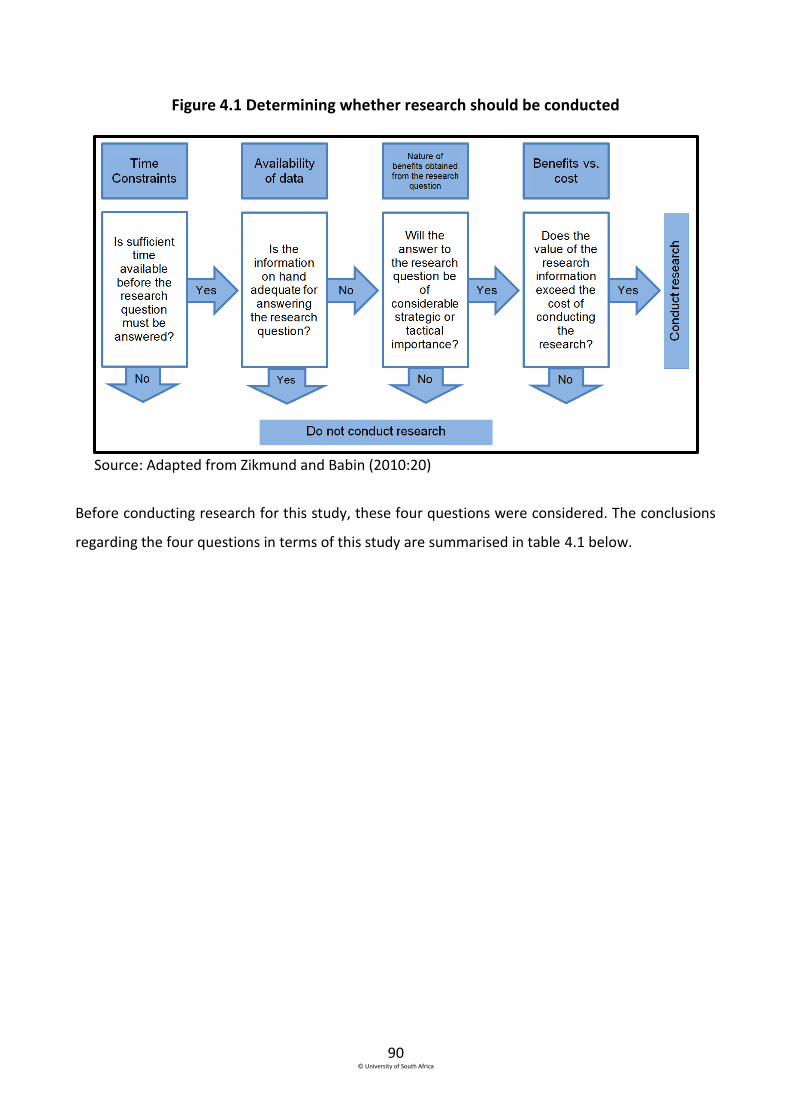
90 © University of South Africa
Figure 4.1 Determining whether research should be conducted
Source: Adapted from Zikmund and Babin (2010:20)
Before conducting research for this study, these four questions were considered. The conclusions
regarding the four questions in terms of this study are summarised in table 4.1 below.
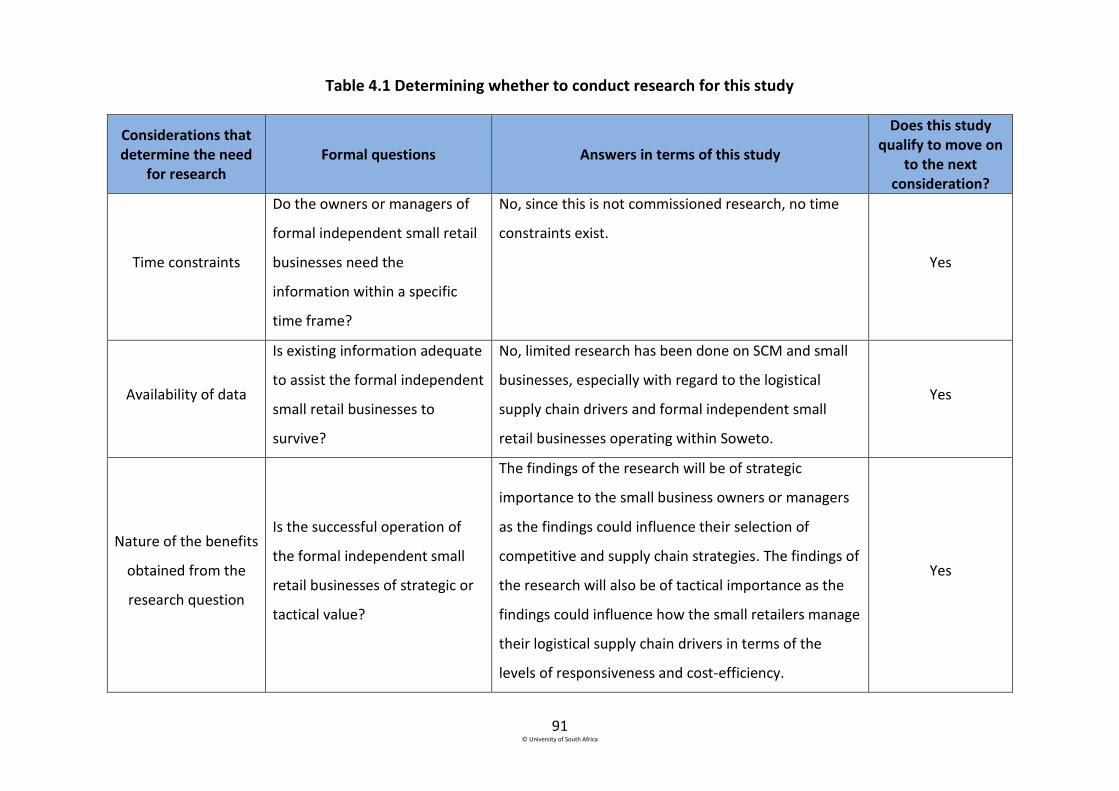
91 © University of South Africa
Table 4.1 Determining whether to conduct research for this study
Considerations that determine the need
for research Formal questions Answers in terms of this study
Does this study qualify to move on
to the next consideration?
Time constraints
Do the owners or managers of
formal independent small retail
businesses need the
information within a specific
time frame?
No, since this is not commissioned research, no time
constraints exist.
Yes
Availability of data
Is existing information adequate
to assist the formal independent
small retail businesses to
survive?
No, limited research has been done on SCM and small
businesses, especially with regard to the logistical
supply chain drivers and formal independent small
retail businesses operating within Soweto.
Yes
Nature of the benefits
obtained from the
research question
Is the successful operation of
the formal independent small
retail businesses of strategic or
tactical value?
The findings of the research will be of strategic
importance to the small business owners or managers
as the findings could influence their selection of
competitive and supply chain strategies. The findings of
the research will also be of tactical importance as the
findings could influence how the small retailers manage
their logistical supply chain drivers in terms of the
levels of responsiveness and cost-efficiency.
Yes
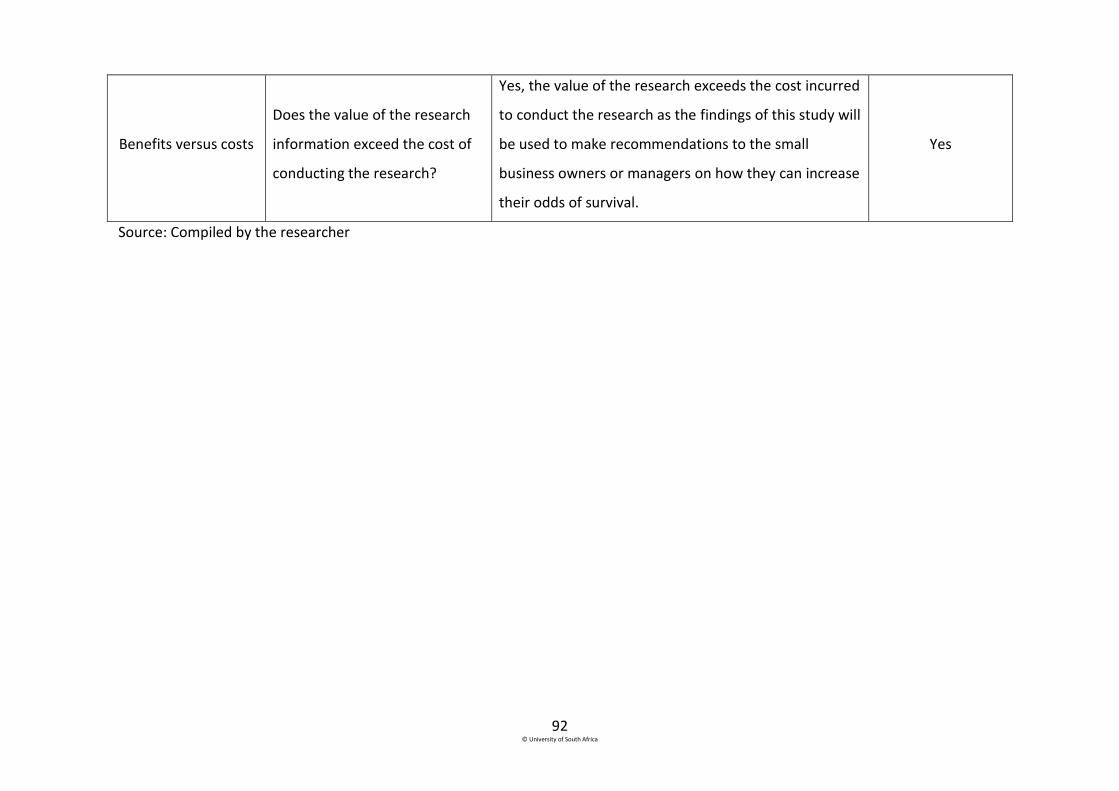
92 © University of South Africa
Benefits versus costs
Does the value of the research
information exceed the cost of
conducting the research?
Yes, the value of the research exceeds the cost incurred
to conduct the research as the findings of this study will
be used to make recommendations to the small
business owners or managers on how they can increase
their odds of survival.
Yes
Source: Compiled by the researcher
93 © University of South Africa
After answering all four questions, it was evident that this research would be valuable to the
owners and managers of formal independent small retail businesses and the next step in the
research process could be started. In the following section the research process will be discussed
in detail.
4.3 Research process
A research process is a multi-stage process that provides for a systematic and planned approach to
a project in order to ensure that the stages of conducting research form a coherent whole (Tustin,
Ligthelm, Martins & Van Wyk, 2005:75; Saunders et al., 2012:12). Figure 4.2 graphically illustrates
the research process. The first step in the process is to determine the research problem to be
addressed, followed by the establishment of research objectives. Only thereafter can the research
design be determined. This requires that the different methods and processes to collect and
analyse the information should be indicated (Babbie, 2016:113-114). Once the research design has
been established, the type and sources of information can be determined. This is followed by the
development of the sample plan and research instrument. After the fieldwork has been
conducted, the coding, editing and capturing of the data is done in preparation for the statistical
analyses. Lastly, the research findings are presented and possible future research is identified
(Tustin et al., 2005:75, 77, 81-82, 88, 99-102, 107).
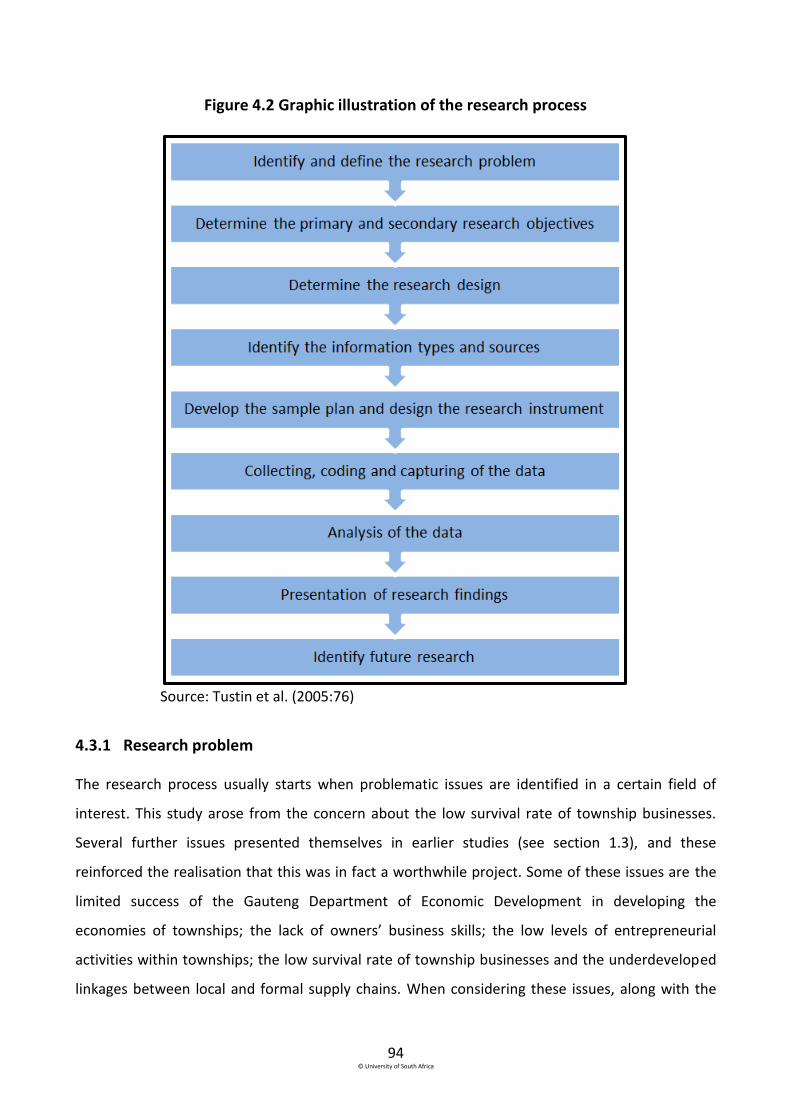
94 © University of South Africa
Figure 4.2 Graphic illustration of the research process
Source: Tustin et al. (2005:76)
4.3.1 Research problem
The research process usually starts when problematic issues are identified in a certain field of
interest. This study arose from the concern about the low survival rate of township businesses.
Several further issues presented themselves in earlier studies (see section 1.3), and these
reinforced the realisation that this was in fact a worthwhile project. Some of these issues are the
limited success of the Gauteng Department of Economic Development in developing the
economies of townships; the lack of owners’ business skills; the low levels of entrepreneurial
activities within townships; the low survival rate of township businesses and the underdeveloped
linkages between local and formal supply chains. When considering these issues, along with the
95 © University of South Africa
strategic importance of SCM in terms of the orientation of the selected supply chain strategy as
discussed in section 1.2, the research problem focused on how small business owners could
increase their odds of survival by using SCM (Gauteng Department of Economic Development,
2014:4-5; World Bank, 2014:10, 13, 19, 22-23).
Identifying and defining the research problem together with step 2, (establishing the research
objectives) will serve as a blueprint for any research process. Once the research problem has been
identified it can be defined. When defining the research problem, one is determining what
information is needed, as well as how the information will be gathered in the most efficient and
effective way (Tustin et al., 2005:77-78). For this study, the next step in the research process was
to establish the research objectives. Section 4.3.2 will discuss the primary and secondary research
objectives derived from the research problem.
4.3.2 Research objectives
Research objectives are based on a study’s research problem and identify what the researcher
aims to accomplish by conducting the research (Saunders et al., 2012:680). In table 4.2 below the
research problem as well as the primary and the secondary research objectives for this study are
outlined.

96 © University of South Africa
Table 4.2 Primary and secondary research questions and objectives
Primary research question:
How can formal independent small retail businesses in Soweto manage their logistical
supply chain drivers in terms of responsiveness and cost-efficiency in order to survive?
Secondary research questions:
SRQ 1: How do small businesses achieve a strategic fit between their competitive
and supply chain strategies?
SRQ 2: How, according to the literature, are the three logistical supply chain
drivers managed by small businesses in terms of responsiveness and cost-
efficiency, based on the orientation of the selected supply chain strategy?
SRQ 3: How do formal independent small retail businesses operating within
Soweto manage their logistical supply chain drivers in terms of
responsiveness and cost-efficiency?
SRQ 4: Does the industry in which the Sowetan formal independent small retail
businesses operate, influence the management of the logistical supply
chain drivers in terms of responsiveness and cost-efficiency?
SRQ 5: Can the management of the logistical supply chain drivers increase the
odds of the formal independent small retail businesses operating within
Soweto to survive?
Primary research objectives
To determine how formal independent small retail businesses in Soweto manage their
logistical supply chain drivers in terms of responsiveness and cost-efficiency in order to
survive.
Secondary research objectives
SRO 1: To discuss how small businesses achieve a strategic fit between their
competitive and supply chain strategies.
SRO 2: To establish how, according to the literature, small businesses manage the
three logistical supply chain drivers in terms of responsiveness and cost-

97 © University of South Africa
efficiency, based on the orientation of the selected supply chain strategy.
SRO 3: To determine how formal independent small retail businesses operating in
Soweto manage their logistical supply chain drivers in terms of
responsiveness and cost-efficiency.
SRO 4: To investigate whether the industry group in which the Sowetan formal
independent small retail businesses operate, influences the management
of the logistical supply chain drivers in terms of responsiveness and cost-
efficiency.
SRO 5: To determine whether the management of the logistical supply chain
drivers increases the odds of the formal independent small retail
businesses operating within Soweto to survive.
Boundaries of the study:
All formal independent small retail businesses operating within the boundaries of the
township of Soweto.
Source: Compiled by the researcher
After the problem statement, the primary and secondary questions and objectives had been
identified, the next step, namely research design, could be embarked upon.
4.3.3 Research design
The research design is considered to be a plan or blueprint of how a research problem and
objectives are going to be solved and achieved. The research design includes describing the
sources from which data will be collected; how the data will be collected; how the data will be
analysed; what the limitations of the study are; as well as the ethical issues that need to be
considered (Saunders et al., 2012:159). Three design approaches are available, namely
exploratory, causal and descriptive.
An exploratory research design (also known as exploratory research) is employed when the
researcher aims to determine the general nature of a research question. A researcher asks open
questions in order to gain insight into a topic of interest. Exploratory research can be used to
clarify a specific research problem (Cooper and Schindler, 2014:127; Saunders et al., 2012:171).

98 © University of South Africa
Highly flexible, unstructured and qualitative research methods are used when conducting
exploratory research (Tustin et al., 2005:86). Often exploratory research will conclude that a
specific research problem does not exist. For this study the research problem was clearly
identified, defined and formulated, therefore an exploratory research design was not suitable.
A causal research design determines whether one variable causes, determines or affects another
variable. In such cases experiments are used as the research method in order to measure the
connections between different variables (Babbie, 2016:29). During this study no specific variable
was identified and used to determine if it was causing certain behaviour; therefore a causal
research design was not used in this study.
A descriptive research design aims at answering the who, what, when, where and how questions
that will enable the researcher to ultimately solve a specific research problem. When conducting
descriptive research the researcher already understands the underlining relationship between the
problem area and the research questions, and univariate (percentages), bivariate (hypotheses)
and multivariate (binary logistic regression) analyses can be conducted. Structured and
quantitative research methods are used when conducting descriptive research, for example face-
to-face interviews (Tustin et al., 2005:86-87). For this study a descriptive research approach was
followed to answer the who, what, when, where and how questions pertaining to the logistical
supply chain drivers, by making use of a questionnaire (see appendix A).
The next step in the research process was to identify the information types and sources that
would be used during the study.
4.3.4 Identifying information types and sources that will be used during the research process
Usually the next step in the research process involves identifying the information types and
sources of information. Tustin et al. (2005:88) state that a researcher should always keep in mind
the time and cost of collecting the necessary data when deciding on the information types and
sources. The two different groupings in data are primary and secondary data. The next section will
start with a discussion of secondary data since researchers need to investigate existing sources
before conducting primary research.
99 © University of South Africa
4.3.4.1 Secondary research
Secondary data is data that has already been collected for a different purpose and has already
been interpreted by a researcher (Cooper and Schindler, 2014:86; Saunders et al., 2012:304).
When using secondary data, the data is analysed further to gain new or different knowledge,
interpretations and conclusions. Secondary data can therefore be obtained either internally, for
example business records and warranty cards; or externally, for example press and trade
publications. Secondary data research acknowledges that the uses of the data is secondary in
nature and that the data may not exactly meet the requirements of the specific study; therefore,
secondary data is an excellent starting point when conducting research since it is easily obtainable
(Management Study Guide, 2016). For the purpose of this study, secondary data was used to
conduct the literature reviews in chapters 2 and 3. Chapter 2 provided a literature review of the
different competitive and supply chain strategies that managers employ within their small
businesses. Chapters 3 provided an in-depth literature review of the logistical supply chain drivers
(facilities, inventory and transportation).
When secondary data is deemed inadequate to answer the research questions or achieve the
research objectives, primary research should be conducted. In this study the secondary data
contained in chapters 2 and 3 was used to answer some of the research questions and achieve
some of the research objectives. However, primary research was necessary in order to address the
remaining research questions and objectives.
4.3.4.2 Primary research
As mentioned earlier, primary data is collected to address specific research problems or achieve
specific research objectives when secondary data is deemed inadequate. When conducting
primary research, the most appropriate research approach (quantitative or qualitative), as well as
the primary method of data collection, must be identified (Tustin et al., 2005:89). First, a
distinction needs to be made between qualitative and quantitative research.
a) Qualitative research
Qualitative research provides researchers with an opportunity to gain insight regarding certain
research areas that may be difficult to quantify. Qualitative research is a less structured and more

100 © University of South Africa
flexible approach to research. A qualitative research approach is based on personal value
judgements and meanings; therefore it can be difficult to draw general conclusions (Cooper and
Schindler, 2014:144). Qualitative research is ideal for extracting feelings, emotions, motivations
and perceptions, but the validity of qualitative research may be questioned because of the
subjectivity of different researchers (Cooper and Schindler, 2014:145). Qualitative research was
not deemed suitable for this study for two reasons: first, qualitative research is focused on
explaining emotions, motivations and perceptions and not to answer questions, such as who,
what, when, where, and how and secondly, due to the scope of the study it would not have been
feasible to use a qualitative research method to gather the necessary primary data.
b) Quantitative research
Quantitative research usually involves the collection of primary data from a large number of
individuals with the intention of projecting the results to a wider population (Quinlan et al.,
2015:399). The results of quantitative research are presented by means of numbers, figures or
statistical parameters. The data collected from the large number of individuals are statistically
analysed to provide representative data for the entire population in order to forecast events
under different conditions. Results are statistically analysed with precise estimations, and
therefore the results can be deemed valid and reliable (Saunders et al., 2012:472-473). Primary
quantitative data can be collected through observations, experiments and surveys (Quinlan et al.,
2015:131-135; Sachdeva, 2009:111).
Observations
Quinlan et al. (2015:225) define observation as a systematic process whereby the behaviour
patterns of people, objects and occurrences are observed without questioning or communicating
with them. The observers rely on their observation skills to collect, record, describe and analyse
people’s behaviour (Saunders et al., 2012:676). Observation was not used during this study as
personal communication was deemed necessary to collect the primary data.
Experiments
Saunders et al. (2012:670) define experiments as a research method that is aimed at studying the
probability of a change in an independent variable, causing a change in a dependent variable in a
101 © University of South Africa
controlled environment. Experiments are used to assist in identifying causal relationships. Since
this study was not focused on identifying causal relationships, experiments were not used as a
primary data collection method.
Surveys
Quinlan et al. (2015:268) define a survey as a method of collecting primary data where the
necessary information is gathered through interacting with a representative sample or group of
people. Surveys are the most common primary data collection method used in research and use a
structured approach to obtain quantified responses. Surveys can therefore typically be classified
as quantitative research (Strydom, Jooste & Cant, 2002:156). Different types of surveys can be
used in order to obtain primary data. Surveys can take the form of self-administrated surveys,
computer-aided surveys and interviewer-administrated surveys. Table 4.3 contains a description
of the different types of surveys as well as some of the advantages and disadvantages of each
survey method.

102 © University of South Africa
Table 4.3 Comparison of self-administrated, computer-aided and interviewer-administrated surveys
Self-administrated surveys Computer-aided surveys Interviewer-administrated surveys
Description
A traditional paper-based questionnaire
where respondents complete the
questionnaire themselves without the
assistance of an interviewer. Self-
administrated surveys can include mail
surveys, faxed surveys, warranty cards
and panel surveys.
In computer-aided surveys, respondents
complete questions on a computer via
online services, the intranet and internet.
Interviewer-administrated surveys are
personal face-to-face interviews that
involve the interviewer asking questions
from a paper-based questionnaire and
recording the responses. Respondents
are selected to form part of a sample and
are interviewed in person by trained
interviewers.
Advantages
Allow contact with respondents who
would otherwise be inaccessible.
Increase geographical area without
increasing costs dramatically.
Minimal staff required.
Anonymous respondents.
Respondents have time to think about
questions.
Increase geographical area without
increasing costs dramatically.
Minimal staff required.
Anonymous respondents (preventing
interview bias).
Respondents have time to think about
questions.
Respondents who cannot be reached
telephonically or personally, can be
accessed.
Sample frame lists provide viable
Good cooperation from respondents.
The interviewer can answer questions
about the survey, probe for answers,
use follow-up questions and gather
information through observation.
Special visual aids and scoring devices
can be used.
Illiterate respondents can be included.
Pre-screening of respondents is
possible to ensure that they fit the
profile.

103 © University of South Africa
locations rather than prospective
respondents.
Disadvantages
High printing costs.
No one available to explain questions.
Mainly short and simply stated
questions.
Accurate mailing-list required.
Often respondents who return surveys
represent extremes of the population
(skewed responses).
Low-distraction environment needed
to complete questionnaire.
Accessibility and availability of
respondents.
No one available to explain questions.
Accurate email list required.
Often respondents who return surveys
represent extremes of the population
(skewed responses).
Computer security.
Accessibility and availability of
internet.
Expensive.
Highly-trained interviewers are
required.
Fieldwork is time-consuming.
Wide geographic dispersion.
Accessibility and availability of
respondents.
Unwillingness to talk to researchers.
Security concerns in some
neighbourhoods.
Appropriateness of the survey type as
the primary quantitative data collection method
for this study
Self-administrated surveys were not
deemed an appropriate primary
quantitative data collection method
because:
only physical business addresses were
available for the 650 small businesses
operating within Soweto that formed
Computer-aided surveys were not
deemed an appropriate primary
quantitative data collection method
because:
not all respondents would have access
to a computer and the internet,
respondents might not be computer
Interviewer-administrated surveys were
deemed the appropriate primary
quantitative data collection method
because:
many respondents did not have
English as their first language and may
therefore misunderstand certain

104 © University of South Africa
the sample frame for this study;
therefore, mail surveys were not
viable,
many respondents did not have
English as their first language and may
therefore misunderstand certain
questions and answer inappropriately,
and
some questions contained business
management terminology that may
require explanation.
literate,
many respondents did not have
English as their first language and may
therefore misunderstand certain
question and answer inappropriately,
and
some questions contained business
management terminology that may
require explanation.
question and answer inappropriately,
some questions contained business
management terminology that may
require explanation. An interviewer
could ensure that relevant responses
were obtained, and
illiterate respondents could be
included if an interviewer could guide
the respondent through the questions.
Source: Adapted from Cooper and Schindler (2014:225); Mentz (2014:144); Marx (2013:93-94); Tustin et al. (2005:145, 184, 208)
105 © University of South Africa
After considering the advantages, disadvantages and the appropriateness of each survey method
with regard to this study, it was decided to use an interviewer-administrated survey to gather the
primary quantitative data. With the information types and sources also established, the next steps
in the research process, namely developing the sample plan and designing the research
instrument, could receive attention.
4.3.5 Developing the sample plan and designing the research instrument
Before the sample plan and design instrument can be discussed, some contextualisation is
necessary. As mentioned in section 1.5.2.3, the researcher conducted the study in conjunction
with the BMR of UNISA. An opportunity became available for the researcher to join other
colleagues from the Department of Business Management (UNISA) and researchers from the BMR
to gather information on formal independent small businesses in Soweto in 2014. The following
aspects were covered in the combined study:
General information
Nature of the business
Geographical location
Logistics or physical distribution channels
Internal operations
Supply chain management
Turnover
Business support
Level of entrepreneurship
Demographic information
Together with the researchers from the BMR and colleagues from the Department, a sample plan
and the research instrument were designed. This would serve as a follow-up on a study conducted
in 2012 by the BMR on formal independent small businesses in Soweto. Because of the successful
gathering of data in 2012, it was decided that the sample plan and research instrument for the
2014 study, would be based on the 2012 study. For the sake of clarity, in the discussion of the
development of the sample plan and the research instrument, the previous study will be referred
to as the ”2012 Soweto study” and the present study as the ”2014 Soweto study”.

106 © University of South Africa
4.3.5.1 Developing the sample plan
Tustin et al. (2005:336) state that when developing an appropriate sampling plan a researcher
typically has to follow seven steps (see figure 4.3).
Figure 4.3 Seven steps in developing a sample plan
Source: Adapted from Mentz (2014:153); Tustin et al. (2005:339)
During the development of the sample plan the population is defined; the data collection method
selected; a specialised and appropriate sample frame is determined; a sample method is selected;
the sample size is determined; and finally the sample is developed and tested. These steps will be
discussed in more detail below.
a) Define the population of interest
A population is defined as a group of elements that shares a common set of characteristics, for
example the area in which a business operates. The population serves as an important source of
information (Cooper and Schindler, 2014:662; Quinlan et al., 2015:268). The population of the
2014 Soweto study consisted of formal independent small businesses situated within the
boundaries of Soweto, which included businesses situated in shopping malls, large shopping areas
(outside shopping malls), smaller shopping areas, stand-alone businesses and industrial areas with
2-5, 6-10 and 10-plus surrounding businesses.
Define population of interest
Select data collection method
Specify sample frame
Select sampling method
Determine sample size
Develop operational
sampling plan
Execute operational
sampling plan
107 © University of South Africa
b) Select data collection method
In section 4.3.4.1 it was mentioned that secondary data would be accessed for the literature
reviews in chapters 2 and 3. However, quantitative primary data would be collected with the aid of
an interviewer-administrated questionnaire. The quantitative primary data would then be
statistically analysed (see chapters 5 and 6).
c) Specify sample frame
This step entails identifying the sample frame from which respondents will be drawn. A sampling
frame refers to possible elements, for example a comprehensive list of businesses from which the
sample is drawn (Quinlan et al., 2015:268). The sampling frame that was used for this study was
the list of 650 formal independent small businesses that had been identified during the 2012
Soweto study. Formal businesses were defined in section 1.5.2.3 as businesses that operate within
purpose-built shops and form part of the registered business infrastructure of South Africa; they
pay taxes and other levies to different levels of government (Strydom, 2015:464; Ligthelm,
2013:59; Du Plessis, Strydom & Jooste, 2012:56).
The five fieldworkers were instructed, by the researcher, that in the case of a business that had
closed down since 2012, they were to include any formal independent small businesses that
complied with the criteria for selecting respondents during the 2012 Soweto study. Consequently,
the following businesses were excluded from the 2014 Soweto study as they had also been
excluded from the 2012 Soweto study: branches of chain stores, franchises, street vendors on
pavements, home-based businesses (such as spazas and tuck shops), professional and business
services and transport businesses (passenger busses and taxis).
d) Select sampling method
In survey studies one of two sampling methods can be used, namely probability sampling and non-
probability sampling. Probability sampling entails that each element in the population has a known
non-zero probability of being selected for the sample; whereas in non-probability sampling the
probability of being selected is unknown (Tustin et al., 2005:344). Probability sampling methods
include simple random sampling, systematic sampling, stratified sampling and cluster sampling;
whereas non-probability sampling methods include convenience sampling, judgement sampling,

108 © University of South Africa
quota sampling, snowball sampling and internet sampling (Quinlan et al., 2015:268). As each
formal independent small business in the population had the same probability of being selected,
the method used in this study can be classified as probability sampling using a stratified sampling
method.
e) Determine sample size
A sample is defined as a subset or representative group of a population (Tustin et al., 2005:336).
According to Cooper and Schindler (2014:662), determining the correct sample size is complex and
depends on factors, such as resource availability in terms of time, money and personnel. The
sample size of this study was 650 formal independent small businesses.
Table 4.4 summarises the sample plan for this study.
Table 4.4 Summary of the sample plan
Empirical research aspect Description of empirical research aspect
Survey area Defined business areas in Soweto.
Survey population Formal independent small businesses located within
business areas/stands across Soweto. These include
businesses situated in shopping malls, large shopping areas
(outside shopping malls), smaller shopping areas, stand-
alone businesses and industrial areas with 2-5, 6-10 and 10-
plus surrounding businesses.
Data collection methods Secondary data would be accessed for the literature reviews.
Quantitative primary data collected through interviewer-
administrated surveys. Personal face-to-face interviews with
owners or managers of the small businesses.
Sample frame A list of 650 formal independent small businesses operating
within the boundaries of Soweto, compiled in 2012 by the
BMR.
Sampling method Probability sampling using a stratified sampling method.
Sample size 650 formal independent small businesses.
Source: Compiled by the researcher

109 © University of South Africa
4.3.5.2 Designing the research instrument
When conducting a survey, a questionnaire is generally used to gather the necessary information.
Questionnaire design involves formulating questions and response options based on the research
objectives (Tustin et al., 2005:98). The purpose of a research instrument is to ensure that relevant
data is collected and compared, respondents are motivated to participate and bias is minimised.
For this study the questionnaire contained questions from different researchers involved in the
2014 Soweto study and covered several general business-related topics. The following discussion
refers only to the supply chain management questions and questions regarding the survival of the
formal independent small businesses that were included in the questionnaire. The questions on
supply chain management were developed specifically for this (2014) study. Therefore, the
research problem and objectives of this study guided the formulation of these questions. The
questions numbered D2, D3, E2, E3 (a-h; j; k), E6 (a; c), and E11 (a; c; j; k; m) focused on supply
chain management and questions B1 and F2 covered the formal independent small business’
survival; measured in terms of age and growth (refer to section 6.2.1) (see appendix A).
a) Questionnaire type
Different types of questionnaires (unstructured, semi-structured, and structured) were considered
before deciding on a structured questionnaire for the 2014 Soweto study.
Unstructured questionnaires: Neither the researcher nor the respondents are bound by
the structure of the questionnaire. The interview is conducted without any pre-formulated
questions and respondents express their opinions in their own words. A topic-list provides
the issues to be covered and the researcher is free to formulate and explain the questions
as he or she sees fit.
Semi-structured questionnaires: Questions accommodate a variety of answers for
respondents to choose from. Introductory questions may be structured, but follow-up
questions will result from the respondents’ replies.
Structured questionnaires: All questions are pre-formulated, structured and controlled
and the appropriate response is chosen from several possible options (Quinlan et al.,
2015:282).
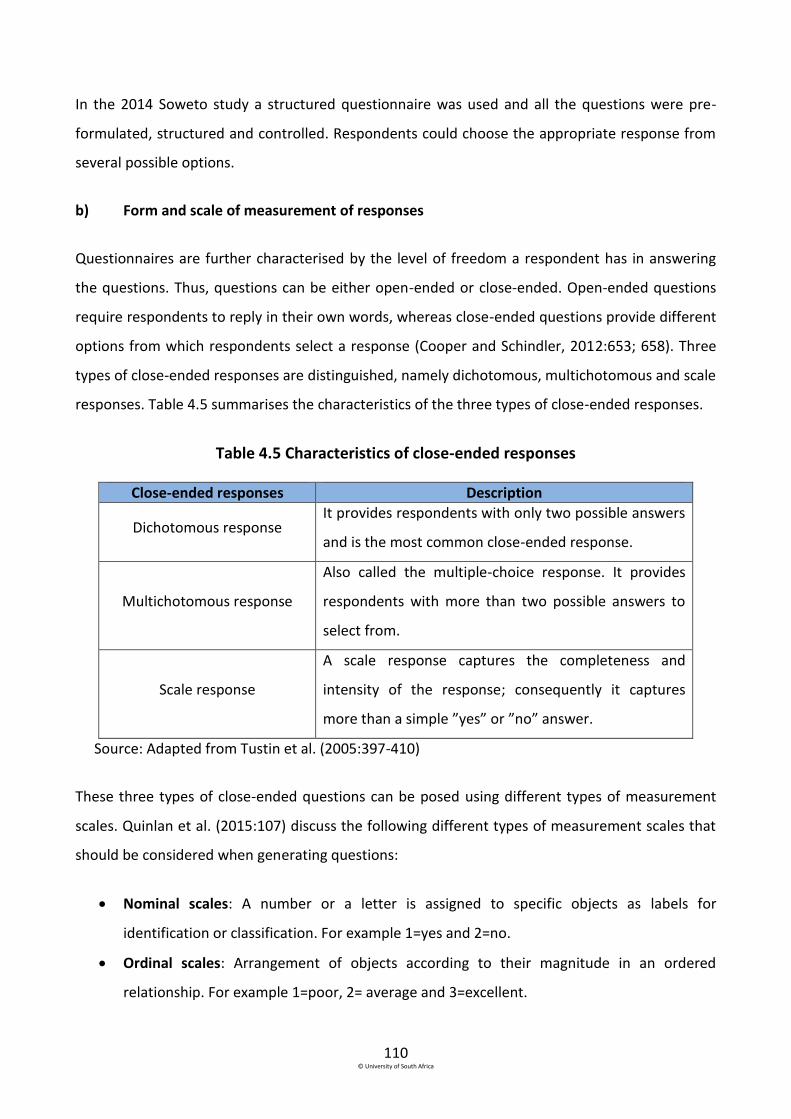
110 © University of South Africa
In the 2014 Soweto study a structured questionnaire was used and all the questions were pre-
formulated, structured and controlled. Respondents could choose the appropriate response from
several possible options.
b) Form and scale of measurement of responses
Questionnaires are further characterised by the level of freedom a respondent has in answering
the questions. Thus, questions can be either open-ended or close-ended. Open-ended questions
require respondents to reply in their own words, whereas close-ended questions provide different
options from which respondents select a response (Cooper and Schindler, 2012:653; 658). Three
types of close-ended responses are distinguished, namely dichotomous, multichotomous and scale
responses. Table 4.5 summarises the characteristics of the three types of close-ended responses.
Table 4.5 Characteristics of close-ended responses
Close-ended responses Description
Dichotomous response It provides respondents with only two possible answers
and is the most common close-ended response.
Multichotomous response
Also called the multiple-choice response. It provides
respondents with more than two possible answers to
select from.
Scale response
A scale response captures the completeness and
intensity of the response; consequently it captures
more than a simple ”yes” or ”no” answer.
Source: Adapted from Tustin et al. (2005:397-410)
These three types of close-ended questions can be posed using different types of measurement
scales. Quinlan et al. (2015:107) discuss the following different types of measurement scales that
should be considered when generating questions:
Nominal scales: A number or a letter is assigned to specific objects as labels for
identification or classification. For example 1=yes and 2=no.
Ordinal scales: Arrangement of objects according to their magnitude in an ordered
relationship. For example 1=poor, 2= average and 3=excellent.

111 © University of South Africa
Interval scales: Similar to ordinal scales, but the difference between the scale values can
be interpreted more meaningfully. In interval scales, zero does not mean a specific
characteristic is absent. For example in temperatures, zero does not mean that there is no
temperature.
Ratio scales: Similar to interval scales, but the ratios of numbers can be interpreted more
meaningfully. In ratio scales, zero means that the specific characteristic is absent. For
example with regard to annual income, zero means that there is no income.
To conclude this section, the table below summarises the form and scale of measurement for each
of the supply chain management questions, the questions related to survival, as well as the
biographical questions that were included in the 2014 Soweto study questionnaire.
Table 4.6 Form and scale of measurement for the supply chain management, sustainability and biographical questions in the 2014 Soweto study
Question number in the questionnaire
Type of close-ended question
Scale of measurement
D1 Scale Ordinal scale
D2 Scale Ordinal scale
D3 Dichotomous Nominal scale
E2 Scale Ordinal scale
E3 (a-h; j; k) Scale Ordinal scale
E6 (a; c) Scale Ordinal scale
E11 (a; c; j; k; m) Scale Ordinal scale
B1 Scale Nominal scale
F2 Scale Nominal scale
Source: Compiled by researcher
Before finalising the questionnaire, it was evaluated and approved by all the researchers involved,
as well as a statistician. The next step in the research process concerns the planning for the
collection, coding and capturing of data.
112 © University of South Africa
4.3.6 Collecting, coding and capturing of data
Collecting, coding and capturing of data are part of the sixth step in the research process.
Independent research consultants who specialise in both qualitative and quantitative surveys were
contracted to collect data for this study. The researcher and staff from the BMR undertook the
coding and capturing of the data.
After designing the questionnaire, the researcher held a work session with the independent
research consultants to explain the rationale for each question. This was to ensure that the
consultants could explain the rationale behind each question to the five fieldworkers and that the
fieldworkers would understand exactly what information each question was designed to yield.
After the completion of the fieldwork the independent research consultants presented a
fieldworkers’ report that contained the following important information:
Fieldworkers were trained with regard to each question. The fieldworkers were able to
explain every question in order to gather the necessary data.
Three hundred and twenty-five (325) formal independent small businesses that formed
part of the 2012 Soweto study had either closed-down or relocated. The researcher
instructed the fieldworkers to replace the small businesses that had closed-down with
other small businesses that complied with the criteria used for the 2012 Soweto study
(refer to section 4.3.5.1).
The fieldwork was done in June/July 2014 over a 7-week period.
The most prevalent problems that fieldworkers encountered were the absence of a
manager or owner at the business and the unwillingness of managers or owners to
participate. If the owner or manager was absent the fieldworker returned to the business
when he or she was available.
In the next step of the research process the analyses of the data are discussed.
4.3.7 Analysis of data
Cooper and Schindler (2014:655) explain that data analysis is a process that facilitates
understanding. Data analysis involves the reduction of the collected data into a manageable size in
order to develop summaries, identify patterns and apply statistical techniques. Before any

113 © University of South Africa
analyses were done in this study, the data had to be filtered to include only formal independent
small businesses in the retail sector as the focus of this study is on small businesses operating
within the retail sector. The 650 formal independent small businesses were divided into different
industries that operate in the different categories identified in the 2014 Standard Industrial
Classification (SIC).
Five hundred and fifty-six (556) formal independent small retail businesses were identified. As the
industry in which the respondents operate, influences customer demand, supply uncertainties,
customer buying behaviour, and ultimately the orientation of the supply chain strategy (refer to
section 2.4), the 556 retail respondents were divided into their different industry groups. Table 4.7
displays the number of respondents in each industry group.
Table 4.7 Classification of respondents in the 2014 Soweto study
Code SIC Industry group description Frequency
04 Retail Grocery 209
05 Retail Hardware 42
07 Retail General Store 88
08 Retail Service 142
09 Eating and Drinking Places 39
10 Sale, maintain and repair of vehicles and retail auto (hereafter referred to as retail auto)
36
Total: 556 Source: Compiled by the researcher from survey results
Both descriptive and inferential analyses were done on the data. Descriptive statistics are used to
describe the characteristics of the distribution of data, whereas inferential statistics relate the
data to the hypotheses and furthermore generalise the data to a larger population (Van Zyl,
2014:161).
4.3.7.1 Descriptive statistical analyses
A descriptive analysis is performed to obtain an accurate first impression of the gathered data
(Van Zyl, 2014:162). Zikmund et al. (2013:484) define descriptive analyses as the basic
transformation of research data that describe the most important characteristics of the data. This
includes the distribution of scores, comparing the distribution of scores and measuring the central
tendency (Van Zyl, 2014:162-164). These characteristics can be reported on by using different

114 © University of South Africa
types of tabular and graphical illustrations, as well as by numerical descriptive statistics that
include means and averages (Williams, Sweeney & Anderson, 2006:12-13). In this study the data
was descriptively analysed (see chapter 5), using frequency distributions. In the next section
inferential statistical analysis is discussed.
4.3.7.2 Inferential statistical analyses
Inferential statistics are used to infer a finding about the population from which the sample was
drawn, based on the characteristics of the sample (Van Zyl, 2014:177). Inferential analyses were
done on the data gathered on all three logistical supply chain drivers to determine whether the
industry in which the respondents operate, influences their responses. When conducting
inferential statistical analyses, the corresponding p-value for each test should be considered. The
p-value reports the extent to which the test statistics disagree with the null hypotheses (Williams
et al., 2006:359). Cooper and Schindler (2011:462) explain that “the p-value is the probability of
observing a sample value as extreme as, or more extreme than, the value actually observed, given
that the null hypotheses is true.” The calculated p-value is compared to the level of significance
and based on this comparison, the null hypotheses is accepted or rejected. The significance level
of a test is defined as the probability of making a decision to reject the null hypothesis, when the
null hypothesis is actually true (a decision known as a Type 1 error).
In this study the chosen level of significance was 0.05. Therefore, for a statistical test to be
deemed statistically significant, the p-value had to be lower or equal to 0.05 (p ≤ 0.05). In this
study three inferential statistical tests were conducted namely, the Kruskal-Wallis test, the
Pearson Chi-Square test and binary logistic regression. Each test is explained in more detail below.
a) The Kruskal-Wallis Test
The Kruskal-Wallis test is a one-way analysis of variances by rank test. The Kruskal-Wallis test is a
nonparametric test, which is used to compare the medians of three or more independent
variables (Cooper and Schindler, 2014:617). The Kruskal-Wallis test was used to determine
whether there is a statistical significant difference between the six industries with regard to the
responses relating to the questions on the three logistical supply chain drivers. The nonparametric
test was used because the data being measured was on an ordinal scale. If the p-value of the
115 © University of South Africa
Kruskal-Wallis test was higher than 0.05 (p ˃ 0.05), no statistically significant difference existes at
the 5% level, between the different industry groups (refer to table 4.6) with regard to the specific
question; therefore, the industry group in which the respondents operate do not influence their
responses. On the other hand, if the p-value was lower or equal to 0.05 (p ≤ 0.05), a statistically
significant difference between the six industry groups, with regard to the responses relating to the
specific question, exists. To further investigate the differences between the six industry groups
with regard to the specific question (where a statistical significant difference exists), the mean
ranks generated by the Kruskal-Wallis test were considered. The mean ranks are described as the
sum of the ranks, assigned in ascending order to all observations, for each specific subgroup,
divided by the number of observations for each subgroup/category. A mean rank does not indicate
a fixed point on a scale, but only shows a tendency to the left or right anchor points of a scale.
Based on the relative position of the mean rank, it was construed that the industry with the
highest mean rank shows a higher frequency or level of importance (on the scale of either never,
sometimes and always or on the scale of unimportant to very important) compared to other
industry groups.
b) The Pearson Chi-Square Test
The Pearson Chi-Square test checks for a significant difference between the observed distribution
of data in the categories and the expected distribution, based on the null hypotheses (Cooper and
Schindler, 2011:469). The Pearson Chi-Square test was used to determine whether there is an
association between the six industry groups (see table 4.6) and the responses relating to the
questions regarding the three logistical supply chain drivers. The nonparametric test was used as
the data being measured was on a nominal scale. As with the Kruskal-Wallis test, if the p-value of
the Pearson Chi-Square test was higher than 0.05 (p ˃ 0.05), no statistically significant association
exists at the 5% level among the different industry groups and the specific question; therefore, the
industry group (refer to table 4.6) in which the respondent operates do not influence their
responses. Then again, if the p-value was lower or equal to 0.05 (p ≤ 0.05), a statistically significant
association do exist between the industry groups and the specific question.
116 © University of South Africa
c) Binary logistic regression model
Logistic regression is a statistical method used to determine whether one or more independent
variables can be used to predict a dichotomous dependent variable. Before the binary logistic
regression model could be developed, preparatory principal component analyses were employed
to reduce the data on the three logistical supply chain drivers.
Principal component analysis is a technique that is used to examine patterns of relationships
between selected variables, in order to establish if there is an underlying combination of the
original variables that can summarise the set of variables. Basically, a principal component analysis
is performed in order to create a more manageable number of variables from a larger set (Cooper
and Schindler, 2014:657). The principal component analysis in this study resulted in valid and
reliable factors, as well as independent items, which were then used to develop the two binary
logistic regression models (see chapter 6). Principal component extraction and varimax rotation
were used to determine the factor structure of the questions; where unidimensionality measured
the extent to which the questions (referred to as items – see section 6.2.2) related to a specific
aspect. When conducting principal component analyses, some general guidelines are pertinent - of
which the following relate to this study:
To ensure sampling adequacy, two measures were used to determine whether a principle
component analysis could be conducted on the questions (items), namely the Kaiser-
Meyer-Olkin test and the Bartlett’s test of sphericity. If the Kaiser-Meyer-Olkin value was
higher or equal to 0.5 (p ≥ 0.05), and the Bartlett’s test of sphericity was significant
(p=0.000), a principle component analysis could be conducted on the question.
The number of factors identified by the principal component analysis was identified
through the Eigenvalue criterion of Eigenvalues greater than one.
Once a factor(s) had been identified by the principle component analysis, the internal
consistency of the factor(s) was considered by examining the Cronbach Alpha value of each
factor(s). The Cronbach Alpha value measured how closely related the different questions
(items) within a group were to each other. A value above the exploratory threshold of 0.6
was deemed as satisfactory.
117 © University of South Africa
After the data on the three logistical supply chain drivers were reduced, two binary logistic
regression models were developed. Using regression terminology, the variable that is being
predicted is referred to as the dependent variables and the variables used for the prediction are
referred to as independent variables (Williams et al., 2006:561). When developing a binary logistic
regression model the independent variables can only predict the probability of a binomial
outcome (one of two possible outcomes) for the dependent variable. The following should be
noted when developing a binary logistic regression model:
To determine adequacy of fit, the Hosmer and Lemeshow test is used. The Hosmer and
Lemeshow test uses a null hypothesis to determine whether the fitted model is adequate
(goodness of fit) by providing a p-value between 0 and 1. The hypothesis for the Hosmer
and Lemeshow test can be stated as follows:
H0: There is a goodness of fit of the logistic regression model
H1: There is no goodness of fit of the logistic regression model
If the p-value is higher than 0.05, H0 cannot be rejected and the logistic regression can be
assumed to be adequate. The higher the p-value of the Hosmer and Lemeshow test, the
better the fit of the logistic regression model (Allison, 2014:1).
The overall correct prediction classification of the binary logistic regression model indicates
the accuracy of the prediction regarding the dependent variable of the model. The overall
correct prediction classification is calculated for both possible outcomes of the dependent
variables.
If the Hosmer and Lemeshow test indicates a goodness of fit (H0 is valid), the odds ratios of
the regression model are considered. Independent variables with a p-value lower or equal
to 0.05 (p≤0.05) are statistically significant predictors of the dependent variable of the
regression model and only the odds ratios of these independent variables are considered.
An odds ratio indicates whether the independent variable influences the dependent
variable positively by having an odds ration larger than 1, or negatively by having an odds
ratio lower than 1. The decimals of the odds ratio indicate the percentage of the positive or
negative influence of the independent variable on the dependent variable. To calculate the
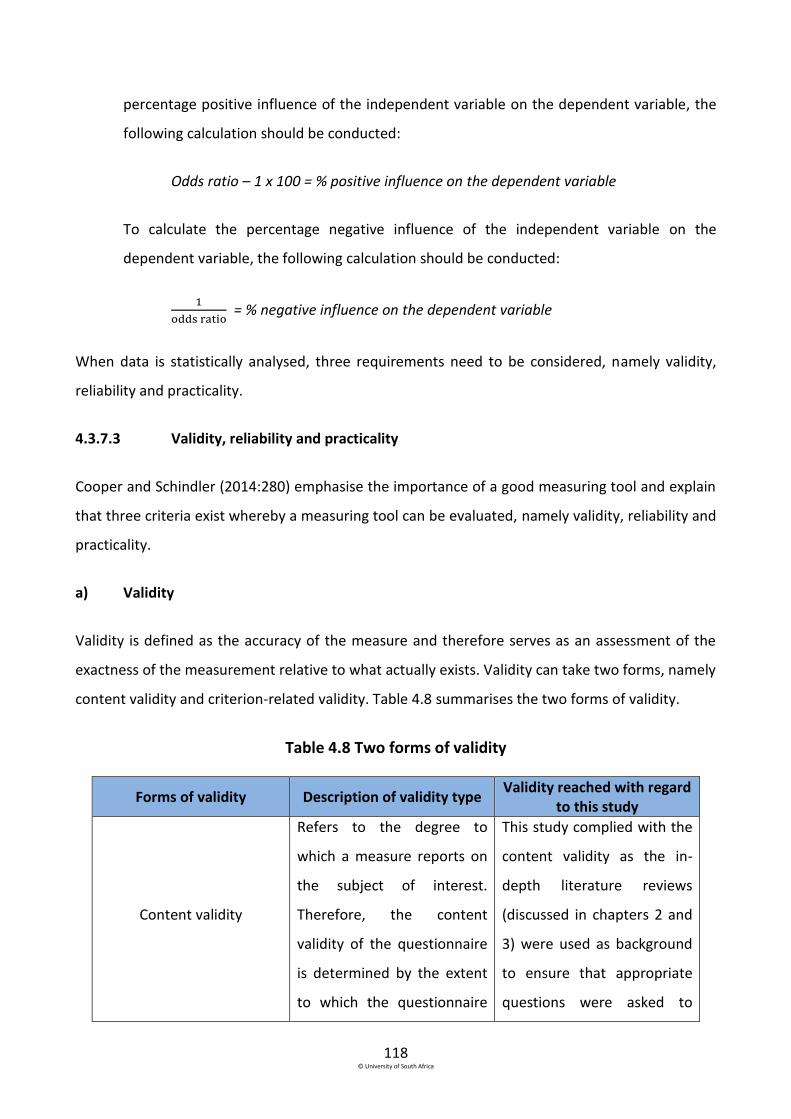
118 © University of South Africa
percentage positive influence of the independent variable on the dependent variable, the
following calculation should be conducted:
Odds ratio – 1 x 100 = % positive influence on the dependent variable
To calculate the percentage negative influence of the independent variable on the
dependent variable, the following calculation should be conducted:
1
odds ratio = % negative influence on the dependent variable
When data is statistically analysed, three requirements need to be considered, namely validity,
reliability and practicality.
4.3.7.3 Validity, reliability and practicality
Cooper and Schindler (2014:280) emphasise the importance of a good measuring tool and explain
that three criteria exist whereby a measuring tool can be evaluated, namely validity, reliability and
practicality.
a) Validity
Validity is defined as the accuracy of the measure and therefore serves as an assessment of the
exactness of the measurement relative to what actually exists. Validity can take two forms, namely
content validity and criterion-related validity. Table 4.8 summarises the two forms of validity.
Table 4.8 Two forms of validity
Forms of validity Description of validity type Validity reached with regard
to this study
Content validity
Refers to the degree to
which a measure reports on
the subject of interest.
Therefore, the content
validity of the questionnaire
is determined by the extent
to which the questionnaire
This study complied with the
content validity as the in-
depth literature reviews
(discussed in chapters 2 and
3) were used as background
to ensure that appropriate
questions were asked to
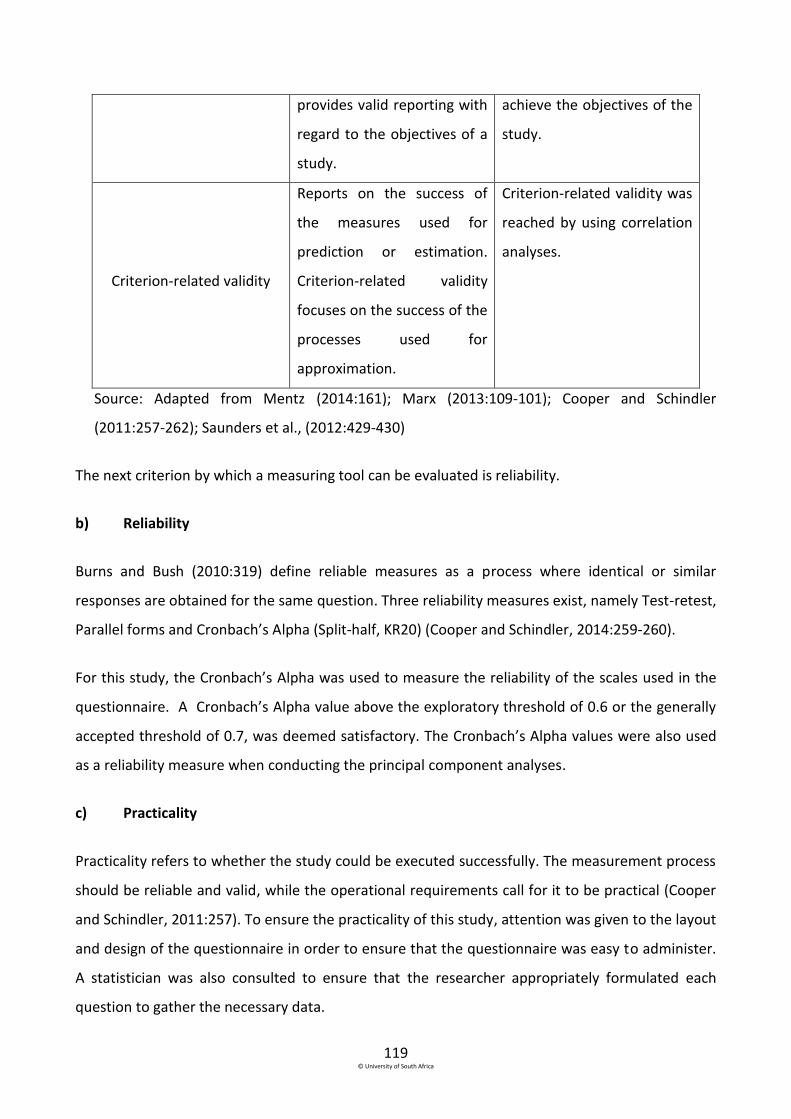
119 © University of South Africa
provides valid reporting with
regard to the objectives of a
study.
achieve the objectives of the
study.
Criterion-related validity
Reports on the success of
the measures used for
prediction or estimation.
Criterion-related validity
focuses on the success of the
processes used for
approximation.
Criterion-related validity was
reached by using correlation
analyses.
Source: Adapted from Mentz (2014:161); Marx (2013:109-101); Cooper and Schindler
(2011:257-262); Saunders et al., (2012:429-430)
The next criterion by which a measuring tool can be evaluated is reliability.
b) Reliability
Burns and Bush (2010:319) define reliable measures as a process where identical or similar
responses are obtained for the same question. Three reliability measures exist, namely Test-retest,
Parallel forms and Cronbach’s Alpha (Split-half, KR20) (Cooper and Schindler, 2014:259-260).
For this study, the Cronbach’s Alpha was used to measure the reliability of the scales used in the
questionnaire. A Cronbach’s Alpha value above the exploratory threshold of 0.6 or the generally
accepted threshold of 0.7, was deemed satisfactory. The Cronbach’s Alpha values were also used
as a reliability measure when conducting the principal component analyses.
c) Practicality
Practicality refers to whether the study could be executed successfully. The measurement process
should be reliable and valid, while the operational requirements call for it to be practical (Cooper
and Schindler, 2011:257). To ensure the practicality of this study, attention was given to the layout
and design of the questionnaire in order to ensure that the questionnaire was easy to administer.
A statistician was also consulted to ensure that the researcher appropriately formulated each
question to gather the necessary data.

120 © University of South Africa
4.3.8 Presentation of research findings and future research
After analysing the data, the next step in the research process is to present the research findings
The research findings for this study are reported in chapters 5 and 6. Since this study was
conducted on formal independent small retail business operating within the boundaries of the
township Soweto, it should be noted that the findings cannot be generalised to small businesses in
other townships. In Chapter 7, issues for future research will be identified.
4.3.9 Ethical considerations
Throughout the entire study all ethical standards and principles, as set out by the UNISA Ethical
Policy, were met. This study was conducted according to the four moral principles of ethics that
UNISA recognises as the basis of any research, namely:
research should respect the autonomy, rights and dignity of research participants,
research should make a positive contribution toward the welfare of people,
research should not cause harm to the research participant(s) in particular or to people in
general, and
the benefits and risks of research should be fairly distributed among people (UNISA,
2013:9).
The UNISA Ethical Policy requires that certain general ethical principles are met before, during and
after the research. The way in which this study adhered to the general ethical principles are
summarised in table 4.9.
Table 4.9 General ethics principles considered in this study
General ethics principle Adherence to the general ethical principle during this
study
Essentiality and relevance An extensive literature review was conducted to
establish whether there was a need for the research and
whether the research was essential in the pursuit of
knowledge. According to the literature, a need for
developing and strengthening supply chains within
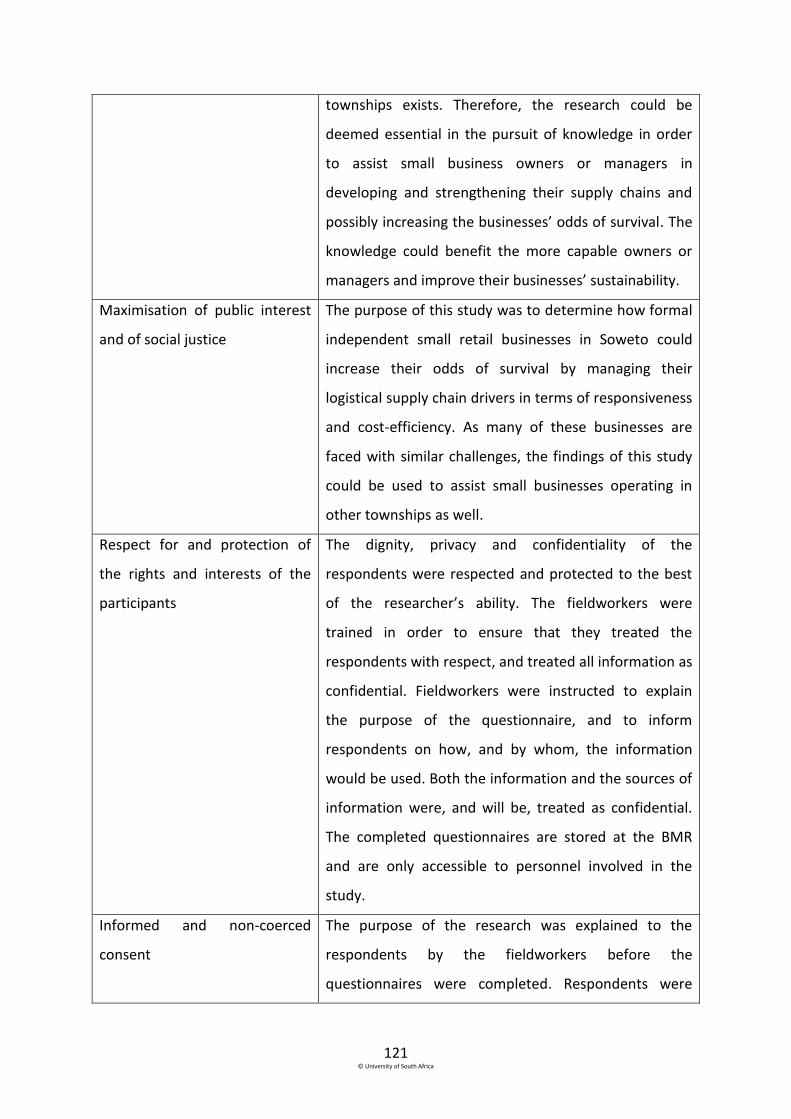
121 © University of South Africa
townships exists. Therefore, the research could be
deemed essential in the pursuit of knowledge in order
to assist small business owners or managers in
developing and strengthening their supply chains and
possibly increasing the businesses’ odds of survival. The
knowledge could benefit the more capable owners or
managers and improve their businesses’ sustainability.
Maximisation of public interest
and of social justice
The purpose of this study was to determine how formal
independent small retail businesses in Soweto could
increase their odds of survival by managing their
logistical supply chain drivers in terms of responsiveness
and cost-efficiency. As many of these businesses are
faced with similar challenges, the findings of this study
could be used to assist small businesses operating in
other townships as well.
Respect for and protection of
the rights and interests of the
participants
The dignity, privacy and confidentiality of the
respondents were respected and protected to the best
of the researcher’s ability. The fieldworkers were
trained in order to ensure that they treated the
respondents with respect, and treated all information as
confidential. Fieldworkers were instructed to explain
the purpose of the questionnaire, and to inform
respondents on how, and by whom, the information
would be used. Both the information and the sources of
information were, and will be, treated as confidential.
The completed questionnaires are stored at the BMR
and are only accessible to personnel involved in the
study.
Informed and non-coerced
consent
The purpose of the research was explained to the
respondents by the fieldworkers before the
questionnaires were completed. Respondents were

122 © University of South Africa
informed that participation was voluntary and that they
may halt the process at any stage, if they were
uncomfortable about the questions. Respondents
signed the questionnaires; indicating that they
understood the aim and purpose of the study; what
participation involved; and that they could withdraw at
any time. By signing the questionnaire respondents also
agreed that they consented freely and voluntarily to
participate in the study.
Integrity, transparency and
accountability
The researcher used professional fieldworkers to gather
the primary data to ensure that the research was
conducted honestly, fairly and transparently.
Source: Compiled by the researcher
The study was reviewed by the Ethical Committee of the BMR and ethical clearance was granted.
(see appendix B).
4.4 Conclusion
This chapter began by defining research and determining the need for this particular project. After
taking into consideration time constraints, available data and the nature of the benefits, as
opposed to the costs of the project, it was established that research was necessary to determine
how formal independent small retail businesses in Soweto can manage the three supply chain
drivers, in terms of responsiveness and cost-efficiency, in order to survive. The research process
that was followed to conduct the research was identified and consisted of nine steps. Each step of
the research process was addressed in theory, as well as in how it applied to this study. Table 4.10
provides a summary of the research methodology discussed in this chapter.
Table 4.10 Summary of the research methodology for this study
Empirical research aspect Description of empirical research aspect in this study
Survey area Defined business areas in Soweto.
Survey population Formal independent small businesses located within

123 © University of South Africa
business areas/stands across Soweto. These include
businesses situated in shopping malls, large shopping
areas (outside shopping malls), smaller shopping areas,
stand-alone businesses and industrial areas with 2-5, 6-10
and 10-plus surrounding businesses.
Sample frame A list of 650 formal independent small businesses
operating within the boundaries of Soweto compiled in
2012 by the BMR.
Sample size 650 formal independent small businesses.
Sampling method Probability sampling using a stratified sampling method.
Research instrument Structured interviewer-completed questionnaires
consisting of close-ended questions, using nominal and
ordinal measurement scales (refer to appendix A).
Collecting, coding and
capturing of data
The fieldwork was coordinated by the BMR and the data
was gathered within 7 weeks (July-August) by five
fieldworkers. Data was captured on Excel and SPSS
(version 23).
Analysis of data Both descriptive (frequency distributions) and inferential
analyses (Kruskall-Wallis test, Pearson Chi-Square test
and binary logistic regression) were conducted on the
data.
Ethical considerations The fieldwork was conducted within the directives of the
ethical policy of the University of South Africa (refer to
appendix B for the ethical clearance certificate).
Source: Compiled by the researcher

124 © University of South Africa
Chapter 5
Empirical findings on the logistical supply chain drivers
5.1 Introduction
In this chapter the empirical analyses related to the three logistical supply chain drivers are
discussed by presenting both descriptive and inferential statistical findings. The findings are
derived from data gathered from 556 formal independent small retail businesses which will be
referred to as “the respondents” or “small retailers” in the subsequent discussions. The inferential
analyses were performed by either the Kruskal-Wallis test or the Pearson Chi-Square test.
Throughout the chapter, twenty four empirical findings are reported on, and indicated by using
the abbreviation EF.
5.2 Notes regarding the statistical analyses of the data
Before discussing the statistical analyses the following should be noted:
Different scales of measurement: When discussing the descriptive findings (in sections
5.3.1, 5.4.1 and 5.5.1), the findings on a specific aspect related to facilities, inventory or
transportation are grouped together, despite the data coming from different questions in
the questionnaire. Since the scales of measurement vary for different questions due to
the type and detail of information required, the frequency distribution of the responses is
presented in separate tables. When asked to rate the importance of a question, the scale
ranged from very unimportant to very important, and when asked about frequency (how
often), a scale of never, sometimes and always, was used.
Inferential analyses: As discussed in section 4.3.7.2, inferential analyses were done on the
data regarding the three logistical drivers in order to determine whether the industry in
which the respondents operate, influences their responses. If a statistically significant
difference or association (p ≤ 0.05) was found between the six industry groups with regard
to the responses relating to a specific question, only the industry with the highest mean
rank was considered. If no statistically significant difference exists at the 5% level between
the different industry groups with regard to the specific question, the industry group in

125 © University of South Africa
which the respondents operate do not influence their responses, therefore the mean
ranks were not discussed. The mean ranks of the questions where no statistically
significant difference exists are available in appendix C.
Stock versus inventory: The concepts of stock and inventory are viewed as synonymous
in this study. The word “stock” was used in the questionnaire and interviews as the
respondents are probably more familiar with the word. When reporting on the results the
word “inventory” is used in order to conform to the academic literature.
5.3 Empirical findings related to facilities as a logistical supply chain driver
In the questionnaire, sections E11 and E3 contained questions on how small retailers manage their
facilities (see appendix A). This section (5.3) is structured to first discuss the descriptive analyses of
the data regarding facilities, followed by the inferential analyses of the data.
5.3.1 Descriptive analyses of the data pertaining to facilities
The descriptive analyses of the data regarding facilities are structured under five headings: the
proximity of the business to customers; the proximity of the business to public transport;
providing customers with a fast checkout; the capacity of the facility; and accessibility of excess
inventory. The frequency distribution of the importance rating regarding the first three issues
(proximity to customers and public transport, and providing a fast checkout) are provided in table
5.1 and is followed by a discussion. Thereafter, the frequency distribution (provided in table 5.2) of
the agreement of the respondents (in terms of how often/frequently) regarding the last two issues
(capacity of the facility and accessibility of excess inventory) is discussed.

126 © University of South Africa
Table 5.1 Respondents’ importance rating of the different aspects relating to facilities
Facility aspects Percentages
Very unimportant Very important
Near to customers 0.9 1.3 2.5 9.4 84.9
Near to public transport 0.7 0.5 2.3 10.1 85.3
Fast checkout 1.3 2.5 6.5 18.9 70
Source: Compiled by the researcher from survey results
5.3.1.1 Proximity of the business to customers
The respondents were asked to rate the importance (ranging from very unimportant to very
important) of being located near to customers. From table 5.1 it follows that the majority (84.9%)
of respondents indicated that they view it as very important that their facility are located near to
their customers. In 2014, researchers for the World Bank (2014:153, 163) found that owners and
managers know that being located close to customers holds an advantage. They also found that
township residents generally purchase from retailers that are located within their neighbourhood
and usually walk to a retailer’s store (World Bank, 2014:15). The high importance rating of
respondents with regard to their facility being located near to customers in this study
corroborates these findings. Therefore, the decision to be located near to customers indicates the
retailers’ focus on responsiveness.EF1
5.3.1.2 Proximity of the business to public transport
In another question the respondents were asked to rate the importance of being located near to
public transport. Once again, a similarly large majority (85.3%) of the respondents indicated that it
is very important to be located near to public transport (see table 5.1). A possible reason for the
high rating can be that retailers know that customers find it convenient to purchase products or
use services at a taxi rank or bus stop on their way home. This is in line with the previous finding in
section 5.3.1.1, that the majority of respondents view it as very important to be located near to
customers. The decision to be located near to public transport is once again based on
responsiveness. EF1

127 © University of South Africa
5.3.1.3 Providing customers with fast checkout
In terms of facilities, the respondents were asked to indicate how important they viewed it to
provide customers with a fast checkout at the retail facility. A slightly lower majority (70%)
indicated that it is very important to provide customers with a fast checkout (see table 5.1). Such a
response implies that respondents are focused on responsiveness by assisting customers at their
facility as quickly as possible.EF1
5.3.1.4 Capacity of the facility
Table 5.2 provides the frequency distribution of the respondents’ level of agreement with regard
to how frequently the statements regarding the capacity of the facility and the accessibility of
excess inventory, applied (see sections 5.3.1.4 and 5.3.1.5).
Table 5.2 Respondents’ rating on facility statements
Facility statements Rate
Never Sometimes Always
I have the capacity to store excess stock in
my store. 32.4 16.7 48.2
I can access my excess stock quickly and
easily. 29 16 52.7
Source: Compiled by the researcher from survey results
Respondents had to indicate whether they (never, sometimes or always) had the capacity to store
excess inventory in their stores. 32.4% of respondents (see table 5.2), indicated that they never
have the capacity to store excess inventory in their stores. A possible explanation for the difficulty
in having capacity to store excess inventory in-store is confirmed by the overall lack of retail space
within townships (World Bank, 2014:46). By not having the capacity to store excess inventory in
their stores, retailers are at risk of not having products immediately available to customers and
this can lead to a decrease in retailers’ level of responsiveness. More than half (64.9%) of the
respondents indicated that they sometimes and always have the capacity to store excess
inventory in their stores (see table 5.2). The respondents who have the capacity to store excess
128 © University of South Africa
inventory in their stores, will most likely experience an increase in their level of responsiveness, as
inventory will be readily available when customer demand arises. Therefore, the decision to have
capacity to store excess inventory in their stores, is based on responsiveness.EF1
5.3.1.5 Accessibility of excess inventory
When the respondents were asked whether they could (never, sometimes or always) access their
excess inventory quickly and easily, more than half (68.7%) indicated that they can sometimes and
always access their excess inventory quickly and easily (see table 5.2). Considering the previous
finding in section 5.3.1.4 where 64.9% of the respondents indicated that they sometimes and
always have capacity to store excess inventory in their stores, it suggests that the respondents do
not only see the benefits of having the capacity to store excess inventory in their stores, but are
also aware of the benefits of having quick and easy access to the excess inventory. Having a facility
where excess inventory is quickly and easily accessible indicates the retailers’ emphasis on
responsiveness.EF1
To summarise, the descriptive analyses of the data on facilities regarding the trade-off between
responsiveness and cost-efficiency, confirm that formal independent small retail businesses
operating in Soweto acknowledge the importance of, and are focused on, being responsive when
managing facilities as a logistical supply chain driver. EF1
The next step was to perform inferential analyses to determine whether a difference exists
between the retailers from the six industry groups with regard to the responses to the questions
concerning facilities.
5.3.2 Inferential analyses of the data pertaining to facilities
When analysing the selected questions on facilities in sections E11 and E3, the Kruskal-Wallis one-
way analysis of variance by rank test was used to analyse the ordinal data obtained (see section
4.3.7.2). Two hypotheses were formulated and are discussed in sections 5.3.2.1 and 5.3.2.2.

129 © University of South Africa
5.3.2.1 Hypothesis 1
The first hypothesis was formulated to determine if a difference exists between the retailers from
the six industry groups with regard to their importance rating of their location near to customers;
near to public transport; and providing customers with a fast checkout. The hypothesis was
formulated as follows:
H1: There is a difference between the industry groups with regard to their importance rating (very
unimportant to very important) concerning whether they are
H1a near to customers
H1b near to public transport
H1c providing a fast checkout.
The results of the Kruskal-Wallis test in terms of the difference between the industry groups with
regard to the importance rating of the facility aspects (hypothesis 1), are shown in table 5.3.
Table 5.3 Kruskal-Wallis test results on hypothesis 1
Facility aspects Chi-Square Df Asymptotic
significance
Near to customers 3.363 5 .644
Near to public transport 8.196 5 .146
Fast checkout 6.901 5 .228
Source: Compiled by the researcher from survey results
The results show that no statistically significant difference exists at the 5% level of significance (all
p-values ˃ 0.05) among the different industry groups with regard to their importance ratings of the
facility aspects. The mean ranks are fairly similar (see section 5.2) and thus show a similar rating of
the importance by the different industry groups to being located near to customers, being located
near to public transport and providing customers with a fast checkout.EF2
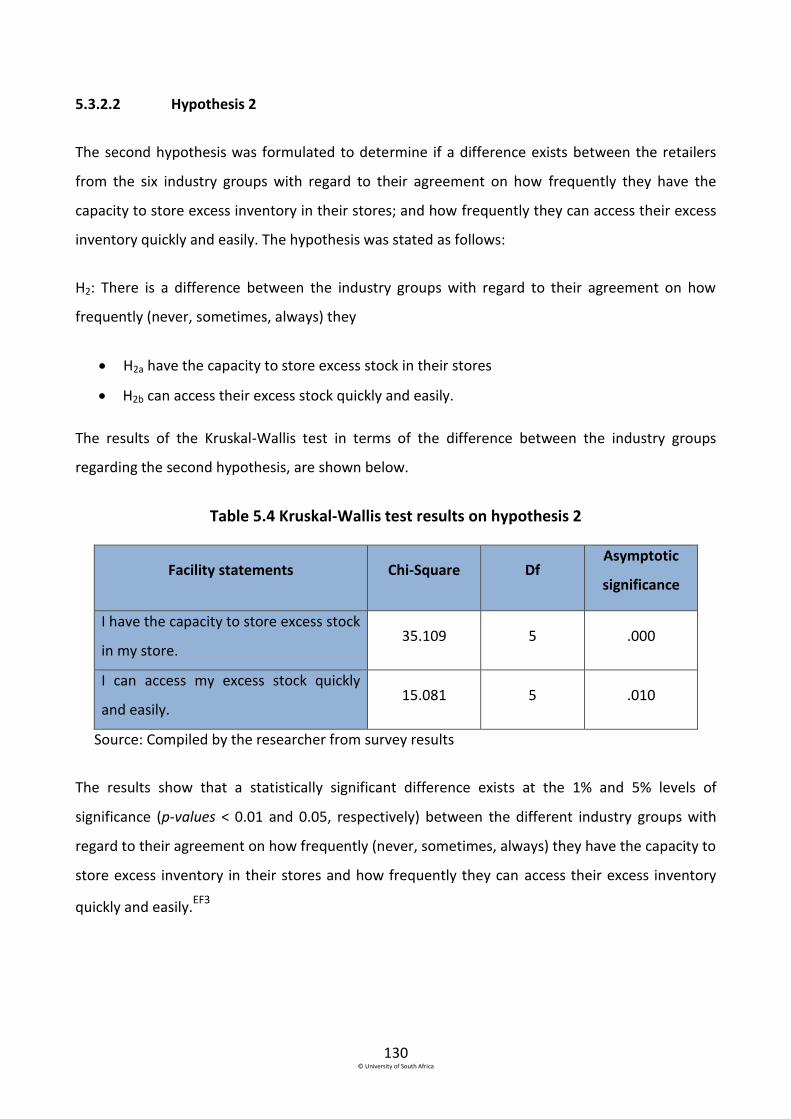
130 © University of South Africa
5.3.2.2 Hypothesis 2
The second hypothesis was formulated to determine if a difference exists between the retailers
from the six industry groups with regard to their agreement on how frequently they have the
capacity to store excess inventory in their stores; and how frequently they can access their excess
inventory quickly and easily. The hypothesis was stated as follows:
H2: There is a difference between the industry groups with regard to their agreement on how
frequently (never, sometimes, always) they
H2a have the capacity to store excess stock in their stores
H2b can access their excess stock quickly and easily.
The results of the Kruskal-Wallis test in terms of the difference between the industry groups
regarding the second hypothesis, are shown below.
Table 5.4 Kruskal-Wallis test results on hypothesis 2
Facility statements Chi-Square Df Asymptotic
significance
I have the capacity to store excess stock
in my store. 35.109 5 .000
I can access my excess stock quickly
and easily. 15.081 5 .010
Source: Compiled by the researcher from survey results
The results show that a statistically significant difference exists at the 1% and 5% levels of
significance (p-values < 0.01 and 0.05, respectively) between the different industry groups with
regard to their agreement on how frequently (never, sometimes, always) they have the capacity to
store excess inventory in their stores and how frequently they can access their excess inventory
quickly and easily.EF3

131 © University of South Africa
To further investigate the differences between the six industry groups and their capacity to store
excess inventory in their stores and also access their excess inventory quickly and easily, the mean
ranks (see section 5.2) as provided in table 5.5, were considered.
Table 5.5 Mean ranks for hypothesis 2
Industries
Mean ranks
I have the
capacity to
store excess
stock in my
store
I can access
my excess
stock quickly
and easily
Retail Grocery 283.72 280.06
Retail Hardware 299.37 301.12
Retail General Store 316.55 304.07
Retail Service 216.81 237.34
Eating and Drinking Places 291.45 278.67
Retail Auto 226.47 231.24
Source: Compiled by the researcher from survey results
A higher mean rank indicates that an industry group tends to have capacity to store their excess
inventory in their stores more frequently, and access their excess inventory quickly and easily
more frequently, than the other industry groups. Table 5.5 shows that retail general stores tend to
have the capacity to store excess inventory in stores more frequently than the other industry
groups, with a mean rank of 316.55. Retail general stores can also access their excess inventory
quickly and easily more frequently than the other industry groups (mean rank of 304.7). A possible
reason can be that retail general stores, by their very nature (selling a variety of products), may
require additional storage space. The results regarding the industry groups indicate that retail
general stores place more emphasis on responsiveness than the other industries. EF4

132 © University of South Africa
5.4 Empirical findings related to inventory as a logistical supply chain driver
In sections D2, E2, E3, E6 and E11 of the questionnaire, respondents were asked to indicate the
type of supplier they purchase inventory from most frequently; their level of agreement with
regard to how frequently an inventory statement applies to them; their importance rating of
certain inventory aspects; and their disagreement or agreement with various inventory
statements. First, the descriptive findings pertaining to inventory will be discussed, followed by
the inferential analyses of the relevant inventory questions.
5.4.1 Descriptive analyses of the data pertaining to inventory
The descriptive analyses of data gathered in sections D2, E2, E3, E6 and E11 are discussed under
two headings, namely the average rate of purchasing inventory and the quantity of inventory
purchased.
5.4.1.1 Average rate of purchasing inventory
The average rate of purchasing inventory was established by examining the frequency
distributions of questions D2, E3 (e) and E2 (see tables 5.6, 5.7 and 5.8).
Table 5.6 Type of supplier from whom respondents purchase inventory
Different types
of suppliers
Percentage of respondents
purchasing from the supplier
Manufacturers 15.7
Wholesalers 62.3
Retailers 15.2
Agents 1.3
NGOs 0.9
Other 4.7
Source: Compiled by the researcher from survey results
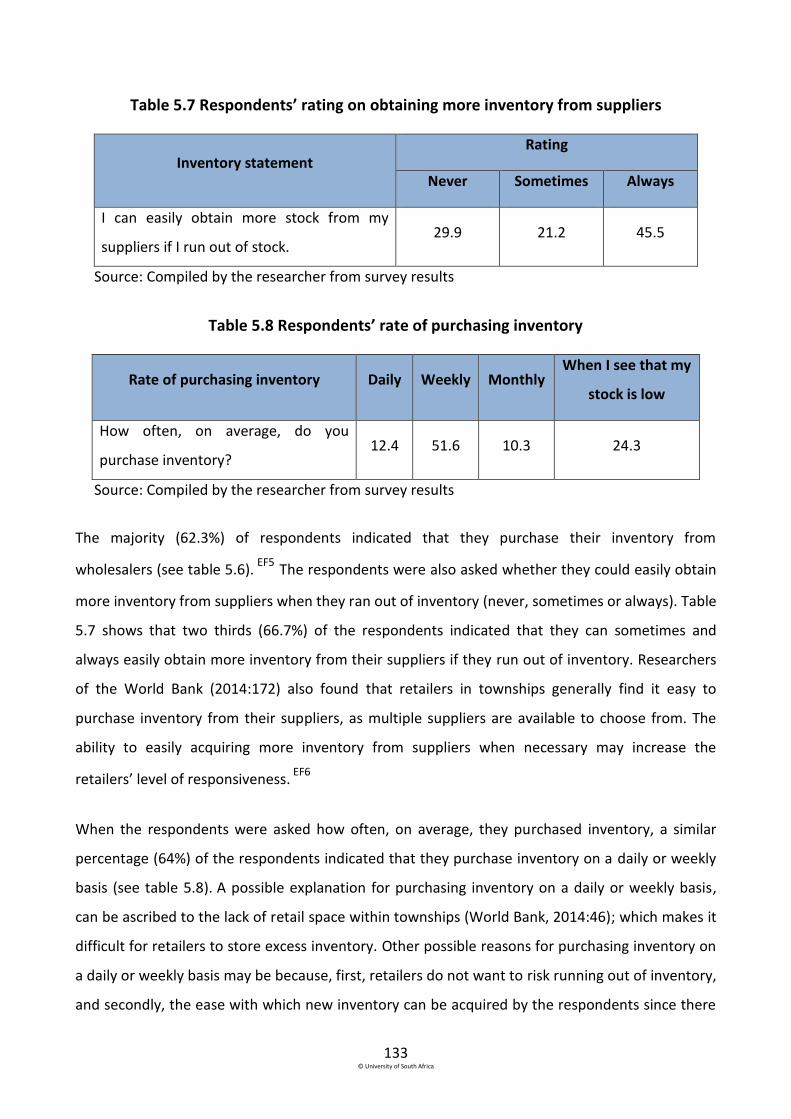
133 © University of South Africa
Table 5.7 Respondents’ rating on obtaining more inventory from suppliers
Inventory statement Rating
Never Sometimes Always
I can easily obtain more stock from my
suppliers if I run out of stock. 29.9 21.2 45.5
Source: Compiled by the researcher from survey results
Table 5.8 Respondents’ rate of purchasing inventory
Rate of purchasing inventory Daily Weekly Monthly When I see that my
stock is low
How often, on average, do you
purchase inventory? 12.4 51.6 10.3 24.3
Source: Compiled by the researcher from survey results
The majority (62.3%) of respondents indicated that they purchase their inventory from
wholesalers (see table 5.6). EF5 The respondents were also asked whether they could easily obtain
more inventory from suppliers when they ran out of inventory (never, sometimes or always). Table
5.7 shows that two thirds (66.7%) of the respondents indicated that they can sometimes and
always easily obtain more inventory from their suppliers if they run out of inventory. Researchers
of the World Bank (2014:172) also found that retailers in townships generally find it easy to
purchase inventory from their suppliers, as multiple suppliers are available to choose from. The
ability to easily acquiring more inventory from suppliers when necessary may increase the
retailers’ level of responsiveness. EF6
When the respondents were asked how often, on average, they purchased inventory, a similar
percentage (64%) of the respondents indicated that they purchase inventory on a daily or weekly
basis (see table 5.8). A possible explanation for purchasing inventory on a daily or weekly basis,
can be ascribed to the lack of retail space within townships (World Bank, 2014:46); which makes it
difficult for retailers to store excess inventory. Other possible reasons for purchasing inventory on
a daily or weekly basis may be because, first, retailers do not want to risk running out of inventory,
and secondly, the ease with which new inventory can be acquired by the respondents since there
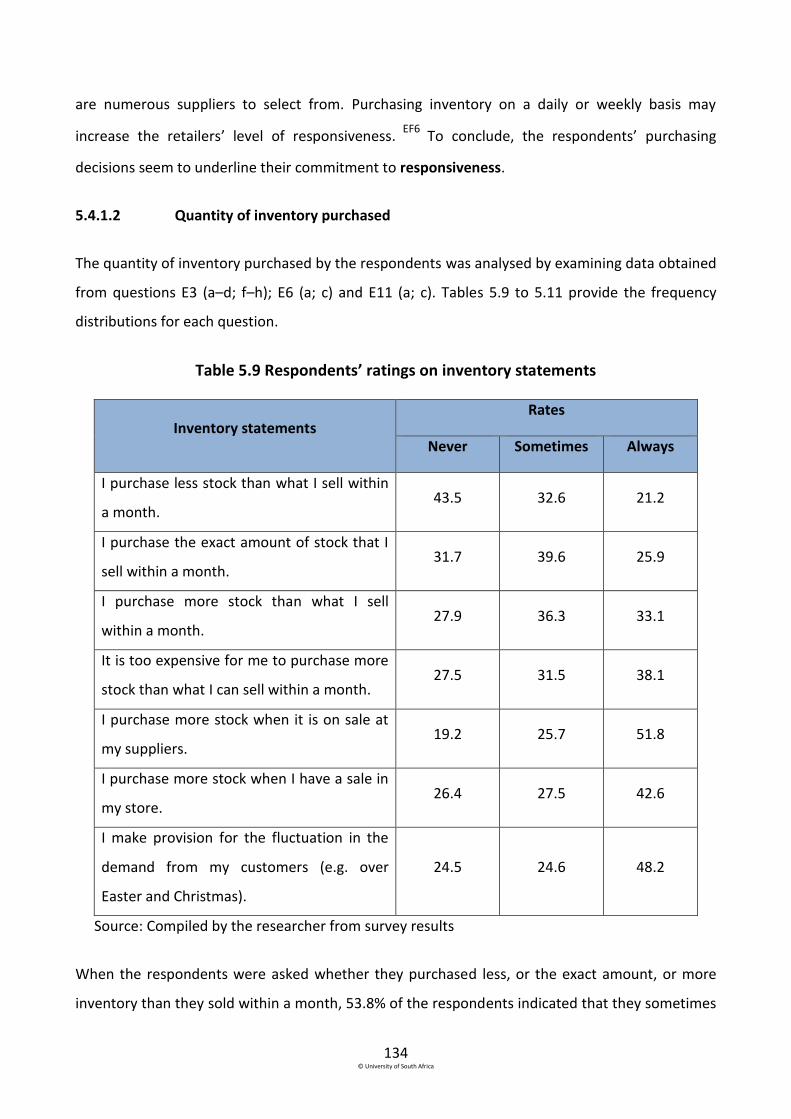
134 © University of South Africa
are numerous suppliers to select from. Purchasing inventory on a daily or weekly basis may
increase the retailers’ level of responsiveness. EF6
To conclude, the respondents’ purchasing
decisions seem to underline their commitment to responsiveness.
5.4.1.2 Quantity of inventory purchased
The quantity of inventory purchased by the respondents was analysed by examining data obtained
from questions E3 (a–d; f–h); E6 (a; c) and E11 (a; c). Tables 5.9 to 5.11 provide the frequency
distributions for each question.
Table 5.9 Respondents’ ratings on inventory statements
Inventory statements Rates
Never Sometimes Always
I purchase less stock than what I sell within
a month. 43.5 32.6 21.2
I purchase the exact amount of stock that I
sell within a month. 31.7 39.6 25.9
I purchase more stock than what I sell
within a month. 27.9 36.3 33.1
It is too expensive for me to purchase more
stock than what I can sell within a month. 27.5 31.5 38.1
I purchase more stock when it is on sale at
my suppliers. 19.2 25.7 51.8
I purchase more stock when I have a sale in
my store. 26.4 27.5 42.6
I make provision for the fluctuation in the
demand from my customers (e.g. over
Easter and Christmas).
24.5 24.6 48.2
Source: Compiled by the researcher from survey results
When the respondents were asked whether they purchased less, or the exact amount, or more
inventory than they sold within a month, 53.8% of the respondents indicated that they sometimes
135 © University of South Africa
and always purchase less, 65.5% that they sometimes and always purchase the exact amount and
69.4% that they sometimes and always purchase more (see table 5.9).
Poor inventory management can be a possible reason for the just more than half (53.8%) of
respondents who indicated that they sometimes and always purchase less inventory than they can
sell within a month. Purchasing less inventory than they could sell within a month may decrease
the level of responsiveness of the retailers, since they may not have a product when required by
customers. The decisions of the almost two thirds (65.5%) of respondents who indicated that they
sometimes and always purchase the exact amount of inventory than they sell within a month, can
be due to the lack of storage space in townships (World Bank, 2014:207). The decisions of the
retailers (69.4%) who indicated that they sometimes and always purchase more inventory than
they sell within a month, can be due to the retailers purchasing inventory in large quantities, in
order to qualify for free delivery from suppliers (World Bank, 2014:151-153). Such a small business
could increase its level of cost-efficiency, since it would save on transportation costs. However,
owners or managers of small businesses should take into consideration the cost of purchasing
additional inventory (to qualify for the free delivery), as it may exceed the saving on
transportation costs. This can result in the business eventually paying more for the additional
inventory and ultimately decreasing the level of cost-efficiency. EF6
More than two thirds (69.6%) of the respondents indicated that it was sometimes and always too
expensive for them to purchase more inventory than they can sell within a month (see table 5.9).
These responses imply that respondents are aware of the costs involved when purchasing more
inventory than they can sell within a month. EF7 When the respondents were asked whether they
purchased more inventory when it was on sale at their suppliers, more than half (51.8%) of the
respondents indicated that they always purchase more during sales (see table 5.8). Paying less for
inventory will contribute to cost-efficiency and responsiveness as excess inventory is available. EF7
A majority (70.1%) of respondents indicated that they sometimes and always purchase more
inventory when they have a sale in their stores (see table 5.9). Purchasing more inventory when
having a sale, implies that the retailers make provision for the increase in customer demand. EF6
Additionally, 72.8% of respondents indicated that they sometimes or always make provision for
fluctuation in customer demand during special times, such as Easter and Christmas (see table 5.9).
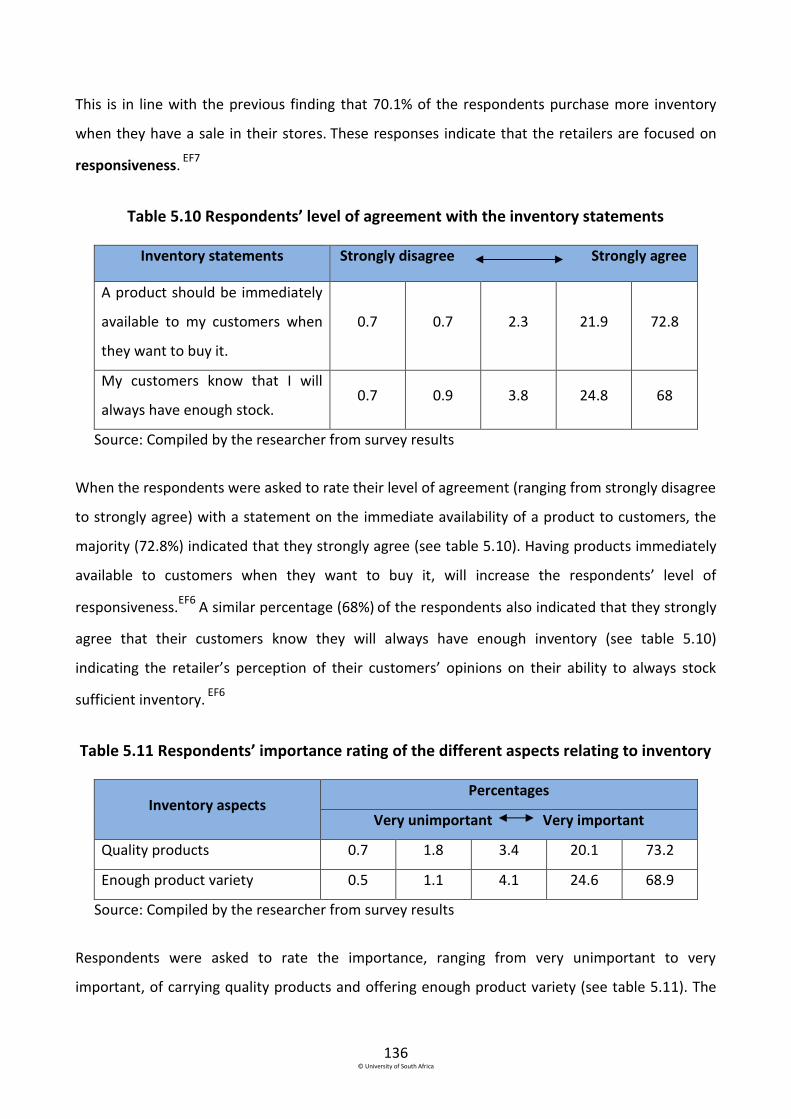
136 © University of South Africa
This is in line with the previous finding that 70.1% of the respondents purchase more inventory
when they have a sale in their stores. These responses indicate that the retailers are focused on
responsiveness. EF7
Table 5.10 Respondents’ level of agreement with the inventory statements
Inventory statements Strongly disagree Strongly agree
A product should be immediately
available to my customers when
they want to buy it.
0.7 0.7 2.3 21.9 72.8
My customers know that I will
always have enough stock. 0.7 0.9 3.8 24.8 68
Source: Compiled by the researcher from survey results
When the respondents were asked to rate their level of agreement (ranging from strongly disagree
to strongly agree) with a statement on the immediate availability of a product to customers, the
majority (72.8%) indicated that they strongly agree (see table 5.10). Having products immediately
available to customers when they want to buy it, will increase the respondents’ level of
responsiveness.EF6
A similar percentage (68%) of the respondents also indicated that they strongly
agree that their customers know they will always have enough inventory (see table 5.10)
indicating the retailer’s perception of their customers’ opinions on their ability to always stock
sufficient inventory. EF6
Table 5.11 Respondents’ importance rating of the different aspects relating to inventory
Inventory aspects Percentages
Very unimportant Very important
Quality products 0.7 1.8 3.4 20.1 73.2
Enough product variety 0.5 1.1 4.1 24.6 68.9
Source: Compiled by the researcher from survey results
Respondents were asked to rate the importance, ranging from very unimportant to very
important, of carrying quality products and offering enough product variety (see table 5.11). The

137 © University of South Africa
majority (73.2%) of respondents rated it very important to carry quality products. According to the
World Bank (2014:10, 268), residents in townships expect the same quality products from small
retailers as from large retail groups, such as Shoprite and Pick n Pay. Quality products are generally
associated with higher prices and will decrease a retailer’s cost-efficiency. EF6 Similarly, 68.8% of
the respondents rated carrying enough product variety as very important. Carrying enough
product variety will also increase the retailer’s responsiveness since customer demand can be met.
EF6 Therefore, the decisions with regard to the quantity of inventory purchased by small retailers
are based on either responsiveness or cost-efficiency, depending on the circumstances of the
individual retailer.
To summarise, the descriptive analyses of the data on inventory, regarding the trade-off between
responsiveness and cost-efficiency, confirm that formal independent small retail businesses
operating in Soweto, seem to focus on responsiveness when managing inventory as a logistical
supply chain driver.
The next step with regard to inventory was to perform inferential analyses on the relevant
responses to determine whether a difference exists between the six industry groups and the
responses on the questions pertaining to inventory.
5.4.2 Inferential analyses of the data pertaining to inventory
The Kruskal-Wallis one-way analysis of variance by ranks test was used to analyse the ordinal data
obtained by the questions in sections E2, E3, E6 and E11 of the questionnaire. Four hypotheses
were formulated and will be discussed in sections 5.4.2.1 to 5.4.2.4.
5.4.2.1 Hypothesis 3
The third hypothesis was formulated in order to determine if a difference exists between the six
industry groups with regard to how often (daily, weekly, monthly, when I see my stock is low), on
average, they purchase inventory. The hypothesis was formulated as follows:
H3: There is a difference between the industry groups with regard to how frequently (daily,
weekly, monthly, when I see my stock is low), on average, they purchase inventory.
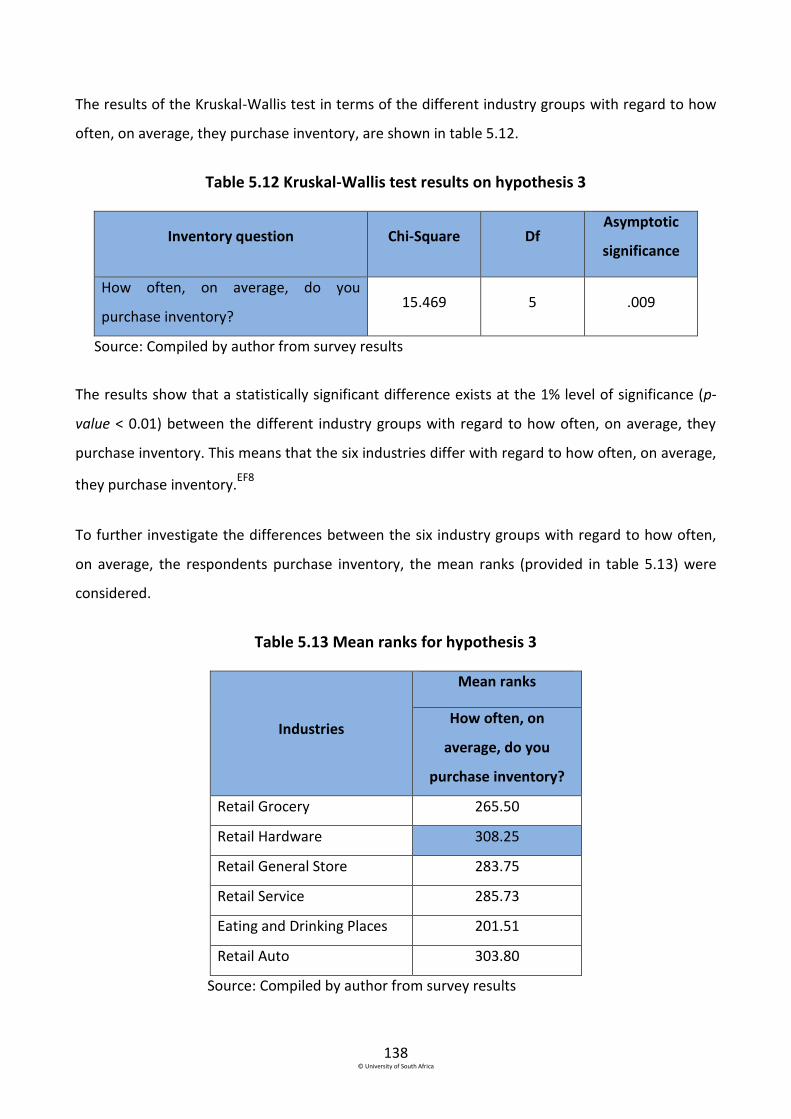
138 © University of South Africa
The results of the Kruskal-Wallis test in terms of the different industry groups with regard to how
often, on average, they purchase inventory, are shown in table 5.12.
Table 5.12 Kruskal-Wallis test results on hypothesis 3
Inventory question Chi-Square Df Asymptotic
significance
How often, on average, do you
purchase inventory? 15.469 5 .009
Source: Compiled by author from survey results
The results show that a statistically significant difference exists at the 1% level of significance (p-
value < 0.01) between the different industry groups with regard to how often, on average, they
purchase inventory. This means that the six industries differ with regard to how often, on average,
they purchase inventory.EF8
To further investigate the differences between the six industry groups with regard to how often,
on average, the respondents purchase inventory, the mean ranks (provided in table 5.13) were
considered.
Table 5.13 Mean ranks for hypothesis 3
Industries
Mean ranks
How often, on
average, do you
purchase inventory?
Retail Grocery 265.50
Retail Hardware 308.25
Retail General Store 283.75
Retail Service 285.73
Eating and Drinking Places 201.51
Retail Auto 303.80
Source: Compiled by author from survey results
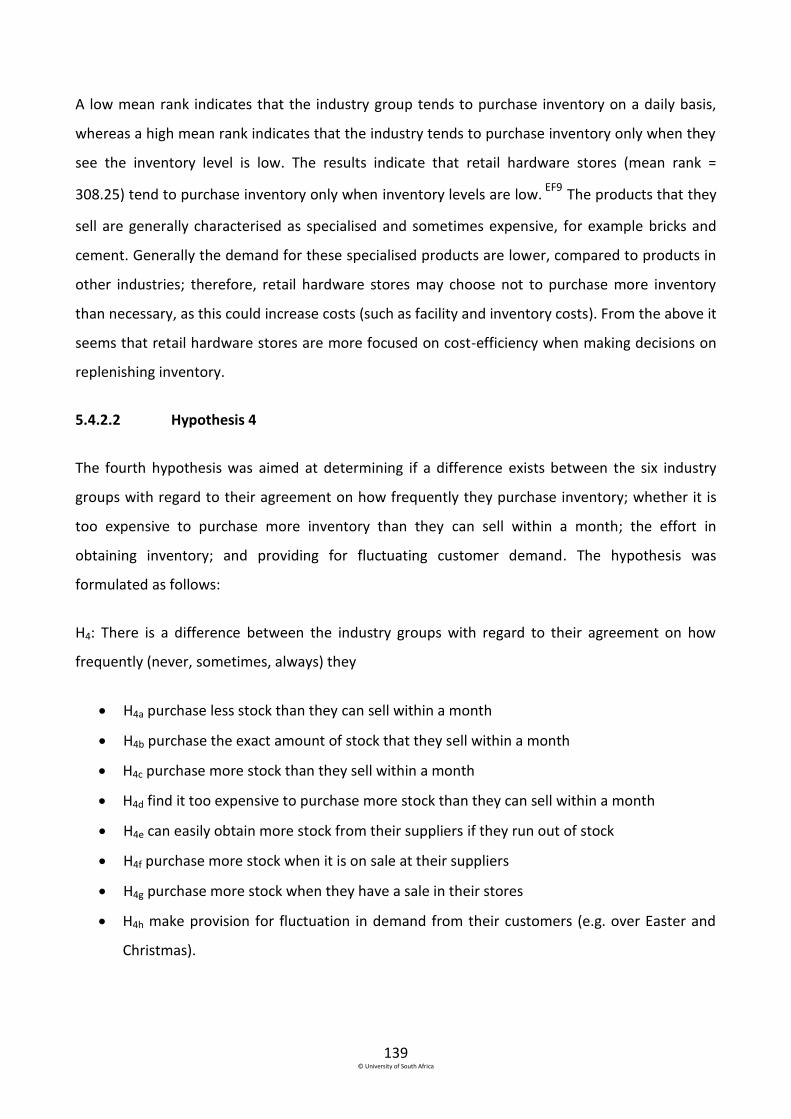
139 © University of South Africa
A low mean rank indicates that the industry group tends to purchase inventory on a daily basis,
whereas a high mean rank indicates that the industry tends to purchase inventory only when they
see the inventory level is low. The results indicate that retail hardware stores (mean rank =
308.25) tend to purchase inventory only when inventory levels are low. EF9 The products that they
sell are generally characterised as specialised and sometimes expensive, for example bricks and
cement. Generally the demand for these specialised products are lower, compared to products in
other industries; therefore, retail hardware stores may choose not to purchase more inventory
than necessary, as this could increase costs (such as facility and inventory costs). From the above it
seems that retail hardware stores are more focused on cost-efficiency when making decisions on
replenishing inventory.
5.4.2.2 Hypothesis 4
The fourth hypothesis was aimed at determining if a difference exists between the six industry
groups with regard to their agreement on how frequently they purchase inventory; whether it is
too expensive to purchase more inventory than they can sell within a month; the effort in
obtaining inventory; and providing for fluctuating customer demand. The hypothesis was
formulated as follows:
H4: There is a difference between the industry groups with regard to their agreement on how
frequently (never, sometimes, always) they
H4a purchase less stock than they can sell within a month
H4b purchase the exact amount of stock that they sell within a month
H4c purchase more stock than they sell within a month
H4d find it too expensive to purchase more stock than they can sell within a month
H4e can easily obtain more stock from their suppliers if they run out of stock
H4f purchase more stock when it is on sale at their suppliers
H4g purchase more stock when they have a sale in their stores
H4h make provision for fluctuation in demand from their customers (e.g. over Easter and
Christmas).
140 © University of South Africa
The results of the Kruskal-Wallis test to determine whether there is a difference between the
industry groups with regard to the agreement on how frequently the inventory statements apply
to them, are shown in table 5.14.
Table 5.14 Kruskal-Wallis test results on hypothesis 4
Inventory statements Chi-Square Df Asymptotic
significance
I purchase less stock than what I sell
within a month. 9.081 5 .106
I purchase the exact amount of stock
that I sell within a month. 2.961 5 .706
I purchase more stock than what I sell
within a month. 3.897 5 .564
It is too expensive for me to purchase
more stock than what I can sell within a
month.
5.015 5 .414
I can easily obtain more stock from my
suppliers if I run out of stock. 21.097 5 .001
I purchase more stock when it is on sale
at my suppliers. 29.711 5 .000
I purchase more stock when I have a
sale in my store. 10.841 5 .055
I make provision for the fluctuation in
the demand from my customers (e.g.
over Easter and Christmas).
15.081 5 .010
Source: Compiled by author from survey results
The results show that no statistically significant difference exists at the 5% level of significance (all
p-values ˃ 0.05) between the different industry groups with regard to their agreement on how
frequently (never, sometimes, always) they
141 © University of South Africa
H4a purchase less stock than they sell within a month
H4b purchase the exact amount of stock that they sell within a month
H4c purchase more stock than they sell within a month
H4d find it too expensive to purchase more stock than they can sell within a month.
H4g purchase more stock when they have a sale in their stores.
The mean ranks are fairly similar and thus show a similar rating of agreement on how frequently
these inventory statements apply to the industry group.EF10
The results of the remaining inventory statements show that statistically significant differences
exist at the 1% and 5% levels of significance (p < 0.01 and p < 0.05) between the different industry
groups with regard to their agreement on how frequently (never, sometimes, always) they
H4e can easily obtain more stock from their suppliers if they run out of stock
H4f purchase more stock when it is on sale at their suppliers
H4h make provision for the fluctuation in demand from their customers (e.g. over Easter
and Christmas). EF11
To further investigate the differences between the six industries and their agreement on the three
matters above, the mean ranks (see section 5.2) provided in table 5.15 were considered.

142 © University of South Africa
Table 5.15 Mean ranks for hypothesis 4
Industries
Mean ranks
I can easily
obtain more
stock from my
suppliers if I run
out of stock
I purchase more
stock when it is
on sale at my
suppliers
I make provision
for the
fluctuation in
demand from
my customers
(e.g. over Easter
and Christmas)
Retail Grocery 288.50 286.60 295.92
Retail Hardware 300.21 281.04 268.88
Retail General Store 280.91 311.57 262.17
Retail Service 227.44 217.22 244.17
Eating and Drinking Places 285.76 262.99 289.42
Retail Auto 224.49 251.00 226.22
Source: Compiled by author from survey results
When considering the mean ranks (in table 5.15) it appears that retail hardware stores (mean rank
= 300.21) tend to easily obtain more inventory from suppliers when they run out of inventory
more frequently than the other industry groups.EF12
This finding can shed light on the previous
finding (for hypothesis 3) that retail hardware stores purchase inventory only when their inventory
level is low. Both findings indicate that owners or managers of retail hardware stores tend to
operate their businesses more cost-efficiently.
Retail general stores tend to purchase more inventory, more frequently, when it is on sale at
suppliers than the other industry groups EF13, with a mean rank of 311.57. Purchasing more
inventory at a lower price can increase the retail general store’s cost-efficiency. In hypothesis 2 it
was determined that retail general stores tend to have capacity to store excess inventory more
frequently, which can also encourage them to purchase more inventory.

143 © University of South Africa
With a mean rank of 295.92, retail grocery stores tend to more frequently make provision for
fluctuation in demand from customers, than the other industry groups.EF14 Retail grocery stores
may be influenced by special occasions, such as Easter and Christmas, more than other industry
groups, since special occasions are generally associated with higher consumption of food and
beverages. By ensuring that they make provision for the fluctuation in customer demand, these
stores can increase their level of responsiveness.
5.4.2.3 Hypothesis 5
The purpose of the fifth hypothesis was to determine if a difference exists between the six
industry groups with regard to their level of agreement on having products immediately available
to customers; and having their customers know that they will always have enough inventory. The
hypothesis was formulated as follows:
H5: There is a difference between the industry groups with regard to their level of agreement
(strongly disagree to strongly agree) on whether
H5a they have products immediately available to customers when they want to buy it
H5b their customers know that they will always have enough stock.
The results of the Kruskal-Wallis one-way analysis of variance by ranks tests are shown in table
5.16.
Table 5.16 Kruskal-Wallis test results on hypothesis 5
Inventory statements Chi-Square Df Asymptotic
significance
A product should be immediately
available to my customers when they
want to buy it.
2.112 5 .833
My customers know that I will always
have enough stock. 6.617 5 .430
Source: Compiled by the researcher from survey results

144 © University of South Africa
The results show that no statistically significant difference exists at the 5% level of significance (p-
values ˃ 0.05) between the different industry groups with regard to the level of agreement on the
two inventory statements in hypothesis 5. The mean ranks are fairly similar and therefore indicate
a similar rating between the different industry groups.EF15
5.4.2.4 Hypothesis 6
The sixth hypothesis was aimed at determining if a difference exists between the six industries
with regard to their importance rating on carrying quality products and having enough product
variety. The hypothesis was formulated as follows:
H6: There is a difference between the industry groups with regard to their importance rating (very
unimportant to very important) on the following aspects related to inventory:
H6a carrying quality products
H6b having enough product variety.
The results of the Kruskal-Wallis test in terms of the difference between the industry groups and
the importance rating on carrying quality products and having enough product variety, are shown
in table 5.17.
Table 5.17 Kruskal-Wallis test results on hypothesis 6
Inventory aspects Chi-Square Df Asymptotic
significance
Quality products 6.915 5 .227
Enough product variety 4.776 5 .444
Source: Compiled by the researcher from survey results
The results show that no statistically significant difference exists at the 5% level of significance (p-
values ˃ 0.05) between the different industry groups with regard to the level of importance on
carrying quality products and having enough product variety available to customers. The mean
ranks are fairly similar and therefore indicate a similar rating between the different industry
groups with regard to the importance of these inventory aspects.EF16
145 © University of South Africa
By examining the inferential analyses of the different industry groups in terms of inventory, it can
be concluded that retail hardware stores manage inventory more cost-efficiently, since they tend
to only purchase inventory when their level is low (see section 5.4.2.1). Retail general stores take
advantage of having capacity to store excess inventory by purchasing more inventory, more
frequently, than other industry groups, when a supplier has a sale. By paying less for inventory,
retail general stores increase their cost-efficiency (see section 5.4.2.2). By making provision for
fluctuation in customer demand, retail grocery stores tend to be more responsive than other
industry groups.
5.5 Empirical findings related to transportation as a logistical supply chain driver
Sections D2 and D3 of the questionnaire contained questions on the management of
transportation by small retailers. In question D2 respondents had to indicate their level of
agreement with regard to how frequently a transportation statement applied to them; whereas
they had to indicate in question D3 whether they would pay higher delivery costs if a supplier
could deliver inventory sooner than usual. The descriptive findings on these questions will be
discussed below, followed by the inferential analyses of the retailers’ responses.
5.5.1 Descriptive analyses of the data pertaining to transportation
This section is structured to provide the frequency distributions and discussion of the agreement
of the respondents with statements on transportation (see table 5.18). These statements refer to
direct delivery of inventory by suppliers; payment for direct delivery; higher payment than
competitors for faster delivery; collection of inventory with own car; collection of inventory by
using a transportation opportunity; collaboration with other retailers; and willingness to wait
longer to pay less for delivery. Thereafter, the frequency distribution and discussion of the
respondents’ willingness to pay a supplier more to receive inventory sooner (see table 5.19), are
provided in section 5.5.1.8.
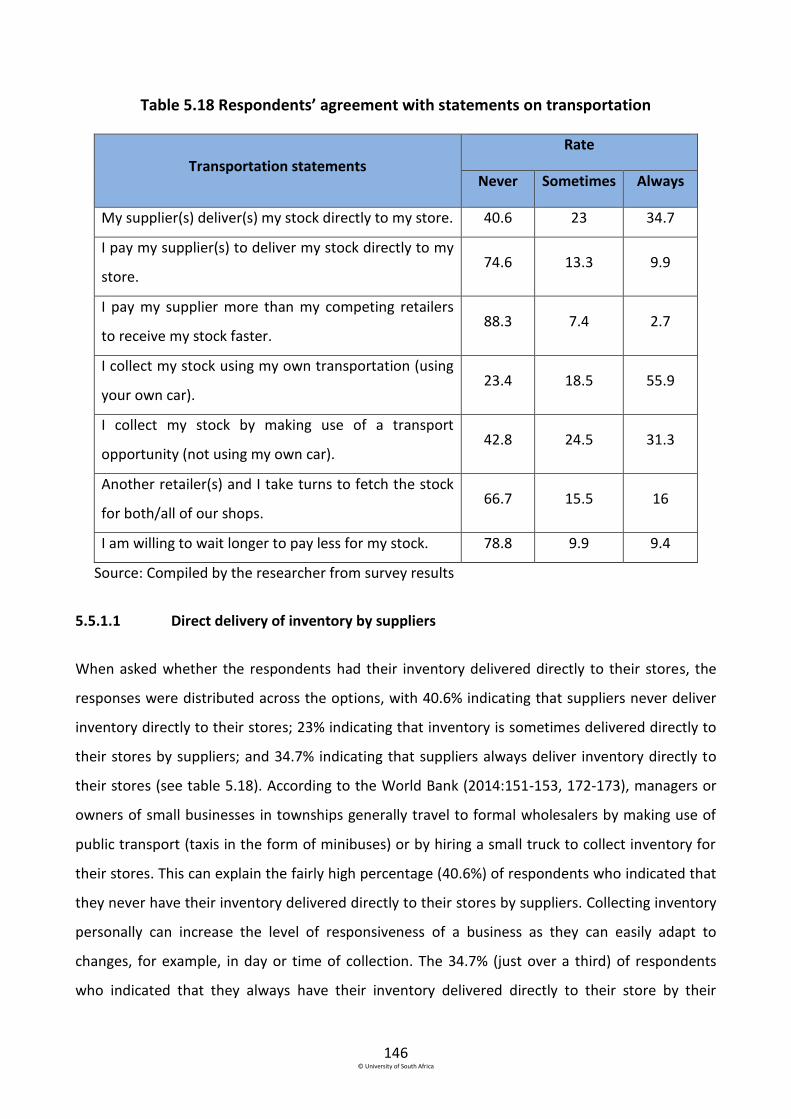
146 © University of South Africa
Table 5.18 Respondents’ agreement with statements on transportation
Transportation statements
Rate
Never Sometimes Always
My supplier(s) deliver(s) my stock directly to my store. 40.6 23 34.7
I pay my supplier(s) to deliver my stock directly to my
store. 74.6 13.3 9.9
I pay my supplier more than my competing retailers
to receive my stock faster. 88.3 7.4 2.7
I collect my stock using my own transportation (using
your own car). 23.4 18.5 55.9
I collect my stock by making use of a transport
opportunity (not using my own car). 42.8 24.5 31.3
Another retailer(s) and I take turns to fetch the stock
for both/all of our shops. 66.7 15.5 16
I am willing to wait longer to pay less for my stock. 78.8 9.9 9.4
Source: Compiled by the researcher from survey results
5.5.1.1 Direct delivery of inventory by suppliers
When asked whether the respondents had their inventory delivered directly to their stores, the
responses were distributed across the options, with 40.6% indicating that suppliers never deliver
inventory directly to their stores; 23% indicating that inventory is sometimes delivered directly to
their stores by suppliers; and 34.7% indicating that suppliers always deliver inventory directly to
their stores (see table 5.18). According to the World Bank (2014:151-153, 172-173), managers or
owners of small businesses in townships generally travel to formal wholesalers by making use of
public transport (taxis in the form of minibuses) or by hiring a small truck to collect inventory for
their stores. This can explain the fairly high percentage (40.6%) of respondents who indicated that
they never have their inventory delivered directly to their stores by suppliers. Collecting inventory
personally can increase the level of responsiveness of a business as they can easily adapt to
changes, for example, in day or time of collection. The 34.7% (just over a third) of respondents
who indicated that they always have their inventory delivered directly to their store by their
147 © University of South Africa
suppliers, can be considered as unique for a small business. The World Bank (2014: 151-153, 172-
173) suggests that larger wholesalers deliver inventory to small businesses only if they order large
quantities which is generally not possible for small businesses as they have limited resources
available. Not only can respondents save on transportation costs by purchasing large quantities,
but they can also benefit from a lower price per unit. By saving on transportation costs and gaining
the benefit of a lower price per unit, they can increase their level of cost-efficiency. Therefore, the
decision to have inventory directly delivered by suppliers to the respondents’ stores can be based
on either responsiveness EF17 or cost-efficiency EF18
.
5.5.1.2 Payment for direct delivery
Almost three quarters (74.6%) of the respondents indicated that they never pay a supplier to
deliver inventory directly to their stores (see table 5.18). Three possible reasons could be given for
this high percentage. First, not all of the respondents have their inventory delivered to their stores
by suppliers; which confirms the previous finding (section 5.5.1.1), where 40.6% of the
respondents indicated that their suppliers never deliver inventory directly to their stores. Thus,
not having inventory delivered directly to their stores by suppliers will involve no delivery costs.
Secondly, the supplier may not offer a delivery service, such as a supplier operating from a stall at
a market, as indicated by the World Bank (2014: 151-153, 172-173). Thirdly, a small retailer may
order large quantities at wholesalers (which, as stated in section 5.5.1.1, is unusual for a small
business), and therefore the wholesalers may deliver free of charge. If small retailers order larger
quantities of inventory in order to qualify for free delivery, they can increase their level of cost-
efficiency as they will save on transportation costs (as discussed in 5.5.1.1). However, owners or
managers should consider the cost of purchasing additional inventory (to qualify for the free
delivery) because it may exceed the cost (transportation cost) benefit of free delivery. This can
result in the retailer eventually paying more for the additional inventory and ultimately decreasing
the level of cost-efficiency. In conclusion, the decision to pay a supplier to deliver inventory
directly to the respondents’ stores is based on cost-efficiency. EF18
5.5.1.3 Higher payment than competitors for faster delivery
Almost 90% of the respondents indicated that they would never pay a supplier more than
competing retailers in order to receive their inventory faster (see table 5.18). Although receiving

148 © University of South Africa
inventory before a competitor, could give retailers a competitive advantage, by having inventory
readily available to customers, the respondents in this study will, by implication, rather wait longer
to receive their inventory than to increase transportation costs. The respondents may argue that
an increase in transportation costs would lead to an increase in the price of their products or
services. By not paying an additional fee to receive inventory faster, the small retailers are focused
on cost-efficiency rather than responsiveness. As transportation costs can influence the price of a
product, and retailers in Soweto are mainly serving price-sensitive customers (Strydom,
2013:2870), an increase in the price of a product can negatively influence sales. If a small retailer
paid a supplier more to receive inventory faster, it could increase responsiveness but at the same
time decrease cost-efficiency, which could lead to a loss in sales. In conclusion, not paying a higher
fee than a competitor for faster delivery of inventory, indicates that the focus is on cost-efficiency.
EF18
5.5.1.4 Collection of inventory with own car
When asked whether the respondents (never, sometimes or always) collected inventory using
their own transportation (using their own car), the responses were distributed across the options:
23.4% of the respondents indicated never, 18.5% indicated sometimes and more than half (55.9%)
of the respondents indicated always (see table 5.18). The responses of the business owners or
managers who indicated that they never use their own transport can be attributed to the fact that
they may either not own cars (which is more likely) or that they may prefer not to use their own
cars for collecting inventory (for instance because of the size of the inventory items or the quantity
purchased). According to the World Bank (2014: 151-153, 172-173), small businesses in townships
that do not use their own cars to collect inventory usually collect their inventory by making use of
public transportation or by hiring small trucks (which is the focus of the next transportation
statement). Since the average cost of collecting inventory from a supplier is between R300 and
R350 per trip when making use of public transport or hiring a small truck (as calculated by the
World Bank, 2014: 151-153, 172-173), an owner or manager who owns a car will probably find it
cheaper to use their own car to collect inventory. This explains why the majority (55.9%) indicated
that they always use their own cars to collect inventory. The explanations for the different
responses on this issue can range from respondents being responsive, to them being cost-efficient,
EF17 depending on their situation. Irrespective of the line of reasoning behind not using one’s own

149 © University of South Africa
car for inventory collection, a focus on cost-efficiency seems to drive this decision. Those
respondents who indicated that they sometimes and always (74.8%) use their own cars to collect
inventory could be either cost conscious (saving the fee associated with other transport) or
responsive (taking control of the situation to fetch inventory themselves). This finding aligns with a
previous descriptive finding that the majority of respondents never pay their suppliers to have
inventory delivered directly to their stores. Therefore, the decision to use their own cars for
inventory collection could be based on either responsiveness EF17 or cost-efficiency EF18.
5.5.1.5 Collection of inventory by using a transportation opportunity
When asked whether the respondents (never, sometimes or always) collected inventory by using a
transportation opportunity, which implies that they do not use their own cars, the responses were
distributed across the options: 42.8% indicated never, 24.5% indicated sometimes and 31.3%
indicated always (see table 5.18). The high percentage (42.8%) who indicated that they never use
a transportation opportunity confirms the previous finding (see section 5.5.1.4) that the majority
of respondents use their own transport to collect inventory. The 55.8% of respondents who
indicated that they sometimes or always use a transport opportunity, will therefore be willing to
pay the transportation fee of between R300 and R350 per trip. Thus, the main reason for making
use of transportation opportunities (and not one’s own car) seems to be based on cost-efficiency.
EF18
5.5.1.6 Collaborating with other retailers to collect inventory
Two thirds (66.7%) of respondents indicated that they never take turns with other retailers to
fetch inventory for both/all of their shops (see table 5.18). This high percentage could be an
indication of a silo mentality and the fact that respondents do not realise the synergistic
advantages of working with others. Owners or managers seem to take sole responsibility for
collecting their inventory, and this can be a reflection of their focus on responsiveness. By
functioning on their own, in terms of collecting inventory, small retail owners and managers show
a preference for having more control of their situations; in this case by controlling the time and
speed of collection. In contrast, the World Bank (2014: 151-153, 172-173) reports that, in general,
owners or managers in townships seem to be more focused on cost-efficiency; and that they
collaborate by renting a small truck together (and sharing the cost) to collect both businesses’
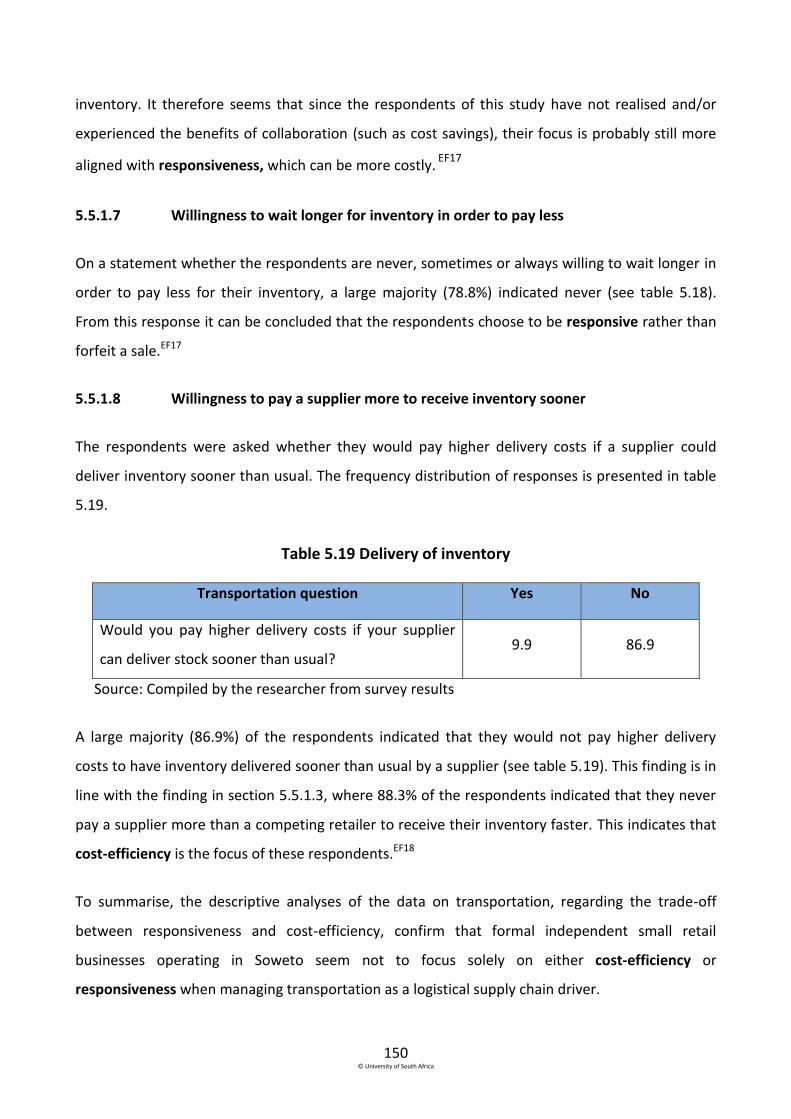
150 © University of South Africa
inventory. It therefore seems that since the respondents of this study have not realised and/or
experienced the benefits of collaboration (such as cost savings), their focus is probably still more
aligned with responsiveness, which can be more costly. EF17
5.5.1.7 Willingness to wait longer for inventory in order to pay less
On a statement whether the respondents are never, sometimes or always willing to wait longer in
order to pay less for their inventory, a large majority (78.8%) indicated never (see table 5.18).
From this response it can be concluded that the respondents choose to be responsive rather than
forfeit a sale.EF17
5.5.1.8 Willingness to pay a supplier more to receive inventory sooner
The respondents were asked whether they would pay higher delivery costs if a supplier could
deliver inventory sooner than usual. The frequency distribution of responses is presented in table
5.19.
Table 5.19 Delivery of inventory
Transportation question Yes No
Would you pay higher delivery costs if your supplier
can deliver stock sooner than usual? 9.9 86.9
Source: Compiled by the researcher from survey results
A large majority (86.9%) of the respondents indicated that they would not pay higher delivery
costs to have inventory delivered sooner than usual by a supplier (see table 5.19). This finding is in
line with the finding in section 5.5.1.3, where 88.3% of the respondents indicated that they never
pay a supplier more than a competing retailer to receive their inventory faster. This indicates that
cost-efficiency is the focus of these respondents.EF18
To summarise, the descriptive analyses of the data on transportation, regarding the trade-off
between responsiveness and cost-efficiency, confirm that formal independent small retail
businesses operating in Soweto seem not to focus solely on either cost-efficiency or
responsiveness when managing transportation as a logistical supply chain driver.
151 © University of South Africa
Following the descriptive analyses on the transportation questions, inferential analyses were done
to determine whether a difference exists between the six industry groups with regard to their
responses regarding transportation.
5.5.2 Inferential analyses of the questions pertaining to transportation
When analysing the questions in sections D2 and D3 of the questionnaire, the Kruskal-Wallis one-
way analysis test was used to analyse the ordinal data obtained by the questions in D2, and the
Pearson Chi-Square test of independence was used to analyse the nominal data gathered on the
question in D3 (see section 4.3.7.2). Two hypotheses were formulated (see section 5.2) and are
discussed in sections 5.5.2.1 and 5.5.2.2
5.5.2.1 Hypothesis 7
The intention of the seventh hypothesis was to determine if a difference exists between the six
industry groups with regard to their agreement on how frequently they had inventory delivered;
paid for the delivery of inventory; and collaborated with other retailers with regard to the
collection of inventory. The hypothesis was formulated as follows:
H7: There is a difference between the industry groups with regard to their agreement on how
frequently (never, sometimes, always) they
H7a have stock delivered directly to their stores by their suppliers
H7b pay their suppliers to deliver their stock directly to their stores
H7c pay a supplier more than competing retailers to receive stock faster
H7d collect their stock using their own transportation (using their own cars)
H7e collect their stock by making use of a transport opportunity (not using their own cars)
H7f collaborate with another retailer(s) to take turns to fetch the stock for both/all of their
shops
H7g are willing to wait longer to pay less for their stock.
The results of the Kruskal-Wallis one way analysis of variance by ranks test, in terms of the
difference between the industry groups on the transportation statements, are shown in table
5.20.
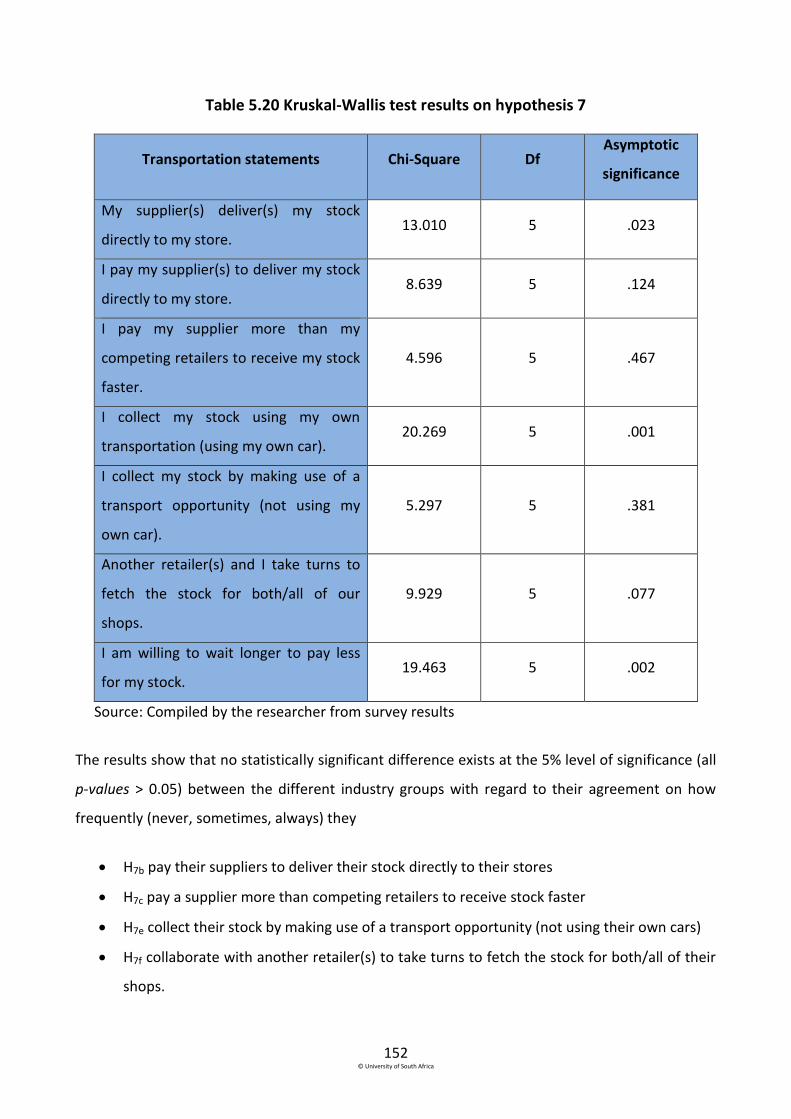
152 © University of South Africa
Table 5.20 Kruskal-Wallis test results on hypothesis 7
Transportation statements Chi-Square Df Asymptotic
significance
My supplier(s) deliver(s) my stock
directly to my store. 13.010 5 .023
I pay my supplier(s) to deliver my stock
directly to my store. 8.639 5 .124
I pay my supplier more than my
competing retailers to receive my stock
faster.
4.596 5 .467
I collect my stock using my own
transportation (using my own car). 20.269 5 .001
I collect my stock by making use of a
transport opportunity (not using my
own car).
5.297 5 .381
Another retailer(s) and I take turns to
fetch the stock for both/all of our
shops.
9.929 5 .077
I am willing to wait longer to pay less
for my stock. 19.463 5 .002
Source: Compiled by the researcher from survey results
The results show that no statistically significant difference exists at the 5% level of significance (all
p-values ˃ 0.05) between the different industry groups with regard to their agreement on how
frequently (never, sometimes, always) they
H7b pay their suppliers to deliver their stock directly to their stores
H7c pay a supplier more than competing retailers to receive stock faster
H7e collect their stock by making use of a transport opportunity (not using their own cars)
H7f collaborate with another retailer(s) to take turns to fetch the stock for both/all of their
shops.
153 © University of South Africa
There are no statistically significant differences between the six industry groups with regard to
these 4 transportation statements; which is deduced from the fairly similar mean ranks. Having
similar mean ranks between the different industry groups indicate that all six industries have
similar frequency distributions with regard to how frequently they pay their suppliers to deliver
their inventory directly to their stores; pay a supplier more than competing retailers to receive
inventory faster; collect their inventory by making use of a transport opportunity (not using their
own car); and work with another retailer(s) to take turns to fetch the inventory for both/all of their
shops.EF19
The results of the remaining transportation statements show that statistically significant
differences exist at the 1% and 5% levels of significance (p-values < 0.05) between the different
industry groups with regard to their agreement on how frequently (never, sometimes, always)
they
have stock delivered directly to their store by their suppliers
collect their stock using their own transportation (using their own cars)
are willing to wait longer to pay less for their stock. EF20
To further investigate the differences in the frequency distribution between the six industry
groups, the mean ranks (provided in table 5.21) were considered.

154 © University of South Africa
Table 5.21 Mean ranks for hypothesis 7
Industries
Mean ranks
My supplier(s)
deliver(s) my
stock directly to
my store.
I collect my stock
using my own
transportation
(using your own
car).
I am willing to
wait longer to
pay less for
my stock.
Retail Grocery 285.94 258.61 285.76
Retail Hardware 330.34 270.34 272.82
Retail General Store 243.06 319.55 240.32
Retail Service 258.90 246.76 272.37
Eating and Drinking Places 263.15 306.72 242.58
Retail Auto 284.84 301.39 317.51
Source: Compiled by the researcher from survey results
A higher mean rank indicates that an industry group tends to have more frequent deliveries of
inventory directly to their stores by suppliers than other industries. From table 5.21 it follows that
retail hardware stores tend to have their inventory delivered directly to their stores by suppliers
more frequently EF21 with the highest mean rank of 330.34. A possible reason can be that the
nature of the products that retail hardware stores sell, require specialised vehicles (for instance
for bricks and cement). Respondents in the retail general store group tend to more frequently
collect inventory by using their own transportation, than the other industry groups EF22 (mean rank
of 319.55). This can be due to the ease of transporting inventory items and/or the speed at which
items can be brought to the stores. Another possible reason may be that the owner or manager
prefers to have more control over the delivery process. Retail auto respondents tend more
frequently to be willing to wait longer in order to pay less for their inventory EF23 (mean rank of
317.51). In terms of retail auto owners or managers, they sometimes have no choice other than to
wait for inventory items, since the correct item may have to be sent from overseas or from auto
manufacturers in an area far outside Soweto. Retail auto parts are sometimes only dispatched
once the order is large enough, in an effort to save on delivery costs. Depending on the motive for
using their own cars, retail general store owners or managers could be focused on either
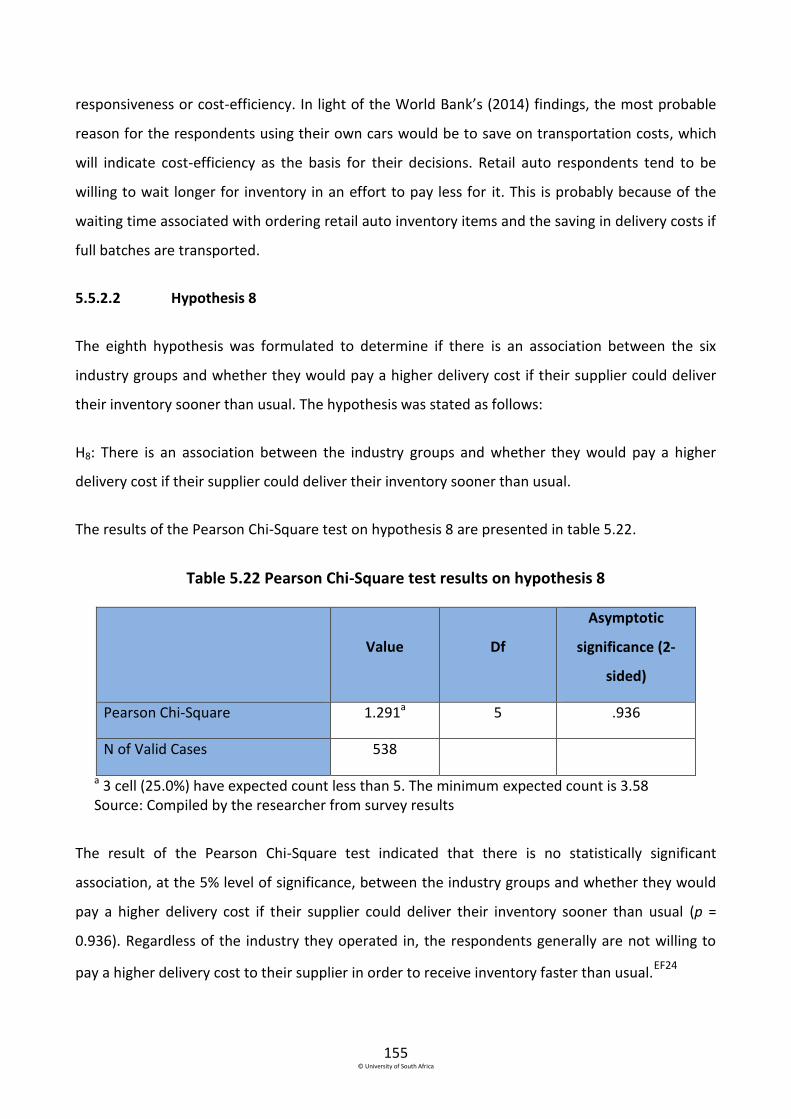
155 © University of South Africa
responsiveness or cost-efficiency. In light of the World Bank’s (2014) findings, the most probable
reason for the respondents using their own cars would be to save on transportation costs, which
will indicate cost-efficiency as the basis for their decisions. Retail auto respondents tend to be
willing to wait longer for inventory in an effort to pay less for it. This is probably because of the
waiting time associated with ordering retail auto inventory items and the saving in delivery costs if
full batches are transported.
5.5.2.2 Hypothesis 8
The eighth hypothesis was formulated to determine if there is an association between the six
industry groups and whether they would pay a higher delivery cost if their supplier could deliver
their inventory sooner than usual. The hypothesis was stated as follows:
H8: There is an association between the industry groups and whether they would pay a higher
delivery cost if their supplier could deliver their inventory sooner than usual.
The results of the Pearson Chi-Square test on hypothesis 8 are presented in table 5.22.
Table 5.22 Pearson Chi-Square test results on hypothesis 8
Value Df
Asymptotic
significance (2-
sided)
Pearson Chi-Square 1.291a 5 .936
N of Valid Cases 538
a 3 cell (25.0%) have expected count less than 5. The minimum expected count is 3.58 Source: Compiled by the researcher from survey results
The result of the Pearson Chi-Square test indicated that there is no statistically significant
association, at the 5% level of significance, between the industry groups and whether they would
pay a higher delivery cost if their supplier could deliver their inventory sooner than usual (p =
0.936). Regardless of the industry they operated in, the respondents generally are not willing to
pay a higher delivery cost to their supplier in order to receive inventory faster than usual.EF24
156 © University of South Africa
By examining the inferential analyses of the different industry groups in terms of the different
transportation statements, and their willingness to pay an additional fee for faster delivery of
inventory, it seems as if the formal independent small retail businesses manage transportation
based on either responsiveness or cost-efficiency, depending on the types of products they sell.
Depending on the reason (whether the retailers find it easier to transport the inventory
themselves or prefer to have more control over the delivery process) retail grocery general stores
manage transportation more responsively or more cost-efficiently than the other industries. It
seems that retailers in the retail auto industry tend to manage transportation focused more on
cost-efficiency than the other industry groups.
5.6 Conclusion
Chapter 5 focused on determining whether the formal independent small retail businesses
operating within Soweto manage their logistical supply chain drivers orientated toward
responsiveness or cost-efficiency. Both descriptive and inferential analyses were conducted on
each logistical supply chain driver.
According to the descriptive findings, the formal independent small retailers manage their
facilities responsively. Further inferential findings indicated that retail general stores manage their
facilities more responsively than the other industry groups, possibly due to the retailers’ focus on
keeping ample inventory and having easy access to excess inventory more frequently. Through the
descriptive findings, it was determined that the formal independent small retailers’ inventory
management is orientated towards responsiveness. The inferential findings showed that retail
grocery stores tend to be the most responsive among the different industries; mainly by making
provision for fluctuation in customer demand. The inferential analyses also indicated that retail
general stores tend to manage inventory more cost-efficiently than the other industries. According
to the data, retail general stores manage facilities more responsively, but inventory more cost-
efficiently, which may be problematic, as maintaining a higher level of responsiveness decreases
the cost-efficiency of the retailer. Both the descriptive and inferential analyses indicated that
transportation is managed orientated towards either responsiveness or cost-efficiency, depending
on the types of products sold. The twenty-four empirical findings in chapter 5 are presented in
table 5.23.
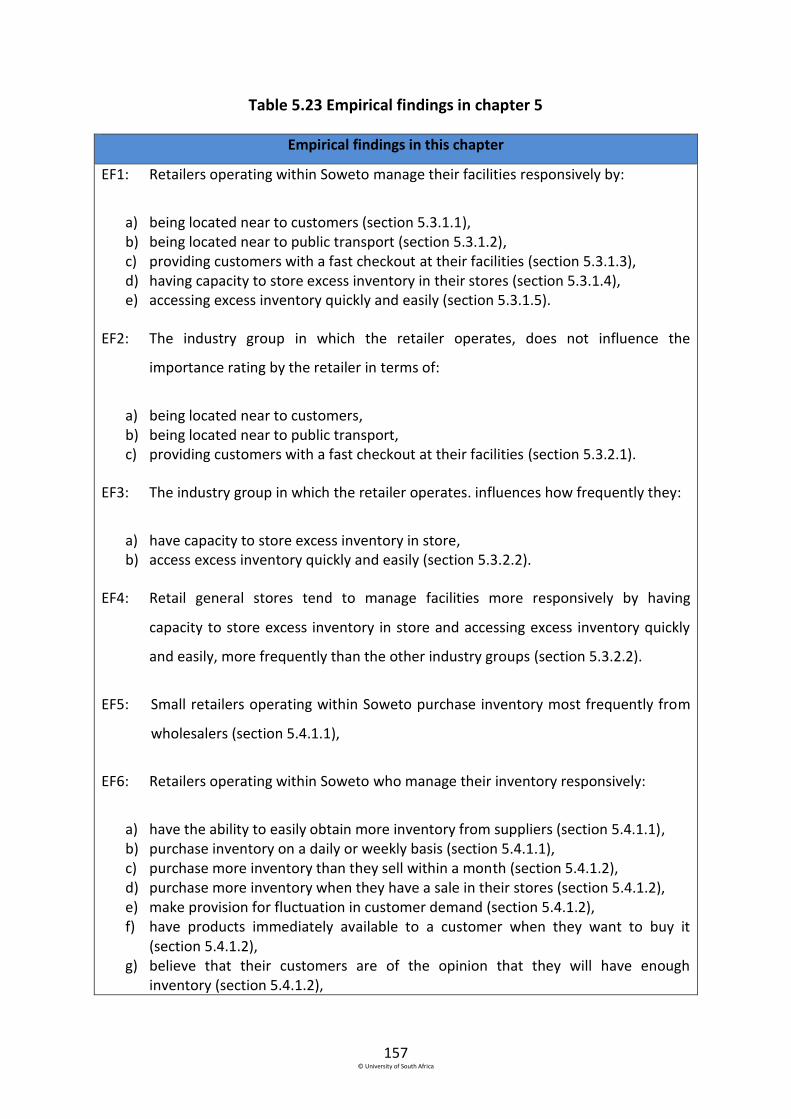
157 © University of South Africa
Table 5.23 Empirical findings in chapter 5
Empirical findings in this chapter
EF1: Retailers operating within Soweto manage their facilities responsively by:
a) being located near to customers (section 5.3.1.1), b) being located near to public transport (section 5.3.1.2), c) providing customers with a fast checkout at their facilities (section 5.3.1.3), d) having capacity to store excess inventory in their stores (section 5.3.1.4), e) accessing excess inventory quickly and easily (section 5.3.1.5).
EF2: The industry group in which the retailer operates, does not influence the
importance rating by the retailer in terms of:
a) being located near to customers, b) being located near to public transport, c) providing customers with a fast checkout at their facilities (section 5.3.2.1).
EF3: The industry group in which the retailer operates. influences how frequently they:
a) have capacity to store excess inventory in store, b) access excess inventory quickly and easily (section 5.3.2.2).
EF4: Retail general stores tend to manage facilities more responsively by having
capacity to store excess inventory in store and accessing excess inventory quickly
and easily, more frequently than the other industry groups (section 5.3.2.2).
EF5: Small retailers operating within Soweto purchase inventory most frequently from
wholesalers (section 5.4.1.1),
EF6: Retailers operating within Soweto who manage their inventory responsively:
a) have the ability to easily obtain more inventory from suppliers (section 5.4.1.1), b) purchase inventory on a daily or weekly basis (section 5.4.1.1), c) purchase more inventory than they sell within a month (section 5.4.1.2), d) purchase more inventory when they have a sale in their stores (section 5.4.1.2), e) make provision for fluctuation in customer demand (section 5.4.1.2), f) have products immediately available to a customer when they want to buy it
(section 5.4.1.2), g) believe that their customers are of the opinion that they will have enough
inventory (section 5.4.1.2),
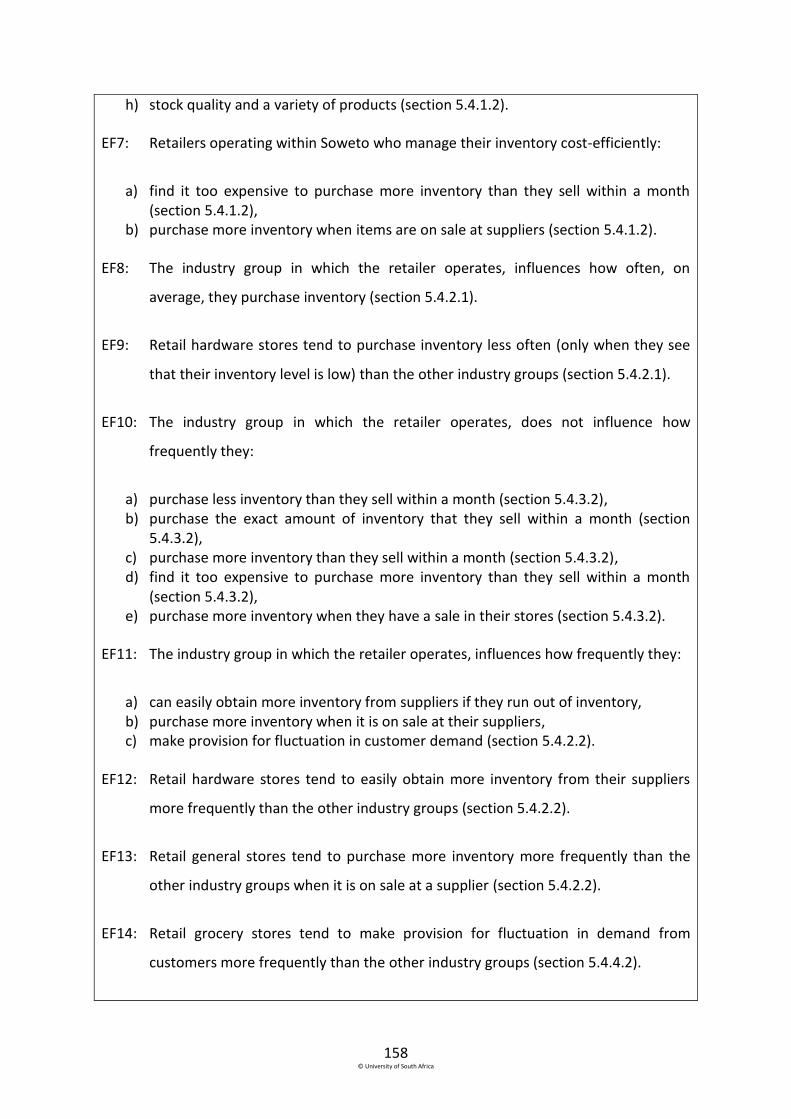
158 © University of South Africa
h) stock quality and a variety of products (section 5.4.1.2).
EF7: Retailers operating within Soweto who manage their inventory cost-efficiently:
a) find it too expensive to purchase more inventory than they sell within a month (section 5.4.1.2),
b) purchase more inventory when items are on sale at suppliers (section 5.4.1.2).
EF8: The industry group in which the retailer operates, influences how often, on
average, they purchase inventory (section 5.4.2.1).
EF9: Retail hardware stores tend to purchase inventory less often (only when they see
that their inventory level is low) than the other industry groups (section 5.4.2.1).
EF10: The industry group in which the retailer operates, does not influence how
frequently they:
a) purchase less inventory than they sell within a month (section 5.4.3.2), b) purchase the exact amount of inventory that they sell within a month (section
5.4.3.2), c) purchase more inventory than they sell within a month (section 5.4.3.2), d) find it too expensive to purchase more inventory than they sell within a month
(section 5.4.3.2), e) purchase more inventory when they have a sale in their stores (section 5.4.3.2).
EF11: The industry group in which the retailer operates, influences how frequently they:
a) can easily obtain more inventory from suppliers if they run out of inventory, b) purchase more inventory when it is on sale at their suppliers, c) make provision for fluctuation in customer demand (section 5.4.2.2).
EF12: Retail hardware stores tend to easily obtain more inventory from their suppliers
more frequently than the other industry groups (section 5.4.2.2).
EF13: Retail general stores tend to purchase more inventory more frequently than the
other industry groups when it is on sale at a supplier (section 5.4.2.2).
EF14: Retail grocery stores tend to make provision for fluctuation in demand from
customers more frequently than the other industry groups (section 5.4.4.2).
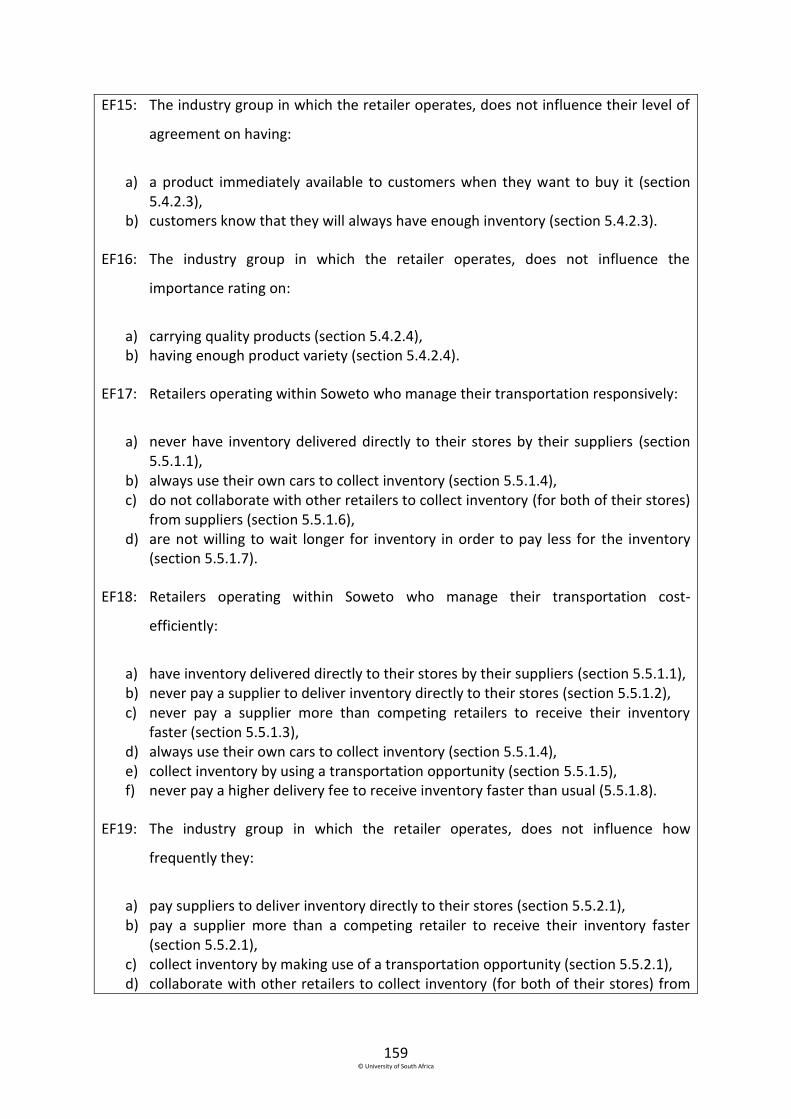
159 © University of South Africa
EF15: The industry group in which the retailer operates, does not influence their level of
agreement on having:
a) a product immediately available to customers when they want to buy it (section 5.4.2.3),
b) customers know that they will always have enough inventory (section 5.4.2.3).
EF16: The industry group in which the retailer operates, does not influence the
importance rating on:
a) carrying quality products (section 5.4.2.4), b) having enough product variety (section 5.4.2.4).
EF17: Retailers operating within Soweto who manage their transportation responsively:
a) never have inventory delivered directly to their stores by their suppliers (section 5.5.1.1),
b) always use their own cars to collect inventory (section 5.5.1.4), c) do not collaborate with other retailers to collect inventory (for both of their stores)
from suppliers (section 5.5.1.6), d) are not willing to wait longer for inventory in order to pay less for the inventory
(section 5.5.1.7).
EF18: Retailers operating within Soweto who manage their transportation cost-
efficiently:
a) have inventory delivered directly to their stores by their suppliers (section 5.5.1.1), b) never pay a supplier to deliver inventory directly to their stores (section 5.5.1.2), c) never pay a supplier more than competing retailers to receive their inventory
faster (section 5.5.1.3), d) always use their own cars to collect inventory (section 5.5.1.4), e) collect inventory by using a transportation opportunity (section 5.5.1.5), f) never pay a higher delivery fee to receive inventory faster than usual (5.5.1.8).
EF19: The industry group in which the retailer operates, does not influence how
frequently they:
a) pay suppliers to deliver inventory directly to their stores (section 5.5.2.1), b) pay a supplier more than a competing retailer to receive their inventory faster
(section 5.5.2.1), c) collect inventory by making use of a transportation opportunity (section 5.5.2.1), d) collaborate with other retailers to collect inventory (for both of their stores) from

160 © University of South Africa
suppliers (section 5.5.2.1).
EF20: The industry group in which the retailer operates, influences how frequently they:
a) have inventory delivered directly to their stores by their suppliers (section 5.5.2.1), b) collect inventory by using their own transportation (section 5.5.2.1), c) are willing to wait longer to pay less for inventory (section 5.5.2.1).
EF21: Retail hardware stores have inventory delivered directly to their stores more
frequently than the other industries (section 5.5.2.2).
EF22: Retail general stores tend to collect their inventory by using their own cars more
frequently than the other industries (section 5.5.2.2).
EF23: Retail auto stores tend to be more willing to wait longer to pay less for their
inventory than the other industry groups (section 5.5.2.2).
EF24: The industry group in which the retailer operates, does not influenced how
frequently they pay a higher delivery fee to receive inventory faster than usual
(section 5.5.2.2)
Source: Compiled by the researcher
161 © University of South Africa
Chapter 6
Predicting the survival of Sowetan small retailers through binary logistic regression
models
6.1 Introduction
Chapter 5 concluded that formal independent small retail businesses operating within Soweto
manage facilities and inventory orientated more towards responsiveness and manage
transportation oriented towards either responsiveness or cost-efficiency. The purpose of this
chapter is to determine whether the management of the three logistical supply chain drivers
influences the survival of the formal independent small retail businesses. Two binary logistic
regression models are developed to determine whether the survival of the formal independent
small retail businesses can be predicted. In section 6.2 an overview of a binary logistic regression
model is provided and the dependent and independent variables necessary for developing the two
binary logistic regression models for this study, are identified. The first model (discussed in section
6.3) aims to predict the survival of the small retailers in terms of the age of the business, and the
second (discussed in section 6.4) to predict the survival of the small retailers based on the income
change pattern for the past year (hereafter referred to as growth). The two literature and eight
empirical findings of this chapter are presented in table 6.4.
6.2 Binary logistic regression model: an overview
As stated in section 4.3.7.2, logistic regression is a statistical method used to determine whether
one or more independent variables can be used to predict a dichotomous dependent variable
(Williams et al., 2006:561). When developing a binary logistic regression model the independent
variables can only predict the probability of a binomial outcome (one of two possible outcomes)
for the dependent variable. Therefore, the first step is to determine the dependent variable with
its two possible outcomes, followed by identifying the independent variables that will be used to
predict the dependent variable.
162 © University of South Africa
6.2.1 Selecting the dependent variable for each binary logistic regression model
Two dependent variables, namely the age and growth of the business, were identified to be used
in the two binary logistic regression models with which the survival of the small retailers could be
predicted.
The age of the business was deemed a suitable dependent variable to predict the survival of the
small retailers, as being in business for five years and longer serves as a measure of success
worldwide. The US Small Business Administration (2014), a United States government agency
supporting small businesses, indicates that half of all small businesses close down by the fifth year
of trading, which is in line with the findings of the official statistics of the United Kingdom (Deakins
and Freel, 2012:19). In South Africa the percentage of small businesses that close down within the
first 5 years is a staggering 80% (Strydom, 2015:467; Van Eeden, Viviers & Venter 2003:12;
Moodie, 2003:1). Therefore, in this study, any small business that has been in business for 5 year
or longer is deemed to be successful.LF23 As the binary logistic regression model can only predict a
binomial outcome (one of two possible outcomes) the age of the small retailers was recorded in
two categories: those in business for less than 5 years and those in business for more than 5 years.
The second dependent variable that was used to predict the survival of the small retailers was the
growth of the retailer and this was measured in terms of the retailers’ income change pattern over
the past year. Growth was deemed a suitable variable to predict survival since it indicates that the
retailers have expanded their businesses and exploited business opportunities in order to grow
and survive (Ligthelm, 2010:137). LF24 The growth of the retailers was recorded in two categories:
those businesses whose income contracted or stayed the same over the past year, and those
whose income grew over the past year.
Binary logistic regression models were developed for each dependent variable and they are
discussed in sections 6.3 and 6.4. In the next section the independent variables that were used in
order to predict the outcomes of the dependent variables, are identified.
6.2.2 Selecting the independent variables used in both binary logistic regression models
The set of independent variables that was used in the binary logistic regression models was
derived from the questions on the management of the three logistical supply chain drivers.
163 © University of South Africa
Hosmer and Lemeshow (2000:92) state that the more independent variables included in a binary
logistic regression model, the greater the estimated standard errors become. Therefore, the
number of independent variables should be minimised in order to produce models that are
numerically more stable and more easily generalised (Hosmer and Lemeshow, 2000:92).
Considering the impact of the number of independent variables on the outcome of the binary
logistic regression model, it was decided to limit the number of independent variables to a
minimum. Therefore, principal component analysis (factor analysis) was used to reduce the
number of independent variables (based on the different sections of the questionnaire concerning
the three logistical supply chain drivers) and to group highly correlated variables together.
Before discussing the results of the principal component analyses, the following should be noted
(as discussed in section 4.3.7.2):
The questions in the different sections of the questionnaire are referred to as items.
Since both sections E2 and D3 in the questionnaire contained only one item, a principal
component analysis could not be conducted on these sections; therefore these items were
used as independent variables. Principal component analyses were conducted on the
remaining sections of the questionnaire, namely E3, E11, E6, and D2, as these sections
contained multiple items.
The two measures of sampling adequacy, namely the Kaiser-Meyer-Olkin test and the
Bartlett’s test of sphericity, were used to determine whether a principle component
analysis could be conducted on the items. Significance is indicated when the Kaiser-Meyer-
Olkin value is higher or equal to 0.5, and the p-value of the Bartlett’s test of sphericity is
p=0.000.
To ensure that the number of factors identified was less than the number of items on
which the principal component analysis was conducted, the eigenvalue criterion of
eigenvalues should be larger than one.
Since the Cronbach Alpha value measures how closely related the different items within a
group are to each other, a value above the exploratory threshold of 0.6 or the generally
accepted threshold of 0.7, was deemed a satisfactory indication of internal consistency.
The results of the principle component analyses are presented in table 6.1.

164 © University of South Africa
Table 6.1 Results of the principle component analyses conducted on the different items
Logistical supply chain driver
Items in the
question-naire
Is the Kaiser-Meyer-Olkin
measure of sampling adequacy p ≥ 0.5?
Is the Barlett’s test of
sphericity significant (p=0.000)?
Is a principal component
analysis appropriate?
Is the eigenvalue criterion of
eigenvalues ˃ 1?
Factor label*
Is the Cronbach Alfa value above the acceptable
threshold (value ˃ 0.6)?
Can this factor be used as an independent
variable in the binary logistic
regression model?
Facilities E3 (j, k)
Yes, (0.500)
Yes, p=0.000
Yes
Yes and 88.84% of the
variance is explained
Excess storage Yes, the Cronbach Alfa value = 0.874
Yes
Facilities E11
(j, k, m) Yes, (0.573)
Yes, p=0.000
Yes
Yes and 60.352% of the
variance is explained
Convenience level
Yes, the Cronbach Alfa value = 0.618
Yes
Inventory E3
(a-h) Yes, (0.719)
Yes, p=0.000
Yes
Yes and 54.71% of the
variance is explained
Maintaining a low inventory
level
Yes, the Cronbach Alfa value = 0.637
Yes
Maintaining a high inventory
level
Yes, the Cronbach Alfa value = 0.765
Yes
Inventory E6
(a, c) Yes, (0.500)
Yes, p=0.000
Yes
Yes and 69.54% of the
variance is explained
-
No, the Cronbach Alfa value is below
the acceptable threshold = 0.561
No, if the Cronbach Alfa value is below the acceptable
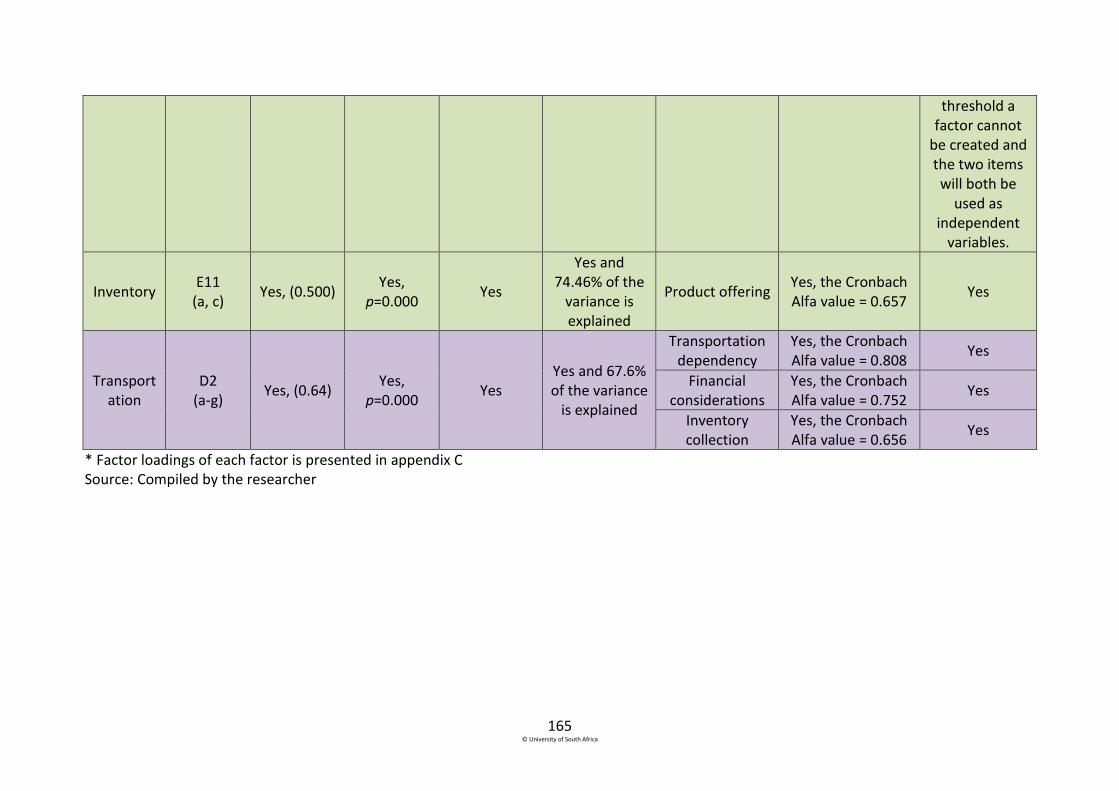
165 © University of South Africa
threshold a factor cannot
be created and the two items will both be
used as independent
variables.
Inventory E11
(a, c) Yes, (0.500)
Yes, p=0.000
Yes
Yes and 74.46% of the
variance is explained
Product offering Yes, the Cronbach Alfa value = 0.657
Yes
Transportation
D2 (a-g)
Yes, (0.64) Yes,
p=0.000 Yes
Yes and 67.6% of the variance
is explained
Transportation dependency
Yes, the Cronbach Alfa value = 0.808
Yes
Financial considerations
Yes, the Cronbach Alfa value = 0.752
Yes
Inventory collection
Yes, the Cronbach Alfa value = 0.656
Yes
* Factor loadings of each factor is presented in appendix C Source: Compiled by the researcher

166 © University of South Africa
Eight factors and two items (E6a and E6c) were identified after conducting the principal
component analyses. Together with items E2 and D3 (see section 6.2.2), 12 independent
variables were identified and used in the binary logistic regression models to predict the
survival of the small retailers. These factors and items are hereafter referred to as the
independent variables. The 12 independent variables are listed below:
Excess storage
Convenience level
Maintaining a high inventory level
Maintaining a low inventory level
Product offering
Transportation dependency
Financial considerations
Inventory collection
Rate of purchasing inventory
Having products immediately available
Perception that customers know retailers have enough inventory
Higher delivery cost for earlier inventory delivery.
To determine whether these independent variables are statistically significant predictors of
the survival of small retailers (in terms of the two dependent variables age and growth), two
binary logistic regression models were developed. The first binary logistic regression model
determined the influence of the independent variables on the dependent variable age,
followed by the second binary logistic regression model that determined the influence of
the independent variables on the dependent variable growth.
6.3 Binary logistic regression model with the dependable variable age
In this section the results of the binary logistic regression model predicting the small
retailers’ survival in terms of age is discussed. Before the results are discussed, the following
should be noted (as discussed in detail in section 4.3.7.2) in terms of the validity and

167 © University of South Africa
reliability of the logistic regression model predicting the small retailers’ survival in terms of
age:
The Hosmer and Lemeshow test indicated goodness of fit of the logistic regression
model with a p-value of 0.145. Therefore the model is assumed to be adequate.
The overall correct prediction classification improved from 59% (model 0 outcome -
the business survives for less than 5 years) to 65.3% (model 1 outcome - the business
survives for more than 5 years) as seen in appendix C. Therefore, the results of the
binary logistic regression model with the dependent variable more than 5 years are
discussed.
An odds ratio larger than 1 indicates that the independent variable increases the
small retailers’ odds to survive beyond 5 years, whereas an odds ratio smaller than 1
indicates that the independent variable decreases the small retailers’ odds to survive
beyond 5 years.
Table 6.2 provides the results of the 12 independent variables that were included in the
binary logistic regression model. Five independent variables were identified as statistically
significant predictors of the model (p-values ≤ 0.05) (highlighted in table 6.2). The odds
ratios of these five independent variables were considered to determine whether the
independent variables had a positive or negative influence on the dependent variable.
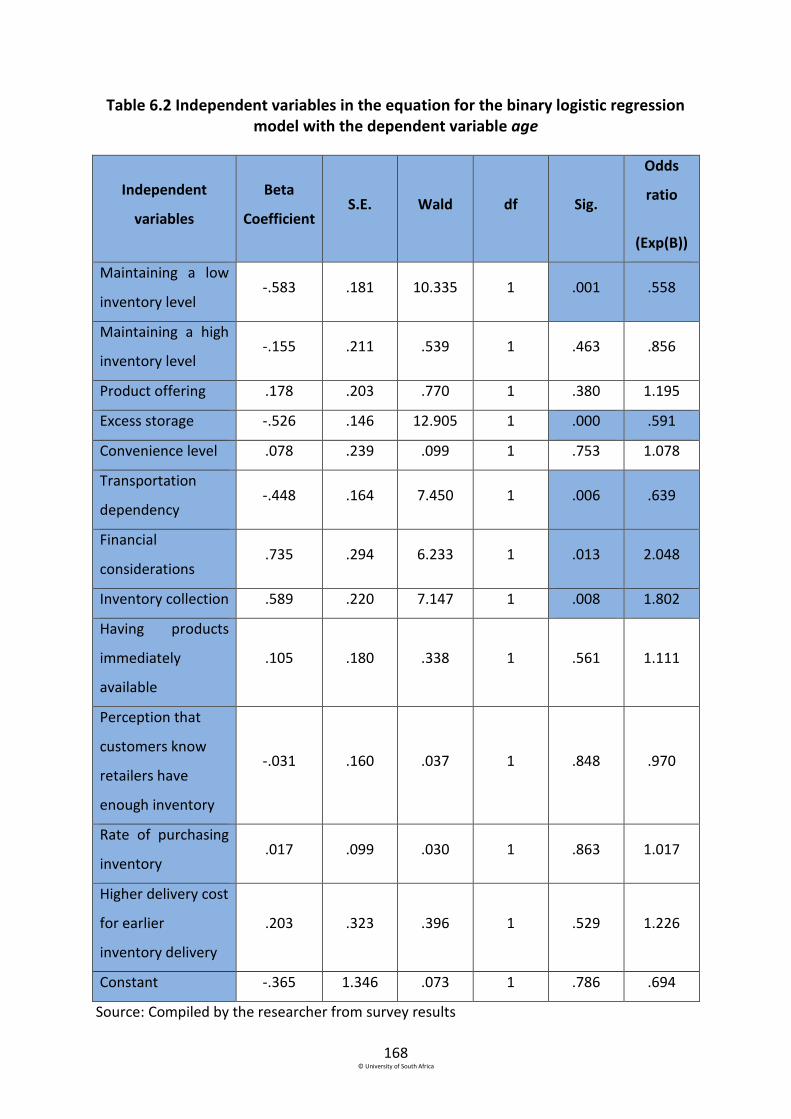
168 © University of South Africa
Table 6.2 Independent variables in the equation for the binary logistic regression model with the dependent variable age
Independent
variables
Beta
Coefficient S.E. Wald df Sig.
Odds
ratio
(Exp(B))
Maintaining a low
inventory level -.583 .181 10.335 1 .001 .558
Maintaining a high
inventory level -.155 .211 .539 1 .463 .856
Product offering .178 .203 .770 1 .380 1.195
Excess storage -.526 .146 12.905 1 .000 .591
Convenience level .078 .239 .099 1 .753 1.078
Transportation
dependency -.448 .164 7.450 1 .006 .639
Financial
considerations .735 .294 6.233 1 .013 2.048
Inventory collection .589 .220 7.147 1 .008 1.802
Having products
immediately
available
.105 .180 .338 1 .561 1.111
Perception that
customers know
retailers have
enough inventory
-.031 .160 .037 1 .848 .970
Rate of purchasing
inventory .017 .099 .030 1 .863 1.017
Higher delivery cost
for earlier
inventory delivery
.203 .323 .396 1 .529 1.226
Constant -.365 1.346 .073 1 .786 .694
Source: Compiled by the researcher from survey results
169 © University of South Africa
The results indicated that the following independent variables are statistically significant
predictors (at the 5% level of significance), for the age of the business: maintaining a low
inventory level; excess storage; transportation dependency; financial considerations; and
inventory collection. Having allowed for the other variables in the equation, the odds ratios
of the 12 independent variables further indicated that:
Each decrease in frequency of maintaining a low inventory level, increases the odds
of the business’ survival (survive beyond 5 years) by 79.2% ( 1
0.558 ).
Each decrease in the frequency of having excess storage, increases the odds of the
business’ survival (survive beyond 5 years) by 69.4% ( 1
0.59 ).
Each decrease in the frequency of transportation dependency, increases the odds of
the business’ survival (survive beyond 5 years) by 56.4% ( 1
0.639 ).
Each increase in the frequency of financial considerations, increases the odds of the
business’ survival (survive beyond 5 years) by 108.4% (2.084 – 1 x 100).
Each increase in the frequency of inventory collection, increases the odds of the
business’ survival (survive beyond 5 years) by 80.2% (1.802 – 1 x 100).
From the results of this binary logistic regression model, using age as the dependent
variable, it can be stated that:
A decrease in the frequency of the independent variables:
maintaining a low inventory levelEF25
excess storage EF26
transportation dependencyEF27
will increase the likelihood of the retailer’s survival (to survive beyond 5 years).
An increase in the frequency of the independent variables:
financial considerations EF28
inventory collection EF29
170 © University of South Africa
will increase the likelihood of the retailer’s survival (to survive beyond 5 years).
The results of the first binary logistic regression model indicated that the following
independent variables: maintaining a low inventory level; having excess storage;
transportation dependency; financial considerations; and inventory collection, are
statistically significant predictors of the age of the formal independent small retail
businesses.
6.4 Binary logistic regression with the dependent variable growth
In this section the results of the binary logistic regression model predicting the small
retailers’ survival in terms of growth is discussed. Before the results are discussed, the
following should be noted (as discussed in detail in section 4.3.7.2) regarding the validity
and reliability of the logistic regression model predicting the small retailers’ survival in terms
of growth:
The Hosmer and Lemeshow test indicated goodness of fit of the logistic regression
model with a p-value of 0.494. Therefore the model is assumed to be adequate.
The overall correct prediction classification improved from 74.2% (model 0 –
business income contracted or stayed the same) to 76.4% (model 1 - business
income grew over the past year) as seen in appendix C. Therefore, the results of the
binary logistic regression model with the dependent variable income growth over the
past year are discussed.
An odds ratio larger than 1 indicates that the independent variable increases the
small retailers’ odds of growing their income, whereas an odds ratio smaller than 1
indicates that the independent variable decreases their odds of growing their
income.
Table 6.3 provides the results of the 12 independent variables that were included in the
binary logistic regression model. Three independent variables were identified as statistically
significant predictors of the model (p-values ≤ 0.05) (highlighted in table 6.3). The odds
ratios of these three independent variables were considered in order to determine whether
the independent variables had a positive or negative influence on the dependent variable.
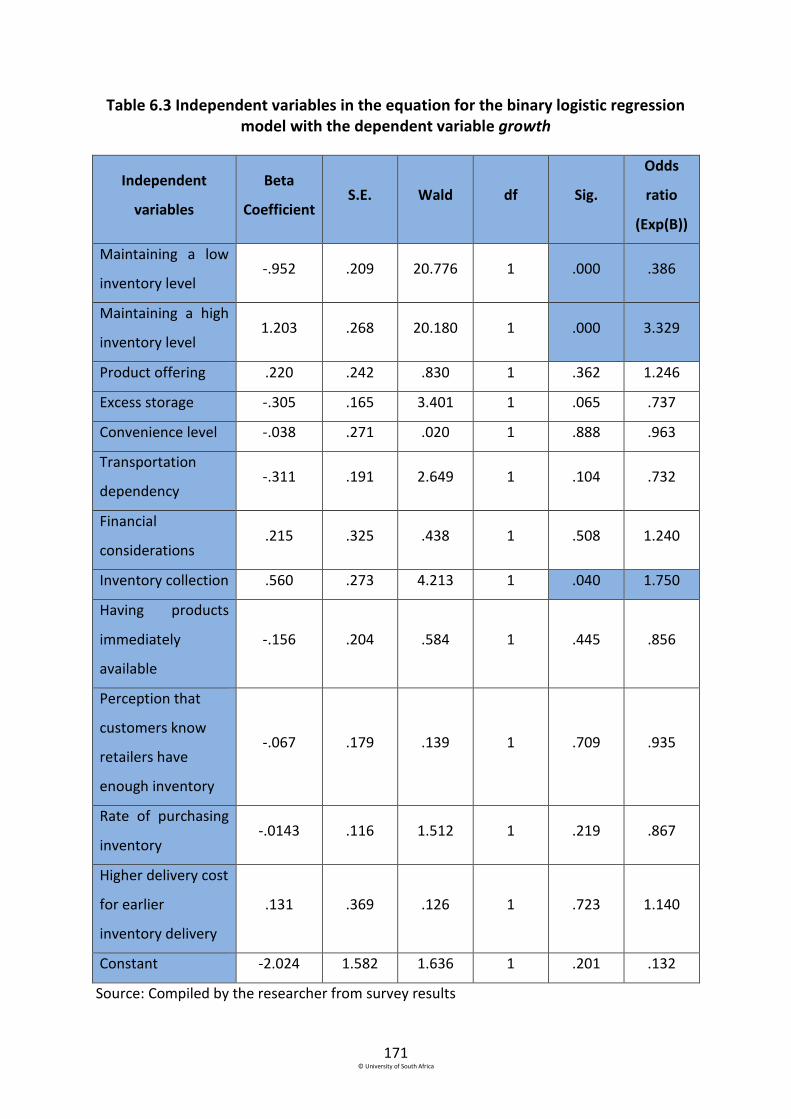
171 © University of South Africa
Table 6.3 Independent variables in the equation for the binary logistic regression model with the dependent variable growth
Independent
variables
Beta
Coefficient S.E. Wald df Sig.
Odds
ratio
(Exp(B))
Maintaining a low
inventory level -.952 .209 20.776 1 .000 .386
Maintaining a high
inventory level 1.203 .268 20.180 1 .000 3.329
Product offering .220 .242 .830 1 .362 1.246
Excess storage -.305 .165 3.401 1 .065 .737
Convenience level -.038 .271 .020 1 .888 .963
Transportation
dependency -.311 .191 2.649 1 .104 .732
Financial
considerations .215 .325 .438 1 .508 1.240
Inventory collection .560 .273 4.213 1 .040 1.750
Having products
immediately
available
-.156 .204 .584 1 .445 .856
Perception that
customers know
retailers have
enough inventory
-.067 .179 .139 1 .709 .935
Rate of purchasing
inventory -.0143 .116 1.512 1 .219 .867
Higher delivery cost
for earlier
inventory delivery
.131 .369 .126 1 .723 1.140
Constant -2.024 1.582 1.636 1 .201 .132
Source: Compiled by the researcher from survey results

172 © University of South Africa
The results indicated that the following independent variables are statistically significant
predictors, at the 5% level of significance, of the growth (in terms of income change
patterns) of the business: maintaining a low inventory level; maintaining a high inventory
level; and inventory collection. Having allowed for the other variables in the equation, the
odds ratios of the 12 independent variables further indicated that:
Each decrease in the frequency of maintaining a low inventory level, increases the
odds of the business’ survival (growing their income) by 159.07% ( 1
0.386 ).
Each increase in the frequency of maintaining a high inventory level, increases the
odds of the business’ survival (growing their income) by 232.9% (3.329 more likely).
Each increase in the frequency of inventory collection, increases the odds of the
business’ survival (growing their income) by 75% (1.750 more likely).
A decrease in the frequency of the independent variable:
maintaining a low inventory level EF30
will decrease the likelihood of the retailer’s survival (growing their income).
An increase in the frequency of the independent variables:
maintaining a high inventory level EF31
inventory collectionEF32
will increase the survival of the retailers (growing their income).
The results of the second binary logistic regression model indicated that the independent
variables: maintaining a low inventory level; maintaining a high inventory level and
inventory collection, are statistically significant predictors of the growth (in terms of income
change patterns) of the formal independent small retail businesses.

173 © University of South Africa
6.5 Conclusion
The purpose of this chapter was to determine whether the survival of the formal
independent small retail businesses could be predicted by using two binary logistic
regression models. The potential survival of the retailers was tested in terms of the age
(binary logistic regression model 1) and the income change patterns (binary logistic
regression model 2) of the businesses.
The set of independent variables consisted of all items related to the three logistical supply
chain drivers. Principal component analyses were conducted using principal component
extraction and varimax rotation to determine the factor structure of the items, in order to
reduce the number of independent variables for use in the binary logistic regression models.
Twelve independent variables were identified, consisting of 8 factors and 4 items.
The first binary logistic regression model that was developed included the 12 independent
variables with the dependent variable age. The results indicated that the following
independent variables: maintaining a low inventory level; having excess storage;
transportation dependency; financial considerations; and inventory collection, are
statistically significant predictors of the age of a business. The second binary logistic
regression model that was conducted included the 12 independent variables with the
dependent variable growth. The results indicated that the independent variables:
maintaining a low inventory level; maintaining a high inventory level; and inventory
collection, are statistically significant predictors of the growth (in terms of income change
patterns) of a business.
The literature findings in chapters 2 and 3, together with the results of the statistical
analyses (reported on in chapters 5 and 6), now allows for recommendations to be made on
how small retailers can improve their odds of survival by the management of the logistical
supply chain drivers (chapter 7). The two literature and eight empirical findings in chapter 6
are presented in the table below.
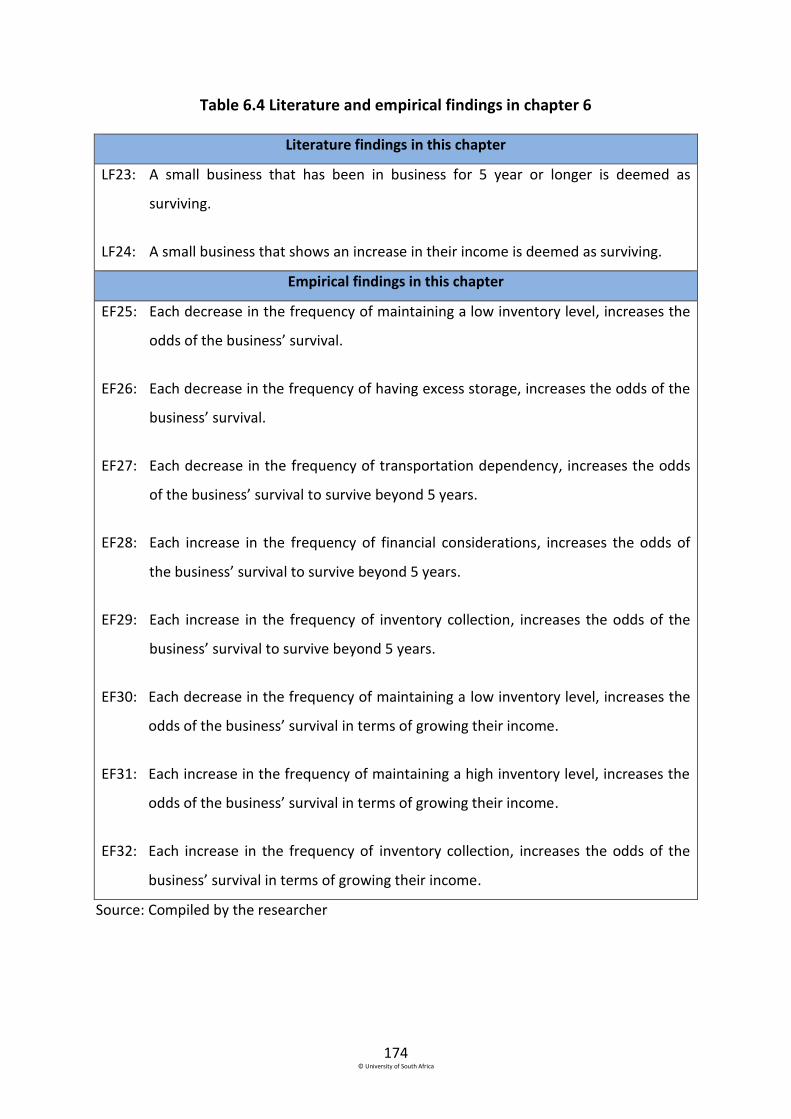
174 © University of South Africa
Table 6.4 Literature and empirical findings in chapter 6
Literature findings in this chapter
LF23: A small business that has been in business for 5 year or longer is deemed as
surviving.
LF24: A small business that shows an increase in their income is deemed as surviving.
Empirical findings in this chapter
EF25: Each decrease in the frequency of maintaining a low inventory level, increases the
odds of the business’ survival.
EF26: Each decrease in the frequency of having excess storage, increases the odds of the
business’ survival.
EF27: Each decrease in the frequency of transportation dependency, increases the odds
of the business’ survival to survive beyond 5 years.
EF28: Each increase in the frequency of financial considerations, increases the odds of
the business’ survival to survive beyond 5 years.
EF29: Each increase in the frequency of inventory collection, increases the odds of the
business’ survival to survive beyond 5 years.
EF30: Each decrease in the frequency of maintaining a low inventory level, increases the
odds of the business’ survival in terms of growing their income.
EF31: Each increase in the frequency of maintaining a high inventory level, increases the
odds of the business’ survival in terms of growing their income.
EF32: Each increase in the frequency of inventory collection, increases the odds of the
business’ survival in terms of growing their income.
Source: Compiled by the researcher
175 © University of South Africa
Chapter 7
Conclusions and recommendations
7.1 Introduction
The purpose of the final chapter is to draw conclusions on how the small retailers operating
within Soweto manage their three logistical supply chain drivers in terms of responsiveness
and cost-efficiency and to propose recommendations on the management of the three
logistical supply chain drivers by the small retailers in order to increase their odds of
survival. These conclusions and recommendations are based on the two literature chapters
(chapters 2 and 3), and the empirical research reported on in chapters 5 and 6. This chapter
is structured to first state the primary research problem and secondary research objectives
that were addressed in this study and then to focus on each chapter by identifying the
secondary research objective(s) addressed within the specific chapter and the steps taken to
address the secondary research objective(s) (see section 7.3). Conclusions and
recommendations for each secondary research objective are presented in section 7.4.
Thereafter, an overview of the entire study is provided in table 7.1. This will link the
secondary research objectives on the one hand with the questionnaire, the literature and
empirical findings, and the conclusions and recommendations on the other. The chapter is
concluded by listing the limitations that were faced in the study and identifying future
research opportunities.
7.2 The primary and secondary research objectives addressed in this study
Based on the discussion in chapter 1, which highlighted the drive of the Gauteng
Department of Economic Development to develop the economies of townships; the impact
of small businesses on the country’s economy and on its citizens; the lack of owners’
business skills; the low levels of entrepreneurial activities within townships; the low survival
rate of township businesses; as well as the need for developing and strengthening supply
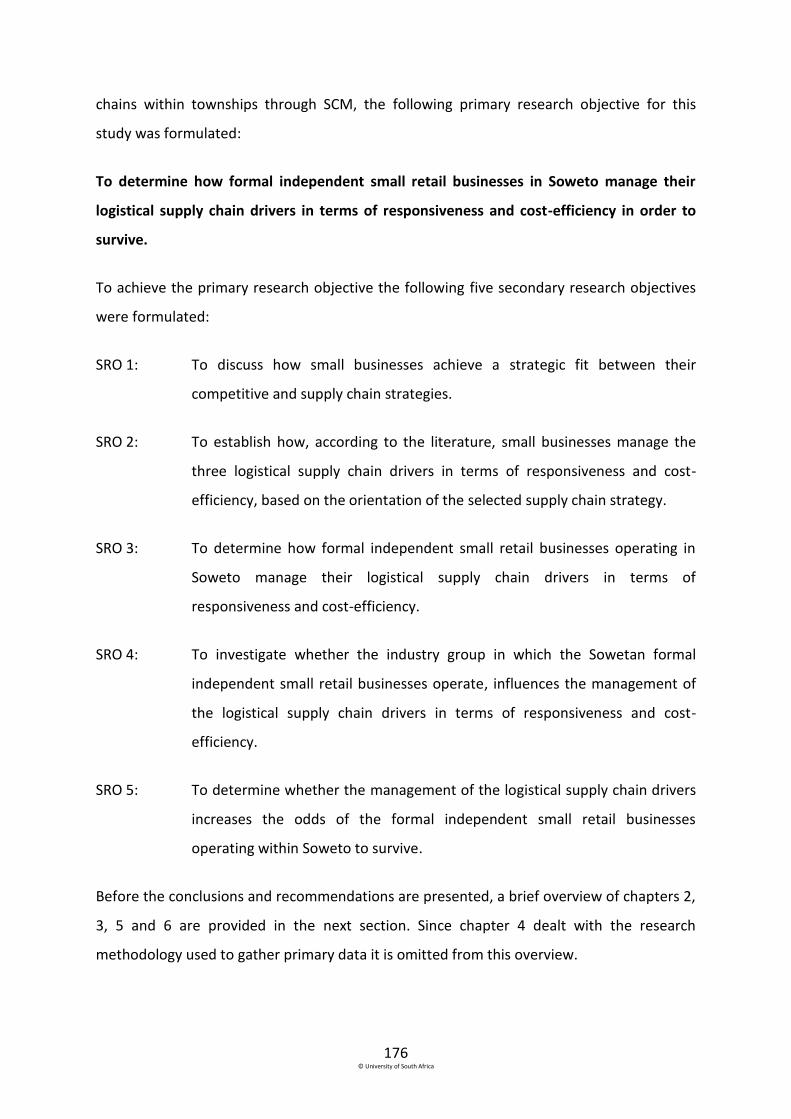
176 © University of South Africa
chains within townships through SCM, the following primary research objective for this
study was formulated:
To determine how formal independent small retail businesses in Soweto manage their
logistical supply chain drivers in terms of responsiveness and cost-efficiency in order to
survive.
To achieve the primary research objective the following five secondary research objectives
were formulated:
SRO 1: To discuss how small businesses achieve a strategic fit between their
competitive and supply chain strategies.
SRO 2: To establish how, according to the literature, small businesses manage the
three logistical supply chain drivers in terms of responsiveness and cost-
efficiency, based on the orientation of the selected supply chain strategy.
SRO 3: To determine how formal independent small retail businesses operating in
Soweto manage their logistical supply chain drivers in terms of
responsiveness and cost-efficiency.
SRO 4: To investigate whether the industry group in which the Sowetan formal
independent small retail businesses operate, influences the management of
the logistical supply chain drivers in terms of responsiveness and cost-
efficiency.
SRO 5: To determine whether the management of the logistical supply chain drivers
increases the odds of the formal independent small retail businesses
operating within Soweto to survive.
Before the conclusions and recommendations are presented, a brief overview of chapters 2,
3, 5 and 6 are provided in the next section. Since chapter 4 dealt with the research
methodology used to gather primary data it is omitted from this overview.

177 © University of South Africa
7.3 Overview of chapters 2, 3, 5 and 6
In the subsequent discussion a brief description of each chapter is provided, followed by the
secondary research objective(s) that were achieved in the specific chapter. The process that
was followed to reach the objective(s) is also outlined.
7.3.1 Chapter 2 – Selecting appropriate competitive and supply chain strategies
The purpose of chapter 2 was to provide a theoretical foundation in terms of the different
competitive and supply chain strategies that small businesses can select from. The first
secondary research objective (SRO1), namely to discuss how small businesses achieve a
strategic fit between their competitive and supply chain strategies, was addressed in this
chapter. In order to achieve this objective the researcher embarked on the following steps
to structure the process:
Determined how a strategic fit could be achieved between the competitive and
supply chain strategies.
Identified the different competitive strategies that small businesses can select from,
and considered the influence of each strategy on the level of responsiveness and
cost-efficiency.
Identified the different supply chain strategies that small businesses can select from,
and reviewed the orientation of each strategy in terms of responsiveness and cost-
efficiency.
Considered how different competitive and supply chain strategies should be aligned,
based on the goals of each strategy in terms of promoting either responsiveness or
cost-efficiency.
The literature review in chapter 2 provided eight literature findings, and these were
presented in table 2.4.
7.3.2 Chapter 3 – The logistical supply chain drivers
This chapter provided a literature overview of how the three logistical supply chain drivers
are managed within small businesses, specifically within townships businesses, based on the
178 © University of South Africa
orientation of the selected supply chain strategy. Each logistical supply chain driver was
discussed individually. Secondary research objective 2 (SRO2), namely to establish how,
according to the literature, small businesses manage the three logistical supply chain drivers
in terms of responsiveness and cost-efficiency, based on the orientation of the selected
supply chain strategy, was addressed in this chapter. The following main aspects were
identified in order to achieve secondary research objective 2:
Identified the different supply chain members within a simplified retail supply chain.
Provided an overview of the state of logistics within South Africa as a developing
country.
Established how the logistical function operates within a small retail business.
Identified and discussed the different components that managers or owners of
township businesses have to consider when managing the logistical supply chain
drivers, and consider the influence of these components on the retailers’ level of
responsiveness and cost-efficiency.
The fourteen literature findings from chapter 3 were presented in table 3.4.
7.3.3 Chapter 5 – Empirical findings on the logistical supply chain drivers
Chapter 5 presented the empirical findings which resulted from the statistical analyses
conducted on data related to the three logistical supply chain drivers. The purpose of this
chapter was to determine whether the formal independent small retail businesses operating
within Soweto manage their logistical supply chain drivers orientated towards
responsiveness or cost-effciency. Both descriptive and inferential analyses were conducted
on the data pertaining to each logistical supply chain driver. Descriptive analyses were
undertaken by generating frequency distributions and inferential analyses were conducted
by formulating hypotheses and testing these with the appropriate statistical tests.
Secondary research objectives 3 and 4 were adressed in this chapter: to determine how
formal independent small retail businesses operating in Soweto manage their logistical
supply chain drivers, in terms of responsiveness and cost-efficiency and to investigate
whether the industry group in which the Sowetan formal independent small retail businesses
operate, influences the management of the logistical supply chain drivers in terms of
179 © University of South Africa
responsiveness and cost-efficiency. In order to reach objectives 3 and 4, the following steps
were taken:
A detailed research plan was developed (in chapter 4) on how secondary research
objectives 3, 4 and 5 (discussed in section 7.3.4) were to be achieved. This included
identifying the sources from which data had to be gathered, the way in which the
data had to be gathered, as well as the statistical analyses that had to be conducted
in order to achieve these secondary objectives.
The data was entered into the statistical program SPSS (version 23) to perform the
different statistical analyses necessary in order to reach the empirical findings.
The analyses in chapter 5 resulted in twenty-four empirical findings and these were listed in
table 5.23.
7.3.4 Chapter 6 – Predicting the survival of Sowetan small retailers through binary logistic regression models
Chapter 6 was focused on determining whether the survival of formal independent small
retail businesses in Soweto could be predicted by using binary logistic regression models.
The first model aimed to determine the survival of the small retailers in terms of the age of
the business, whereas the second model aimed to determine the survival of the small
retailers in terms of the growth of their income. The secondary research objective 5 (SRO5),
namely to determine whether the management of the logistical supply chain drivers
increases the odds of the formal independent small retail businesses operating within
Soweto to survive, was considered in chapter 6. This chapter contributed two literature and
eight empirical findings and these were listed in table 6.4.
7.4 Conclusions and recommendations related to each secondary research
objective
The literature and empirical findings from chapters 2, 3, 5, and 6, form the basis for the
conclusions and recommendations in this section.

180 © University of South Africa
7.4.1 Secondary research objective 1
SRO1 - To discuss how small businesses achieve a strategic fit between their competitive
and supply chain strategies.
A strategic fit can be achieved when the goals of the selected competitive and supply chain
strategies are aligned (LF1). When selecting a competitive strategy small businesses will
benefit from competing in narrow target markets, as they are prevented from competing in
large markets, mainly due to their limited resources. Porter’s focus competitive strategy is
deemed as the most appropriate competitive strategy for small businesses, as this strategy
targets a narrow market (LF2). Furthermore, small businesses can select to compete with a
focus strategy within a narrow market, based on either differentiation or on low-cost. On
the one hand the focus differentiation competitive strategy is more suitable for innovative
products with uncertain customer demand, operating in an unstable and dynamic market
environment and serving less price-sensitive customers (LF3). On the other hand, a focus
low-cost competitive strategy is more suitable for functional products with certain customer
demand, operating in a stable and stationary market while serving price-sensitive customers
(LF4). Managers need to consider numerous factors when deciding on the orientation of
their supply chain strategy (LF6), and when deciding on the orientation of the entire supply
chain in which the small business operates (LF5). Depending on the decision regarding a
supply chain strategy orientated towards either responsiveness (LF7) or cost-efficiency
(LF8), the following can be concluded:
Conclusion 1.1: A responsive supply chain strategy is most suitable for a focus
differentiation competitive strategy and a cost-efficient supply chain strategy is most
suitable for a focus low-cost competitive strategy.
Based on the above conclusion from the literature, the following recommendations for
small retail businesses are made:
Recommendation 1.1: In order to compete effectively, small retail businesses should select
a focus competitive strategy.
181 © University of South Africa
Recommendation 1.2: If small retail businesses decide to compete with a focus
differentiation competitive strategy, they should select a supply chain strategy orientated
towards responsiveness to ensure a strategic fit.
Recommendation 1.3: If small retail businesses decide to compete with a focus low-cost
competitive strategy, they should select a supply chain strategy orientated towards cost-
efficiency to ensure a strategic fit.
7.4.2 Secondary research objectives 2 and 3
In this section two secondary research objectives are discussed, namely SRO2 and SRO3.
Both these objectives are referred to in this discussion since they deal with the management
of the three logistical supply chain drivers, in terms of responsiveness and cost-efficiency.
The discussion is structured to consider each logistical supply chain driver in terms of the
management of the driver by a small business, based on the orientation of the selected
supply chain strategy (according to the literature findings), as well as how the small retailers
in this study manage the specific logistical supply chain driver (according to the empirical
findings). SRO2 and SRO3 are:
SRO2 - To establish how, according to the literature, small businesses manage the three
logistical supply chain drivers in terms of responsiveness and cost-efficiency, based on the
orientation of the selected supply chain strategy.
SRO3 - To determine how formal independent small retail businesses operating in Soweto
manage their logistical supply chain drivers in terms of responsiveness and cost-efficiency.
The three logistical supply chain drivers were identified as facilities, inventory and
transportation. Although small businesses differ from larger businesses in numerous ways,
they face the same logistical challenges (LF9).
182 © University of South Africa
7.4.2.1 Facilities as a logistical supply chain driver
Facilities as a logistical supply chain driver must be managed according to the orientation
decided upon for the business’ supply chain strategy. When small businesses design an
appropriate facility network they should consider the function, location and capacity of the
facility; as this can result in reduced costs or lead-times and so be a source of competitive
advantage. When facilities are managed responsively, a small retailer will have excess
capacity available (at a storage facility or at the retail premises) to store excess inventory
and a small retailer who renders a service will have excess space to hire additional staff and
so to reduce lead-times (LF13a, LF13b). The majority of participants in this study, not only
have excess capacity within their facilities to store additional inventory, but also ensure that
they can access their excess inventory quickly and easily (EF1d, EF1e). These small retailers
can be considered fortunate, as a general lack of retail space exists within townships and
retailers generally find it difficult to obtain facilities from which to operate their businesses
(LF12). The majority of small retailers in this study prefer to have facilities close to their
customers or close to public transport (EF1a, EF1b), in order to increase the number of
customers that they can serve. This confirms that when implementing a decentralised
facility system, retailers can increase their level of responsiveness (LF13c, LF13d).
Additionally, the majority of small retailers in this study strive to provide customers with a
fast checkout, which increases the rate at which they can assist customers and meet their
demands; ultimately leading to an increase in responsiveness (EF1c, LF13e). In contrast,
when facilities are managed cost-efficiently, small retailers usually have a facility with
limited capacity (at a storage facility or at the retailer’s premises) since limited or no excess
inventory is purchased. In the case of a service retailer, additional staff is not hired to
reduce lead-times as it would increase costs (LF14a, LF14b, LF14c, LF14e). A cost-efficient
facility is usually centralised and is therefore not necessarily located close to customers
(LF14d).
Conclusion 2.1: The majority of small retailers in this study manage facilities responsively as
they have excess capacity available within their facilities and they operate decentralised
facility systems. These small retailers also increase their level of responsiveness by providing
customers with a fast checkout.
183 © University of South Africa
Recommendation 2.1: If Sowetan small retailers are orientated towards managing their
facilities responsively, based on the selected supply chain strategy, they should consider the
following: opening further outlets at different locations to increase the number of
customers that they can serve; increasing their facilities’ capacity to store more excess
inventory; hiring additional staff to reduce lead-times; and increasing the rate at which
customers are served by providing a faster checkout.
Recommendation 2.2: If Sowetan small retailers prefer to manage their facilities orientated
towards cost-efficiency, based on the selected supply chain strategy, they should reduce the
excess capacity at their facilities; implement a centralised facility system to decrease costs,
such as facility and transportation costs; and not hire additional staff to reduce lead-times.
7.4.2.2 Inventory as a logistical supply chain driver
The orientation of the selected supply chain strategy will determine whether inventory is
managed more responsively or more cost-efficiently. Since inventory can be the most
expensive asset in many businesses, it should be managed with caution. The different
components that small business managers should consider when managing inventory are
the amount of cycle, safety and seasonal inventory to carry, as well as the frequency of
purchasing these inventory items. The majority of retailers in this study purchase inventory
on a daily or weekly basis (EF6b); which is more often than other retailers operating within
townships (who do so only every two weeks) (LF15). The research results show that the
majority of retailers in this study do not find it difficult to purchase inventory from suppliers
(EF6a), which is in line with retailers operating within other townships (LF16). Those in other
townships can also select from multiple suppliers from whom to purchase inventory (LF16).
The majority of retailers in this study purchase inventory from wholesalers (EF5).
When inventory is managed responsively, cycle inventory is purchased on a more frequent
basis (LF17a) to ensure that inventory levels are maintained at the small retailer’s preferred
level. Responsive retailers view having ample inventory as so important that they are willing
to pay for additional storage space to store their excess inventory (LF17d). The majority of
small retailers in this study purchase more inventory than they sell within a month (EF6c),
which confirms their focus on responsiveness (by holding large amounts of safety inventory)

184 © University of South Africa
(LF17b). This focus on responsiveness is further strengthened by the small retailers’ efforts
to make provision for fluctuating customer demand (LF17c; EF6e), especially when having
in-store sales (EF6d). Furthermore, the majority of participants in this study increases their
level of responsiveness by providing customers with a variety of products (EF6h) and by
viewing it as important that their customers know that they always have enough inventory
available (EF6g).
In contrast, when a small retailer decides to manage inventory cost-efficiently, cycle
inventory is purchased less often and in larger batches to save on, for example ordering
costs, or to gain the benefits of economies of scale (LF18a). The small retailers in this study
find it too expensive to purchase more inventory than they can sell within a month (EF7a)
and they use cost saving opportunities by purchasing more inventory when the supplier has
a sale (EF7b). Small retailers will generally purchase inventory from suppliers who offer the
lowest prices (LF18b). As cost-efficient retailers do not make provision for fluctuation in
customer demand, they hold small amounts of safety inventory (LF18d) and to increase
their level of cost-efficiency, they collaborate with other retailers in terms of purchasing
inventory in bulk (LF18c).
Conclusion 2.2: The majority of small retailers in this study manage inventory responsively
as they hold safety inventory and make provision for fluctuating customer demand. These
retailers also increase their level of responsiveness by holding a variety of products and by
striving to create the perception with their customers that they will always have enough
inventory available.
Recommendation 2.3: If Sowetan small retailers are orientated towards managing inventory
responsively, as stipulated by their selected supply chain strategy, they should consider
increasing the amount of safety or seasonal inventory, or they should increase the rate at
which they purchase cycle inventory, if at all feasible. This will allow them to always have
ample inventory readily available to customers.
Recommendation 2.4: If Sowetan small retailers are orientated towards managing inventory
cost-efficiently, depending on the orientation of the selected supply chain strategy, they
should reduce the amount of safety or seasonal inventory in order to minimise the amount
185 © University of South Africa
of money tied up in their inventory, or decrease the rate at which they purchase cycle
inventory. They should also collaborate with other retailers to order inventory in bulk and so
gain the advantage of economies of scale.
7.4.2.3 Transportation as a logistical supply chain driver
The majority of small businesses’ logistical costs consist of transportation costs (LF11) and
on average transportation can cost between R300 to R350 per trip (LF19). Some small
retailers find it too expensive to maintain their own transportation fleet and therefore use a
third-party logistic service provider for the transportation of their inventory (LF10).
Whether transportation is managed more responsively or more cost-efficiently depends on
the orientation of the selected supply chain strategy. When designing their transportation
networks, small businesses should consider the mode, as well as the route used, to
transport their inventory.
When transportation is managed responsively, inventory is transported directly from a
supplier to a small retailer using the fastest mode of transportation (LF21a, LF21b). The
small retailers in this study do not have inventory delivered directly to their stores by
suppliers (EF17a), but prefer to collect the inventory personally, using their own
transportation (EF17b). The focus on responsiveness by the retailers is strengthened by their
reluctance to wait longer for inventory in order to pay less for it (EF17d). Furthermore, these
retailers do not collaborate with others to collect inventory from suppliers (despite the
possible cost advantages) (EF17c).
In contrast, when transportation is managed cost-efficiently, the slowest and cheapest
mode of transportation is used (LF22c) and inventory is usually delivered to an intermediate
site, such as a distribution centre, in order to lower inbound transportation costs (LF22a).
Retailers in townships purchase large amounts of inventory to qualify for free delivery from
suppliers (LF20, LF22b), and this seems to be the main driving force behind small retailers in
this study having their suppliers deliver inventory directly to their stores (EF18a). In contrast
with the majority of retailers operating within other townships, the small retailers in this
186 © University of South Africa
study will rather use their own cars to collect inventory (LF20, EF18d) in order to increase
their level of cost-efficiency by not paying delivery costs to suppliers (EF18b).
The retailers in this study will also rather use a transportation opportunity, for example a
taxi, to collect inventory from suppliers (EF18e), as this may be less expensive than to pay
for delivery by a supplier. Even if the retailers in this study pay for delivery of inventory, they
are still not willing to pay a supplier more than a competing retailer to receive inventory
sooner (EF18f); which indicates that the cost of transportation outweighs the possible
advantage of having inventory sooner than a competitor.
Conclusion 2.3: The small retailers in this study manage transportation not solely focused on
either responsiveness or cost-efficiency.
Conclusion 2.4: The small retailers in this study who manage transportation orientated
towards responsiveness, do so by collecting inventory directly from suppliers and use their
own cars, and thereby ultimately increase their flexibility. These responsive retailers will not
make use of cost-saving opportunities if this will lead to a decrease in their level of
responsiveness.
Conclusion 2.5: The respondents who manage transportation orientated towards cost-
efficiency, do so in several ways. First, by ordering large amounts of inventory to qualify for
free delivery; secondly, they collect inventory by using their own cars; or thirdly, by using a
transportation opportunity to keep costs as low as possible. These cost-efficient retailers
will not make use of any transport opportunity that might lower their level of cost-
efficiency.
Recommendation 2.5: Considering conclusions 2.1 and 2.2, (that Sowetan small retailers
manage facilities and inventory orientated towards responsiveness as stipulated by the
selected supply chain strategy) this recommendation is that small businesses should also
manage transportation orientated towards responsiveness so that the three logistical supply
chain drivers are aligned.
Recommendation 2.6: If Sowetan small retailers are orientated towards managing
transportation responsively, to align the orientation of the three logistical supply chain

187 © University of South Africa
drivers, they should consider collaborating with a trustworthy fellow-retailer to increase the
frequency at which inventory is collected, or have inventory delivered directly to their stores
by suppliers.
7.4.3 Secondary research objective 4
The fourth secondary research objective addressed in this study was:
SRO4 - To investigate whether the industry group in which the Sowetan formal independent
small retail businesses operate, influences the management of the logistical supply chain
drivers in terms of responsiveness and cost-efficiency.
It was established that the industry in which small businesses operate, influences customer
demand; supply uncertainties; customer buying behaviour; and ultimately the orientation of
the supply chain strategy (LF6).
7.4.3.1 Influence of the industry group on the management of facilities
The industry in which the Sowetan small retailers operate, influences the management of
facilities in terms of having capacity to store excess inventory in stores, as well as being able
to access the excess inventory quickly and easily (EF2, EF3). Retail general stores tend to
manage facilities more responsively by having capacity to store excess inventory in stores,
and they can access excess inventory quickly and easily, more frequently than the other
industries (EF3). The industry in which the retailer operates also influences the management
of inventory in terms of how often inventory is purchased (EF8). Retail hardware stores tend
to purchase inventory less often than the other industry groups (EF9).
7.4.3.2 Influence of the industry group on the management of inventory
The management of inventory is influenced by the industry in which the Sowetan small
retailers operate, in terms of how frequently they can easily obtain more inventory from
their suppliers; purchase more inventory when such items are on sale at their suppliers; and
make provision for fluctuation in customer demand (EF10, EF11). Retail hardware stores
tend to obtain inventory more easily from suppliers than the other industries (EF12). Retail
188 © University of South Africa
general stores tend to purchase inventory more often when the inventory is on sale at
suppliers than the other industries (EF13). With regard to making provision for fluctuation in
customer demand, retail grocery stores tend to do so more frequently than the other
industries (EF14).
7.4.3.3 Influence of the industry group on the management of transportation
The industry in which the Sowetan small retailers operate, influences the management of
transportation in terms of how frequently they have inventory delivered directly to their
stores by suppliers; how frequently they collect inventory by using their own transportation;
and their willingness to wait longer to pay less for inventory (EF20). Retail hardware stores
have inventory delivered directly to their stores more frequently than the other industries
(EF21); whereas retail general stores tend to collect their inventory using their own
transportation more frequently than the other industry groups (EF22). The retail auto stores
are generally more willing to wait longer to pay less for their inventory than the other
industry groups (EF23).
Conclusion 3.1: The industry in which the Sowetan small retailers operate, influences their
orientation towards responsiveness and cost-efficiency with regard to how the three
logistical supply chain drivers are managed.
Recommendation 3.1: When Sowetan small retailers select an appropriate supply chain
strategy they should consider the industry in which they operate, since it will influence the
level of responsiveness and cost-efficiency at which the logistical supply chain drivers can be
managed.
7.4.4 Secondary research objective 5
The fifth secondary research objective addressed in this study was:
SRO5 - To determine whether the management of the logistical supply chain drivers
increases the odds of the formal independent small retail businesses operating within
Soweto to survive.

189 © University of South Africa
A small business that has been in operation for 5 years or longer; or a small business that
has shown an increase in income over the past year is deemed as surviving (LF23, LF24).
Formal independent small retailers operating within Soweto can increase their odds of
surviving beyond 5 years, by doing one or more of the following:
decrease how frequently they maintain a low inventory level (EF25)
decrease how frequently they have excess storage (EF26)
decrease how frequently they are transportation dependent (EF27)
increase how frequently they review their financial situation (EF28)
increase how frequently they collect inventory (EF29)
Sowetan formal independent small retail businesses can increase their odds of growing in
terms of income by acting to:
decrease how frequently they maintain a low inventory level (EF30)
increase how frequently they maintain a high inventory level (EF31)
increase how frequently they collect inventory (EF32).
Conclusion 4.1: The management of the three logistical supply chain drivers in terms of
their orientation, influences the Sowetan small retailers’ odds to survive beyond 5 years and
grow their income.
Recommendation 4.1: Should small Sowetan retailers aim to increase their odds of surviving
beyond 5 years, they should:
hold more inventory, or
decrease excess facility capacity, or
be less dependent on transportation opportunities and other retailers for the
transportation of their inventory, or
increase collection of inventory.
Recommendation 4.2: Should small Sowetan retailers aim to increase their odds of growing
their income, they should:
190 © University of South Africa
hold more inventory, and/or
increase frequency of inventory collection.
7.5 Linking secondary research objectives to questions in the
questionnaire, literature and empirical findings, conclusions and
recommendations
Table 7.1 illustrates the links between the five secondary research objectives and the
questions pertaining to the three logistical supply chain drivers in the questionnaire, the
literature and empirical findings made throughout the study, as well as the conclusions and
recommendations presented in this chapter.

191 © University of South Africa
Table 7.1 Linking the research objectives to the questionnaire, findings, conclusions and recommendations
Secondary research objectives
Questions in
the
questionnaire
Literature
findings
Empirical
findings Conclusions Recommendations
SRO1 - To discuss how small businesses
achieve a strategic fit between their
competitive and supply chain strategies.
Not applicable
LF1; LF2; LF3;
LF4; LF5; LF6;
LF7; LF8
Not applicable C1.1
R1.1
R1.2
R1.3
SRO 2 - To establish how, according to the
literature, small businesses manage the three
logistical supply chain drivers in terms of
responsiveness and cost-efficiency, based on
the orientation of the selected supply chain
strategy.
SRO3 - To determine how formal independent
small retail businesses operating in Soweto
manage their logistical supply chain drivers in
terms of responsiveness and cost-efficiency.
E11 j, k, m
E3 j ,k
E2
E3 a-h
E6 a, c
E11 a, c
D2
D3
LF12; LF13;
LF14 EF1 C2.1
R2.1
R2.2
LF15; LF16;
LF17; LF18 EF5; EF6; EF7 C2.2
R2.3
R2.4
LF10; LF11;
LF19; LF20;
LF21; LF22
EF17; EF18
C2.3
C2.4
C2.5
R2.5
R2.6
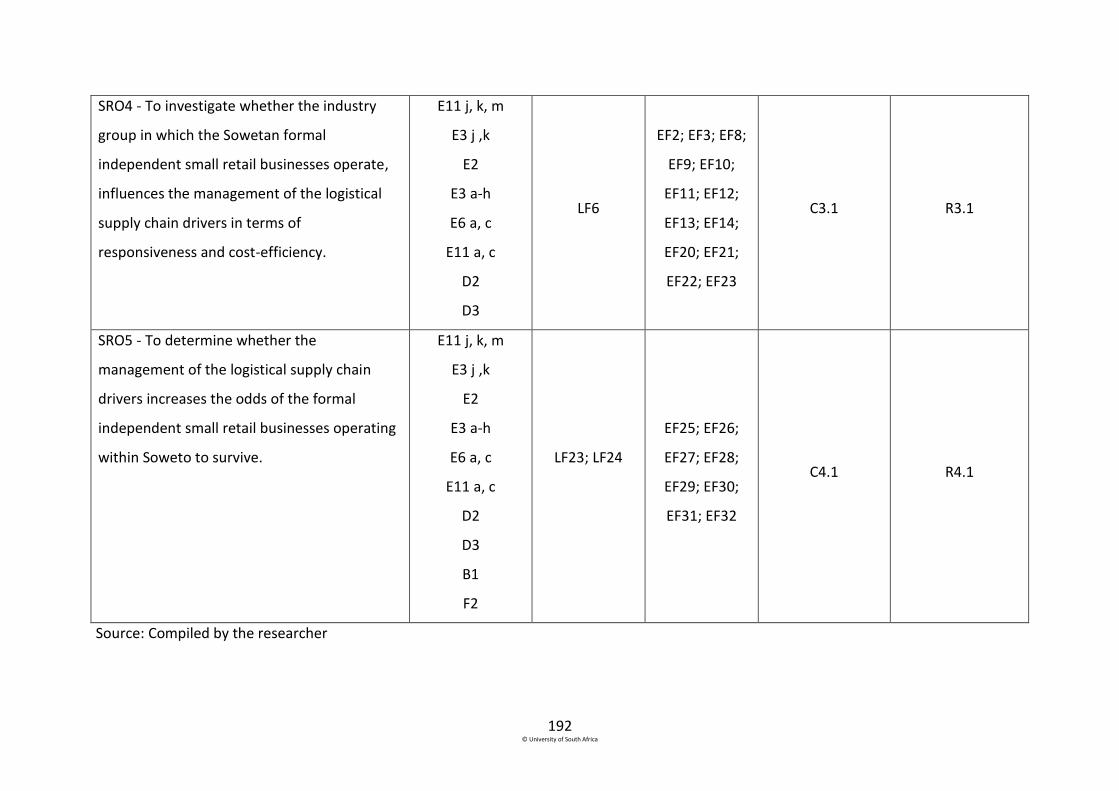
192 © University of South Africa
SRO4 - To investigate whether the industry
group in which the Sowetan formal
independent small retail businesses operate,
influences the management of the logistical
supply chain drivers in terms of
responsiveness and cost-efficiency.
E11 j, k, m
E3 j ,k
E2
E3 a-h
E6 a, c
E11 a, c
D2
D3
LF6
EF2; EF3; EF8;
EF9; EF10;
EF11; EF12;
EF13; EF14;
EF20; EF21;
EF22; EF23
C3.1
R3.1
SRO5 - To determine whether the
management of the logistical supply chain
drivers increases the odds of the formal
independent small retail businesses operating
within Soweto to survive.
E11 j, k, m
E3 j ,k
E2
E3 a-h
E6 a, c
E11 a, c
D2
D3
B1
F2
LF23; LF24
EF25; EF26;
EF27; EF28;
EF29; EF30;
EF31; EF32
C4.1 R4.1
Source: Compiled by the researcher

193 © University of South Africa
7.6 Limitations of the study
The following limitations in terms of this study were identified:
The respondents’ first language was not English, therefore fieldworkers had to assist
the respondents in completing the questionnaires.
As the study’s sample frame was based on the list of 650 formal independent small
businesses operating within the boundaries of Soweto compiled in 2012 by the BMR,
some of the retailers had since closed down and fieldworkers had to find others who
complied with the requirements for the 2014 study. In such cases the fieldworkers
found it time-consuming to identify other small retailers who both complied with the
requirement and who were willing to participate in the study.
Fieldworkers indicated that some owners or managers were not available when they
initially arrived at the shops, and they had to make appointments to return at later
times. Revisiting these small businesses was time-consuming and prolonged the
collection period.
As the study was conducted on a very specific sample (formal independent small
retail business operating within Soweto), the recommendations in section 7.4 cannot
be generalised to other small retail businesses in other townships.
The inclusion of questions related to other fields of business management resulted
in a very lengthy questionnaire that may have discouraged some business owners or
managers from participating in the study,
7.7 Future research identified
The following areas for future research were identified:
This research was conducted on the management of only three logistical supply
chain drivers by small retailers. Therefore, future research could focus on
determining how these retailers manage the three cross-functional supply chain
drivers (information, sourcing and pricing).
194 © University of South Africa
A longitudinal study could be conducted to determine whether the formal
independent small retail businesses operating within Soweto changed the
orientation of how they manage their logistical supply chain drivers over time; and if
so, how the changes influenced the survival of these small retailers.
The independent variables (identified in chapter 6) that positively influenced the age
and growth of the small retailers could be explored further to investigate how they
could be managed to increase the odds of survival of small retailers.
For comparison purposed, a similar study could be conducted on the management of
the three logistical supply chain drivers in different townships.
7.8 A final word
The primary research objective of this study was:
To determine how formal independent small retail businesses in Soweto manage their
logistical supply chain drivers in terms of responsiveness and cost-efficiency in order to
survive.
The three logistical supply chain drivers should be managed as a cohesive unit and should be
aligned with the orientation of the selected supply chain strategy, in terms of
responsiveness and cost-efficiency. It was established that formal independent small retail
businesses operating within the boundaries of Soweto mainly manage facilities and
inventory as logistical supply chain drivers, responsively. However, these small retailers
manage transportation as a logistical supply chain driver, not solely orientated towards
either responsiveness or cost-efficiency. As the orientation of the logistical supply chain
drivers influences the odds of survival for the formal independent small retail businesses
operating within Soweto, these small retailers should consider adapting their management
style to manage transportation more responsively, so that it aligns with the orientation of
the other two logistical supply chain drivers.
195 © University of South Africa
Bibliography
Abor, J. and Quartey, P. 2010. Issues in SME development in Ghana and South Africa. International Research Journal of Finance and Economics, 39:218-228.
Adeniran, T.V. and Johnston, K.A. 2012. Investigating the dynamic capabilities and competitive advantage of South African SMEs. African Journal of Business Management, 6(11):4088-4099.
Agustina, D., Lee, C.K.M. & Piplani, R. 2014. Vehicle scheduling and routing at a cross docking center for food supply chains. International Journal of Production Economics, 152:29-41.
Alfalla-Luque, R., Mendina-Lopez, C. & Dey, P.K. 2013. Supply chain integration framework using literature review. Production Planning and Control, 24(8-9):800-817.
Allison, P.D. 2014. Measures of fit for logistic regression. [Online] Available from: <https://support.sas.com/resources/papers/proceedings14/1485-2014.pdf> [Accessed: 16 May 2016].
Ambe, I. M. 2012. Determining an optimal supply chain strategy. Journal of Transport and Supply Chain Management, 6(1):126-147.
Aykan, E., Aksoylu, S. & Sönmez, E. 2013. Effects of support programs on corporate strategies of small and medium-sized enterprises. Procedia – Social and Behavioural Sciences, 99:938-946.
Babbie, E. 2016. The practice of social research. 14th ed. Boston: Cengage.
Baily, P., Farmer, D., Crocker, B., Jessop, D. & Jones, D. 2008. Procurement principles and management. 10th ed. Harlow, Essex: Financial Times, Prentice Hall.
Badenhorst, A. 2013. A framework for prioritising practices to overcome cost-related problems in reverse logistics. Journal of Transport and Supply Chain Management, 7(1):10 pages.
Badenhorst-Weiss, J.A. and Cilliers, J.O. 2014. Competitive advantage of independent small businesses in Soweto. Southern African Business Review, 18(3):1-21.
Badenhorst-Weiss, J. A., Cilliers, J. O. & Eicker, T. 2014. A unique market offering by formal independent retail and wholesale small businesses in Soweto township, South Africa. Problems and Perspectives in Management, 12(4):366-376.
Baker, P. and Canessa, M. 2009. Warehouse design: A structured approach. European Journal of Operational Research, 193(2):425-436.
196 © University of South Africa
Banker, R.D., Mashruwala, R. & Tripathy, A. 2014. Does a differentiation strategy lead to more sustainable financial performance than a cost strategy? Management Decisions, 52(5):872-896.
Barloworld Logistics. 2016. Supply chain foresight. Navigating smart. Drive tomorrow’s change today. [Online] Available from: http://www.barloworld-logistics.com/navigating-smart/[Accessed: 17 July 2016].
Berman, O. and Sapna, K.P. 2001. Optimal control of service for facilities holding inventory. Computers & Operations Research, 28(5):429-441.
Berman, O. and Sapna, K.P. 2002. Optimal service rates of a service facility with perishable inventory items. Naval Research Logistics (NRL), 49(5):464-482.
Borella, M.R.C. and Padula, A.D. 2010. Alignment between the supply, manufacturing and distribution strategies and the business strategy. Journal of Operations and Supply Chain Management, 3(2):44-60.
Bowersox, D.J., Closs, D.J., Cooper, M.B. & Bowersox, J.C. 2013. Supply chain logistics management. 4th ed. New York: McGraw-Hill Irwin.
Box, T.M. and Miller, W.D. 2011. Small-firm competitive strategy. Academy of Strategic Management, 10(1):55-60.
Bressler, M.S. 2012. How small businesses master the art of competition through superior competitive advantage. Journal of Management and Marketing Research, 11:2-9.
Burns, A.C. and Bush, R.F. 2003. Marketing research. Online research applications. 4th ed. Upper Saddle River, NJ: Pearson.
Burns, P. 2011. Entrepreneurship and small businesses; start-up, growth and maturity. 3rd ed. Basingstoke: Palgrave.
Celli, M. 2015. Are EU’s small and medium-sized entities familiar with economies of scale?: Response from the field. World Journal of Social Sciences, 5(3):101-109.
Chi, T., Kilduff, P.P. & Gargeya, V.B. 2009. Alignment between business environment characteristics, competitive priorities, supply chain structures, and firm business performance. International Journal of Productivity and Performance Management, 58(7):645-669.
Chopra, S. and Meindl, P. 2016. Supply chain management: Strategy, planning, and operation. 6th ed. Harlow, Essex: Pearson.
Christopher, M. 2011. Logistics & supply chain management. 4th ed. Harlow, Essex: Pearson.

197 © University of South Africa
Christopher, M. and Gattorna, J. 2005. Supply chain cost management and value-based pricing. Industrial Marketing Management, 34(2):115-121. Christopher, M. and Towill, D.R. 2002. Developing market specific supply chain strategies. The International Journal of Logistics Management, 13(1):1-14.
Chu, Z. 2012. Logistics and economic growth: a panel data approach. The Annals of Regional Science 49(1):1-16. [Online] Available from: <https://www.researchgate.net/publication/ 241035259_Logistics_and_economic_growth_A_panel_data_approach> [Accessed: 21 September 2014].
City of Johannesburg. 2005. Soweto retail strategy. [Online] Available from: <http://www.joburg.org.za/index.php?option=com_content&task=view&id=165&Itemid=125> [Accessed: 1 November 2013].
City of Johannesburg. 2008. The five year Soweto economic development plan 2008-2013. [Online] Available from: http://www.joburg.org.za/images/stories/2012/Sept/regiond.pdf [Accessed: 1 November 2013].
CSIR. 2014. 10th Annual State of Logistics survey for South Africa 2013. [Online] Available from: <http://www.csir.co.za/sol/> [Accessed: 15 November 2014].
Cooper, D.R. and Schindler, P.S. 2011. Business research methods. 11th ed. New York: McGraw-Hill.
Cooper, D.R. and Schindler, P.S. 2014. Business research methods. 12th ed. New York: McGraw-Hill.
Coyle, J.J., Langley, C.J., Novack, B.J. & Gibson, B.J. 2013. Managing supply chains. A logistics approach. 9th ed. Mason, OH: South-Western/Cengage.
Duarte, S. and Machado, V.C. 2011. Manufacturing paradigms in supply chain management. International Journal of Management Science and Engineering Management, 6(5):328-342.
Du Plessis, P.J., Strydom, J.W. and Jooste, C.J. 2012. Marketing management. 6th ed. Cape Town: Juta.
Ehlers, T. and Lazenby, K. 2010. Strategic management – Southern African concepts and cases. 3rd ed. Pretoria: Van Schaik. Ehrenthal, J.C.F., Honhon, D. & Van Woensel, T. 2014. Demand seasonality in retail inventory management. European Journal of Operational Research, 238(2):527-539.

198 © University of South Africa
Erasmus, B.J., Strydom, J.W. & Rudansky-Kloppers, S. 2013. Introduction to business management. 9th ed. Cape Town: Oxford.
Fawcett, S.E., Ellram, L.M. & Ogden, J.A. 2007. Supply chain management: From vision to implementation. 1st ed. Upper Saddle River, NJ: Pearson.
Fernie, J. and Sparks, L. 2014. Logistics and retail management. 4th ed. London: Kogan Page.
Fisher, M.L. 1997. What is the right supply chain for your product? Harvard Business Review, March-April:105-116.
Flint, D. J. and Golicic, S. L. 2009. Searching for competitive advantage through sustainability: A qualitative study in the New Zealand wine industry. International Journal of Physical Distribution & Logistics Management, 39(10):841-860.
Gattorna, J. 2003. Gower handbook of supply chain management. Hants, UK: Gower. Gattorna, J. 2010. Dynamic supply chains. Delivering value through people. 2nd ed. Harlow, UK: Financial Times, Prentice Hall.
Gauteng Department of Economic Development. 2014. Gauteng Department of Economic Development revitalisation strategy. [Online] Available from: <http://www.ecodev .gpg.gov.za/Documents/Draft%20GTER%20Strat.pdf> [Accessed: 23 January 2016].
Gauteng Quarterly Bulletin. 2012. The retail industry on the rise in South Africa. [Online] Available from: <http://www.treasury.gpg.gov.za/Documents/QB1%20The%20Retail%20 Industry%20on%20the%20Rise.pdf> [Accessed: 20 December 2015].
Gligor, D.M. and Holcomb, M.C. 2012. Understanding the role of logistics capabilities in achieving supply chain agility: A systematic literature review. Supply Chain Management: An International Journal, 17(4):438-453.
Goldsby, T.J., Iyengar, D. & Rao, S. 2014. The definitive guide to transportation: Principles, strategies, and decisions for the effective flow of goods and services. 1st ed. Upper Saddle River, NJ: Pearson.
Gonzállez-Benito, J. and Suárez-Gonzállez, I. 2010. A study of the role played by manufacturing strategic objectives and capabilities in understanding the relationship between Porter’s generic strategies and business performance. British Journal of Management, 21:1027-1043.
Grant, R. 2010. Working it out: Labour geographies of the poor in Soweto, South Africa. Development Southern Africa, 27(4):595–612.

199 © University of South Africa
Graungaard Pedersen, S., Zachariassen, F. & Stentoft Arlbjørn, J. (2012). Centralisation vs de-centralisation of warehousing: A small and medium-sized enterprise perspective. Journal of Small Business and Enterprise Development, 19(2):352-369.
Havenga, J. and Simpson, Z. 2014. Reducing national freight logistics costs risk in a high-oil-price environment: A South African case study. The International Journal of Logistics Management, 25(1):35-53.
Hasan, M.A., Sarkis, J. & Shankar, R. 2012. Agility and production flow layouts: An analytical decision analysis. Computers & Industrial Engineering, 62(4)898-907.
Hatten, T.S. 2012. Principles of small business management. 5th ed. Florence, US: South-Western/Cengage.
Hines, T. 2013. Supply chain strategies: Demand driven and customer focused. 2nd ed. New York: Routledge.
Hoejmose, S., Brammer, S. & Millington, A. 2012. An empirical examination of the relationship between business strategy and socially responsible supply chain management. International Journal of Operations & Production Management, 33(5):589-621.
Holter, A.R., Grant, D.B., Ritchie, J. & Shaw, N. 2008. A framework for purchasing transport services in small and medium size enterprises. International Journal of Physical Distribution & Logistics Management, 38(1):21-38.
Hong, P. and Jeong, J. 2006. Supply chain management practices of SMEs: from a business growth perspective. Journal of Enterprise Information Management, 19(3):292-302.
Horn, G., Badenhorst-Weiss, J.A., Cook G., Heckroodt, S., Howell, J., Phume, T. & Strydom, J. 2014. Supply chain management. A logistics approach. Cape Town: Oxford.
Hosmer, D.W. and Lemeshow, S. 2000. Applied logistic regression. 2nd ed. New York: Wiley.
Hsieh, Y.H. and Chen, H.M. 2011. Strategic fit among business competitive strategy, human resource strategy, and reward system. Academy of Strategic Management Journal, 10(2):11-32.
Hugo, W.M.J. and Badenhorst-Weiss, J.A. 2011. Purchasing & supply management. 6th ed. Pretoria: Van Schaik.
Hugos, M. 2006. Essentials of supply chain management. Hoboken, NJ: Wiley. Islam, D.M.Z., Meier, J.F., Aditjandra, P.T., Zunder, T.H. & Pace, G. 2013. Logistics and supply chain management. Research in Transportation Economics, 41(1):3-16.
200 © University of South Africa
Jooste, C.J., Strydom, J.W., Berndt, A. & Du Plessis, P.J. eds. 2012. Applied strategic marketing. 4th ed. Cape Town: Pearson. Kamath, N.B. and Roy, R. 2007. Capacity augmentation of a supply chain for a short lifecycle product: A system dynamics framework. European Journal of Operational Research, 179(2)334-351. Katz, J.A and Green, R.P. 2012. Entrepreneurial small businesses. 3rd ed. New York: McGraw-Hill. Kilic, H.S., Cebeci, U. & Ayhan, M.B. 2015. Reverse logistics system design for the waste of electrical and electronic equipment (WEEE) in Turkey. Resources, conservation and recycling, 95:120-132. Koh, S.C.L., Demirbag, M., Bayraktar, E., Tatoglu, E. & Zaim, S. 2007. The impact of supply chain management practices on performance of SMEs. Industrial Management and Data Systems, 107(1):103-124. Kotler, P. 1997. Marketing management: Analysis, planning, implementation and control. London: Prentice Hall.
Kotler, P., Burton, S., Deans, K., Brown. L. & Armstrong, G. 2013. Marketing. 9th ed. Frenchs Forest, Australia: Pearson,
Lai, K. and Cheng, T.C.E. 2003. Supply chain performance in transport logistics: An assessment by service providers. International Journal of Logistics Research and Applications: A Leading Journal of Supply Chain Management, 6(3):151-164.
Langley, C.J. (Jr), Coyle, J.J., Gibson, B.J., Novack, R.A. & Bardi, E.J. 2009. Managing supply chains: A logistics approach. 8th ed. Mason, OH: South-Western/Cengage.
Lawrence, A.S., Sivakumar, B. & Arivarignan, G. 2013. A perishable inventory system with service facility and finite source. Applied Mathematical Modelling, 37(7):4771-4786.
Lazenby, K. 2014. The strategic management process: A South African perspective. 1st ed. Pretoria: Van Schaik.
Lee, H.L. 2002. Aligning supply chain strategies with product uncertainties. California Management Review, 44(3):105-119.
Lee, K., Cho, H. & Jung, M. 2014. Simultaneous control of vehicle routing and inventory for dynamic inbound supply chain. Computers in industry, 65(6):1001-1008.
Leitner, K. H. and Güldenberg, S. 2010. Generic strategies and firm performance in SMEs: a longitudinal study of Austrian SMEs. Small Business Economics, 35(2):169-189.

201 © University of South Africa
Li & Fung Research Centre. 2008. China’s logistics industry. 2007-2008 China distributions and trading. [Online] Available from: <http://www.funggroup.com/eng/knowledge/ research/ china_dis_issue53.pdf> [Accessed: 18 July 2015]
Ligthelm, A.A. 2010. Entrepreneurship and small business sustainability. Southern African Business Review, 14(3):131-153.
Ligthelm, A.A. 2013. Confusion about entrepreneurship? Formal versus informal small businesses. Southern African Business Review, 17(3):57-75.
Liu, Z., Chen, L., Li, L. & Zhai, X. 2014. Risk hedging in a supply chain: Option vs. price discount. International Journal of Production Economics, 151:112-120.
Louw, L. and Venter, P. 2011. Strategic management: Developing sustainability in Southern Africa. 2nd ed. Cape Town: Oxford.
Management Study Guide. 2016. Secondary Data. [Online] Available from: <http://www.managementstudyguide.com/secondary_data.htm> [Accessed: 21 April 2016].
Martínez-Olvera, C. and Shunk, D. 2006. Comprehensive framework for the development of a supply chain strategy. International Journal of Production Research, 44(21):4511-4528. Marx, N. 2013. Online marketing communication tools used by guest houses in the Pretoria East region. Unpublished Master’s thesis. Pretoria: University of South Africa. [Online] Available from Oasis: http://oasis.unisa.ac.za/search~S1/?searchtype=t&searcharg=Online+ marketing+communication+tools+used+by+guest+houses+in+the+Pretoria+E&searchscope=1&SORT=D&extended=0&SUBMIT=Search&searchlimits=&searchorigarg=tnline+marketing+communication+tools+used+by+guest+houses+in+the+Pretoria+East+region.+> [Accessed: 29 June 2015].
Mason-Jones, R., Naylor, B. & Towill, D.R. 2000. Lean, agile or leagile? Matching your supply chain to the marketplace. International Journal of Production Research, 38(17):4061-4070. Mbonyane, B. and Ladzani, W. 2011. Factors that hinder the growth of small businesses in South African townships. European Business Review, 23(6):550-560.
Mentz, M.H. 2014. Developing a framework for relationship intention, satisfaction, loyalty and retention of SMEs in the business-to-business financing environment. Unpublished Doctoral thesis. Potchefstroom: North-West University.
Merschmann, U. and Thonemann, U.W. 2011. Supply chain flexibility, uncertainty and firm performance: An empirical analysis of German manufacturing firms. International Journal of Production Economics, 130(1):43-53.
Monczka, R.M., Handfield, R.B., Giunipero, L.C. & Patterson, J.L. 2016. Purchasing and supply chain management. 6th ed. Boston: Cengage.

202 © University of South Africa
Morita, M., Machuca, J.A., De los Ríos, J.L.P. & Flynn, E.J. 2015. Effects of supply chain strategy on product development. 22nd International Annual European Operations Management Association Conference (EurOMA), Switzerland. [Online] Available from: <http://www.euroma2015.org/euromapapers/papers/SCM-42_33226.pdf> [Accessed: 20 December 2015].
Nel, J.D. 2010. Developing a conceptual framework to analyse supply chain design practices. Unpublished Doctoral thesis. Pretoria: University of South Africa. [Online] Available from Oasis: http://oasis.unisa.ac.za/search~S16?/anel/anel/25%2C81%2C101%2CE/2exact&FF =anel+jacobus+daniel&1%2C2%2C> [Accessed: 17 February 2015].
Nichols, J. 2010. Transport and logistics companies for small businesses. [Online] Available from:<http://www.business.com/inventory-management/transportation-and-logistics companies-for-small-business/> [Accessed: 13 June 2015].
Njiro, E., Mazwai, T. & Urban, B. 2010. A situational analysis of small businesses and enterprises in the townships of the Gauteng province of South Africa. The First International Conference of the Centre for Small Business Development (University of Johannesburg), Soweto, 27-28 January 2010. [Online] Available from: https://www.uj.ac.za/faculties/humanities/Department-of-Social-Work/Documents/Intro _Njiro MazwaiUrban.pdf> [Accessed: 21 April 2016].
Nkosi, E., Bounds, M. & Goldman, G. 2013. Skills required for the black-owned small enterprise in Soweto. Acta Commercii, 13(1):10 pages.
Nwaogbe, O.R., Omoke, V., Ubani, E.C. & Ukaegbu, S.I. 2013. Cost minimisation of product transhipment for physical distribution management. Journal of Transport and Supply Chain Management, 7(1):9 pages.
Olawale, F. and Garwe, D. 2010. Obstacles to the growth of new SMEs in South Africa: A principal component analysis approach. African Journal of Business Management, 4(5):729-738.
Orfanos, V., Mylonakis, J. & Evripiotis, M. 2010. An evaluation of logistics determinates, business relationships and firms characteristics of the Greek small and medium enterprises. International Journal of Marketing Studies, 2(2):21-33.
Parnell, A.A. 2013. Uncertainty, generic strategy, strategic clarity, and performance of retail SMEs in Peru, Argentina, and the United States. Journal of Small Business Management, 51(2):215-234.
Petty, J.W., Palich, L.E., Hoy, F. & Longenecker, J.G. 2012. Managing small business: an entrepreneurial emphasis. 16th ed. Mason, OH: South-Western/Cengage.
Pienaar, W.J. and Vogt, J.J. 2012. Business logistics management: A value chain perspective. 4th ed. Cape Town: Oxford.
203 © University of South Africa
Porter, M. 1985. Competitive advantage: Creating and sustaining superior performance. New York: The Free Press.
Porter, M.E. 2008. Competitive advantage: Creating and sustaining superior performance. New York: The Free Press.
Quinlan, C., Babin, B., Carr, J., Griffin, M. & Zikmund, W.G. 2015. Business research methods. 1st ed. Hampshire: Cengage.
Qrunfleh, S. and Tarafdar, M. 2013. Lean and agile supply chain strategies and supply chain responsiveness: the role of strategic supplier partnership and postponement. Supply Chain Management: An International Journal, 18(6):571-582.
Rahimnia, F. and Moghadasian, M. 2010. Supply chain leagility in professional services: how to apply decoupling point concept in healthcare delivery system. Supply Chain Management: An International Journal, 15(1):80–91.
Richards, G. 2014. Warehouse management: A complete guide to improving efficiency and minimizing costs in the modern warehouse. 2nd ed. London: Kogan Page.
Rogerson, C.M. and Rogerson, J.M. 1997. The changing post-apartheid city: emergent black-owned small enterprises in Johannesburg. Urban Studies, 34(1):85-103.
Sachdeva, J.K. 2009. Business research methodology. 1st ed. Mumbai: Himalaya Publishing House.
Sakhuj, S. and Jain, V. 2012. Service supply chain: An integrated conceptual framework. CIE 42 Proceedings, 16-18 July 2012, Cape Town. [Online] Available from: <http://conferences.sun.ac.za/index.php/cie/cie-42/paper/viewFile/216/184> [Accessed: 14 July 2015].
Salavou, H. E. 2015. Competitive strategies and their shift to the future. European Business Review, 27(1):80-99.
Saunders, M., Lewis, P. & Thornhill, A. 2012. Research methods for business students. 6th ed. London: Prentice Hall.
Scarborough, N.M. 2011. Essentials of entrepreneurship and small business management. 6th ed. Upper Saddle River, NJ: Pearson Prentice Hall.
Scarborough, N.M., Wilson, D.L. & Zimmerer, T.W. 2009. Effective small business management: An entrepreneurial approach. 9th ed. Upper Saddle River, NJ: Pearson Prentice Hall
204 © University of South Africa
Schmitt, A.J., Sun, S.A., Snyder, L.V. & Shen, Z.J.M. 2015. Centralization versus decentralization: Risk pooling, risk diversification, and supply chain disruptions. Omega, 52:201-212.
Shaw, E.H. 2012. Marketing strategy. From the origin of the concept to the development of a conceptual framework. Journal of Historical Research in Marketing, 4(1):30-35.
Simchi-Levi, D., Kaminsky, P. & Simchi-Levi, E. 2003. Designing and managing the supply chain: Concepts, strategies and case studies. 2nd ed. Boston: McGraw-Hill.
Simon, A.T., Serio, L.C.D., Pires, S.R.I. & Martins, G.S. 2015. Evaluating supply chain management: A methodology based on a theoretical model. Revista de Administração Contemporânea, 19(1):26-44.
Soni, G. and Kodali, R. 2011. The strategic fit between “competitive strategy” and “supply chain strategy” in Indian manufacturing industry: an empirical approach. Measuring Business Excellence, 15(2):70-89.
Soinio, J., Tanskanen, K. & Finne, M. 2012. How logistics-service providers can develop value-added services for SMEs: a dyadic perspective. The International Journal of Logistics, 23(1):31-49.
South Africa. National Small Business Amendment Act of the Republic of South Africa. 2004. Pretoria Government Printer. (no. 29) [Online] Available from: https://www.thedti.gov.za/business_regulation/acts/small_business_amendment_act.pdf [Accessed: 17 April 2014].
South Africa. National Planning Commission. 2012. National development plan 2030. Our future – make it work. The Presidency: Pretoria
Stellenbosch University. 2015. Logistics barometer South Africa. [Online] Available from: <http://www.sun.ac.za/english/faculty/economy/logistics/Documents/Logistics%20Barometer/Logistics%20Barometer%202015.pdf> [Accessed: 21 September 2015].
Storsjö, I., Martins, A. L., & Zanoni, S. 2015. Leanness and agility in the judicial supply chain. 22nd International Annual European Operations Management Association Conference (EurOMA), Switzerland. [Online] Available from: <http://www. euroma2015.org/euromapapers/papers/PUB-01_32995.pdf> [Accessed: 20 December 2015].
Strydom, J.W. 2011. Retailing in disadvantaged communities: the outshopping phenomenon revisited. Journal of Contemporary Management, 8:150-172.
Strydom, J.W. 2013. Retail patronage of Sowetan consumers after 1994. African Journal of Business Management, 7(29):2863-2871.

205 © University of South Africa
Strydom, J.W. 2015. David against Goliath: Predicting the survival of formal small businesses in Soweto. International Business & Economics Research Journal, 14(3):463-476.
Strydom, J.W., Jooste, C.J. & Cant, M.C. 2002. Marketing management. Cape Town: Juta.
Su, H.C., Linderman, K., Schroeder, R.G. & Van de Ven, A.H. 2014. A comparative case study of sustaining quality as a competitive advantage. Journal of Operations Management, 32(7):429-445.
Surowiec, A. 2015. Supply chain management practices in SME sector. Research Papers of Wrocław University of Economics, 398:432-440.
Taylor, D.A. 2004. Supply chains: A manager’s guide. Boston: Addison-Wesley.
Teeratansirikool, L., Siengthai, S., Badir, Y. & Charoenngam, C. 2013. Competitive strategies and firm performance: the mediating role of performance measurement. International Journal of Productivity and Performance Management, 62(2):168-184.
Thompson, A.A., Gamble, J.E. & Strickland, A.J. 2004. Strategy: winning in the market place – core concepts, analytical tools, cases. 1st ed. Boston: McGraw-Hill Irwin.
Thompson, J. and Martin, F. 2010. Strategic management: awareness & change. 6th ed. Hampshire: South-Western.
Todaro, M.P. and Smith, S.C. 2006. Economic development. 9th ed. Harlow, Essex: Pearson.
Töyli, J., Häkkinen, L., Ojala, L. & Naula, T. 2008. Logistics and financial performance: An analysis of 424 Finnish small and medium-sized enterprises. International Journal of Physical Distribution & Logistics Management, 38(1):57-80.
Towill, D. and Christopher, M. 2002. The supply chain strategy conundrum: to be lean or agile or to be lean and agile? International Journal of Logistics Research and Applications, 5(3):299-309.
Tustin, D.H., Ligthelm, A.A., Martins, J.H. & Van Wyk, H. de J. 2005. Marketing research in practice. 1st ed. Pretoria: UNISA Press.
Tustin, D.H and Strydom, J.W. 2006. The potential impact of formal retail chains’ expansion strategies on retail township development in South Africa. Southern African Business Review, 10(3):48-66. University of South Africa. 2013. Policy on research ethics. [Online] Available from: <http://www.unisa.ac.za/research/news/wp-content/uploads/2014/06/Policy-on-Research-Ethics-rev-appr-Council-20.09.2013.pdf > [Accessed: 12 March 2016].
206 © University of South Africa
University of South Africa. 2015. The Bureau of Market Research. [Online] Available from: <http://www.unisa.ac.za/default.asp?Cmd=ViewContent&ContentID=2359country/south -africa> [Accessed: 15 July 2015].
Van Belle, J., Valckenaers, P. & Cattrysse, D. 2012. Cross-docking: State of the art. Omega, 40(6):827-846.
Van Zyl, L.E. 2014. Research methodology for the economic and management sciences. 1st
ed. Cape Town: Pearson.
Vincent, F.Y., Jewpanya, P. & Redi, A.P. 2016. Open vehicle routing problem with cross-docking. Computers & Industrial Engineering, 94:6-17.
Wagner, S.M., Grosse-Ruyken, P.T. & Erhun, F. 2012. The link between supply chain fit and financial performance of the firm. Journal of Operations Management, 30(01):340-353.
West, D., Ford, J. & Ibrahim, E. 2015. Strategic marketing: Creating competitive advantage. 3rd ed. Oxford: Oxford.
Wieland, A. and Wallenburg, C.M. 2012. Dealing with supply chain risks: Linking risk management practices and strategies to performance. International Journal of Physical Distribution & Logistics Management, 42(10):887-905.
Williams, T.A., Sweeney, D.J. & Anderson, D.R. 2006. Contemporary business statistics with Microsoft Excel. Mason, OH: Thompson South-Western.
Wisner, J.D., Tan, K.C. & Leong, G.K. 2016. Supply chain management: a balanced approach. 4rd ed. Boston: South-Western.
World Bank. 2014. Economics of South African townships: Special focus on Diepsloot. Washington, DC: The World Bank.
World Bank. 2015. New country classification. [Online] Available from: <http://data.worldbank.org/news/new-country-classifications-2015> [Accessed: 13 March 2015].
World Bank. 2016a. Logistics performance index. [Online] Available from: <http://lpi.worldbank.org/report> [Accessed: 8 June 2016].
World Bank. 2016b. New country classifications by income level. [Online] Available from: <http://data.worldbank.org/indicator/NY.GNP.PCAP.CD?locations=ZA> [Accessed: 13 March 2015]. Yu, W. and Egbelu, P.J. 2013. Development of dispatching strategy for inbound and outbound trucks in cross docking system. Journal of the Korea Safety Management and Science, 15(2):167-184.
207 © University of South Africa
Zhang, X. and Chen, R.A. 2006. Forecast-driven or customer-order-driven? An empirical analysis of the Chinese automotive industry. International Journal of Operations & Production Management, 26(6):668–688.
Zikmund, W.G. and Babin, B.J. 2010. Exploring marketing research. 10th ed. [Online] Available from: https://www.cengagebrain.co.uk/content/zikmund88614_0324788614 _02.01_chapter01.pdf> [Accessed: 16 July 2015].
Zikmund, W.G., Babin, B.J., Carr, J.C. & Griffin, M. 2013. Business research methods. Mason, OH: South-Western/Cengage.
Zondi, G.M. 2011. Investigating the social and economic effect of Jabulani and Maponya malls on the residents of Soweto. MBA dissertation. University of Stellenbosch: Stellenbosch.
Zowada, K. 2013. Business cooperation of logistic companies with small and medium enterprises – research report. Journal of Economics & Management, 12:112-120.
Zuraimi, A.A., Yaacob, M.R. & Ibrahim, M.D. 2013. Logistics development in Malaysia East coast region: Infrastructure, constraints and challenges. International Journal of Trade, Economics and Finance, 4(5):325-330.

208 © University of South Africa
Appendix A – Soweto 2014 Questionnaire
BUREAU OF MARKET RESEARCH CENTRE FOR BUSINESS MANAGEMENT
University of South Africa and
PULANE FIELDWORK AND DATA CONSULTANTS
PO Box 392 UNISA 0003
Tel : (012) 429-3228 Fax : (012) 429-2544
e-mail : [email protected]
2014 SMALL BUSINESS SURVEY: SOWETO
Questionnaire number 1 3
SECTION A: GENERAL INFORMATION
A1.1 Name and contact particulars
Name of business _________________________________________________
Business address _________________________________________________
_________________________________________________
Contact person: Name _________________________________________________
Telephone no _________________________________________________
E-mail _________________________________________________
A1.2
RESPONDENT INFORMED CONSENT TO PARTICIPATE IN THE SOWETO BUSINESS SURVEY
I, _____________________________________________________ (Name and Surname) am satisfied that I understand the aim and purpose of the study, what participation will involve, and that I can withdraw at any time. I therefore consent freely and voluntarily to participate in the study.
________________________________ ________________________________
(Signature of respondent) (Date)
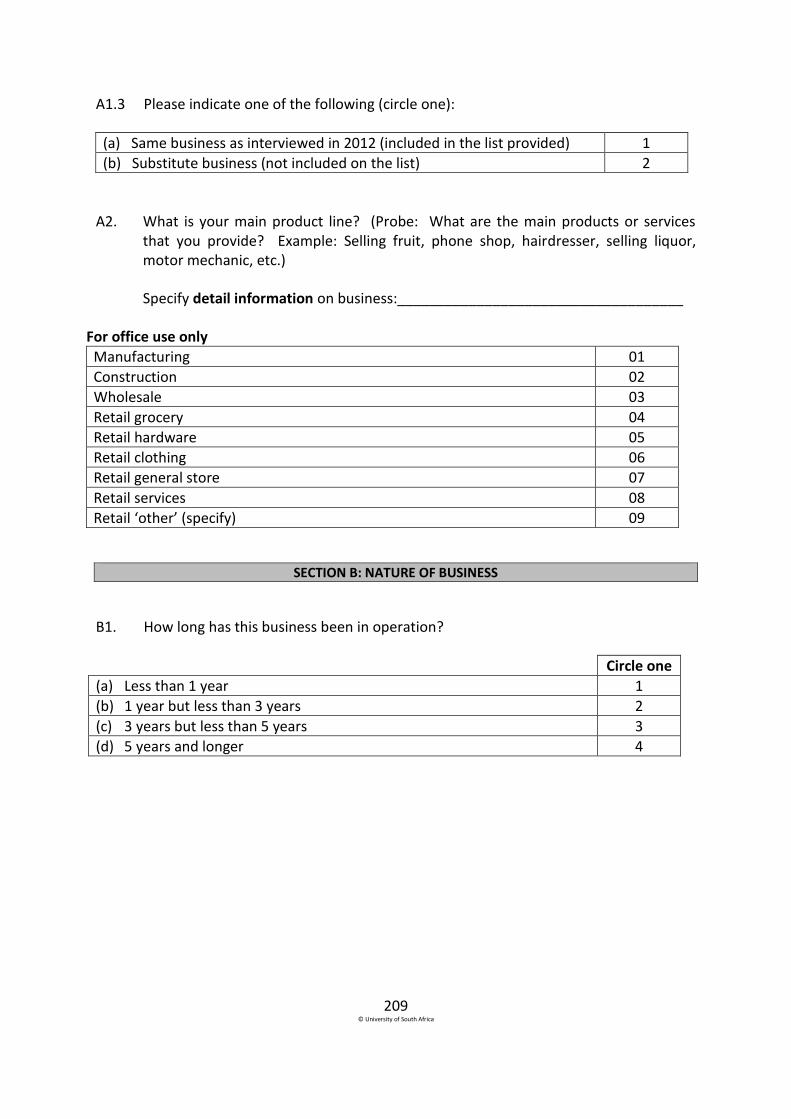
209 © University of South Africa
A1.3 Please indicate one of the following (circle one):
(a) Same business as interviewed in 2012 (included in the list provided) 1
(b) Substitute business (not included on the list) 2
A2. What is your main product line? (Probe: What are the main products or services that you provide? Example: Selling fruit, phone shop, hairdresser, selling liquor, motor mechanic, etc.)
Specify detail information on business:____________________________________
For office use only
Manufacturing 01
Construction 02
Wholesale 03
Retail grocery 04
Retail hardware 05
Retail clothing 06
Retail general store 07
Retail services 08
Retail ‘other’ (specify) 09
SECTION B: NATURE OF BUSINESS
B1. How long has this business been in operation?
Circle one
(a) Less than 1 year 1
(b) 1 year but less than 3 years 2
(c) 3 years but less than 5 years 3
(d) 5 years and longer 4

210 © University of South Africa
B2. What was the main reason for starting this business?
Circle one
(a) Was unemployed/no income 1
(b) Take over a family business 2
(c) To seize a business opportunity 3
(d) Supplement my income 4
(e) Other (specify):
5
B3. Do you run your business on a:
Circle one
(a) Full-time basis 1
(b) Part-time basis 2
B4. What is the status of your business?
Circle one
(a) Sole proprietor 1
(b) Partnership 2
(c) Co-operative 3
(d) CC – Close Corporation 4
(e) Pty Ltd 5
(f) Other (specify):
6
SECTION C: GEOGRAPHICAL LOCATION OF BUSINESS
C1. Please indicate the name of the nearest large shopping mall:
_____________________________________________________________
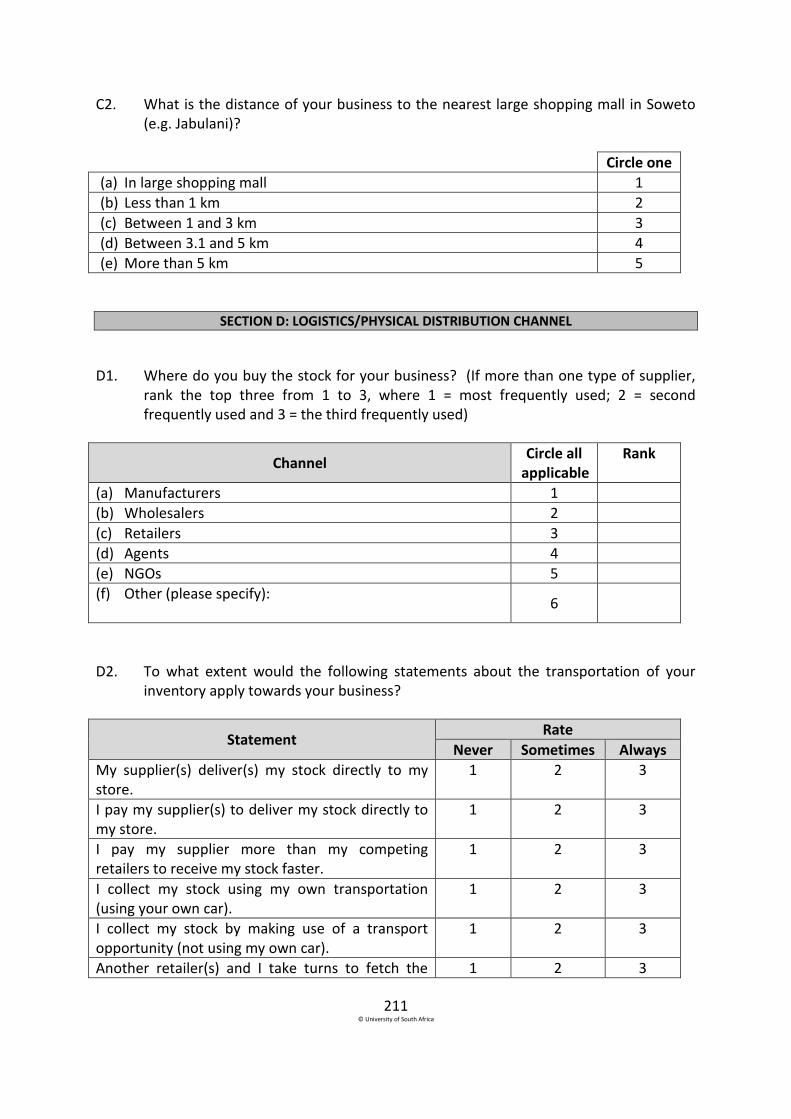
211 © University of South Africa
C2. What is the distance of your business to the nearest large shopping mall in Soweto (e.g. Jabulani)?
Circle one
(a) In large shopping mall 1
(b) Less than 1 km 2
(c) Between 1 and 3 km 3
(d) Between 3.1 and 5 km 4
(e) More than 5 km 5
SECTION D: LOGISTICS/PHYSICAL DISTRIBUTION CHANNEL
D1. Where do you buy the stock for your business? (If more than one type of supplier, rank the top three from 1 to 3, where 1 = most frequently used; 2 = second frequently used and 3 = the third frequently used)
Channel Circle all
applicable Rank
(a) Manufacturers 1
(b) Wholesalers 2
(c) Retailers 3
(d) Agents 4
(e) NGOs 5
(f) Other (please specify):
6
D2. To what extent would the following statements about the transportation of your inventory apply towards your business?
Statement Rate
Never Sometimes Always
My supplier(s) deliver(s) my stock directly to my store.
1 2 3
I pay my supplier(s) to deliver my stock directly to my store.
1 2 3
I pay my supplier more than my competing retailers to receive my stock faster.
1 2 3
I collect my stock using my own transportation (using your own car).
1 2 3
I collect my stock by making use of a transport opportunity (not using my own car).
1 2 3
Another retailer(s) and I take turns to fetch the 1 2 3

212 © University of South Africa
stock for both/all of our shops.
I am willing to wait longer to pay less for my stock 1 2 3
D3.1. Would you pay higher delivery costs if your suppliers can deliver your stock sooner than usual.
Circle one
Yes 1
No 2
D3.2. If yes, how much are you prepared to pay more towards your delivery costs, if it means that your stock will be delivered faster to your store?
1 2 3 4 5
Less than half Half More than half Double More than
double
SECTION E: INTERNAL OPERATIONS
Price E1. What is the main method to determine the selling price for your products/services?
Method Circle one
(a) Cost plus fixed percentage mark-up 1
(b) Competitive pricing (same as competitors) 2
(c) Variable pricing depending on time of day/month/season 3
(d) Other (please specify):
4
Inventory E2. How often, on average, do you purchase inventory?
Circle one
(a) Daily 1
(b) Weekly 2
(c) Monthly 3
(d) When I see my stock is low 4

213 © University of South Africa
E3. To what extent do you agree with the following statements about inventory in your business?
Statement Rate
Never Sometimes Always
I purchase less stock than what I sell within a month.
1 2 3
I purchase the exact amount of stock that I sell within a month.
1 2 3
I purchase more stock than what I sell within a month.
1 2 3
It is too expensive for me to purchase more stock than what I can sell within a month.
1 2 3
I can easily obtain more stock from my suppliers if I run out of stock.
1 2 3
I purchase more stock when it is on sale at my suppliers.
1 2 3
I purchase more stock when I have a sale in my store.
1 2 3
I make provision for the fluctuation in the demands from my customers (e.g. over Easter and Christmas).
1 2 3
I purchase more stock in order to save on my transportation costs.
1 2 3
I have the capacity to store excess stock in my store. 1 2 3
I can access my excess stock quickly and easily. 1 2 3
I would collaborate with one of my competitors to bargain for lower prices at suppliers.
1 2 3
Financial Planning E4. How do you remunerate yourself for work done for the business?
Remuneration Circle one
(a) Fixed monthly payment/salary 1
(b) Take money on daily/weekly basis out of cash register 2
(c) Do not make sufficient profit to take any money 3
(d) Other (please specify): 4
Marketing E5. Do you know your target market?
Circle one
Yes 1
No 2
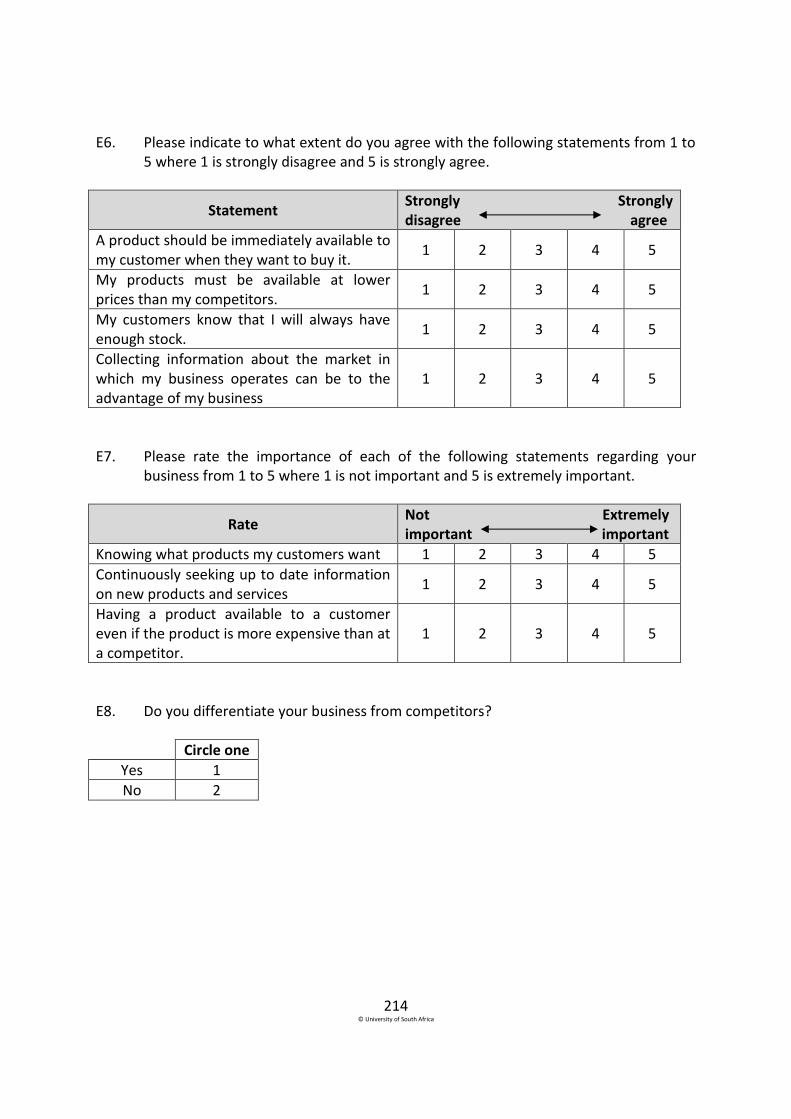
214 © University of South Africa
E6. Please indicate to what extent do you agree with the following statements from 1 to 5 where 1 is strongly disagree and 5 is strongly agree.
Statement Strongly Strongly disagree agree
A product should be immediately available to my customer when they want to buy it.
1 2 3 4 5
My products must be available at lower prices than my competitors.
1 2 3 4 5
My customers know that I will always have enough stock.
1 2 3 4 5
Collecting information about the market in which my business operates can be to the advantage of my business
1 2 3 4 5
E7. Please rate the importance of each of the following statements regarding your business from 1 to 5 where 1 is not important and 5 is extremely important.
Rate Not Extremely important important
Knowing what products my customers want 1 2 3 4 5
Continuously seeking up to date information on new products and services
1 2 3 4 5
Having a product available to a customer even if the product is more expensive than at a competitor.
1 2 3 4 5
E8. Do you differentiate your business from competitors?
Circle one
Yes 1
No 2
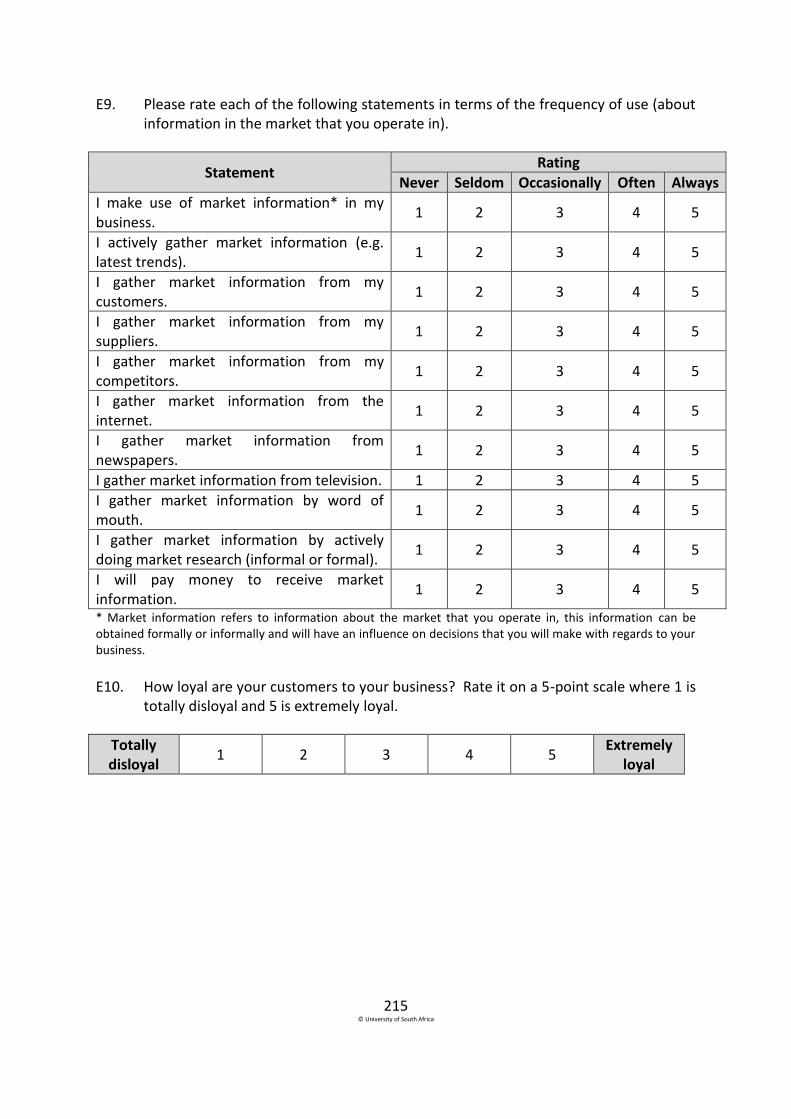
215 © University of South Africa
E9. Please rate each of the following statements in terms of the frequency of use (about information in the market that you operate in).
Statement Rating
Never Seldom Occasionally Often Always
I make use of market information* in my business.
1 2 3 4 5
I actively gather market information (e.g. latest trends).
1 2 3 4 5
I gather market information from my customers.
1 2 3 4 5
I gather market information from my suppliers.
1 2 3 4 5
I gather market information from my competitors.
1 2 3 4 5
I gather market information from the internet.
1 2 3 4 5
I gather market information from newspapers.
1 2 3 4 5
I gather market information from television. 1 2 3 4 5
I gather market information by word of mouth.
1 2 3 4 5
I gather market information by actively doing market research (informal or formal).
1 2 3 4 5
I will pay money to receive market information.
1 2 3 4 5
* Market information refers to information about the market that you operate in, this information can be obtained formally or informally and will have an influence on decisions that you will make with regards to your business.
E10. How loyal are your customers to your business? Rate it on a 5-point scale where 1 is totally disloyal and 5 is extremely loyal.
Totally disloyal
1 2 3 4 5 Extremely
loyal

216 © University of South Africa
E11. How important would you rate the following marketing aspects in your business on a 5-point scale where 1=very unimportant and 5=very important.
Marketing aspect Circle one in each row
Unimportant Very important
Product
(a) Quality products 1 2 3 4 5
(b) Best brands 1 2 3 4 5
(c) Enough product variety 1 2 3 4 5
Price
(d) Lowest prices in area 1 2 3 4 5
(e) Lower prices than my direct competitors 1 2 3 4 5
(f) Value for money (the price justifies the offer) 1 2 3 4 5
(g) Higher prices as indicator of higher quality 1 2 3 4 5
(h) Offer credit 1 2 3 4 5
(i) Offer lay-by 1 2 3 4 5
Place
(j) Near to customers 1 2 3 4 5
(k) Near to public transport 1 2 3 4 5
Promotion
(l) Appealing in-store appearance 1 2 3 4 5
(m) Fast checkout 1 2 3 4 5
(f) Advertise merchandise 1 2 3 4 5
(g) In-store promotions 1 2 3 4 5
(h) Seasonal promotions (Christmas) 1 2 3 4 5
Competition E12. To what extend do the following external variables influence the success of your
business (ie your business vitality)? Use a 5-point scale where is 1 not influenced at all and 5 is influenced to a large extent.
External variables
Not at all To a large extent
With a rating of 3 to 5 please indicate how
you deal with the influence
(a) Other small local competitors (excluding hawkers)
1 2 3 4 5
(b) Large retailers in shopping malls
1 2 3 4 5
(c) Foreign entrepreneurs 1 2 3 4 5
(d) Hawkers 1 2 3 4 5
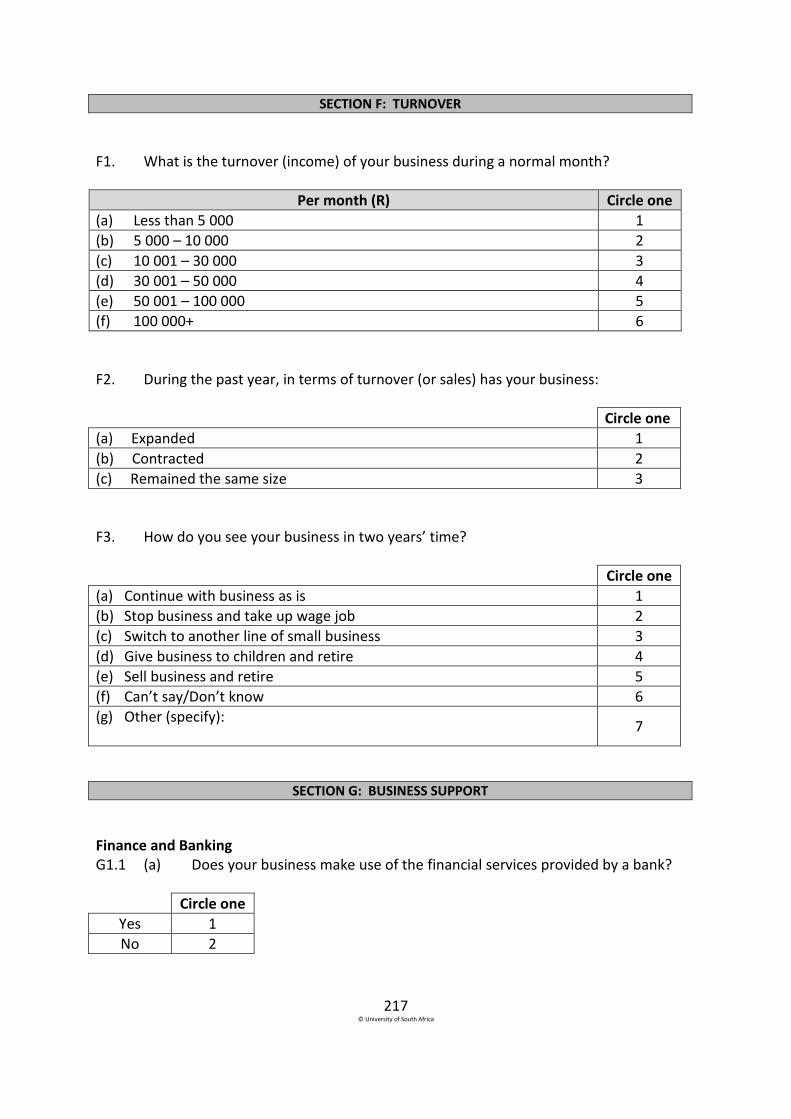
217 © University of South Africa
SECTION F: TURNOVER
F1. What is the turnover (income) of your business during a normal month?
Per month (R) Circle one
(a) Less than 5 000 1
(b) 5 000 – 10 000 2
(c) 10 001 – 30 000 3
(d) 30 001 – 50 000 4
(e) 50 001 – 100 000 5
(f) 100 000+ 6
F2. During the past year, in terms of turnover (or sales) has your business:
Circle one
(a) Expanded 1
(b) Contracted 2
(c) Remained the same size 3
F3. How do you see your business in two years’ time?
Circle one
(a) Continue with business as is 1
(b) Stop business and take up wage job 2
(c) Switch to another line of small business 3
(d) Give business to children and retire 4
(e) Sell business and retire 5
(f) Can’t say/Don’t know 6
(g) Other (specify):
7
SECTION G: BUSINESS SUPPORT
Finance and Banking G1.1 (a) Does your business make use of the financial services provided by a bank?
Circle one
Yes 1
No 2
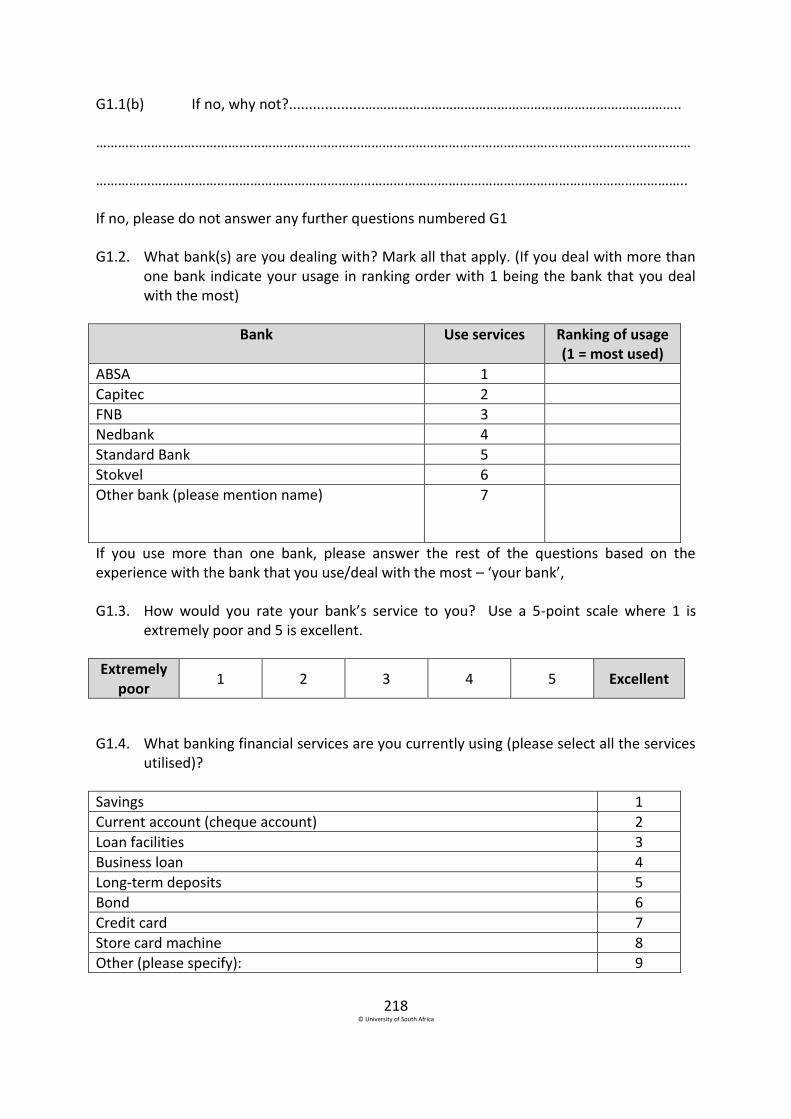
218 © University of South Africa
G1.1(b) If no, why not?...................…………………………………………………………………………..
………………………………………………………………………………………………………………………………………………
……………………………………………………………………………………………………………………………………………..
If no, please do not answer any further questions numbered G1
G1.2. What bank(s) are you dealing with? Mark all that apply. (If you deal with more than one bank indicate your usage in ranking order with 1 being the bank that you deal with the most)
Bank Use services Ranking of usage (1 = most used)
ABSA 1
Capitec 2
FNB 3
Nedbank 4
Standard Bank 5
Stokvel 6
Other bank (please mention name)
7
If you use more than one bank, please answer the rest of the questions based on the experience with the bank that you use/deal with the most – ‘your bank’,
G1.3. How would you rate your bank’s service to you? Use a 5-point scale where 1 is extremely poor and 5 is excellent.
Extremely poor
1 2 3 4 5 Excellent
G1.4. What banking financial services are you currently using (please select all the services utilised)?
Savings 1
Current account (cheque account) 2
Loan facilities 3
Business loan 4
Long-term deposits 5
Bond 6
Credit card 7
Store card machine 8
Other (please specify): 9
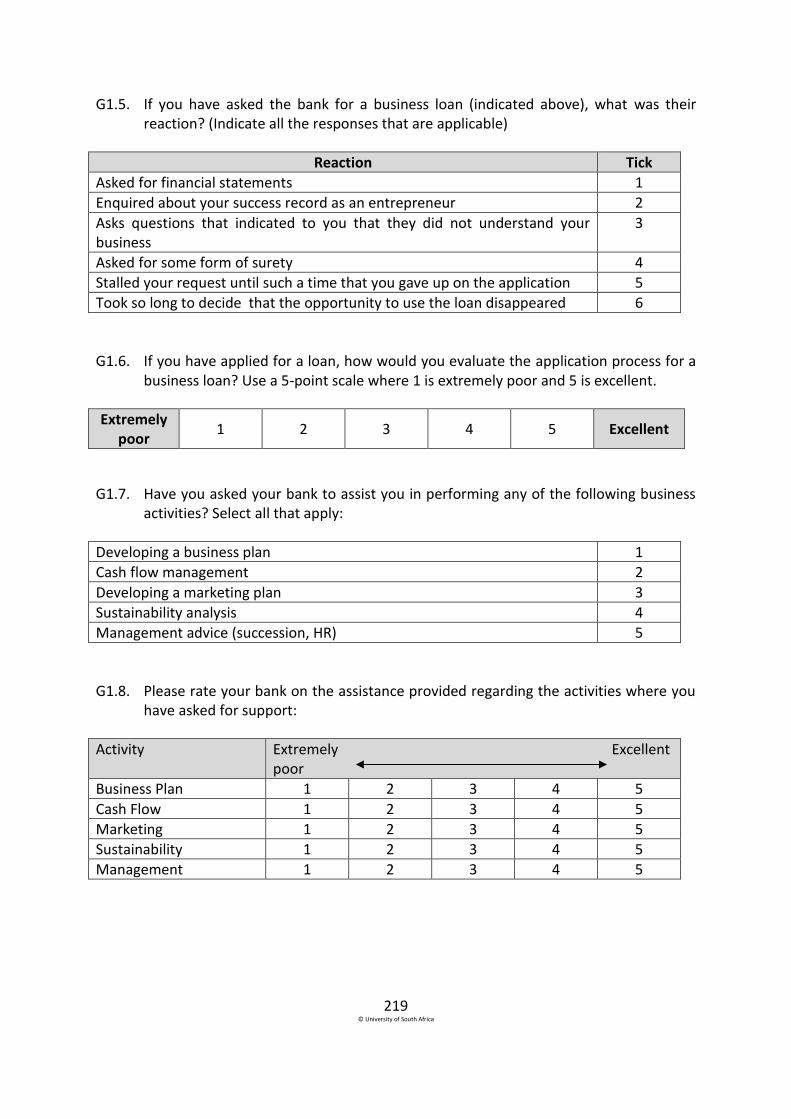
219 © University of South Africa
G1.5. If you have asked the bank for a business loan (indicated above), what was their reaction? (Indicate all the responses that are applicable)
Reaction Tick
Asked for financial statements 1
Enquired about your success record as an entrepreneur 2
Asks questions that indicated to you that they did not understand your business
3
Asked for some form of surety 4
Stalled your request until such a time that you gave up on the application 5
Took so long to decide that the opportunity to use the loan disappeared 6
G1.6. If you have applied for a loan, how would you evaluate the application process for a business loan? Use a 5-point scale where 1 is extremely poor and 5 is excellent.
Extremely poor
1 2 3 4 5 Excellent
G1.7. Have you asked your bank to assist you in performing any of the following business activities? Select all that apply:
Developing a business plan 1
Cash flow management 2
Developing a marketing plan 3
Sustainability analysis 4
Management advice (succession, HR) 5
G1.8. Please rate your bank on the assistance provided regarding the activities where you have asked for support:
Activity Extremely Excellent poor
Business Plan 1 2 3 4 5
Cash Flow 1 2 3 4 5
Marketing 1 2 3 4 5
Sustainability 1 2 3 4 5
Management 1 2 3 4 5

220 © University of South Africa
G1.9. To what extent will you recommend your bank’s services to another small business? Use a 5-point scale where is 1 never and 5 is definitely.
Never 1 2 3 4 5 Definitely
Support: Non-finance
G2. Indicate the single most important business support you need to improve your business (excluding finance)
Circle one
(a) Business skills training 1
(b) Marketing assistance 2
(c) Physical facilities (building structure, equipment, etc) 3
(d) Information 4
(e) Business planning assistance 5
(f) Other (specify):
6
SECTION H: LEVEL OF ENTREPRENEURSHIP
H1. Use a five-point scale to rate each of the following statements, where 1 signifies ‘strongly disagree’ with the statement and 5 signifies ‘strongly agree’ with the statement.
Statement
Circle one in each row Strongly disagree Strongly agree
(a) Operational entrepreneurship
(i) I completed a business plan prior to starting my business
1 2 3 4 5
(ii) I regularly update my business plan (once a year)
1 2 3 4 5
(iii) I have a marketing strategy for my business
1 2 3 4 5
(iv) I did a risk analysis prior to starting my business
1 2 3 4 5
(v) I analyse my competitors on a continuous basis
1 2 3 4 5
(vi) I have an operational plan for my business
1 2 3 4 5
(b) Innovative entrepreneurship
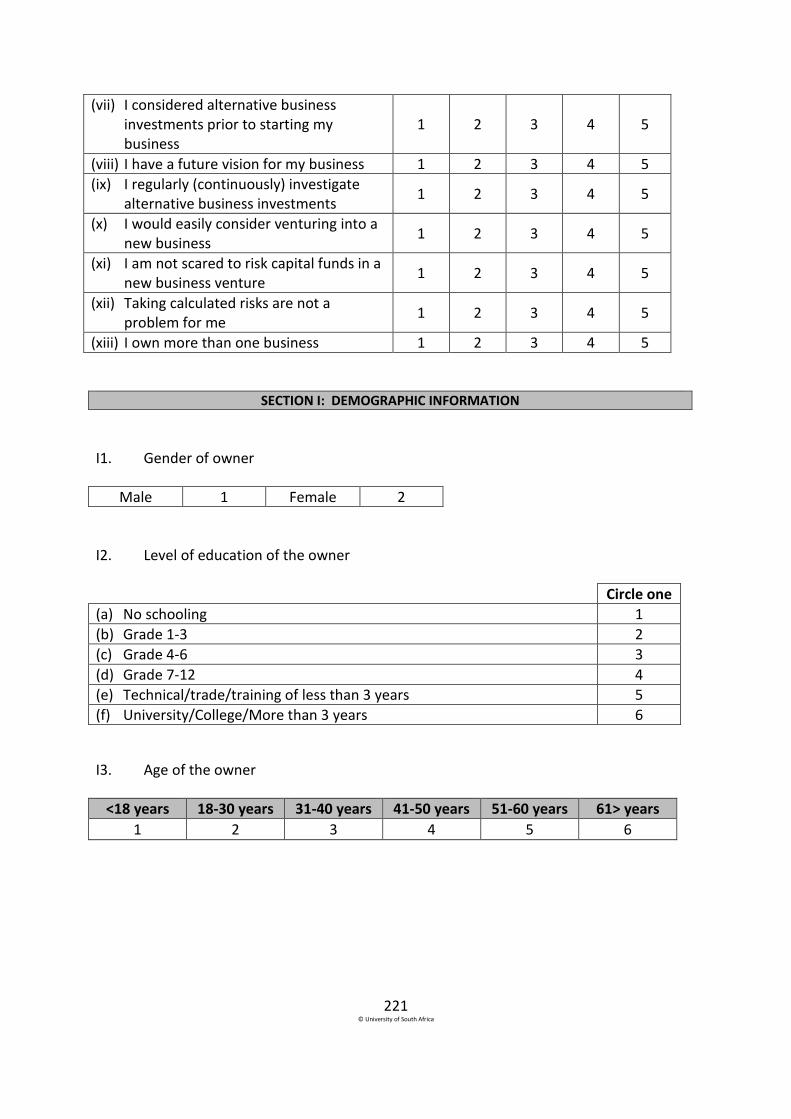
221 © University of South Africa
(vii) I considered alternative business investments prior to starting my business
1 2 3 4 5
(viii) I have a future vision for my business 1 2 3 4 5
(ix) I regularly (continuously) investigate alternative business investments
1 2 3 4 5
(x) I would easily consider venturing into a new business
1 2 3 4 5
(xi) I am not scared to risk capital funds in a new business venture
1 2 3 4 5
(xii) Taking calculated risks are not a problem for me
1 2 3 4 5
(xiii) I own more than one business 1 2 3 4 5
SECTION I: DEMOGRAPHIC INFORMATION
I1. Gender of owner
Male 1 Female 2
I2. Level of education of the owner
Circle one
(a) No schooling 1
(b) Grade 1-3 2
(c) Grade 4-6 3
(d) Grade 7-12 4
(e) Technical/trade/training of less than 3 years 5
(f) University/College/More than 3 years 6
I3. Age of the owner
<18 years 18-30 years 31-40 years 41-50 years 51-60 years 61> years
1 2 3 4 5 6
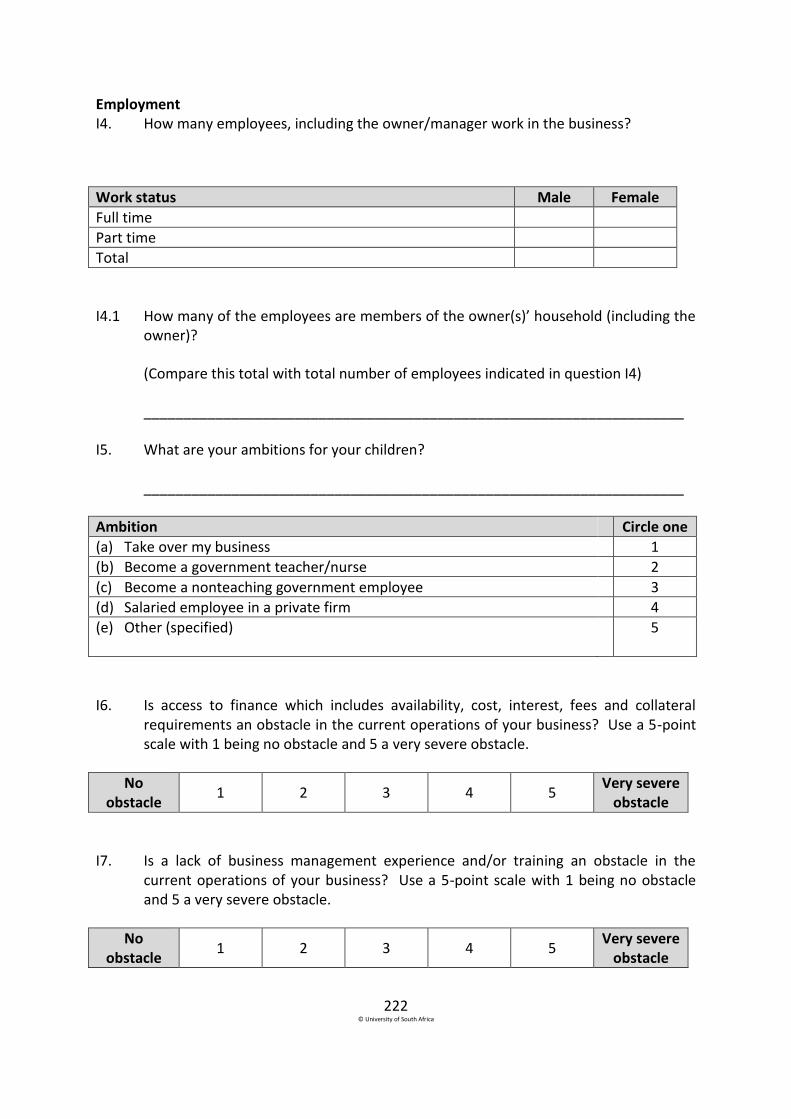
222 © University of South Africa
Employment I4. How many employees, including the owner/manager work in the business?
Work status Male Female
Full time
Part time
Total
I4.1 How many of the employees are members of the owner(s)’ household (including the owner)?
(Compare this total with total number of employees indicated in question I4)
____________________________________________________________________
I5. What are your ambitions for your children?
____________________________________________________________________
Ambition Circle one
(a) Take over my business 1
(b) Become a government teacher/nurse 2
(c) Become a nonteaching government employee 3
(d) Salaried employee in a private firm 4
(e) Other (specified)
5
I6. Is access to finance which includes availability, cost, interest, fees and collateral requirements an obstacle in the current operations of your business? Use a 5-point scale with 1 being no obstacle and 5 a very severe obstacle.
No obstacle
1 2 3 4 5 Very severe
obstacle
I7. Is a lack of business management experience and/or training an obstacle in the current operations of your business? Use a 5-point scale with 1 being no obstacle and 5 a very severe obstacle.
No obstacle
1 2 3 4 5 Very severe
obstacle
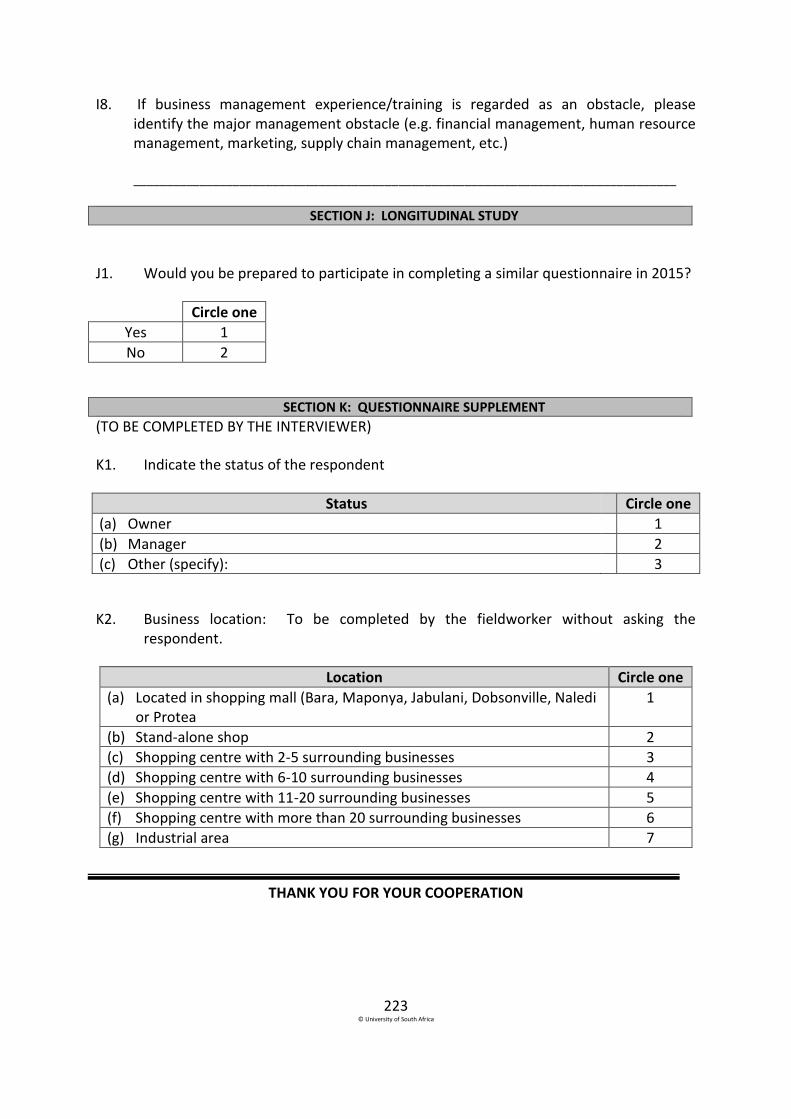
223 © University of South Africa
I8. If business management experience/training is regarded as an obstacle, please identify the major management obstacle (e.g. financial management, human resource management, marketing, supply chain management, etc.)
__________________________________________________________________________________
SECTION J: LONGITUDINAL STUDY
J1. Would you be prepared to participate in completing a similar questionnaire in 2015?
Circle one
Yes 1
No 2
SECTION K: QUESTIONNAIRE SUPPLEMENT (TO BE COMPLETED BY THE INTERVIEWER)
K1. Indicate the status of the respondent
Status Circle one
(a) Owner 1
(b) Manager 2
(c) Other (specify): 3
K2. Business location: To be completed by the fieldworker without asking the respondent.
Location Circle one
(a) Located in shopping mall (Bara, Maponya, Jabulani, Dobsonville, Naledi or Protea
1
(b) Stand-alone shop 2
(c) Shopping centre with 2-5 surrounding businesses 3
(d) Shopping centre with 6-10 surrounding businesses 4
(e) Shopping centre with 11-20 surrounding businesses 5
(f) Shopping centre with more than 20 surrounding businesses 6
(g) Industrial area 7
THANK YOU FOR YOUR COOPERATION

224 © University of South Africa
Appendix B - Ethical Clearance Certificate
225 © University of South Africa
Appendix C – SPSS Data Outputs
Please see attached CD for the SPSS Version 23 outputs.