the malate dehydrogenase laboratories …home.sandiego.edu/~josephprovost/mcc two substrate kinetics...
TRANSCRIPT

Malate Dehydrogenase Collaborative CUREs
Two Substrate Kinetics and Inhibition Module
University of San Diego
Jessica & Ellis Bell Copyright 1
THE MALATE DEHYDROGENASE LABORATORIES
Laboratory Page
Overview of the Enzyme Kinetics Block of Laboratories 1
Introduction to the Study of Enzyme Kinetics and Enzyme Mechanisms 2
Review of the Roles of Malate Dehydrogenase 5
EXPERIMENT 1
Determination of the basic kinetic parameters, Km and Vmax 7
Does the Enzyme Obey Simple Michaelis Menten Kinetics?
Introduction to the Design of the Experiment 7
Determination of Km for Oxaloacetate 9
Set Up of the Experiment you will perform 11
Determination of Km for NADH 13
Characterization of the Kinetic and Binding Properties of the Enzyme 15
EXPERIMENT 2
Determine the True Kinetic Parameters for 3 Phosphoglycerate Dehydrogenase at
pH 7.5
16
Set Up of the Experiment you will perform 21
Quantitative Analysis of Data 24
Group Project 27
Problem Set 1.1 27
EXPERIMENT 3
Inhibitors
Competitive Inhibitors 29
Experiments to Investigate the Behavior of Structural Analogs and Competitive
Inhibitors on the Activity of Malate Dehydrogenase
31
Set Up of the Experiment you will perform 31
Mixed Inhibitors 35
Set Up of the Experiment you will perform 36
Quantitative Analysis of Data 40
Problem Set 2.1 41
EXPERIMENT 4
Determination of Thermodynamic Parameters from Kinetic Experiments 41
Set Up of the Experiment you will perform 41
Problem Set 3.1 42
Overview of the Enzyme Kinetics Block of Laboratories
In previous course work, the activity of an enzyme was used to follow the purification of the enzyme and to
quantitate the amount of an enzyme present in a solution. In CHEM331, you have also been exposed to “one
substrate” kinetics where you can determine the Km and Vmax from a single set of experiments by varying the
concentration of the substrate. The experiments in this course focus on using measurements of the rate of
enzyme activity to characterize the interaction of the substrates and inhibitory ligands with the enzyme, and to
ascertain the overall rate limiting step in the enzyme catalyzed pathway for enzymes with two substrates.
The first experiment will illustrate how the basic kinetic parameters, Km and Vmax, for an enzyme are
determined and how careful analysis of the data obtained in such experiments can be used to determine whether

Malate Dehydrogenase Collaborative CUREs
Two Substrate Kinetics and Inhibition Module
University of San Diego
Jessica & Ellis Bell Copyright 2
and enzyme obeys "normal" behavior or might be subject to some type of "homotropic" regulation, where the
activity is disproportionate to the substrate concentration and the activity of the enzyme is "regulated" in some
way by changing substrate concentrations.
As an important corollary to the actual experiments, the data analysis discussed in this chapter, both for the
actual experiments and for the problem sets, illustrates how replicate measurements and appropriate data
analysis can be used to determine whether the assumed equation used for the analysis is appropriate and you can
maximize the information obtainable from your data.
Introduction
There are many different types of enzymes, categorized using the so-called "Enzyme Commission,” E.C.,
numbers into classes based upon the types of chemistry that they utilize in their reactions. What is it about
enzymes that make them so attractive for study? Enzymatic activities play crucial roles in every type of life
process in addition to being increasingly important in both drug design and synthesis and biotechnology. This is
easily seen by considering the types of enzymes that might be found in a typical cell.
Some enzymes are involved in the basic biochemistry and molecular biology of virtually every cell, whether
they are associated with metabolism [the enzyme Glyceraldehyde-3-Phosphate Dehydrogenase is an excellent
example: virtually all cells have a constant level of expression of the gene for Glyceraldehyde-3-Phosphate
Dehydrogenase as it is involved in a critical step in glycolysis, common to virtually all cells], or the machinery
of RNA transcription and protein synthesis: such enzymes are often referred to as “house-keeping” enzymes.
Particular enzymes are sometimes associated only with specific tissues or cell types, or only with certain
subcellular organelles and can be used as "marker enzymes" for that tissue or organelle [for example the Heart
Isoenzyme of Lactate Dehydrogenase: LDH-H, is found only in aerobic muscle such as the heart rather than
skeletal muscle which is designed to operate under anaerobic conditions: measurement of the amount of H-LDH
can be used to determine whether a person has had a heart attack.] Similarly, the various Glycosyl transferases
used in glycoprotein biosynthesis are found only in the Golgi membrane and their activity can be used as a
marker for that subcellular organelle. Table.1 summarizes several tissue or organelle specific enzymes the
measurement of whose activity has been useful in defining the tissue or organelle.
Marker Enzymes:
Membrane or Location Marker Enzyme
Mitochondrial: Inner Membrane Succinate-Cytochrome c Reductase
Rotenone Sensitive NADH Cytochrome c
Oxidase
Mitochondrial: Outer Membrane MonoAmine Oxidase
Rotenone Insensitive NADH Cytochrome c
Oxidase
Endoplasmic Reticulum RNA
Protein Synthesis Enzymes
NADPH Cytochrome c Reductase
Plasma Membrane 5' Nucleotidase
Lectin Binding
Oxytocin [or Hormone] Binding
Golgi Apparatus Glycosyl Transferases
Mitochondrial Matrix Glutamate Dehydrogenase

Malate Dehydrogenase Collaborative CUREs
Two Substrate Kinetics and Inhibition Module
University of San Diego
Jessica & Ellis Bell Copyright 3
Cytosol Glyceraldehyde 3 Phosphate Dehydrogenase
Enzymes in both these first two categories are not only necessary for the everyday functions of a particular cell
but often have their activity regulated to allow the cell to respond to normal changes in its environment.
Virtually all cell types in eukaryotic biology differentiate during their life time and usually certain enzyme
activities can be associated with the stage of differentiation of the cell: for example chondrocytes: [cells that
help create bone formation] differentiate to produce specific types of collagen and the enzyme alkaline
phosphatase [which is directly involved in releasing the phosphate that will be used in hydroxyapatite-the main
mineral in bone or teeth formation]. The quantitation of the activity of alkaline phosphatase can be used to
follow the level of differentiation of these cells.
Finally, the activity of some enzymes indicates the presence of an invading organism. During the early stages of
the AIDS crisis scientists measured the activity of the enzyme reverse transcriptase in infected tissue to show
that a retrovirus was involved in the infection. Enzymes specific for an invading organism are often targets for
drug design: again the AIDS crisis offers many examples. The reverse transcriptase and the HIV protease have
both been targets of intensive research in recent years to find specific inhibitors to block their activity.
So, what type of questions do we want to explore with enzymes? Any enzyme catalyzed reaction can be broken
down into three simple phases, see scheme 1:
1] substrate binding,
2] chemical catalysis, and
3] product release.
To understand an enzyme, we must be able to
examine each of these phases and document their
individual contributions to the overall activity of
the enzyme.
In the first phase, we want to know what is the order
of addition of substrates if there are more than one
substrate, and how tightly do the substrates bind. In
the second phase, we want to be able to ask
Pepsin [left] and the HIV Protease
[right] are both Aspartyl proteases.
The catalytic aspartate groups are
shown on the ribbon diagram of
pepsin, which is a monomeric
enzyme, and as can be seen are
similarly located in the HIV protease
although each group is contributed
by a different subunit. The two
subunits of the HIV protease are
identical and together the dimer
shows overall structural similarity to
pepsin.

Malate Dehydrogenase Collaborative CUREs
Two Substrate Kinetics and Inhibition Module
University of San Diego
Jessica & Ellis Bell Copyright 4
questions about the nature of the overall rate limiting step of the reaction. In the third phase, like the first phase,
the order of product release is important. Since an enzyme is often present with a mixture of both substrates
and products, we may also want to know whether complexes where, for example, one substrate and one product
can bind simultaneously to the enzyme exit. Such complexes may well play important roles in the regulation of
the activity of the enzyme if they are more stable than the "normal" enzyme-substrate or enzyme-product
complexes.
In the first two classes of enzymes considered above (housekeeping, cell type/organelle specific), in addition to
understanding these three phases of the enzyme's activity, it may be important to understand how the activity of
the enzyme is regulated: Does regulation of the enzyme involve alterations in substrate or product binding, or
does it involve changes in the rate of the chemical catalytic step? Does the regulation involve substrate
molecules themselves: homotropic regulation, or does it involve molecules separate from the normal substrates
and products of the reaction: heterotropic regulation? What information can the study of enzyme kinetics give
us that let us understand these aspects of an enzyme catalyzed reaction?
In the third class of enzyme, those that are differentiation specific or invading organism specific, the most
important question we can ask may well be: how tightly does a certain molecule inhibit the enzyme?
Understanding what chemical and structural features of the substrate [or product] are important in providing
interactions with the enzyme in the binding site are important in the rational design of drugs that will bind
tightly and specifically to the active site of the enzyme. Remember also that understanding the chemistry of the
catalytic step can also provide valuable information for the design of drugs since the transition state of the
chemical step binds to the active site far more tightly than does either the substrate or the product: transition
state analogs often are very high affinity inhibitors of enzymes.
In these laboratories, we will explore how enzyme kinetic measurements can contribute to our understanding of
how enzymes perform. In each section, the experiments progress from how to accurately measure the initial rate
of an enzyme and characterize its basic properties to more sophisticated laboratories where questions about how
substrates, products and inhibitors bind. Since these experiments involve two substrates, we will also explore
experiments that can give us an indication as to the order of addition of the substrates to the enzyme: is there a
compulsory order or can either substrate bind first followed by the other [a so called random order of substrate
addition]? Many of the experiments described here also give an indication as to where the overall rate limiting
step of the enzyme catalyzed reaction is - usually catalysis or product release – and, as appropriate, this will be
discussed.
What type of experimental measurements will allow us to study and understand the activity, regulation, and
potentially inhibition of enzymes in addition to simply showing that they are present and how much is present?
Eukaryotic Glutamate Dehydrogenases, the structure of bovine
glutamate dehydrogenase is shown on the left, are multisubunit
enzymes which show complex allosteric behavior involving both
substrates [homotropic regulation] and a variety of other ligands
[heterotropic regulation] such as ADP, GTP, Leucine, Zinc and a wide
variety of other ligands.
Enzyme kinetic studies have played an important role in elucidating
how substrates and regulatory ligands interact with this complex
enzyme.
The enzyme has six identical subunits [each subunit is shown in a
different color] with complex subunit interactions mediated by the
"antennae" [top and bottom] which connect three subunits within each
half of the enzyme

Malate Dehydrogenase Collaborative CUREs
Two Substrate Kinetics and Inhibition Module
University of San Diego
Jessica & Ellis Bell Copyright 5
It is often not sufficient to simply show that a protein is present. Mutant forms of a protein may be present in
"normal" amounts but show very different activity or regulation of its activity. The experiments described are
designed to show the types of experiments that can be used to fully investigate the activity of enzymes.
Measurement of the activity of enzymes also plays a critical role in many other types of experiments that can be
used to investigate "structure-activity" relationships in proteins and fully understanding the types of information
that apparently simple measurement of enzyme activities can provide is the underpinning of much of modern
biochemistry, molecular biology and biotechnology.
Review of the Roles of Malate Dehydrogenase
Malate Dehydrogenases catalyze the reaction:
Malate + NAD+ Oxaloacetate + NADH
Involving a simple hydride transfer from the 2 position of Malate to the nicotinamide ring of NAD+ to give
NADH. During the process a proton is also released to the solvent.
This reaction plays a number of important roles in metabolism, illustrated by a reaction in the Tricarboxylic acid
cycle (left), a reaction critical to the Urea Cycle (center), and a reaction playing a role in the shuttling of
reducing equivalents into mitochondria (right):

Malate Dehydrogenase Collaborative CUREs
Two Substrate Kinetics and Inhibition Module
University of San Diego
Jessica & Ellis Bell Copyright 6
In the later example it is clear that there must exist Malate Dehydrogenase in at least two different locations
within the cell and in fact there are two distinct isoenzymes, a cytoplasmic MDH [cMDH] and a mitochondrial
MDH [mMDH] in higher eukaryotes which have different amino acid sequences and different three
dimensional structures: cytoplasmic MDH and mitochondrial MDH. [In the final section of each of the major
types of experiments described are group projects that involve comparisons of the properties of cytoplasmic and
mitochondrial forms of malate dehydrogenase.] Each MDH isoform is a dimer, and each subunit contains two
domains, with a classic dinucleotide binding domain and a malate binding domain.
In mitochondria, MDH is thought to form loose multienzyme complexes with several other enzymes sharing
substrates, in particular Aspartate AminoTransferases which catalyze the transamination of Glutamate and
Oxaloacetate to give Aspartate and 2-Oxoglutarate, a key reaction in the Glyoxylate Cycle and
Gluconeogenesis:
cMDH mMDH

Malate Dehydrogenase Collaborative CUREs
Two Substrate Kinetics and Inhibition Module
University of San Diego
Jessica & Ellis Bell Copyright 7
In the case of an enzyme such as Malate dehydrogenase, which catalyzes the reaction:
Malate + NAD+ Oxaloacetate + NADH
where two substrates are involved, NAD+ and Malate in the forward direction, NADH and Oxaloacetate in the
“reverse” of the reaction, there is yet another consideration: what concentration of the non-varied substrate to
use. The answer, when the aim of the experiment is to determine the Km of one of the substrates, in the first
experiment here, that is the Km of Oxaloacetate, is to fix the concentration of the non-varied substrate as close to
saturation as is practical. In the experiment described below, the concentration of NADH will be fixed at
0.1mM and the concentrations of Oxaloacetate varied.
You will have noticed that in all of the discussion of Malate Dehydrogenase the utilization of NADH has been
used in the assay. Why not use the experimentally simpler NAD+ NADH direction of the reaction?
The answer is actually quite simple if you remember that a reaction can reach an equilibrium position, and in
the case of MDH the equilibrium position significantly favors Malate/NAD+ and as a result the oxidation of
Malate goes rapidly to equilibrium making it very difficult to determine an initial rate in the NAD+ NADH
direction.

Malate Dehydrogenase Collaborative CUREs
Two Substrate Kinetics and Inhibition Module
University of San Diego
Jessica & Ellis Bell Copyright 8
Experiment 1
Determination of the Basic Kinetic Parameters, Km and Vmax
Does the Enzyme Obey Simple Michaelis-Menten Kinetics? In experiments concerning the measurement of initial rates, a number of critical features involved with
accurately measuring the initial rate of an enzyme catalyzed reaction and some of the uses of such
measurements must be considered. In this experiment, we start to answer some of the questions about what sort
of information do we want to know about enzymes: specifically, how well do they bind their substrates [as
assessed by their Michaelis Constant, Km], what is the maximum rate of the catalyzed reaction [as assessed by
the Maximum Rate of the catalyzed reaction with saturating substrate concentrations, Vmax] and how efficiently
does the enzyme operate, as estimated by Vmax/Km.
Why do we want to know these things about an enzyme? Knowing each of the above parameters can help us
understand how the enzyme may operate in vivo, how changes in the enzyme as a result of mutation may
contribute to a clinical condition, or how an enzyme might be engineered to be more useful in a
biotechnological setting. Knowing the Km for Glutamate of the enzyme N-AcetylGlutamate Synthase and
realizing that the in vivo concentrations of Glutamate are much lower helps us understand how the Urea Cycle
is regulated [small changes in Glutamate concentrations have a direct and proportional effect on the
concentration of N-AcetylGlutamate, an absolutely required allosteric effector of the Enzyme Carbamoyl
Synthase- the key first step in Urea Synthesis]. Understanding how fast an enzyme can go at saturating substrate
concentrations can help elucidate whether or not the enzyme plays an overall rate limiting role in a pathway,
and hence may be subject to regulation. Isocitrate Dehydrogenase in the Krebs Cycle has the lowest Vmax of any
enzyme in the cycle and hence is the rate limiting enzyme of the cycle. As a result it is the major point of
activation of the cycle [you must speed up the overall rate limiting step if you want to speed up the cycle]. The
catalytic efficiency of an enzyme can give not only information about its evolutionary status [for example the
enzyme Triose Phosphate Isomerase, a very primitive enzyme whose catalytic efficiency has evolved to near
perfection], but also the potential to improve the enzyme for biotechnological purposes.
Introduction to the Design of the Experiment.
The Michaelis-Menten Equation:
vo = Vmax[S]/{Km + [S]}
Together with its linear transformation, the LineWeaver Burk Equation:
1/vo = 1/Vmax + {Km/Vmax} x 1/[S]
are the basic equations of enzyme kinetics which allows us to not only calculate values for Km and Vmax from
the appropriate experiments, but helps us to understand the design of such experiments. These equations are
used to analyze simple one substrate kinetics and calculate Km and Vmax. The basic equations also apply to
multi-substrate enzyme kinetics except that the values for Km and Vmax obtained from the simple experiment
used earlier do not take into account the possibility that the second substrate may have some influence on the
values for each parameter. For a given two substrate experiment where values for Km and Vmax are obtained
from a single experiment with one of the substrate concentrations varied, they are the values determined at a
fixed concentration of the other substrate or substrates and are usually referred to as “apparent” values.
Furthermore, they are values obtained assuming that the enzyme obeys Michaelis-Menten kinetics. This, too, is
not always the case.

Malate Dehydrogenase Collaborative CUREs
Two Substrate Kinetics and Inhibition Module
University of San Diego
Jessica & Ellis Bell Copyright 9
Using the Predictions of the Equation to Design the Experiment:
Both equations predict a particular response of the initial rate, vo, to changes in the concentration of a substrate.
The parameters Km and Vmax are obtained from experiments where the initial velocity is measured as a
function of the substrate concentration. In these experiments, it is important to keep in mind how you plan to
display and analyze the resultant data. If you are using the Michaelis Menten equation, which gives a plot of vo
vs [S], the experiment should be designed to have regular spacing along the [S] axis. If you plan to use the
LineWeaver Burk plot to display the data, which utilizes a plot of 1/vo vs 1/[S], then 1/[S] should be regularly
spaced. Are there any other considerations in the design of the experiment? Two. First, the most accurate data is
likely to be obtained from 0.5Km to 5Km and hence a preliminary experiment to give a rough value of Km can be
useful. Second, you are testing the hypothesis that the enzyme obeys the fit to the appropriate equation, and to
test this assumption as thoroughly as possible you need as wide a range of substrate concentrations as possible.
Why the Data May Not Fit the Predictions of the Equations
The activity of many enzymes is “regulated” by the concentration of their own substrates. In such cases, simple
Michaelis Menten kinetics are not observed. Three scenarios are possible: First, the enzyme could have a
regulatory binding site for the substrate in addition to the active site. At concentrations of substrate where there
was significant binding to the “regulatory” site, the activity could be increased or decreased. Think what this
would do to the simple assumption made in the Michaelis Menten or LineWeaver Burk equations. If we assume
that the “regulatory” site has lower affinity than the active site, the apparent activity of the enzyme would
disproportionally increase or decrease depending upon whether the binding to the regulatory site increased or
decreased the activity of the enzyme.
Second, if the enzyme has multiple subunits with active sites, there could be some type of allosteric interaction
between the sites such that substrate affinity or catalytic activity increased or decreased as a higher degree of
saturation was achieved. Such “homotropic” allosteric interactions could give rise to sigmoidal saturation
curves. Like those obtained with oxygen saturation of hemoglobin in the case where the substrate binding was
enhanced as saturation increased-positive cooperativity. Or, saturation curves which decreased substrate
binding-so called negative cooperativity.
While both of these mechanisms require either a second binding site for the substrate or allosteric interactions
between subunits, there is an explanation for both the above types of “deviation” from Michaelis-Menten
behaviour that requires no such causes. Consider a two substrate enzyme with subsites for each substrate. In
many cases, the products of a reaction closely resemble the substrates- Malate Dehydrogenase for example
where the substrate NAD+ is very similar to the product NADH and similarly the substrate Malate is very
similar to the product Oxaloacetate. If in a two substrate-two product system such as malate dehydrogenase,
malate were the first product to leave, but the rate limiting step in the overall reaction was the release of NAD+
from the resultant Enzyme-NAD+ complex, it is conceivable that at high concentrations of oxaloacetate,
oxaloacetate would bind to the E-NAD+ complex before NAD+ was released to form an E-NAD+-Oxaloacetate
Complex. If this complex released NAD+ faster than the E-NAD+ complex, the result would be that
oxaloacetate would speed up the overall rate limiting step and cause “substrate activation.” If the E-NAD+-
oxaloacetate complex released NAD+ more slowly that the E-NAD+ complex, oxaloacetate would slow the
overall reaction, and a “substrate inhibition” effect would be observed. Such complexes, containing one product
and one substrate, often called “abortive” complexes, play key roles in many enzyme catalyzed reactions and
result in significant deviations at high substrate concentrations from expected Michaelis-Menten behavior. As a
result, there is a necessity to decide whether or not the collected data has in fact obeyed the predictions of the
Michaelis Menten or LineWeaver Burk equations. As discussed in the “Quantitative Analysis of Data” section
this involves an analysis of the residuals of the fit to the appropriate equation to determine whether in fact the
data obeys the predicted equation.

Malate Dehydrogenase Collaborative CUREs
Two Substrate Kinetics and Inhibition Module
University of San Diego
Jessica & Ellis Bell Copyright 10
Experiment
Determination of the Km for Oxaloacetate in the Reaction Catalyzed by Malate Dehydrogenase.
The aims of this laboratory are to show how an experiment is designed and conducted to a] obtain the most
appropriate values for the Km of the enzyme Malate Dehydrogenase for its substrate Oxaloacetate and for its
apparent Vmax, and b] to decide whether or not the enzyme obeys the assumptions made in the Michealis
Menten or LineWeaver Burk equations: ie does the enzyme follow "normal" kinetic behavior. This will entail
not only carefully conducting the experiment, but also learning how to appropriately analyze and present the
data that you obtain.
Set Up of the Experiment
We will assume that the Km for Oxaloacetate is in the range 0.1 to 0.5mM and hence as discussed above we
will want to vary the concentration of Oxaloacetate from 0.02mM to at least 2.5mM. The NADH concentration
will be fixed at 0.1mM. We will replicate each data point three times to give sufficient data for reasonable
statistical analysis. Six to twelve Oxaloacetate concentrations over our range would give a total of 18-36 assays
and since each assay takes a minute or so, this can be easily achieved during the limited time available for the
laboratory.
So, what 12 Oxaloacetate Concentrations should we choose?
If you examine the concentrations listed in Table 1.1 you will find that they are reasonably spaced throughout
the concentration range, but weighted toward the low end of the spectrum. When you examine the 1/[S] values
in the same table you will see that they are reasonably spaced over the whole range, although a little bunched
towards the high concentration range. These concentrations represent a compromise between the needs of a
Michaelis Menten plot and a LineWeaver Burk plot, and you will use both types of plots to analyze the data.
Table 1.1. Concentrations to Be Used to determine the Km for Oxaloacetate
Concentration, mM 1/[S], mM-1 Diluted Stock* Original Stock H2O added
0.025 40 0.05mL 0.95mL
0.05 20 0.1mL 0.9mL
0.075 13.3 0.15mL 0.85mL
0.1 10 0.2mL 0.8mL
0.15 6.67 0.3mL 0.7mL
0.25 4 0.5mL 0.5mL
0.5 2 0.1mL# 0.9mL
0.75 1.33 0.15mL 0.85mL
1.0 1.0 0.2mL 0.80mL
1.5 0.67 0.3mL 0.7mL
2.0 0.5 0.4mL 0.6mL
2.5 0.4 0.5mL 0.5mL
How do we achieve these concentrations in the actual assays?
In this experiment we were provided with a series of solutions:
0.04M Phosphate Buffer
15mM Oxaloacetate in H2O
0.6mM NADH in H2O and

Malate Dehydrogenase Collaborative CUREs
Two Substrate Kinetics and Inhibition Module
University of San Diego
Jessica & Ellis Bell Copyright 11
an enzyme solution, in 0.1M Phosphate Buffer, of approximately 0.1mg/mL
You will use a total of 3mL in the cuvette before addition of the enzyme, and again to achieve the least chance
for pipetting errors you will premix everything that can be mixed: in this case, the buffer and the NADH can be
premixed. As before since you want a final buffer concentration of 0.02M you will need 1.5mL buffer per
cuvette.
How much NADH do you need to give a final concentration of 0.1mM?
You have a stock of 0.6mM, you want 0.1mM: the dilution Factor is 0.6/0.1 = 6
Simply divide the total volume, ie 3mL, by the dilution factor, 6, to give 3.0/6 = 0.5mL of the stock NADH
solution added per 3mL of total volume.
Thus for each cuvette you can premix 1.5mL of the stock 0.04M buffer and 0.5mL of the stock 0.6mM NADH
and add 2.0mL per cuvette. You will have a total of 36 cuvettes but using the principle of making up a bit more
that you need, you should plan for 40 cuvettes.
Measure out 40 x 1.5mL = 60mL of the Stock Buffer
Add 40 x 0.5mL = 20mL of the stock NADH
Mix
Add 2.0mL to each cuvette that you will need
What else do you need in each cuvette?
Oxaloacetate: added to give the concentrations in Table 1.1, and H2O to make up the volume to 3.0mL
Consider the 1mM concentration of Oxaloacetate. You have a 15mM stock solution: the dilution factor is 15/1 =
15. Thus you will need to add 3/15 = 0.2mL of the stock to give 1mM
If you make the same calculation for the 0.025mM you will get a dilution factor of 15/0.025 = 600 and would
need to add 3.0/600 = 0.005mL of the stock to give 0.025mM Oxaloacetate. This is not very practical from the
accuracy standpoint and so you will make a 10 fold dilution of the stock solution [5mL of the stock plus 45mL
H2O] which will give a second stock of 1.5mM. Now calculating a dilution factor for the 0.025mM point you
get 1.5/0.025 = 60 which would mean that you add 0.05mL of the diluted stock to give 0.025mM oxaloacetate
in the cuvette. As a general rule of thumb, for accurate work try not to add less than 0.05mL since pipetting
errors are magnified as the volume pipetted decreases.
In table 1.1, the volumes of oxaloacetate to add to the appropriate cuvettes are indicated, with * indicating that it
is the diluted stock rather than the original stock that is being used.
The final column in table 1.1-ib shows the amount of H2O to add to the cuvette to bring the total volume to
3.0mL.
Set Up of the Experiment that You Will Perform
In the experiment that you will perform you are provided with the following solutions:
50mL of 10mM Oxaloacetate in H2O
30mL of 0.5mM NADH in H2O
200mL of 0.04M Phosphate
2mL of Malate Dehydrogenase at approximately 0.1mg/mL [you will be provided with the exact concentration].
Using the above worked example of experimental set up and design as a guide, design the experiment that you
will perform, using the above solutions that you will be provided with, to determine the Km for Oxaloacetate at
pH 8.0. Fill in the necessary information on Experimental Set Up WorkSheet 1.1

Malate Dehydrogenase Collaborative CUREs
Two Substrate Kinetics and Inhibition Module
University of San Diego
Jessica & Ellis Bell Copyright 12
You will not be able to calculate the actual enzyme concentration that you will use but will add this information
to your worksheet at the start of the actual experiment.
Experiment 1.1
Experimental Set Up Work Sheet
Components of Assay Mix
Abs of Enzyme
at 280nm:
[enzyme]: mL H2O: mL Buffer : mL NAD+:
Cuvette # [Oxaloacetate] mL Oxaloacetate mL Assay Mix mL H2O
1
2
3
4
5
6
7
8
9
10
# of Replicates
Volume of Enz
to initiate:
Preequilibrate the cuvettes to the desired temperature, room temperature for example
While the cuvettes are pre-equilibrating, determine the enzyme concentration in the stock enzyme solution and
decide what volume you wish to add per assay. To determine the enzyme concentration take a 100L aliquot
and add to a cuvette containing 1.0mL of 0.1M Phosphate buffer at pH 7.0, that has been zeroed in the
spectrophotometer at 280nm, and read the resultant absorbance after careful mixing. For example, in the
quantitative analysis data set given below, utilizing Glutamate Dehydrogenase, a value of 0.152 for the
absorbance was obtained when 200L of stock enzyme solution was added to give a total of 1.2mL buffer. The
concentration of the enzyme was calculated by multiplying the measured absorbance by the dilution factor
[1.2/0.2 = 6] and dividing by the extinction coefficient for glutamate dehydrogenase, 0.93mg/mL cm-1 at
280nm. Thus the stock enzyme solution was:
{0.152 x 6}/ 0.93 = 0.98mg/mL
10L of the stock was added to initiate the reaction with each cuvette as appropriate.
Depending upon the exact concentration you obtain for the stock enzyme solution you may want to dilute to no
more than 0.1mg/mL since adding L of a higher enzyme concentration will give problems in determining an
initial rate for the cuvettes in the experiment. A concentration of the stock solution in the range 0.05 to
0.1mg/mL should give good data in this experiment.

Malate Dehydrogenase Collaborative CUREs
Two Substrate Kinetics and Inhibition Module
University of San Diego
Jessica & Ellis Bell Copyright 13
Conduct the Experiment.
Since you need no more than about 30 seconds of data to determine an initial rate, there is no point in collecting
more data than that for each cuvette. Be sure to mix thoroughly after the enzyme addition. Record the
absorbance at 340nm for 30-40 seconds for each cuvette and calculate the A/minute for each cuvette.
Remember that the absorbance will go down as NADH is consumed. This means that you will need to “blank”
each cuvette with a buffer blank, not the actual cuvette you will use to make the rate measurement. Remember
to switch to the actual cuvette before adding the enzyme!
At the end of the measurements, calculate the initial rate for each trace, calculate the averages and standard
deviations for each set of replicates. Record the values that you obtain in the data analysis work sheet:
Data Analysis Work Sheet 1.1-I:
[OAA],mM Rate 1
A/min
Rate 2
A/min
Rate 3
A/min
Average
A/min
St. Dev.
A/min
Convert your A/minute values into M NADH utilized/minute and enter into Data Analysis Work Sheet 1.1-II
Data Analysis Work Sheet 1.1-II
[OAA], mM Average Rate M NADH Utilized/minute
Standard Deviation M NADH Utilized/minute
%Standard Deviation
Determine the Km and Vmax for the reaction using both the Michaelis Menten equation and the LineWeaver
Burk equation. From the experimentally determined Vmax, calculate the specific activity of the enzyme.
Experiment

Malate Dehydrogenase Collaborative CUREs
Two Substrate Kinetics and Inhibition Module
University of San Diego
Jessica & Ellis Bell Copyright 14
Determining the Km for NADH
Design Your Own Experiment:
Using the above experiment as a guide, you should design an experiment to determine the Vmax and Km values
for NADH at pH 8.0, using a fixed concentration of Oxaloacetate of 1mM. Assume that the Km for NADH is in
the range of 20 to 200M. You should use 10 concentrations of NADH.
You will be provided with the following solutions to conduct the experiment:
0.04M Phosphate Buffer, pH 8.0
6mM Oxaloacetate in H2O
Assume 1.5mM NADH in H2O [you can check the actual concentration using a millimolar extinction
coefficient for NADH at 340nm of 6.22cm-1]
Approximately 0.1mg/mL Malate Dehydrogenase in 0.1M Phosphate Buffer at pH 7.0 [check the actual
concentration as before].
Experiment 1.2
Experimental Set Up Work Sheet
Components of Assay Mix
Abs of Enzyme
at 280nm:
Concentration of
enzyme:
mL H2O: mL Buffer : mL Oxaloacetate:
Cuvette # [NADH] mL NADH mL Assay Mix mL H2O
1
2
3
4
5
6
7
8
9
10
# of Replicates
Volume of Enz
to initiate:
At the end of the measurements, calculate the initial rate for each trace and calculate the averages and standard
deviations for each set of replicates. Record the values that you obtain in the data analysis work sheet:
Data Analysis Work Sheet 1.2-I:
[NADH],
M
Rate 1
A/min
Rate 2
A/min
Rate 3
A/min
Average
A/min
St. Dev.
A/min

Malate Dehydrogenase Collaborative CUREs
Two Substrate Kinetics and Inhibition Module
University of San Diego
Jessica & Ellis Bell Copyright 15
Convert your A/minute values into M NADH utilized/minute and enter into Data Analysis Work Sheet 1.2-
II.
Data Analysis Work Sheet 1.2-II
[NADH], M Average Rate M NADH Utilized/minute
Standard Deviation M NADH Utilized/minute
%Standard Deviation
Determine the Km and Vmax for the reaction using both the Michaelis Menten equation and the LineWeaver
Burk equation. From the experimentally determined Vmax, calculate the specific activity of the enzyme.

Malate Dehydrogenase Collaborative CUREs
Two Substrate Kinetics and Inhibition Module
University of San Diego
Jessica & Ellis Bell Copyright 16
EXPERIMENT 2
Characterization of the Kinetic and Binding Properties of the Enzyme
In the previous experiments with Malate Dehydrogenase, experiments 1.1-2, the apparent values for Km for
either substrate, and for Vmax were determined in experiments where one of the substrate concentrations was
fixed and the other varied. Since in a two substrate enzyme it is possible that the binding of one substrate
influences the binding of the other substrate, it is necessary to establish whether one substrate binding affects
the Km for the other substrate. Similarly, in the experiment with one substrate concentration fixed and the other
varied you are in effect extrapolating the rate to saturation of the varied substrate [the 1/vo intercept is
1/Vmax(apparent) since you have extrapolated to saturation by going to 0 on the 1/[S] axis]. The true Vmax of
course would be obtained by extrapolation to saturation with both substrates. This is achieved by conducting a
series of experiments where one substrate concentration is varied at a series of fixed concentrations of the other
substrate. This experiment is described by the generalized rate equation for a two substrate enzyme catalyzed
reaction:
e/vo = S1] + [S2] + [S1xS2]
where the parameters are the so-called initial rate parameters and, as we shall see, are related to the Km and
Vmax parameters of a standard LineWeaver Burk equation. This equation is of course in the format of a
LineWeaver Burk equation and can be easily rearranged to give a LineWeaver Burk equation for either
substrate:
For Substrate 1, S1 varied: we get:
e/vo = {[S2]} + {+ [S2]} x S1]
intercept slope
or for Substrate 2, S2 varied: we get:
e/vo = {[S1]} + {+ [S1]} x S2]
intercept slope
These equations predict that both the slope and the intercept of a LineWeaver Burk plot with S1 as the varied
substrate will vary as a function of S2, and similarly for the slopes and intercepts of LineWeaver Burk plots with
S2 as the varied substrate when different S1 values are used.
These equations also show how the initial rate parameters are related to the true Km and Vmax values for the
enzyme in question. From the equation above, the apparent Km for substrate 1 will be slope/intercept:
Km = {+ [S2]} / {[S2]} and is clearly a function of S2. At saturating S2 however the terms
[S2] and [S2] go to zero and the Km becomes Likewise, the Km for S2 becomes From
either equation it should be apparent that the true Vmax for the enzyme is 1/
The generalized rate equation for a two substrate enzyme also shows how the individual initial rate parameters
can be experimentally determined to allow calculation of the true kinetic parameters for the enzyme. As shown
in the problem set below, the slope of a primary LineWeaver Burk plot with S1 as the varied substrate is a

Malate Dehydrogenase Collaborative CUREs
Two Substrate Kinetics and Inhibition Module
University of San Diego
Jessica & Ellis Bell Copyright 17
function of S2, as is the intercept. A secondary plot of either slope or intercept against 1/S2 allows for the four
initial rate parameters to be calculated. An experiment to determine the values of the initial rate parameters
would consist of varying one substrate concentration in the presence of a series of fixed concentrations of the
second substrate. A typical experiment might involve five different concentrations of each substrate, in a 5 x 5
grid, as illustrated in the problem set at the end of this section.
Determine the True Kinetic Parameters for 3 Phosphoglycerate Dehydrogenase at pH 7.5
Rationale to the Set Up the Experiment: Worked Example
What considerations do you need to take into account to design an experiment to determine the initial rate
parameters for a two substrate enzyme? Consider the experimental set up for determining the initial rate
parameters for the enzyme Glutamate dehydrogenase at pH 7.0 outlined below. How were the concentration
ranges for Glutamate and for NAD+ chosen? Preliminary experiments such as those illustrated earlier in this
section established the approximate values for Km for each substrate. From such an experiment, we know that
the Km for Glutamate is approximately 3-4mM and hence a good range of Glutamate concentrations to use
would be from 1mM to 20mM. From such an experiment, we expect that the LineWeaver Burk plots with
Glutamate as the varied substrate will be linear in this range. Remembering that we will plot LineWeaver Burk
plots to analyze the data, we will choose five concentrations of Glutamate, as shown in the table below: why
were these concentrations chosen?
It is known that with NAD+ as the varied substrate, a non-linear LineWeaver Burk plot is generated when the
NAD+ concentration is varied from 5M to 1000M, but that the data is approximated by two linear regions,
one with NAD+ up to about 45M and the other with NAD+ concentrations between 100 and 1000M. We can
choose to determine the initial rate parameters in either of these two NAD+ concentration ranges.
In the example here we will use the 5-45M range, and choose five NAD+ concentrations, as shown in the table
below.
Experiment Set Up Work Sheet 2.1:
[Glutamate],
mM
Volume of
Glutamate
Added
[NAD+], M Volume of
NAD+ Added
Volume of
Buffer Added
Volume of
Water Added
1.0 5
7.5
10
20
45
1.5 5
7.5
10
20
45
2.5 5
7.5
10
20
45
5.0 5
7.5

Malate Dehydrogenase Collaborative CUREs
Two Substrate Kinetics and Inhibition Module
University of San Diego
Jessica & Ellis Bell Copyright 18
10
20
45
20.0 5
7.5
10
20
45
Pre-Laboratory Problem:
Assuming that you are provided with the following solutions, how would you make up each cuvette if you plan
to use a final buffer concentration of 0.1M?
0.2M Phosphate Buffer containing 20M EDTA
120mM Glutamate in H2O
270M NAD+ in H2O
If you are planning to make each measurement in quintuplet [five] how much of each solution would you plan
to make up?
Note: After you have made up the stock solution of NAD+, you would check its concentration by absorbance
measurements at 260nm using a millimolar extinction coefficient of 17.8cm-1.
Performing the Experiment:
Make up three cuvettes each with the following contents:
[Glutamate],
mM
Volume of
Glutamate
Added
[NAD+], M Volume of
NAD+ Added
Volume of
Buffer Added
Volume of
Water Added
1.0 0.1* 5 55L 1.5mL 1.345mL
0.1 7.5 83 " 1.317
0.1 10 110 " 1.290
0.1 20 220 " 1.180
0.1 45 500 " 0.900
1.5 0.15* 5 55 " 1.295
0.15 7.5 83 " 1.267
0.15 10 110 " 1.240
0.15 20 220 " 1.130
0.15 45 500 " 0.850
2.5 0.25* 5 55 " 1.195
0.25 7.5 83 " 1.167
0.25 10 110 " 1.120
0.25 20 220 " 1.030
0.25 45 500 " 0.750
5.0 0.5* 5 55 " 0.945
0.5 7.5 83 " 0.917
0.5 10 110 " 0.890

Malate Dehydrogenase Collaborative CUREs
Two Substrate Kinetics and Inhibition Module
University of San Diego
Jessica & Ellis Bell Copyright 19
0.5 20 220 " 0.780
0.5 45 500 " 0.500
20.0 0.5 5 55 " 0.945
0.5 7.5 83 " 0.917
0.5 10 110 " 0.890
0.5 20 220 " 0.780
0.5 45 500 " 0.500
When you have pre-equilibrated the cuvettes at whatever temperature you choose, initiate the reaction by the
addition of 10L of the approximately 0.5mg/mL solution of Glutamate dehydrogenase and determine the
initial rate for each cuvette.
Using Data Analysis work sheets 2.2 and 2.3 calculate the initial rate parameters for Glutamate Dehydrogenase
under these conditions. You would calculate the actual NAD+ concentrations from the experimentally
determined concentration of the stock NAD+ solution.
Data Analysis Work Sheet 2.2
Glutamate,
mM NAD+, M Rate #1
A/min
Rate #2 Rate #3 Average
Rate
Standard
Deviation

Malate Dehydrogenase Collaborative CUREs
Two Substrate Kinetics and Inhibition Module
University of San Diego
Jessica & Ellis Bell Copyright 20
Convert the A/minute to nM NADH produced per minute and enter the results into Data Analysis Work Sheet
2.3
Data Analysis Work Sheet 2.3
Glutamate, mM NAD+, M Average Rate
nM NADH produced
per minute
Standard Deviation
Plot the primary plots as illustrated in the section on quantitative analysis of the data and enter the values for the
slopes and intercepts into Data Analysis Work Sheet 2.4
Data Analysis Work Sheet 2.4
Glutamate, mM Intercept from
LWB plot with
NAD+ Varied
Intercept
Standard
Deviation
Slope from LWB
plot with NAD+
Varied
Slope Standard
Deviation

Malate Dehydrogenase Collaborative CUREs
Two Substrate Kinetics and Inhibition Module
University of San Diego
Jessica & Ellis Bell Copyright 21
Construct the secondary plot and enter the values for the appropriate initial rate parameters in Data Analysis
Work Sheet 2.5 together with the calculated values for the Km values for each substrate and the Vmax
Data Analysis Work Sheet 2.5
Parameter 0 1 2 12
Value
Standard
Deviation
Units
Km Substrate 1= Substrate 2=
Vmax
Experimental Set Up WorkSheet
Design Your Own Experiment:
Design and conduct an experiment to determine the initial rate parameters for either Malate Dehydrogenase.
Use NADH concentrations in the range 10-100M, and oxaloacetate concentrations in the range 0.025-0.4mM.
Assuming that you can make up the stock solutions of NADH and Substrate as you desire:
NADH Stock Concentration_____________________
Substrate Stock Concentration__________________
Using an 0.04M Phosphate Buffer stock as before.
Experiment Set Up Work Sheet 2.6:
[Substrate],
mM
Volume of
Substrate
Added
[NADH], M Volume of
NADH Added
Volume of
Buffer Added
Volume of
Water Added

Malate Dehydrogenase Collaborative CUREs
Two Substrate Kinetics and Inhibition Module
University of San Diego
Jessica & Ellis Bell Copyright 22
Initiate the reaction with the addition of 10-20L of 0.1mg/mL MDH.
Using Data Analysis work sheets 2.7-2.9 calculate the initial rate parameters for the enzyme under these
conditions. You would calculate the actual NADH concentrations from the experimentally determined
concentration of the stock NADH solution.
Data Analysis Work Sheet 2.7-I
Substrate,
mM
NADH,
M
Rate #1
A/min
Rate #2 Rate #3 Average
Rate
Standard
Deviation
Convert the A/minute to nM NADH utilized per minute and enter the results into Data Analysis Work Sheet
1.8-II

Malate Dehydrogenase Collaborative CUREs
Two Substrate Kinetics and Inhibition Module
University of San Diego
Jessica & Ellis Bell Copyright 23
Data Analysis Work Sheet 2.7-II
Substrate, mM NADH, M Average Rate
nM NADH utilized
per minute
Standard Deviation
Plot the primary plots as illustrated in the section on quantitative data analysis and enter the values for the
slopes and intercepts into Data Analysis Work Sheet 2.8.
Data Analysis Work Sheet 2.8
Substrate, mM Intercept from
LWB plot with
NADH Varied
Intercept
Standard
Deviation
Slope from LWB
plot with NADH
Varied
Slope Standard
Deviation
Construct the secondary plot and enter the values for the appropriate initial rate parameters in Data Analysis
Work Sheet 2.9 together with the calculated values for the Km values for each substrate and the Vmax.

Malate Dehydrogenase Collaborative CUREs
Two Substrate Kinetics and Inhibition Module
University of San Diego
Jessica & Ellis Bell Copyright 24
Data Analysis Work Sheet 2.9
Parameter 0 1 2 12
Value
Standard
Deviation
Units
Km Substrate 1= Substrate 2=
Vmax
Quantitative Analysis of the Data
The enzyme 3-Phosphoglycerate Dehydrogenase has a subunit molecular weight of 42,000 and utilizes 3-
phosphoglycerate and NAD+ as substrates. The data in the table below was obtained in an experiment where S1
is NAD+ and S2 is 3-phosphoglycerate. The reaction was initiated by the addition of 20L of a 0.23mg/mL
solution of the enzyme to a reaction mixture with a total volume of 1mL.
The following data was obtained:
Concentration of S1 Concentration of S2 Average Initial Rate
M NADH per
minute
Standard deviation
10M 0.05mM 0.156 0.006
4 0.130 0.007
2 0.104 0.007
1.25 0.084 0.011
0.83 0.0667 0.012
10 0.133mM 0.189 0.006
4 0.164 0.005
2 0.137 0.007
1.25 0.113 0.009
0.83 0.0926 0.011
10 0.2mM 0.247 0.007
4 0.219 0.007
2 0.193 0.006
1.25 0.164 0.008
0.83 0.135 0.007
10 0.5mM 0.303 0.009
4 0.285 0.008
2 0.257 0.008
1.25 0.23 0.006
0.83 0.196 0.006
10 2.0mM 0.337 0.005
4 0.3106 0.006
2 0.290 0.007
1.25 0.263 0.008
0.83 0.230 0.008

Malate Dehydrogenase Collaborative CUREs
Two Substrate Kinetics and Inhibition Module
University of San Diego
Jessica & Ellis Bell Copyright 25
From the above data, determine the values of the 4 initial rate parameters for the reaction and determine the Km
values for each substrate and the overall maximum rate of the reaction.
For Substrate 1, S1, varied, we get:
e/vo = {[S2]} + {+ [S2]} x S1]
intercept slope
If we plot the above data in double reciprocal LineWeaver Burk format we obtain a graph:
If the slopes and intercepts obtained from this plot are then plotted according to:
Slope = {+ [S2]}
And
Intercept = {[S2]}

Malate Dehydrogenase Collaborative CUREs
Two Substrate Kinetics and Inhibition Module
University of San Diego
Jessica & Ellis Bell Copyright 26
It is clear that plots of slope or intercept versus 1/[S2] should be linear. For the slopes plot, we obtain an
intercept of and a slope of . For the plot of the intercepts versus 1/[S2], the slope is and the intercept
is .
The so-called secondary plot of the primary data allows calculation of all of the initial rate parameters as shown
below
Km for S1 is M. Likewise, the Km for S2 becomes M. From either
equation, it should be apparent that the true Vmax for the enzyme is 1/min-1. But what are the
units? In reality, but rarely in practice, we would have plotted e/Vo, where e is the active site concentration in
M, and hence the units of Vmax would be min-1. The units of o are currently M/min-1, hence if we convert
the enzyme concentration to M and divide we will obtain the correct units.
To calculate the M of the enzyme in the reaction mix, we must take into account the fact that 20L of stock
enzyme was added to 1mL reaction mix to initiate the reaction and that the stock enzyme was 0.23mg/mL [with
an active site molecular weight of 42,000].

Malate Dehydrogenase Collaborative CUREs
Two Substrate Kinetics and Inhibition Module
University of San Diego
Jessica & Ellis Bell Copyright 27
First, to calculate the stock enzyme concentration:
42,000mg/mL = 1M
42mg/mL = 1mM
1mg/mL = 31.7M, thus 0.23mg/mL = 31.7 x 0.23 = 7.28M
To obtain the concentration in the reaction mix:
Stock concentration x Volume Added/Total volume:
(7.28 x 20)/1020 = 0.143M
Thus the value for would have been 0.143/3.03 = 0.0472 and Vmax becomes 1/0.0472 = 21.2min-1.
Since the Km values are obtained from ratios of initial rate parameters we do not need to make the same type of
correction since the enzyme concentration would cancel out.
Group Projects
Comparison of Initial Rate Parameters for Cytoplasmic and Mitochondrial Malate Dehydrogenases.
Problem Set 1
The enzyme Glucose-6-Phosphate Dehydrogenase was examined using NADP+ as substrate 1 and Glucose 6
Phosphate as substrate 2. Initial rates were measured at varying concentrations of both substrates using a protein
concentration of 0.034M in the cuvette
Concentration of S1 Concentration of S2 Average Initial Rate
M NADPH per
minute
Standard deviation
5mM 1.0mM 0.1232 0.0081
2.5 0.0969 0.0063
1.67 0.0732 0.0055
1.11 0.0577 0.0051
0.83 0.0444 0.0042
5mM 2.0mM 0.1942 0.0087
2.5 0.1493 0.0071
1.67 0.1190 0.0034
1.11 0.0939 0.0055
0.83 0.0758 0.0051
5mM 3.0mM 0.2985 0.0093
2.5 0.2326 0.0092
1.67 0.1887 0.0080
1.11 0.1493 0.0066
0.83 0.1212 0.0079
5mM 5.0mM 0.5263 0.0070

Malate Dehydrogenase Collaborative CUREs
Two Substrate Kinetics and Inhibition Module
University of San Diego
Jessica & Ellis Bell Copyright 28
2.5 0.4082 0.0065
1.67 0.3390 0.0071
1.11 0.2632 0.0080
0.83 0.2151 0.0081
5mM 10.0mM 0.8333 0.0063
2.5 0.5882 0.0089
1.67 0.4651 0.0088
1.11 0.3984 0.0081
0.83 0.3279 0.0066
Calculate the initial Rate Parameters for Glucose 6 Phosphate Dehydrogenase and Vmax, and Km for each
substrate.

Malate Dehydrogenase Collaborative CUREs
Two Substrate Kinetics and Inhibition Module
University of San Diego
Jessica & Ellis Bell Copyright 29
EXPERIMENT 3
Competitive Inhibitors
Many drugs and therapeutic agents are based on the principle that they look like the normal substrate [or ligand]
for an enzyme or protein and hence will bind specifically to that enzyme or protein and block the effects of the
normal substrate binding. In the case of an enzyme catalyzed reaction, this results in an inhibition of the activity
of the enzyme. However, since the normal substrate and the "inhibitor" compete for the normal binding site on
the enzyme, the inhibition can be overcome at a fixed concentration of the inhibitor by saturating with the
normal substrate: the inhibitor is a "competitive" inhibitor of substrate binding. The more tightly the inhibitor
binds to the active site of the enzyme, the more of the normal substrate is required to displace the inhibitor. The
tightness of inhibitor binding is assessed by the inhibition constant, Ki, which is the dissociation constant for the
inhibitor binding to the enzyme in the scheme:
Enzyme-Inhibitor Complex
The inclusion of this pathway in the presence of the inhibitor alters the Michaelis Menten Equation for the
reaction:
vo = Vmax[S]/Km + [S]}
Where 1 + [I]/Ki.
This has an effect also on the LineWeaver Burk equation for the system:
1/vo = {Km/Vmax} x 1/[S] + 1/Vmax
slope intercept
The value of Ki can be obtained by determining the effect of the presence of a known inhibitor concentration on
the slope of the LineWeaver Burk plot obtained with the "normal" substrate as the varied substrate:
Slope (with inhibitor present) = slope (no inhibitor present) x (that is 1 + [I]/Ki)
Thus the Dissociation Constant (Ki) for inhibitor binding can be readily determined experimentally.

Malate Dehydrogenase Collaborative CUREs
Two Substrate Kinetics and Inhibition Module
University of San Diego
Jessica & Ellis Bell Copyright 30
Ki = [E][I]/[EI] is related to the equilibrium constant for the binding of inhibitor to enzyme, Keq = [EI]/[E][I]
= 1/Ki, and hence is a measure of the Free Energy of Binding of the inhibitor to the enzyme:
Go = -RTln(1/Ki)
for example, an inhibition constant (dissociation constant) of 1mM (10-3M) at 25oC (298oK) results from a Go
of -4.096kcal/mol:
Go = -1.99 x 298 x ln(1/10-3) = -4.096kcal/mol
These values must be considered in light of the strengths of the various bond types that could be involved in the
non-covalent interaction of an inhibitor with an enzyme, shown in table
Table 3.1.
Type of Bond Example Bond Strength,
kJ.mol-1
Bond Strength,
kcal.mol-1
Ionic Interaction -COO- ….+H3N- 86 20.5
Hydrogen Bond -O-H…..O< 20 4.78
Van der Waals Forces
Dipole-Dipole >C=O…..>C=O 9.3 2.22
London Dispersion -CH2-H….H-CH2- 0.3 0.072
Consider if the structure of an inhibitor was changed so that it made one additional hydrogen bond to its target,
this would increase the free energy of binding by 4.78kcal mol-1. If the original inhibitor bound with a
dissociation constant of 1mM, as in our example above, we can calculate what the new inhibitor would have as
a dissociation constant:
Go for the new inhibitor would be -8.88kcal mol-1: -8,800 = 1.99 x 298 x ln(1/Kinew)
thus 14.97 = ln(1/Kinew) and the new dissociation constant would be 0.000315mM, over 3000-fold tighter
binding than the original compound.
The ratio of the increase in the affinity can be calculated directly using:
Go = -RT x ln(K1/K2), where (K1/K2) is the ratio of the two constants:
4,780 = 593 x ln(K1/K2) and hence (K1/K2) = 3,167
Note that this gives the same ratio as comparing the calculated dissociation constants. The gain or loss of a
hydrogen bond can have a very significant effect on the affinity of a protein for a compound. The relative
contributions of enthalpy and entropy to the binding of the inhibitor can be assessed by examining the
temperature dependence of Ki and the relationship:
ln(1/Ki) = {-Ho/R} x 1/T + So/R
where Ho and So represent enthalpy and entropy in the standard state and R is the Gas Constant, = 8.3145J.K-
1.mol-1 = 1.99cal.K-1.mol-1

Malate Dehydrogenase Collaborative CUREs
Two Substrate Kinetics and Inhibition Module
University of San Diego
Jessica & Ellis Bell Copyright 31
Experiment 3.1
Experiments to Investigate the Behavior of Structural Analogs and Competitive Inhibitors on the
Activity of Malate Dehydrogenase
Design Your Own Experiments:
Using the problem set below as a guide, design an experiment to investigate the relationship between structure
and affinity for one or more of the potential 3, 4 and 5 carbon analogs of malate shown in scheme 3.1. Fill in
Experimental Set Up Work Sheet 3.1 for the experiment where you investigate the effects of the inhibitor(s) you
choose as a function of varied oxaloacetate concentration. Fill in Experimental Set Up Work Sheet 3.2 for the
experiment where you investigate the effects of the inhibitor(s) you choose as a function of varied NADH
concentration. You may choose to do the experiment either with two different inhibitors and either NADH or
oxaloacetate varied, OR you can choose one inhibitor and examine its effects with a) NADH varied and b)
oxaloacetate varied. Remember the data that you collected in experiment 2 when deciding upon the NADH
concentrations to use. Your laboratory notebook should contain a detailed discussion of your experimental
design and should include some discussion about the structures of the analogs you choose to use. They, together
with the substrate-product pair, are shown here both as structures and as electrostatic surface potential diagrams.
Scheme 3.1
O
O
O
O
OH-
-
O
O
O
O
O-
-
Malate Oxaloacetate
O
OO
O
-
-
O
O
O
O
-
-
O
O
OO
-
-
Glutarate Succinate Malonate

Malate Dehydrogenase Collaborative CUREs
Two Substrate Kinetics and Inhibition Module
University of San Diego
Jessica & Ellis Bell Copyright 32
You are provided with the following solutions:
10mM Oxaloacetate in H2O
1mM NADH in H2O
0.04M Phosphate Buffer containing, pH 8.0
0.1mg/mL Malate Dehydrogenase in 0.1M Phosphate Buffer, pH 7.0
30mM Glutarate, in H2O
30mM Malonate, in H2O
30mM Succinate, in H2O
Decide upon the varied concentrations of Oxaloacetate [5 concentrations] that you want to use, calculate the
volumes to add to a total of 3mL and enter the volumes in the Experimental Set Up Work Sheet. Second, choose
two different concentrations of each inhibitor that you choose [each of them has Ki values in the range 1-5mM
as a guide to choosing your concentrations] and calculate how much of the inhibitor solution you need to add to
achieve those concentrations: enter these volumes in the appropriate parts of the work sheet. Finally calculate
how much NADH, buffer and water that you will add to each cuvette so that the total volume is 3mL
Experimental Set Up Work Sheet 3.1:
Cuvette # [OAA],
mM
mL OAA mL
Inhibitor
mL H2O mL Buffer mL NADH
NO
INHIBITOR
[ ]
Inhibitor 1
[ ]
Inhibitor 1
[ ]
Inhibitor 2
Malate Dehydrogenase Collaborative CUREs
Two Substrate Kinetics and Inhibition Module
University of San Diego
Jessica & Ellis Bell Copyright 33
[ ]
Inhibitor 2
Make up the cuvettes, in triplicate, as detailed above and one cuvette at a time initiate the reaction by the
addition of 10L of the stock Malate Dehydrogenase solution.
Calculate the A/minute and enter the values into the Data Analysis Work Sheet below
Data Analysis Work Sheet 3.2:
[OAA] Rate #1 Rate #2 Rate #3 Average Standard
Deviation
NO
INHIBITOR
[ ] mM
Inhibitor 1
[ ] mM
Inhibitor 1
[ ] mM
Inhibitor 2
[ ] mM

Malate Dehydrogenase Collaborative CUREs
Two Substrate Kinetics and Inhibition Module
University of San Diego
Jessica & Ellis Bell Copyright 34
Inhibitor 2
Convert the average rates and standard deviations into rates in terms of nM NADH utilized per minute and enter
into Data Analysis Work Sheet 3.3.
Data Analysis Work Sheet 3.3
[OAA], mM Average Rate
nM NADH/minute
Standard Deviation
nM NADH/minute
% Standard Deviation
NO INHIBITOR
[ ] mM
Inhibitor 1
[ ] mM
Inibitor 1
[ ] mM
Inhibitor 2
[ ] mM
Inhibitor 2

Malate Dehydrogenase Collaborative CUREs
Two Substrate Kinetics and Inhibition Module
University of San Diego
Jessica & Ellis Bell Copyright 35
Construct LineWeaver Burk Plots for each set of Oxaloacetate Varied Data and analyze each line to obtain a
slope and intercept and the associated standard deviations. Enter these values into Data Analysis Work Sheet
3.4.
Data Analysis Work Sheet 3.4
Condition Slope Std. Deviation Intercept Std. Deviation
No Inhibitor
mM Inhibitor 1
mM Inhibitor 1
mM Inhibitor 2
mM Inhibitor 2
From the effects of the inhibitor on the slope and intercept determine whether the inhibitor obeys competitive
inhibitor behavior and calculate the Ki values form the slope effects.
Mixed Inhibitors
Sometimes the inhibitory molecule can bind not only to free enzyme but also to the enzyme-substrate complex,
causing an additional mode of inhibition:
The inclusion of this pathway in the presence of the inhibitor alters the Michaelis Menten Equation for the
reaction:
Vo = Vmax[S]/Km + [S]}
Where 1 + [I]/Ki
And 1 + [I]/Ki'
This has an effect also on the LineWeaver Burk equation for the system:

Malate Dehydrogenase Collaborative CUREs
Two Substrate Kinetics and Inhibition Module
University of San Diego
Jessica & Ellis Bell Copyright 36
1/vo = {Km/Vmax} x 1/[S] + /Vmax
slope intercept
The value of Ki can be obtained by determining the effect of the presence of a known inhibitor concentration on
the slope of the LineWeaver Burk plot obtained with the "normal" substrate as the varied substrate:
Slope (with inhibitor present) = slope (no inhibitor present) x (that is 1 + [I]/Ki)
While the value of Ki' can be obtained by determining the effect of the presence of a known inhibitor
concentration on the intercept of the LineWeaver Burk plot obtained with the "normal" substrate as the varied
substrate.
Thus the two Dissociation Constants (Ki and KI') for inhibitor binding can be readily determined experimentally
and have quite different physical significance: Ki represents the tightness of binding to free enzyme while Ki'
represents the tightness of binding to the Enzyme-Substrate Complex. When both modes of binding can occur
the inhibition is said to be "mixed" type inhibition.
Occasionally an inhibitor will bind only to the Enzyme-Substrate complex and the LineWeaver Burk equation
will contain the term and not the term in the equation above:
1/vo = {Km/Vmax} x 1/[S] + /Vmax
slope intercept
As a result, the intercept of the resultant LineWeaver Burk plot, not the slope, will be altered in the presence of
the inhibitor and the inhibition will be "uncompetitive."
When reporting Ki values it is important to indicate whether the Ki value was calculated from a slope effect
or from an intercept effect.

Malate Dehydrogenase Collaborative CUREs
Two Substrate Kinetics and Inhibition Module
University of San Diego
Jessica & Ellis Bell Copyright 37
Experiment 3.2
Determination of the Inhibition Patterns of Malate Dehydrogenase by Oxaloacetate Analogs, with NADH
as the Varied Substrate
In the previous experiment, 3.1, a series of structural analogs of Oxaloacetate/Malate were used as potential
inhibitors of Malate Dehydrogenase, with Oxaloacetate as the varied substrate. In this experiment, you will
utilize the same inhibitors, but with NADH as the varied substrate. In this case, it is important that you decide
what Oxaloacetate concentration to use. If it is too high, you may swamp out the effect of the inhibitors, at least
in terms of the "competitive" component of any inhibition [ie the slope effect]. You should choose a
concentration that is about the same as the Km concentration for Oxaloacetate that you found in experiment 3.1,
ie around 50M.
The design of the experiment will be essentially the same as in the experiments with Oxaloacetate as the varied
substrate and you are provided with the same stock solutions of reagents that you used in that part of the
experiment. Design the experiment using Experimental Set Up Work Sheet 3.5
Experimental Set Up Work Sheet 3.5:
Cuvette # [NADH],
mM
mL NADH mL
Inhibitor
mL H2O mL Buffer mL OAA
NO
INHIBITOR
[ ]
Inhibitor 1
[ ]
Inhibitor 1
[ ]
Inhibitor 2

Malate Dehydrogenase Collaborative CUREs
Two Substrate Kinetics and Inhibition Module
University of San Diego
Jessica & Ellis Bell Copyright 38
[ ]
Inhibitor 2
Make up the cuvettes, in triplicate, as detailed above and one cuvette at a time initiate the reaction by the
addition of 10L of the stock Malate Dehydrogenase solution.
Calculate the A/minute and enter the values into the Data Analysis Work Sheet 3.6 below.
Data Analysis Work Sheet 3.6:
[NAD+] Rate #1 Rate #2 Rate #3 Average Std Deviation
NO
INHIBITOR
[ ] mM
Inhibitor 1
[ ] mM
Inhibitor 1
[ ] mM
Inhibitor 2
[ ] mM
Inhibitor 2

Malate Dehydrogenase Collaborative CUREs
Two Substrate Kinetics and Inhibition Module
University of San Diego
Jessica & Ellis Bell Copyright 39
Convert the average rates and standard deviations into rates in terms of nM NADH utilized per minute and enter
into Data Analysis Work Sheet 3.7.
Data Analysis Work Sheet 3.7
[NADH], M Average Rate
nM NADH/minute
Standard Deviation
nM NADH/minute
% Standard Deviation
NO INHIBITOR
[ ] mM
Inhibitor 1
[ ] mM
Inibitor 1
[ ] mM
Inhibitor 2
[ ] mM
Inhibitor 2
Malate Dehydrogenase Collaborative CUREs
Two Substrate Kinetics and Inhibition Module
University of San Diego
Jessica & Ellis Bell Copyright 40
Construct LineWeaver Burk Plots for each set of NADH Varied Data and analyze each line to obtain a slope
and intercept and the associated standard deviations. Enter these values into Data Analysis Work Sheet 3.8.
Data Analysis Work Sheet 3.8
Condition Slope Std. Deviation Intercept Std. Deviation
No Inhibitor
mM Inhibitor 1
mM Inhibitor 1
mM Inhibitor 2
mM Inhibitor 2
From the effects of the inhibitor on the slope and intercept determine whether the inhibitor obeys competitive or
mixed inhibitor behavior and calculate the appropriate Ki values.
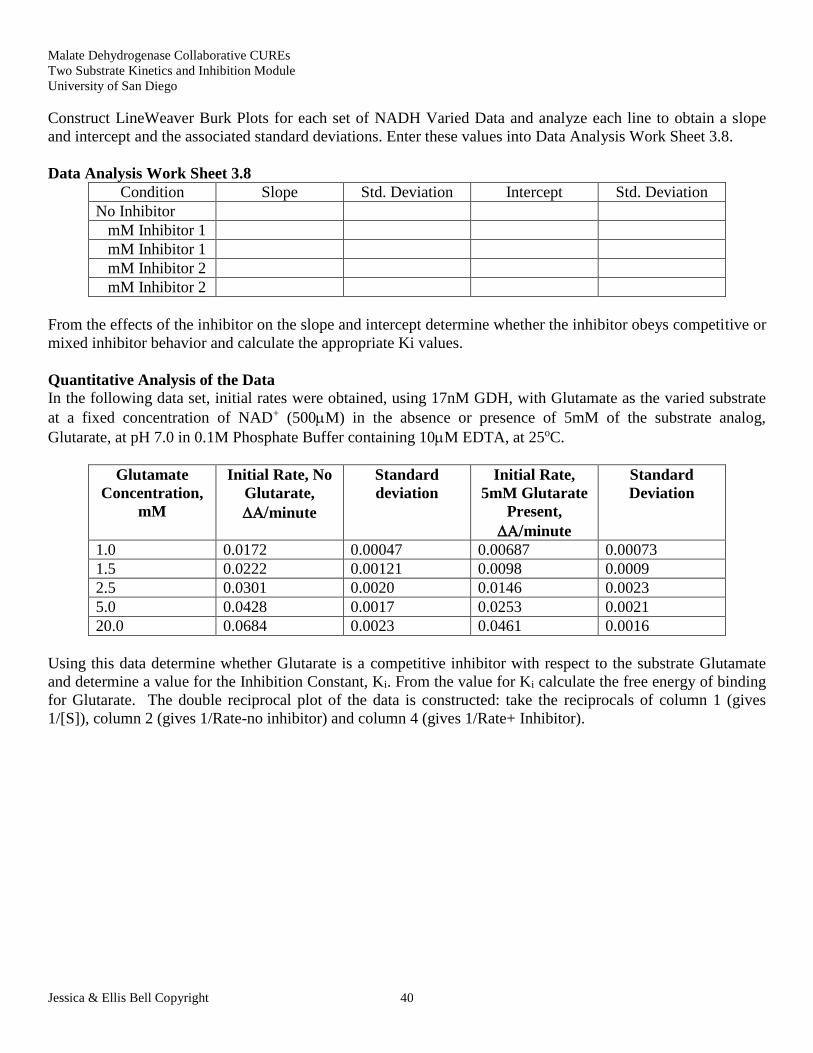
Quantitative Analysis of the Data
In the following data set, initial rates were obtained, using 17nM GDH, with Glutamate as the varied substrate
at a fixed concentration of NAD+ (500M) in the absence or presence of 5mM of the substrate analog,
Glutarate, at pH 7.0 in 0.1M Phosphate Buffer containing 10M EDTA, at 25oC.
Glutamate
Concentration,
mM
Initial Rate, No
Glutarate,
minute
Standard
deviation
Initial Rate,
5mM Glutarate
Present,
minute
Standard
Deviation
1.0 0.0172 0.00047 0.00687 0.00073
1.5 0.0222 0.00121 0.0098 0.0009
2.5 0.0301 0.0020 0.0146 0.0023
5.0 0.0428 0.0017 0.0253 0.0021
20.0 0.0684 0.0023 0.0461 0.0016
Using this data determine whether Glutarate is a competitive inhibitor with respect to the substrate Glutamate
and determine a value for the Inhibition Constant, Ki. From the value for Ki calculate the free energy of binding
for Glutarate. The double reciprocal plot of the data is constructed: take the reciprocals of column 1 (gives
1/[S]), column 2 (gives 1/Rate-no inhibitor) and column 4 (gives 1/Rate+ Inhibitor).
Malate Dehydrogenase Collaborative CUREs
Two Substrate Kinetics and Inhibition Module
University of San Diego
Jessica & Ellis Bell Copyright 41
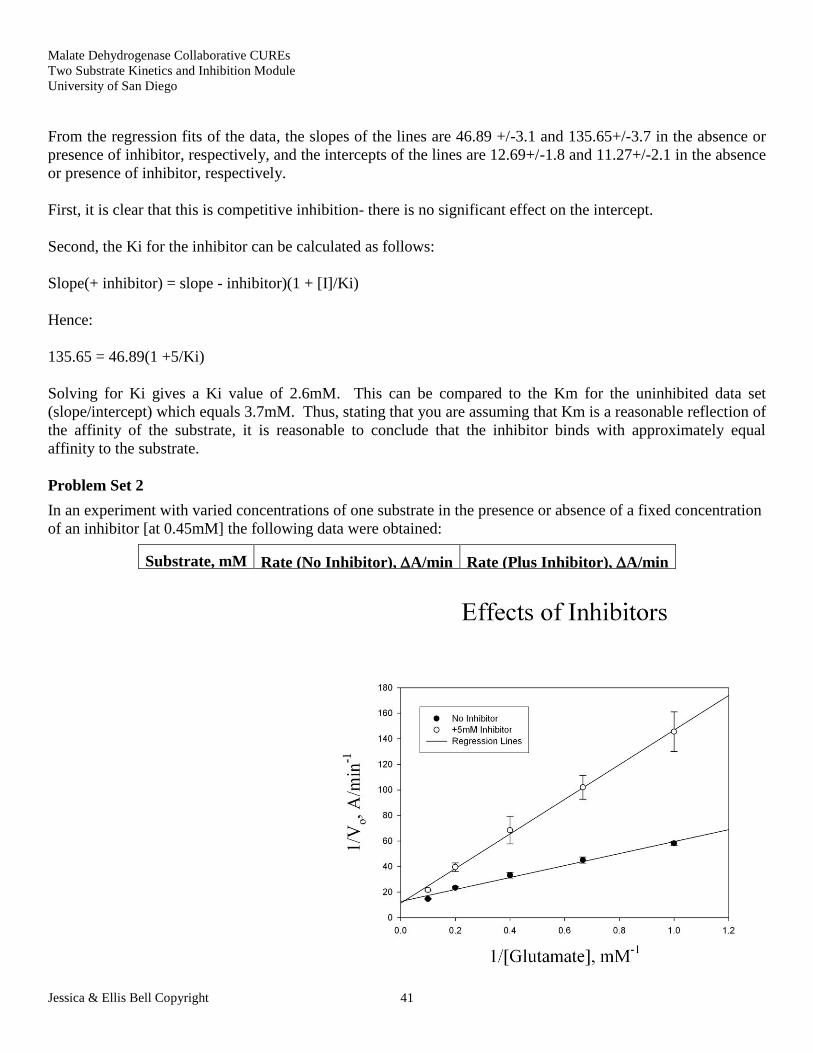
From the regression fits of the data, the slopes of the lines are 46.89 +/-3.1 and 135.65+/-3.7 in the absence or
presence of inhibitor, respectively, and the intercepts of the lines are 12.69+/-1.8 and 11.27+/-2.1 in the absence
or presence of inhibitor, respectively.
First, it is clear that this is competitive inhibition- there is no significant effect on the intercept.
Second, the Ki for the inhibitor can be calculated as follows:
Slope(+ inhibitor) = slope - inhibitor)(1 + [I]/Ki)
Hence:
135.65 = 46.89(1 +5/Ki)
Solving for Ki gives a Ki value of 2.6mM. This can be compared to the Km for the uninhibited data set
(slope/intercept) which equals 3.7mM. Thus, stating that you are assuming that Km is a reasonable reflection of
the affinity of the substrate, it is reasonable to conclude that the inhibitor binds with approximately equal
affinity to the substrate.
Problem Set 2
In an experiment with varied concentrations of one substrate in the presence or absence of a fixed concentration
of an inhibitor [at 0.45mM] the following data were obtained:
Substrate, mM Rate (No Inhibitor), A/min Rate (Plus Inhibitor), A/min

Malate Dehydrogenase Collaborative CUREs
Two Substrate Kinetics and Inhibition Module
University of San Diego
Jessica & Ellis Bell Copyright 42
2.0 0.606 0.247
1.0 0.513 0.192
0.5 0.435 0.149
0.33 0.345 0.118
0.25 0.278 0.093
0.2 0.241 0.078
0.17 0.213 0.077
How tightly does the inhibitor bind relative to the substrate?
In a separate experiment, the pH dependence of Km for the substrate was examined and the following data
obtained:
pH Km, mM
6.0 5.1
7.0 5.2
8.0 3.9
9.0 0.9
10.0 0.6
What would you conclude about the nature of the interaction between the substrate and the enzyme?
EXPERIMENT 4
Determination of Thermodynamic Parameters from Kinetic Experiments:
Experiment 4.1
Determining the Thermodynamic Parameters of Inhibitor Binding to Malate Dehydrogenase.
As discussed in the introduction to this section on Inhibitor effects, the Ki for an inhibitor is directly related to
the free energy of binding of the inhibitor, G. By studying the effects of temperature on Ki, values for both the
enthalpy changes and entropy changes associated with inhibitor binding to the enzyme can be determined.
Using the above experiment as a guide, a class experiment, where each pair of students determines a Ki value
for the inhibitor at a particular temperature can be conducted. At the end of the experiment the class pools their
data for the values of Ki at whatever temperature they used and each student can calculate the appropriate
thermodynamic parameters. For example by using a range of temperatures from 15oC to 40oC the relative
contributions of enthalpy and entropy to the binding of each of the above inhibitors can be determined.
Problem Set 2:
The Following data was collected during studies of the inhibition of Aspartate Aminotransferase by a series of
structural analogs of L-Aspartate:
Parameter 23oC 30oC 37oC 45oC
Succinate 0.054mM 0.2mM 0.45mM 1.37mM

Malate Dehydrogenase Collaborative CUREs
Two Substrate Kinetics and Inhibition Module
University of San Diego
Jessica & Ellis Bell Copyright 43
Glutarate 0.42mM 0.48mM 0.53mM 0.58mM
D-Glutamate 1.0mM 0.8mM 1.0mM 0.9mM
L-OH-Glutarate 5.8mM 6.5mM 4.6mM 3.2mM
Km (Asp) 2.1mM 1.2mM 0.8mM 0.7mM
Vmax 0.23nM/sec 0.31nM/sec 0.64nM/sec 1.49nM/sec
Calculate the appropriate thermodynamic parameters from this data and draw what conclusions you can from
the complete set of results.