the lsa saf vegetation products and applications: drought ... · banda 1 ∑ = = n i j i i j k k k...
TRANSCRIPT
F. Javier García-Haro (UV: University of Valencia, Spain)
With contributions from Fernando Camacho (EOLAB), Beatriz Martínez (UV)Other contributors: Isabel Monteiro, Julia Stoyanova, K. Guan
The LSA SAF vegetation products and applications: drought monitoring
EUMeTrain Event Week 2014: Droughts, Floods and Landslides 1-5 December 2014
INDEX
LSA SAF vegetation products
Expert knowledge: advantages and limitations
Some applications
Derivation of phenological information
Response of vegetation to rainfall deficit
Near real time detection/monitoring of drought related disturbances

3
LSA SAF VEGA SEVIRI daily products
Example: 15 April 2007
Euro
NAfr
SAfr
SAme
http://landsat.meteo.pt
LAIFVC FAPARSEVIRI “VEGA”: daily products
landsaf.ipma.pt

4
VEGA: Daily (MDVEGA) and 10-day (MTVEGA)
10-day VEGA (MTVEGA) based on AL3 (time scale of 30-day)
Daily and 10-day are spatially and temporally consistent

• Fraction of ‘ green’ Vegetation Cover (FVC)⇒ Probabilistic Spectral Mixture Analysis
( )0
0ln)0(
1a
FVCaGb
LAIs
−⋅
Ω⋅=⋅−
=θ
Algorithms description
V1
V2
V3
S1
S2
S3
Banda 1
∑=
= N
i iij
KKjjK
MMrp
MMrprMp
1)()|(
)()|()|(
π
π
×
Mixed pixel, Rj
2 components (veg,soil): R = Rv fv + Rs fs
Each component: mixture of gaussians
∑=
ΣjG
kjkjkkk
1),(µφτ
Bayesian Theory
• ‘True’ Leaf Area Index (LAI)Pragmatic approach of Roujean and Lacaze, (2002) based on a modified Beer’s law:
b=0.97, G=0.5, clumping (Ω) from a GLC-2000 lookup table (Chen et al. 2005). 5

• ’Daily’ Fraction of Absorbed PAR (FAPAR)Statistical relationship established between a vegetation index (RDVI) in anoptimal geometry and daily integrated FAPAR by using RT simulations withPROSPECT+SAIL model (Roujean and Breon, 1995).
FAPAR=1.81*(RDVI)opt - 0.21
Minimum dispersion FAPAR-RDVI was found in the Principal Plane, VZA=45ºand SZA=60º.
Algorithms description
RNIRRNIRDVINDVIRDVI+−
=⋅= 2/1)(
Ropt(λ)= k0(λ) - 0.240*k1(λ) + 0.202*k2(λ)
6
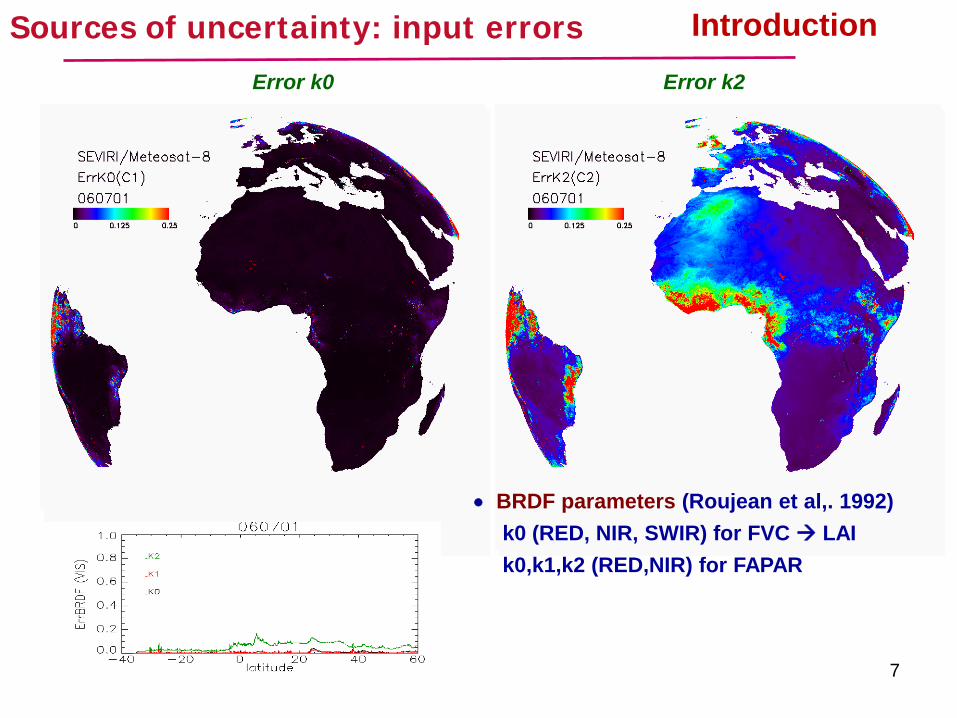
Error k0 Error k2
Sources of uncertainty: input errors
• BRDF parameters (Roujean et al,. 1992)k0 (RED, NIR, SWIR) for FVC LAIk0,k1,k2 (RED,NIR) for FAPAR
Introduction
7
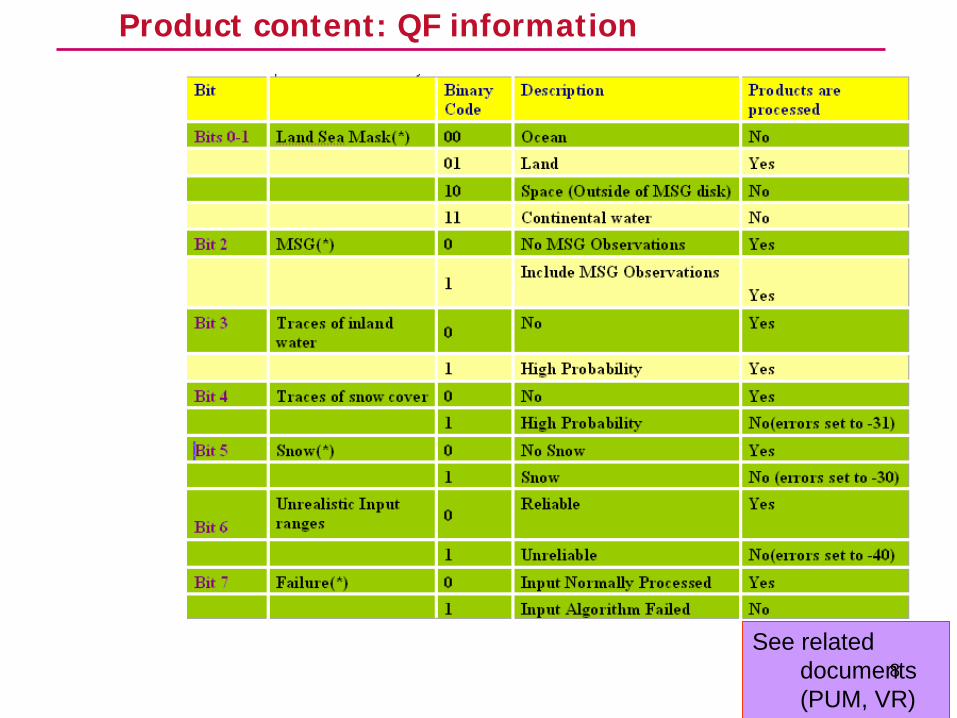
See related documents (PUM, VR)
Product content: QF information
8

Error Map (Sept’05-Sept’07) FVC v2.1
9

EuropeError Map consistency between products
10
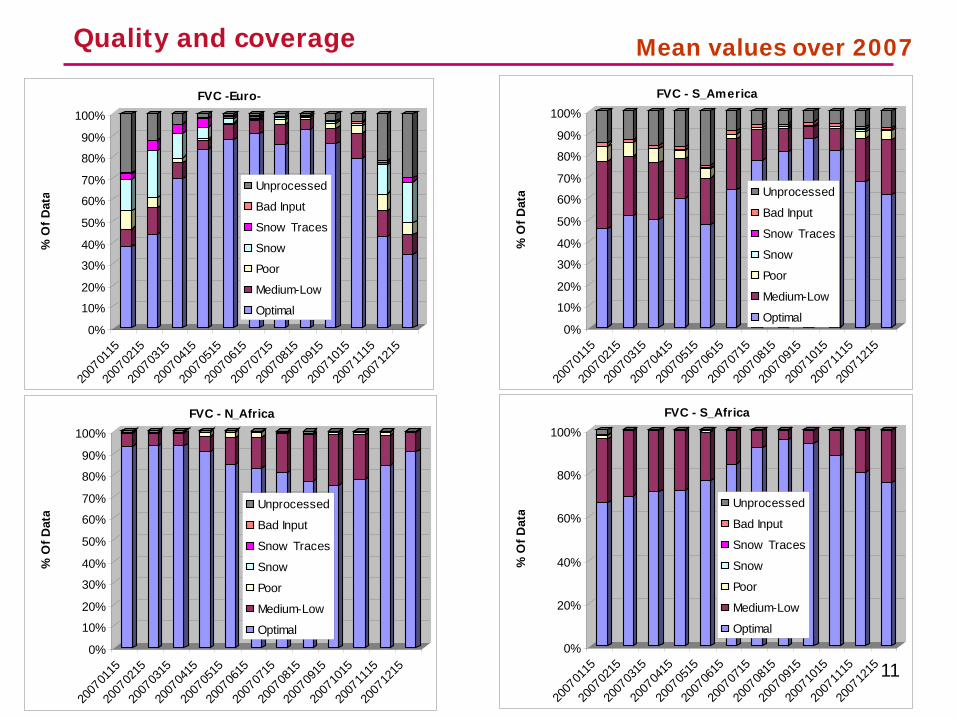
Mean values over 2007Quality and coverage
0%
10%
20%
30%
40%
50%
60%
70%
80%
90%
100%
% O
f Dat
a
2007
0115
2007
0215
2007
0315
2007
0415
2007
0515
2007
0615
2007
0715
2007
0815
2007
0915
2007
1015
2007
1115
2007
1215
FVC -Euro-
Unprocessed
Bad Input
Snow Traces
Snow
Poor
Medium-Low
Optimal
0%
10%
20%
30%
40%
50%
60%
70%
80%
90%
100%
% O
f Dat
a
2007
0115
2007
0215
2007
0315
2007
0415
2007
0515
2007
0615
2007
0715
2007
0815
2007
0915
2007
1015
2007
1115
2007
1215
FVC - N_Africa
Unprocessed
Bad Input
Snow Traces
Snow
Poor
Medium-Low
Optimal
0%
10%
20%
30%
40%
50%
60%
70%
80%
90%
100%
% O
f Dat
a
2007
0115
2007
0215
2007
0315
2007
0415
2007
0515
2007
0615
2007
0715
2007
0815
2007
0915
2007
1015
2007
1115
2007
1215
FVC - S_America
Unprocessed
Bad Input
Snow Traces
Snow
Poor
Medium-Low
Optimal
0%
20%
40%
60%
80%
100%
% O
f Dat
a
2007
0115
2007
0215
2007
0315
2007
0415
2007
0515
2007
0615
2007
0715
2007
0815
2007
0915
2007
1015
2007
1115
2007
1215
FVC - S_Africa
Unprocessed
Bad Input
Snow Traces
Snow
Poor
Medium-Low
Optimal
11
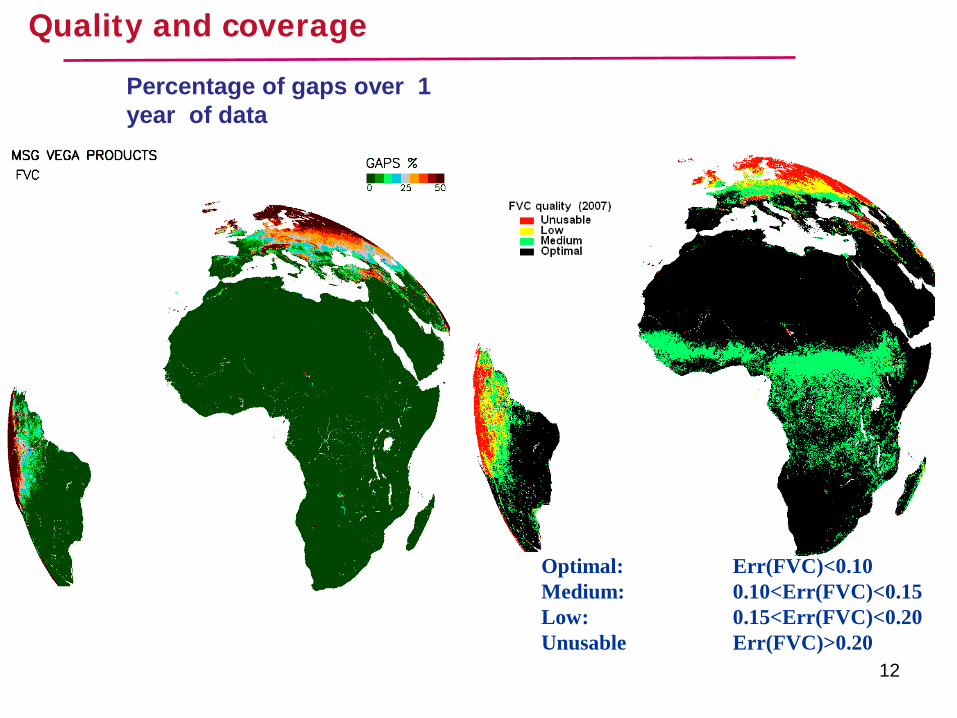
Quality and coverage
Percentage of gaps over 1 year of data
Optimal: Err(FVC)<0.10Medium: 0.10<Err(FVC)<0.15Low: 0.15<Err(FVC)<0.20Unusable Err(FVC)>0.20
12
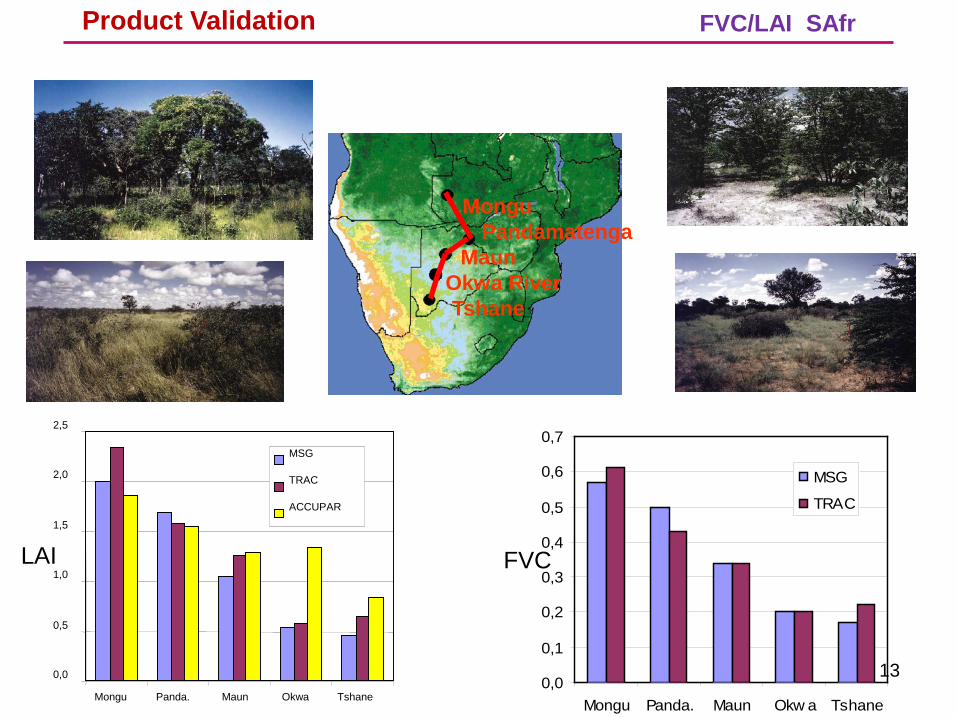
Product Validation
MonguPandamatenga
Maun Okwa River Tshane
0,0
0,5
1,0
1,5
2,0
2,5
Mongu Panda. Maun Okwa Tshane
MSG
TRAC
ACCUPAR
LAI
0,0
0,1
0,2
0,3
0,4
0,5
0,6
0,7
Mongu Panda. Maun Okw a Tshane
MSG
TRAC
FVC
FVC/LAI SAfr
13

14
Product validation Comparison with VGT4SAFRICA FVC
14

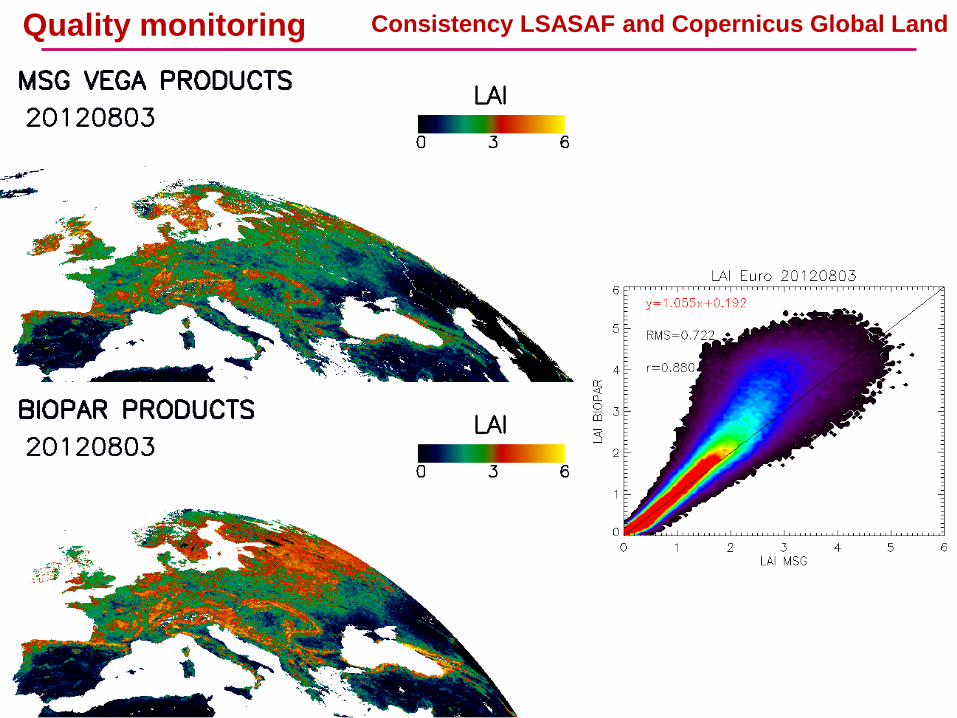
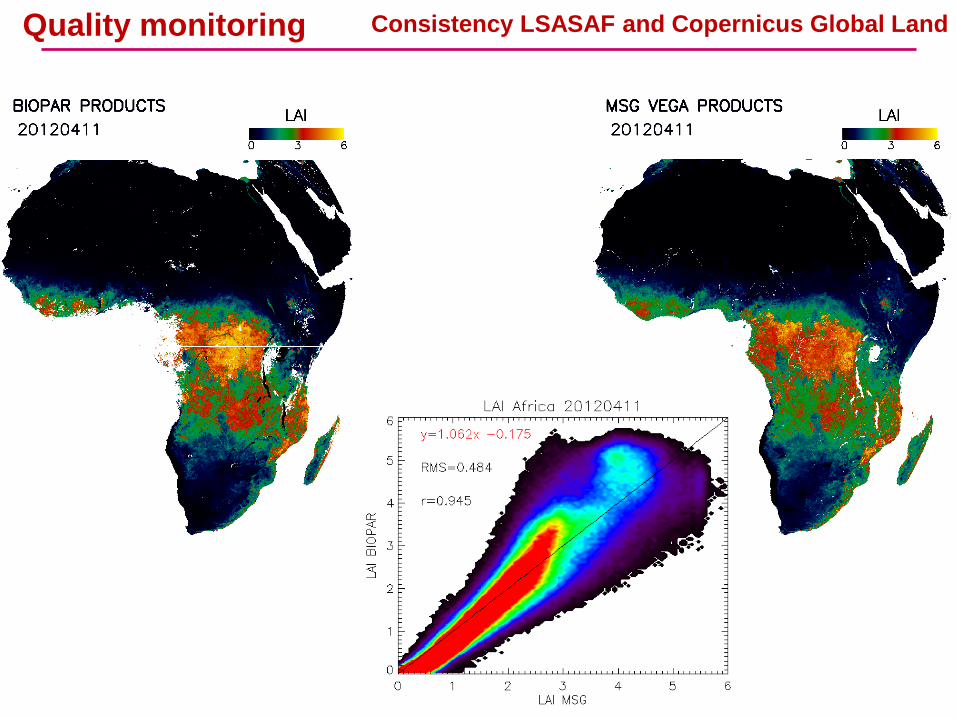
Quality monitoring Consistency LSASAF and Copernicus Global Land
Quality monitoring Consistency LSASAF and Copernicus Global Land


Quality monitoring Consistency LSASAF and Copernicus Global Land
Quality monitoring Consistency LSASAF and Copernicus Global Land

Quality monitoring Consistency LSASAF and Copernicus Global Land

Quality monitoring Consistency LSASAF and Copernicus Global Land

Quality monitoring Consistency LSASAF and Copernicus Global Land

2006 2007 2008 2009 2010 2011 2012 20130
1
2
3
4
5
6
DOY
LAI
SudOuest
LAI MSGMOD15A2LAI BIOPARIN SITU
Quality monitoring Temporal consistency
2006 2007 2008 2009 2010 2011 2012 20130
1
2
3
4
5
6
DOY
LAI
Mongu
LAI MSGMOD15A2LAI BIOPARIN SITU
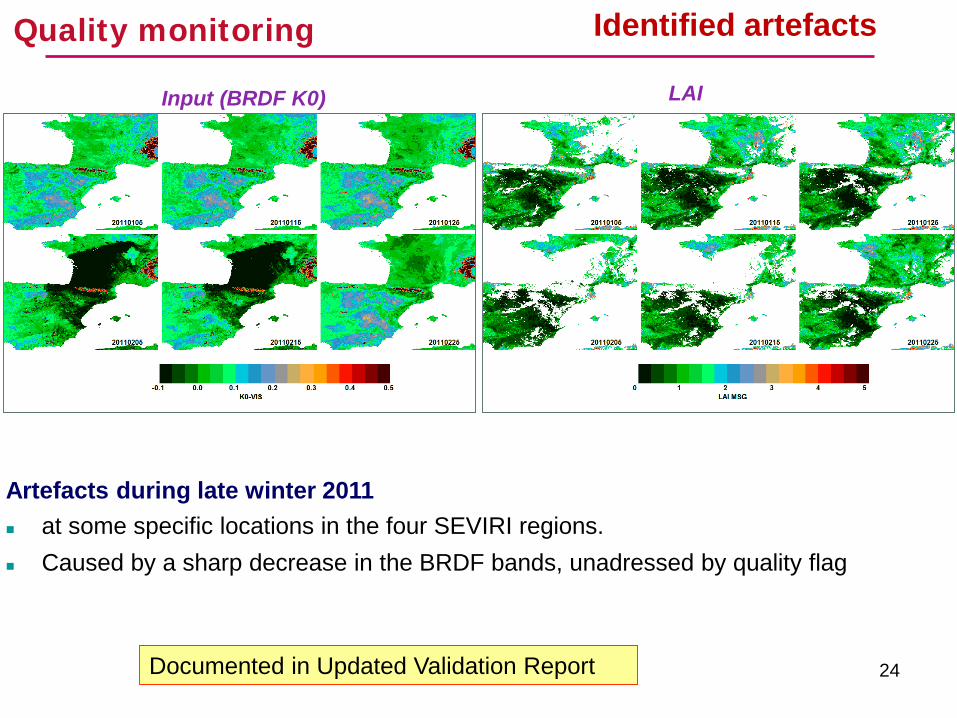
Identified artefacts
Input (BRDF K0)
Artefacts during late winter 2011 at some specific locations in the four SEVIRI regions. Caused by a sharp decrease in the BRDF bands, unadressed by quality flag
LAI
Documented in Updated Validation Report
Quality monitoring
24
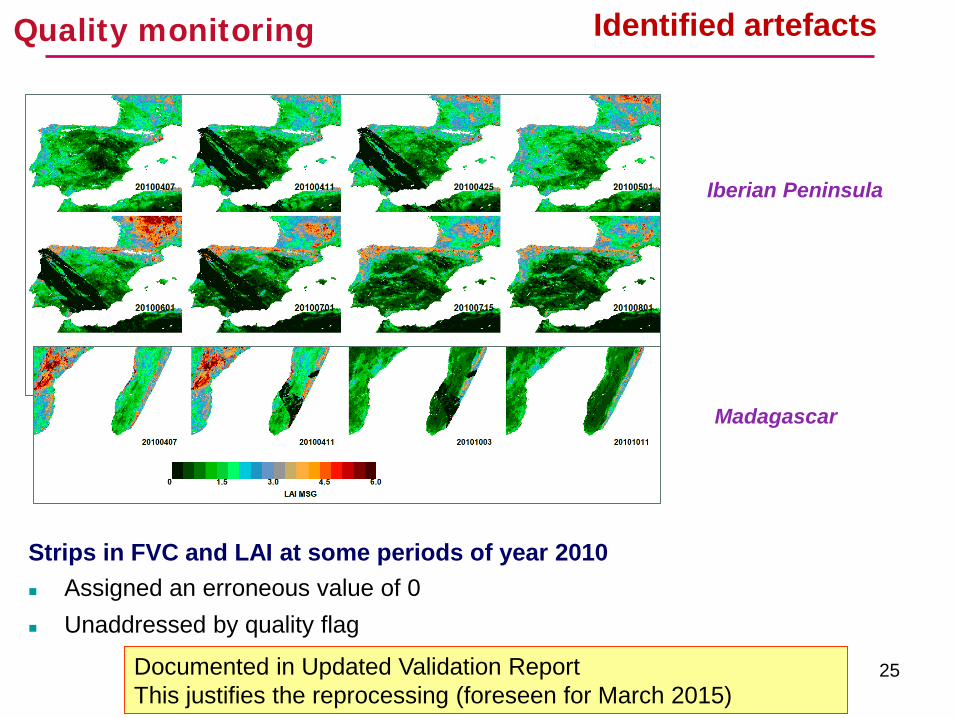
25
Strips in FVC and LAI at some periods of year 2010 Assigned an erroneous value of 0 Unaddressed by quality flag
Documented in Updated Validation ReportThis justifies the reprocessing (foreseen for March 2015)
Iberian Peninsula
Madagascar
Identified artefactsQuality monitoring

Canopy Water Content (CWC)
Products under develpment
Gross PrimaryProductivity (GPP)
Global FVC, LAI, FAPAR from AVHRR/Metop

Sequence of products over a 50-day period, S_Africa (0º S, 11.2º E – 8.3ºS, 23.2ºE).
INDIRECT VALIDATIONMODIS LAI Land-SAF LAI
The temporal continuity and stability of LAI MSG product clearly outperforms that of MODIS product.
Added value with regard to similar products Expert knowledge
27

Reconstruction of seasonal curves
False second-season False second-seasonFalse second-season
Potential applications
Ja Fe Ma Ap Ma Jun Jul Au Se
Start of growing season 2007
Africa is a consolidated region: no gaps, temporal continuity, improving the capabilities of polar orbiters to characterise the phenology

Deriving phenologic attributes Potential applications
Seasonal metrics Base level, amplitude,
phase indicators of productivity,
and timing. More reliable than
(MODIS, VGT) derived

30by Isabel Monteiro (EUMETRAIN)
Guan, K., E. F. Wood, D. Medvigy, K. K. Caylor, S. Li and S. J. Jeong, (2013), Derive vegetation phenological time and structure information over Africa using SEVIRI daily LAI, IEEE transactions on Geoscience and Remote Sensing, 52:1113-1130.
Deriving phenologic attributes Potential applications
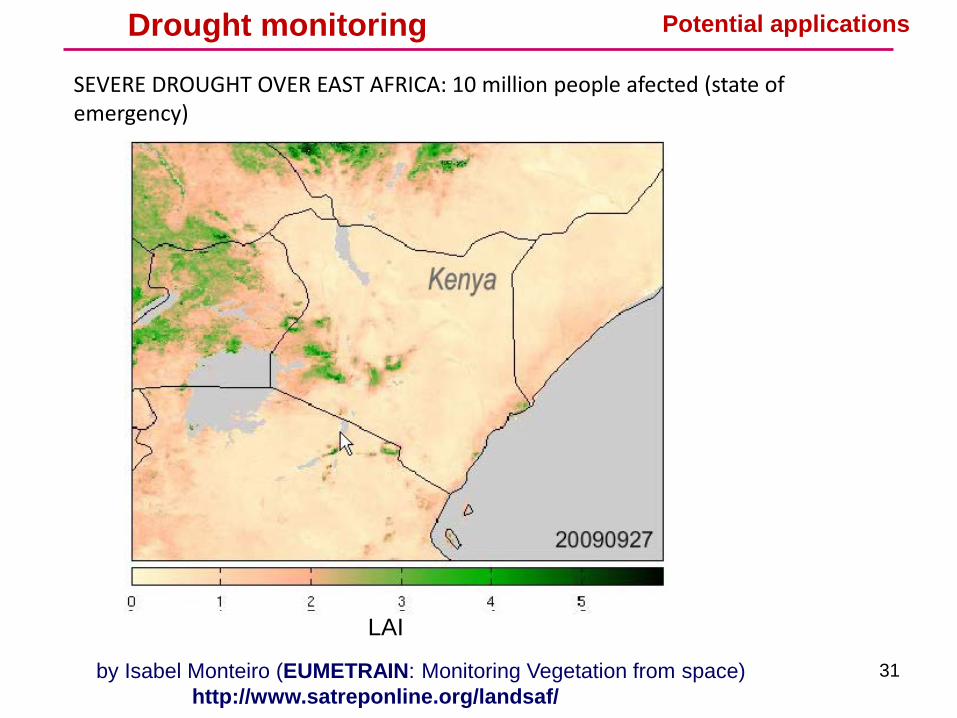
SEVERE DROUGHT OVER EAST AFRICA: 10 million people afected (state of emergency)
Drought monitoring
LAI
by Isabel Monteiro (EUMETRAIN: Monitoring Vegetation from space)http://www.satreponline.org/landsaf/
Potential applications
31

32•From Julia Stoyanova (Bulgarian National Institute of Meteorology and Hydrology)
Drought monitoring from LSA SAF products

33
Meterological data
Moisture index
Extremely drySeverely dryModerately drySlightly drySlightly wetModerately wetVery wetExtremely wet
Extremely drySeverely dryModerately drySlightly drySlightly wetModerately wetVery wetExtremely wet
SPI
AFRICA 10-day rainfall estimates (RFE 2.0) for Africa from the NOAA Climate Prediction
Center (NOAA/CPC) at a spatial resolution of 8-km monthly and 3-montly accumulated
SPAIN Monthly P,T records from all AEMET (Spanish Agency of Meteorology) stations. Images of climatic variables were interpolated (2-km) Thornthwaite Moisture index ⇒ climatic classification Standardised Precipitation index (SPI-i) at i-month scales (i=1,3,6,12)
Drought Applications

Impact of 2004-06 drought in SpainFEEDBACKS CLIMATE-VEGETATION
FVC anomaly (June’05) vs SPI-3 (March-May)
FVC shows large deviation for certains classes/periods in water-limited areas
Shrub, herbaceous and broadleaved are very sensitive to drought
Extremely drySeverely dryModerately drySlightly drySlightly wetModerately wetVery wetExtremely wet
Extremely drySeverely dryModerately drySlightly drySlightly wetModerately wetVery wetExtremely wet
SPI-12 (August’04 – July’05)
0 100 200 3000
0.2
0.4
0.6
0.8
Herbaceous
Day of Year
FVC
0 100 200 3000
0.2
0.4
0.6
0.8
Broadleaved Forest
Day of Year
FVC

Spatial distributionINTERRELATION CLIMATE-VEGETATION
Climatic Type Moisture IndexA Very humid ≥ 100 B4 Humid 80 to100B3 Humid 60 to 80B2 Humid 40 to 60B1 Humid 20 to 40C2 Moist subhumid 0 to 20C1 Dry subhumid -20 to 0
D Semiarid -40 to -20E Arid -60 to -40
0
0.2
0.4
0.6
0.8
1
FVC
Climatic Type
E D C1
C2 B1
B2
B3
B4 A
2096 24912 67968 23776 11072 5840 4928 5904 10432
relationships between water availability and vegetation coverage in Spain
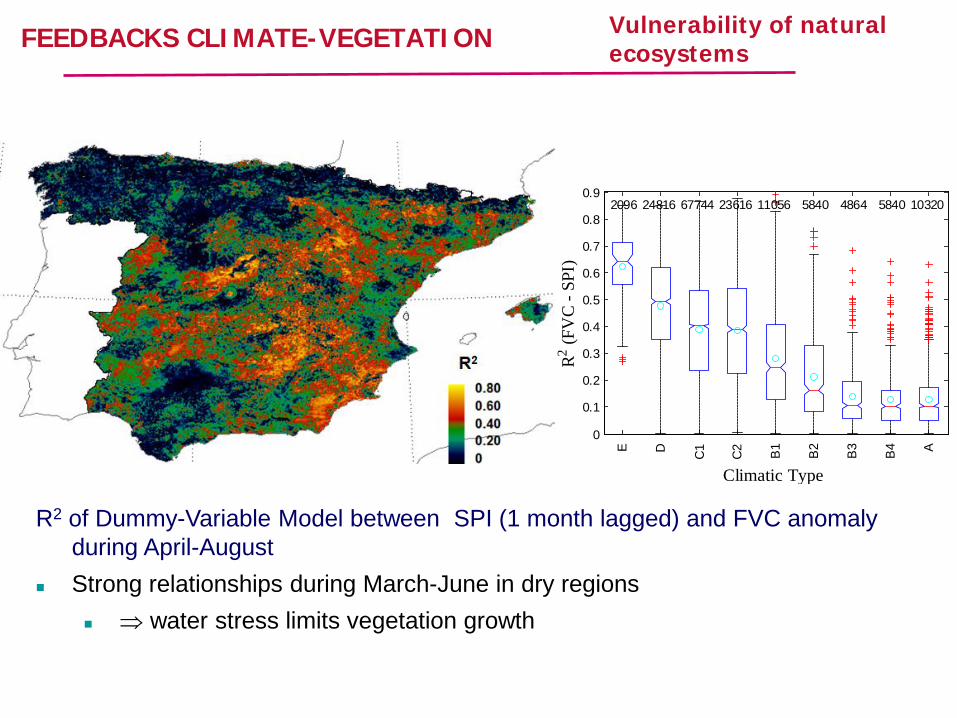
Vulnerability of natural ecosystemsFEEDBACKS CLIMATE-VEGETATION
0
0.1
0.2
0.3
0.4
0.5
0.6
0.7
0.8
0.9
R2 (FV
C -
SPI)
Climatic Type
E D C1
C2 B1
B2
B3
B4 A
2096 24816 67744 23616 11056 5840 4864 5840 10320
R2 of Dummy-Variable Model between SPI (1 month lagged) and FVC anomaly during April-August
Strong relationships during March-June in dry regions ⇒ water stress limits vegetation growth
37
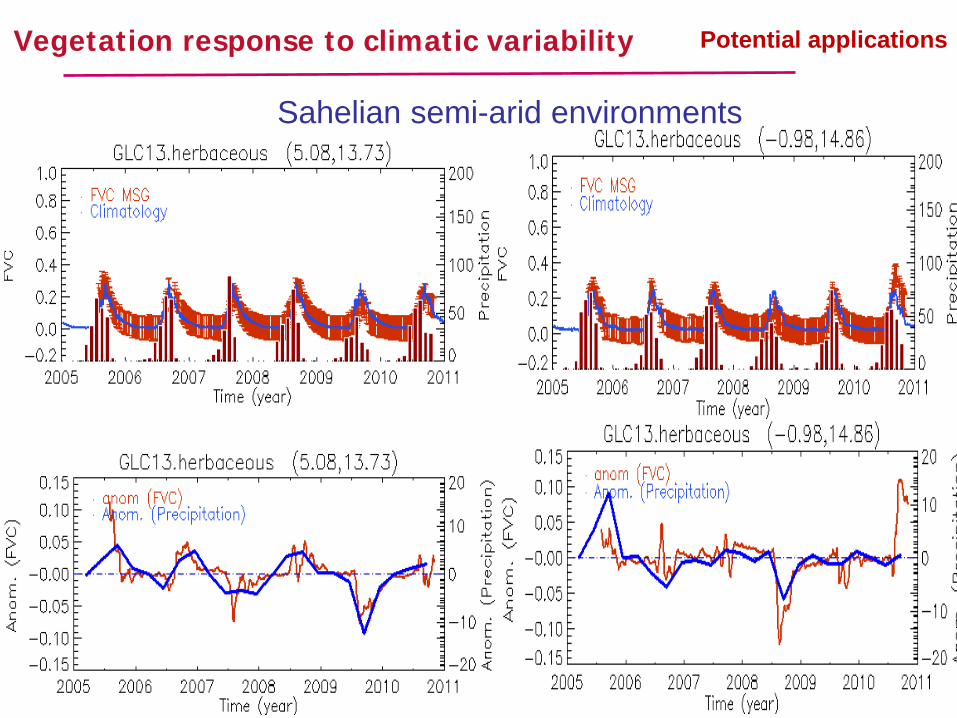
Vegetation response to climatic variability Potential applications
Sahelian semi-arid environments

tttt RandomStationalTrendY ++=
Model
Modeling the dynamics of vegetation Season-trend parametric model:
Example: Time series of SEVIRI FVC
Residual
Automated monitoring of vegetation disturbance
( )∑=
+++=3
110 sin)(
kkk kwtAtaatFVC ϕ
APPLICATIONS: Real time detection (drought, fire): Retrospectively monitoring of disturbances
Extent, severity, duration (start, period of recovery)
y
t YYtresidstd
σ
ˆ)(_
−=
Example: Disturbance measure

39
Automated monitoring of vegetation disturbance
Example: Drought in Somalia (2011)
FVC/MSG time series Savanna, 2 growing seasons
SEVIRI Capabilities (VEGA) High frequency and continuity Normal season-trend can be
usually captured from a single year
⇒ VEGA is specially suited for very rapid detection (e.g. < 1 month)

40
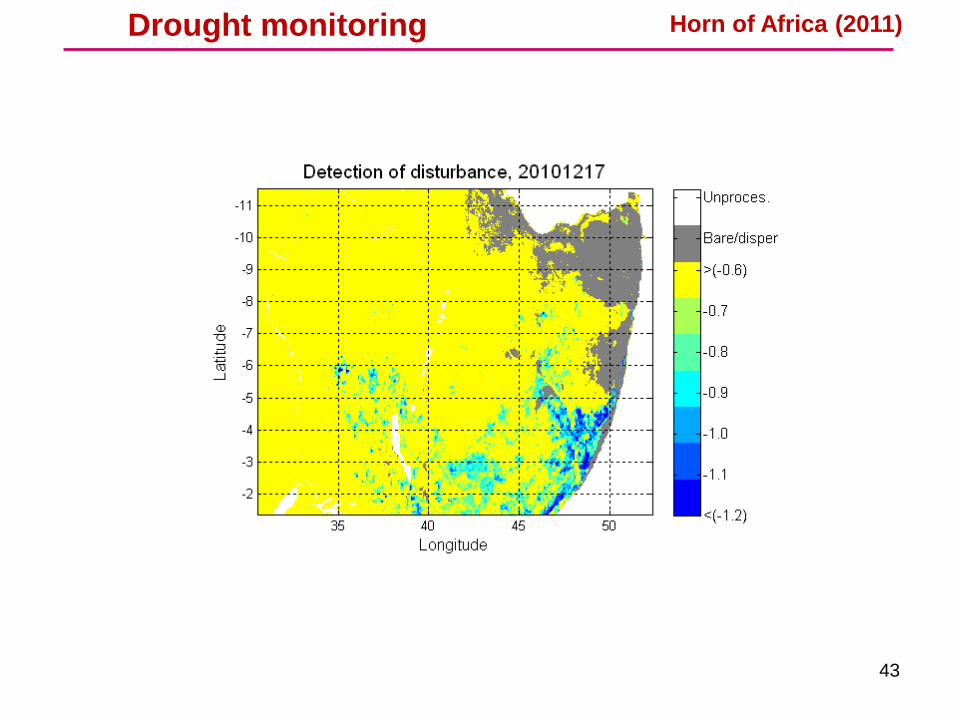
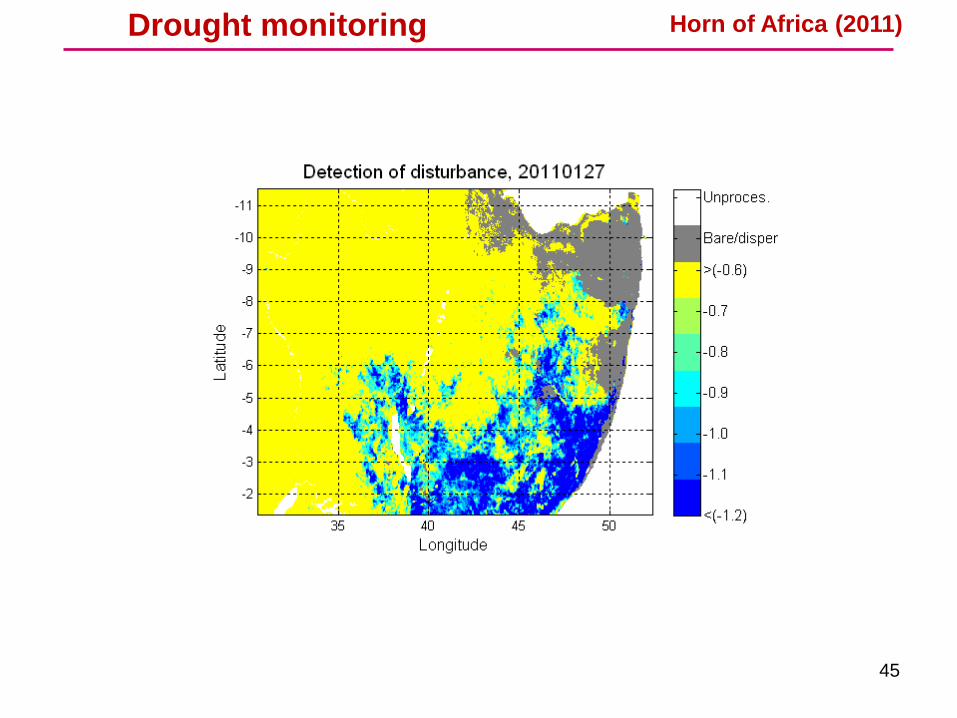
Drought monitoring Potential applications
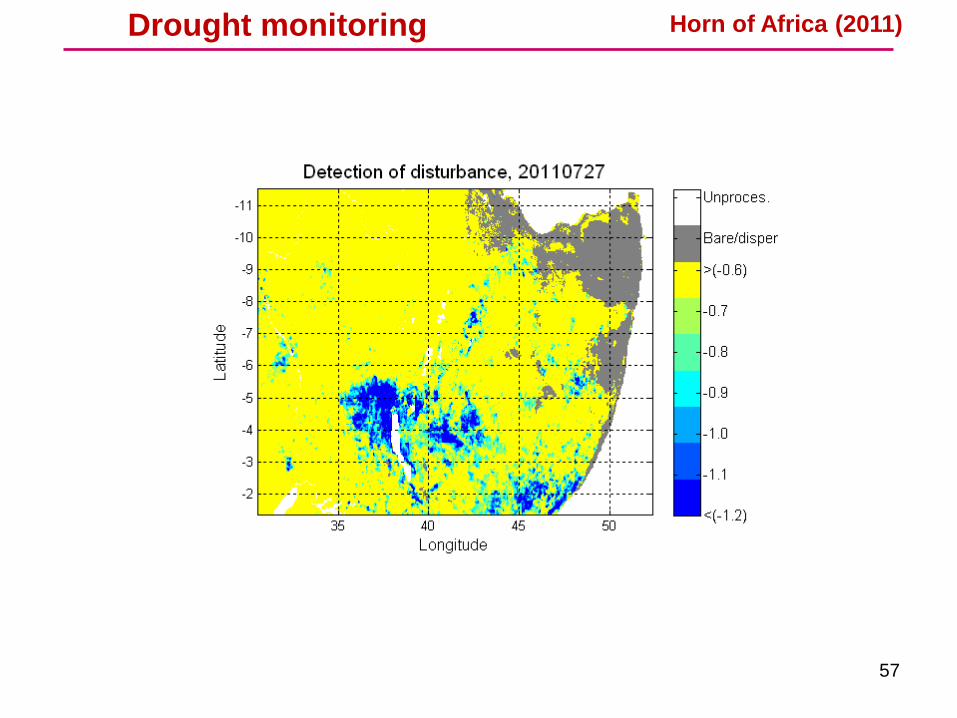
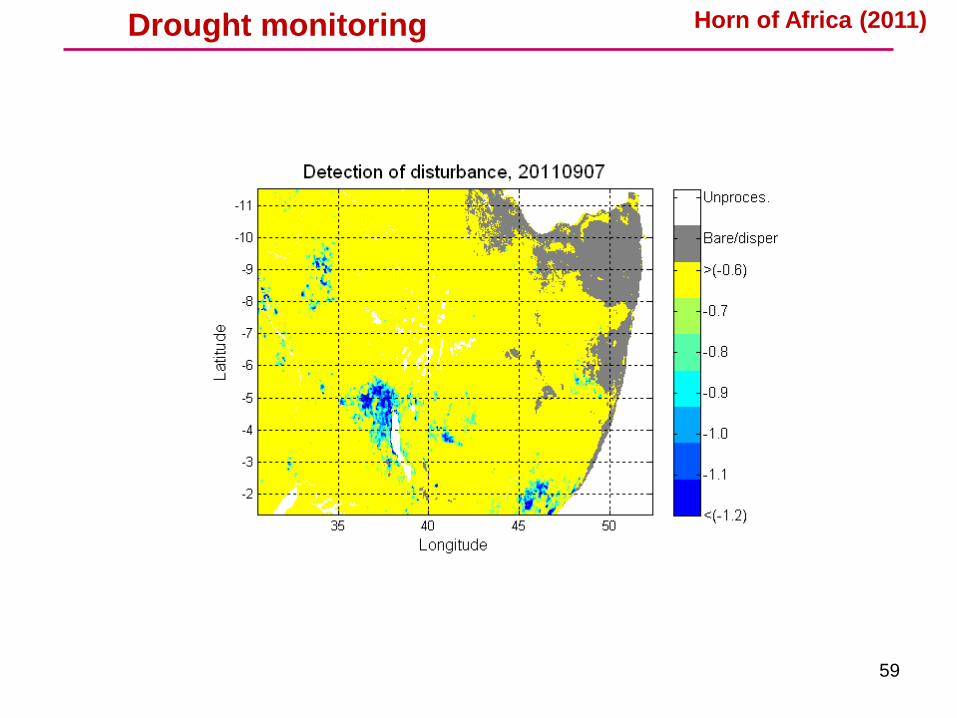
Severe drought in Horn of Africa (2011): Shortage of rain in the two rainy seasons (autumn and spring)

41
Drought monitoring Horn of Africa (2011)

42
Drought monitoring Horn of Africa (2011)
43
Drought monitoring Horn of Africa (2011)

44
Drought monitoring Horn of Africa (2011)
45
Drought monitoring Horn of Africa (2011)

46
Drought monitoring Horn of Africa (2011)
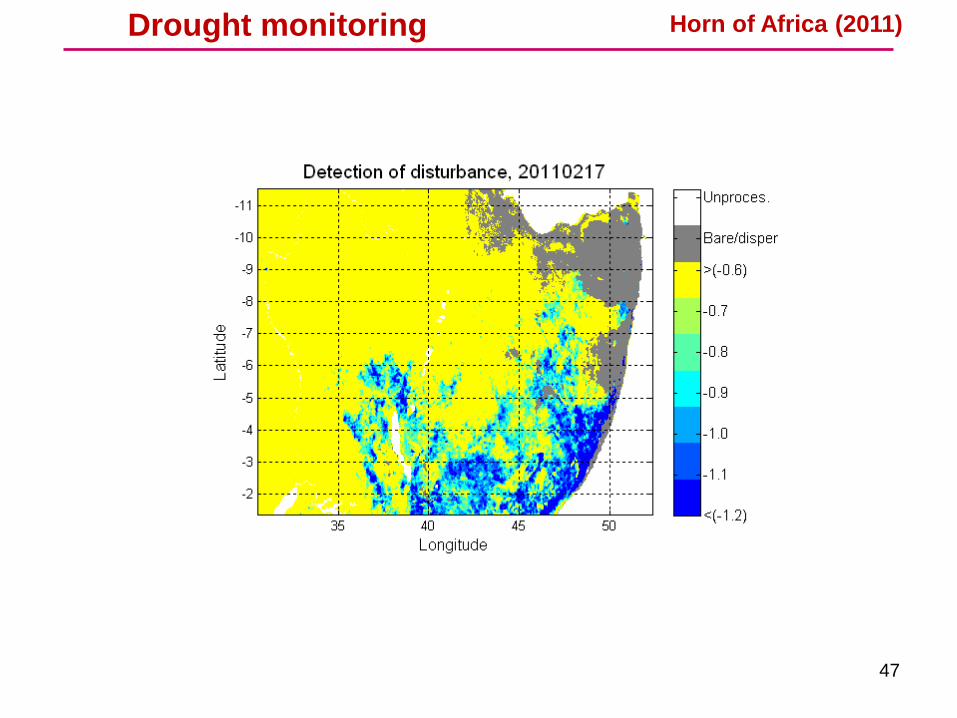
47
Drought monitoring Horn of Africa (2011)
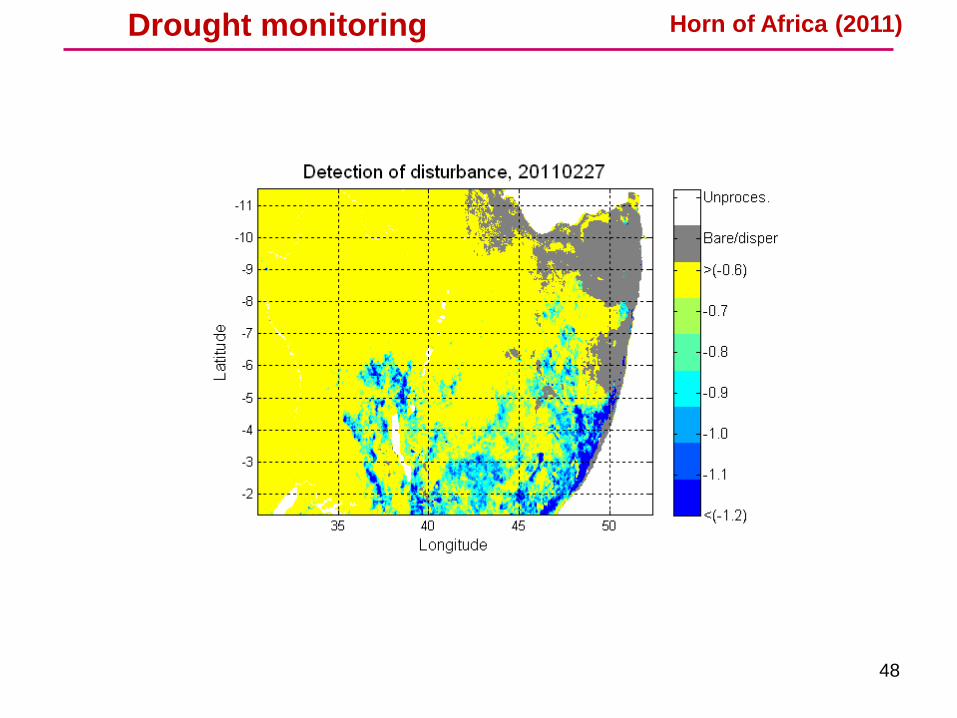
48
Drought monitoring Horn of Africa (2011)

49
Drought monitoring Horn of Africa (2011)

50
Drought monitoring Horn of Africa (2011)

51
Drought monitoring Horn of Africa (2011)

52
Drought monitoring Horn of Africa (2011)
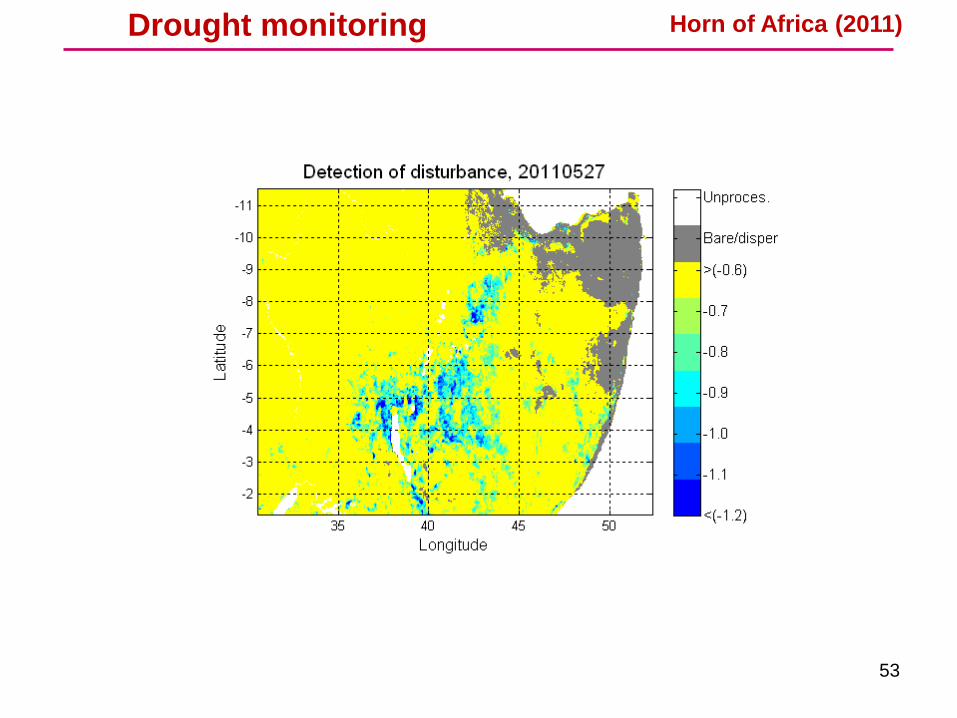
53
Drought monitoring Horn of Africa (2011)

54
Drought monitoring Horn of Africa (2011)
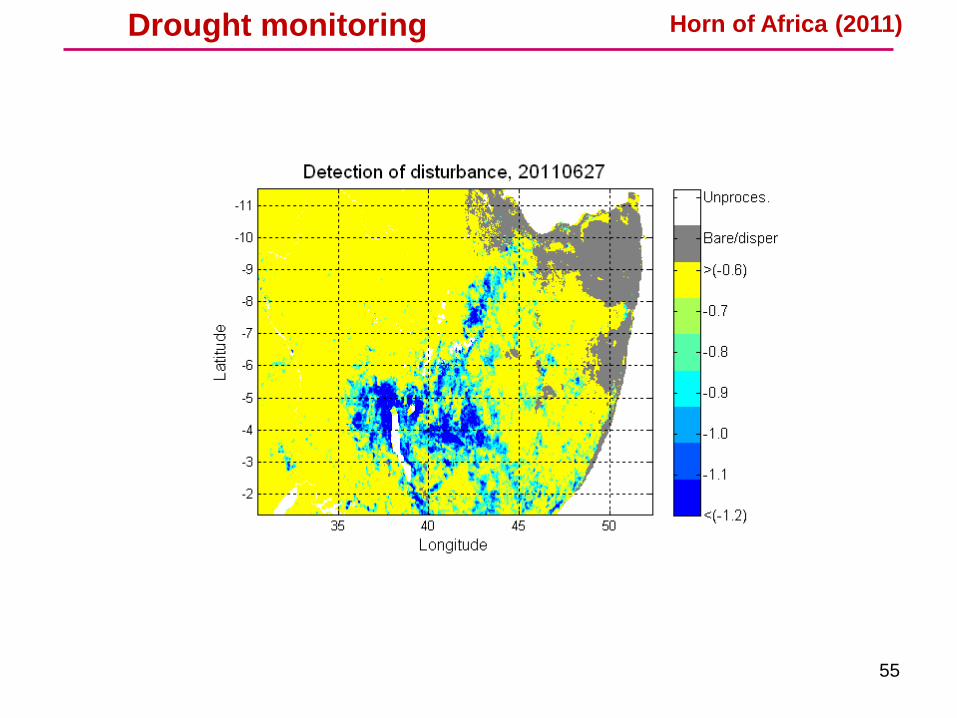
55
Drought monitoring Horn of Africa (2011)
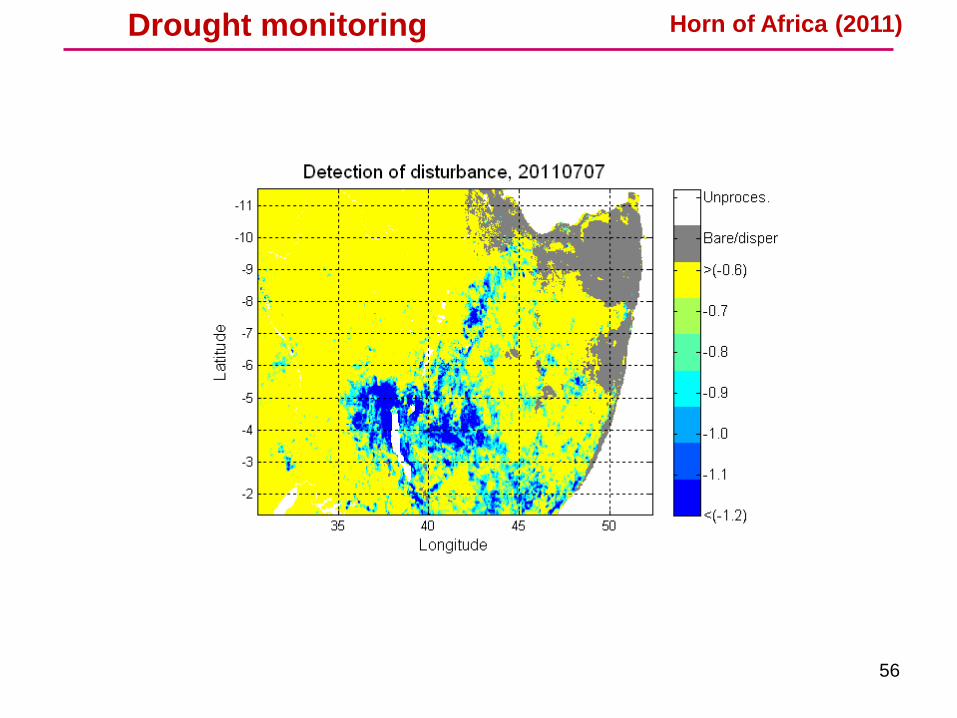
56
Drought monitoring Horn of Africa (2011)
57
Drought monitoring Horn of Africa (2011)

58
Drought monitoring Horn of Africa (2011)
59
Drought monitoring Horn of Africa (2011)

60
Drought monitoring Horn of Africa (2011)

61
Drought monitoring Horn of Africa (2011)
A similar example Drought in 2006

62
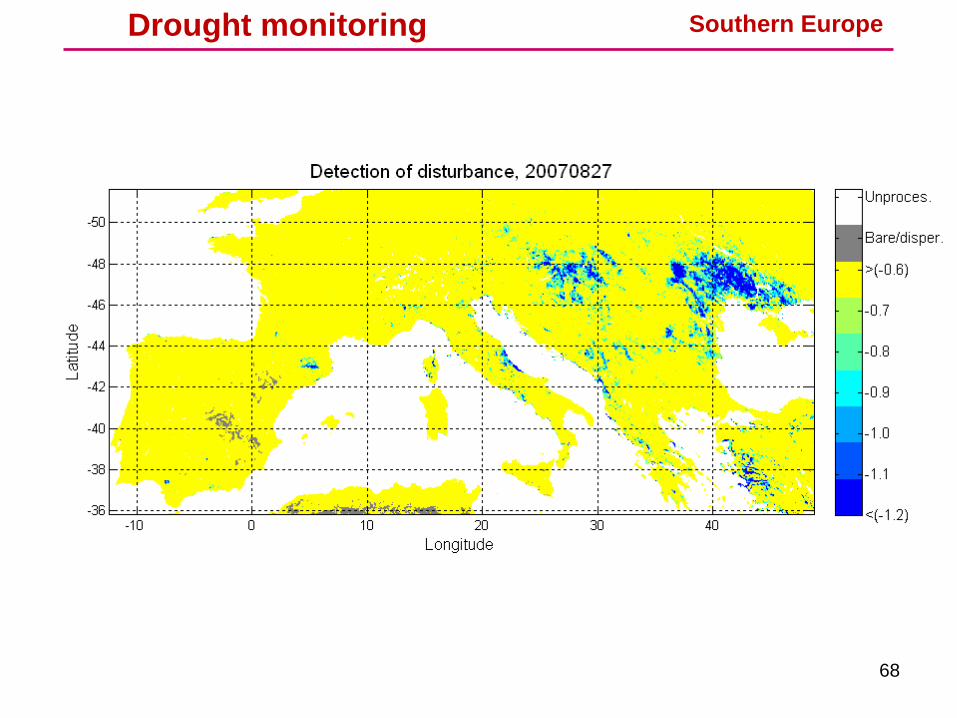
Drought monitoring Southern Europe

63
Drought monitoring Southern Europe

64
Drought monitoring
Central Europe (May, 2006)
Southern Europe

65
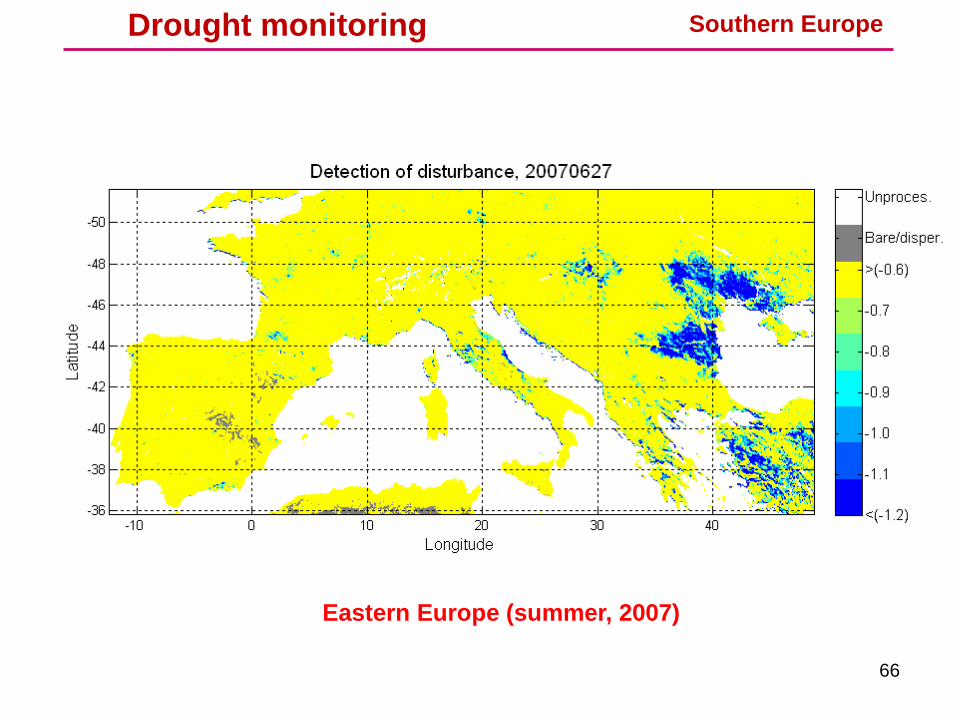
Drought monitoring Southern Europe
66
Drought monitoring
Eastern Europe (summer, 2007)
Southern Europe

67
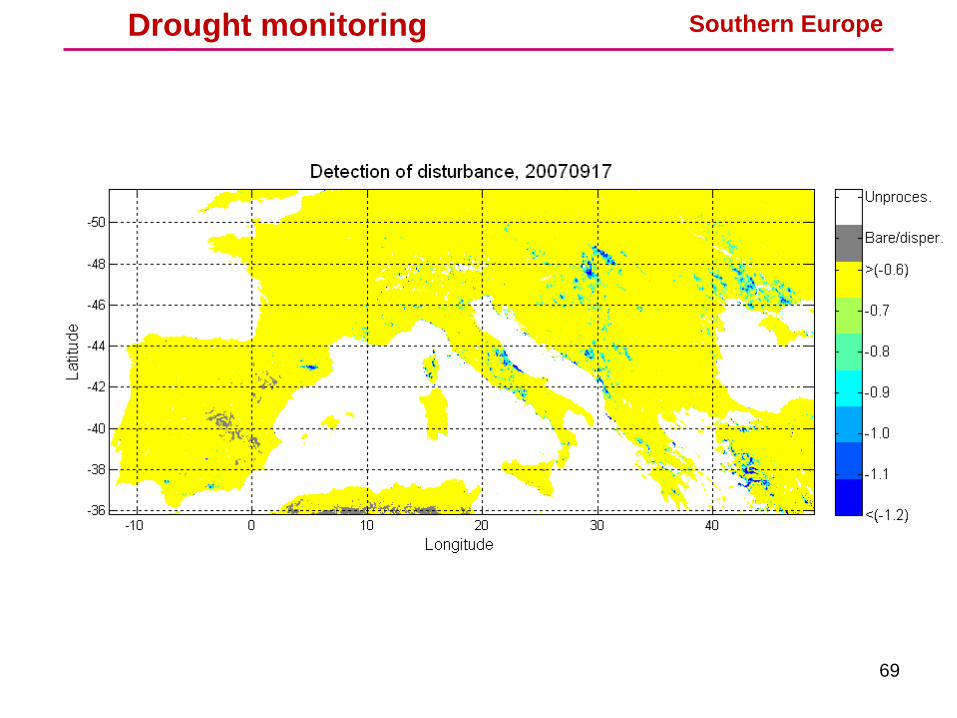
Drought monitoring Southern Europe
68
Drought monitoring Southern Europe
69
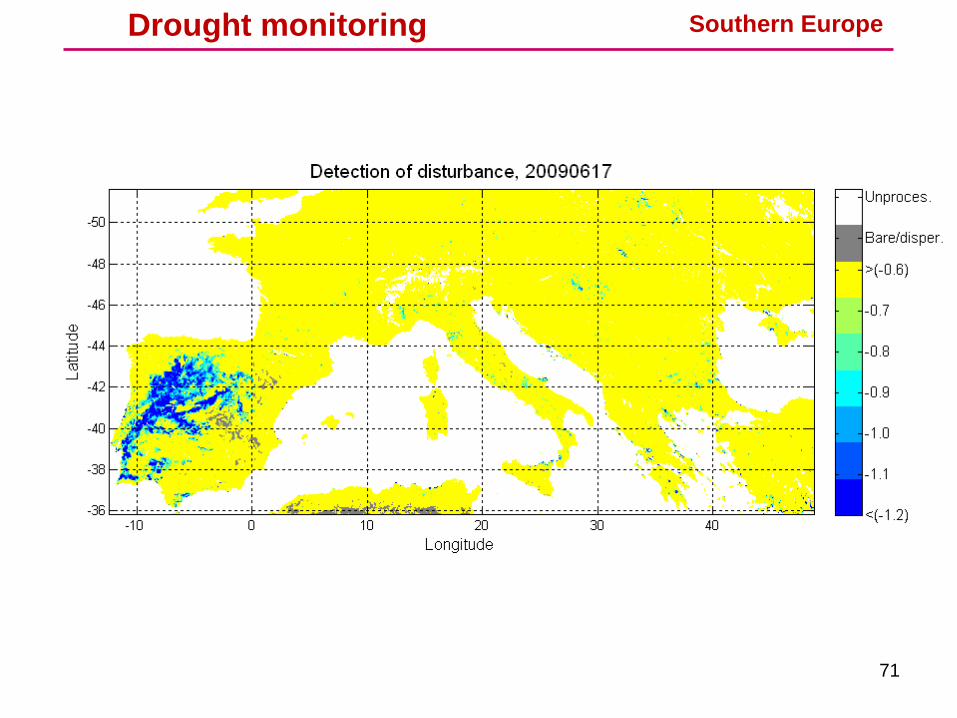
Drought monitoring Southern Europe

70
Drought monitoring
Iberian Peninsula (spring, 2009)
Southern Europe
71
Drought monitoring Southern Europe

72
Drought monitoring Southern Europe

73
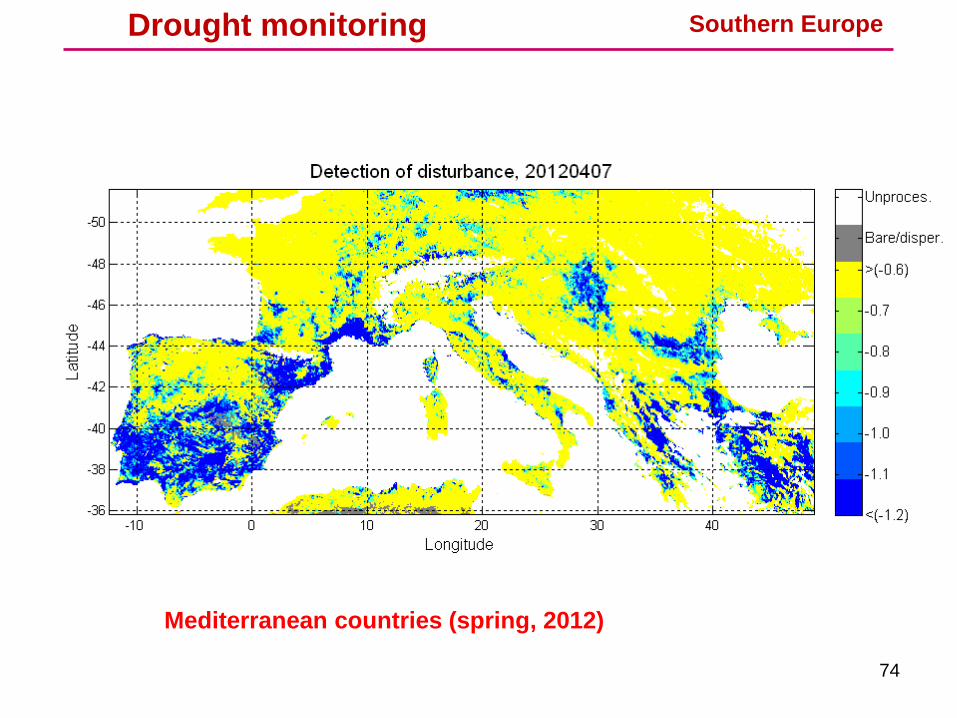
Drought monitoring Southern Europe
74
Drought monitoring
Mediterranean countries (spring, 2012)
Southern Europe

75
Drought monitoring
Mediterranean countries (spring, 2012)
Southern Europe
76
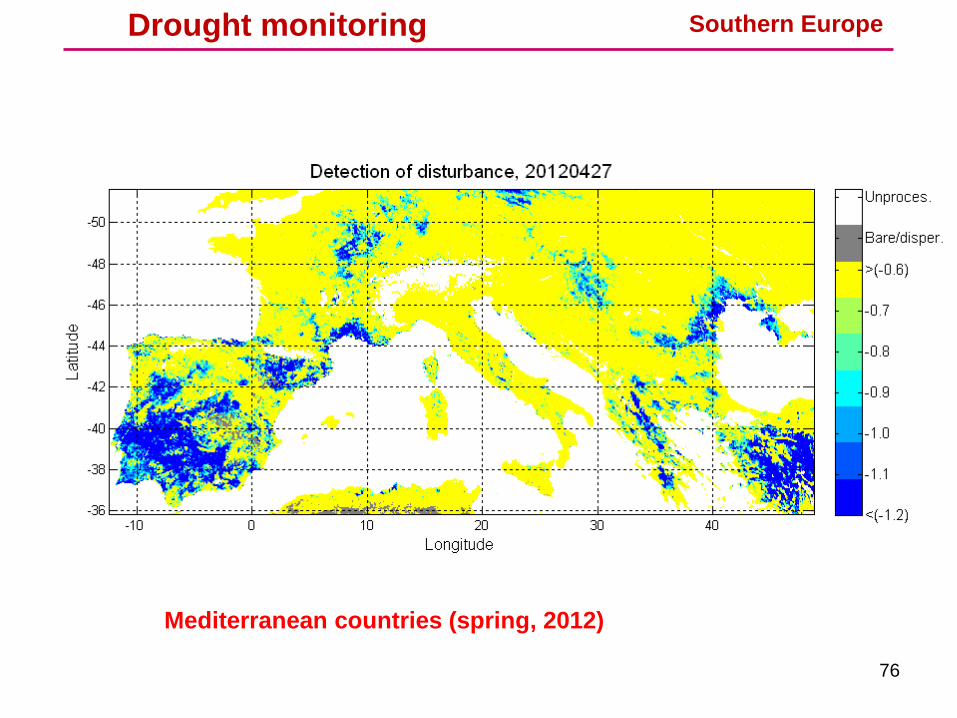
Drought monitoring
Mediterranean countries (spring, 2012)
Southern Europe
Summary
Vegetation estimates from satellite A complete integrator of the physical variables (moisture condition) closely related to rainfall dynamics in water limited ecosystems
LSA SAF VEGA products (FVC, LAI, FAPAR) spatial and temporally consistent indicators of vegetation structure and condition over wide FVC time series are suited for near real time drought monitoring Use of several LSA SAF products (ET, LST, FVC, FAPAR) to monitoring initiation of water stress and propagation of drought
Contact [email protected]