the longer-term costs and benefits of different initial
TRANSCRIPT

The Longer-Term Costs and Benefits of Different Initial Teacher Training Routes
Rebecca AllenChris BelfieldEllen Greaves Caroline SharpMatt Walker
IFS Report 118

The Longer-Term Costs and Benefits of Different
Initial Teacher Training Routes
Rebecca Allen
Education Datalab
Chris Belfield
Institute for Fiscal Studies
Ellen Greaves
Institute for Fiscal Studies
Caroline Sharp
National Foundation for Educational Research
Matt Walker
National Foundation for Educational Research
Copy-edited by Rachel Lumpkin
Institute for Fiscal Studies
7 Ridgmount Street
London WC1E 7AE

Published by
The Institute for Fiscal Studies
7 Ridgmount Street
London WC1E 7AE
Tel: +44 (0) 20-7291 4800
Fax: +44 (0) 20-7323 4780
Email: [email protected]
Website: http://www.ifs.org.uk
© The Institute for Fiscal Studies, July 2016
ISBN 978-1-911102-18-2

Foreword
Since the 1960s, when the push began to make teaching an all-graduate profession, the
roles of higher education institutions and schools in initial teacher training (ITT) have
been the focus for debate and significant variation in practice, in both undergraduate
teaching degrees (BEd) and post-graduate (PGCE) courses. Further policy-making has
resulted in a proliferation of training routes, as well as incentives for aspirant teachers.
This has been accompanied by sporadic debate about theory and ideology versus practice
and ‘craft’, and an associated reduction in the role of universities in teacher training.
In 1992 Ken Clarke made it a requirement for all ITT to involve partnerships between
HEIs and schools. From then, new routes into teaching were introduced (building on the
Articled and Licensed Teacher schemes), including SCITT (school-centred), the Graduate
Teacher Programme (GTP) – an employment-based and immediately-salaried route
ostensibly aimed at older entrants, and Teach First – an employment-based route aimed
at ‘high-flying’ new graduates. The Coalition Government introduced Teaching Schools
(which gives well-performing schools a wider professional development role), and School
Direct, a school-led route where participating schools contract accredited training
providers and then recruit, select and employ their own trainees. Underlying the
development of these new routes is a trend towards giving schools ever-increasing
responsibility for the development and accreditation of newly-qualified teachers, which
looks set to grow if the aims of the recent ‘Educational excellence everywhere’ White
Paper are realised.
Despite the recognition of teaching quality as having prime importance, the new routes
appear to have been developed with little or no consideration of evidence pertaining to
their relative costs and benefits. In response to this, the Nuffield Foundation funded a
group of researchers – led by the Institute for Fiscal Studies – to explore the topic in more
detail. As the project has progressed, concern about teacher supply has increased.
Historically the 24,000 or so state schools in England have required an influx of around
35,000 new teachers each year to maintain staffing levels, and although this demand
fluctuates from year to year, it is likely to increase over the coming years as pupil
numbers rise.
Against this backdrop of growing demand, teacher supply and retention in England has
moved from a centrally managed, university-led system, to a devolved and more locally
responsive model, which in recent years has included greater local decision-making on
the number of teachers needed in each area. This new, supply-side model appears to be
out of step with those of countries frequently cited as ‘high-performing’, and there are
concerns – not least from some schools – that it is not yet delivering sufficient supply,
retention, and quality assurance of teachers. Careful consideration of the costs (and
associated benefits) of the current training routes is required in order to address these
concerns.
This report provides the first step in that direction and is essential reading for all those
involved in teacher supply and retention strategies in England. It also demonstrates how
vital it is to have coherent, reliable, and accessible training and employment data for
teachers, something that the researchers have used in their work to great effect. Without
this evidence, there is a danger that reforms are a set of costly leaps in the dark which
may have an adverse effect on outcomes for children and young people.
Josh Hillman
Acting Director
The Nuffield Foundation

Preface
As collaborators for this project, the Fischer Family Trust, the Institute for Fiscal Studies
(IFS) and the National Foundation for Educational Research would like to sincerely thank
the Nuffield Foundation for funding and supporting this research (grant number
EDU/41313). The Nuffield Foundation is an endowed charitable trust that aims to
improve social well-being in the widest sense. It funds research and innovation in
education and social policy and also works to build capacity in education, science and
social science research. The Nuffield Foundation has funded this project, but the views
expressed are those of the authors and not necessarily those of the Foundation. More
information is available at http://www.nuffieldfoundation.org. We also appreciate the
Economic and Social Research Council, whose support through the Centre for the
Microeconomic Analysis of Public Policy (grant number ES/H021221/1) at the IFS
underpins much of IFS’s research. This project would not have been possible without the
time taken by schools to complete the survey, and to participate in case studies that
informed our survey design, for which we are extremely grateful. We hope that schools
find the findings informative and valuable. The advisory group for this project has been
extremely valuable and has greatly informed our analysis. Estimates of the central costs
for government were informed by information provided by the National College for
Teaching and Leadership, in particular Michelle Moore, to whom we are very grateful. We
acknowledge the Department for Education for providing the data relating to pupil
attainment and staff composition of schools in England, and retention.

Contents
Executive Summary 1
1. Introduction 5
2. Data 10
2.1 School Workforce Census 10
2.2 Initial Teacher Training Performance Profiles 11
2.3 Annual Survey of Hours and Earnings 11
2.4 Survey of primary and secondary schools 12
3. The Costs and Benefits to Schools and Central Government 13
3.1 Average cost per route 13
3.2 Characteristics of trainees and schools 21
3.3 Summary 23
4. The Retention of Teachers Trained Through Different Routes 25
4.1 Retention of primary school teachers 26
4.2 Retention of secondary school teachers 27
4.3 Where do they teach? 28
5. The Mobility of Teachers Trained Through Different Routes 31
6. Demand-Led Provision? 35
7. The Responsiveness of Retention to Local Wages 44
7.1 Descriptive statistics 46
7.2 Estimates of responsiveness 47
7.3 Robustness checks 50
7.4 Summary 54
8. Comparison across Routes 55
8.1 Features of cost-effectiveness 55
8.2 Summary of features of cost-effectiveness 60
8.3 Areas for future research 63
9. Conclusion 66
Appendix A. Matching the SWFC and ITTPP 69
Appendix B. Accounting for Variation in Teacher Pay 76
Appendix C. Assumptions for Average Costs 77
Appendix D. Retention Rate by Cohort 78
Appendix E. Retention Rate by Trainee Characteristics 86
Appendix F. Previous Evidence on Retention 88
References 91


1
© Institute for Fiscal Studies
Executive Summary
There are various routes to achieving qualified teacher status (QTS) in
England. They cost the taxpayer different amounts and, potentially, have
different consequences for trainees, schools and pupils. There is currently a
policy shift towards school-led initial teacher training (ITT) – away from
traditional higher education institution (HEI)-led training – and this
highlights the need for an independent assessment of the financial costs of
each route in comparison to the benefit it brings.
This report makes a large contribution to this aim, calculating the average
cost per trainee per route for central government and schools, in the context
of the benefits reported by schools. In addition, this report provides the most
recent evidence on the retention of teachers trained through different routes,
and a summary of the longer-term cost-effectiveness of each route in
England.
Around 35,000 individuals train to become teachers each year, through six
main routes. Some features of routes vary, particularly in how they are
funded, but all lead to QTS, and all except undergraduate (UG) training can
lead to a Postgraduate Certificate of Education (PGCE). The main distinctions
between routes are whether they are school-led or HEI-led, and whether the
trainee is employed by a school during training. School-led routes have
grown in recent years, with School Direct (salaried and unsalaried)
accounting for around one-third of trainees in 2015–16, although over 40%
of trainees still trained through HEI-led postgraduate (PG) courses. Teach
First, where trainees work in a relatively disadvantaged school while working
towards QTS (and commit to one year after QTS), accounts for around 5% of
trainees, although this route has also grown over time.
Costs and benefits to central government and schools
The average cost to central government and schools (here referred to as the
total average cost) for secondary school trainees is similar across all routes,
with the exception of Teach First. The average cost of non-Teach First
secondary routes varies between £18,200 and £23,500. The average total
cost of a Teach First trainee is £38,200, which is £14,000 higher than for any
other route. This variation in total average costs is less evident for primary
school trainees.
The total average costs for primary school trainee teachers are slightly lower
than for secondary school trainees across all routes, and there is less overall
variation. They range between £17,000 for School Direct salaried and
£23,000 for HEI-led PG routes.

Longer-term costs and benefits of different initial teacher training routes
2
Average cost per trainee per route (2013–14)
Note: See Appendix C for a full description of the data and assumptions underlying these figures.
Source: Survey of primary and secondary schools and ITT performance profiles.
The total average cost per trainee is largely made up of costs to central
government, but the average costs to schools are sizeable, particularly for
some routes. For example, the average cost to schools per Teach First trainee
is around £11,000 (accounting for the offsetting contribution trainees make
to teaching).
The costs to central government across routes are from direct funding to ITT
providers, grants to schools, provision of student finance and provision of
student bursaries. There is scope for rationalising this system of funding. Our
research suggests that: removing tuition fees for PG teaching training routes
could remove a potential deterrent to train at relatively low cost; justification
is required for the substantial difference in funding from central government
between routes, most notably for Teach First; further research is required to
measure whether the relatively expensive policy of tax-free bursaries for
trainees in high-priority subjects increases the long-term supply of high-
quality teachers ‘in service’.
The benefits of being involved with ITT, such as trainees’ contribution to
teaching, staff capacity and fresh teaching ideas, outweigh the costs for most
schools. This is true for routes with larger net costs for schools, such as Teach
First, which suggests that these routes also have larger benefits for the
schools. A non-negligible proportion of school leaders in our survey believe
that the benefits of involvement with ITT are lower than the costs, however,
particularly for some routes. For example, around 30% of primary school
head teachers involved with School Direct salaried reported that the benefits
were less than the costs, in comparison with 6% for its predecessor, the
Graduate Teacher Programme (GTP).
£0
£5,000
£10,000
£15,000
£20,000
£25,000
£30,000
£35,000
£40,000
Pri Sec Pri Sec Pri Sec Pri Sec Pri Sec Pri Sec
HEI-led PG HEI-led UG SCITT SD(S) SD(US) Teach First
Central government School

Executive Summary
3
Retention and mobility
The cost-effectiveness of ITT depends on the retention rate of teachers
(defined from those who begin training). Lower retention implies that the
average cost of training a teacher who remains (or starts) in teaching
increases. There could also be negative consequences for pupil outcomes due
to a lower number of experienced teachers. The mobility of teachers across
schools and regions informs the design of the whole ITT system. For example,
low regional mobility implies that the allocation of training places across
regions should depend in part on the local demand for teachers. Low mobility
across schools implies that school-led training has potentially large
consequences for unequal access to newly qualified teachers (NQTs) in
England across schools that have or do not have the capacity to support
school-led trainees to become effective teachers.
Between 58% and 68% of primary school trainees from each route are ‘in
service’ in the state-funded education sector five years after their expected
date of qualification. The retention rate is highest for the GTP (which was
replaced by School Direct; i.e., 65–68%) and lowest for HEI-led PG routes (i.e.,
58–61%).
The five-year retention rates for secondary school trainees are lower than for
primary school trainees on average and more variable across routes, ranging
from 37–44% for Teach First to 59–62% for the GTP.
The variation in retention rates across routes implies a variation in the
average cost to central government per trainee ‘in service’ five years after
expected date of qualification, between £59,000 and £70,000 for Teach First,
and between £25,000 and £44,000 for all other routes.
As expected, trainees from Teach First are disproportionately likely to teach
in schools with the most disadvantaged population of pupils, conditional on
being ‘in service’ after three years. Trainees from other routes are roughly
equally distributed across school types. Disadvantaged schools are a
particular focus for government and this may provide some justification for
the larger costs of training for this route.
In general, trainees from school-led routes are typically less mobile across
schools and regions, although trainees from Teach First are the most mobile.
Conditional on being ‘in service’, 41% of teachers trained through Teach First
are in the same school three years after qualification, compared to 72%
trained through GTP and 64% for the HEI-led UG route, the next lowest.
Teachers trained through the HEI-led UG route are most likely to move
regions between training and starting to teach, suggesting that there is less
need to focus training place allocations for this route to particular regions.
Our research suggests that retention may be affected by the relative pay of
teachers and other local workers. This is especially relevant given the current
public sector pay restraint. Higher local wages are associated with lower
retention rates of teachers. The probability of remaining ‘in service’ the

Longer-term costs and benefits of different initial teacher training routes
4
following year decreases by around 1 percentage point for a 10 percent
increase in local wages. This effect is cumulative, so is equivalent to a 5
percentage point decrease over five years for a 10 percent increase in local
wages. Teachers trained through different routes vary in responsiveness to
the local labour market, perhaps suggesting that alternative options are more
or less salient for trainees from some routes.
Wider considerations for an optimal system of ITT
The National College for Teaching and Leadership (NCTL) allocates teacher
training places to HEI and non-HEI providers. The distribution of places has
historically been ‘quality led’ on the basis of Ofsted ratings. There is some
evidence that the allocation responds in part to the demand for teachers at
the regional level, although the North West and North East regions are
outliers with disproportionately many trainees. The allocation of School
Direct training places is unrelated to the demand for teachers at the regional
level, or the presence of alternative routes.
There is some evidence that a disproportionate allocation of teacher training
places relative to the demand for teachers is related to a lower retention rate,
and therefore to a higher average cost of training for each teacher who
remains ‘in service’. Future allocation of training places should therefore take
into account the regional demand for teachers, given that most teachers do
not subsequently move regions.
Future allocation of training places should be transparent and provide
longer-term certainty for providers, who should make appropriate long-term
decisions based on the best available information. As suggested in the
government’s 2016 White Paper, this should involve allocations for each
provider, rather than national allocations taken on a ‘first-come first-served’
basis, which may lead to reductions in the quality of trainee accepted.
In the context of the substantial recent reforms to the ITT system, this has
addressed a number of important issues. However, it also raises significant
questions, which should be the focus of future research, including the following.
How should the quality of training be monitored and assured as providers
become more dispersed? How are the costs of teacher training affected by
economies of scale? How effective are bursaries at increasing the number or
quality of teachers in the medium term? What is the long-term effectiveness of
teachers trained through each route?

5
© Institute for Fiscal Studies
1. Introduction
The Department for Education (DfE) 2016 White Paper recognises the widely
held view that teacher recruitment and retention are increasingly challenging for
schools, with recruitment becoming more difficult as the economy grows, the
pools of graduates in key subjects decline and pupil numbers grow.1 The National
Audit Office (NAO) also concludes that indicators point to growing teacher
shortages.2 Between 2016 and 2020, the number of teachers will need to increase
by 30,000 (around 7% of the current school workforce) if pupil:teacher ratios are
to be maintained (Belfield and Sibieta, 2015).
In addition to increasing the number of teachers, the government is also seeking
to improve the quality of the teacher workforce, following the consensus in the
research community that being taught by a good teacher can have a dramatic
impact on pupils’ academic attainment and later outcomes (Rockoff, 2004; Rivkin
et al., 2005; Aaronson et al., 2007; Sutton Trust, 2011; Slater et al., 2012). For
example, Hanushek (2011) calculates that replacing the least effective 5–8% of
teachers with teachers of average effectiveness would move the US from a mid to
upper position in international league tables of educational performance.
To address these challenges, the DfE has introduced reforms to the provision of
initial teacher training (ITT) and large financial incentives to train for applicants
with high previous academic attainment.3 These reforms have sought to increase
the role schools themselves take in training new teachers, with the introduction
of the School Direct (school-led) training routes and the expansion of teaching
schools.4 The transition to a school-led system, from a traditionally Higher
Education Institution (HEI)-led system, is reaffirmed in the 2016 White Paper,
which states that the government will continue to move to an ‘increasingly
school-led ITT system which recruits enough great teachers in every part of the
country, so that the best schools and leaders control which teachers are recruited
and how they are trained’. The number of School Direct trainees has increased
from 350 in its introduction in 2012–13 to over 10,000 (around one-third of the
total number of trainees) in 2015–16.
1 Educational Excellence Everywhere, March 2016,
https://www.gov.uk/government/uploads/system/uploads/attachment_data/file/508447/Educational_Excellence_Everywhere.pdf.
2 Training new teachers, February 2016, https://www.nao.org.uk/wp-
content/uploads/2016/02/Training-new-teachers.pdf.
3 The Importance of Teaching: The Schools White Paper 2010, November 2010,
http://www.education.gov.uk/schools/toolsandinitiatives/schoolswhitepaper/b0068570/the-importance-of-teaching.
4 Teaching schools: a guide for potential applicants, March 2014, https://www.gov.uk/teaching-
schools-a-guide-for-potential-applicants.

Longer-term costs and benefits of different initial teacher training routes
6
Despite the keen policy interest and reform in this area, there is little existing
evidence on the costs and benefits of different teacher training routes and how
they relate to longer-term teacher effectiveness and retention. This is especially
important in a system that is changing dramatically.
Previous work by this research team provided the first evidence on the short-
term costs and benefits of each of the ITT routes in England, to both schools and
central government. Our research was based on a survey of schools, which
captured information about specific costs and benefits of engaging in ITT (such as
teacher time spent mentoring or payments to/from ITT providers), the overall
cost or benefit to the school and subjective measures of trainee quality. The
survey was sent to schools with and without experience of school-led ITT and
combined with administrative data sources to investigate the characteristics of
schools that take each type of trainee and the short-term impact of these trainees
on pupil attainment. This report summarises these findings and assesses the
longer-term implications of such costs by analysing the early career retention
rate and mobility across schools for teachers trained through different routes.
The data required for this work were provided by the National College for
Teaching and Leadership (NCTL) under contract with the DfE, and are described
in full in Allen et al. (2016a).
This report comprehensively demonstrates the costs and benefits to central
government and schools involved with different teacher training routes,
calculating the marginal cost of training an additional teacher through each route.
This is timely and valuable information for policymakers and schools involved, or
considering involvement, with ITT.
Our first contribution is to document the most recent retention rates across
different ITT routes. A number of studies have estimated the retention rates of
different groups of teachers, at different points in their career using different
datasets. These all lead to different estimates as each dataset has its idiosyncratic
issues that affect the estimates (for more details on previous studies, see
Appendix F). Our study uses the first linkage of the data required to estimate
retention rates on a consistent basis for each of the ITT routes, for each of the
first five years post-QTS. We define retention as the proportion of those that
begin ITT who are still in teaching each year after QTS. We use the number of
individuals who begin ITT as a base to best approximate the cost associated with
teacher training (this is different from the methodology used by the DfE, where
the base is the number of trainees who achieve QTS). The estimates of the
retention rate presented here are likely to be at the lower end of the probable
range due to missing records in the teacher data (discussed in more detail in
Appendix A, this additional uncertainty is reflected in the error bars and ranges
given). However, all relevant sources of data in this area are likely to suffer from
similar problems. We provide the most reliable estimates to date of the early
retention rate for teachers trained through the current range of ITT routes.
We document the distribution of teachers trained through different routes across
school types (defined by the level of disadvantage in the pupil population and
attainment). Work by Smithers and Robsinson (2005) and Allen et al. (2012)
examines the movement of teachers across schools and how this relates to the

Introduction
7
level of disadvantage in the school. Our work extends this and, for the first time,
provides evidence of how the relationship between school characteristics and the
movement of teachers depends on the route through which they trained, using a
national administrative source. We show that there are few differences across
those trained through different routes in the distribution and mobility across
school types, although teachers trained through Teach First are more likely to
teach in disadvantaged schools, and to move to schools with lower levels of pupil
disadvantage and higher levels of attainment.
We consider how regional differences in the allocation of training places relate to
regional differences in the demand for teachers and how this interacts with the
geographical mobility of teachers to affect the retention rate of those trained in
different regions. This has implications for the governments’ teacher supply
model and allocation of training places across regions.
Next, we analyse the relationship between wages in the local labour market and
retention. This is of particular relevance given the recent government
announcements constraining average teacher pay to grow by 1% per year until
2019–20. Our analysis suggests that teachers’ decisions are at least in part
affected by the external labour market and that the government pay policy has
the potential to reduce the retention rate of teachers.
Finally, we combine these findings with evidence of the short-term costs and
benefits for an overall assessment of each route into teaching, building on the
findings of Allen et al. (2014). There are remaining questions to be answered,
however, before it can be determined whether the current system of ITT
(including the allocation of training places between school-led and HEI-led
providers) offers value for money and best meets the priorities for government.
Analysis of the wider costs and benefits to teacher training routes, such as
differences in teacher quality, requires access to information on applications
made to each route, more detailed information on the prior attainment and
potential quality of each applicant, and the ability to measure longer-term
retention and the effectiveness of successful applicants in raising pupil
attainment. These research questions should be factored in to the government’s
ambitious reforms to ITT and teacher development in England.
Teacher training routes in England
Around 35,000 individuals train to become teachers each year, through six main
routes. Some features of routes vary, particularly in their funding, but all lead to
QTS and, with the exception of the HEI-led undergraduate (UG) route, all can lead
to a Postgraduate Certificate of Education (PGCE). The main distinctions between
routes are whether they are school-led or HEI-led, and whether the trainee is
employed by a school during training. School-led routes have grown in recent
years, with School Direct (salaried and unsalaried) accounting for around one-
third of trainees in 2015–16, although over 40% of trainees still trained through
HEI-led postgraduate (PG) courses. Teach First, where trainees work in a
relatively disadvantaged school while working towards QTS (and commit to one
year after QTS), accounts for around 5% of trainees, although this route has also

Longer-term costs and benefits of different initial teacher training routes
8
grown over time. The key features for each route considered in this report are
shown in Table 1.1.

Table 1.1. Main initial teacher training in England.
Route
UG PG SCITT SD(US) SD(S) GTP Teach First
Number starting training
(2013–14)1
5,725 20,3784 4,203 2,473 N/A 1,2615
Number starting training
(2014–15)2
5,936 14,695 1,988 6,311 2,759 N/A 1,4266
Number starting training
(2015–16)2,3
5,440 13,561 2,372 7,086 3,166 N/A 1,584
Who leads recruitment and training?
HEI HEI School-centred provider
School School School Teach First
HEI involvement in training
Some/
varying
Some/
varying
Some/
varying
Trainees employed by a school
Need not be supernumerary
Years to QTS 3(4) 1 1 1 1 1 1
Graduate
Prior work experience (typically)
Qualification BA, BSc or BEd with QTS
QTS and PGCE QTS, usually
with PGCE
QTS, usually
with PGCE
QTS, usually
with PGCE
QTS QTS and PGCE
Note: 1
https://www.gov.uk/government/uploads/system/uploads/attachment_data/file/438698/Main_tables_SFR48_2014.xls. 2
https://www.gov.uk/government/uploads/system/uploads/attachment_data/file/477891/Main_tables_SFR_46_2015_to_2016.xls. 3
Data for 2015–16 are provisional. 4
Numbers for PG and SCITT are not reported separately for 2013–14. 5
https://www.teachfirst.org.uk/news/prime-minister-pupils-and-teachers-celebrate-our-success-top-graduate-employer. 6https://graduates.teachfirst.org.uk/sites/graduates.teachfirst.org.uk/files/2014%20cohort%20profile.pdf. Two routes are excluded from this report due to small
numbers of trainees: Troops to Teachers and Researchers in Schools.

10
© Institute for Fiscal Studies
2. Data
In this chapter, we describe the sources of data used to produce the findings
presented in this report. The purpose of these sources of data is to produce the
most up-to-date figures on the retention of individuals that begin ITT (see
Sections 2.1 and 2.2); to measure the responsiveness of retention to local labour
market conditions (Section 2.3); to measure the costs and benefits of
involvement with ITT to schools and the characteristics of trainees (Section 2.4).
2.1 School Workforce Census
The School Workforce Census (SWFC) is an annual record of the school
workforce in state-funded schools in England, maintained by the DfE.5 The SWFC
was introduced in November 2010, replacing multiple previous data collections
(e.g. the local authority focused 618g survey and the Secondary Schools
Curriculum and Staffing Survey). We use the annual census between 2010 and
2014, inclusive, primarily as a record of the presence of an early career trainee in
the state-funded sector, from which we calculate the retention rate of trainee
teachers. The SWFC also contains a range of individual-level characteristics, such
as gender, age, ethnic group, pay grade and type of contract, which are useful to
our analysis.
The SWFC should contain data on all staff in regular employment, defined by a
contract of 28 days or longer. This includes contracts that were open on the
census date and also those that were open but ended during the previous
academic year. Supply teachers, unless centrally employed by the local authority,
are therefore less likely to be recorded in the SWFC, and therefore counted in the
number of ‘in service’ teachers from each cohort.
There are some concerns about the completeness and accuracy of the SWFC,
particularly in its first years, as schools adjusted to the new data collection. We
consider this in more detail in Appendix A.
These data are also used to construct school- and department-level
characteristics for use in the school-level analysis, such as the proportion of
teachers with short tenure at the school, and to calculate the average pay of staff
members at different pay grades to inform the overall costs of training for
schools. We also calculate typical career and wage progression to inform the
likely repayment of student loans for ITT.
5 The definition of ‘state-funded schools’ includes local authority maintained schools, academy
schools, free schools, City Technology Colleges and Pupil Referral Units (PRUs). Information about centrally employed teachers is collected from local authorities. The SWFC does not collect data from independent schools, sixth forms and other further education colleges.

Data
11
2.2 Initial Teacher Training Performance Profiles
The Initial Teacher Training Performance Profiles (ITTPP), maintained by the
NCTL, are designed to provide information on the characteristics and outcomes
of ITT providers, with the aim of helping potential trainee teachers make
informed choices, to monitor the performance of providers and to support
evaluation.
We use the ITTPP as the complete record of trainees who began training through
each route, for the academic years 2009–10 to 2013–14, inclusive. (We refer to
trainees who are expected to achieve or achieve QTS in the academic year 2009–
10 as the 2010 cohort, and so on.) The ITTPP is essential to measure the
retention rate of trainees from different routes, as route of training is not
routinely collected in the SWFC.
The ITTPP contains individual-level data for each trainee registered with an ITT
provider. These include name, date of birth and teacher reference number, which
are solely used to link the data to the SWFC to calculate retention rates
(described above). Relevant to our research are age, gender, degree class, subject,
and date achieved QTS. Information at the provider level, such as provider ID and
region, is also available. The data exclude information on whether the trainee was
in service six months after QTS, which would be useful to compare to published
statistics, but this is not central to our study. The data also exclude QTS grade (an
indicator for trainee quality). This may have provided an interesting additional
comparison across routes, as another factor that may affect the retention and
mobility of trainees, and it is a potential area for further research.
2.3 Annual Survey of Hours and Earnings
The Annual Survey of Hours and Earnings (ASHE) is based on a 1% sample of
employee jobs taken from HM Revenue and Customs PAYE records. Information
on earnings and hours is obtained from employers and treated confidentially.6
We use publicly available local-authority-level data (for full-time workers) from
ASHE to create a measure of local wages around each school. Our primary
measure of local wages is a weighted average of all local authorities where the
boundary is within 30 km of the school. This measure is similar to that used by
Britton and Propper (2016) but uses male and female full-time wages (rather
than male full-time wages) and the 70th percentile of wages in each local
authority (rather than the wage for non-manual workers), and it is a weighted
average of all local authorities within 30 km (rather than a simple average of all
local authorities where the headquarters is in within 30 km of the school).7
6 https://www.nomisweb.co.uk/articles/793.aspx.
7 We choose the 70
th percentile of local authority wages based on the relative salaries of early
career teachers: an NQT teacher in England (M1) would be around the 50th
percentile in the income distribution, around the 60
th percentile in their third year (M3), and around the 70
th in
their fifth year (M5). If we assume that pay in the outside option must be greater or equal to current pay (assuming that non-pecuniary aspects of the job are not worse), then we should make

Longer-term costs and benefits of different initial teacher training routes
12
2.4 Survey of primary and secondary schools
The survey of primary and secondary schools used to inform the costs and
benefits to schools involved with ITT throughout this report is described fully in
Section 2.1 of Allen et al. (2014). The survey collected information about the
school’s central costs and the benefits to the school of participating in a given
teacher training route (such as the cost of advertising and recruitment for school-
led trainees), as well as information about the costs and benefits related to
specific trainee teachers (such as whether the trainee contributed fresh teaching
ideas and provided extra capacity). For secondary schools, the survey was split:
we asked the person responsible for coordinating ITT activities (the ‘ITT
coordinator’) questions about the central costs and benefits for the school, and
we asked six subject leaders questions relating to specific trainees.8 In primary
schools, the entire survey was sent to the head teacher, who would be expected
to have detailed knowledge of both central school costs and the costs and
benefits associated with specific trainees.
Response rates were lower than predicted at the beginning of the project,
particularly for primary schools. However, the achieved samples are of similar
sizes across routes, and the responding schools are broadly representative of
schools involved with each route. This suggests that results from the survey can
be generalised to the set of schools involved with ITT.
use of higher percentiles in our analysis. In practice, the percentiles are highly correlated, and we repeat our analysis using alternative measures for robustness.
8 The subjects specified for priority were English, mathematics, science, humanities, physical
education, languages and arts (or separate subjects in these areas, such as geography and history).

13
© Institute for Fiscal Studies
3. The Costs and Benefits to Schools and
Central Government
Training of teachers comes with a cost, and this cost is borne to a greater or
lesser extent by central government, schools that are involved with training, ITT
providers and the trainees themselves. Given the government’s rapid expansion
of school-led routes, it is vital to understand how these costs vary between the
different ITT routes, and how they are shared across the stakeholders. In this
chapter, we present the average cost of each main ITT route per trainee, to
central government and schools, summarising and extending findings from Allen
et al. (2014), which are the first comprehensive figures for England.
3.1 Average cost per route
Figures 3.1 and 3.2 show the average cost for central government and schools, for
each route, for primary and secondary schools, respectively. These figures are
based on calculations reported in detail in Allen et al. (2014) (and summarised
below). Average figures per route are calculated using the breakdown of trainee
numbers in 2013–14 by route and relevant characteristics (such as subject,
region and degree class).9 These figures do not take account of any indirect
benefits to the school, such as expectation to hire, which may be particularly
valuable for school-led routes. A detailed breakdown of these costs can be found
in the online appendix to our interim report (Allen et al., 2014). Because of a lack
of data about the allocation of bursaries and the take-up of student finance, these
figures make a number of assumptions to calculate the average central costs
these, outlined in Appendix C.
The average cost to central government is similar across tuition-fee routes for
primary school trainees, varying from around £15,200 for HEI-led UG to £18,400
for HEI-led PG routes. This variation is primarily due to the structure of Higher
Education finance. Undergraduate courses are longer and so have larger overall
tuition fees and maintenance costs for trainees. However, the average cost to
central government is lower, as most postgraduate trainees have already
acquired student loans from their undergraduate degrees. Our previous report
(Allen et al., 2014) showed that an individual following an average teacher career
would not even begin to pay off the additional loan.10 As a result, the loan subsidy
(the cost to the government of providing the loan) associated with the smaller
9 These calculations are now possible due to new data provided by the NCTL.
10 In reality, there is no distinction between student loans acquired through undergraduate and
PGCE courses. However, we are considering the cost to government of ITT courses and so it is sensible to consider the PGCE debt as the marginal loan and hence paid off last. Doing so, we essentially compare the cost to central government of providing the undergraduate loan and PGCE loan with only providing the undergraduate loan.

Longer-term costs and benefits of different initial teacher training routes
14
Figure 3.1. Average cost per route: primary
Note: See Appendix C for a full description of the data and assumptions underlying these figures.
Source: Survey of primary schools and ITTPP.
Figure 3.2. Average cost per route: secondary
Note: See Appendix C for a full description of the data and assumptions underlying these figures.
Source: Survey of secondary schools and ITTPP.
HEI-led PG loan is larger than the loan subsidy associated with the larger HEI-led
UG loan. In this context, the description of the available support as a loan, whilst
factually accurate, is in practice rather similar to the previous bursary
arrangements, but the terminology may be off-putting for already indebted
graduates.
The School Direct salaried route has a slightly lower average central cost at
£14,800 entirely made up from a direct grant from the NCTL to schools, ranging
between £14,000 and £19,000.
The average cost accruing to the individual schools is around £4,000–£5,000 for
all primary school routes except School Direct salaried. The lower average cost
for School Direct salaried is a result of the average NCTL grant and the
£0
£5,000
£10,000
£15,000
£20,000
£25,000
£30,000
£35,000
£40,000
HEI-led PG HEI-led UG SCITT SD(S) SD(US)
Central government School
£0
£5,000
£10,000
£15,000
£20,000
£25,000
£30,000
£35,000
£40,000
HEI-led PG SCITT SD(S) SD(US) Teach First
Central government School

The costs and benefits to schools and central government
15
contribution School Direct salaried trainees provide (in the place of a newly
qualified teacher (NQT)) more than outweighs the cost to schools of the trainee’s
salary.
The costs to central government are generally higher and more variable for
secondary school trainees, ranging from £15,700 for School Direct salaried to
£26,500 for Teach First. The higher cost is due to the additional cost of the higher
grants provided to secondary school trainees in priority subjects with a higher
degree classification.
When the school costs are included, the average total cost is similar across routes
for secondary school trainees, with the exception of Teach First, which has a
significantly larger average total cost. This is a result of schools paying Teach
First trainees a salary at least equal to the minimum of the NQT pay scale, in
addition to the fees schools pay Teach First and the grant NCTL pays for Teach
First teacher training. It is worth noting that these figures include the
contribution to teaching provided by both School Direct salaried and Teach First
trainees, valued at the amount it would cost to employ the equivalent proportion
of an NQT in their place.11 However, it may be that schools value this contribution
differently (potentially due to recruitment difficulties) and there are additional
omitted benefits that may help to explain why schools choose to engage in the
School Direct salaried and Teach First routes despite the high costs to the school.
The focus of this report is on the costs and benefits to schools and central
government; however, it is worth considering the variation in the amount of
funding ITT providers receive for trainees on the different training routes. Most
notably, Teach First receives net funding of £28,700 per trainee (this includes
direct grants from the NCTL, fees paid by schools and voluntary contributions,
and this is net of the payment to schools to cover mentoring). This compares with
the £9,000 HEI providers receive in tuition fees for HEI-led PG courses. It should
be noted that ITT providers cover a different range of services on different
routes. For example, Teach First cover all the recruitment costs for their training
route; however, justification is required for whether the higher direct funding
represents value for money.
Costs to central government
Table 3.1 summarises the funding that is available to each route, and whether
this funding varies according to characteristics of trainees or schools involved in
training. Types of central costs are summarised more fully in Table 3.2. Teach
First is the only route that receives a fixed amount of central funding per trainee,
independent of the trainee’s subject, degree class and region of training.
11 We only include the contribution to teaching for School Direct salaried and Teach First trainees as these
trainees are allowed to be supernumerary. It is possible that trainees from other routes provide additional capacity, which potentially offsets some of the time teachers spend with the trainees; however, as they are required to be supernumerary, schools could not have used the trainee to avoid employing an NQT and therefore the benefit cannot be valued in the same way. These benefits are included in the summary measure of costs and benefits reported in Table 3.3 and details on the contribution to teaching of all trainees can be found in Appendix F of Allen et al. (2014).

Longer-term costs and benefits of different initial teacher training routes
16
Table 3.1. Central costs relevant to each route
Central cost HEI-led UG
HEI-led PG
SCITT School Direct
unsalaried
School Direct
salaried
Teach First
Scholarship †
†
†*
Bursary †
†
†*
Tuition fee and maintenance loan
*†
*†
*†
*†
Maintenance grant †
†
†
†
NCTL grant †*
Note: † denotes whether funding is received and, if so, its amount varies with one or more trainee
characteristics (degree class, subject or household income). *
denotes whether funding is received
and, if so, its amount varies with one or more school characteristics (region and pupil
composition). Scholarship and bursary awards depend on school characteristics for School Direct
unsalaried only by whether the ‘free school meals’ uplift is applied, if the award is granted.
Source: See notes to Table 3.2.
School Direct salaried funding depends on region,12 subject (with higher funding
for high-priority subjects)13 and school characteristics (with higher funding for
trainees in schools where more than 35% of pupils are eligible for free school
meals).
Funding for postgraduate tuition fee routes (School Direct unsalaried, HEI-led
PGCE and SCITT) depends on eligibility for maintenance grants (and therefore
the maximum available maintenance loan), degree class and subject (and
consequently eligibility for a tax-free bursary), and award of a tax-free
scholarship through a competitive process in high-priority subjects (excluding
modern languages and including one other-priority subject – computer science).
For School Direct unsalaried, there is also an uplift for trainees in schools where
more than 35% of pupils are eligible for free school meals.14 Note that trainees on
these routes cannot be awarded both a scholarship and a bursary, although all
other aspects of student finance (tuition fee loans to cover the cost of tuition fees,
maintenance grants and maintenance loans) are unaffected by these sources of
funding. Funding for the HEI-led UG route is solely through tuition fees paid to
the ITT provider. The central costs of these routes per trainee therefore vary
according to the timing and total repayment of the loan, and eligibility for a
maintenance grant (the size of which determines the maximum possible
maintenance loan).
For Teach First and School Direct salaried, the trainee is paid a salary, a
proportion of which is then paid in tax. To calculate the overall net cost to central
government, this tax revenue must be deducted from the central costs. However,
12 Wherever funding varies by region, there is higher funding for schools in Inner London, followed
by Outer London, followed by Fringe London, followed by outside London.
13 High-priority subjects are defined by the DfE as physics, mathematics, chemistry and modern
languages. Other-priority subjects are English, geography, history, computer science, classics, Greek, Latin, music, biology, physical education and primary.
14 This uplift was removed from the 2015–16 academic year.

The costs and benefits to schools and central government
17
Table 3.2. Central costs of ITT
Source of central cost
Description (academic year 2013–14)
Scholarshipa Scholarships are awarded through a competitive process by the Institute of Physics (IOP), the Royal Society of Chemistry (RSC), BCS (the Chartered Institute for IT) and the Institute of Mathematics and Its Application (IMA), primarily for trainees with at least a 2:1 degree class. The scholarship funding is £20,000 (tax free) per trainee, independent of region,b with a 25% uplift for School Direct unsalaried trainees whose training is based in a school (more than 60 days) where more than 35% of pupils are eligible for free school meals.c Trainees are not eligible for both scholarships and bursaries. Trainees on salaried routes are not eligible for scholarships or bursaries.
Bursarya Bursaries are awarded by the NCTL and are tax free. The amount depends on subject and degree class, in general with higher amounts for high-priority subjects and higher degree classes. The lowest bursary amount is £4,000 for trainees for primary school (non-maths specialists) with a 2:1 and for trainees for secondary school in an other-priority subject. The highest bursary amount is £20,000 for trainees for secondary school in a high-priority subject with a first-class degree.d Bursaries are not available for: non-graduates; secondary school trainees with a third or lower in any subject; secondary school trainees with a 2:2 or lower in an other-priority subject or non-priority subject; and primary school trainees with a 2:2 or lower. There is a 25% uplift for School Direct unsalaried trainees whose training is based in a school (more than 60 days) where more than 35% of pupils are eligible for free school meals.c ITT providers will be able to award higher bursary awards than a trainee’s degree class would allow if they have outstanding potential, where trainees are not currently eligible for the highest bursary award.e Trainees are not eligible for both scholarships and bursaries. Trainees on salaried routes are not eligible for scholarships or bursaries.
Tuition fee and maintenance loanf
Tuition fee and maintenance loans are available to all trainees on non-salaried routes (including those eligible for a bursary or scholarship). The maximum tuition fee loan is £9,000 per annum. The maximum maintenance fee loan is £7,675 for those living away from home and training in London. Entitlement for the maintenance loan declines as the amount of maintenance grant increases (£0.50 for every pound). The cost of providing these tuition fee and maintenance loans to central government includes the long-term cost of non-repayment and the opportunity cost of the provision of loans.
Maintenance grantf
£3,354 per year for trainees on non-salaried ITT routes with household income less than £25,000; declining at a rate of £0.1876 per pound of household income to £50 at £42,611 and zero above this. Each pound of maintenance grant leads to a decline in entitlement to a maintenance loan of £0.50.
NCTL grant to schoolsg
No direct grant for HEI-led routes and School Direct unsalaried, which are funded through trainee’s tuition fees.

Longer-term costs and benefits of different initial teacher training routes
18
Range between £14,000 and £26,000 for School Direct salaried depending on subject and area (zero for non-priority subjects at secondary level) and whether the school is eligible for a 10% uplift (where more than 35% of pupils are eligible for free school meals and the trainee is based in the school (more than 60 days)). c
NCTL contract £25,958 for Teach First (£17,652 per trainee for ITT; £8,306 per trainee for expansion grant).
Note: All figures refer to the 2013–14 academic year (for trainees beginning their training in
September 2013). a http://webarchive.nationalarchives.gov.uk/20130423140808/http://education.gov.uk/get-into-
teaching/funding/postgraduate-funding. b The value of a scholarship has increased since 2013–14, to £25,000 (£30,000 for physics).
c The ‘free school meals’ uplift was removed from the academic year 2015–16.
d This maximum value has increased since 2013–14, to £30,000.
e https://www.gov.uk/government/uploads/system/uploads/attachment_data/file/193849/
130430_Training_Bursary_Guide_AY_2013-14_V2.1.pdf. f http://webarchive.nationalarchives.gov.uk/20130423140808/https://www.gov.uk/student-
finance/loans-and-grants. g Annex D of
https://www.gov.uk/government/uploads/system/uploads/attachment_data/file/237266/School_
Direct_Manual_V6_0.pdf. Email correspondence with NCTL.
this requires contemplation of the counterfactual: another teacher would have
been teaching, earning and paying tax in the place of the trainee.
To estimate the central cost of providing student finance for ITT, we model the
timing and total repayment of tuition fee and maintenance loans, under the
assumption that each trainee borrows the maximum possible amount.
For further details of how central funding varies within and across routes, and of
how we have modelled the cost to central government of providing student
finance for teachers, see Chapter 4 of Allen et al. (2014).
Direct costs to schools
There are four types of direct costs for schools involved with ITT.
First, secondary schools hosting School Direct salaried trainees pay ITT providers
an average of £4,200 to provide elements of the course. This number is £3,300 for
primary schools. In contrast, schools hosting trainees on the HEI-led PG, HEI-led
UG, SCITT and School Direct unsalaried routes receive payments from ITT
providers. These vary depending on the route and the length of placement; see
Allen et al. (2014) for more details.
Second, School Direct salaried and unsalaried routes may face recruitment costs
associated with attracting trainees to their school. Estimates from our survey
suggest these vary between £100 and £400 in primary schools and between £300
and £700 in secondary schools.15
15 Note that these costs may have changed since application for all routes moved to UCAS.

The costs and benefits to schools and central government
19
Third, in order to have a Teach First trainee/teacher, schools pay Teach First an
upfront recruitment cost of between £3,800 and £4,100 (depending on the
subject and region).16
Finally, the school must pay the trainee’s salary for the salaried routes (Teach
First and School Direct salaried). For School Direct salaried, this is at least the
minimum of the unqualified teacher pay scale, and for Teach First at least the
minimum of the NQT pay scale. Schools receive a direct grant from the NCTL to
offset the salary cost for School Direct salaried trainees, although the size of this
grant depends on the subject, with no grant for trainees in non-priority subjects.
However, for both these routes, the teacher is not required to be supernumerary
– this cost may be in the place of hiring another teacher. To account for this, we
take the difference between the salary paid to the trainee and a typical NQT,
adjusting for the average contribution to teaching the trainees provide (as
reported in our survey).
Indirect costs to schools
In addition to direct costs, schools also incur costs in the form of teacher time.
Our survey captured the amount of time teachers spend with trainees performing
a variety of tasks including observations (including feedback), mentoring, lesson
planning support and written assessment. We then use the average wage of the
teacher engaged in the task (according to their broad pay grade) to calculate a
monetary measure of the opportunity cost incurred by the school hosting the
trainee.
Table 3.3 shows how the average indirect cost per week of placement incurred by
the school varies across routes, and provides some indication of how the costs
associated with each trainee vary within each route. In both primary and
secondary schools, the total indirect cost associated with specific trainees varies
more within a route than between routes: the mean values are similar across
routes, while the variation within a route is large – the 25th and 75th percentiles
are around £100 and £250 per week for HEI-led PG trainees, for example.17 The
exception is Teach First trainees, who have significantly lower indirect costs, on
average, than HEI-led PG trainees in secondary schools. The cost per week is
typically higher from primary schools, which is in part due to the higher pay
grade of the typical staff member involved with training.
16 Schools are also required to contribute if a Teach First trainee chooses to take a Masters course
in their second year. However, this cost is excluded from this report as it is not incurred during training. It is in effect an additional cost associated with employing a Teach First trainee the following year.
17 The 25
th percentile is the point where one-quarter of respondents have a value below this level.
The 75th
percentile is the point where one-quarter of respondents have a value above this level.

Longer-term costs and benefits of different initial teacher training routes
20
Table 3.3. Total cost per route (pounds per week): primary and secondary
Route Primary Secondary
N Mean 25th 75th N Mean 25th 75th
HEI-led PG 40 194.1 102.7 254.3 198 185.6 96.8 227.9
HEI-led UG 23 195.9 75.2 162.3
SCITT 28 191.7 117.3 231.2 26 161.8 90.7 209.6
GTP 16 184.3 108.6 271.1 52 147.9 77.8 184.5
School Direct salaried
34 190.9 108.3 203.2 54 187.6 73.4 228.1
School Direct unsalaried
18 213.6 109.2 287.5 58 178.0 96.4 233.7
Teach First 27 138.0 54.4 198.2
Source: Survey of primary schools and secondary schools.
Benefits to schools
The discussion thus far has focused solely on the costs associated with teacher
training, putting aside potential benefits. The obvious benefit to the overall
teaching profession is the creation of an additional qualified teacher. We consider
this benefit in the remainder of this report, for example showing the retention
rate for these additional qualified teachers, their propensity to work in
disadvantaged schools and their geographical mobility. Before this discussion,
this section focuses on the benefit to the individual school of participating in ITT,
rather than the benefit to the teaching system as a whole.
There are a wide variety of ways schools could benefit from either hosting a
trainee teacher – ranging from increased continuing professional development
(CPD) opportunities and fresh teaching ideas to the trainee contributing to
teaching – or expecting to hire the trainee. These benefits are summarised in
Chapter 8, and in detail in Allen et al. (2014).
This section focuses on the overall benefits for schools involved with ITT. Tables
3.4 and 3.5 report the proportion of schools who engaged in each training route
that felt the benefits outweighed, were roughly equal to or were less than the
costs associated with being involved with the particular training route.
The main finding is that for every route, other than HEI-led PG in primary
schools, the majority of schools felt the benefits outweighed the costs. This is not
necessarily surprising, as all schools make some active decision to participate in
ITT, presumably based on reasonable information. Schools are equally likely to
say the benefits outweigh the costs for the Teach First and School Direct salaried
routes, which have considerably higher school costs associated with them,
implying that these routes also provide large benefits to the school.
We also find that, in both primary and secondary schools, the GTP route was the
most likely to have the benefits reported as outweighing the costs, while School
Direct salaried, the replacement of GTP, was amongst the least likely. This is a
reflection of the earlier finding that School Direct salaried was reported to have
higher indirect costs than GTP.

The costs and benefits to schools and central government
21
These findings are based on the sample of schools that chose to engage in each of
the particular training routes and we cannot extrapolate to schools that do not
participate. Below we discuss findings that suggest schools that engage in ITT are
not representative of all schools, and this may be more true of certain training
routes than others. We cannot rule out that schools that have chosen not engage
in ITT are doing so because they know that, in their circumstances, the costs
would outweigh the benefits. Indeed, a pertinent question is the type of school
that could be encouraged to participate in ITT, and the quality of training these
schools would provide.
Table 3.4. Net benefit for school: the perceived costs and benefits to
schools (primary)
Route Benefit > Cost
Benefit = Cost
Benefit < Cost
N
(%) (%) (%)
HEI-led UG 58 19 22 38
HEI-led PG 40 31 29 58
GTP 72 22 6 18
School Direct salaried 54 17 29 41
School Direct unsalaried 63 22 15 27
SCITT 68 16 16 39
Source: Survey of primary schools.
Table 3.5. Net benefit for departments: the perceived costs and benefits
to departments (secondary subject leaders)
Route Benefit > Cost
Benefit = Cost
Benefit < Cost
N
(%) (%) (%)
HEI-led PG 50 30 20 283
Teach First 61 19 19 34
GTP 65 22 13 63
School Direct salaried 48 22 29 60
School Direct unsalaried 52 21 27 76
SCITT 46 32 22 39
Source: Survey of secondary schools (subject leaders in up to six departments per school).
3.2 Characteristics of trainees and schools
Trainees
The characteristics of trainees in primary and secondary schools are largely
similar across routes. This indicates that there is not a significant degree of
sorting across routes according to trainee ‘quality’, as captured subjectively

Longer-term costs and benefits of different initial teacher training routes
22
through the responses to our survey.18 The limitations of this conclusion are the
relatively small sample size of our survey and the potentially non-representative
sample for some routes, although the results are robust to accounting for school
characteristics.
A high percentage of survey respondents believe the trainee has ‘very good’ or
‘good’ potential to be a good teacher – at least 82% across all routes in primary
schools and at least 79% in secondary schools. Although there are small
differences in this percentage between routes, these are not statistically
significant, suggesting that trainees from each route are perceived as equally
capable in their future careers. This is also true for ratings of the trainee’s
commitment to teaching, resilience, social skills and confidence in the classroom.
The percentage perceived to have ‘very good’ or ‘good’ subject knowledge is
lower and more variable across routes than other characteristics. Between 53%
and 71% of trainees are perceived to have ‘very good’ or ‘good’ subject
knowledge across routes in primary schools, and 66% and 89% across routes in
secondary schools.
The variation in trainee characteristics is predictive of the variation in costs and
benefits for the school. Further research should investigate whether early
assessments of trainees’ potential and ‘quality’ are also related to the
qualification rate and longer-term effectiveness.
Schools
Schools may become involved with ITT in a number of ways. For HEI-led routes,
ITT providers may approach schools to host trainees, or have established
relationships with schools. Involvement with a school-led route is likely to be a
more pro-active decision – for example, joining or leading a school partnership
(as for SCITT), registering with the NCTL to be part of School Direct or
participating in Teach First. Eligibility criteria also determine involvement with
some routes: for the academic year 2013–14, schools were eligible for Teach First
if more than half of pupils were from the poorest 30% of families in England,
according to the Income Deprivation Affecting Children Index (IDACI);19,20 for the
academic year 2013–14, the lead school in a School Direct partnership could not
be in special measures, classified by Ofsted.21 A school’s participation in HEI-led
18 These characteristics relate to the initial perception of a specific trainee at the start of the
placement, in order to distinguish the characteristics of trainees who choose each route from any influence of training at the school.
19 Note that the eligibility criteria for Teach First will change for the academic year 2015–16, so
that the income deprivation threshold will be lower for schools in local authorities with poor performance.
20 http://webarchive.nationalarchives.gov.uk/20120601152500/http://www.communities.gov.uk/
communities/research/indicesdeprivation/deprivation10/; http://www.teachfirst.org.uk/about/our-history.
21 School Direct Operations Manual academic year 2013 to 2014, Version 6: September 2013,
https://www.gov.uk/government/uploads/system/uploads/attachment_data/file/237266/ School_Direct_Manual_V6_0.pdf.

The costs and benefits to schools and central government
23
or school-led ITT therefore depends in part on proximity to an ITT provider
(either for placement of a HEI-led trainee or for partnership under School Direct),
school characteristics, and in part on the perceived costs and benefits associated
with each ITT route.
Overall, our survey finds that schools become involved with ITT if they have the
capacity and ability to support trainees. This is consistent with evidence from the
survey that the most commonly cited barrier to involvement with ITT is a lack of
staff capacity, for both primary and secondary schools. Schools are also
concerned about the potential negative impact of the presence of trainees on
pupil attainment, which may be a greater risk in schools that have worse Ofsted
grades and poorer existing pupil attainment and progress, on average.
Involvement with ITT is therefore unlikely to be chosen at random by schools;
rather it appears to be clearly related to the schools’ circumstances.
For example, schools involved with any ITT route have significantly better Ofsted
grades, on average, than the overall population of schools. Schools involved with
School Direct (salaried and unsalaried routes) and GTP also have significantly
better Ofsted grades, on average, than schools involved with HEI-led UG and PG
routes. This suggests that schools involved with these new school-led routes have
better capacity to recruit trainees and deliver ITT in partnership with ITT
providers. In contrast, amongst schools that are involved with any ITT, there are
few differences in measures of pupil performance and progress between those
involved with different routes,22 although all routes (except School Direct
salaried) have significantly higher pupil performance and progress, on average,
than the population of schools.
It is also difficult to generalise results from schools involved with Teach First, as
schools currently involved with this route have distinct characteristics, such as a
higher proportion of pupils eligible for free school meals, on average, than
schools involved with all other routes. This is because the correlation between
Teach First’s eligibility criteria and the percentage of pupils eligible for free
school meals is high (Crawford and Greaves, 2013). Pupil attainment and Ofsted
grades are also significantly lower for schools involved with Teach First, on
average, than for schools in the general population. This is again unsurprising as
there is an established relationship between pupil disadvantage and school
attainment, on average, in England (Lupton, 2004).
3.3 Summary
This section provides clear evidence of the costs and benefits associated with
each of the main ITT routes in England. Average costs are highest for Teach First
by some margin. Schools involved with Teach First are equally likely to say that
the benefits of being involved outweigh the costs compared with other less costly
routes, which implies that the benefits to schools involved are larger. The
benefits to central government should also be outlined in order to justify the
22 The exception is that schools involved with School Direct Fee have higher measures of pupil
progress, on average, than schools involved with HEI-led UG and PG routes.

Longer-term costs and benefits of different initial teacher training routes
24
substantially larger direct funding Teach First receives in comparison with HEI-
led and school-led providers.
This analysis is based on a sample of schools who have chosen to engage in ITT
and questions remain as to whether the results can be generalised to the set of
schools that have chosen not to engage in ITT, as they have different
characteristics. This limits the potential for the research to conclude whether
particular routes should be expanded or contracted, as the benefits and costs
may be different for a less select group of schools or for schools with different
characteristics.
Such a recommendation would also depend on the wider system costs and
benefits of different ITT routes, such as economies of scale in recruitment, which
should be an important priority for future research.

25
© Institute for Fiscal Studies
4. The Retention of Teachers Trained
Through Different Routes
In this chapter, we present the retention rate of teachers who achieved (or were
expected to achieve) QTS between 2010 and 2014. We define retention from the
sample of trainees that begin training to best reflect the whole costs of ITT, in
contrast to the DfE, which defines retention based on the number of trainees who
achieve QTS (or those who begin teaching in state-funded schools in England).
Our analysis presented here uses the first link of the relevant sources of data
required to estimate retention by routes (the ITTPP and SWFC), which makes it
possible to update the only existing evidence from cohorts of trainees that
qualified in 2010. Only short-term retention rates are available for School Direct
routes, as the first cohort of trainees only began in September 2012 and
September 2013 for School Direct (unsalaried) and School Direct (salaried),
respectively. It is plausible that the retention rate for GTP is likely to be a
reasonable indicator of longer-term retention for School Direct (salaried), given
the similarity of structure of the target population of the routes, and we discuss
this further in what follows.
Throughout this chapter, error bars represent the extent to which our estimates
of retention might be downward biased due to measurement error (up to around
3 percentage points for all routes except for Teach First, which is around 7
percentage points) in addition to statistical confidence intervals. Downward bias
occurs where individuals are ‘in service’ but not observed in the SWFC (e.g., if a
school fails to record a member of staff, or records a member of staff with some
error). There are also cases where an individual may be ‘in service’ at some point
in the academic year, but in a period not relevant to the SWFC (e.g., supply
teachers with short-term contracts).23 The size of the potential downward bias is
derived from a comparison of the one-year retention rate between our source
and an alternative source – the General Teaching Council for England (GTCE)
database – in 2011, across all routes. This calculation is described in Box 4.1. We
believe that the GTCE database is likely to contain the vast majority of teachers,
as registration was a legal requirement for all qualified teachers in maintained
schools, pupil referral units and non-maintained special schools prior to 2012.24
Each source of data is likely to be imperfect, however, so this range is indicative
only. We use an alternative figure of 7 percentage points for Teach First, derived
23 The SWFC guidance says that teachers and support staff are included in the census ‘if they are in
regular service on census reference day’, or were in regular service at any point during the
previous academic year. Regular service is defined as ‘continuous service of twenty eight days or
more, already undertaken or planned, either under a specific contract or under a service
agreement’. See
https://www.gov.uk/government/uploads/system/uploads/attachment_data/file/508805/2016_S
chool_Workforce_Census_Specification_v1-0_web.pdf.
24 http://www.gtce.org.uk/registration/index.html.

Longer-term costs and benefits of different initial teacher training routes
26
from comparison of the SWFC and a Teach First internal database, which is used
in Allen et al. (2016b) and is described in detail in Appendix A. We apply this
larger range for Teach First to make use of the route-specific information
available, but caution that Teach First’s internal database may also contain some
measurement error. There may also be variation across other routes that the
GTCE database does not capture.
Box 4.1. Comparison of GTCE and SWFC estimates
From the ITTPP data, there were 39,103 trainees registered in 2009–10, of
whom 34,796 were awarded QTS in 2010.
The GTCE on 30 September 201125 registered 24,099 registered of these
teachers in schools covered by the SWFC:26 a one-year retention rate of 61.6%.
The SWFC from 3 November 2011 registered 22,494 of these teachers as ‘in
service’: a one-year retention rate of 57.5%.
This implies a difference of 3.1 percentage points in the retention rate for those
who achieved (or were expected to achieve) QTS in 2010.
4.1 Retention of primary school teachers
Figure 4.1 shows that around 90% of primary school trainees on most routes
achieve QTS, with the exception of HEI-led UG routes where around 80% of
trainees achieve QTS. The year one retention rate across routes is variable
(between 50% and 53% for HEI-led UG and between 77% and 80% for GTP) but
largely similar for the five-year retention rate (between 58% and 61% for HEI-
led PG and between 65% and 68% for GTP). The early retention rate for School
Direct routes closely follows the retention rate for SCITT trainees, which
converges to the (initially slightly higher) rate for GTP trainees by five years post-
QTS. Teach First is excluded due to the small sample size over the period of our
data.
There is an increase in retention between year one and year two for trainees
from HEI-led UG and PG routes, and SCITT. This feature has been noted in
previous research (Smithers et al., 2012). The retention rate across routes
converges to around 60% five years after expected QTS date. Appendix D shows
that there is generally convergence in retention across cohorts, with the ‘dip’ in
retention one year following QTS less pronounced for later cohorts. This suggests
that either the data quality of the SWFC is improving over time, or that trainees’
25 General Teaching Council for England (2012), Registered Teachers in England, September 2011
[data collection] UK Data Service SN: 6995 (https://discover.ukdataservice.ac.uk/catalogue/?sn=6995&type=Data%20catalogue ).
26 See Section 4.1 of School Workforce Census 2015 DfE Guidance
(https://www.gov.uk/government/uploads/system/uploads/attachment_data/file/448625/School_Workforce_Guide_2015_v1_school_return.pdf). Returns should not be made from early years, independent schools, non-maintained special schools, sixth form colleges, overseas and offshore establishments, FE establishments, service children’s education schools, secure units and hospital schools.

The retention of teachers trained through different routes
27
preferences or ability to start teaching immediately after qualification is
increasing.
Figure 4.1. Retention rate of primary school trainees expected to achieve
QTS between 2010 and 2014
Note: Cohorts of trainees that are expected to achieve QTS between 2010 and 2014 are included
in this figure. Error bars represent the likely range of plausible retention rates, reflecting known
measurement error and statistical uncertainty.
Source: Authors’ calculations based on the ITTPP linked to the SWFC.
4.2 Retention of secondary school teachers
Figure 4.2 shows the retention rate of secondary school teachers trained through
each route. Here, the HEI-led UG route is excluded due to the small sample size.
Again, around 90% of trainees from each route achieve QTS.
The year one retention rate is highest for Teach First (80–87%) and lowest for
HEI-led PG, SCITT and School Direct salaried (around 60–66%). This reflects the
expectation that Teach First participants commit to teaching in the same school
one year pre- and one year post-QTS. GTP has a noticeably higher retention rate
than School Direct salaried, and to a lesser extent School Direct unsalaried, which
suggests that GTP may not be a reasonable proxy for the short-term retention of
trainees from these routes. Although School Direct was a direct replacement of
GTP, these figures suggest that something about the training route, trainees
recruited or school environment has led to a lower early retention rate.
The five-year retention rate is broadly similar for GTP and SCITT (between 56%
and 62%), slightly lower for HEI-led PG (51–54%) and lower for Teach First (37–
44%), a reversal from the one-year retention rate.
Comparing these results to those for primary trainees in Figure 4.1, there is more
divergence across routes and a lower level of retention after five years. There is
less evidence of a ‘recovery’ in retention between year one and year two, but the
decline in retention is less steep between these two years (aside from Teach First
who reach the end of their commitment to the programme, and have the steepest
0
0.1
0.2
0.3
0.4
0.5
0.6
0.7
0.8
0.9
1
Achieve QTS
Year 1 Year 2 Year 3 Year 4 Year 5
HEI-led PG
HEI-led UG
GTP
SCITT
SDS
SDUS

Longer-term costs and benefits of different initial teacher training routes
28
Figure 4.2. Retention rate of secondary school trainees expected to
achieve QTS between 2010 and 2014
Note: Cohorts of trainees that are expected to achieve QTS between 2010 and 2014 are included
in this figure. Error bars represent the likely range of plausible retention rates, reflecting known
measurement error and statistical uncertainty.
Source: Authors’ calculations based on the ITTPP linked to the SWFC.
fall in retention, from between 80% and 87% to between 55% and 62% across
these two years).
Retention rates are similar across cohorts for each route, as for primary schools,
which is presented in Appendix D. Note that the pattern across cohorts is
consistent with the recent NAO analysis of Teach First internal data, where there
is reasonable similarity in retention between the most recent Teach First cohorts.
The NAO report is most comparable with the upper bound of the retention rate
presented in Figure D.9, as both our upper bound and NAO figures are based on
Teach First’s internal data. The upper bound presented here and NAO figures are
not completely consistent as we had access to two years of internal data only.
Some variation in the five-year retention rate across routes may be due to
differences in teachers’ characteristics rather than their training route. Appendix
E shows that five-year retention rates are higher for females, for example, and
lower for those from high-priority subjects. There are also differences in the
characteristics of teachers that are more difficult to observe in administrative
data, such as preferences for location and alternative career, which may also
affect the retention rate across routes. These factors are explored in Chapters 6
and 7, respectively.
4.3 Where do they teach?
Figures 4.3 and 4.4 show the types of schools that trainees from each route are
likely to teach in, three years after QTS, conditional on being in service. This gives
some indication of the presence of teachers from each route in schools of
particular interest to the DfE – schools with higher levels of disadvantage, and
0
0.1
0.2
0.3
0.4
0.5
0.6
0.7
0.8
0.9
1
Achieve QTS
Year 1 Year 2 Year 3 Year 4 Year 5
HEI-led PG
GTP
SCITT
SDS
SDUS
TF

The retention of teachers trained through different routes
29
schools with lower levels of pupil attainment. Figures after three years are
presented as NQTs may struggle to find a job in their preferred location (Hobson
et al., 2009).
Figure 4.3 focuses on the level of disadvantage in the pupil population (proxied
by the proportion of pupils eligible for free school meals). Schools are grouped
into five groups according to this measure weighted by overall teacher
numbers.27 This ranges from the most disadvantaged quintile (the fifth of
teachers in schools with the most disadvantaged intake) to the least
disadvantaged quintile.
Three years after QTS, conditional on being in service, those from HEI-led UG and
PG routes, SCITT and GTP are roughly equally spread across schools with high
and low levels of pupil disadvantage. Teach First trainees who remain in service
are disproportionately likely to teach in disadvantaged schools three years after
QTS: 54% teach in schools in the most disadvantaged quintile (compared with
under 24% for each other route), and 82% teach in schools in the highest and
second highest disadvantage quintiles (compared with under 44% for each other
route). This suggests that although Teach First has a lower retention rate than
other routes, trainees from this route may be more likely to teach in schools that
are a focus for the government. Whether this is due to the characteristics of the
trainees (who may have a preference for teaching in this type of school before
involvement with Teach First) or due to the training route itself is a question for
further research.
Figure 4.4 shows the equivalent distribution of teachers trained through different
routes across schools with different levels of attainment. Again, schools are split
into five groups, ranging from the group with the lowest attainment to the group
with the highest attainment. Teachers trained through most routes are evenly
distributed across schools with high/low attainment, apart from teachers trained
through Teach First, who, conditional on remaining in service, are
disproportionately likely to teach in schools in the highest two fifths of school
attainment. As discussed in the following section, this is a result of Teach First
trainees moving to higher attaining schools, or more likely to remain in teaching
in high attaining schools. In the first year after QTS, 30% of Teach First trainees
were teaching in schools in the top two quintiles of academic attainment; by the
third year after QTS, this was 48%. Drawing on Figures 4.3 and 4.4, it seems as
though teachers trained through Teach First sort into schools with relatively high
levels of disadvantage and academic attainment, while teachers from other
routes are roughly evenly distributed after three years. This may be due to the
characteristics and motivation of the trainees who choose to train through Teach
First, or a particular feature of this route into teaching.
27 These groups are organised such that if we were looking at the whole population of teachers,
rather than early career teachers, there would be 20% in each group.

Longer-term costs and benefits of different initial teacher training routes
30
Figure 4.3. Distribution of primary and secondary school teachers trained
through different routes across schools with higher/lower levels of
disadvantage three years after QTS, conditional on presence
Note: Figures are weighted by the number of teachers in each school to account for different
requirements for teachers across less/more disadvantaged schools.
Source: Authors’ calculations based on the ITTPP linked to the SWFC.
Figure 4.4. Distribution of primary and secondary school teachers trained
through different routes across schools with higher/lower levels of
attainment three years after QTS, conditional on presence
Note: Figures are weighted by the number of teachers in each school to account for different
requirements for teachers across less/more disadvantaged schools.
Source: Authors’ calculations based on the ITTPP linked to the SWFC.
0%
10%
20%
30%
40%
50%
60%
70%
80%
90%
100%
HEI-led PG HEI-led UG GTP SCITT SDS SDUS TF
Th
ree
ye
ar
dis
trib
uti
on
Least disadvantaged 2 3 4 Most disadvantaged
0%
10%
20%
30%
40%
50%
60%
70%
80%
90%
100%
HEI-led PG HEI-led UG GTP SCITT SDS SDUS TF
Th
ree
ye
ar
dis
trib
uti
on
Lowest attainment 2 3 4 Highest attainment

31
© Institute for Fiscal Studies
5. The Mobility of Teachers Trained
Through Different Routes
The National Teaching Service has recently been proposed as a scheme to
increase the regional mobility of teachers, particularly to schools which
otherwise would have recruitment difficulties. Mobility across schools, and
indeed regions, is therefore seen as beneficial in some circumstances, providing
flexibility in the system. Public criticism of school-led training includes the
possibility that teachers trained predominantly in one school are less mobile
across schools and less effective teachers in schools in different circumstances. It
is worth noting, however, that higher mobility across schools can have negative
implications for pupil attainment (Ronfeldt et al., 2013). This section therefore
gives the first nationally representative picture of mobility of teachers across
schools, with a particular focus on those trained through different routes.
This section explores whether teachers trained through particular routes are
more mobile, but differences may be due to the characteristics of the trainees or
characteristics of the route. For example, trainees on school-led routes may have
stronger preferences for working in the local area, which influenced their choice
of route, and therefore may be less likely to find alternative employment in
another school. Alternatively, school-led routes may be more likely to prepare
teachers for teaching in a particular school context, which limits mobility.
Figure 5.1 shows the proportion of teachers trained through each route that are
in the same school, in a different school, and have left service three years after
achieving QTS. Conditional on being in service, teachers trained through school-
led or school-centred routes are roughly equally likely to move school by their
first three years of teaching (28% for GTP and 36% for SCITT compared to 31%
and 33% for HEI-led UG and PG routes). This is counter to the recent concerns
raised for School Direct, although of course the picture may emerge differently
for this route. Teachers trained through Teach First are most likely to move
schools by their third year after QTS, conditional on being in service: 59% of
teachers trained through this route leave their first school. This may have
positive implications for pupil attainment, on average, for example if Teach First
trainees go on to be effective teachers and/or leaders in other schools, but may
be disruptive for the schools they leave.

Longer-term costs and benefits of different initial teacher training routes
32
Figure 5.1. Mobility of primary and secondary school teachers trained
through different routes across schools three years after QTS
Note: School Direct salaried and unsalaried routes are excluded due to the recent introduction of
these routes. The sample excludes those that entered teaching after their first year post-QTS.
Source: Authors’ calculations based on the ITTPP linked to the SWFC.
Figures 5.2 and 5.3 explore the mobility of early career teachers across school
types, conditional on moving schools by the third year after QTS. In general, the
pattern of moves across schools is consistent with teachers’ preferences being for
schools with higher attainment and lower disadvantage, as more teachers move
towards schools of these types.
Figure 5.2 shows the pattern of movement across schools with higher/lower
levels of pupil disadvantage, for those that move schools. There are few
differences across routes, with the exception of Teach First, where almost 50%
move to a school with lower levels of pupil disadvantage, compared to 11% who
more to schools with higher levels of disadvantage.28 This is primarily a function
of where the trainees start teaching; 53% of teachers trained through Teach First
are in the most deprived quintile of schools in their first year after QTS, from
where they cannot possibly move to a more deprived school by our measure.
Movement across school types is most similar for teachers trained through the
HEI-led UG route, with around 35% moving to a school with higher and lower
levels of disadvantage.
Figure 5.3 shows a similar picture for movements across schools with
higher/equal/lower levels of attainment. Teach First trainees are much more
likely to move to a school with higher attainment, conditional on moving, than
28 These proportions (and those that follow) exclude those who move to a school of unknown
disadvantage. This makes the assumption that, for each route, the set of schools teachers move to with unknown deprivation look like the set of schools teachers move to with known deprivation.
0%
10%
20%
30%
40%
50%
60%
70%
80%
90%
100%
HEI-led PG HEI-led UG GTP SCITT SDS SDUS TF
Th
ree
ye
ar
dis
trib
uti
on
Left Move school Same school

The mobility of teachers trained through different routes
33
other routes: 63% of those who move go to a school with higher attainment,29
compared to 43% for HEI-led PG – the next most common route – and 38% for
HEI-led UG.
These findings suggest that teachers across all routes have preferences for
schools with higher levels of pupil attainment and lower levels of disadvantage,
although a definite conclusion would require consideration of the interaction
between school and teacher decisions (i.e., the movements of teachers across
schools may be determined by demand from schools rather than teachers’
preferences). There are few differences across routes, particularly for GTP and
HEI-led routes, which is relevant to current concerns about mobility of those
trained through school-led routes. Those trained through Teach First seem to
have distinct preferences (more likely to move to higher attaining and less
disadvantaged schools) but this is partly a function of the type of school in which
they begin their career.
Figure 5.2. Mobility of primary and secondary school teachers trained
through different routes across schools with higher/lower levels of
disadvantage three years after QTS
Note: A school’s level of disadvantage is defined by the weighted deprivation quintile as defined
above. Teachers defined as moving to a more/less/equally deprived school move to a school with a
higher/lower/equal deprivation quintile. The sample excludes those who entered teaching after
their first year post-QTS and those who teach in schools of unknown deprivation level.
Source: Authors’ calculations based on the ITTPP linked to the SWFC.
29 By contrast to the deprivation figures, this result can only be slightly affected by the initial
allocation of Teach First trainees – Teach First trainees are only marginally likely to be initially placed in low attaining schools in their first year (27% in the bottom quintile, and 24% in the second bottom quintile).
0%
10%
20%
30%
40%
50%
60%
70%
80%
90%
100%
HEI-led PG HEI-led UG GTP SCITT SDS SDUS TF
Th
ree
ye
ar
dis
trib
uti
on
Less disadvantaged Equally disadvantaged More disadvantaged
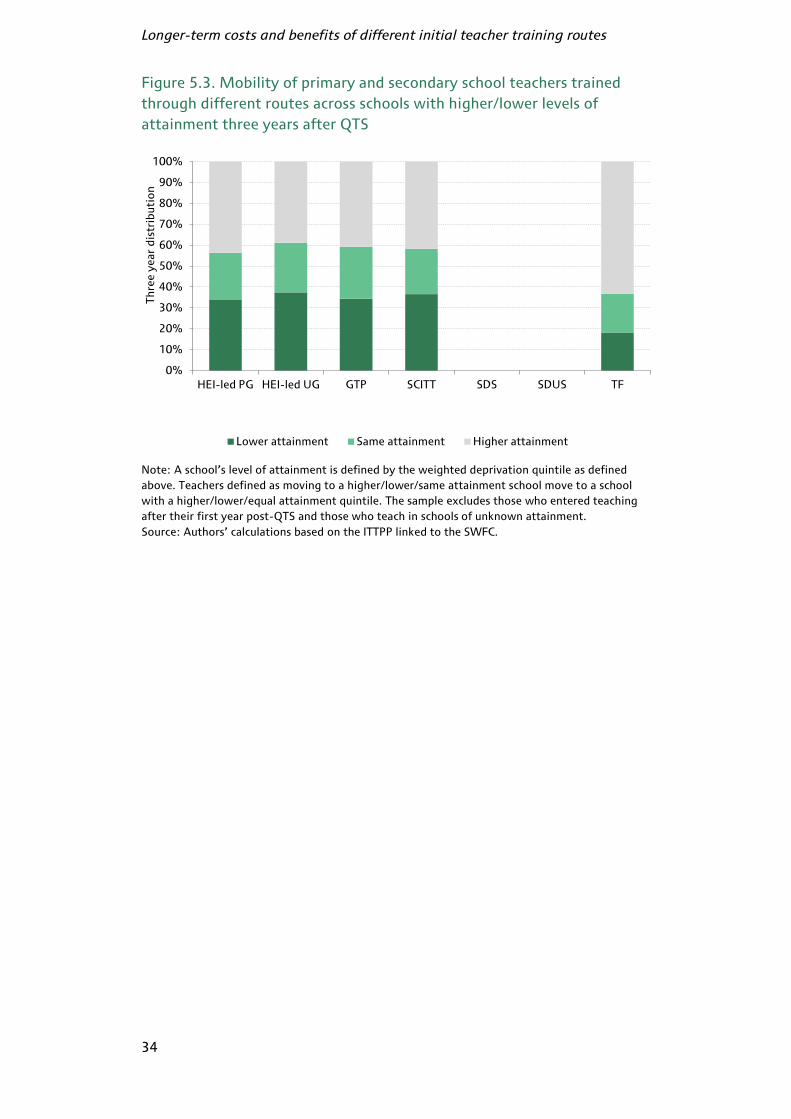
Longer-term costs and benefits of different initial teacher training routes
34
Figure 5.3. Mobility of primary and secondary school teachers trained
through different routes across schools with higher/lower levels of
attainment three years after QTS
Note: A school’s level of attainment is defined by the weighted deprivation quintile as defined
above. Teachers defined as moving to a higher/lower/same attainment school move to a school
with a higher/lower/equal attainment quintile. The sample excludes those who entered teaching
after their first year post-QTS and those who teach in schools of unknown attainment.
Source: Authors’ calculations based on the ITTPP linked to the SWFC.
0%
10%
20%
30%
40%
50%
60%
70%
80%
90%
100%
HEI-led PG HEI-led UG GTP SCITT SDS SDUS TF
Th
ree
ye
ar
dis
trib
uti
on
Lower attainment Same attainment Higher attainment

35
© Institute for Fiscal Studies
6. Demand-Led Provision?
Some indicators (although imperfect) suggest that teacher shortages are growing,
while an increasing proportion of training places remain unfilled (NAO, 2016). In
the context of increasing demand for teachers, especially in particular subjects
with shortages, it has been suggested that school-led ITT can help meet local
demand (DfE, 2016). This may be an advantage for some schools that are in a
position to become involved with school-led provision, but it has the potential to
create shortages elsewhere if the supply of training places does not meet overall
demand for teachers and/or teachers are not perfectly mobile. Geographical
location is an important determinant of choice of route and provider for trainees
(Hobson et al., 2009), and may also influence choice of school following
qualification. In Chapter 4, we showed that around 30% of teachers still in
service in the third year after QTS have changed schools by this time, suggesting
that teachers are reasonably mobile. By documenting the mobility of teachers
across regions, in this chapter we give some indication of whether the DfE’s
regional allocation of training places has implications for the employment and
retention of teachers trained in each region, and future regional vacancy rates.
To inform whether increasing school-led provision is likely to meet schools’
demand for teachers, in this chapter we also present some descriptive evidence
for the relationship between local demand for teachers (using a proxy of vacancy
rates and the proportion of posts temporarily filled) and school-led provision of
ITT. Evidence is presented at the Government Office Region level, which may
mask more local variation in teacher vacancy rates and the response of individual
schools.
As a context for this discussion, Figure 6.1 shows the allocation of training places
across regions for the 2014–15 academic year, split by whether the allocation is
to a provider (HEI or SCITT) or School Direct lead school. There is variation
across the country in the number of teacher training places per 100 pupils, from
around 4 per 100 pupils in the East Midlands to around 7 per 100 pupils in the
North West. There is also variation in the proportion of places allocated to School
Direct across regions, from around 25% of the total allocation in the South West,
to around 55% in the East of England.
Questions that arise from this are whether the variation in the total number of
allocated places is in part driven by school demand (e.g., due to higher vacancy
rates), whether the proportion of places allocated to School Direct is driven by
school demand (e.g., due to high vacancy rates or proximity to alternative
providers), and whether the mobility of teachers has been or is enough to offset
regional discrepancies in the allocation of training places per 100 pupils and the
level of demand for NQTs. A broader question is whether NCTL’s system of
allocating places to HEI- and school-led providers is driven by demand, with a
larger proportion of places unfilled on school-led routes, and unfilled places not
transferred across sectors (Universities UK, 2013).

Longer-term costs and benefits of different initial teacher training routes
36
Figure 6.1. Provider-led and School Direct training places per pupil
(2014–15)
Note: Teach First trainees are not included.
Source: Authors’ calculations from NCTL data.
Turning first to the relationship between the demand for NQTs and the location
of ITT providers, Figure 6.2 maps the regional vacancy rate (the proportion of
positions vacant or temporarily filled) recorded by the SWFC in November 2014,
and the position of ITT providers and School Direct lead schools. The vacancy
rate is lowest in the North East (0.6%) and North West (0.7%) and highest in the
South West (1.4%) and London (1.5%).30
ITT providers involved with provider-led and School Direct are generally well
spread across England, but there is some scarcity, for example, in the East of
England and parts of the South West and North West. There is some suggestion
that the allocation of training places responds to demand from schools, as there is
a high concentration of providers in London where there is the highest vacancy
rate. Figure 6.3 explores the correlation in more detail, showing the relationship
between regional vacancy rates and total training place allocations and School
Direct allocations. Excluding the North West and North East, there is a positive
correlation between the allocation of training places and the vacancy rate. (The
correlation is 0.82, which is significant at the 5% level.) There is less evidence
that the allocation of School Direct places has responded to school demand,
however: the correlation is negative (although not significant) whether or not the
North East and North West are included. This could be because vacancy rates are
an imperfect proxy for school demand,31 or because School Direct allocations are
determined by other factors.
30 Note that there are limitations with this, and alternative indicators for demand for teachers.
Gorard et al. (2006) suggest developing reliable indicators for teacher shortages. Vacancy rates
collected in the SWFC in November of each academic year may understate teacher shortages as
vacancies early in the school year are relatively low (NAO, 2016). 31
Alternatives include the proportion of unqualified teachers, and the proportion of lessons taught by a teacher without a relevant degree (NAO, 2016). Unfortunately, these indicators are not readily available for this purpose. Gorard et al. (2006) suggest developing such indicators.
0.0 1.0 2.0 3.0 4.0 5.0 6.0 7.0 8.0
East of England
East Midlands
Yorkshire and The Humber
West Midlands
South East
London
North East
South West
North West

Demand-led provision?
37
Figure 6.2. Map of teacher vacancies and temporarily filled posts by
region and location of provider-led and School Direct training places
Note: The map shows the percentage of teaching posts declared vacant or temporarily filled in
November 2014. Each dot shows the location of provider-led (HEI and SCITT) and School Direct
lead schools in 2014–15.
Source: DfE and NCTL.
Figure 6.3 shows that the allocation of School Direct training places does not
respond to contemporaneous regional vacancy rates, although this may mask
more local variation. Figure 6.4 considers whether School Direct provision has
instead responded to scarcity of alternative providers, showing the correlation
between training allocations to providers and School Direct lead schools across
regions. There is a strong positive correlation (0.75, which is significant at the 5%
level) between the allocation of provider-led and School Direct places. This
suggests that School Direct has in fact grown more in areas with alternative
provision, mirroring the historical pattern of allocations. This may be because
School Direct typically involves collaboration with providers in some way, which
limits the feasibility of establishing School Direct in isolated areas. An alternative
hypothesis is that NQTs are sufficiently mobile that schools in areas with scarce
provider provision have sufficient recruitment. One exception is the East of

Longer-term costs and benefits of different initial teacher training routes
38
Figure 6.3. Vacancy rates and School Direct training places (2014–15)
Note: The percentage of teaching posts declared vacant or temporarily filled is taken from
summary statistics from the SWFC in November 2014.
Source: DfE and NCTL.
Figure 6.4. Provider and School Direct training places (2014–15)
Note: The percentage of teaching posts declared vacant or temporarily filled is taken from
summary statistics from the SWFC in November 2014.
Source: DfE and NCTL.
Demand-led provision?
39
England, where School Direct has a large allocation despite a low allocation to
alternative providers, and large distances between lead schools and HEI
providers (as shown in Figure 6.2). This region may give an example of where
School Direct has met schools’ demand for involvement with ITT, perhaps to
meet schools’ demand for NQTs (although the regional vacancy rate is relatively
low).
To summarise the evidence in this chapter so far, there is some suggestion that
the allocation of training places across regions is correlated with vacancy rates,
although the North West and North East are exceptions to this. However, the
allocation of School Direct places is not correlated with regional vacancy rates,
which suggests that increasing school recruitment of NQTs is not the primary
motivation for schools to establish this route (although regional vacancy rates
may mask more local variation). School Direct has also not typically grown more
in areas with reduced access to alternative providers, except for in the East of
England.
We now consider whether the regional imbalances in training allocations have
implications for teacher employment and retention. This will be affected by the
regional demand for NQTs and the mobility of teachers across regions.
Figure 6.5 shows the three-year retention rate by region of ITT provider, where
trainees are counted as in service if recorded in a school in any region (not just
the region of training). The retention of teachers trained through all routes in the
North West is lowest (56–59%) and highest in the East of England (69–72%). The
retention rate for teachers trained in London is relatively low (60–63%) although
similar to surrounding regions. The implications for future ITT allocations
depend on the causes of the variation in retention across regions. If lower
retention is driven by fewer vacancies in the region of training (and low mobility
of teachers), then ITT allocations should in future take into account the regional
demand for teachers. If, however, regional variation in retention is caused by
underlying characteristics of the region (such as pupil composition, attainment,
the quality of life, or outside options), then compensating differentials may be
required.
Referring to previous evidence in this section, the retention rate is lowest for
teachers trained in the region with the highest allocation of trainees per pupil
(the North West), which also has a relatively low vacancy rate (see Figure 6.2),
suggesting that there may be an excess supply of teachers in this region.
Figure 6.6 shows the three-year retention rate by region of the trainee’s first
school. The retention rate is higher across the regions here, as the figures are
conditional on the trainee starting teaching. The retention rate across the regions
of the first school is more even, with a 6 percentage point difference between the
highest and lowest regional retention rates, compared to a 13 percentage point
difference for the region of training provider. The retention rate of those that
start teaching in the North West is 84–87%, which is in the middle of the range.
This suggests that the low retention rate of teachers trained in this region is due
to a lower qualification rate, those who move regions to begin their teaching
career, or those who do not enter the profession after qualification.

Longer-term costs and benefits of different initial teacher training routes
40
Figure 6.5. Three-year retention rate by region of ITT provider (lower
bounds)
Note: Legend shows lower bound estimates.
Source: Authors’ calculations based on the ITTPP linked to the SWFC.
In contrast to Figure 6.5, teachers who start teaching in London have the lowest
retention rate (81–84%). In Chapter 7, we explore in more depth whether the
higher wage outside options in London contribute to the lower retention rate,
conditional on starting teaching in the region.
Retention for those trained in different regions may be affected by the local
availability of jobs, but there is some evidence that teachers are relatively mobile.
Around half of the teachers surveyed by Menzies et al. (2015) reported that being
able to commute from their current home would be an important determinant of
where to teach, suggesting that location is not fixed, but around a third of NQTs
surveyed by Hobson et al. (2009) secured a post in a school in which they had
undertaken a placement during their ITT.

Demand-led provision?
41
Figure 6.6. Three-year retention rate by region of first school (conditional
on teaching first year after QTS)
Note: Legend shows lower bound estimates.
Source: Authors’ calculations based on the ITTPP linked to the SWFC.
Figure 6.7 shows the mobility of primary school teachers trained through
different routes across regions, three years after QTS, conditional on being in a
school one year after QTS. ‘Same region’ means that the teacher is in the same
region as their ITT provider three years after achieving QTS. Teachers trained
through GTP are most likely to be teaching in the same region as their training
provider after three years (76% compared to 63% for SCITT, 60% for HEI-led PG
and 57% for HEI-led UG). This perhaps reflects the selection of trainees on to this
route, who are on average older and may have a preference for teaching and
training in the local area. Teachers trained through HEI-led UG routes are most
mobile across regions, with 27% changing region between training and the first
year of teaching, and an additional 5% changing region between the first and
third years of teaching. Teachers trained through HEI-led PG and SCITT routes
have similar levels of mobility across regions.

Longer-term costs and benefits of different initial teacher training routes
42
Figure 6.7. Mobility of primary school teachers trained through different
routes three years after QTS across regions
Note: These proportions are conditional on being observed in a school in year one – hence giving
higher retention rates than previous figures.
Source: Authors’ calculations based on the ITTPP linked to the SWFC.
Figure 6.8 shows a similar picture, that teachers trained through GTP are less
likely to move across regions. The proportion of teachers trained through Teach
First that move region by year one (the first year after QTS) is, unsurprisingly,
very low, as teachers are committed to the same school for this year. The
proportion of teachers trained through Teach First that change region by year
three is large, however, around one-third of those that remain in service. Across
primary and secondary teachers, those trained through HEI-led routes,
particularly UG, are more mobile across regions than school-led routes,
particularly GTP. While it is not possible to conclude whether this is due to
supply or demand, it is likely that the system as a whole requires some
geographically mobile teachers and, as such, a mix of training routes.
In this chapter, we have shown that the allocation of training places is only in
part related to schools’ demand for NQTs (as measured by vacancy rates), and
that School Direct does not seem to respond to schools’ demand for NQTs or the
proximity of alternative providers. There is some suggestion that the discrepancy
between the number of teachers trained (per pupil) per region has implications
for the retention rate of teachers trained from that region, as not all teachers are
willing/able to be geographically mobile.
In line with the NAO (2016) recommendations, it seems sensible for the
government to consider the regional demand for teachers when allocating ITT
places.
0%
10%
20%
30%
40%
50%
60%
70%
80%
90%
100%
HEI-led PG HEI-led UG GTP SCITT SDS SDUS
Th
ree
ye
ar
dis
trib
uti
on
Same region Change region by year one Change region by year three Left

Demand-led provision?
43
Figure 6.8. Mobility of secondary school teachers trained through
different routes across schools three years after QTS across regions
Note: These proportions are conditional on being observed in a school in year one – hence giving
higher retention rates than previous figures.
Source: Authors’ calculations based on the ITTPP linked to the SWFC.
0%
10%
20%
30%
40%
50%
60%
70%
80%
90%
100%
HEI-led PG GTP SCITT SDS SDUS TF
Th
ree
ye
ar
dis
trib
uti
on
Same region Change region by year one Change region by year three Left

44
© Institute for Fiscal Studies
7. The Responsiveness of Retention to
Local Wages
In May 2015, the government announced that the minima and maxima of teacher
pay bands would be limited to rise by 1% per year until 2019–20, while average
non-teacher earnings are expected to rise more than this.32 To explore the
implications of future teacher pay restraint on the retention of early career
teachers, we explore whether teachers’ decisions are affected by pecuniary
considerations, by examining whether the retention rate is affected by the level of
local wages. We focus on the differences between ITT routes, providing evidence
on whether alternative wage options are more pertinent, or available, for
teachers trained through some routes.
Previous evidence suggests that pay is an important factor in a teacher’s decision
to remain in service, among others. For example, in a survey of teachers in their
fourth year, Hobson et al. (2009) found that 60% gave a ‘great deal’ or ‘fair
amount’ of weight to salary in their decision to continue teaching. Dolton and van
der Klaauw (1995, 1999) find that higher relative earnings for teachers reduce
attrition, although this finding is not universal (Dolton et al., 2003). A number of
studies have examined the effect of teacher pay on school performance and the
evidence is mixed (Hanushek, 1997, 2003), although recent work has shown
relative pay to be important for school performance. For example, Britton and
Propper (2016) found that a 10% shock to the teacher wage gap (the difference
between teacher pay and the local labour market) is associated with a 2% fall in
average school performance as measured by test scores in the UK. Evidence from
the US shows that one of the channels through which increasing local wages
relative to teacher pay adversely affects student performance is through
increasing teacher turnover (Marchand and Weber, 2015).
In what follows, we examine how teacher retention rates in England vary
according to the wages in the local labour market. This exploits the fact that local
non-teacher wages vary between areas, but teacher pay bands are set nationally
according to four large pay regions (Inner London, Outer London, Fringe London
and the rest of England). This requires defining a relevant outside option for
teachers. Worth et al. (2015) show that more than half of teachers leaving the
profession take jobs inside the education sector. Our data do not allow us to
control for occupation type but we account for the fact that teachers are, on
average, more educated than the general population by defining their outside
option as the 70th percentile of local wages, where local wages are defined as the
weighted average of local authority level wages within a 30 km radius of the
32 This is according to the forecast published by the Office for Budget Responsibility (OBR) in
March 2016, before the result of the UK referendum on membership of the European Union.

The responsiveness of retention to local wages
45
school where the teacher works.33 To reduce the measurement error in wages,
we take the five-year average of this wage.
Deciles of this wage measure are shown in Figure 7.1, with darker shades
indicating higher wage areas. This shows there is significant variation across the
country; 10% of schools have local wages below £16, while 10% have local wages
above £22.
Figure 7.1. Map of local wages
Note: Darker points represent schools in areas with higher local wages (average of 2010–14).
Source: Authors’ calculations based on the ASHE.
Use of the 70th percentile of wages is justified by comparing the main teacher pay
scales with local wages; however, Worth et al. (2015) find that, on average,
teachers move to lower paying jobs when they first leave teaching. Our definition
of relevant local wages also assumes that teachers look for alternative jobs within
a 30 km radius of their current school. Earlier in this report, we have shown that
some teachers are regionally mobile, however, and some teachers may only
consider more local alternatives.34 To address these concerns, we provide
33 Specifically, our measure of wages is an average of the 70
th percentile of wages in all local
authorities that fall within a 30 km radius of the school, weighted by the area of the local authority that lies within that 30 km radius.
34 For some individuals, this assumption is clearly problematic. We showed in Chapter 4 that 23%
of teachers move region by their third year of teaching, providing evidence that they are willing to move more than 30 km for work. However, our model is still valid if there is a subset of teachers who are less geographically mobile, or who use the local labour market as an indication of outside options further afield.
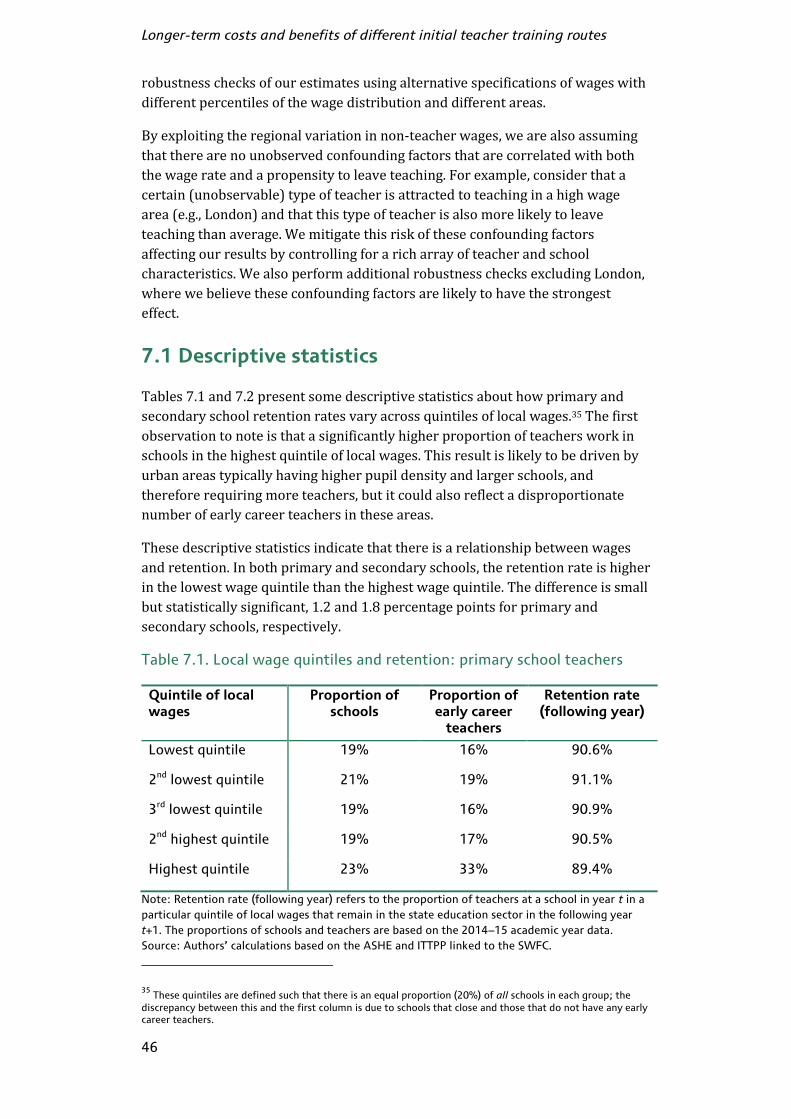
Longer-term costs and benefits of different initial teacher training routes
46
robustness checks of our estimates using alternative specifications of wages with
different percentiles of the wage distribution and different areas.
By exploiting the regional variation in non-teacher wages, we are also assuming
that there are no unobserved confounding factors that are correlated with both
the wage rate and a propensity to leave teaching. For example, consider that a
certain (unobservable) type of teacher is attracted to teaching in a high wage
area (e.g., London) and that this type of teacher is also more likely to leave
teaching than average. We mitigate this risk of these confounding factors
affecting our results by controlling for a rich array of teacher and school
characteristics. We also perform additional robustness checks excluding London,
where we believe these confounding factors are likely to have the strongest
effect.
7.1 Descriptive statistics
Tables 7.1 and 7.2 present some descriptive statistics about how primary and
secondary school retention rates vary across quintiles of local wages.35 The first
observation to note is that a significantly higher proportion of teachers work in
schools in the highest quintile of local wages. This result is likely to be driven by
urban areas typically having higher pupil density and larger schools, and
therefore requiring more teachers, but it could also reflect a disproportionate
number of early career teachers in these areas.
These descriptive statistics indicate that there is a relationship between wages
and retention. In both primary and secondary schools, the retention rate is higher
in the lowest wage quintile than the highest wage quintile. The difference is small
but statistically significant, 1.2 and 1.8 percentage points for primary and
secondary schools, respectively.
Table 7.1. Local wage quintiles and retention: primary school teachers
Quintile of local wages
Proportion of schools
Proportion of early career
teachers
Retention rate (following year)
Lowest quintile 19% 16% 90.6%
2nd lowest quintile 21% 19% 91.1%
3rd lowest quintile 19% 16% 90.9%
2nd highest quintile 19% 17% 90.5%
Highest quintile 23% 33% 89.4%
Note: Retention rate (following year) refers to the proportion of teachers at a school in year t in a
particular quintile of local wages that remain in the state education sector in the following year
t+1. The proportions of schools and teachers are based on the 2014–15 academic year data.
Source: Authors’ calculations based on the ASHE and ITTPP linked to the SWFC.
35 These quintiles are defined such that there is an equal proportion (20%) of all schools in each group; the
discrepancy between this and the first column is due to schools that close and those that do not have any early career teachers.

The responsiveness of retention to local wages
47
Table 7.2. Local wage quintiles and retention: secondary school teachers
Quintile of local wages
Proportion of schools
Proportion of early career
teachers
Retention rate (following year)
Lowest quintile 17% 15% 89.3%
2nd lowest quintile 22% 19% 89.2%
3rd lowest quintile 19% 16% 88.1%
2nd highest quintile 18% 18% 88.5%
Highest quintile 24% 32% 87.5%
Note: Retention rate (following year) refers to the proportion of teachers at a school in year t in a
particular quintile of local wages that remain in the state education sector in the following year
t+1. The proportions of schools and teachers are based on the 2014–15 academic year data.
Source: Authors’ calculations based on the ASHE and ITTPP linked to the SWFC.
7.2 Estimates of responsiveness
To estimate this relationship formally, we model the retention behaviour of
teachers using a logit regression controlling for other observable characteristics
of the teachers and schools, reducing the confounding factors they might play.
Throughout this section, we define retention as remaining in teaching the
following year. For more details on this model, see Appendix B.
Table 7.3 reports the results on our data from estimating this model, sequentially
adding in the cohort-, teacher- and school-level controls. The table reports the
average marginal effects calculated from the coefficients estimated in our logit
model. Before controlling for teacher or school characteristics, the result implies
that a 10% increase in local wages is associated with a 1.1 percentage point fall in
the retention rate (statistically significant at the 5% level). Controlling for teacher
and school characteristics does not significantly affect the size of our estimates
(although the teacher controls specification is not significant at the 5% level).
This effect size is small, but it is important to consider that this is an annual effect
and will compound across years. Using estimates from our preferred
specification, which controls for teacher and school characteristics, a teacher in
an area with 10% higher wages is 1.0 percentage point more likely to leave
teaching, each year.
Figure 7.2 examines how this responsiveness to local wages varies by the ITT
route through which the teacher trained. A striking finding here is that teachers
who train through the HEI-led UG route do not appear to respond to local wages
at all, with a marginal effect close to zero. This could be because teachers from UG
routes have an education-specific qualification, which may be less transferable to
the wider labour market.
It is also noticeable that the marginal effect of local wages on retention rate is
similar for both the HEI-led PG and the GTP, indicating that the location of
training, school-led or HEI-led, does not significantly affect the responsiveness of
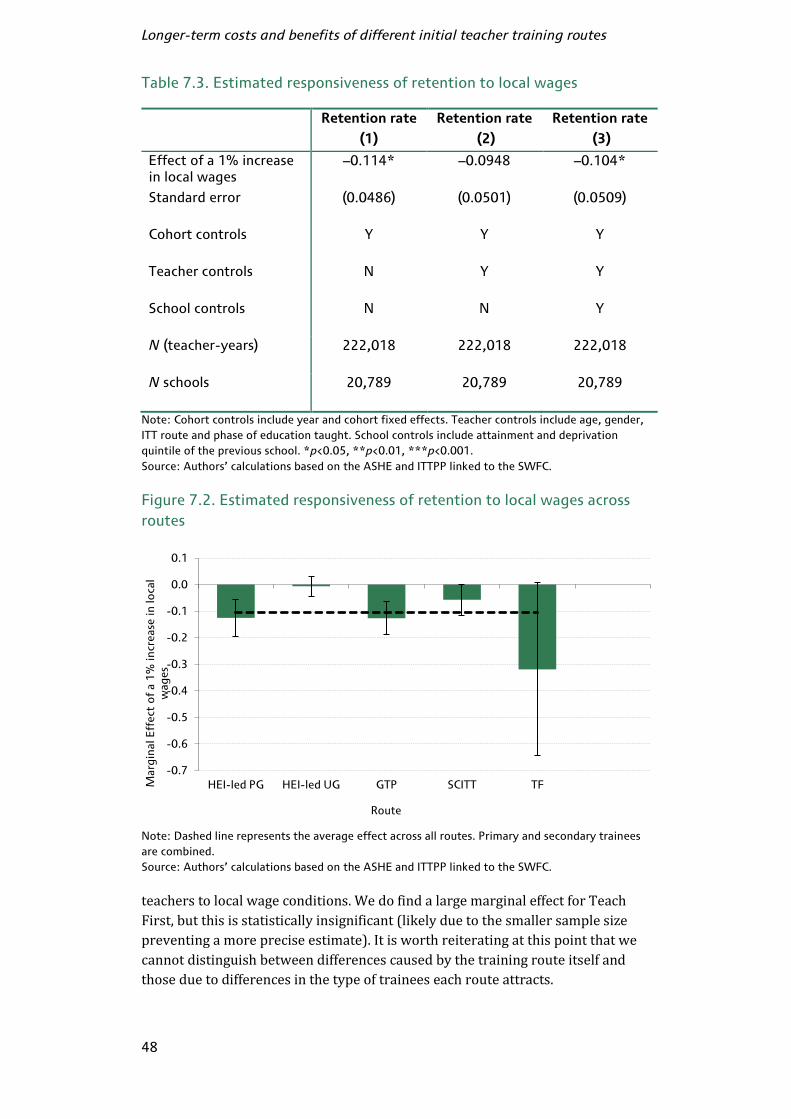
Longer-term costs and benefits of different initial teacher training routes
48
Table 7.3. Estimated responsiveness of retention to local wages
Retention rate
(1)
Retention rate
(2)
Retention rate
(3)
Effect of a 1% increase in local wages
–0.114* –0.0948 –0.104*
Standard error (0.0486) (0.0501) (0.0509)
Cohort controls Y Y Y
Teacher controls N Y Y
School controls N N Y
N (teacher-years) 222,018 222,018 222,018
N schools 20,789 20,789 20,789
Note: Cohort controls include year and cohort fixed effects. Teacher controls include age, gender,
ITT route and phase of education taught. School controls include attainment and deprivation
quintile of the previous school. *p<0.05, **p<0.01, ***p<0.001.
Source: Authors’ calculations based on the ASHE and ITTPP linked to the SWFC.
Figure 7.2. Estimated responsiveness of retention to local wages across
routes
Note: Dashed line represents the average effect across all routes. Primary and secondary trainees
are combined.
Source: Authors’ calculations based on the ASHE and ITTPP linked to the SWFC.
teachers to local wage conditions. We do find a large marginal effect for Teach
First, but this is statistically insignificant (likely due to the smaller sample size
preventing a more precise estimate). It is worth reiterating at this point that we
cannot distinguish between differences caused by the training route itself and
those due to differences in the type of trainees each route attracts.
-0.7
-0.6
-0.5
-0.4
-0.3
-0.2
-0.1
0.0
0.1
HEI-led PG HEI-led UG GTP SCITT TF Ma
rgin
al E
ffe
ct o
f a 1
% i
ncr
ease
in
lo
cal
wag
es
Route

The responsiveness of retention to local wages
49
We can also examine how the responsiveness of the teacher to outside wages
varies by other characteristics of the teacher. Table 7.4 gives the marginal effect
of local wages on retention rate separately for primary and secondary school
teachers, and then splits secondary school teachers according to the subject they
teach.
Table 7.4. Estimated responsiveness of retention to local wages: by phase
and subject
Phase Subject (secondary only)
Retention rate
(primary)
(1)
Retention rate
(secondary)
(2)
Retention rate
(high-priority)
(3)
Retention rate
(other priority)
(4)
Retention rate
(no priority)
(4)
Effect of a 1% increase in local wages
–0.0745 –0.134 –0.268* –0.111 0.00887
Standard error
(0.0729) (0.0693) (0.126) (0.0921) (0.155)
Cohort controls
Y Y Y Y Y
Teacher controls
Y Y Y Y Y
School controls
Y Y Y Y Y
N (teacher-years)
109,330 112,688 33,488 54,531 24,669
N schools 16,470 5,729 4,359 5,085 3,963
Note: Cohort controls include year and cohort fixed effects. Teacher controls include age, gender,
ITT route and phase of education taught. School controls include attainment and deprivation
quintile of the previous school. *p<0.05, **p<0.01, ***p<0.001.
Source: Authors’ calculations based on the ASHE and ITTPP linked to the SWFC.
We find that secondary school teachers appear to be more responsive than
primary school teachers, although neither effect is statistically significant at the
5% level (likely due to the that fact the sample is smaller). At least some of this
difference will be due to the fact that a higher proportion of primary school
teachers train through the HEI-led UG route, a group that we have already seen is
less responsive to outside wages.
We also find that amongst secondary school teachers, those who teach high-
priority subjects are the most responsive to outside wages. A 10% increase in
local wages reduces the retention rate of high-priority subject teachers by 2.7
percentage points for this group. This is of particular importance to the DfE.
Demand for high-priority subject teachers is likely to rise with the increasing
focus on English Baccalaureate (EBacc) subjects, at a time when retention of

Longer-term costs and benefits of different initial teacher training routes
50
these teachers may become harder as average earnings are expected to rise
faster than teacher pay in coming years (Office for Budget Responsibility,
2016).36 Earlier in this report we have shown that the retention rate is lower for
high-priority subjects (which include maths, chemistry, physics and modern
languages). Teachers with degrees in these subjects seem to be most in demand,
and these are the teachers who are most responsive to outside options, and most
likely to change careers.
7.3 Robustness checks
The evidence presented in this chapter so far indicates that higher local wages
are associated with lower teacher retention rates, and that the size of the effect
varies by the ITT route, phase of education and the type of subject taught. In what
follows, we test the robustness of these results, by altering some of the
assumptions we have made about the outside option teachers might consider.
First, we relax the assumptions about the level of outside wages relevant to
teachers. In the previous analysis, we assumed that the relevant measure of
wages was the 70th percentile of the overall local wage distribution. Table 7.5
presents the results from re-estimating our model instead using the mean or the
median of local wages. Using the mean of local wages gives a similar, but
insignificant, marginal effect, while using the median gives a substantially larger
estimate. This may indicate that some teachers are more responsive to changes
lower down the wage distribution.
Second, we examine the robustness of our estimates to the area of local wages we
consider. The objective is to choose the local area that represents the labour
market teachers consider when deciding whether or not to remain in teaching.
Our original specification assumed that this is the area within 30 km of the school
where the teacher works, but in reality little is known about how far teachers are
willing to travel for work. It is possible that using an area that is too small could
bias results, as high-earning families may choose to live close to good schools to
ensure they fall within the catchment area (and the quality of the school is also
likely to affect the retention rate of the teachers). However, using a very large
area would include jobs and labour markets irrelevant to teachers. Table 7.5
presents results from re-estimating the model instead using a 10 km and a 50 km
radius. Using a 10 km radius gives a substantially smaller, but statistically
significant, marginal effect, while using a 50 km radius gives a similar effect size
to our baseline specification, although no longer statistically significant.
Third, we consider the effect of using the current local wages rather than the
average over five years as in the baseline model. In this specification, we achieve
slightly larger and highly significant estimates. The five-year average of local
wages is chosen as the main specification to reduce measurement error in yearly
estimates, but it is reassuring that using yearly wages gives similar results.
36 This is according to the forecast published by the Office for Budget Responsibility (OBR) in
March 2016, before the result of the UK referendum on membership of the European Union.

The responsiveness of retention to local wages
51
These robustness checks reliably show there is a negative effect of local wages on
retention (i.e., higher local wages lead to lower retention rates), but the size of
these estimates is very sensitive to the exact speciation. The results presented

Table 7.5. Estimated responsiveness of retention to local wages: Robustness checks
Retention rate
(baseline)
(1)
Retention rate
(mean)
(2)
Retention rate
(median)
(3)
Retention rate
(10 km)
(4)
Retention rate
(50 km)
(5)
Retention rate
(current wages)
(6)
Effect of a 1% increase in local wages –0.104* –0.0816 –0.173* –0.033*** –0.104 –0.134***
Standard error (0.0509) (0.0439) (0.0692) (0.00977) (0.0597) (0.0319)
Cohort controls Y Y Y Y Y Y
Teacher controls Y Y Y Y Y Y
School controls Y Y Y Y Y Y
N (teacher-years) 222,018 222,018 222,018 222,018 222,021 222,018
N schools 20,789 20,789 20,789 20,789 20,790 20,789
Note: Cohort controls include year and cohort fixed effects. Teacher controls include age, gender, ITT route and phase of education taught. School controls include attainment and
deprivation quintile of the previous school. *p<0.05, **p<0.01, ***p<0.001.
Source: Authors’ calculations based on the ASHE and ITTPP linked to the SWFC.

The responsiveness of retention to local wages
53
here indicate that a 10% increase in local wages reduces the year-on-year
retention rate by between 0.3 and 1.7 percentage points.
Another potential concern is that teachers with a higher propensity to leave
teaching may choose to teach in high wage areas, which would introduce
spurious correlation between high outside wages and the propensity to leave
teaching. This could bias estimates if it is not possible to control for the
characteristics of the teacher that are associated with the higher propensity to
leave, or the characteristics of the high wage areas to which the teacher was
attracted.
We mitigate such a risk by controlling for an array of background characteristics
of the teachers and the schools they teach in, including the age, gender, degree
class, ITT training route and subject of the teacher and the level of deprivation
and attainment of the school. However this does not rule out the possibility of
unobservable selection entirely. If our estimates still suffer from selection bias it
is reasonable to expect its presence might be strongest in the selection in to or
out of London, an area which we also know has high wages and lower than
average retention rates. To remove any bias resulting from the selection of
certain types of teachers into London, Table 7.6 re-estimates our model excluding
London.
Table 7.6. Estimated responsiveness of retention to local wages: non-
London
Retention rate
(baseline)
(1)
Retention rate
(non-London)
(2)
Effect of a 1% increase in local wages –0.104* –0.0220*
Standard error (0.0509) (0.0112)
Cohort controls Y Y
Teacher controls Y Y
School controls Y Y
N (teacher-years) 222,018 175,797
N schools 20,789 18,238
Note: Cohort controls include year and cohort fixed effects. Teacher controls include age, gender,
ITT route and phase of education taught. School controls include attainment and deprivation
quintile of the previous school. *p<0.05, **p<0.01, ***p<0.001.
Source: Authors’ calculations based on the ASHE and ITTPP linked to the SWFC.
The exclusion of London results in a substantially smaller marginal effect than
our main specification, but it remains negative and statistically significant. The
difference between this estimate and the main specification can be interpreted in
two ways.

Longer-term costs and benefits of different initial teacher training routes
54
It is possible that the higher wages in London could be driving the lower
retention rate there. This would imply that the higher responsiveness estimates
based on the whole country represent the true response of teachers to local
wages. Alternatively, London may attract teachers with a higher propensity to
leave teaching, regardless of the higher wages, in which case the higher estimates
when including London are biased by this unobserved selection. In reality, it is
likely to be a combination of both factors which drives the result.
7.4 Summary
Teachers’ decisions to leave teaching appear to be affected by alternative local
wages, with a 10% increase in local wages associated with a 1 percentage point
fall in the year-on-year retention rate. This finding implies that retention rates
are likely to fall in coming years as teacher pay is expected to grow more slowly
than average wages.37 We have found evidence that this effect is smaller amongst
those teachers who train through the HEI-led UG route, perhaps because their
qualification is more education-specific. Secondary school teachers, particularly
those in high-priority subjects, are substantially more responsive to local wages.
This should be of particular concern to the DfE given the imperative need to
retain and attract teachers in high-priority subjects.
Our robustness checks have reliably shown the negative effect of local wages on
retention rates but the size of this effect is sensitive to the exact definition of local
wages; our estimates range between a 10% increase in local wages causing a 0.3
percentage point fall in retention and a 1.7 percentage point fall in retention.
More definitive estimates require research into the outside options that teachers
consider when deciding whether or not to leave teaching. We have reduced the
potential for selection bias to affect our estimates by controlling for detailed
background characteristics of the teachers and schools, and we have shown that
increased local wages are associated with lower retention rates even when we
exclude London, albeit with a smaller effect size.
Overall, we can conclude that an increase in local wages is very likely to be
associated with a reduction in the retention rate of early career teachers, but the
precise magnitude of the effect is uncertain.
37 This is according to the forecast published by the Office for Budget Responsibility (OBR) in
March 2016, before the result of the UK referendum on membership of the European Union.
55
© Institute for Fiscal Studies
8. Comparison across Routes
In this chapter, we draw on the previous chapters to provide a comparison of the
short- and longer-term costs and benefits of the different ITT routes. There are
important aspects of the current system not covered here, and this highlights
areas where further research is needed.
We provide a summary for each route, rather than calculating a single measure of
cost-effectiveness. This is because in addition to aspects discussed below, the
overall cost-effectiveness depends on the quality of teachers trained through
each route (defined by their impact on pupil attainment and long-term
outcomes), the longer-term retention of teachers trained through each route,
costs and benefits to ITT providers and the system as a whole. In addition, a
number of features summarised below are also difficult to monetise, such as the
proportion of teachers from each route that teach in schools with more
disadvantaged or lower attaining pupils.
8.1 Features of cost-effectiveness
The features of cost-effectiveness we are able to consider are those measured in
our survey of schools, and the retention and mobility of teachers trained through
each route. These are shown in Table 8.1, and are described briefly in turn.
Selection of trainees: this is the extent to which different routes attract
trainees of better or worse quality as measured by the initial perception of
characteristics of trainees, as reported by survey respondents. This is
described in full in Chapter 3 of our interim report (Allen et al., 2014). In
general, there is more variation in the perceived quality of trainees within
routes than is evident between routes. Table 8.1 summarises one perceived
characteristic only: the proportion of trainees thought to have ‘good’ or ‘very
good’ potential to be a good teacher.
Central costs: average costs to central government, in 2013–14. These include
the cost of direct grants paid to schools, providers and trainees, the cost of
providing student finance, and the cost of bursaries for trainees in priority
subjects. The average cost is calculated using the number of trainees with
particular characteristics that affect funding (such as degree class for bursary
funding).
School costs: the indirect and direct monetary costs reported by schools, and
calculated from external sources. Indirect costs are the opportunity cost of
time spent on training: mentoring; observations by a qualified teacher,
including feedback; lesson planning support; written assessment of the
trainee; liaising with the ITT provider; liaising with schools; arranging
training and observations; administration and paperwork (other than that
involved with recruitment, which was asked about elsewhere in the survey);

Longer-term costs and benefits of different initial teacher training routes
56
and ‘other’. Direct costs include the school recruitment fee per Teach First
trainee; payment to or from ITT providers; recruitment cost for School Direct
routes; salary for trainees employed by the school; associated payroll costs
for trainees employed by the school (minus the contribution that would
otherwise have been made for an NQT).38
School benefits: benefits reported by survey respondents, described in full in
Chapter 4 of our interim report (Allen et al. 2014). Table 8.1 summarises two
specific reported benefits: the proportion of respondents that ‘agree’ or
‘strongly agree’ that a specific trainee provided fresh teaching ideas and the
proportion that expect to hire the trainee on qualification. Table 8.1 also
summarises the proportion of school survey respondents who report that the
benefits of hosting the trainee are greater than, and less than, the costs to
their school (everything considered).
Achieve QTS: the proportion of trainees that achieve QTS, derived from the
ITTPP. This gives some indication of initial wastage from ITT, but may be a
combination of the quality of the trainee and quality of the training.
Retention rate (one year): the proportion of trainees that are ‘in service’ the
year following expected QTS date. This shows the percentage of trainees that
teach in state-maintained schools in England one year after expected QTS
date. As discussed in Chapter 4, this may not perfectly reflect early career
retention, as some routes have higher retention in the second year following
expected QTS date.
Retention rate (five year): the proportion of trainees that are ‘in service’ the
fifth year following expected QTS date. This is the latest possible retention
rate it is possible to calculate using the data available to us. It is not possible
to observe longer-run retention rates for School Direct, given the timing of
the introduction of these routes.
Presence in disadvantaged schools: the proportion of trainees that are ‘in
service’ in the most disadvantaged quintile of schools three years after
achieving QTS. This provides some information on the presence of trainees
from different routes in schools that are of particular focus for government.
Mobility: the proportion of trainees that move schools up to three years after
achieving QTS, conditional on becoming a teacher. The proportion of trainees
that change region between training to become a teacher and three years
following QTS. This relates to the hypothesis that trainees from school-led
routes are less mobile across schools. Regionally, mobility is of interest in a
system where training places are allocated to providers without accounting
for regional demand for NQTs.
Response to local labour market: the estimated impact of a 10% increase on
local wages on the retention rate for teachers in the following academic year.
38 Any grants schools receive from central government (e.g., for School Direct salaried trainees)
are deducted from the schools’ direct costs.

Comparison across routes
57
One interpretation of the effect of the local labour market on teacher
retention is the extent to which teachers are making marginal decisions
between teaching and alternative careers. Trainees with a high

Table 8.1. Costs and benefits of ITT routes
Cost/benefit HEI-led PG HEI-led UG GTP SCITT SD(S) SD(US) Teach First
Selection of trainees: ‘good’ or ‘very good’ potential to be a good teacher
82% pri.
79% sec.
93% pri.
89% pri.
83% sec.
88% pri.
79% sec.
86% pri.
81% sec.
90% pri.
83% sec.
83% sec.
Central costs (average)
[minimum, maximum]
Primary: £18,408
[£13,287, £24,281]
Secondary: £22,354
[£13,287,
£35,281]
Primary: £15,158
[£14,352, £20,658]
N/A Primary: £18,101
[£13,287,
£24,281]
Secondary: £20,526
[£13,287,
£35,281]
Primary: £14,811
[£14,000, £19,360]
Secondary: £15,699
[£0, £26,290]
Primary: £17,201
[£11,751,
£26,531]
Secondary: £19,597
[£11,751, £40,281]
Secondary: £25,958
School costs (average)
2013–14
Primary: £4,286
Secondary: £1,173
Primary: £4,123
N/A Primary: £5,355
Secondary: £3,531
Primary: £2,631
Secondary: £14,566
Primary: £5,166
Secondary: £3,554
Secondary: £10,567
School benefits: fresh teaching ideas
63% pri.
77% sec.
74% pri.
94% pri.
80% sec.
80% pri.
69% sec.
70% pri.
56% sec.
78% pri.
70% sec.
69% sec.
School benefits: expect to hire
23% pri.
28% sec.
18% pri. 71% pri.
56% sec.
62% pri.
34% sec.
71% pri.
52% sec.
63% pri.
35% sec.
59% sec.
School benefit > cost
40% pri.
50% sec.
58% pri. 72% pri.
65% sec.
68% pri.
46% sec.
54% pri.
48% sec.
63% pri.
52% sec.
61% sec.
School benefit < cost
29% pri.
20% sec.
22% pri. 6% pri.
13% sec.
16% pri.
22% sec.
29% pri.
29% sec.
15% pri.
27% sec.
19% sec.
Achieve QTS 91% pri.
88% sec.
78% pri.
92% pri.
91% sec.
90% pri.
87% sec.
90% pri.
89% sec.
88% pri.
89% sec.
91% sec.

Retention rate (one year)
63–66% pri.
60–63% sec.
50–53% pri. 77–80% pri.
73–76% sec.
69–72% pri.
62–65% sec.
69–72% pri.
63–66% sec.
73–76% pri.
68–71% sec.
80–87% sec.
Retention rate (five year)
58–61% pri.
51–54% sec.
63–66% pri. 65–68% pri.
59–62% sec.
61–64% pri.
56–59% sec.
N/A N/A 37–44% sec.
Percentage in disadvantaged schools
(if in service after three years)
23% 22% 24% 21% N/A N/A 54%
Mobility
(if in service)
31% 33% 28% 36% N/A N/A 59%
Regional mobility
(if in service)
29% pri.
34% sec.
35% pri. 11% pri.
15% sec.
27% pri.
30% sec.
N/A N/A 36% sec.
Response to local labour market
(10% increase in outside wages)
1.3 ppt decrease in retention
No effect on retention
1.3 ppt decrease in retention
0.6 ppt decrease in retention
N/A N/A 3.2 ppt decrease in retention
Note: ppt denotes percentage point.
Source: Authors’ calculations based on the ITTPP linked to the SWFC and survey of primary and secondary schools, described in our interim report (Allen et al.,
2014), ITTPP (NCTL), and DfE.

Longer-term costs and benefits of different initial teacher training routes
60
responsiveness to the local labour market may be more likely to leave at
times when average non-teacher graduate wages grow faster than average
teacher wages, as is forecast to happen in coming years.
Impact of training placement on pupil attainment: further research is
required, as calculating the short-term impact of the presence of a trainee
was not possible for each route separately. The general finding across routes
was that the presence of the trainee did not affect contemporaneous pupil
attainment at the end of primary and secondary school, but this may be
because trainees are allocated to other year groups, or because only schools
that are confident that pupil attainment will not be compromised are
involved with ITT.
Teacher effectiveness: further research is required. Measuring teacher
effectiveness in England across a representative sample of teachers across
routes is currently not possible with existing data in England. The new Ofsted
two-stage inspection process for ITT providers should provide some useful, if
short-term, information in this area.39
Caveats
The costs and benefits to schools involved with ITT were drawn from a survey of
schools currently involved. On average, these schools have higher Ofsted ratings
than those not currently involved, and have other characteristics associated with
better circumstances. This highlights the limitation, true of any research of this
type, that the costs and benefits may be different for those schools that are
unable to, or choose not to, currently participate in ITT. There is also selection
into particular routes, which means that the costs and benefits for schools
currently involved with one route may not be applicable to those currently
involved with another. This is most relevant to school-led routes, where some
schools may not have the capacity to run and deliver effective training.
Particular characteristics of trainee teachers that choose each route may
influence the findings presented here. That is, it is sometimes not possible to
separate the effect of preferences of the trainee (that influenced their choice of
route and subsequent choices) from the influence of the training route.
8.2 Summary of features of cost-effectiveness
There are no significant differences in the proportion of trainees from each route
that are perceived to have ‘good’ or ‘very good’ potential to become good
teachers. This is an early indication of the effectiveness of trainees as they
entered their training placement. More research (and information) is required to
understand whether these initial perceptions translate into longer-term teacher
quality. The Ofsted inspection of ITT providers is moving in this direction, with
an inspection of teaching now required in the Autumn term following QTS (for
those that enter the profession). While useful, longer-term information about
39 https://www.gov.uk/government/news/new-approach-to-teacher-training-inspection.

Comparison across routes
61
teacher quality is essential before any conclusions regarding the cost-
effectiveness of each route can be made.
Central costs for each route (on average) vary across routes and stages of
education, from £15,700 for School Direct salaried secondary trainees, to £26,000
for Teach First trainees. There is also variation within each route, driven by the
funding system for trainees with different characteristics, subjects, and in
different areas. For example, School Direct salaried trainees in non-priority
subjects receive no funding from central government, while the maximum cost is
£26,000. The maximum cost to central government is for School Direct unsalaried
(£40,000)40 although the average cost is similar to that for other routes. The
central cost is largest for Teach First (£26,000), and this is constant across all
trainee types.
School costs are lower than central government costs for each route and stage of
education (with the exception of School Direct salaried in secondary schools for
reasons discussed at length in Chapter 2). Costs to schools are lower for HEI-led
routes (PG and UG) than for SCITT, School Direct and Teach First. The school cost
for School Direct salaried and Teach First is partly offset by the salary that would
otherwise have been paid to a NQT, however.
Trainees from school-led routes are more likely to have the expectation of being
hired following QTS. In part, this reflects the expectation that schools involved
with these routes have the capacity to hire the trainee. This may bring a benefit
to the individual school, but the system as a whole is likely to benefit from
teachers who are mobile across schools and areas as teacher demand fluctuates.
There are few significant differences in the contribution of fresh teaching ideas,
or other stated benefits, across routes, although there is some variation in the
perception of benefits in relation to costs (everything considered). Only 40% of
primary school respondents feel that the benefit of hosting PG trainees outweighs
the cost, compared to 72% of GTP trainees and 68% of SCITT trainees. There are
similar patterns among secondary school respondents, where GTP and Teach
First had the highest percentage of respondents stating that the benefits
outweighed the costs (65% and 61%, respectively) compared to around half for
other routes. Experiences of training routes vary across schools, however, with
around one fifth of school respondents reporting benefits less than costs for most
routes. Exceptions are GTP, where fewer schools reported benefits less than
costs, and School Direct (salaried), where around one third felt that benefits were
less than costs.
The proportion of trainees that achieve QTS across PG routes is similar, and
around 10 percentage points lower for the HEI-led UG route. Including those that
do not achieve QTS, the retention rate one year after the expected QTS date is
highest for Teach First (80–87%). This reflects the expectation that Teach First
participants commit to a school for one year pre- and post-QTS. The lowest one-
year retention rate is for HEI-led UG, where only around 50–53% of trainees are
40 This is for a trainee in a high-priority subject with a first-class degree who receives an uplifted
bursary.

Longer-term costs and benefits of different initial teacher training routes
62
in service (although this is not representative of the true retention rate of HEI-led
UG trainees as the proportion of teachers in service increases to 63–66% after
five years). The one-year retention rate for School Direct salaried trainees is
roughly similar to SCITT trainees, slightly lower than School Direct unsalaried
and slightly higher than for HEI-led PG.
Figure 8.1 combines the five-year retention rate estimates with the central costs
associated with ITT to show an average central cost per teacher ‘in service’ after
five years for each of the routes for which we have data available.41 Teach First
has both the lowest five-year retention rate (37–44%) and the highest average
central cost. This means that the average central cost per Teach First trainee who
remains in service five years after QTS is therefore between £59,000 and
£70,000.42 For other secondary school routes, the five-year retention rates are
higher and the central costs lower, resulting in a lower implied average central
cost per trainee ‘in service’ after five years of between £35,000 and £44,000.43
For primary school teachers, the central costs are lower still, and the retention
rates even higher, resulting in average central costs between £25,000 and
£29,000 per trainee.
Figure 8.1. Average central costs per teacher ‘in service’ after five years
Note: Error bars represent the likely range of plausible retention rates, reflecting known
measurement error and statistical uncertainty.
Source: Authors’ calculations based on the ITTPP linked to the SWFC and survey of primary and
secondary schools.
41 We do not have estimates of the five-year retention rate for School Direct and we do not have
central cost estimates for the now discontinued GTP route.
42 The figures differ from the width of the error bars in Figure 8.1 as the figure also includes
statistical uncertainty from estimating the retention rate.
43 This excludes the School Direct salaried figures, which have very low average central costs due
to the high number of non-priority trainees.
£0
£20,000
£40,000
£60,000
£80,000
£100,000
PGCE SCITT B.Ed PGCE SCITT TF
Primary Secondary
Comparison across routes
63
Of those that are in service three years after QTS, with the exception of those that
trained through Teach First, a roughly proportionate number teach in
disadvantaged schools. Of those who trained with Teach First that are still in
service three years after QTS, over half teach in the fifth most disadvantaged
schools (defined by pupil intake). Depending on the focus and priorities of
government, this may offset some of the negative implications of the lower
retention rate for this route. Teachers from Teach First are also the most mobile
across schools, with around 60% of those in service having changed schools
within three years after QTS. It is worth noting that mobility across schools can
be thought of as positive if it reflects flexibility in the system (and indeed is a
recent focus for government), but it can have negative implications for pupil
attainment (Ronfeldt et al., 2013). Around one-third of teachers trained through
other routes change school in their early career, conditional on starting teaching.
Although mobility across schools is similar, regional mobility is much lower for
GTP than other routes. This may reflect the preferences of trainees that select
this route, but it is interesting that these preferences do not limit mobility across
schools. As discussed in Chapter 6, regional mobility is helpful to the system
where the allocation of training places does not meet demand for teachers and in
circumstances where the demand for teachers fluctuates (perhaps in response to
pupil numbers). This suggests that some mobility is desirable. Unfortunately, we
cannot conclude whether GTP (or its replacement School Direct) led to teachers
with lower regional mobility, or whether trainees with lower regionally mobility
were attracted to this route. More research is needed to study the routes that are
considered, and applied to, by potential teachers with different sets of
characteristics.
Teachers trained through most routes show some responsiveness to the local
labour market, which suggests that the decision to remain in teaching is affected
by outside options. This is strongest for Teach First trainees, who are most likely
to leave the profession if teaching in a high-wage area. Retention for teachers
from HEI-led UG routes is not affected by local wages, which may reflect lower
outside options for individuals with an education-specific degree.
This summary shows the key differences and similarities between routes into
teaching in England. This is not sufficient to conclude whether one route is more
cost effective than another, as this depends crucially on the long-term
effectiveness of teachers trained through each route. There are also judgements
for policy makers, such as the value placed on teaching in disadvantaged schools.
The following section considers what would be required for such a conclusion,
and factors that should inform the design of the optimal ITT system.
8.3 Areas for future research
This research has not been able to consider the costs and benefits for ITT
providers, and how these respond to changes in the allocation of training places.
It is reasonable to assume there are economies of scale in the provision of ITT,
but uncovering the nature of this would require a detailed survey of providers
that is beyond the scope of this project. Recent evidence suggests that it is

Longer-term costs and benefits of different initial teacher training routes
64
possible for providers to absorb reductions in allocations. For example, the NAO
reported that the DfE has grown school-led training, in line with policy, without
university providers leaving the market in large numbers (NAO, 2016) but this
finding is limited to the short run, perhaps before providers have fully adjusted to
the new system. The complementarity of school-led and HEI-led provision is also
an area of interest that affects the overall cost-effectiveness of the system.
Designing an optimal initial teacher training system
The content and precise structure of ITT courses is the subject of dedicated
research and policy, which is not within the remit of our research or expertise.
There are some general principles for the efficient functioning of any system
which are related to our research, however, which are helpful to consider.
First, certainty allows agents in the market to make rational long-term decisions.
Uncertainty leads to suboptimal allocations of resources and effort. This is
related to the current system of allocating training places to providers, which has
varied from year to year, moving in September 2015 from provider-level to
national allocations. Information can also change at short notice. For example, as
reported by NAO (2016), the NCTL halted university recruitment for physical
education ITT in 2015–16 only two days after warning providers that 75% of
places had been filled. This does not allow for long-term planning in staff
recruitment or the allocation of resources across school and HEI-led routes (for
providers involved with both, and for schools considering involvement in ITT).
The proposal in the recent White Paper from the DfE to ‘provide greater certainty
to the best school and HEI providers by exploring ways to offer multi-year
allocations’ (a return to an approach used between 2007 and 2010) is welcome.
Second, availability of information is important for long- and short-term
decisions. This is relevant for central government, who decide the number of
training places across subjects without sufficient information on the regional
demand for teachers (in total and in each subject). Our results suggest that
teachers are not perfectly mobile across regions, so an over-supply of NQTs in
one region may lead to a lower retention rate for these teachers, and therefore
misallocated resources.
More information is also required on the factors that affect the decision to enter
teacher training. For example, whether the distance to ITT provider is an
important determinant of deciding to train for many teachers (which would
favour decentralised, typically school-led ITT) or whether a centralised, uniform
system would be feasible. Gorard et al. (2006) suggest this would be a cost-
efficient method of training, in contrast to the current move to school-led
provision. The cost-effectiveness of providing financial incentives to train as a
teacher must also be rigorously evaluated, against the alternative policy choices,
such as reducing the pupil:teacher ratio, which may reduce teacher workload and
therefore wastage rates.
The optimal design for ITT therefore depends not only on the structure and
content of the course, but also on the correct incentives to attract (and retain)
trainees, an efficient allocation of places across local areas, and sufficient stability

Comparison across routes
65
and accurate information for providers to make long-term decisions. The current
distinction is between school-led and HEI-led provision, with some suggesting
that school-led provision is necessary for school recruitment. Whether all schools
should, and could, be involved with school-led teacher training is an important
question for future research.

66
© Institute for Fiscal Studies
9. Conclusion
The overall cost-effectiveness of ITT depends on the priorities for central
government, for example the weight placed on teachers’ presence in
disadvantaged schools. There are also features of cost-effectiveness that are
impossible to measure using current sources of data, such as longer-term teacher
quality. This report has provided evidence on some key features of cost-
effectiveness for different routes into teaching, most importantly the retention
rate and average net costs for schools and central government.
The five-year retention rate across routes is largely similar for primary school
trainees, but variable across routes (and lower) for secondary school trainees.
This implies large differences in the average cost of a teacher in school five years
after their expected qualification date.
The average cost of a teacher is also affected by the average cost to central
government, and to the schools involved with the training. The average cost to
central government varies across routes, particularly for secondary school
trainees, which is driven by the alternative systems of funding across routes. The
average net cost to schools is much smaller than the average cost to central
government, but it is still an important component of the overall cost of ITT.
Average school costs are particularly variable across routes for secondary school
trainees, partly because costs for some routes are offset by direct funding from
central government.
Total average costs are markedly larger for Teach First (more than £14,000
higher than for any other route). This is partly due to higher average central
grant funding; Teach First receives around £10,000 more per trainee than the
average for School Direct salaried trainees, but this difference is less pronounced
for high-priority subjects. Average costs to schools are also highest for Teach
First, but schools involved are equally likely to say the benefits of this training
route outweigh the costs, suggesting that the benefits are also large.
The overall cost-effectiveness of each route cannot be considered in isolation, as
all routes are in part collaborative. School-led routes typically partner with HEIs
for some elements of the training, for example. An important feature of the
system as a whole is therefore the costs and benefits to ITT providers, and how
these are affected by changing allocations. Large economies of scale in ITT would
suggest that fewer, centralised providers would be more efficient, although there
may be competing considerations, such as meeting local demand for teachers.
This is an area of research we have been unable to cover, but it is especially
relevant at a time with dramatic changes in the allocation of training places from
HEI- to school-led provision. Longer-term changes to allocations should be clear
and transparent, however, to allow providers to make effective long-term plans.
As noted in the recent DfE White Paper (DfE, 2016), there is widespread concern
about a shortage of teachers, especially in priority subjects. A number of our
Conclusion
67
findings relate directly to this concern. First, there are differences in retention
rates across training routes, particularly at secondary level. The government may
therefore be able to influence longer-term retention rates by changing the
allocation of training places across routes. However, these differences in
retention may reflect differences in the underlying preferences or characteristics
of trainees across routes rather than a product of the training routes. Second,
there is some suggestion that an oversupply of training places relative to demand
for teachers in the local area leads to a lower retention rate, and therefore higher
average cost per teacher in service. This suggests that the government should
take into account the regional demand for teachers when allocating training
places. Third, there is evidence suggesting that high local wages, relative to
teacher pay, are associated with lower retention rates. The government cannot
directly influence the local labour market; however, this finding suggests that
retention is in part determined by the relative level of teacher pay. The policy of
fixing annual growth in teacher pay to 1%, below the forecast growth in average
wages, is therefore likely to reduce the retention rate of teachers.44
Of course, retention is also affected by teachers’ wider well-being, such as
workload and pupil behaviour, which should inform broader discussions about
teacher retention. In recent years, generous bursaries have been introduced in
priority subjects with the aim of increasing recruitment to address the shortage.
Future research should consider whether these bursaries have been effective at
raising recruitment, both to training and subsequently to state schools in
England, in comparison with alternative methods of increasing teacher numbers.
Our research has found that the cost of training an additional teacher who will
remain in teaching five years after achieving QTS can be as high as £70,000. This
cost may be higher than alternative policies that could retain an existing teacher
for an additional five years, such as higher pay, better support, or continued
professional development.
The role of increasing school-led ITT in affecting recruitment and retention must
also be considered. The longer-run retention of those trained through school-led
routes is typically equal to or greater than retention for HEI-led routes, which is
most noticeable for the GTP. From the early retention rates available to date, it is
unclear whether its replacement, School Direct salaried, will replicate this higher
retention rate. If the longer-run retention rate is lower, the reasons for this
should be explored and addressed. Recruitment for School Direct salaried has
been lower than anticipated by government, leading some to suggest that
increasing the role of school-led routes could exacerbate any shortage of teachers
(Universities UK, 2013). This may be because schools are more discerning when
selecting trainees, but reports from our survey suggest that the perceived quality
of trainees on each route is largely similar. Further research should explore
whether the increasing role of school-led ITT will increase teacher shortages and
the reasons for this.
44 This is according to the forecast published by the Office for Budget Responsibility (OBR) in
March 2016, before the result of the UK referendum on membership of the European Union.

Longer-term costs and benefits of different initial teacher training routes
68
Finally, the cost-effectiveness of ITT, and different routes, depends on the
effectiveness of teachers in improving pupil attainment. We found no evidence
that the presence of trainees affected department- or school-level effectiveness at
the end of secondary and primary schools, respectively, but this could be because
schools make a calculated decision about involvement with ITT based on the
possible effects on pupil attainment. Trainees from each route were roughly
equally likely to be rated as having ‘good’ or ‘very good’ potential to be a good
teacher, but further research is needed to establish what this implies for the
qualification rate and long-term effectiveness for teachers training through each
route.
While further research is needed, there are a number of concrete suggestions to
improve the system of ITT in England based on research presented here. First,
funding across routes could be rationalised, with direct grants available for each
route (in the place of current tuition fees). This would remove any potential
disincentive to train as a result of student fees, while being largely cost neutral
for government because a teacher with typical career progression would not
begin to pay back the additional student loan to achieve QTS. Evidence should
inform the status quo where some routes receive substantially more funding
from central government if this is to be maintained. Second, allocations to ITT
providers and School Direct lead schools should take into account regional (and
perhaps more local) demand for teachers. This is likely to increase retention
rates and therefore to reduce the average cost of training per teacher in service.
Third, the allocations to providers should be clear and transparent in advance of
applications so that the candidates with the best potential to be good teachers are
selected, as suggested in the recent White Paper. As mentioned previously,
whether candidates are less likely to be selected for school-led routes, and the
resulting implications for teacher quality and teacher shortages, are important
questions for future research to determine whether the current system of ITT
meets the needs of schools and central government.

69
© Institute for Fiscal Studies
Appendix A. Matching the SWFC and
ITTPP
Consistently identifying teachers across datasets
To estimate the retention in the profession of those training to be teachers, we
need to do the following.
1. We need to consistently identify individuals where they appear on multiple
occasions in the ITTPP. For our analysis in this report, we wish to record their
first registration on a course leading to QTS and to calculate the earliest date
at which QTS was achievable. Individuals will have multiple records if:
they registered on a course lasting more than one year;
they registered on a one-year course, but took longer than a year to
complete it;
they registered on multiple courses (in this case we take the route and
timing details from the first registration but look across all courses to see
whether QTS was ever achieved);
if a provider recorded them in a year by error (for example, not removing
them after completion or withdrawal);
if two different providers registered the same individual (for example, a
school-centred ITT provider and a higher education institution who are
both involved in their training).
2. We need to consistently identify individuals within the five years of SWFC
data available.
3. We need to successfully identify teachers from the ITTPP who go on to teach
in state-maintained schools in England, finding them in the SWFC.
Using the teacher reference number as an identifier across
datasets
The teacher reference number (TRN) is a seven-digit identifier allocated by the
Qualified Teacher Status and Induction (QTS-I) team within the DfE. It is used as
a unique teacher identifier for many purposes; for example, a TRN is allocated to
all trainees on state-funded ITT programmes, it is used for identification for
pensions purposes, and it is assigned to overseas teachers who are awarded QTS
by virtue either of their existing teaching qualifications (EU and Schengen
countries plus Canada, USA, Australia and New Zealand) or following assessment
for QTS in the UK.

Longer-term costs and benefits of different initial teacher training routes
70
It should, in theory, be a unique identifier for teachers, but is occasionally not; for
example, a teacher who is unqualified and opts out of the Teachers’ Pension
Scheme will not have a TRN, a teacher may be allocated two different TRNs for
rare administrative reasons, and a TRN can be recorded with error by a school.
The TRN is present on almost all records in the ITTPP (missing on just 323
records or 0.09%). TRNs appear just once in 74% of cases, twice in 13% of cases,
three times in 10% of cases and four or more times in 3% of cases. (These
multiple entries are mostly correct repeat entries of the same teacher in multiple
years of ITTPP.)
In the version of the SWFC that we use here, TRNs are missing at the rate of about
1% in years 2010–13 and at a rate of 2% in 2014. The missing TRNs in the SWFC
are more prevalent among the youngest teachers. This may be because they are
unqualified teachers who are choosing not to contribute to the Teachers’ Pension
Scheme and so do not possess a TRN. However, we think this is relatively rare.
More likely, we believe it is because they are new to the school and the school has
not entered their TRN into their management information system by the time of
the November census.
Data availability for fuzzy matching of teachers
Fuzzy matching is a technique used to link records within and between databases
where a unique identifier cannot be used to match perfectly. For that reason,
matches may be less than a hundred per cent perfect. We use it here to
consistently identify individuals within each of our databases and between our
databases.
The TRN remains a key identifier, but we now assume it may be coded with error
or that individuals may hold several TRNs simultaneously. In addition, we draw
on personal identifiers across the databases. In the ITTPP, the fields available to
us are date of birth, first name, surname, gender and ethnicity. It does not include
an alternative surname field. Where training route precedes employment in
schools, this is not a problem for linking to the SWFC post-QTS award; it may lead
to under-matching if an individual changes their surname between working as an
unqualified teacher and taking a training course, or if they take multiple courses
and change their surname during the process.
The SWFC has the same personal identifiers as the ITTPP, but we additionally
have a former family name field. Unfortunately, the data are incomplete in other
respects. First, the name fields are missing for about half the records in the 2010
census, leading to significant risk of under-matching for individuals joining the
profession in this year. Second, personal identifiers are missing where the SWFC
has been patched with additional records from the Database of Teacher Records,
which is compiled from pension records. This has happened where a school has
entirely failed to make a census return (23,164 records in total across 2010–13;
the 2014 SWFC has not yet been imputed).

Appendix A
71
Fuzzy matching procedure and performance
We draw records from all our databases and implement a fuzzy match to create
an alternative consistent teacher identifier that we call the FFT ID. At the start of
this process, we clean the name text fields to remove errant characters, prefixes,
suffixes, and so on, to improve the chances of consistency across databases. We
implement a typical fuzzy matching procedure that prioritises exact matches on
fields such as TRN and date of birth, and attempts matches on common variants
of names. We attempt to avoid over-matching by ensuring that our procedure
does not result in teachers working in multiple schools in one year. At the end of
this procedure, we perform a standard set of under-matching and over-matching
checks, and we manually adjust a small number of the FFT IDs accordingly.
We evaluate the performance of the FFT IDs created by our fuzzy matching
procedure by comparing them to the TRNs in the databases. Overall, they are in
considerable agreement. According to the FFT ID, there are slightly more trainees
in the dataset overall but there are also notably more individuals with multiple
records (245,842 FFT IDs in the ITTPP versus 243,838 TRNs). Conflicts occur in
only 5,880 FFT ID individuals (i.e., 2.4% of all the individuals identified using the
fuzzy matching procedure).
The creation of the FFT IDs identifies a slightly different set of teachers achieving
QTS in the ITTPP compared to the records identified by the DfE. The DfE subset
of NQTs contains 193,434 records for teachers achieving QTS; we think this
includes a small number of duplicates and we can identify only 193,389 unique
teachers in this subset who were awarded QTS. However, we find 199,419
teachers with unique FFT IDs who achieve QTS in the full ITTPP database.45
The linked 2010–14 SWFC database that we are using in our analysis has been
set up to contain one record per individual per year, with the main contract being
selected where teachers work at multiple schools. Our FFT ID identifies small
additional numbers of occasions where a teacher is present in multiple schools in
a year, but with different (or missing) TRNs (see Table A.1). On the whole, this
indicates that the quality and consistency of the DfE matching work is good.
Table A.2 shows patterns of presence across the five years of the SWFC for
teachers using the FFT ID and the TRN as alternative identifiers. The FFT ID has
fewer occasions where an individual is identified as present for only one of the
years of the census. In the majority of cases where the TRN identifies an
individual in one year only and the FFT ID does not, this is because the TRN is
missing or invalid (i.e., 9,999,999 or 0). In these cases, the FFT ID identifies the
individual in question anywhere between two and five times.
45 It is important to note that the ITTPP is not the main record of whether QTS is awarded. The
DfE have an independent record in the form of the Database of Qualified Teachers (DQT) for this purpose.

Longer-term costs and benefits of different initial teacher training routes
72
Table A.1. The FFT ID in the SWFC
2010 2011 2012 2013 2014
Total number of observations 485,445 483,023 488,768 492,631 497,484
Number with missing FFT IDs 0 0 0 0 0
Number of distinct FFT IDs within a year
485,418 482,985 488,731 492,601 497,430
FFT ID appears once in a year 485,391 482,947 488,694 492,571 497,376
FFT ID appears twice in a year 54 76 74 60 108
Table A.2. Patterns of presence across years of the SWFC
Years present in: FFT ID TRN ID
2010 2011 2012 2013 2014 N % N %
No No No No Yes 46,116 7% 48,529 7%
No No No Yes No 9,523 1% 12,156 2%
No No No Yes Yes 34,855 5% 34,180 5%
No No Yes No No 7,272 1% 9,438 1%
No No Yes No Yes 2,320 0% 2,304 0%
No No Yes Yes No 5,208 1% 5,104 1%
No No Yes Yes Yes 31,278 5% 30,983 5%
No Yes No No No 7,493 1% 9,415 1%
No Yes No No Yes 928 0% 922 0%
No Yes No Yes No 622 0% 606 0%
No Yes No Yes Yes 2,280 0% 2,266 0%
No Yes Yes No No 4,515 1% 4,299 1%
No Yes Yes No Yes 1,296 0% 1,267 0%
No Yes Yes Yes No 4,294 1% 4,155 1%
No Yes Yes Yes Yes 31,374 5% 30,884 5%
Yes No No No No 39,218 6% 40,153 6%
Yes No No No Yes 2,106 0% 2,118 0%
Yes No No Yes No 945 0% 943 0%
Yes No No Yes Yes 2,661 0% 2,663 0%
Yes No Yes No No 1,660 0% 1,677 0%
Yes No Yes No Yes 517 0% 519 0%
Yes No Yes Yes No 1,092 0% 1,093 0%
Yes No Yes Yes Yes 7,036 1% 7,070 1%
Yes Yes No No No 30,086 4% 30,011 4%
Yes Yes No No Yes 2,603 0% 2,606 0%
Yes Yes No Yes No 1,388 0% 1,391 0%
Yes Yes No Yes Yes 5,237 1% 5,226 1%
Yes Yes Yes No No 29,785 4% 29,790 4%
Yes Yes Yes No Yes 6,276 1% 6,274 1%
Yes Yes Yes Yes No 34,261 5% 34,238 5%
Yes Yes Yes Yes Yes 320,547 48% 319,673 47%

Appendix A
73
The FFT ID also identifies a larger number of individuals who are present across
all five years of the census (48% of all teachers). It is worth noting that both the
TRN as an ID and the FFT ID identify relatively large numbers who are missing in
2010 and present in 2011–14, or vice versa. If the missing name fields for the
2010 census could be recovered, then it is possible that some of these individuals
could be correctly matched across all years.
Missing records in SWFC
A teacher may be teaching in a school and yet not be recorded in the November
SWFC for a number of reasons, as follows.
1. The school may have entirely failed to make a SWFC return. Where this
happened in 2010, 2011, 2012 and 2013, the Database of Teacher Records
has been used to impute the missing information from Teachers’ Pensions
Scheme records. However, there is considerable lag between a teacher’s
arrival at a school and their appearance in the Database of Teacher Records,
so – particularly for new teachers – this will not always be possible.
2. The school may have inadvertently failed to record an individual teacher.
This may be more likely where that teacher is new to the school payroll and
was not included in the previous year’s census return
3. The school may have decided not to provide a return for teachers currently
training in their school if they did not consider them to be ‘full’ employees,
against the completion guidance provided by the DfE.
If the missing record problem is significant, particularly in relation to those who
are new to the profession or to the school, then we risk seriously understating
teacher retention as there will appear to be more cases of a teacher being in the
school system, then disappearing.
Known missing records for employment-based ITT teachers
Teach First placements in years one and two
Teach First participants are employed by schools in the first two years of their
programme and so should appear in the SWFC. Teach First maintain their own
records of participant location and drop-out. From these records, we can see that
across the cohorts starting the programme in 2010, 2011 and 2012:
only 81% can be identified in the SWFC in the November of year one,
whereas Teach First’s own records suggest that 96% are teaching in schools;
78% can be identified in the SWFC in the November of year two, whereas
Teach First’s own records suggest 87% are teaching in schools.
School Direct Salaried
School Direct is a new programme and the salaried route was first available from
2013–14. These School Direct salaried trainees are employed while training and
should appear in the SWFC during their training year. NCTL’s initial analysis of
the School Direct salaried route showed very significant numbers of missing

Longer-term costs and benefits of different initial teacher training routes
74
records for the 2,185 trainees in the 2015 ITTPP achieving QTS at the end of their
course. Of these:
2,183 were allocated a TRN;
1,581 were found in the SWFC during their training year (2013);
1,768 were found during their first year of qualified employment in SWFC
2014 (1,405 appear in both training and first post-QTS year).
Finding missing records using the date of arrival in school
The SWFC contains a field recording the date of arrival in school of the teacher.
So, for example, if a teacher appears in SWFC 2012 with a date of arrival in school
of 01/09/2010, then we should find the same teacher in the same school in SWFC
2011 and SWFC 2010. Assuming the date of arrival in school is accurate, if we
cannot find them in earlier years, then we know the records are missing and can
write the records back into the SWFC. We can do this for two different types of
SWFC records: those for teachers who are still teaching at the school (open
records) and those for teachers who left the school within the past 12 months
(closed records). Table A.3 shows that the number of records found via open
contracts varies a little by SWFC year; very few additional records are identified
through analysis of the arrival date on closed contracts.
There are two possible difficulties with the approach. The first is that teachers
may be incorrectly written back for years where they were not actually employed
teachers in the school:
this might happen where students are on PGCE training placements;
the date of arrival in school may simply be incorrect;
there may be breaks in service within the period bounded by the date of
arrival and current date.
The second possible difficulty is that the probability of recovering the record may
be a function of the characteristics of the teacher or the school. In particular, it
seems less likely that we would manage to write back a missing record for high-
turnover teachers than we would for those with a tendency to remain in schools
for longer. It is also possible that an academy resets the date of arrival in school
at the point of academy conversion (although our inspection of the data suggests
they are only resetting the contract start date and not the arrival date). Thus, all
of these adjustments to write back missing records may or may not further
distort the presence of records in the SWFC.
Overall, this approach to recovering missing records materially affects estimates
of early career retention as it disproportionately writes back records for teachers
who are young and who are recently qualified.

Appendix A
75
Table A.3. Identifying missing records using date of arrival in school
Found in main SWFC
Found via arrival date on open
contract
Found via arrival date on closed
contract
N % N % N %
2010 SWFC 485,416 94% 25,422 5% 4,590 1%
2011 SWFC 482,978 96% 21,267 4% 1,252 0%
2012 SWFC 488,728 96% 17,154 3% 1,815 0%
2013 SWFC 492,596 97% 12,704 2% 3,916 1%
Table A.4. Success rate in identification of Teach First records in the
SWFC
Cohort starting the programme in:
2010 2011 2012
% of starting cohort found in the SWFC 81% 79% 82%
% found using open contract start dates 7% 8% 6%
% found using closed contract start dates
1% 1% 2%
% found somewhere in the SWFC 89% 88% 90%
% of starting cohort that Teach First record as still teaching
96% 96% 96%
% of starting cohort found in the SWFC 81% 76% 77%
% found using open contract start dates 2% 1% 1%
% found using closed contract start dates
0% 1% 3%
% found somewhere in the SWFC 83% 78% 81%
% of starting cohort that Teach First record as still teaching
90% 85% 86%
Table A.4. summarises the success of the use of arrival date to recover Teach First
participant records that are known to be missing. It shows the importance of this
write-back approach for participants in the first year of the programme, with
fewer records written back in year 2. There are still some records missing for
each cohort and year.

76
© Institute for Fiscal Studies
Appendix B. Accounting for Variation
in Teacher Pay
In this appendix, we discuss how the specification we use measures the impact of
local wages relative to the average level of teacher pay.
Our main specification is given by
Until 2013, teacher pay bands were set nationally according to the four pay
regions: Inner London, Outer London, Fringe Area and rest of England. By
including fixed effects for pay region, we control for the average level of pay in
each region. This means that our estimate measures the effect of the local wage
gap (i.e., the difference between local wages and average teacher wage in the pay
region). Consider
where is the average teacher pay in the pay region where teacher works and
changes in national pay teacher pay levels are captured by .
This is equivalent to
where
We chose to control for the pay region average pay rather than the actual pay the
teacher earns because, prior to 2013, teacher pay could only vary by the spine
point of the teacher. In this specification, we want to analyse the effect of the
difference between a teacher’s inside option, what they could earn in teaching,
and their outside option, local wages. Average teacher pay gives a closer
approximation to a teacher’s potential future earnings than their current pay
grade. Post-2013 schools had more flexibility to vary pay in line with
performance; we chose to exclude this additional variation as it is likely to be
endogenous. The level of performance-related pay a teacher earns will vary with
unobserved individual teacher characteristics, which may also affect propensity
to leave. Instead, we only exploit the variation between the nationally set pay
regions and pay in the local labour markets.

77
© Institute for Fiscal Studies
Appendix C. Assumptions for Average
Costs
The average costs are calculated using the examples of central and school costs
per teacher in the online appendix to this report (with additional figures for
Outer London and Fringe London46). The calculation of these costs is described in
detail in the interim report (Allen et al., 2014). To create average figures for each
route, we combined these examples with the breakdown of trainee
characteristics from the ITTPP SWFC linked data in 2013–14. However, this
requires making a number of additional assumptions, which are outlined below.
We do not observe whether primary teachers are ‘maths specialists’. These
trainees receive £2,000 higher bursaries if they have a first-class or 2:1 degree
and are on a tuition-fee route. We assume that there are no primary maths
specialists. This will cause our figures to slightly underestimate the central cost
for these routes; however, this is a relatively innocuous assumption.
We do not observe whether a trainee takes out student finance and/or is eligible
for a maintenance grant. We assume that all trainees on tuition-fee routes take
out the full tuition fee and maintenance loan (which will lead us to slightly
overestimate costs) but do not receive a maintenance grant (leading to a slight
underestimate of costs).
We do not observe which trainees are awarded scholarships and therefore we
assume that no trainees receive scholarships. This will lead us to underestimate
central costs for the routes offering scholarships; however, the effect is small
especially if the majority of those awarded scholarships have first-class or 2:1
degrees, as the scholarships are awarded instead of the bursary.
The ITTPP data do not distinguish between upper and lower second-class
degrees. This is problematic as degree class determines the size of the bursary for
some subjects. We assume all second-class degrees are 2:1 degrees (in 2013–14,
68% of full-time second-class degrees were 2:1).47 This will lead us to slightly
overestimate the costs.
46 Available from authors on request.
47 Higher Education Statistics Agency (HESA), Statistical First Release (SFR) 210, Higher Education
Student Enrolments and Qualifications Obtained at Higher Education Providers in the United Kingdom 2013/14, https://www.hesa.ac.uk/sfr210.

78
© Institute for Fiscal Studies
Appendix D. Retention Rate by Cohort
Primary trainees
Figure D.1. Retention rate of primary school HEI-led PG trainees expected
to achieve QTS between 2010 and 2014, by cohort
Note: ‘Cohort 2010’ refers to the cohort that was expected to achieve QTS in 2010, ‘Cohort 2011’
to the cohort that was expected to achieve QTS in 2011, and so on. Error bars represent the likely
range of plausible retention rates, reflecting known measurement error and statistical uncertainty.
Source: Authors’ calculations based on the ITTPP linked to the SWFC.
Figure D.2. Retention rate of primary school HEI-led UG trainees
expected to achieve QTS between 2010 and 2014, by cohort
0
0.1
0.2
0.3
0.4
0.5
0.6
0.7
0.8
0.9
1
Achieve QTS
Year 1 Year 2 Year 3 Year 4 Year 5
Cohort 2010
Cohort 2011
Cohort 2012
Cohort 2013
Cohort 2014
0
0.1
0.2
0.3
0.4
0.5
0.6
0.7
0.8
0.9
1
Achieve QTS
Year 1 Year 2 Year 3 Year 4 Year 5
Cohort 2010
Cohort 2011
Cohort 2012
Cohort 2013
Cohort 2014
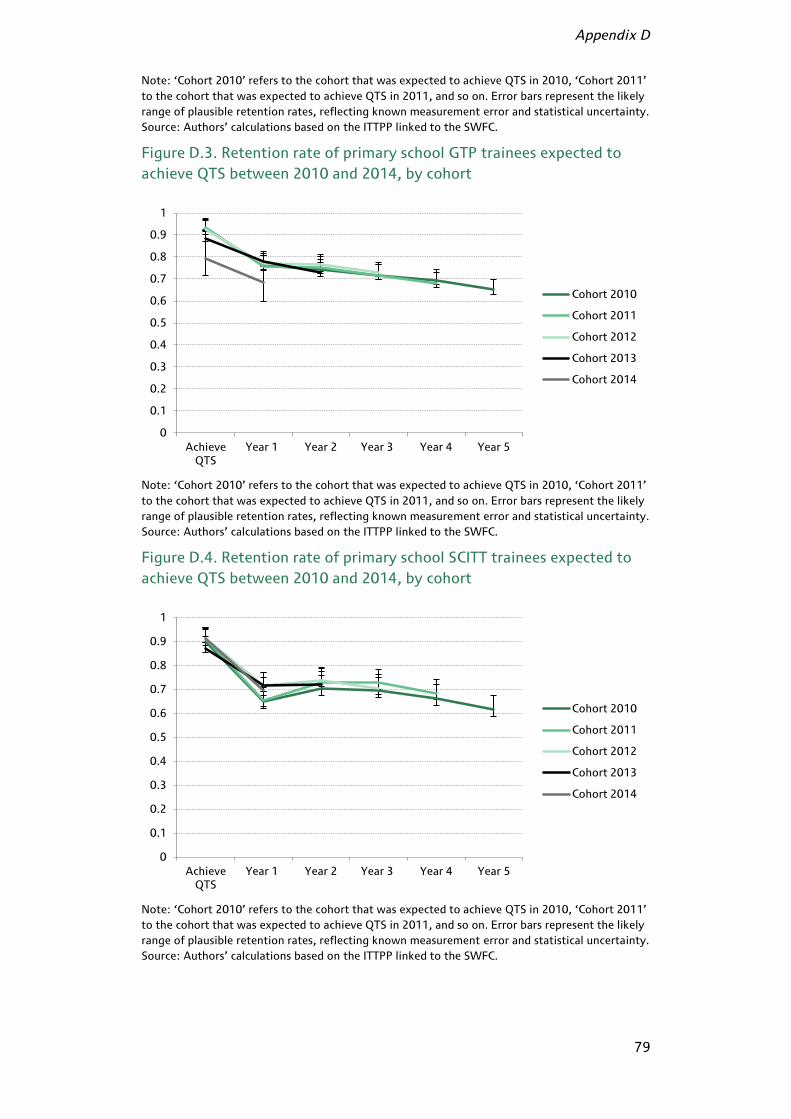
Appendix D
79
Note: ‘Cohort 2010’ refers to the cohort that was expected to achieve QTS in 2010, ‘Cohort 2011’
to the cohort that was expected to achieve QTS in 2011, and so on. Error bars represent the likely
range of plausible retention rates, reflecting known measurement error and statistical uncertainty.
Source: Authors’ calculations based on the ITTPP linked to the SWFC.
Figure D.3. Retention rate of primary school GTP trainees expected to
achieve QTS between 2010 and 2014, by cohort
Note: ‘Cohort 2010’ refers to the cohort that was expected to achieve QTS in 2010, ‘Cohort 2011’
to the cohort that was expected to achieve QTS in 2011, and so on. Error bars represent the likely
range of plausible retention rates, reflecting known measurement error and statistical uncertainty.
Source: Authors’ calculations based on the ITTPP linked to the SWFC.
Figure D.4. Retention rate of primary school SCITT trainees expected to
achieve QTS between 2010 and 2014, by cohort
Note: ‘Cohort 2010’ refers to the cohort that was expected to achieve QTS in 2010, ‘Cohort 2011’
to the cohort that was expected to achieve QTS in 2011, and so on. Error bars represent the likely
range of plausible retention rates, reflecting known measurement error and statistical uncertainty.
Source: Authors’ calculations based on the ITTPP linked to the SWFC.
0
0.1
0.2
0.3
0.4
0.5
0.6
0.7
0.8
0.9
1
Achieve QTS
Year 1 Year 2 Year 3 Year 4 Year 5
Cohort 2010
Cohort 2011
Cohort 2012
Cohort 2013
Cohort 2014
0
0.1
0.2
0.3
0.4
0.5
0.6
0.7
0.8
0.9
1
Achieve QTS
Year 1 Year 2 Year 3 Year 4 Year 5
Cohort 2010
Cohort 2011
Cohort 2012
Cohort 2013
Cohort 2014

Longer-term costs and benefits of different initial teacher training routes
80
Figure D.5. Retention rate of primary school School Direct salaried
trainees expected to achieve QTS between 2010 and 2014, by cohort
Note: ‘Cohort 2010’ refers to the cohort that was expected to achieve QTS in 2010, ‘Cohort 2011’
to the cohort that was expected to achieve QTS in 2011, and so on. Error bars represent the likely
range of plausible retention rates, reflecting known measurement error and statistical uncertainty.
Source: Authors’ calculations based on the ITTPP linked to the SWFC.
Figure D.6. Retention rate of primary school School Direct unsalaried
trainees expected to achieve QTS between 2010 and 2014, by cohort
Note: ‘Cohort 2010’ refers to the cohort that was expected to achieve QTS in 2010, ‘Cohort 2011’
to the cohort that was expected to achieve QTS in 2011, and so on. Error bars represent the likely
range of plausible retention rates, reflecting known measurement error and statistical uncertainty.
Source: Authors’ calculations based on the ITTPP linked to the SWFC.
0
0.1
0.2
0.3
0.4
0.5
0.6
0.7
0.8
0.9
1
Achieve QTS
Year 1 Year 2 Year 3 Year 4 Year 5
Cohort 2010
Cohort 2011
Cohort 2012
Cohort 2013
Cohort 2014
0
0.1
0.2
0.3
0.4
0.5
0.6
0.7
0.8
0.9
1
Achieve QTS
Year 1 Year 2 Year 3 Year 4 Year 5
Cohort 2010
Cohort 2011
Cohort 2012
Cohort 2013
Cohort 2014

Appendix D
81
Figure D.7. Retention rate of primary school Teach First trainees expected
to achieve QTS between 2010 and 2014, by cohort
Note: ‘Cohort 2010’ refers to the cohort that was expected to achieve QTS in 2010, ‘Cohort 2011’
to the cohort that was expected to achieve QTS in 2011, and so on. Error bars represent the likely
range of plausible retention rates, reflecting known measurement error and statistical uncertainty.
Source: Authors’ calculations based on the ITTPP linked to the SWFC.
Secondary trainees
Figure D.8. Retention rate of secondary school HEI-led PG trainees
expected to achieve QTS between 2010 and 2014, by cohort
Note: ‘Cohort 2010’ refers to the cohort that was expected to achieve QTS in 2010, ‘Cohort 2011’
to the cohort that was expected to achieve QTS in 2011, and so on. Error bars represent the likely
range of plausible retention rates, reflecting known measurement error and statistical uncertainty.
Source: Authors’ calculations based on the ITTPP linked to the SWFC.
0
0.2
0.4
0.6
0.8
1
1.2
Achieve QTS
Year 1 Year 2 Year 3 Year 4 Year 5
Cohort 2010
Cohort 2011
Cohort 2012
Cohort 2013
Cohort 2014
0
0.1
0.2
0.3
0.4
0.5
0.6
0.7
0.8
0.9
1
Achieve QTS
Year 1 Year 2 Year 3 Year 4 Year 5
Cohort 2010
Cohort 2011
Cohort 2012
Cohort 2013
Cohort 2014

Longer-term costs and benefits of different initial teacher training routes
82
Figure D.9. Retention rate of secondary school Teach First trainees
expected to achieve QTS between 2010 and 2014, by cohort
Note: ‘Cohort 2010’ refers to the cohort that was expected to achieve QTS in 2010, ‘Cohort 2011’
to the cohort that was expected to achieve QTS in 2011, and so on. Error bars represent the likely
range of plausible retention rates, reflecting known measurement error and statistical uncertainty.
Source: Authors’ calculations based on the ITTPP linked to the SWFC.
Figure D.10. Retention rate of secondary school HEI-led UG trainees
expected to achieve QTS between 2010 and 2014, by cohort
Note: ‘Cohort 2010’ refers to the cohort that was expected to achieve QTS in 2010, ‘Cohort 2011’
to the cohort that was expected to achieve QTS in 2011, and so on. Error bars represent the likely
range of plausible retention rates, reflecting known measurement error and statistical uncertainty.
Source: Authors’ calculations based on the ITTPP linked to the SWFC.
0
0.2
0.4
0.6
0.8
1
1.2
Achieve QTS
Year 1 Year 2 Year 3 Year 4 Year 5
Cohort 2010
Cohort 2011
Cohort 2012
Cohort 2013
Cohort 2014
0
0.1
0.2
0.3
0.4
0.5
0.6
0.7
0.8
0.9
1
Achieve QTS
Year 1 Year 2 Year 3 Year 4 Year 5
Cohort 2010
Cohort 2011
Cohort 2012
Cohort 2013
Cohort 2014
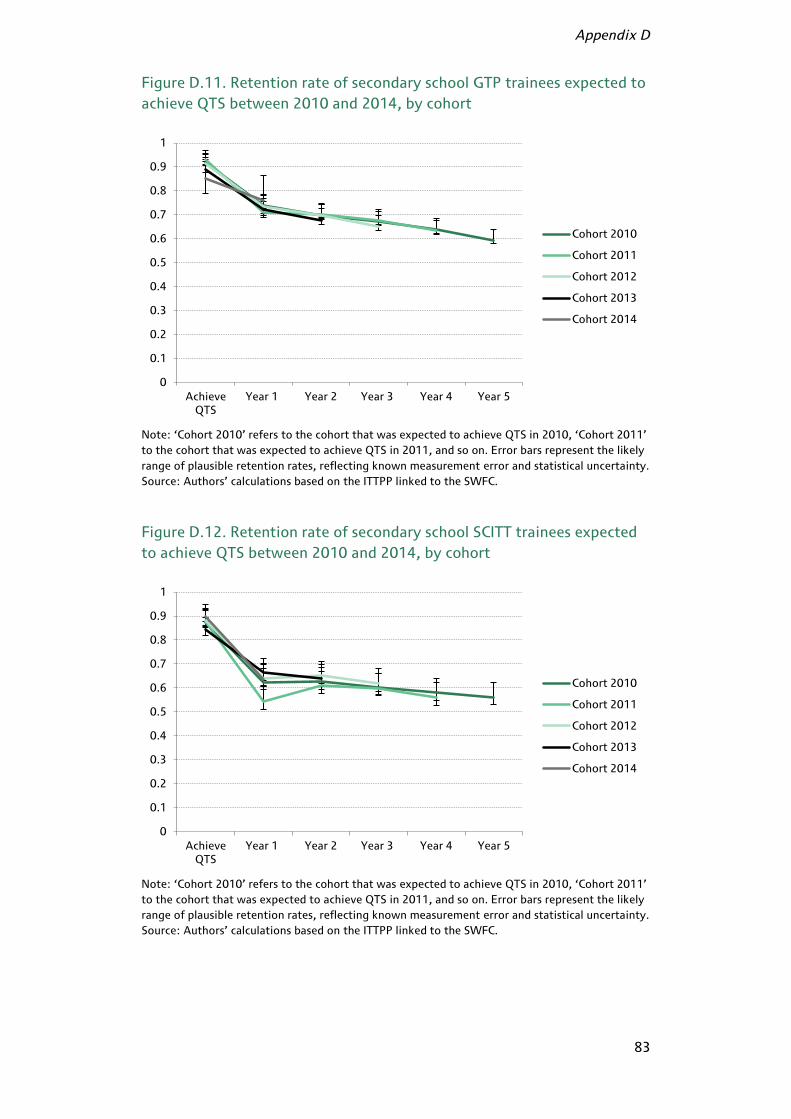
Appendix D
83
Figure D.11. Retention rate of secondary school GTP trainees expected to
achieve QTS between 2010 and 2014, by cohort
Note: ‘Cohort 2010’ refers to the cohort that was expected to achieve QTS in 2010, ‘Cohort 2011’
to the cohort that was expected to achieve QTS in 2011, and so on. Error bars represent the likely
range of plausible retention rates, reflecting known measurement error and statistical uncertainty.
Source: Authors’ calculations based on the ITTPP linked to the SWFC.
Figure D.12. Retention rate of secondary school SCITT trainees expected
to achieve QTS between 2010 and 2014, by cohort
Note: ‘Cohort 2010’ refers to the cohort that was expected to achieve QTS in 2010, ‘Cohort 2011’
to the cohort that was expected to achieve QTS in 2011, and so on. Error bars represent the likely
range of plausible retention rates, reflecting known measurement error and statistical uncertainty.
Source: Authors’ calculations based on the ITTPP linked to the SWFC.
0
0.1
0.2
0.3
0.4
0.5
0.6
0.7
0.8
0.9
1
Achieve QTS
Year 1 Year 2 Year 3 Year 4 Year 5
Cohort 2010
Cohort 2011
Cohort 2012
Cohort 2013
Cohort 2014
0
0.1
0.2
0.3
0.4
0.5
0.6
0.7
0.8
0.9
1
Achieve QTS
Year 1 Year 2 Year 3 Year 4 Year 5
Cohort 2010
Cohort 2011
Cohort 2012
Cohort 2013
Cohort 2014

Longer-term costs and benefits of different initial teacher training routes
84
Figure D.13. Retention rate of secondary school SCITT trainees expected
to achieve QTS between 2010 and 2014, by cohort
Note: ‘Cohort 2010’ refers to the cohort that was expected to achieve QTS in 2010, ‘Cohort 2011’
to the cohort that was expected to achieve QTS in 2011, and so on. Error bars represent the likely
range of plausible retention rates, reflecting known measurement error and statistical uncertainty.
Source: Authors’ calculations based on the ITTPP linked to the SWFC.
Figure D.14. Retention rate of secondary school School Direct salaried
trainees expected to achieve QTS between 2010 and 2014, by cohort
Note: ‘Cohort 2010’ refers to the cohort that was expected to achieve QTS in 2010, ‘Cohort 2011’
to the cohort that was expected to achieve QTS in 2011, and so on. Error bars represent the likely
range of plausible retention rates, reflecting known measurement error and statistical uncertainty.
Source: Authors’ calculations based on the ITTPP linked to the SWFC.
0
0.1
0.2
0.3
0.4
0.5
0.6
0.7
0.8
0.9
1
Achieve QTS
Year 1 Year 2 Year 3 Year 4 Year 5
Cohort 2010
Cohort 2011
Cohort 2012
Cohort 2013
Cohort 2014
0
0.1
0.2
0.3
0.4
0.5
0.6
0.7
0.8
0.9
1
Achieve QTS
Year 1 Year 2 Year 3 Year 4 Year 5
Cohort 2010
Cohort 2011
Cohort 2012
Cohort 2013
Cohort 2014
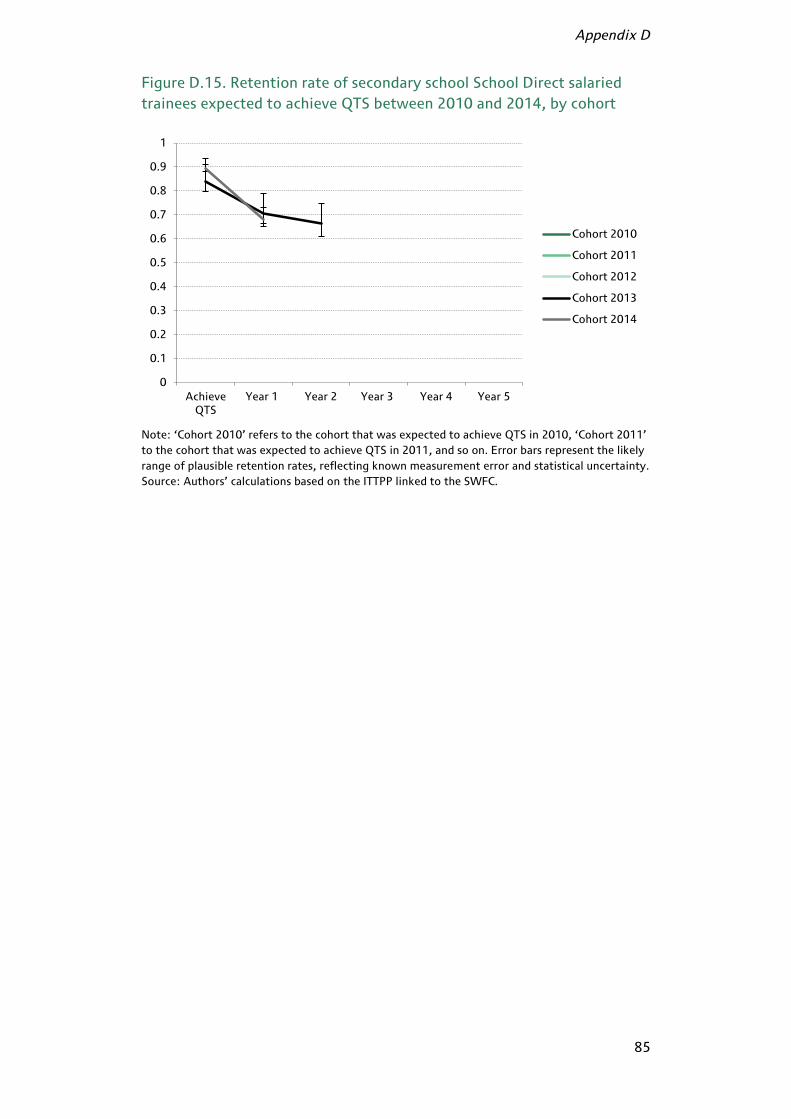
Appendix D
85
Figure D.15. Retention rate of secondary school School Direct salaried
trainees expected to achieve QTS between 2010 and 2014, by cohort
Note: ‘Cohort 2010’ refers to the cohort that was expected to achieve QTS in 2010, ‘Cohort 2011’
to the cohort that was expected to achieve QTS in 2011, and so on. Error bars represent the likely
range of plausible retention rates, reflecting known measurement error and statistical uncertainty.
Source: Authors’ calculations based on the ITTPP linked to the SWFC.
0
0.1
0.2
0.3
0.4
0.5
0.6
0.7
0.8
0.9
1
Achieve QTS
Year 1 Year 2 Year 3 Year 4 Year 5
Cohort 2010
Cohort 2011
Cohort 2012
Cohort 2013
Cohort 2014

86
© Institute for Fiscal Studies
Appendix E. Retention Rate by
Trainee Characteristics
Figure E.1 shows that the three-year retention rate for trainees with different
degree classes is largely similar, although slightly lower for trainees with a third-
class degree. Females are more likely to be in service after three years than males
(64–67% to 56–59%). Primary teachers are more likely to be in service after
three years than secondary teachers, where the retention rate is similar across
subject groups.
Figure E.2 shows that there is more variation in five-year retention rates. The
difference between male and female retention rates remains at around 8
percentage points, but differences across teacher types increase. Trainees from
high-priority subjects are less likely to be in service after five years than those
from low or no priority subjects. This is perhaps unsurprising as high-priority
subjects are classified as such due to shortages of teachers. Although financial
incentives are available to train as a teacher, there are less explicit financial
incentives to remain in teaching.48 Those with a second-class degree are more
likely to be in service after five years than those with a first-class or third-class
degree.
48 School leaders do have flexibility in pay awards, particularly after the teacher pay reform
introduced in 2013. Decisions to introduce financial incentives for retention would have to be made from within a fixed budget, however, so are likely to be as generous as the tax-free bursary available to train.
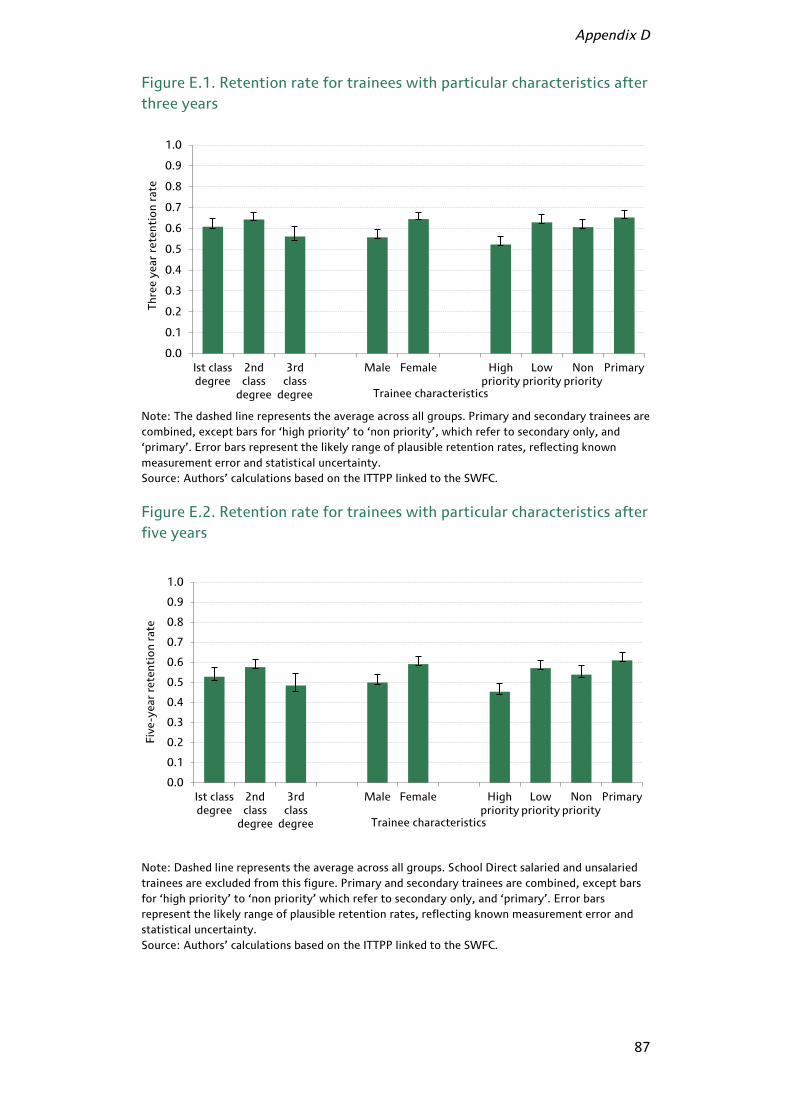
Appendix D
87
Figure E.1. Retention rate for trainees with particular characteristics after
three years
Note: The dashed line represents the average across all groups. Primary and secondary trainees are
combined, except bars for ‘high priority’ to ‘non priority’, which refer to secondary only, and
‘primary’. Error bars represent the likely range of plausible retention rates, reflecting known
measurement error and statistical uncertainty.
Source: Authors’ calculations based on the ITTPP linked to the SWFC.
Figure E.2. Retention rate for trainees with particular characteristics after
five years
Note: Dashed line represents the average across all groups. School Direct salaried and unsalaried
trainees are excluded from this figure. Primary and secondary trainees are combined, except bars
for ‘high priority’ to ‘non priority’ which refer to secondary only, and ‘primary’. Error bars
represent the likely range of plausible retention rates, reflecting known measurement error and
statistical uncertainty.
Source: Authors’ calculations based on the ITTPP linked to the SWFC.
0.0
0.1
0.2
0.3
0.4
0.5
0.6
0.7
0.8
0.9
1.0
Ist class degree
2nd class
degree
3rd class
degree
Male Female High priority
Low priority
Non priority
Primary
Th
ree
ye
ar
rete
nti
on
rate
Trainee characteristics
0.0
0.1
0.2
0.3
0.4
0.5
0.6
0.7
0.8
0.9
1.0
Ist class degree
2nd class
degree
3rd class
degree
Male Female High priority
Low priority
Non priority
Primary
Fiv
e-y
ear
rete
nti
on
rate
Trainee characteristics

88
© Institute for Fiscal Studies
Appendix F. Previous Evidence on
Retention
Existing evidence on the retention teachers in England comes from various
sources of data, which makes comparison across estimates difficult. In addition,
all sources of data have some measurement error, so all estimates must be
treated as approximate (Gorard et al., 2006). The most recent sources of data are
described more fully in Chapter 2.
Retention
The DfE produces annual statistics on the retention of NQTs in the state-funded
sector in England who were ‘in service’ the year following qualification.49 (Those
who do not enter the state-funded sector the academic year after QTS are not
included in any figures.) These statistics are based on the SWFC from 2010
onwards, and the Database of Teacher Records before then. In 2010, 24,100
newly qualified entrants entered the service. This corresponds to a retention rate
in the first academic year after QTS of 62%.50 Of these teachers who start
teaching the year following QTS, 87–88% of recent cohorts are in service the
following year (second year after QTS). For the 2010 cohort, this corresponds to
an overall retention rate of 54%, but excludes those that may enter teaching in
later years following QTS. Figures for three years after qualification are 81–83%
(around 51% overall), and 77% four years after qualification (around 47%
overall).
These data also suggest that the early career retention rate for teachers entering
the state-funded sector has remained roughly constant over time (from 1996
when records begin). For example, between 87% and 91% of those entering
teaching in the year following QTS remain in teaching the following year across
all years.
Previous estimates from the DfE are based on the GTCE database, in combination
with the Database of Teacher Records and Pensioner Statistical System.51 For a
sample of ‘college-based’ teacher trainees, the five-year retention rate in the
state-funded sector for those completing ITT is 56%. The one-year retention rate
is 59%. Note that this estimate does not include those who do not achieve QTS, or
trainees not on ‘college-based’ routes.
49 https://www.gov.uk/government/statistics/school-workforce-in-england-november-2014.
50 The total number of final year trainees in the academic year 2009–10 was 39,103. Source:
http://dataprovision.education.gov.uk/external-file/public/profiles/pp2011.xls.
51 https://www.gov.uk/government/uploads/system/uploads/attachment_data/file/182407/DFE-
RR151.pdf.

Appendix F
89
A small number of previous estimates give the variation in retention rates
between those trained through different ITT routes. Smithers et al. (2012) report
the retention rate, by route, for those who achieved QTS between 2005 and 2010.
These estimates are based on registration data of the GTCE, linked to those who
successfully completed their training. This found that the five-year retention rate
for those achieving QTS (averaging across the cohorts and conditional on
qualification) was, approximately:
90% for GTP primary;
77% for university-led PGCE primary;
72% for SCITT-led PGCE primary;
75% for university-led PGCE secondary;
68% for SCITT-led PGCE secondary;
40% for Teach First secondary.
The submission of the Training and Development Agency for Schools to the
Education Select Committee reported the qualification rate and retention rate
(conditional on qualification) for the following five routes: ‘mainstream UG’,
‘mainstream PG’, SCITT, GTP and Teach First.52 Averaging across the years 2006–
10, and presumably primary and secondary sectors, completion rates were
highest for Teach First (95%) and lowest for mainstream PG (86%). The four-
year retention rate for the cohort that achieved QTS in 2005 is between 42% for
Teach First and 82% for mainstream UG and GTP. Assuming the completion rate
was similar across cohorts in the years 2006–10, the implied retention rate for all
trainees rather than those who achieve QTS is between 40% for Teach First and
75% for GTP.
An alternative source of data is the Destination of Leavers from Higher Education
(DLHE), which surveys trainees around six months after graduation. These data
are then submitted by ITT providers. The response rate is relatively high (around
78%) although not necessarily representative. This is reported annually by
Smithers and Robinson in the Good Teacher Training Guide. In 2013, the broad
finding was that ‘more trainees on school-led programmes (80.9%) entered
teaching than those on university-led courses (76.1%)’.53 A higher proportion of
NQTs from postgraduate courses entered teaching than from undergraduate
courses (71.1% compared to 75.6%).
Recent analysis of internal Teach First data by the NAO gives retention rate
estimates for this route from this alternative source. The retention rate decreases
markedly in the second year after achieving QTS (beyond the end of expected
participation in the programme), but there is significant variation across cohorts.
Between approximately 38% and 56% of trainees are recorded as ‘in service’ five
years after the expected QTS date, with retention typically higher for more recent
cohorts. Estimates from this source of data are compared with estimates from the
52 For the full report from the Education Select Committee, see
http://www.publications.parliament.uk/pa/cm201012/cmselect/cmeduc/1515/1515ii.pdf.
53 Smithers, A., Robinson, P. and Coughlan, M.-D. (2013), The Good Teacher Training Guide,
http://www.buckingham.ac.uk/wp-content/uploads/2014/01/GTTG2013.pdf.

Longer-term costs and benefits of different initial teacher training routes
90
linked ITTPP and SWFC data to give some indication of the likely downward bias
in the SWFC. These are presented in full in Appendix A.
Four-fifths of trainees surveyed in the ‘Becoming a Teacher’ project indicated
that they expected to be in teaching after five years, and only 5% reported that
they intended to leave by this time (Hobson et al., 2009). This is in contrast to
figures presented here, and the actual retention rate reported in later waves of
the survey, where the one-year retention rate was under 60%.
In summary, estimates of the retention rate of teachers vary due to the data
source used and the sample taken for the denominator (those who register for
training, those who achieve QTS, or those who start teaching in the year following
QTS). The data source and sample used must therefore be considered when
interpreting previous published retention rates. It is also useful to remember that
each of the data sources has different types of measurement error or non-
response bias, which affect the estimates differently. Most importantly, all figures
should be taken as approximate. One can draw some general conclusions,
however, that the retention rate for primary and secondary trainees declines
over time, and is typically lowest for Teach First and highest for GTP in the long
run.

91
© Institute for Fiscal Studies
References
Aaronson, D., Barrow, L. and Sander, W. (2007), ‘Teachers and student achievement in the Chicago public high schools’, Journal of Labor Economics, vol. 25, pp. 95–135. Allen, R., Burgess, S. and Mayo, J. (2012), ‘The teacher labour market, teacher
turnover and disadvantaged schools: new evidence for England’, Centre for
Market and Public Organisation (CMPO) Working Paper No. 12/294.
Allen, R., Belfield, C., Greaves, E., Sharp, C. and Walker, M. (2014), ‘The costs and
benefits of different initial teacher training routes’, Institute for Fiscal Studies
(IFS) Report R100 (http://www.ifs.org.uk/publications/7435).
Allen, R., Bibby, D., Parameshwaran, M. and Nye, P. (2016a), ‘Linking ITT and
workforce data: (Initial Teacher Training Performance Profiles and School
Workforce Census), NCTL Research Report
(https://www.gov.uk/government/publications/linking-itt-and-workforce-data-
initial-teacher-training-performance-profiles-and-school-workforce-census).
Allen, R., Parameshwaran, M. and Nye, P. (2016b), ‘The careers of Teach First
Ambassadors who remain in teaching: job choices, promotion and school quality’,
Education Datalab report.
Belfield, C. and Sibieta, L. (2015), ‘English schools will feel the pinch over the next
five years’, Institute for Fiscal Studies (IFS) Observation
(http://www.ifs.org.uk/publications/8027).
Britton, J. and Propper, C. (2016), ‘Teacher pay and school productivity:
exploiting wage regulation’, Journal of Public Economics, vol. 133, pp. 75–89.
Crawford, C. and Greaves, E. (2013), ‘A comparison of commonly used socio-
economic indicators: their relationship to educational disadvantage and
relevance to Teach First’, Institute for Fiscal Studies (IFS) Report R79
(http://www.ifs.org.uk/publications/6640).
Department for Education (2016), ‘Educational Excellence Everywhere’, White
Paper
(https://www.gov.uk/government/uploads/system/uploads/attachment_data/f
ile/508447/Educational_Excellence_Everywhere.pdf).
Dolton, P. J. and van der Klaauw, W. (1995), ‘Leaving teaching in the UK: a
duration analysis’, Economic Journal, vol. 105 (429), pp. 431–44.
Dolton, P. J. and van der Klaauw, W. (1999), ‘The turnover of teachers: a
competing risks explanation’, Review of Economics and Statistics, vol. 81, pp. 543–
50.

Longer-term costs and benefits of different initial teacher training routes
92
Dolton, P., Tremayne, A. and Chung, T-P. (2003), ‘Teacher supply and the
economic cycle’, Education and Training Policy Division, OECD
(https://www.oecd.org/edu/school/2506610.pdf).
Gorard, S., Huat See, B., Smith, E. and White, P. (2006), Teacher Supply, London:
Continuum International Publishing Group.
Hanushek, E. A. (1997), ‘Assessing the effects of school resources on student
performance: an update’, Educational Evaluation and Policy Analysis, vol. 19, pp.
141–61.
Hanushek, E. A. (2003), ‘The failure of input-based schooling policies’, Economic
Journal, vol. 113 (485), pp. F64–F98.
Hanushek, E. A. (2011), ‘The economic value of higher teacher quality’, Economics of Education Review, vol. 30, pp. 466–79. Hobson, A. J., Ashby, P., Malderez, A. and Tomlinson, P. D. (2009), ‘Mentoring beginning teachers: what we know and what we don’t’, Teaching and Teacher Education, vol. 25, pp. 207–16. Lupton, R. (2004), ‘Schools in disadvantaged areas: recognising context and raising quality’, Centre for Analysis of Social Exclusion (CASE) paper 76 (http://eprints.lse.ac.uk/6321/1/Schools_in_Disadvantaged_Areas_Recognising_context_and_raising_quality.pdf). Marchand, J. and Weber, J. (2015), ‘The labor market and school finance effects of
the Texas shale boom on teacher quality and student achievement’, University of
Alberta, Working Paper no. 2015-15
(http://www.ualberta.ca/~econwps/2015/wp2015-15.pdf).
Menzies, L., Parameshwaran, M., Trethewey, A., Shaw, B., Baars, S. and Chiong, C.
(2015), ‘Why Teach?’, LKMco and Person report (http://whyteach.lkmco.org/wp-
content/uploads/2015/10/Embargoed-until-Friday-23-October-2015-Why-
Teach.pdf).
National Audit Office (2016), ‘Training new teachers’
(https://www.nao.org.uk/wp-content/uploads/2016/02/Training-new-
teachers.pdf).
Office for Budget Responsibility (2016), ‘Economic and Fiscal Outlook’,
(http://cdn.budgetresponsibility.org.uk/March2016EFO.pdf).
Rivkin, S. G., Hanushek, E. A. and Kain, J. F. (2005), ‘Teachers, schools, and academic achievement’, Econometrica, vol. 73, pp. 417–58. Rockoff, J. (2004), ‘The impact of individual teachers on student achievement: evidence from panel data’, American Economic Review, vol. 94, pp. 247–52. Ronfeldt, M., Loeb, S. and Wyckoff, J. (2013), ‘How teacher turnover harms student achievement’, American Educational Research Journal, vol. 50, pp. 4–36.

References
93
Slater, H., Davies, N. M. and Burgess, S. (2012), ‘Do teachers matter? Measuring the variation in teacher effectiveness in England’, Oxford Bulletin of Economics and Statistics, vol. 74, pp. 629–45. Smithers, A. and Robinson, P. (2005), ‘Teacher turnover, wastage and movements
between schools’, Department for Education and Skills, Research Report RR640
(http://dera.ioe.ac.uk/5625/1/RR640.pdf).
Smithers, A., Robinson, P. and Coughlan, M.-D. (2012), The Good Teacher Training
Guide 2012, Centre for Education and Employment Research, University of
Buckingham (http://www.buckingham.ac.uk/wp-
content/uploads/2012/11/GTTG12.pdf).
Sutton Trust (2011), ‘Improving the impact of teachers on pupil achievement in
the UK – interim findings’ (http://www.suttontrust.com/wp-
content/uploads/2011/09/2teachers-impact-report-final.pdf).
Universities UK (2013), Parliamentary Briefing: Initial Teacher Training
(http://www.universitiesuk.ac.uk/highereducation/Documents/2013/InitialTea
cherTraining-Nov2013.pdf).
Worth, J., Bamford, S. and Durbin, B. (2015), ‘Should I stay or should I go? NFER
analysis of teachers joining and leaving the profession’, National Foundation for
Educational Research (NFER) Report
(https://www.nfer.ac.uk/publications/LFSA01/LFSA01.pdf).