the limits of price discrimination april 14, 2014 · the limits of price discrimination . april 14,...
TRANSCRIPT

Princeton University - Economic Theory Center Research Paper No. 052-2013
The Limits of Price Discrimination
April 14, 2014
Dirk Bergemann
Yale University
Benjamin Brooks
Princeton University
Stephen Morris
Princeton University

The Limits of Price Discrimination∗
Dirk Bergemann† Benjamin Brooks‡ Stephen Morris§
April 14, 2014
Abstract
We analyze the welfare consequences of a monopolist having additional information about
consumers’ tastes, beyond the prior distribution; the additional information can be used to
charge different prices to different segments of the market, i.e., carry out "third degree price
discrimination".
We show that the segmentation and pricing induced by the additional information can achieve
every combination of consumer and producer surplus such that: (i) consumer surplus is non-
negative, (ii) producer surplus is at least as high as profits under the uniform monopoly price,
and (iii) total surplus does not exceed the surplus generated by effi cient trade.
Keywords: First Degree Price Discrimination, Second Degree Price Discrimination, Third
Degree Price Discrimination, Private Information, Privacy, Bayes Correlated Equilibrium, Con-
cavification.
JEL Classification: C72, D82, D83.
∗We gratefully acknowledge financial support from NSF SES 0851200 and ICES 1215808. We thank the co-editor,
Andy Skrzypacz and three anonymous referees for many helpful and productive suggestions. We would like to thank
Nemanja Antic, Simon Cowan, Emir Kamenica, Babu Nahata, Omer Reingold, Lars Stole, Juha Tolvanen, and Ricky
Vohra, as well as many seminar participants, for informative discussions. Lastly, thanks to Alex Smolin and Áron
Tóbiás for excellent research assistance.†Department of Economics, Yale University, New Haven, U.S.A., [email protected].‡Department of Economics, Princeton University, Princeton, U.S.A., [email protected].§Department of Economics, Princeton University, Princeton, U.S.A., [email protected].
1

2
1 Introduction
A classic issue in the economic analysis of monopoly is the impact of discriminatory pricing on
consumer and producer surplus. A monopolist engages in third degree price discrimination if he uses
additional information about consumer characteristics to offer different prices to different segments
of the aggregate market. A large and important literature (reviewed below) examines the impact of
particular segmentations on consumer and producer surplus, as well as on output and prices.
In this paper, we characterize what could happen to consumer and producer surplus for all possible
segmentations of the market. We know that at least two points will be attained. If the monopolist
has no information beyond the prior distribution of valuations, there will be no segmentation. The
producer charges the uniformmonopoly price and gets the associated monopoly profit, which is always
a lower bound on producer surplus; consumers receive a positive surplus, the standard information
rent. This is marked by point A in Figure 1. On the other hand, if the monopolist has complete
information about the valuations of the buyers, then he can charge each buyer their true valuation,
i.e., engage in perfect or first degree price discrimination. The resulting allocation is effi cient, but
consumer surplus is zero and the producer captures all of the gains from effi cient trade. This is
marked by point B in Figure 1.
Figure 1: The surplus triangle
We are concerned with the welfare consequences of all possible segmentations, in addition to the

3
two mentioned above. To begin with, we can identify some elementary bounds on consumer and
producer surplus in any market segmentation. First, consumer surplus must be non-negative as a
consequence of the participation constraint; a consumer will not buy the good at a price above his
valuation. Second, the producer must get at least the surplus that he could get if there was no
segmentation and he charged the uniform monopoly price. Third, the sum of consumer and producer
surplus cannot exceed the total value that consumers receive from the good, when that value exceeds
the marginal cost of production. The shaded right angled triangle in Figure 1 illustrates these three
bounds.
Our main result is that every welfare outcome satisfying these constraints is attainable by some
market segmentation. This is the entire shaded triangle in Figure 1. The point marked C is where
consumer surplus is maximized; in particular, the producer is held down to his uniform monopoly
profits, but at the same time the outcome is effi cient and consumers receive all of the gains in effi ciency
relative to no discrimination. At the point marked D, social surplus is minimized by holding producer
surplus down to uniform monopoly profits and holding consumer surplus down to zero.
We can explain these results most easily in the case where there is a finite set of possible consumer
valuations and the cost of production is zero. The latter is a normalization of constant marginal cost
we will maintain in the paper. We will first explain one intuitive way to maximize consumer surplus,
i.e., realize point C. The set of market prices will consist of every valuation less than or equal to the
uniform monopoly price. Suppose that we can divide the market into segments corresponding to each
of these prices in such a way that (i) in each segment, the consumers’valuations are always greater
than or equal to the price for that segment; and (ii) in each segment, the producer is indifferent
between charging the price for that segment and charging the uniform monopoly price. Then the
producer is indifferent to charging the uniform monopoly price on all segments, so producer surplus
must equal uniform monopoly profit. The allocation is also effi cient, so consumers must obtain the
rest of the effi cient surplus. Thus, (i) and (ii) are suffi cient conditions for a segmentation to maximize
consumer surplus.
We now describe a way of constructing such a market segmentation iteratively. Start with a
"lowest price segment" where a price equal to the lowest valuation will be charged. All consumers
with the lowest valuation go into this segment. For each higher valuation, a share of consumers with
that valuation also enters into the lowest price segment. While the relative share of each higher
valuation (with respect to each other) is the same as in the prior distribution, the proportion of
all of the higher valuations is lower than in the prior distribution. We can choose that proportion

4
between zero and one such that the producer is indifferent between charging the segment price and
the uniform monopoly price. We know this must be possible because if the proportion were equal to
one, the uniform monopoly price would be profit maximizing for the producer (by definition); if the
proportion were equal to zero– so only lowest valuation consumers were in the market– the lowest
price would be profit maximizing; and, by keeping the relative proportions above the lowest valuation
constant, there is no price other than these two that could be optimal. Now we have created one
market segment satisfying properties (i) and (ii) above. But notice that the consumers not put in
the lowest price segment are in the same relative proportions as they were in the original population,
so the original uniform monopoly price will be optimal on this "residual segment". We can apply the
same procedure to construct a segment in which the market price is the second lowest valuation: put
all the remaining consumers with the second lowest valuation into this market; for higher valuations,
put a fixed proportion of remaining consumers into that segment; choose the proportion so that the
producer is indifferent between charging the second highest valuation and the uniform monopoly
price. This construction iterates until the segment price reaches the uniform monopoly price, at
which point we have recovered the entire population and point C is attained.
For the formal proof of our results, we make use of a deeper geometric argument. This establishes
an even stronger conclusion: any point where the monopolist is held down to his uniform monopoly
profits– including outcomes A, C, and D in Figure 1– can be achieved with the same segmentation!
In this segmentation, consumer surplus varies because the monopolist is indifferent between charging
different prices. The existence of such a segmentation is a consequence of the following key property:
Consider the set of all markets where a given monopoly price is optimal. This set is convex, so
any aggregate market with the given monopoly price can be decomposed as a weighted sum of
markets which are extreme points of this set, which in turn defines a segmentation. We show that
these extreme points, or extremal markets, must take a special form: In any extremal market, the
monopolist will be indifferent to setting any price in the support of consumers’valuations. Thus,
each subset of valuations that includes the given monopoly price generates an extremal market.
If the monopolist charges the uniform monopoly price on each extreme segment, we get point A.
If he charges the lowest value in the support of each segment (which is also an optimal price, by
construction), we get point C; and if he charges the highest value in the support, we get point D.
Beyond its welfare implications, this argument also highlights the multiplicity of segmentations that
can achieve extreme outcomes, since there are many sets of extremal markets which can be used to
decompose a given market.

5
Thus, we are able to demonstrate that points B, C, and D can be attained. Every point in their
convex hull, i.e., the shaded triangle in Figure 1, can also be attained by segmenting a share of the
market using extremal markets as in the previous paragraph and segmenting the rest of the market
to facilitate perfect price discrimination. Such a segmentation always gives a fixed level of producer
surplus between the uniform monopoly profits and perfect price discrimination, and the monopolist
is indifferent between prices that yield a consumer surplus of zero and prices that maximize social
surplus. This gives us a complete characterization of all possible welfare outcomes.
While we focus on welfare implications, we can also completely characterize possible output
levels and derive implications for prices. An upper bound on output is the effi cient quantity, and
this is realized by any segmentation along the effi cient frontier. In particular, it is attained in any
consumer surplus maximizing segmentation. In such segmentations, prices are always weakly below
the uniform monopoly price. We are also able to obtain a tight lower bound on output. Note that in
any segmentation the monopolist must receive at least his uniform monopoly profits, so this profit is
a lower bound on social surplus. We say that an allocation is conditionally effi cient if conditional on
the good being sold, it sold to those with the highest valuations. Such allocations minimize output
for a given level of social surplus. In fact, we construct a social surplus minimizing segmentation that
results in a conditionally effi cient allocation and therefore attains a lower bound on output. In this
segmentation, and indeed in any social surplus minimizing segmentation, prices are always weakly
higher than the uniform monopoly price.
Though the results described above are for discrete distributions, we are able to prove similar
results for any market that can be described by a Borel measure over valuations. For such distribu-
tions, we use a limit argument to establish the existence of segmentations that attain points C and
D.
We contribute to a large literature on third degree price discrimination, starting with the classic
work of Pigou (1920). This literature examines what happens to prices, quantity, consumer surplus,
producer surplus, and social welfare as a market is segmented. Pigou (1920) considered the case of
two segments with linear demand. In the special case where both segments are served when there is
a uniform price, he showed that output does not change under price discrimination. Since different
prices are charged in the two segments, this means that some high valuation consumers are replaced
by low valuation consumers, and thus social welfare decreases. We can visualize the results of Pigou
(1920) and other authors in Figure 1. Pigou (1920) showed that this particular segmentation resulted
in a west-northwest move (i.e., a move from point A to a point below the negative 45◦ line going

6
through A). A literature since then has focused on identifying suffi cient conditions on the shape
of demand for social welfare to increase or decrease with price discrimination. A recent paper of
Aguirre, Cowan, and Vickers (2010) unifies and extends this literature and, in particular, identifies
suffi cient conditions for price discrimination to either increase or decrease social welfare (i.e., move
above or below the negative 45◦ line through A). Restricting attention to market segments that have
concave profit functions and an additional property ("increasing ratio condition") that they argue is
commonly met, they show that welfare decreases if the direct demand in the higher priced market
is at least as convex as that in the lower priced market; welfare is higher if prices are not too far
apart and the inverse demand function in the lower priced market is locally more convex than that
in the higher priced market. They note how their result ties in with an intuition of Robinson (1933):
concave demand means that price changes have a small impact on quantity, while convex demand
means that prices have a large impact on quantity. If the price rises in a market with concave
demand and falls in a market with convex demand, the increase in output in the low-price market
will outweigh the decrease in the high price market, and welfare will go up. A recent paper of Cowan
(2013) gives suffi cient conditions for consumer surplus (and thus total surplus) to increase under
third degree price discrimination.
Our paper also gives suffi cient conditions for particular welfare impacts of segmentation. However,
unlike most of the literature, we allow for segments with non-concave profit functions. Indeed, the
segmentations giving rise to extreme points in welfare space (i.e., consumer surplus maximization at
point C and social surplus minimization at point D) generally rely on non-concave profit functions
within segments. This ensures that the type of local conditions highlighted in the existing literature
will not obtain. Our non-local results suggest some very different intuitions. Of course, consumer
surplus always increases if prices drop in all markets. We show that for any demand curve, low
valuation consumers can be pooled with high valuation consumers in such a way that the producer
has an incentive to offer prices below the monopoly price; but if this incentive is made arbitrarily
weak, the consumers capture the effi ciency gains.
The literature also has results on the impact of segmentation on output and prices. On output,
the focus is on identifying when an increase in output is necessary for an increase in welfare, as in
Schmalensee (1981) and Varian (1985). Although we do not analyze the question in detail in this
paper, a given output level is associated with many different levels of producer, consumer and social
surplus. We do provide a sharp characterization of the highest and lowest possible output over
all market segmentations. On prices, Nahata, Ostaszewski, and Sahoo (1990) offer examples with

7
non-concave profit functions where third degree price discrimination may lead prices in all market
segments to move in the same direction; it may be that all prices increase or all prices decrease. We
show that one can create such segmentations for any demand curve. In other words, in constructing
our critical market segmentations, we show that it is always possible to have all prices rise or all
prices fall (although profit functions in the segments cannot all be strictly concave, as shown by
Nahata, Ostaszewski, and Sahoo (1990)).
If market segmentation is exogenous, one might argue that the segmentations that deliver extremal
surpluses are special and might be seen as atypical. But given the amount of information presently
being collected on the internet about consumer valuations, it might be argued that there is increasing
endogeneity in the market segmentations that arise. To the extent that producers control how
information is disseminated, they will have an incentive to gather as much information as possible,
ideally engaging in perfect price discrimination. Suppose, however, that an internet intermediary
wanted to release its information about consumers to producers for free in order to maximize consumer
welfare, say, because of regulatory pressure or the relation to a broader business model. Our results
describe how such a consumer-minded internet company would choose to structure this information.1
Third degree price discrimination is a special case of the classic screening problem, in which a
principal is designing a contract for an agent who has private information about the environment.
If the principal has no information about the agent’s type, then he must offer the same menu to all
agents, which yields a uniformmenu profit (or producer surplus) for the principal with a corresponding
information rent (or consumer surplus) for the agent, leading to a point analogous to A in Figure
1. If the principal was perfectly informed about the agent’s type, he could extract all the potential
surplus from the relationship, leading to point analogous to B in Figure 1. And, as in the third degree
price discrimination problem, there are bounds on surplus pairs for any intermediate segmentation
given by a triangle BCD. However, it is not possible in general to find a segmentation that attains
every point in BCD, and we do not have a characterization of what happens in general screening
problems. Nonetheless, we do examine the robustness of our main result by seeing what happens as
we move from third degree price discrimination to more general settings.
To understand our robustness exercise, observe that our main result would be unchanged if instead
of restricting consumers to either not getting the good or getting one unit, we allowed consumption
1An important subtlety of this story, however, is that this could only be done by randomly allocating consumers
with the same valuation to different segments with different prices. Thus it could be done by a benevolent intermediary
who already knew consumers’valuations, but not by one who needed consumers to truthfully report their values.

8
of quantities between 0 and 1 and linearly interpolated the consumer’s valuation of intermediate
quantities. This follows from the classical observation that as long as consumers’valuations are
linear in quantities or probabilities of getting the object, a posted price is an optimal mechanism.
This would no longer be true if valuations are nonlinear in quantity. In Section 5, we examine the
robustness of our result by adding a small amount of concavity to consumers’valuations. In this case,
the monopolist will wish to engage in "second degree price discrimination", since for each consumer
the marginal value of the good varies with quantity, as in Maskin and Riley (1984). As long as
only a finite set of quantities are possible, our geometric analysis can be extended to characterize
the set of distributions over consumer valuations where a given menu is optimal. At extreme points
of that set, the producer will be indifferent between different menus. Thus, there will be a range
of consumer surpluses that are consistent with the producer being held down to his uniform menu
profits. However, it will not generally be the case– as it was with linear preferences– that the
aggregate market can be segmented in ways such that the producer is held down to his uniform menu
profit, but the allocation is either effi cient– giving point C– or results in zero consumer surplus–
leading to point D. The reason is that with linear preferences it is possible to make the monopolist
indifferent to any subset of prices, whereas with general concave utility, the monopolist can only be
indifferent among menus that differ by small amounts. Yet, we do show that as we approach the
linear case, the equilibrium surplus pairs converge to the triangle and, in this sense, our main result
is robust to small deviations from linearity.
Our work has a methodological connection to two strands of literature. Kamenica and Gentzkow
(2011)’s study of "Bayesian persuasion" considers how a sender would choose to transmit information
to a receiver, if he could commit to an information revelation strategy before observing his private
information. They provide a characterization of such optimal communication strategies as well as
applications. If we let the receiver be the producer choosing prices, and let the sender be a planner
maximizing some weighted sum of consumer and producer surplus, our problem belongs to the class
of problems analyzed by Kamenica and Gentzkow (2011). They show that if one plots the utility of
the "sender" as a function of the distribution of the sender’s types, his highest attainable utility can
be read off from the "concavification" of that function.2 The concavification arguments are especially
2Aumann and Maschler (1995), show that the concavification of the (stage) payoff function represents the limit
payoff that an informed player can achieve in a repeated zero sum game with incomplete information. In particular,
their Lemma 5.3, the "splitting lemma", derives a partial disclosure strategy on the basis of a concavified payoff
function.

9
powerful in the case of two types. While we do not use concavification arguments in the proof of our
main result, we illustrate their use in our two type analysis of second degree price discrimination.
Bergemann and Morris (2013a) examine the general question, in strategic many-player settings, of
what behavior could arise in an incomplete information game if players observe additional information
not known to the analyst. They show that behavior that might arise is equivalent to an incomplete
information version of correlated equilibrium termed "Bayes correlated equilibrium", which reduces
to the problem Kamenica and Gentzkow (2011) in the case of one player.3 Using the language of
Bergemann and Morris (2013a), the present paper considers the game of a producer making take-
it-or-leave-it offers to consumers. Here, consumers have a dominant strategy to accept all offers
strictly less than their valuation and reject all offers strictly greater than their valuation, and we
select for equilibria in which consumers accept offers that make them indifferent. We characterize
what could happen for any information structure that players might observe, as long as consumers
know their own valuations. Thus, we identify possible payoffs of the producer and consumers in all
Bayes correlated equilibria of the price setting game. Thus, our results are a striking application of
the methodologies of Bergemann and Morris (2013a), (2013b) and Kamenica and Gentzkow (2011) to
the problem of price discrimination. We also make use of these methodologies as well as results from
the present paper in our analysis of what can happen for all information structures in a first-price
auction, in Bergemann, Brooks, and Morris (2013a).
We present our model of monopoly price discrimination with discrete valuations in Section 2,
with our main results in Section 3. We first give a characterization of the equilibrium surplus pairs
using the extremal segmentations described above. Though the argument for this characterization
is non-constructive, we also exhibit some constructive approaches to achieve extreme welfare out-
comes. In this Section, we also characterize a tight lower bound on output that can arise under price
discrimination. In Section 4, we briefly extend our results to general settings with a continuum of
values, so that the demand curve consists of a combination of mass points and densities. The basic
economic insights extend to this setting unchanged. In Section 5, we describe how our results do
change as we move to more general screening environments, where the utility of the buyer and/or the
cost of the seller are not linear in quantity, and thus give rise to second degree price discrimination.
We conclude in Section 6. All omitted proofs are contained in the Appendix.
3In Bergemann and Morris (2013b), these insights were developed in detail in games with a continuum of players,
linear-quadratic payoffs and normally distributed uncertainty.

10
2 Model
A monopolist sells a good to a continuum of consumers, each of whom demands one unit. We
normalize the total mass of consumers to one and the constant marginal cost of the good to zero.
There are K possible values vk ∈ V ⊆ R+ that the consumers might have:
0 < v1 < · · · < vk < · · · < vK .
We will extend the analysis to a continuum of valuations in Section 4. A market x is a distribution
over the K valuations, with the set of all markets being:
X ,{x ∈ RV+
∣∣∣∣∣K∑k=1
x (vk) = 1
}.
This set can be identified with the (K − 1)-dimensional simplex, and to simplify notation we will
write xk for x (vk), which is the proportion of consumers who have valuation vk. Thus, a market x
corresponds to a step demand function, where∑j≥k
xj is the demand for the good at any price in the
interval (vk−1, vk] (with the convention that v0 = 0).
While we will focus on this interpretation of the model throughout the paper, there is a well-
known alternative interpretation that there is a single consumer with unit demand whose valuation
is distributed according to probability distribution x. The analysis is unchanged and all results can
be translated into this alternative interpretation.
Throughout the analysis, we hold a given aggregate market as fixed and identify it by:
x∗ ∈ X. (1)
We say that the price vk is optimal for market x if the expected revenue from price vk satisfies:
vk∑j≥k
xj ≥ vi∑j≥i
xj, for all i = 1, ..., K. (2)
Xk denotes the set of markets where price vk is optimal:
Xk ,{x ∈ X
∣∣∣∣∣vkK∑j=k
xj ≥ vi
K∑j=i
xj, for all i = 1, ..., K
}.
Now write v∗ , vi∗ for the optimal uniform price for the aggregate market x∗. Thus x∗ ∈ X∗ , Xi∗.
The maximum feasible surplus is:
w∗ ,K∑k=1
vkx∗k, (3)

11
corresponding to all consumers buying the good. The uniform price producer surplus is then:
π∗ , v∗K∑k=i∗
x∗k = maxi∈{1,...,K}
vi
K∑k=i
x∗k, (4)
and the uniform price consumer surplus is
u∗ ,K∑k=i∗
(vk − v∗)x∗k.
We will use a simple example to illustrate many of the results to follow.
Example 1 (Three Values with Uniform Probability)
There are three valuations {1, 2, 3} which arise in equal proportions. Thus, K = 3, vk = k, and
x∗ =(13, 13, 13
). The feasible social surplus is w∗ = 1
3(1 + 2 + 3) = 2. The uniform monopoly price is
v∗ = 2 = i∗. Under the uniform monopoly price, profit is π∗ = 23× 2 = 4
3and consumer surplus is
u∗ = 13
(3− 2) + 13
(2− 2) = 13.
We can visualize the markets consisting of three possible valuations as being points in the two-
dimensional probability simplex, as depicted in Figure 2. Each point in the triangle corresponds to
the weighted sum of the three vertices with weights corresponding to the respective proportions. We
have divided the simplex into three regions corresponding to X1, X2, and X3 where prices 1, 2 and 3
respectively are optimal. Note that the restriction that revenue from price vk is greater than revenue
from price vi is a linear restriction, and thus the region X1, for example, is the intersection of the
region in which price 1 is better than 2 and the region where price 1 is better than 3. The aggregate
market x∗ is the centroid(13, 13, 13
), which lies in the interior of the set X2, since price 2 is strictly
optimal.
A segmentation is a division of the aggregate market into different markets. Thus, a segmentation
σ is a simple probability distribution on X, with the interpretation that σ (x) is the proportion of the
population in market x. A segmentation can be viewed as a two stage lottery on outcomes {1, ..., K}whose reduced lottery is x∗. Writing supp for the support of a distribution, the set of possible
segmentations is:
Σ =
σ ∈ ∆ (X)
∣∣∣∣∣∣∑
x∈supp(σ)
σ (x) · x = x∗, |suppσ| <∞
.We restrict attention to finitely many segments so that |suppσ| < ∞. This is without loss ofgenerality in the present environment with finitely many valuations, in that finite segmentations will
suffi ce to prove tightness of our bounds on welfare outcomes.

12
Figure 2: The simplex of markets with vk ∈ {1, 2, 3} .
A pricing rule for a segmentation σ specifies a distribution over prices for each market in the
support of σ:
φ : suppσ → ∆ {v1, ..., vK} . (5)
We will write φk(x) for the probability of charging price vk in market x. A pricing strategy is optimal
if, for each x, vk ∈ suppφ(x) implies x ∈ Xk, i.e., all prices charged with positive probability on
market x must be profit maximizing for market x.
An example of a segmentation and an associated optimal pricing rule is given by the case of
perfect (or first degree) price discrimination. In this case, there are at least as many segments
as possible valuations, and each segment contains consumers of a single valuation. The optimal
pricing rule charges the unique valuation that appears in the segment. For Example 1, perfect price
discrimination consists of three market segments with three associated prices as illustrated in the
table below:value 1 value 2 value 3 price weight
market 1 1 0 0 1 13
market 2 0 1 0 2 13
market 3 0 0 1 3 13
total 13
13
13
(6)
This segmentation can be visualized as simply saying that(13, 13, 13
)can be decomposed as the convex
combination of (1, 0, 0), (0, 1, 0), and (0, 0, 1).
Given segmentation σ and pricing rule φ, consumer surplus is:∑x∈supp(σ)
σ (x)K∑k=1
φk (x)K∑j=k
(vj − vk)xj;

13
producer surplus is: ∑x∈supp(σ)
σ (x)K∑k=1
φk (x) vk
K∑j=k
xj;
and the total surplus is: ∑x∈supp(σ)
σ (x)
K∑k=1
φk (x)K∑j=k
vjxj.
3 The Limits of Discrimination
We now turn to the characterization of the set of welfare outcomes which can arise under third degree
price discrimination. We will demonstrate that the welfare bounds described in the Introduction are
tight, using the special geometry that comes from grouping the markets by corresponding optimal
prices. This geometry is the subject of Section 3.1, and we use it to prove our main result in Section
3.2. Though the argument we present is non-constructive, there are in fact many ways of constructing
segmentations that achieve the bounds, and we give examples of constructions in Section 3.3. We
will also provide a tight characterization of limits on output in Section 3.4.
3.1 Extremal Markets
Our first result is a linear algebraic characterization of the setXk of markets where price vk is optimal.
Write V for the set of non-empty subsets of V = {v1, ..., vK}. For every support set S ∈ V, we definea market xS ∈ X, with the properties that: (i) no consumer has a valuation outside the set S; and(ii) the monopolist is indifferent between charging any price inside the set S. Writing Vk for theset of subsets of V containing vk and letting S ∈ Vk, we define the market xS by the indifferenceconditions that if vi ∈ S, then:
vi
K∑j=i
xSj = vk
K∑j=k
xSj ; (7)
and by the inclusiveness condition that: ∑{j|vj∈S }
xSj = 1. (8)
Thus, we have K equations in K unknowns with a unique solution in X. Writing min S for the
smallest element of S, (7) implies that profits from any price in the support must be minS and thus

14
we must have:
vi
K∑j=i
xSj = minS (9)
for all vi ∈ S. Writing µ (vi, S) for the smallest element of S which is strictly greater than vi, we
must have:
xSi ,
0, if vi /∈ S;
minS(1vi− 1
µ(vi,S)
), if vi ∈ S and vi 6= maxS;
minSmaxS
, if vi = maxS.
. (10)
An implication is that in every market xS, the discrete version of the virtual utility is zero for every
element vi ∈ S except maxS:
vi ∈ S\ {maxS} ⇔ vi − (µ (vi, S)− vi)1−
∑k≤i x
Sk
xSi= 0.
A remarkable and useful property of the set Xk is that every x ∈ Xk can be represented as a
convex combinations of the markets{xS}S∈Vk
. For this reason, we will refer to any market of the
form xS for some non-empty S as an extremal market.
Lemma 1 (Extremal Markets)
Xk is equal to the convex hull of{xS}S∈Vk
.
Proof. The inclusion of the convex hull of{xS}S∈Vk
in Xk is immediate, since by definition
xS ∈ Xk for any S ∈ Vk, and Xk is convex, being the intersection of the convex simplex and the half
spaces in which price vk is better than price vi for all i 6= k.
Moreover, Xk is finite-dimensional and compact, as it is the intersection of closed sets with the
compact simplex. Thus, by the Minkowski-Caratheodory Theorem (see Simon (2011), Theorem 8.11)
Xk is equal to the convex hull of its extreme points. We will show that every extreme point of Xk is
equal to xS for some S ∈ Vk. First observe that if vi is an optimal price for market x, then xi > 0.
Otherwise the monopolist would want to deviate to a higher price if∑K
j=i+1 xj > 0 or a lower price
if this quantity is zero, either of which contradicts the optimality of vi.
Now, the set Xk is characterized by the linear constraints that for any x ∈ Xk:
K∑i=1
xi = 1,
the non-negativity constraints:
xi ≥ 0, for all i,

15
and the optimality (of price vk) constraints:
vk
K∑j=k
xj ≥ vi
K∑j=i
xj for i 6= k.
Any extreme point of Xk must lie at the intersection of at least K of these constraints (see Simon
(2011), Proposition 15.2). One binding constraint is always∑K
i=1 xi = 1, and since vk is an optimal
price, the non-negativity constraint xk ≥ 0 is always slack. Thus, there must be at least K − 1
binding optimality and non-negativity constraints for i 6= k.
But as we have argued, we cannot have both the optimality and non-negativity constraints bind
for a given i, so for each i 6= k precisely one of these is binding. This profile of constraints defines
xS, where S is the set valuations for which the optimality constraint binds.
The following is an alternative and intuitive explanation as to why any x ∈ Xk \{xS|S ∈ Vk
}cannot be an extreme point of Xk. Let S be the support of x and consider moving from x either
towards xS or in the opposite direction. Price vk will continue to be optimal, because complete
indifference at xS to all prices in the support means moving in either direction will not change
optimal prices. Also, for small perturbations, we will remain in the simplex, since x and xS have the
same support by construction. Since we can move in opposite directions and remain within Xk, it
follows that x is not an extreme point of Xk.
We illustrate in Figure 3 the extremal markets for X2 in the probability simplex of Example 1.
Since the uniform monopoly price was v∗ = 2, the extremal markets xS corresponding to S ∈ V∗ arex{2}, x{1,2}, x{2,3}, and x{1,2,3}.We will refer to a segmentation consisting only of extremal markets as
an extremal segmentation and a segmentation consisting only of extremal markets in X∗ as a uniform
profit preserving extremal segmentation. It is a direct consequence of Lemma 1 that a uniform profit
preserving extremal segmentation exists.
An example of a uniform profit preserving extremal segmentation for Example 1 is given below.4
value 1 value 2 value 3 weight
market {1, 2, 3} 12
16
13
23
market {2, 3} 0 13
23
16
market {2} 0 1 0 16
total 13
13
13
. (11)
4This segmentation is the output of the “greedy”algorithm we will describe in Section 3.3.

16
Figure 3: Uniform Profit Preserving Extremal Markets for x∗ = (1/3, 1/3, 1/3).
An example of an extremal segmentation that is not uniform profit preserving is the perfect price
discriminating segmentation described in table (6), since this necessarily uses markets x{vk} with
vk 6= v∗, which are not in X∗.
3.2 Limits of Welfare
For a given market x, we define the minimum pricing rule φ(x) to deterministically charge
min suppx and, similarly, we define the maximum pricing rule φ (x) to deterministically charge
max suppx. The minimum pricing rule always implies an effi cient allocation in the market x and
the maximum pricing rule always implies an allocation in the market x where there is zero consumer
surplus. When combined with extremal segmentations, the minimum and maximum pricing rules are
especially powerful:
Proposition 1 (Extremal Segmentations)
In every extremal segmentation, minimum and maximum pricing rules are optimal. Total surplus is
w∗ under the minimum pricing rule, and consumer surplus is zero under the maximum pricing rule.
If the extremal segmentation is uniform profit preserving, then producer surplus is π∗ under every
optimal pricing rule, and consumer surplus is w∗ − π∗ under the minimum pricing rule.
Proof. By construction of the extremal markets, any price in S is an optimal price in market
xS. This implies that minimum and maximum pricing rules are both optimal. Under the minimum
pricing rule, all consumers purchase the good, so the effi cient total surplus is attained. Consumer

17
surplus is always zero under the maximum pricing strategy because consumers who purchase pay
exactly their value. If the extremal segmentation is uniform profit preserving, setting the price equal
to v∗ in every segment is optimal, so producer surplus must be exactly π∗ under any optimal pricing
rule. Combining this with the fact that total surplus is w∗ under minimum pricing, we conclude that
consumer surplus is w∗ − π∗.This Proposition implies that with a uniform profit preserving extremal segmentation, aggregate
consumer surplus must be weakly greater under the minimum pricing rule and weakly lower (in
particular zero) under the maximum pricing rule. In fact, the same predictions hold conditional
on each possible valuation of the consumer. With the minimum pricing rule φ (x), we observe that
all effi cient trades are realized (as opposed to only those with a value equal or above the uniform
price vi ≥ v∗), and by construction of the minimum pricing rule φ (x), all sales are realized at prices
below or equal to v∗. Thus, conditional on each valuation, consumer surplus must increase. As for
the maximum pricing rule φ (x), only the buyer with the highest value in the segment x purchases
the product but has to pay exactly his valuation. Hence, the expected net utility conditional on a
purchase is zero, and so is the expected net utility without a purchase. Thus, all valuation types are
weakly worse off relative to the uniform price in the aggregate market.
Combining the previous analysis, we have our main result on the welfare limits of price discrimi-
nation:
Theorem 1 (Surplus Triangle)
There exists a segmentation and optimal pricing rule with consumer surplus u and producer surplus
π if and only if (u, π) satisfy u ≥ 0, π ≥ π∗ and π + u ≤ w∗.
Proof. First we argue necessity. That consumer surplus must be non-negative and that total
surplus is bounded above by w∗ follows directly from the definitions. For producer surplus, a price
offered under an optimal pricing rule must generate weakly greater revenue than would v∗. Summing
this inequality over all markets in the segmentation and over all prices induced by the rule yields the
desired result:
∑x∈supp(σ)
σ (x)
K∑k=1
φk (x) vk
K∑j=k
xj ≥∑
x∈supp(σ)
σ (x)
K∑k=1
φk (x) v∗K∑j=i∗
xj
= v∗K∑j=i∗
x∗j
= π∗.

18
For suffi ciency, a direct consequence of Lemma 1 is that a uniform profit preserving extremal
segmentation σ always exists. By Proposition 1, the minimum and maximum pricing rules under
this segmentation achieve the surplus pairs (w∗ − π∗, π∗) and (0, π∗) respectively. The segmentation:
σ′ (x) =
x∗k, if x = x{vk};
0, if otherwise;
together with any optimal pricing rule attains the surplus pair (0, w∗), in which the seller receives
the entire surplus. It follows that the three vertices of the surplus triangle can be attained. But now
any point in the surplus triangle can be written as a convex combination:
α (0, w∗) + (1− α) [β (w∗ − π∗, π∗) + (1− β) (0, π∗)] ,
with α, β ∈ [0, 1]. The extremal segmentation:
σ′′ (x) = ασ (x) + (1− α)σ′ (x)
together with the optimal pricing rule:
φk (x) = βφk
(x) + (1− β)φk (x) .
achieves the desired welfare outcome.
Note that the property that the producer cannot be driven below his uniform monopoly profits
reflects the general result that information has positive value in single-person decision problems.
In oligopolistic settings, however, partial information can drive sellers below their profits with no
information (see, e.g., Bergemann and Morris (2013b) for a different setting where this occurs).
3.3 Constructive Approaches and Direct Segmentations
Our results thus far establish the existence of segmentations that achieve extreme welfare outcomes,
based on the fact that any market can be decomposed as a convex combination of extremal markets
in X∗. In general, there will be many such segmentations. One reason is that there may be many
subsets of extremal markets in X∗ whose convex hulls contain x∗, and therefore many uniform
profit preserving extremal segmentations with different supports. A second reason is that extremal
segmentations are just one kind of segmentation; welfare bounds can also be attained with segments
that are not extremal. We will briefly describe two constructive algorithms in order to gives a sense

19
of this multiplicity, to give some intuition for what critical segmentations will end up looking like,
and to make some additional observations about the number of segments required.
We start with a construction of a uniform profit preserving extremal segmentation, through the
following "greedy" procedure. First, pack as many consumers as possible into the market xsuppx∗,
i.e., the extremal market in which the monopolist is indifferent between charging all prices in the
support of x∗. At some point, we will run out of mass of some valuation in suppx∗, and define the
residual market to be the distribution of all remaining consumers. We then proceed inductively with
a segment that puts as much mass as possible on the extremal market corresponding to all remaining
valuations in the residual market; and so on. At each step, we eliminate one valuation from the
residual market, so the process will necessarily terminate after at most K rounds.
More formally, let Y S = {x ∈ X |suppx ⊆ S }, which is the subset of the simplex with supportin S. It is a fact that the extreme points of Y S ∩ X∗ are simply those xS′ such that i∗ ∈ S ′ and
S ′ ⊆ S. Also, the only extreme point of Y S ∩X∗ that is in the relative interior of Y S is xS,5 since
any point on the relative boundary of Y S has xk = 0 for some k ∈ S. With these observations inhand, we can define the greedy algorithm as the following iterative procedure. At the end of iteration
l ≥ 0, the "residual" market of valuations not yet assigned to a segment is xl, with x0 = x∗, and the
support of this residual is defined to be Sl = suppxl.
We now describe what happens at iteration l, taking as inputs the residual and support from the
previous iteration(xl−1, Sl−1
). If xl−1 = xSl−1 , then we define αl = 1. Otherwise, we find the unique
t for which the market z (t) = xSl−1 + t(xl−1 − xSl−1
)is on the relative boundary of Y Sl−1 , and define
xl = z(t)and αl by xl−1 = αlxSl−1 +
(1− αl
)xl. Note that moving away from xSl−1 will never take
us out of X∗, since this transformation preserves the set of optimal prices. In particular, for any
vi ∈ Sl, the loss in revenue from pricing at vi instead of v∗ is:
v∗K∑j=i∗
zj (t)− viK∑j=i
zj (t) = t
(v∗
K∑j=i∗
xl−1j − viK∑j=i
xl−1j
),
which is non-negative as long as t ≥ 0. Also observe that this transformation preserves the fact that∑Kj=1 zj (t) = 1. Finally, since xl−1 6= xSl−1 , having xl−1i ≥ x
Sl−1i for all i would violate probabilities in
xl−1i summing to one. Therefore there is at least one i for which xl−1i < xSl−1i , so that zi (t) eventually
hits zero. The desired t is inf {t|t ≥ 0, zi (t) < 0 for some i}.5The relative interior of Y S is the set of y ∈ Y S such that for all z1, z 2 ∈ Y S , {y + εz, y − εz} ⊆ Y S for ε suffi ciently
small, where z = z1 − z2.

20
Figure 4: The Greedy Segmentation
Now inductively define Sl = suppxl, which is a strict subset of Sl−1 since xl is on the relative
boundary of Y Sl−1 . The inductive hypothesis is that:
x∗ =l∑
j=0
αjxSjj−1∏i=0
(1− αi
)+ xl
l∏i=0
(1− αi
),
which by is trivially satisfied for the base case l = 0 with the convention that α0 = 0. Our choice
of αl guarantees that if the inductive hypothesis holds at l − 1, it continues to hold at l as well.
The algorithm terminates at iteration L + 1 when xL = xSL , which certainly has to be the case
when |SL| = 1, and we define the segmentation to have support equal to{xSl}Ll=0
with σ(xSl)
=
αl+1∏l
j=0 (1− αj).For Example 1, this decomposition is visually depicted in Figure 4, and results in the following
segmentation which we previously used to illustrate uniform profit preserving extreme segmentations
in (11):
value 1 value 2 value 3 weight φ (x) φ (x)
market {1, 2, 3} 12
16
13
23
1 3
market {2, 3} 0 13
23
16
2 3
market {2} 0 1 0 16
2 2
total 13
13
13
1
.

21
This algorithm incidentally establishes constructively that at most K segments are required to attain
points on the bottom of the welfare triangle, and thus at most 2K segments to attain all points in
the welfare triangle.
In the greedy segmentation of Example 1, under either the minimum or the maximum pricing
rule, there are multiple segments in which the same price is charged. For example, if we focus on
maximizing consumer surplus, then the monopolist is to charge price 2 when the segment is x{2,3} or
when the segment is x{2}. Note that from the monopolist’s point of view, he would also be happy to
charge price 2 if we just told him that the market was one of x{2,3} and x{2}, but we did not specify
which one. The reason is that price 2 is also optimal in the "merged" market:
σ(x{2,3})
σ(x{2,3}) + σ(x{2})x{2,3} +
σ(x{2}
)σ(x{2,3}) + σ(x{2})
x{2}.
Given this observation, a natural class of segmentations (and associated pricing rules) are those in
which any given price is charged in at most one segment. Formally, we define a direct segmentation
σ to be one that has support on at most K markets, indexed by k ∈ {1, .., K} such that xk ∈ Xk.
In other words, price vk is optimal on its corresponding segment xk. The direct pricing rule is the
rule that puts probability one on price vk being charged in market xk, i.e., φk(xk) = 1. This notation
is in contrast to the extremal markets where the upper case superscript S in xS referred to the
support of the distribution. Here, the lower case superscript k in xk refers to price vk charged in
the direct segment xk. By construction, the direct pricing rule is optimal for direct segmentations,
and whenever we refer to a direct segmentation in the subsequent discussion, it is assumed that the
monopolist will use direct pricing.
Extremal segmentations and direct segmentations are both rich enough classes to achieve any
welfare outcome. The reason is that the welfare outcome is completely determined by the joint
distribution over prices and valuations that is induced by the segmentation and the pricing rule, and
both classes of segmentations can achieve any such joint distribution. This result is formalized in the
following proposition:
Proposition 2 (Extremal and Direct Segmentations)
For any segmentation and optimal pricing rule (σ, φ), there exist: (i) an extremal segmentation and
an optimal pricing strategy (σ′, φ′) and (ii) a direct segmentation σ′′ (and associated direct pricing
strategy φ′′) that achieve the same joint distribution over valuations and prices. As such, they achieve
the same producer surplus, consumer surplus, total surplus, and output.

22
Proof. To find an extremal segmentation, each market x ∈ suppσ can itself be decomposedusing extremal markets with a segmentation σx, using only those indifference sets S which contain
suppφ(x). The extremal segmentation of (σ, φ) is then defined by:
σ′(xS) ,∑
x∈suppσσ(x)σx(x
S),
and the corresponding pricing rule is:
φ′k(xS) , 1
σ′(xS)
∑x∈suppσ
σ(x)σx(xS)φk(x).
Similarly, the direct segmentation σ′′ can be defined by:
σ′′(xk) ,∑
x∈suppσσ(x)φk(x),
and therefore:
xk , 1
σ′′(xk)
∑x∈suppσ
σ(x)φk(x) · x
yields the corresponding composition of each direct segment xk.
As an example, the direct segmentation corresponding to the consumer surplus maximizing greedy
extremal segmentation of Example 1 is:
value 1 value 2 value 3 price weight
Market 1 12
16
13
1 23
Market 2 0 23
13
2 13
total 13
13
13
1
, (12)
where the market for price 3 is degenerate. Note that Market 1 is extremal but Market 2 is not.
This direct segmentation is visually represented in Figure 4.2 and is realized after the first step of the
greedy algorithm, namely after splitting x{1,2,3} from the aggregate market. This example illustrates
the observation that, while any surplus pair can be achieved by either a direct segmentation or an
extremal segmentation, it is generally not possible to attain any surplus pair with a segmentation that
is both extremal and direct. To see why there is not another segmentation which is both extremal
and direct corresponding this outcome, observe that in Example 1, any extremal segmentation must
use at least three segments, while any direct segmentation that attains maximum consumer surplus
must use at most two segments.
23
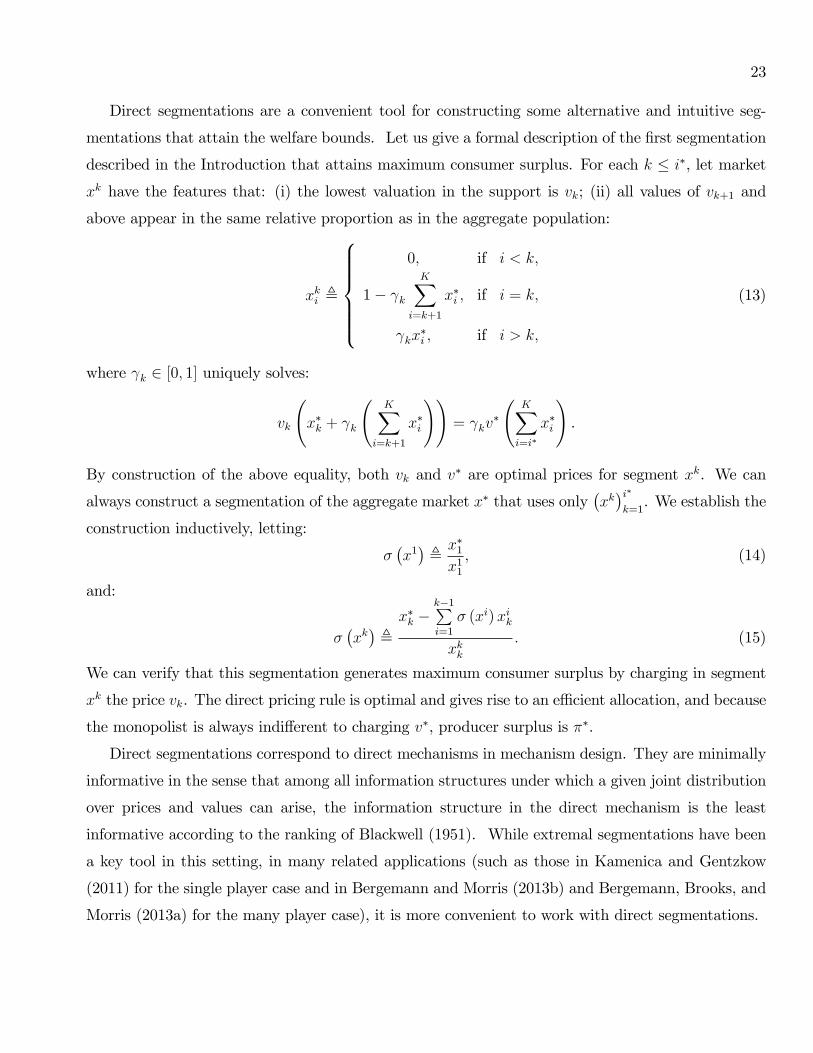
Direct segmentations are a convenient tool for constructing some alternative and intuitive seg-
mentations that attain the welfare bounds. Let us give a formal description of the first segmentation
described in the Introduction that attains maximum consumer surplus. For each k ≤ i∗, let market
xk have the features that: (i) the lowest valuation in the support is vk; (ii) all values of vk+1 and
above appear in the same relative proportion as in the aggregate population:
xki ,
0, if i < k,
1− γkK∑
i=k+1
x∗i , if i = k,
γkx∗i , if i > k,
(13)
where γk ∈ [0, 1] uniquely solves:
vk
(x∗k + γk
(K∑
i=k+1
x∗i
))= γkv
∗
(K∑i=i∗
x∗i
).
By construction of the above equality, both vk and v∗ are optimal prices for segment xk. We can
always construct a segmentation of the aggregate market x∗ that uses only(xk)i∗k=1. We establish the
construction inductively, letting:
σ(x1), x∗1x11, (14)
and:
σ(xk),x∗k −
k−1∑i=1
σ (xi)xik
xkk. (15)
We can verify that this segmentation generates maximum consumer surplus by charging in segment
xk the price vk. The direct pricing rule is optimal and gives rise to an effi cient allocation, and because
the monopolist is always indifferent to charging v∗, producer surplus is π∗.
Direct segmentations correspond to direct mechanisms in mechanism design. They are minimally
informative in the sense that among all information structures under which a given joint distribution
over prices and values can arise, the information structure in the direct mechanism is the least
informative according to the ranking of Blackwell (1951). While extremal segmentations have been
a key tool in this setting, in many related applications (such as those in Kamenica and Gentzkow
(2011) for the single player case and in Bergemann and Morris (2013b) and Bergemann, Brooks, and
Morris (2013a) for the many player case), it is more convenient to work with direct segmentations.

24
3.4 Limits of Output
While our focus so far has been on welfare outcomes, we can also report tight bounds on how output
can vary across segmentations and optimal price rules. For a segmentation σ and pricing rule φ,
output is given by: ∑x∈supp(σ)
σ (x)K∑k=1
φk (x)K∑j=k
xj.
An upper bound on output among all segmentations and optimal pricing rules is selling to all con-
sumers, and this bound is achieved by any effi cient segmentation.6 Characterizing the lowest possible
output is more subtle. We will first establish a lower bound and then show that it can be attained.
To establish a lower bound on output, recall that the producer must get at least the uniform
monopoly profits π∗, and this requires some positive output. The smallest output delivering π∗ will
arise in a conditionally effi cient allocation where the good is always sold to those with the highest
valuation. In our discrete valuations model, there must be a critical valuation vi such that the good
is always sold to all consumers with valuations above vi and never sold to consumers with valuations
below vi. Thus letting i and β ∈ (0, 1] uniquely solve:
viβx∗i +
K∑j=i+1
vjx∗j = π∗, (16)
we obtain a lower bound q given by:
q , βx∗i +K∑
j=i+1
x∗j . (17)
The additional variable β ∈ (0, 1] describes the proportion of buyers at the threshold value vi who
must purchase the good to achieve equality (16) in this discrete setting.
With respect to the earlier Example 1, we have q = β = 12and i = i∗ = 2. In fact, the greedy
segmentation for this Example displayed in (11) in combination with maximum pricing strategy sup-
ports the conditionally effi cient allocation with q = β = 12; all of the consumers with valuation 3 and
exactly half of the consumers with valuation 2 purchase the good. However, it need not be the case
more generally that every uniform profit preserving extremal segmentation delivers a conditionally
effi cient outcome under the maximum pricing strategy. This is illustrated in the following:
6If we had a positive constant marginal cost and some consumers had valuations below the marginal cost, then the
producer could never be induced to sell to those consumers, so it would still be the case that the effi cient output would
be an upper bound that was attained.

25
Example 2 (Three Values without Uniform Probability)
The setup is the same as in Example 1, except that now the proportion of valuation 1 consumers is
x∗1 = 35, and the proportions of valuations 2 and 3 are x∗2 = x∗3 = 1
5. The monopoly price is 1, π∗ = 1,
u∗ = 35, and w∗ = 8
5. The minimum output is q = 2
5, i = 2, and β = 1.
Two alternative uniform profit preserving extremal segmentations are displayed below in (18)
and graphically represented in Figure 5. However, only Segmentation 2 leads to a conditionally
effi cient allocation with the maximum pricing rule, in which case only prices 2 and 3 are used.
In Segmentation 1, the price 1 will sometimes be charged under maximum pricing, thus creating
conditional ineffi ciency.
value 1 value 2 value 3 price weight
Segmentation 1
market {1, 2, 3} 12
16
13
3 35
market {1, 2} 12
12
0 2 15
market {1} 1 0 0 1 15
Segmentation 2
market {1, 3} 23
0 13
3 35
market {1, 2} 12
12
0 2 25
total 35
15
15
1
. (18)
In spite of this apparent complication, it turns out that for any aggregate market, it is always
possible to find a uniform profit preserving extremal segmentation that, together with the maximum
pricing rule, results in a conditionally effi cient outcome. Our approach is analogous to that employed
for Lemma 1 and Proposition 1. We will show that when looking for a uniform profit preserving
extremal segmentation, it is without loss of generality to look at a particular subset of extremal
markets in X∗. The use of these markets will then imply that the outcome under the maximum
pricing rule is conditionally effi cient. In particular, we divide the simplex into regions Xk,l for
l = k, . . . , K, which is the set of markets in Xk for which vl is the lowest valuation receiving the good
in the minimum quantity conditionally effi cient outcome. In other words:
Xk,l ,{x ∈ Xk
∣∣∣∣∣K∑
j=l+1
vjxj ≤ vk
K∑j=k
xj ≤K∑j=l
vjxj
}.
We will refer to these two additional constraints in the definition of Xk,l as the lower and upper
output constraints (LC and UC, respectively). Note that with l = K, the left-hand side of the lower

26
constraint is zero, and with l = k, the right-hand side of the upper constraint is necessarily at least
π∗, soK⋃l=1
Xk,l =
{x ∈ Xk
∣∣∣∣∣0 ≤ vk
K∑j=k
xj ≤K∑j=k
vjxj
}= Xk.
Let Vk,l be the subsets of values:
Vk,l ,
S ∈ Vk∣∣∣∣∣∣ S ∩ {vl, . . . , vK} 6= ∅,|S ∩ {vl+1, . . . , vK}| ≤ 1
.We have the following linear algebraic characterization of the sets Xk,l in terms of extremal markets
with supports in Vk,l, which mirrors Lemma 1:
Lemma 2 (Extremal Markets with Output Constraints)
Xk,l is the convex hull of{xS}S∈Vk,l
.
Now, by the definition of lowest valuation vi in the support of the conditionally effi cient allocation,
it must be that x∗ ∈ Xi∗,i, and taking extremal segmentations with support in Xi∗,i, we can verify
that the outcome under the maximum pricing rule is conditionally effi cient:
Proposition 3 (Quantity Minimizing Segmentation)
For every market, there exists a uniform profit preserving extremal segmentation such that the allo-
cation under the maximum pricing rule is conditionally effi cient. As a result, producer surplus is
π∗, consumer surplus is 0, and output is q.
Proof. Since the Xi∗,l cover Xi∗, x∗ ∈ Xi∗,l for some l. As such, x∗ can be written as a convex
combination of extreme points of Xi∗,l. For every such market, S ∩ {vl, . . . , vK} 6= ∅ implies onlyconsumers with valuations weakly greater than vl receive the good, and |S ∩ {vl+1, . . . , vK}| ≤ 1
implies that all consumers with valuations strictly greater than vl purchase the good. For if not,
there must be some market in which consumers with valuation vi > vl have strictly positive mass but
the price charged is vi′ > vi. But this can only happen if {vi, vi′} ⊆ S, a contradiction. As a result,
the allocation is conditionally effi cient, but because the segmentation is uniform profit preserving
extremal, producer surplus is π∗, and under the maximum pricing rule consumer surplus is 0. Hence,
output must be q.
For any aggregate market with three possible valuations, the geometry is quite simple when the
optimal uniform price is v∗ = 2 or v∗ = 3. In those cases, every extremal segmentation results in a

27
Figure 5: Multiple Extremal Segmentations
conditionally effi cient outcome whenever the maximum pricing rule is used: For v∗ = 3, the maximum
pricing rule always induces a price of 3, and when v∗ = 2, one can verify from the definitions that
X2,2 = X2. However, when v∗ = 1, as in Example 2, then the sets X1,1 and X1,2 have disjoint and
non-empty interiors. X1,3 is just the line segment connecting x{1,3} and x{1,2,3}. This is illustrated
in detail in Figure 5. Here, the market x∗ =(35, 15, 15
)lies on the boundary of X1,1 and X1,2, and it
also lies in the convex hull of{x{1}, x{1,2}, x{1,2,3}
}. The latter sets of extremal markets appear in the
segmentation generated by the greedy algorithm.
4 A Continuum of Valuations
Until now, we have considered markets that have a finite and fixed support of valuations. The
finite structure has allowed us to make simple geometric arguments to characterize the limits of price
discrimination. Nonetheless, our results generalize in a straightforward manner to environments with
infinitely many valuations. In this Section, we give a simple convergence argument showing why this
is the case and report some examples of critical segmentations for continuous demand curves.
For the present analysis, we redefine a market to be an element x ∈ X = ∆ ([0, v]), which is the
set of Borel probability measures on the interval [0, v], and we endow the set X with the weak-∗
topology. We will write x (Y ) for the measure of a set Y ∈ B ([0, v]), which is the collection of Borel
subsets of [0, v]. As before, we fix an aggregate market x∗ ∈ X, and let v∗ denote a uniform monopoly

28
price that solves:
v∗ ∈ arg maxv∈[0,v]
v x∗ ([v, v]) .
Note that for any Borel measure, such a maximizer exists due to the fact that x∗ ([v, v]) is monoton-
ically decreasing and continuous from the left.
The set Xv is defined to be the set of markets in which v∗ is a maximizer of v x ([v, v]). We let
Xv denote the set of markets in Xv such that the seller is indifferent between setting any price in the
support, i.e.:
Xv = {x ∈ Xv |v′ x ([v′, v]) = min suppx, ∀v′ ∈ suppx} .
We write Xv for the subset of Xv with finite support. A preliminary result asserts that a convergent
sequence of measures in Xv must converge to an element of Xv.
Lemma 3 (Closure)
cl Xv ⊆ Xv.
In fact, the closure of Xv is equal to Xv, but the weaker property is suffi cient for our goals.
Lemma 3 should not be viewed as a continuous analogue of Lemma 1, but rather as the "glue" that
binds the discrete characterization of extremal markets to the continuous characterization. Extremal
markets in the continuous case are precisely the elements of Xv for some v. But in order to find
an extremal segmentation in the proof of Theorem ??, which appears in the Appendix, we will take
limits of extremal segmentations of finite approximations to x∗, and convergence is guaranteed by
Lemma 3.
To that end, we redefine a segmentation of the market x∗ to be an element σ ∈ Σ, where:
Σ =
{σ ∈ ∆ (X)
∣∣∣∣∫x′∈X
x′ (Y )σ (dx′) = x∗ (Y ) ∀Y ∈ B ([0, v])
}.
A segmentation σ is uniform profit preserving extremal if its support is contained in Xv∗ . A pricing
rule is a mapping φ : suppσ → X, and the pricing rule is optimal if for all x ∈ suppσ, suppφ (x) ⊆arg maxv∈[0,v] v x ([v, v]). The minimum pricing rule and maximum pricing rule put probability one
on the minimum and maximum of suppx for all x ∈ suppσ, respectively. Consumer surplus is:∫x′∈X
∫v′∈[0,v]
∫v′′∈[v′,v]
(v′′ − v′) x′ (dv′′)φ (dv′)σ (dx′) ;
producer surplus is: ∫x′∈X
∫v′∈[0,v]
v′ x′ ([v′, v])φ (dv′)σ (dx′) ;

29
and total surplus is: ∫x′∈X
∫v′∈[0,v]
∫v′′∈[v′,v]
v′′ x′ (dv′′)φ (dv′)σ (dx′) .
We can then re-establish the earlier Proposition 1 and Theorem 1 for the environment with a con-
tinuum of Borel measurable values.
Proposition 1B (Extremal Segmentations (with a Continuum of Values))
In every extremal segmentation, minimum and maximum pricing rules are optimal. Total surplus is
w∗ under the minimum pricing rule, and consumer surplus is zero under the maximum pricing rule.
If the extremal segmentation is uniform profit preserving, then producer surplus is π∗ under every
optimal pricing rule, and consumer surplus is w∗ − π∗ under the minimum pricing rule.
Combining results, we have the following:
Theorem 1B (Surplus Triangle (with a Continuum of Values))
There exists a segmentation and optimal pricing rule with consumer surplus u and producer surplus
π if and only if (u, π) satisfy u ≥ 0, π ≥ π∗ and π + u ≤ w∗.
We conclude this Section with an Example of an aggregate market with continuously distributed
values for which we can derive explicit segmentations with a convex support for all segmentations.
Example 3 (Unit Interval with Uniform Density)
The valuations of the consumers are uniformly distributed between 0 and 1, so that x∗ ([v, 1]) = 1− vfor all v ∈ [0, 1]. The uniform monopoly price is v∗ = 1
2, uniform monopoly profits are π∗ = 1
4, and
the effi cient surplus is w∗ = 12.
We will construct a uniform profit preserving extremal segmentation σ of this x∗, in which there
is a uniform distribution of market segments xp for p ∈[0, 1
2
]. Each segment xp has support of the
form [p, z (p)], and is defined by:
xp ([v, 1]) =
1, if v ≤ p;
pv, if p < v ≤ z (p) ;
0, if v > z (p) ;
and the upper boundary point is given by:
z (p) =1 +
√1− 4p2
2,

30
which is monotonically decreasing and has range[12, 1]. Thus, the support sets of the segments can
be ordered by the strong set order. By construction, all of the segments are in X 12, and in fact the
segmentation arises as the solution to the continuous version of the greedy algorithm constructed in
Section 3.3.
Let us briefly verify that σ is in fact a segmentation of the aggregate market. It is suffi cient to
check that the density of a valuation v integrates to one. For v ∈[0, 1
2
], the density in market xp is
pv2when p ≤ v and zero otherwise, so the aggregate density is:∫ v
p=0
2p
v2dp =
p2
v2
∣∣∣∣vp=0
= 1.
If v ∈[12, 1], the density in market xp is
pv2when z (p) > v, and there is a conditional mass point of
size pvin the market xp such that z (p) = v, which is when p =
√v (1− v). Note that the probability
that the maximum of the support of xp is less than w is 1 − 2√w (1− w), so the density at v is
2v−1√v(1−v)
. Therefore the aggregate density for every valuation v is equal to:
2v − 1√v (1− v)
√v (1− v)
v+
∫ √v(1−v)
p=0
2p
v2dp =
2v − 1
v+
1− vv
= 1.
We conclude that σ does in fact segment the aggregate market, as it preserves the aggregate density.
The proof of Theorem 1B establishes the existence of extremal segmentations for general Borel
measurable distributions. In Bergemann, Brooks, and Morris (2013b), we establish a related existence
result for direct segmentations, stated as Theorem 2 in that paper. In addition, there we show that
when we narrow the analysis to aggregate markets with differentiable distribution functions, we can
explicitly construct direct segmentations that achieve the extreme welfare outcomes as solutions of
differential equations. The resulting segmentations, given in Bergemann, Brooks, and Morris (2013b)
as Proposition 3 and 4, mirror those in the finite environment (see our current Proposition 2).
We will illustrate these results with examples of direct segmentations for the uniform environment
of Example 3. The consumer surplus maximizing segmentation, as derived there in Proposition 3,
leads to an associated distribution function of prices H (p) given by:
H (p) = 1− 1− p1− 2p
e−2p
1−2p , for p ∈[0,
1
2
]. (19)
By contrast, the segmentation of the consumers in the total surplus and output minimizing allocation
as described there by Proposition 4 leads to a distribution function of prices given by:
H (p) = 2p2 − 1, for p ∈[
1√2, 1
].
31
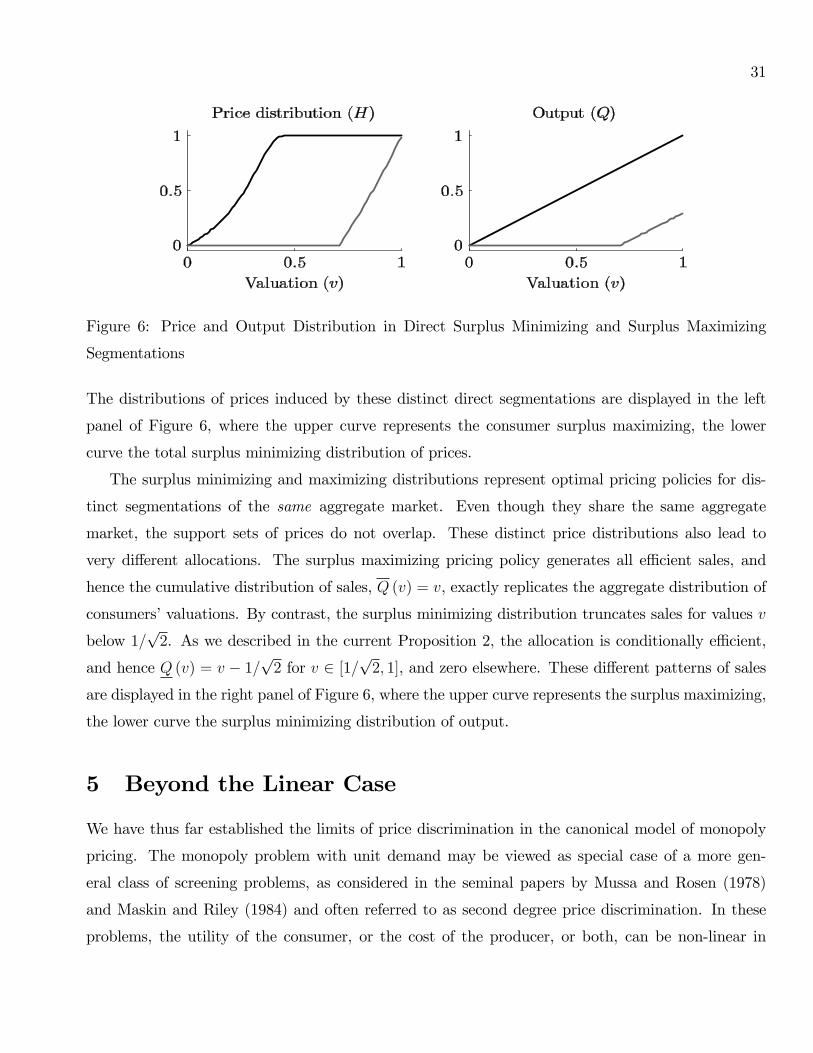
Figure 6: Price and Output Distribution in Direct Surplus Minimizing and Surplus Maximizing
Segmentations
The distributions of prices induced by these distinct direct segmentations are displayed in the left
panel of Figure 6, where the upper curve represents the consumer surplus maximizing, the lower
curve the total surplus minimizing distribution of prices.
The surplus minimizing and maximizing distributions represent optimal pricing policies for dis-
tinct segmentations of the same aggregate market. Even though they share the same aggregate
market, the support sets of prices do not overlap. These distinct price distributions also lead to
very different allocations. The surplus maximizing pricing policy generates all effi cient sales, and
hence the cumulative distribution of sales, Q (v) = v, exactly replicates the aggregate distribution of
consumers’valuations. By contrast, the surplus minimizing distribution truncates sales for values v
below 1/√
2. As we described in the current Proposition 2, the allocation is conditionally effi cient,
and hence Q (v) = v − 1/√
2 for v ∈ [1/√
2, 1], and zero elsewhere. These different patterns of sales
are displayed in the right panel of Figure 6, where the upper curve represents the surplus maximizing,
the lower curve the surplus minimizing distribution of output.
5 Beyond the Linear Case
We have thus far established the limits of price discrimination in the canonical model of monopoly
pricing. The monopoly problem with unit demand may be viewed as special case of a more gen-
eral class of screening problems, as considered in the seminal papers by Mussa and Rosen (1978)
and Maskin and Riley (1984) and often referred to as second degree price discrimination. In these
problems, the utility of the consumer, or the cost of the producer, or both, can be non-linear in

32
the quantity (or quality) of the object. In contrast, our benchmark results only apply to settings in
which utility is linear or the monopolist is restricted to selling a single unit to each consumer, so that
posted price mechanisms are optimal. Nonetheless, the same welfare question can be posed in the
general screening environment: what are the feasible pairs of consumer and producer surplus that
can be induced through optimal behavior by the monopolist under some segmentation of the market?
While we do not provide a complete answer to this question, we can report general features of how
our results change as we move towards more general screening environments.
The limits of price discrimination are characterized by the surplus triangle, which is defined by the
participation constraint of the consumer, the uniform price profit lower bound of the producer, and
effi cient surplus upper bound. In the non-linear case, there are analogous restrictions on consumer
surplus and total surplus, and the monopolist must get at least the profit he would obtain with
the uniform monopoly menu (rather than just a posted price). As we introduce non-linearity, these
bounds can no longer be attained exactly, but the central features of the limits survive as follows:
(i) With a finite set of allocations, the geometric approach, in particular the characterization of the
feasible surplus pairs by means of the critical markets, remains valid. A continuum of consumer
surplus values can still be supported while maintaining the producer surplus associated with the
uniform monopoly menu. Thus, we maintain the “bottom flat”of the surplus set;
(ii) With a continuum of allocations, the “bottom flat”typically disappears. Critical markets where
several distinct allocations are simultaneously optimal do not exist anymore. Nonetheless, the entire
surplus set remains "fat" in the sense that many levels of consumer surplus are consistent with profit
levels strictly above the "uniform menu profit," where the producer offers the same menu to all
consumers;
(iii) As the nonlinear environment approaches the linear one, the surplus set of the nonlinear envi-
ronment continuously approaches the surplus triangle of the linear environment.
We will illustrate these points with simple examples that add a small amount of concavity to the
utility function of the consumer, namely the linear quadratic utility function:
uk (q) = vkq + εq (1− q) , ε > 0. (20)
As before, we maintain zero marginal cost and let q ∈ [0, 1]. The concave model can be interpreted
as one of quantity discrimination with a constant marginal cost of production, as in Maskin and
Riley (1984). Alternatively, we could have considered a convex cost function, and then relate the
subsequent results to quality discrimination as in Mussa and Rosen (1978). As ε converges to zero,

33
the model converges to the linear model in which a uniform price for the entire object, q = 1, is
always an optimal policy. We observe that the concavity in the utility function is independent of
the type v, and so is the socially effi cient allocation (as long as ε is suffi ciently small). That is,
provided that v > 0, the socially effi cient allocation is to assign each type the entire object, q = 1.
In consequence, the effi cient boundary of the surplus triangle is independent of the quadratic term
and of the size of ε.
We choose to present results in this Section for this one parameter example and report calculations
in an Supplemental Online Appendix. For the cases considered in this Section, with a small number
of outcomes or types, the arguments extend in a straightforward manner to more general models
with single crossing payoff functions. However, we will not characterize this general case.7
Finite Set of Allocations First consider the case of finitely many allocations and finitely many
types. With second degree price discrimination, the seller offers a menu consisting of price-quantity
pairs from which the consumer can choose. In every optimal menu, prices are uniquely determined
given the quantities through binding incentive compatibility constraints. Thus, any optimal menu
is described by a vector of quantities rather than a single price p, as in the preceding analysis of
third degree price discrimination. A menu is then a K−dimensional vector, q = (q1, ..., qK), where
qk ∈ Q ⊆ [0, 1] and |Q| < ∞. The menu prescribes for every type vk the quantity qk that thattype will choose. The only restriction on the feasible set of allocation vectors q is that the entries
of the vector q are weakly increasing. This monotonicity requirement comes from the incentive
compatibility constraints: vk+1 ≥ vk ⇒ qk+1 ≥ qk.8 The binary allocation space of Sections 3 and
4 with qk ∈ {0, 1} is simply a special case of the more general finite allocation space. With thisgeneralization of the space of optimal policies, from a single price to a menu of quantities, the earlier
results of Lemma 1 and Proposition 1 generalize, with the modification that now it is only possible
to make the monopolist indifferent between particular sets of menus. This is in contrast to the linear
case, where the monopolist can simultaneously be indifferent among charging any set of prices in the
7In Bergemann, Brooks, and Morris (2013b), we performed another robustness check, seeing how the results changed
if only "partial segmentation" was possible, so that segmentations were required to be convex combinations of some
fixed set of markets. As in the case of second degree price discrimination, we no longer attain the entire welfare
triangle but attain fat regions of possible welfare outcomes.8Equivalently, we could represent the allocation vector by a vector of prices rather than quantities. However, as
usual, the monotonicity condition of the incentive compatibility is more immediate to express in the quantity than in
the price dimension.

34
support of x∗. Nonetheless, we can identify a uniform profit preserving extremal segmentations and
identify the corresponding minimum and maximum pricing strategies, as in Proposition 1.
We illustrate this by returning to Example 1 with three valuations given by vk ∈ {1, 2, 3}, butnow allow for an intermediate quantity between 0 and 1, say 1
2, and thus:
qk ∈{
0,1
2, 1
}.
In Figure 7 we display the resulting optimal policies given the concave utility of the consumers (for
the case of ε = 0.6). There are now six distinct allocation vectors q, each of which is optimal for a
subset of markets. The number of optimal allocation vectors is much smaller than the combinatorial
upper bound, 33, would suggest as each vector has to be monotone by incentive compatibility, and
by the familiar "no distortion at the top" result, allocation for the highest type must be the effi cient
quantity, q3 = 1. It is informative to contrast the revenue maximizing allocations in Figure 7 with
Figure 7: Extremal Markets with Menus
those in Figure 2. In the preceding analysis with unit demand, the choice of a single price p uniquely
determined the allocation vector, so for example p = 1 represented the associated allocation vector
q = (1, 1, 1), in which every type receives the object, or p = 2 represented the allocation q = (0, 1, 1)
in which the low type does not receive the good. Between the previously used allocations, namely
(1, 1, 1), (0, 1, 1) and (0, 0, 1), there now appears a band of markets where the use of the intermediate
quantity 12appears as an element of an optimal menu. In other words, with concave utility, the
revenue maximizing policy sometimes uses the intermediate quantity to screen consumers within a
segment.

35
In Figure 7, we observe at the base of the simplex, where only the low and intermediate valuation
have positive probability, that the intermediate quantity 12already appears as part of the optimal
allocation. Since we can analyze this case insightfully and completely, we therefore restrict attention
further to the binary type model.
Binary Types With the binary type model, vk ∈ {1, 2}, the aggregate market is described by theprior probability of the low type:
x∗ , Pr (vk = 1) .
In the binary type space, the probability simplex becomes the unit interval and we can determine
the extremal markets at which multiple, here exactly two, menus are simultaneously optimal. The
extremal market x identifies the prior probability at which the seller is indifferent between offering
the menus (0, 1) and(12, 1); and the extremal market x identifies the prior probability at which the
seller is indifferent between the menus(12, 1)and (1, 1). These extremal segments are illustrated in
Figure 8.
Figure 8: Probability Simplex with Binary Types
We can ask how the nonlinearity affects the limits of discrimination. The benchmark is now
provided by the uniform menu profit rather than the uniform price profit, namely the profit that
the seller could achieve with a single menu offered to the aggregate market x∗. We continue to
refer to the uniform menu profit as π∗. The earlier Proposition 1 still applies and we can construct
minimum and maximum pricing strategies to construct the horizontal boundary at the uniform menu
profit π∗, but the resulting bounds on the consumer surplus are weaker in the non-linear screening
environment. In the linear environment, the uniform profit preserving extremal segmentation had
the property that there existed one pricing strategy that generates the socially effi cient allocation
and the consumer surplus is w∗ − π∗, and another pricing strategy at which consumers receives zerosurplus. By contrast, in the present case of second degree price discrimination, one or even both of
the optimal pricing strategies involve intermediate quantities for any given market. As intermediate
quantities are neither socially effi cient nor do they suppress the information rents completely, the
lower and upper bounds on consumer surplus, 0 and w∗ − π∗, can no longer be achieved.

36
We can divide the binary type simplex into three regions in which each of the menus (1, 1) ,(12, 1),
and (0, 1) are respectively optimal. The corresponding set of extremal markets is given by {0, x, x, 1}.Now, for every aggregate market x∗ ∈ [0, 1] \ {0, x, x, 1}, a uniform profit preserving extremal seg-
mentation involves the two markets adjacent to x∗, and at least one of them is necessarily x or x.
In consequence, the intermediate menu(12, 1)is used under either the maximum or the minimum
pricing policy. Either way, the intermediate menu does not generate the entire social surplus w∗ nor
does it reduce the consumer surplus to 0.
In Figure 9, we illustrate the attainable surplus set and the optimal allocation at an aggregate
market x∗ = 12, at which point the menu
(12, 1)is strictly optimal since x < 1
2< x. Thus, the uniform
profit preserving extremal segmentation uses the markets x and x, as indicated by the arrows in
Figure 8. The minimum pricing strategy asks the seller to offer the most effi cient among the optimal
menus at each segment, which is (1, 1) at the segment x and(12, 1)at the segment x. This is
analogous to the minimum pricing strategy, in that the allocation of the low type is as effi cient as
possible subject to optimal behavior on the part of the monopolist. However, these menus do not
lead to the effi cient allocation with probability one, and hence the realized surplus pair is below
the effi cient frontier. By a similar consideration, the maximum pricing strategy involves at every
extremal market the least effi cient among the optimal allocations, and hence offers (0, 1) at x and(12, 1)at x. Here again, we do not succeed in lowering the information rent of consumers to zero. It
then follows that the set of attainable surplus pairs is strictly smaller than the bounds that defined
the surplus triangle. But importantly, the characterization in terms of the extremal segmentations
and the resulting large or "fat" set of possible surplus pairs remain valid.Of course, uniform profit
preserving extremal segmentations give us only the lower and upper boundary of the set of consumer
surpluses that are consistent with the uniform menu profit π∗. Thus, while we now have the boundary
of the surplus set at π∗, the question arises how to identify the entire surplus set. With the linear
environment, this question could be answered immediately as we directly attained the vertices of the
surplus triangle. By contrast, in the present nonlinear environment, additional work remains to be
done. Clearly, we can still form convex combinations of the extremal markets at π∗ and the complete
information outcome, the case of perfect discrimination. However, there are other surplus points
that can be achieved using extremal but non-uniform profit preserving segmentations, as depicted in
Figure 9 (for ε = 0.6). In particular, it is possible to achieve zero consumer surplus if the aggregate
market is segmented using x and x{2}, and the monopolist offers (1, 1) at x and (0, 1) (which is strictly
optimal) at x{2}. Similarly, zero consumer surplus can be reached by segmenting into x{1} and x and

37
Figure 9: Surplus Set with Second Degree Price Discrimination
offering (1, 1) at x{1} (again strictly optimal) and (0, 1) at x. We will see that with a continuum of
allocations, the frontier becomes significantly more complicated, as in Figure 11.
A Continuum of Allocations We conclude our discussion by staying with the binary type space
{1, 2} and the quadratic utility function given above by (20), but we now allow for a continuous choiceof allocations with qk ∈ [0, 1]. In other words, we are giving up the finiteness in the allocation space
that we assumed so far. With this amount of flexibility in the allocation, the revenue maximizing
menu will continuously respond to the composition of the market. In particular, for every market
x ∈ [0, 1], there exists a single menu that is revenue optimal. Thus, there are no longer any extremal
markets at which multiple distinct menus are simultaneously optimal. In consequence, we cannot
use the multiplicity of optimal menus to identify an interval of possible surplus pairs (u, π∗) varying
in u that can be achieved by uniform profit preserving extremal segmentations. In fact, the set of
attainable surplus pairs, while still large, now has a unique pair (u∗, π∗) at which the monopolist is
held down to lower bound profits. Nonetheless, we can use segmentation across different profit levels
to vary both the consumer and the producer surplus.
We will solve for the entire set of feasible surplus pairs in this example using the "concavification"
methodology of Aumann and Maschler (1995) and Kamenica and Gentzkow (2011), discussed in the
Introduction. This technique is especially powerful and transparent in the two type case considered

38
here. In the language of Bayesian persuasion (Kamenica and Gentzkow (2011)), the problem is as
follows: Suppose a sender could commit, before observing his type, to a noisy signal that he will
transmit to a receiver conditional on each type. The receiver in turn takes an action with payoff
consequences for both sender and receiver, where this action maximizes the receiver’s payoff given
his posterior beliefs about the type conditional on the signal he received. The sender’s payoff from
the optimal signal structure can be identified by the concavification of the sender’s payoff as a
function of the receiver’s posterior beliefs, where this payoff is induced by the receiver’s optimal
action given those beliefs. In particular, the maximum payoff of the sender over all signal structures
is the concavification evaluated at the prior distribution of the type. In the present problem, the
"sender" is a social planner maximizing a weighted sum of consumer and producer surplus with the
type being the consumer’s valuation, and the "receiver" is the monopolist choosing his privately
optimal menu as a function of the posterior belief about the consumer’s valuation. In effect, both
the signal and the posterior beliefs are a market segment, and Bayesian updating requires that the
average segment be the aggregate distribution of types. We can use this methodology to calculate
the surplus frontier by finding the concavification of every possible objective of the social planner.
With this perspective, the profit function of the seller as a function of the proportion of low types
x is given by:
π (x) ,
(1− x)u2 (1) , if 0 ≤ x ≤ x;
xu1 (q (x)) + (1− x) (u2 (1)− u1 (q (x)) + u2 (q (x))) , if x ≤ x ≤ x;
u1 (1) , if x ≤ x ≤ 1;
(21)
and likewise the consumer surplus is:
u (x) ,
0, if 0 ≤ x ≤ x;
(1− x) (u2 (q (x))− u1 (q (x))) , if x ≤ x ≤ x;
(1− x) (u2 (1)− u1 (1)) , if x ≤ x ≤ 1.
(22)
The profit and consumer surplus expressions follow directly from the optimal and incentive compatible
prices charged by the seller.
In Figure 10, we illustrate the shape of producer and consumer surplus for the quadratic utility
function and q ∈ [0, 1] and for the case of ε = 0.6, as well as their respective concavified versions.
The concavified version has a graph equal to the convex hull of the graph of the original function.
Now, in segments where the concavification is strictly greater than the original function, we find that
a convex combination of the critical markets that form the concavification maximizes producer and

39
consumer surplus, respectively. These illustrations immediately indicate some elementary properties
of the profit maximizing or consumer surplus maximizing segmentations, which hold true for all
concave utility functions u (v, q). The concavified profit function strictly dominates the convex profit
function π (x) and hence the seller always prefers perfect segmentation, i.e., segments which contain
either only low or only high valuations customers. By contrast, it is indicated by the concavified
consumer surplus function that the maximal consumer surplus is attained without any segmentation
with a large share x of low valuation buyers, whereas a small share x of low valuation buyers requires
market segmentation to achieve maximal consumer surplus.
Figure 10: Consumer and producer surplus, and their concavified versions.
The entire boundary of the set of feasible pairs of consumer and producer surplus can be con-
structed by concavifying the weighted sum of these two expressions. We would have to allow for
negative weights on either term to able to reach the lower bounds of the surplus set as well.
We illustrate the shape of the surplus triangle in Figure 11 for four different values of ε. As
ε decreases, the concave utility comes closer to the linear utility. At the same time, the surplus
set increases in the strong set order and eventually approximates the boundaries that identify the
surplus triangle. Importantly, even though for every ε there is a unique pair of (u∗, π∗) at the Bayes
Nash equilibrium profit level π∗, the overall surplus set is still "fat" in the sense that it forms a large
open set inside the boundaries identified earlier.Ultimately, we find that the dramatic and concise
characterization of feasible surplus pairs in our benchmark setting does depend on the linearity of
payoffs. Nonetheless, the qualitative features of the main results remain approximately true for
small deviations from linearity. The complete characterization of the limits of price discrimination
in non-linear settings seems to be an open direction for future research.

40
Figure 11: Surplus Set with a Continuum of Allocations
6 Conclusion
It was the objective of this paper to study the impact of additional information about consumers’
valuations on the distribution of surplus in a canonical setting of monopoly price discrimination. We
showed that additional information above and beyond the prior distribution can have a substantial
effect on consumer and producer surplus. In general, there are many directions in which welfare could
move relative to the benchmark of a unified market. We showed that while additional information
can never hurt the seller, it can lead social and consumer surplus to both increase, both decrease, or
respectively increase and decrease. Most notably, we establish the exact limits of these predictions
without any restrictions on the aggregate market and in particular the sharp boundaries do not rely
on any regularity or concavity assumption on the distribution of values or the profit function.
Exactly which form of market segmentation arises in practice is no doubt influenced by many
factors, which may include technological and legal limitations on how information can be collected
and used. In an age in which individuals are increasingly concerned about the preservation of privacy,
it is important to understand the welfare consequences that may result from the collection of data
on consumers’preferences. Policy discussion often assumes that this will favor producers and hurt
consumers. This may be a reasonable assumption if the data ends up in the hands of producers.
But this need not be the case. Our findings indicate that the relationship between effi ciency and
information can only be understood in the context of how data will be used, and this crucially depends

41
on the preferences of those who collect the information. Thus, a natural and important direction for
future research is to better understand which forms of price discrimination will endogenously arise,
and for whose benefit.
42
7 Appendix
Proof of Lemma 2. We begin with the following four observations:
Fact 1: LC implies that optimality constraints are satisfied for all i ≥ l + 1.
Fact 2: UC implies that the non-negativity constraint is slack for some i ≥ l.
Fact 3: If LC binds, then the non-negativity constraint is slack for some i ≥ l + 1.
Fact 4: If UC binds and xi > 0 for some i > l, then vl is not optimal.
As with Xk, any element x ∈ Xk,l must satisfy the 2 (K − 1) non-negativity and optimality
constraints. In addition, x must satisfy the lower and upper minimum output constraints. An
extreme point of Xk,l is characterized by a subset of at least K − 1 of these constraints which
are binding (see Simon (2011), Proposition 15.2). By Fact 1, we can drop all of the optimality
constraints for i ≥ l + 1, leaving just UC, LC, non-negativity, optimality constraints for i ≤ l. Let
m = |{l, . . . , K} \ {k}|. As before, non-negativity of xi and optimality of vi are mutually exclusive,so we can obtain at most K − 1 − m binding optimality or non-negativity constraints for i < l,
leaving m constraints to define the extreme point. We will establish by cases that the choice of the
remaining active constraints must be equivalent to choosing at most one optimality constraint from
{l + 1, . . . , K} and at least one optimality constraint from {l, . . . , K}, with the remaining bindingconstraints being non-negativity. Note that if l = K, then LC is always satisfied and can be dropped,
and UC implies that vK is an optimal price.
First, suppose that non-negativity is binding for xl, i.e., xl = 0. Note that this case can only arise
if l < K. Then UC and LC are redundant and equivalent to the single linear restriction:
v∗∑j≥i∗
xj =∑j≥l+1
vjxj.
By Fact 2, there must be exactly m − 1 binding non-negativity constraints for i ≥ l. This implies
that optimality binds for the single i ≥ l + 1 for which the non-negativity constraint on xi need not
bind.
Now suppose that xl > 0. Then at most one of UC and LC can bind (the gap between them is
strict). Suppose that it is LC. By Fact 3, some non-negativity constraint is slack for i ≥ l + 1. If
more than one of these is slack, or if optimality is not binding for vl, we could not reach the requisite
number of binding constraints. Thus, exactly one non-negativity constraint is slack for i ≥ l+ 1, and
the optimality binds for vl. Together with LC, this gives us the required m. As a result, optimality
must be binding for the single i ≥ l + 1 for which non-negativity does not bind.

43
Alternatively, suppose xl > 0 and UC binds. (Note that this case cannot arise when l = k,
since then UC is implied by optimality of vk, and can be dropped from the problem.) By Fact 4,
non-negativity must bind for all i ≥ l + 1. Otherwise, neither optimality of vl, non-negativity of
xl, nor non-negativity of xi for i ≥ l + 1 binds, and we would only have UC plus at most m − 2
non-negativity constraints for i ≥ l + 1, which is one short of the m required. We conclude that
xi = 0 for all i ≥ l + 1, so that UC implies that optimality binds for vl.
Finally, it must be that either LC or UC binds. Otherwise, then clearly xl > 0 and the only way
to get to K − 1 constraints is all non-negativity constraints are binding for i ≥ l+ 1, and optimality
binding for vl, which contradicts that LC does not bind.
Proof of Lemma 3. As X is metrizable in the Prokhorov metric, cl Xv is the set of limits
of convergent sequences in Xv. Take a weakly convergent sequence xk ∈ Xv, and suppose that it
converges to some x /∈ Xv. Then we can find some v′ ∈ suppx such that v′ x ([v′, v]) 6= min suppx.
Claim: For any v′ ∈ suppx and for any ε > 0, there exists a K such that for all k ≥ K,
we can find vk ∈ suppxk such that |vk x ([vk, v])− v′ x ([v′, v])| < ε. The measure x can have at
most countably many mass points, so we can find δ > 0 so that x ({v′ − δ, v′ + δ}) = 0 (i.e., both
[v′ − δ, v′ + δ] and [v′ − δ, v] are continuity sets of x) and x ([v′ − δ, v′)) < ε2v. By weak convergence,
we must have that xk ([v′ − δ, v])→ x ([v′ − δ, v]) and xk ([v′ − δ, v′ + δ])→ x ([v′ − δ, v′ + δ]). Since
v′ ∈ supp x, it must be that x ([v′ − δ, v′ + δ]) > 0, so we can pick a K large enough so that for all
k ≥ K, xk ([v′ − δ, v′ + δ]) > 0 and |xk ([v′ − δ, v])− x ([v′ − δ, v])| < ε2v. Let vk = min suppxk ∩
[v′ − δ, v′ + δ], which is non-empty because xk ([v′ − δ, v′ + δ]) > 0. Hence,
|vk xk ([vk, v])− v x ([v′, v])| = |vk xk ([v′ − δ, v])− v x ([v′, v])|
≤∣∣∣vk xk ([v′ − δ, v])− v′ x ([v′ − δ, v]) + v′
ε
2v
∣∣∣≤
∣∣∣(vk − v′) ε
2v
∣∣∣+∣∣∣v′ ε
2v
∣∣∣≤ ε
which proves the claim.
Thus, we can find K large enough so that for k ≥ K, there exist vk and v′k ∈ suppxk such that|vk xk ([vk, v])−min suppx| < ε and |v′k xk ([v′k, v])− v′ x ([v′, v])| < ε where
ε = (|v′ x ([v′, v])−min suppx|) /2. But this means that |vk xk ([vk, v])− v′k xk ([v′k, v])| > 0, which
contradicts the assumption that xk ∈ Xv.
Proof of Proposition 1B. The monopolist is indifferent to a pricing rule that puts probability
one on v∗ when x ∈ Xv∗. Under such a rule, producer surplus is π∗. By definition of an extremal
44
segmentation, the maximum and minimum pricing rules are optimal, and the former results in a
consumer surplus of zero and the latter results in all consumers purchasing the good, so that total
surplus is w∗.
Proof of Theorem 1B. The argument for necessity is as in the finite case. For suffi ciency,
we first argue that there exists a uniform profit preserving extremal segmentation. Since simple
measures are dense in Xv∗, we can find a sequence xk of markets in Xv∗ that converge to x∗ in the
weak topology. By Lemma 1, there exist extremal segmentations of xk for every k, which we can
identify with elements σk of ∆(cl Xv∗
). Since cl Xv∗ is a closed subset of the compact set X, it is
also a compact. By the Banach-Alaoglu Theorem, ∆(cl Xv∗
)is compact, so σk has a convergent
subsequence that converges to some σ ∈ ∆(cl Xv∗
).
Claim: σ is a segmentation of x∗. For any continuous and bounded function f on [0, v], we have∫v∈[0,v]
f (v)x (dv) = limk→∞
∫v∈[0,v]
f (v)xk (dv)
= limk→∞
∫v∈[0,v]
f (v)
∫x′∈X
x′ (dv)σk (dx′)
= limk→∞
∫x′∈X
∫v∈[0,v]
f (v)x′ (dv)σk (dx′)
=
∫x′∈X
∫v∈[0,v]
f (v)x′ (dv)σ (dx′)
where the first line follows from weak convergence, the second line is the definition of an extremal
segmentation, the third line is Fubini’s Theorem, and the last line is again weak convergence, using
the fact that∫v∈[0,v] f (v)x′ (dv) is a continuous function of x′. Hence, the measure
∫x′∈X x
′σ (dx′) is
a version of x∗.
To conclude, there exists a uniform profit preserving segmentation σ, under which minimum
and maximum pricing rules are optimal and induce the points (w∗ − π∗, π∗) and (0, π∗). As before,
the segmentation σ′ defined by σ′ (Y ) = x∗({v|x{v} ∈ Y
})and x{v} is the Dirac measure on {v},
together with any optimal pricing rule, induces the welfare outcome (0, w∗). Weighted averages
σ′′ = ασ + (1− α)σ′ and φ = βφ+ (1− β)φ achieve every other surplus pair in the triangle.

45
References
Aguirre, I., S. Cowan, and J. Vickers (2010): “Monopoly Price Discrimination and Demand
Curvature,”American Economic Review, 100, 1601—1615.
Aumann, R., and M. Maschler (1995): Repeated Games with Incomplete Information. MIT.
Bergemann, D., B. Brooks, and S. Morris (2013a): “Extremal Information Structures in
First Price Auctions,”Discussion Paper 1926, Cowles Foundation for Research in Economics, Yale
University.
(2013b): “The Limits of Price Discrimination,”Discussion Paper 1896R, Cowles Foundation
for Research in Economics, Yale University.
Bergemann, D., and S. Morris (2013a): “The Comparison of Information Structures in Games:
Bayes Correlated Equilibrium and Individual Suffi ciency,”Discussion Paper 1909, Cowles Foun-
dation for Research in Economics, Yale University.
(2013b): “Robust Predictions in Games with Incomplete Information,”Econometrica, 81,
1251—1308.
Blackwell, D. (1951): “Comparison of Experiments,” in Proc. Second Berkeley Symp. Math.
Statist. Probab., pp. 93—102. University of California Press, Berkeley.
Cowan, S. (2013): “Welfare-Increasing Third-Degree Price Discrimination,”Discussion paper, Ox-
ford University.
Kamenica, E., and M. Gentzkow (2011): “Bayesian Persuasion,”American Economic Review,
101, 2590—2615.
Maskin, E., and J. Riley (1984): “Monopoly with Incomplete Information,” Rand Journal of
Economics, 15, 171—196.
Mussa, M., and S. Rosen (1978): “Monopoly and Product Quality,”Journal of Economic Theory,
18, 301—317.
Nahata, B., K. Ostaszewski, and P. Sahoo (1990): “Direction of Price Changes in Third-Degree
Price Discrimination,”American Economic Review, 80, 1254—1258.

46
Pigou, A. (1920): The Economics of Welfare. Macmillan, London.
Robinson, J. (1933): The Economics of Imperfect Competition. Macmillan, London.
Schmalensee, R. (1981): “Output and Welfare Implications of Monopolistic Third-Degree Price
Discrimination,”American Economic Review, 71, 242—247.
Simon, B. (2011): Convexity: An Analytic Viewpoint. Cambridge University Press.
Varian, H. (1985): “Price Discrimination and Social Welfare,”American Economic Review, 75,
870—875.

47
8 Supplemental Online Appendix
This Appendix provides a formal analysis of the examples of Section 5. The monopolist is selling to a
market that consists of three types of consumers with valuations vk = k for k ∈ {1, 2, 3}. As before,xk is the mass of consumers with valuation vk, and
∑3k=1 xk = 1. Type k’s utility from q ∈ [0, 1]
units of the good is:
vkq + εq (1− q) .
The monopolist offers a menu of quantity-price pairs, and we will solve three screening problems in
this framework. The first considers what happens when the monopolist is restricted to choosing one
of the three discrete output levels in{
0, 12, 1}. For this model, we will characterize the decomposition
of the simplex into regions in which particular menus are optimal. For the second specification, we
reduce the model to two valuations by imposing x3 = 0. For this version of the problem, we will
characterize the limits of welfare outcomes that can arise under segmentation. The third specification
again has two valuations, but now the monopolist is allowed to choose any output q ∈ [0, 1]. For
this specification, we again derive the surplus pairs that can arise under some segmentation of the
market.
8.1 Finite Set of Allocations
We first consider a model in which the monopolist must choose q ∈{
0, 12, 1}. Optimal incentive
compatible menus can be identified with monotonic allocations (q1, q2, q3) that specify the quantity
sold to each type. In this setting, the usual "no distortion at the top" condition holds, so that q3 = 1
in any optimal allocation. The corresponding transfers are pinned down by a binding individual
rationality constraint for the low type, and binding downward incentive constraints for the higher
types.
The following table lists the monotonic allocations that have no distortion at the top, and the
corresponding transfers, expected profits, and expected consumer surpluses:

48
(q1, q2, q3) p1 p2 p3 π u
(1, 1, 1) 1 1 1 1 x2 + 2x3(12, 1, 1
)12
+ ε4
32
32
(12
+ ε4
)x1 + 3
2(x2 + x3)
12x2 + 3
2x3
(0, 1, 1) 0 2 2 2 (x2 + x3) x3(0, 1
2, 1)
0 1 + ε4
52
(1 + ε
4
)x2 + 5
2x3
12x3
(0, 0, 1) 0 0 3 3x3 0(12, 12, 1)
12
+ ε4
12
+ ε4
2(12
+ ε4
)(x1 + x2) + 2x3
12x2 + x3
The six menus give rise to fifteen linear inequalities defining the markets in which one contract
generates greater expected profit than the other. The following tabulates all of the inequalities, and
reports the extreme points of the simplex that lie along the boundary of each region:
(q1, q2, q3)� (q′1, q′2, q′3) Region Extreme points
(1, 1, 1)�(12, 1, 1
)1 ≥
(12
+ ε4
)x1+
32
(x2 + x3){(
24−ε ,
2−ε4−ε , 0
),(24−ε , 0,
2−ε4−ε)}
(1, 1, 1)� (0, 1, 1) 1 ≥ 2 (x2 + x3){(
12, 12, 0),(12, 0, 1
2
)}(1, 1, 1)�
(0, 1
2, 1)
1 ≥(1 + ε
4
)x2+
52x3
{(ε4+ε
, 44+ε
, 0),(35, 0, 2
5
)}(1, 1, 1)� (0, 0, 1) 1 ≥ 3x3
{(23, 0, 1
3
),(0, 2
3, 13
)}(1, 1, 1)�
(12, 12, 1)
1 ≥(12
+ ε4
)(x1 + x2) +2x3
{(46−ε , 0,
2−ε6−ε),(0, 4
6−ε ,2−ε6−ε)}(
12, 1, 1
)� (0, 1, 1)
(12
+ ε4
)x1+
32
(x2 + x3)≥ 2 (x2 + x3){(
24+ε
, 2+ε4+ε
, 0),(24+ε
, 0, 2+ε4+ε
)}(12, 1, 1
)�(0, 1
2, 1) (
12
+ ε4
)x1+
32
(x2 + x3)≥(1 + ε
4
)x2+
52x3
{(46+ε
, 0, 2+ε6+ε
),(0, 4
6−ε ,2−ε6−ε)}(
12, 1, 1
)� (0, 0, 1)
(12
+ ε4
)x1+
32
(x2 + x3)≥ 3x3{(
68+ε
, 0, 2+ε8+ε
),(0, 1
2, 12
)}(12, 1, 1
)�(12, 12, 1) (
12
+ ε4
)x1+
32
(x2 + x3)≥(12
+ ε4
)(x1 + x2) +2x3
{(1, 0, 0) ,
(0, 2
6−ε ,4−ε6−ε)}
(0, 1, 1)�(0, 1
2, 1)
2 (x2 + x3)≥(1 + ε
4
)x2+
52x3
{(1, 0, 0) ,
(0, 2
6−ε ,4−ε6−ε)}
(0, 1, 1)� (0, 0, 1) 2 (x2 + x3)≥ 3x3{
(1, 0, 0) ,(0, 1
3, 23
)}(0, 1, 1)�
(12, 12, 1)
2 (x2 + x3)≥(12
+ ε4
)(x1 + x2) +2x3
{(34− ε
8, 14
+ ε8, 0), (0, 0, 1)
}(0, 1
2, 1)� (0, 0, 1)
(1 + ε
4
)x2+
52x3≥ 3x3
{(1, 0, 0) ,
(0, 2
6+ε, 4+ε6+ε
)}(0, 1
2, 1)�(12, 12, 1) (
1 + ε4
)x2+
52x3≥
(12
+ ε4
)(x1 + x2) +2x3
{(24+ε
, 2+ε4+ε
, 0),(24+ε
, 0, 2+ε4+ε
)}(0, 0, 1)�
(12, 12, 1)
3x3≥(12
+ ε4
)(x1 + x2) +2x3
{(46+ε
, 0, 2+ε6+ε
),(0, 4
6+ε, 2+ε6+ε
)}These boundaries are depicted visually in Figure 12 for ε = 0.6. The simplex is shaded to indicate
regions in which a given menu is optimal, which is the intersection of all of the regions in which that
menu is pairwise superior to other menus. We can readily see from Figure 12 that there are exactly
twelve extremal markets, which are extreme points in which a given menu is optimal. The resulting

49
regions where each one of the menus is optimal but without the pairwise boundaries are displayed in
the text in Figure 7.
Figure 12: (Pairwise) Optimal Menus in the Probability Simplex
First, there are the three degenerate markets which have a single valuation in the support. Next,
there are six extremal markets that have a support of two valuations, which are as follows:
suppx Optimal menus Market
{1, 2}{
(0, 1, 1) ,(12, 1, 1
)} (24+ε
, 2+ε4+ε
0)
{1, 2}{(
12, 1, 1
), (1, 1, 1)
} (24−ε ,
2−ε4−ε , 0
){2, 3}
{(0, 0, 1) ,
(0, 1
2, 1)} (
0, 26+ε
, 4+ε6+ε
){2, 3}
{(0, 1
2, 1), (0, 1, 1)
} (0, 2
6−ε ,4−ε6−ε)
{1, 3}{
(0, 0, 1) ,(12, 12, 1)} (
46+ε
, 0, 2+ε6+ε
){1, 3}
{(12, 12, 1), (1, 1, 1)
} (46−ε , 0,
2−ε6−ε)

50
Finally, there are three extreme points with full support, suppx = {1, 2, 3} :
Optimal menus Market{(1, 1, 1) ,
(12, 12, 1),(12, 1, 1
)} (48−ε ,
4(4−ε)(12−ε)(8−ε) ,
4−ε12−ε
){
(0, 0, 1) ,(0, 1
2, 1),(12, 12, 1)} (
24+ε
, 2(2+ε)(6+ε)(4+ε)
, 2+ε6+ε
){
(0, 1, 1) ,(0, 1
2, 1),(12, 12, 1),(12, 1, 1
)} (48+ε
, 4(4+ε)(12−ε)(8+ε) ,
(8−ε)(4+ε)(12−ε)(8+ε)
)8.2 Binary Types
We now calculate the surplus set for the model of the previous subsection when x1 = x2 = 12and
x3 = 0. With binary types it is suffi cient to identify the probability of the low type, and so we set
x1 , x, and x2 , 1− x. The menus can now be represented as:
(q1, q2) p1 p2 π u
(1, 1) 1 1 1 1− x(12, 1)
12
+ ε4
32
(12
+ ε4
)x+ 3
2(1− x) 1
2(1− x)
(0, 1) 0 2 2 (1− x) 0
Note that the menu(12, 1)is optimal in the aggregate market x∗ =
(12, 12
), and yields a profit of
π∗ = 1 + ε8. There are three extremal markets for the simplex of markets consisting of types 1 and
2, which are:
Optimal menus x
(1, 1) 1{(1, 1) ,
(12, 1)}
24−ε{(
12, 1), (0, 1)
}24+ε
(0, 1) 0
Let x =(24−ε ,
2−ε4−ε)and let x =
(24+ε
, 2+ε4+ε
). We will consider surplus pairs that can be derived
from extremal segmentations. Note that within each region where a given menu is optimal, consumer
and producer surplus are both linear functions of the proportion x of low valuation types. Hence,
to maximize any weighted sum of u and π, it is always optimal to segment using extremal markets.
Moreover, we know from the concavification argument that it is without loss of generality to consider
segmentations that have only two segments. There are five extreme points of the surplus set, as
derived below.
The only profit preserving extremal segmentation uses the extremal markets x and x, since these
are the only extremal markets for which the monopolist is indifferent to the uniform monopoly menu.

51
The weight on x can be derived from:
1
2= σ (x)
2
4− ε + (1− σ (x))2
4 + ε⇔ σ (x) =
4 + ε
8.
Any optimal menu choice by the monopolist will preserve profits of π∗. Among optimal menus,
consumer surplus is maximized by offering menu (1, 1) in market x and by offering menu(12, 1)in
market x. Consumer surplus is minimized by offering menu(12, 1)in market x and offering (0, 1) in
market x. Thus, this segmentation gives rise to the extreme points:(4 + ε
8
1
2
2− ε4− ε, 1 +
ε
8
),
(4 + ε
8
2− ε4− ε +
4− ε8
1
2
2 + ε
4 + ε, 1 +
ε
8
).
There are two binary extremal segmentations which can facilitate an effi cient welfare outcome.
The first is perfect price discrimination, i.e., segmentation into x{1} and x{2}, which yields the surplus
pair: (0,
3
2
).
To attain effi ciency, the monopolist must be indifferent to offering (1, 1) in any market such that
x1 > 0. The only other segmentation with this property has segments x and x{2}. The weight on x
must satisfy:1
2= σ (x)
2
4− ε ⇔ σ (x) =4− ε
4.
If the monopolist offers (1, 1) at x, we obtain the effi cient surplus point:(1
2− ε
4, 1 +
ε
4
).
This being one of only two welfare points that we can generate on the effi cient frontier, it must be an
extreme point of the surplus set. On the other hand, if the monopolist offers(12, 1)at x, we obtain
the point: (1
4− ε
8, 1 +
ε
4
).
Now, as ε becomes small, this consumer surplus converges to 14, whereas the minimum consumer
surplus at the uniform menu profit converges to 18. As a result, it is impossible that this is an
extreme point of the surplus set for ε suffi ciently small.
To attain consumer surplus of zero, the monopolist must be indifferent to offering (0, 1) whenever
x2 > 0. Hence, there is one binary extremal segmentation (aside from perfect discrimination) which
can facilitate consumer surplus of zero, namely segmenting into x{1} and x. The weight on x must
satisfy:1
2= σ (x)
2 + ε
4 + ε⇔ σ (x) =
4 + ε
4 + 2ε.

52
If the monopolist offers the menu (0, 1) at x, we obtain the point:(0, 1 +
ε
4 + 2ε
).
Since this is one of only two possible welfare points that we can generate using binary extremal
segmentations where consumer surplus is zero, it must be an extreme point of the surplus set. On
the other hand, if the monopolist offers the menu(12, 1)at x, we obtain the welfare outcome:(
1
4, 1 +
ε
4 + 2ε
).
This consumer surplus is less than the maximum amount we can generate on the effi cient frontier,
which approaches 12as ε → 0, as well as less than the maximum we can generate at uniform menu
profit, which approaches 38. Hence, for ε suffi ciently small, this welfare point cannot be extreme
either.
We conclude that the four binary extremal segmentations generate precisely five extreme welfare
points, for ε suffi ciently small, which are given by:(4 + ε
8
1
2
2− ε4− ε, 1 +
ε
8
),
(4 + ε
8
2− ε4− ε +
4− ε8
1
2
2 + ε
4 + ε, 1 +
ε
8
),(
0,3
2
),
(1
2− ε
4, 1 +
ε
4
),
(0, 1 +
ε
4 + 2ε
),
and illustrated in Figure 9.
8.3 A Continuum of Allocations
Now consider the model with q ∈ [0, 1] and vk ∈ {1, 2}. Optimal menus have q2 = 1, and thus we
define the quantity of low type for simplicity as q1 , q, and as individual rationality binds for the
low type, so p1 = q + εq (1− q). The benefit of the high type from pretending to be the low type is
thus:
2q + εq (1− q)− p1 = q.
Since the high type has a binding incentive constraint, his payment is simply p2 = 2− q. When thereis a proportion x1 , x of low types, profits when allocating q to the low type are:
(q + εq (1− q))x+ (2− q) (1− x) .
Differentiating with respect to q, the first order condition is:
0 = (1 + ε (1− 2q))x− (1− x)⇔ q (x) =1
2− 1− 2x
2εx.

53
If this number is in [0, 1], then the optimal menu sells this quantity to the low type. If it is negative,
for which the condition is:1
2≤ 1− 2x
2εx⇔ x ≤ 1
2 + ε,
then since profits are concave in q, it is optimal to exclude the low type with an allocation of q = 0.
Note that when x < 12, excluding the low type also yields a strictly higher payoff than pooling.
Similarly, if the solution to the first-order condition is greater than 1, for which the condition is:
−1
2≥ 1− 2x
2εx⇔ x ≥ 1
2− ε,
then it is optimal to pool the high type and the low type at the effi cient output. Note that when
x > 12, pooling yields strictly higher profit than exclusion. Hence, output is:
q (x) =
0, if 0 ≤ x < 1
2+ε;
12− 1−2x
2εx, if 1
2+ε≤ x < 1
2−ε ;
1, if 12−ε ≤ x ≤ 1.
Producer surplus is given by
π (x) = q (x) (1 + ε (1− q (x)))x+ (2− q (x)) (1− x) ;
and consumer surplus is given:
u (x) = (1− x) q (x) ,
and illustrated in Figure 10.
We will solve for the surplus set when the aggregate market is x∗ = 12. We can write:
wλ (x) , λπ (x) + u (x)
for λ ∈ R. The support function of the surplus set at a given direction (1, λ) is given by the
concavification of wλ (x) at x∗. Similarly, the support function at directions (−1,−λ) is given by the
concavification of −wλ (x) at x∗.
Eastern frontier The concavification of wλ at x∗ falls into four "regimes", defined relative to three
cutoff values of λ which are λ < λ < λ. We depict examples for each of these regimes in Figure 13.
For each of four values of λ, we plot scaled producer surplus, consumer surplus, the sum, as well
as their respective concavifications. The plots are scaled to show the relative magnitudes of λπ and
u, with λ decreasing as we progress downwards through the figure. For λ extremely large, i.e., in

54
Figure 13: Examples for the concavification along the eastern frontier.
λ ∈(λ,∞
), we are close to maximizing π. This is accomplished by perfect price discrimination, i.e.,
with x = 0 and x = 1, as depicted in the top row of Figure 13. For this range of λ, the extreme point
of the welfare set is the effi cient point where u = 0, i.e., the northernmost point in Figure 11.
As λ decreases, consumer surplus becomes more important, and the concavification of wλ comes
closer to the line segment between x = 12−ε and x = 1, where both u and π are linear. At a critical
value λ, the two coincide, in particular when:
1
2− εwλ (1) +
(1− 1
2− ε
)wλ (0) = wλ
(1
2− ε
).
The solution to this equation is given by λ = 1. At this point, the concavification at x = 12becomes
the line segment connecting (0, wλ (0)) and(12−ε , wλ
(12−ε)). In other words, for the next range of
directions, it is optimal to segment between markets with x = 0 and x = 12−ε . This case is depicted in
the second row of Figure 13, where λ = 34. Note that as λ decreases, this corresponds to the direction
we are maximizing in rotating clockwise from due north. At some point, the optimum switches from
the northernmost point to the easternmost point on the effi cient frontier in Figure 11.
As λ decreases further towards zero, wλ (0) = 2λ falls relative to wλ in[12+ε
, 12−ε]. Eventually, the
tangent between (0, wλ (0)) and the graph of wλ moves from being at 12−ε to a point in
[12, 12−ε]. The

55
tangent just moves to the left of 12−ε when:
1
2− ε limx↑ 1
2−ε
w′λ (x) =
(wλ
(1
2− ε
)− wλ (0)
).
The solution is:
λ =3
2− 1
2ε.
In this regime, the concavification at x = 12is given by the line connecting (0, wλ (0)) and
(x (λ) , wλ (x (λ))), where x (λ) solves:
xw′λ (x) = wλ (x)− wλ (0)⇔ x (λ) =2− λ
3 + ε (1− λ)− 2λ.
This is the case in the third row of Figure 13, where λ = 14. For λ in this range, we trace out the
curved portion of the eastern-southeastern frontier of Figure 11.The final cutoff λ is the solution to:
1
2w′λ
(1
2
)= wλ
(1
2
)− wλ (0)⇔ λ = 1− 1
ε.
It is at this point that the tangent point from (0, wλ (0)) to the graph of wλ moves to the left of 12 ,
so that the concavification of wλ at x = 12is just wλ
(12
), which is true for all λ ∈ (−∞, λ). In this
range, the weight on minimizing producer surplus is so large that the solution is no segmentation,
as in the bottom row of Figure 13. For this values, the direction (1, λ) points southerly enough that
the optimum is no information, i.e., the southern corner of Figure 11.
Western frontier For the western frontier, we find the concavification of −wλ (x) at x = 12for
λ ∈ R. As before, there are four regimes, and we depict examples in Figure 14. For λ suffi cientlylarge, again we are close to minimizing π, and no segmentation is optimal, as in the top row. Note
that large λ corresponds to maximizing a direction (−1,−λ) close to due south, so again we are at
the southern corner of Figure 11.
As λ decreases, u becomes relatively larger compared to π, and eventually the concavification at
x = 12switches to the tangent line between (1, wλ (1)) = (1, λ) and the graph of wλ (x). Let x (λ)
again denote the point of tangency, which solves:
(1− x)w′λ (x) = 2λ− wλ (x) =⇒ x (λ) = 1/
(1−
√(1− ε (6− ε))λ (λ− 2)
λ− 2
).
The critical λ occurs when x (λ) = 12, which is:
λ =2
ε (6− ε) .

56
Figure 14: Examples for the concavification along the western frontier.
As λ increases above λ, x (λ) decreases from 12until it eventually hits 1
2+ε. The critical λ is:
λ =(1 + ε)2
4ε.
For λ ∈[λ, λ]the solution is to segment using markets x (λ) and x = 1, as in the second row of
Figure 14. Thus, in Figure 11, there is in fact a subtle curve to the southwestern frontier as x (λ)
moves smoothly from 12to 1
2+ε. At λ, the regime changes to segmenting between x = 1
2+εand x = 1,
as in the third row of Figure 14. This generates the southernmost point along the western frontier
where u = 0. This continues until we hit λ at which:
wλ
(1
2 + ε
)=
1
2 + εwλ (1) +
(1− 1
2 + ε
)wλ (0) ,
which occurs precisely at λ = 0, when we are minimizing consumer surplus. Finally, for λ ∈(λ,∞
),
when we have negative weight on consumer surplus and a non-negative weight on producer surplus,
the optimum is again perfect price discrimination, and we are back to the northernmost corner of
Figure 11.