the legislative council complex greenhouse gas ......the legislative council complex greenhouse gas...
TRANSCRIPT
The Legislative Council Complex
Greenhouse Gas Accounting Report
For the Period 1 April 2017 - 31 March 2018
Carbon Care Asia Ltd.
www.carboncareasia.com

The Legislative Council Complex Greenhouse Gas Accounting Report 2017-2018
August 2018
Table of Contents 1. EXECUTIVE SUMMARY .............................................................................................................. 1
1.1 Key findings from the GHG accounting project ....................................................................... 1
1.2 Recommendations on carbon reduction and information management ........................................... 1
2. BACKGROUND ............................................................................................................................ 3
2.1 Name of the reporting entity ................................................................................................ 3
2.2 Description of the reporting entity ......................................................................................... 3
2.3 Reporting period ............................................................................................................... 3
2.4 Scope of physical boundary .................................................................................................. 3
2.5 Scope of operational boundary ............................................................................................. 4
2.6 Methodologies for quantifying GHG emissions ....................................................................... 4
2.7 Contact person of the reporting entity .................................................................................... 7
2.8 References ........................................................................................................................ 7
3. GHG EMISSIONS DATA .............................................................................................................. 9
3.1 Information on GHG emissions and removals ........................................................................ 9
3.2 Total and breakdown of the GHG emissions ......................................................................... 9
3.3 Data collection ............................................................................................................... 11
3.4 Data analysis ................................................................................................................ 12
3.5 Activity data comparison .................................................................................................. 18
3.6 Implementation of the GHG emission reduction measures ....................................................... 19
4. DISCUSSION AND RECOMMENDATIONS ............................................................................ 21
4.1 Discussion ..................................................................................................................... 21
4.2 Recommendations ........................................................................................................... 23
APPENDIX 1: SUMMARY OF ACTIVITY DATA ............................................................................. 27
APPENDIX 2: CONVERSION FACTORS ......................................................................................... 28
APPENDIX 3: DETAILED CALCULATION WORKSHEETS FOR GHG EMISSIONS ................ 30
APPENDIX 4: GHG EMISSIONS SUMMARY IN THE BASE YEAR .............................................. 38

The Legislative Council Complex Greenhouse Gas Accounting Report 2017-2018
August 2018 Page 1
1. EXECUTIVE SUMMARY
1.1 Key findings from the GHG accounting project
i. The reported greenhouse gas (GHG) emissions of the Legislative Council (the LegCo)
Complex (the Complex) during the period from 1 April 2017 to 31 March 2018 totaled
8,363.30 tonnes CO2 equivalent (CO2-e), with Scope 2 emissions contributing to 97.10%
through purchased energy. Scope 1 direct GHG emissions which include fuel
combustions by vehicles, generators, Towngas equipment and fugitive emissions from
refrigerant and fire suppression system made up 1.75% while Scope 3 other indirect
emissions, including fresh water processing, sewage processing, waste paper and
general waste sent to landfill, accounted for 1.14% of reported emissions.
ii. The GHG emission intensity of the Complex was calculated at 158.60 kg CO2-e/m2,
based on the included construction floor area at 52,731 m2, and 9.65 tonnes CO2-
e/person based on 867 building users.
iii. Absolute GHG emissions showed a 1.46% increase compared with the base year (1
April 2013 - 31 March 2014), and a 2.07% increase compared with the previous year
(1 April 2016 - 31 March 2017). The GHG performance in terms of construction floor
area presented a 0.63% increase compared with the base year, as well as an increase at
2.07% compared with the previous year.
iv. Scope 1 and Scope 2 GHG emissions increased by 0.21% and 2.22% respectively,
while Scope 3 presented a 37.16% decrement compared with the base year. The
decrease in Scope 3 GHG emissions was mainly due to the reduction of waste paper
disposal at landfill.
v. Electricity consumption is the most significant source of Scope 2 GHG emissions.
One of the main reasons for the increment in electricity consumption was that
compared to 2016, the number of hours of Council meetings and committee meetings
in 2017 increased by 58 and 310, representing an increase of 12.31% and 25.83%
respectively. Another possible reason was that hotter weather during the summer of
2017 led to greater use of air-conditioning and hence higher electricity consumption
compared to 2016.
1.2 Recommendations on carbon reduction and information management
i. The application of automated air conditioning control systems in the Complex is
recommended, which can reduce redundant energy use by turning off the air
conditioners when no occupants are using the facilities.
ii. A feasibility study on the application of anti-UV films on windows for reduced
excessive heat gain through windows, increased comfort and energy saving can be
carried out.
iii. It is recommended that checks and maintenance of lifts shall be conducted and the
conventional lifts be replaced with lifts equipped with regenerative power features as
The Legislative Council Complex Greenhouse Gas Accounting Report 2017-2018
August 2018 Page 2
the latter can capture and condition the regenerated electricity for feeding directly into
power grid for immediate consumption by the Complex.
iv. Installing more solar panels on available open space is also recommended.
v. Waste audit for the Complex to facilitate the review of different waste streams
produced from the Complex and formulation of waste reduction measures.
vi. Carbon Road Map: It is recommended that the Commission engage different
stakeholders to develop its reduction targets in the short, medium and long term based
on a review of internal capacity and current performance.
vii. Communication and engagement: The Complex is the center of public attention. It
can play a leadership role in championing the cause of combating climate change in
carbon management.
- Engaging suppliers: The Commission may also lead and influence its service
providers to take actions for the environment, which could provide strong support
to the Commission for introducing more innovative and efficient carbon reduction
measures;
- Engaging employees and users: More engagement exercises, such as incentive
programmes, Green Day Events and carbon reduction competitions would
encourage greater stakeholder involvement.
The Legislative Council Complex Greenhouse Gas Accounting Report 2017-2018
August 2018 Page 3
2. BACKGROUND
2.1 Name of the reporting entity
The Legislative Council Commission (the Commission)
2.2 Description of the reporting entity
The Commission is a statutory body established under The Legislative Council
Commission Ordinance (Cap. 443).
2.3 Reporting period
1 April 2017 - 31 March 20181, and this is the fifth consecutive GHG reporting period for
the Legislative Council Complex (the Complex).
2.4 Scope of physical boundary
(a) Location of the building
1 Legislative Council Road, Central, Hong Kong
(b) Description of the purpose of the building
The Complex is the first purpose-built building to house the Legislature of Hong
Kong.
(c) Description of physical boundary with detailed information
The GHG accounting is compiled from an assessment of facilities under operational
control as qualified by the Commission. The construction floor area of the Complex
is 52,955 m2 in the reporting period, comprising the Council Block, the Office Block,
and the adjacent open space area, namely, the LegCo Square and the LegCo Garden.
The Cafeteria, with an area of 224 m2, is operated by an outsourced contractor. The
Complex, one of the buildings of the Tamar Development Project, has achieved the
Platinum rating under the Hong Kong Building Environment Assessment Method
(HK-BEAM).
(d) Description of areas excluded from the GHG accounting
The contractor’s operation of the Cafeteria (floor area: 224 m2) is not under control
of the Commission and therefore the Cafeteria is excluded from this GHG
1 1 April 2013 – 31 March 2014 has been set as the base year for the Legislative Council Complex’s GHG accounting in order to compare the GHG emissions over time.

The Legislative Council Complex Greenhouse Gas Accounting Report 2017-2018
August 2018 Page 4
accounting report. The total floor area of the Complex covered by the GHG
accounting is 52,731 m2.
2.5 Scope of operational boundary
(a) Scope 1 - Direct GHG emissions from:
Combustion of fuels in stationary sources – diesel used in electricity generators
Combustion of fuels in stationary sources – Towngas used in boilers and room kit
Combustion of fuels in mobile sources – petrol used in vehicles owned by the
Commission
Unintentional GHG release from equipment and system (fugitive emissions from
fire suppression system and refrigeration/air conditioning equipment)
(b) Scope 2 - Energy indirect GHG emissions from:
Electricity purchased from The Hongkong Electric Company Limited
Towngas purchased from The Hong Kong and China Gas Company Limited
(c) Scope 3 - Other indirect GHG emissions from:
Methane gas generation at landfill in Hong Kong due to disposal of paper waste
GHG emissions due to electricity used for fresh water processing by Water Supplies
Department (WSD)
GHG emission due to electricity used for sewage processing by Drainage Services
Department (DSD)
Methane gas generation at landfill in Hong Kong due to general waste disposal
2.6 Methodologies for quantifying GHG emissions
The accounting process follows the “Guidelines to Account for and Report on Greenhouse Gas
Emissions and Removals for Buildings (Commercial, Residential or Institutional Purposes) in Hong Kong
(2010)” (EPD-EMSD Guidelines) in data collection, classification of emission source,
quantification methods and the reporting format. The GHG emissions are quantified in
terms of CO2-e, and the types of GHG covered in this report are: carbon dioxide (CO2),
methane (CH4), nitrous oxide (N2O), hydrofluoro-carbons (HFCs), perfluoro-carbons
(PFCs) and sulphur hexafluoride (SF6).
(a) List of activities where simplified methodologies and conversion factors in the
Guidelines are used for quantification:
Direct emissions from stationary combustion (Scope 1)
Emission (CO2) = Σ Amount of fuel consumed × Emission factor of CO2
The Legislative Council Complex Greenhouse Gas Accounting Report 2017-2018
August 2018 Page 5
Emission (CH4 / N2O) =Σ Amount of fuel consumed × Emission factor of (CH4
/ N2O) × Relative Global Warming Potential (GWP)
where
Emission is summed over all types of fuel used by all generators and Towngas
consuming devices; and
Amount of diesel consumed is in terms of litre and amount of Towngas
consumed is in terms of unit.
Direct emissions from mobile combustion (Scope 1)
Emission (CO2) = Σ Amount of fuel consumed × Emission factor of CO2
Emission (CH4 / N2O) =Σ Amount of fuel consumed × Emission factor of (CH4
/ N2O) × GWP
where
Emission is summed over petrol used by all vehicles owned by the Commission;
and
Amount of fuel consumed is in terms of litre.
Indirect emissions from electricity / Towngas purchased (Scope 2)
Emission (CO2-e) = Quantity of purchased electricity / Towngas × Emission
factor
where
Purchased electricity is measured in kilowatt-hours (kWh); and
Purchased Towngas is measured in unit.
Other indirect emissions due to electricity used for processing fresh water by
WSD (Scope 3)
Emission (CO2-e) = Quantity of fresh water consumed × Emission factor
where
Water consumed is measured in cubic metre (m3).
Other indirect emissions due to electricity used for processing sewage water by
DSD (Scope 3)
Emission (CO2-e) = Quantity of sewage discharged × Emission factor
where
Sewage discharged is measured in cubic metre (m3).
Other indirect emissions from paper disposed at landfills (Scope 3)
In order to simplify the calculations, the default emission factor assumes that the
total raw amount of CH4 emitted throughout the entire decomposition process of
the paper waste disposed at landfills will go into the atmosphere within the same
reporting period when the paper waste is collected.
Emission (CO2-e) = (Ps + Pi – Pr – Pe) × Emission factor (estimated at 4.8 kg
CO2-e/kg)
where
Ps = Paper inventory at the beginning of the reporting period (in storage) (kg)
The Legislative Council Complex Greenhouse Gas Accounting Report 2017-2018
August 2018 Page 6
Pi = Paper added to the inventory during the reporting period (kg)
Pr = Paper collected for recycling purpose (kg)
Pe = Paper inventory at the end of the reporting period (in storage) (kg)
(b) Details (including necessary reference) of other methodologies and conversion
factors used for quantification:
Fugitive emissions from fire suppression system – portable extinguishers (Scope 1)
“2006 IPCC Guidelines for National Greenhouse Gas Inventories” 2 is referred, as below:
Emissions (CO2-e) = Σ Amount of extinguishing agent leakage × GWP of
extinguishing agent
where
Amount of extinguishing agent leakage = Amount of extinguishing agent × leakage
rate
The IPCC default leakage rate is 4% ± 2% and midpoint of the interval, 4%, is
adopted.
Fugitive emissions from fire suppression system – FM 200 system (Scope 1)
“2006 IPCC Guidelines for National Greenhouse Gas Inventories” is referred, as below:
Emissions (CO2-e) = Σ Amount of HFC-227ea3 leakage × GWP HFC-227ea
where
Amount of extinguishing agent leakage = Amount of HFC-227ea × leakage rate
The IPCC default leakage rate is 2% ± 1%. Considering the periodical pressure
tests conducted during the reporting period, the lower value 1% is selected.
Fugitive emissions from refrigeration / air conditioning systems – refrigerators /
air conditioning equipment (Scope 1)
“2006 IPCC Guidelines for National Greenhouse Gas Inventories” is referred, as below:
Emissions (CO2-e) = Σ Amount of refrigerant leakage × GWP of refrigerant
where
Amount of refrigerant leakage = Amount of refrigerant charge × operation
emission factor
The IPCC default operation emission factor for domestic refrigeration is 0.1% -
0.5% of initial charge per year and for chiller is 2% - 15% of initial charge per year.
The lower end of the emission factors is intended to specify the status in developed
region, thus, 0.1% and 2% are selected accordingly.
Other indirect GHG emissions from general waste disposal (Scope 3)
“The Guidelines of Carbon Audit Toolkit for Small and Medium Enterprises in Hong Kong”
is referred, as below:
2 Source: http://www.ipcc-nggip.iges.or.jp/public/2006gl/pdf/3_Volume3/V3_7_Ch7_ODS_Substitutes.pdf 3 HFC-227ea is the fire suppression agent used in FM 200 system.
The Legislative Council Complex Greenhouse Gas Accounting Report 2017-2018
August 2018 Page 7
The general waste sent to landfill will be decomposed through anaerobic digestion
and CH4 will be emitted. Estimating that anaerobic digestion of one kg of the
general waste is equivalent to 1.5 kg CO2-e, then
Emission (CO2-e) =Amount of general waste disposal × Emission factor
(estimated at 1.5 kg CO2-e/kg).
(c) Details of any changes in methodologies and conversion factors since the last
GHG report by the reporting entity:
The GHG Emission Factor of Towngas purchased within Scope 2 has been
revised from 0.599 kg CO2-e/unit (2016) to 0.592 kg CO2-e/unit (2017) according
to the “Towngas Sustainability Report 2017”.
The GHG Emission Factor for Sewage Processing by DSD within Scope 3 has
been revised from 0.190 kg CO2-e/m3 (2016) to 0.202 kg CO2-e/m3 (2017)
according to the recent “DSD Sustainability Report 2016-2017”.
The GHG Emission Factor for Fresh Water Processing by WSD within Scope 3
has been revised from 0.402 kg CO2-e/m³ (2016) to 0.403 kg CO2-e/m³ (2017)
according to the recent “WSD Annual Report 2016/17”
(d) Details on any re-calculation of previously reported emissions and removals
because of changes in methodologies and conversion factors
Not applicable.
2.7 Contact person of the reporting entity
The Administration Division, Legislative Council Secretariat (the Secretariat)
2.8 References
The following guidelines are taken as references in this Report:
“Guidelines to Account for and Report on Greenhouse Gas Emissions and Removals for Buildings
(Commercial, Residential or Institutional Purposes) in Hong Kong (2010)”. Environmental
Protection Department and Electrical and Mechanical Services Department of the
Government of the Hong Kong Special Administrative Region
“ISO14064-1 (2006): International Standard on Greenhouse Gases - Part 1: Specification with
guidance at the organization level for quantification and reporting of greenhouse gas emissions and
removals”, ISO
The Legislative Council Complex Greenhouse Gas Accounting Report 2017-2018
August 2018 Page 8
“2006 IPCC Guidelines for National Greenhouse Gas Inventories - Chapter 7: Emissions of
Fluorinated Substitutes for Ozone Depleting Substances”, IPCC
“Carbon Audit Toolkit for Small and Medium Enterprises in Hong Kong (2010)”, published in
February 2010 by The University of Hong Kong
Other references, where appropriate (e.g. emission factors), have also been taken into
consideration and are quoted in corresponding sections of this report.
The Legislative Council Complex Greenhouse Gas Accounting Report 2017-2018
August 2018 Page 9
3. GHG EMISSIONS DATA
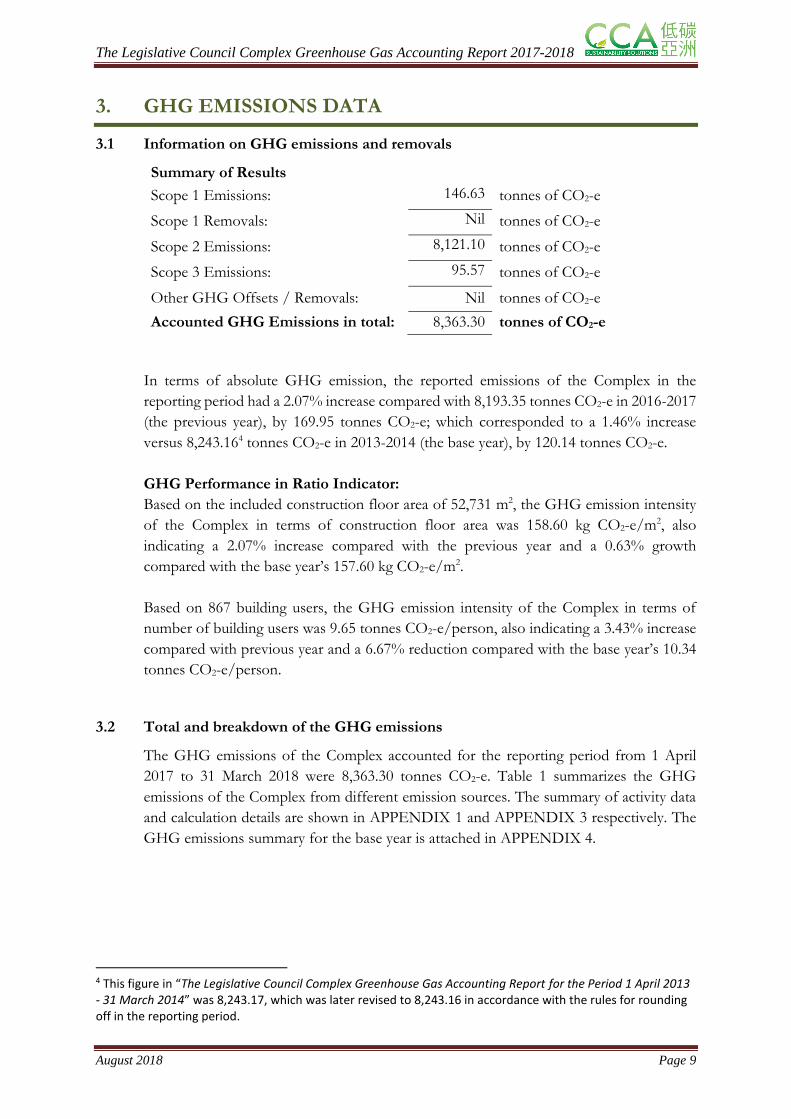
3.1 Information on GHG emissions and removals
Summary of Results
Scope 1 Emissions: 146.63 tonnes of CO2-e
Scope 1 Removals: Nil tonnes of CO2-e
Scope 2 Emissions: 8,121.10 tonnes of CO2-e
Scope 3 Emissions: 95.57 tonnes of CO2-e
Other GHG Offsets / Removals: Nil tonnes of CO2-e
Accounted GHG Emissions in total: 8,363.30 tonnes of CO2-e
In terms of absolute GHG emission, the reported emissions of the Complex in the
reporting period had a 2.07% increase compared with 8,193.35 tonnes CO2-e in 2016-2017
(the previous year), by 169.95 tonnes CO2-e; which corresponded to a 1.46% increase
versus 8,243.164 tonnes CO2-e in 2013-2014 (the base year), by 120.14 tonnes CO2-e.
GHG Performance in Ratio Indicator:
Based on the included construction floor area of 52,731 m2, the GHG emission intensity
of the Complex in terms of construction floor area was 158.60 kg CO2-e/m2, also
indicating a 2.07% increase compared with the previous year and a 0.63% growth
compared with the base year’s 157.60 kg CO2-e/m2.
Based on 867 building users, the GHG emission intensity of the Complex in terms of
number of building users was 9.65 tonnes CO2-e/person, also indicating a 3.43% increase
compared with previous year and a 6.67% reduction compared with the base year’s 10.34
tonnes CO2-e/person.
3.2 Total and breakdown of the GHG emissions
The GHG emissions of the Complex accounted for the reporting period from 1 April
2017 to 31 March 2018 were 8,363.30 tonnes CO2-e. Table 1 summarizes the GHG
emissions of the Complex from different emission sources. The summary of activity data
and calculation details are shown in APPENDIX 1 and APPENDIX 3 respectively. The
GHG emissions summary for the base year is attached in APPENDIX 4.
4 This figure in “The Legislative Council Complex Greenhouse Gas Accounting Report for the Period 1 April 2013 - 31 March 2014” was 8,243.17, which was later revised to 8,243.16 in accordance with the rules for rounding off in the reporting period.
The Legislative Council Complex Greenhouse Gas Accounting Report 2017-2018
August 2018 Page 10
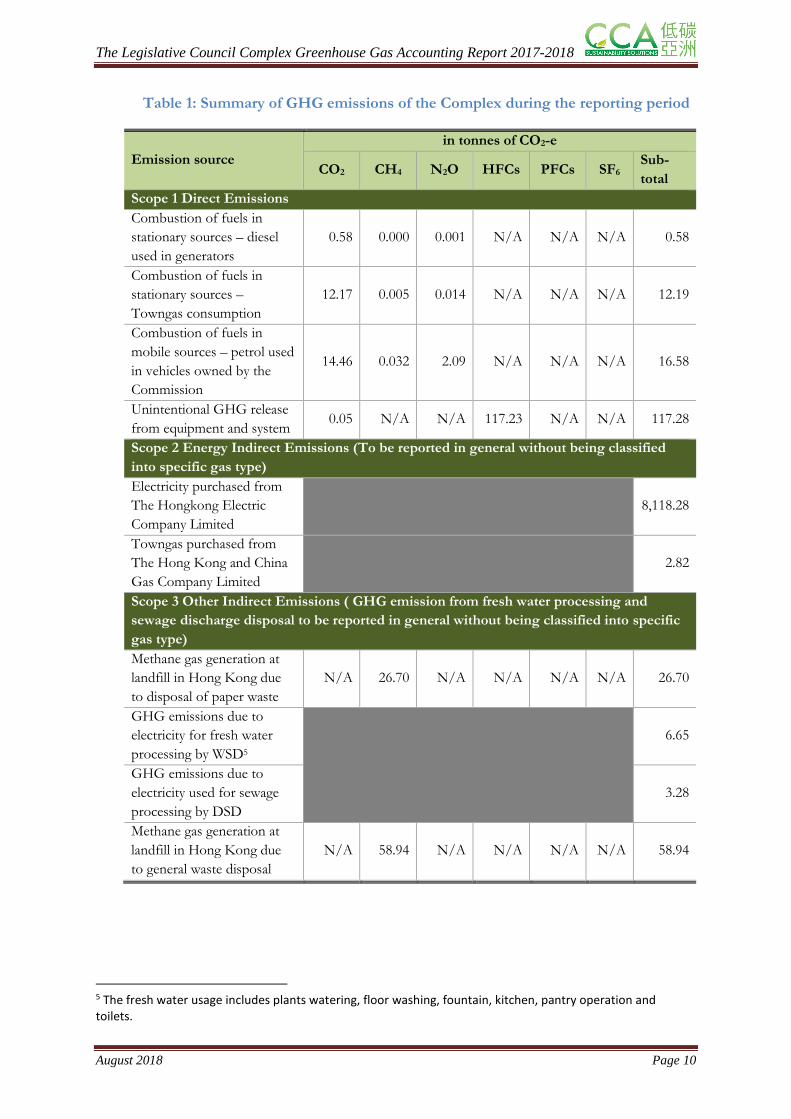
Table 1: Summary of GHG emissions of the Complex during the reporting period
Emission source
in tonnes of CO2-e
CO2 CH4 N2O HFCs PFCs SF6 Sub-
total
Scope 1 Direct Emissions
Combustion of fuels in
stationary sources – diesel
used in generators
0.58 0.000 0.001 N/A N/A N/A 0.58
Combustion of fuels in
stationary sources –
Towngas consumption
12.17 0.005 0.014 N/A N/A N/A 12.19
Combustion of fuels in
mobile sources – petrol used
in vehicles owned by the
Commission
14.46 0.032 2.09 N/A N/A N/A 16.58
Unintentional GHG release
from equipment and system 0.05 N/A N/A 117.23 N/A N/A 117.28
Scope 2 Energy Indirect Emissions (To be reported in general without being classified
into specific gas type)
Electricity purchased from
The Hongkong Electric
Company Limited
8,118.28
Towngas purchased from
The Hong Kong and China
Gas Company Limited
2.82
Scope 3 Other Indirect Emissions ( GHG emission from fresh water processing and
sewage discharge disposal to be reported in general without being classified into specific
gas type)
Methane gas generation at
landfill in Hong Kong due
to disposal of paper waste
N/A 26.70 N/A N/A N/A N/A 26.70
GHG emissions due to
electricity for fresh water
processing by WSD5
6.65
GHG emissions due to
electricity used for sewage
processing by DSD
3.28
Methane gas generation at
landfill in Hong Kong due
to general waste disposal
N/A 58.94 N/A N/A N/A N/A 58.94
5 The fresh water usage includes plants watering, floor washing, fountain, kitchen, pantry operation and toilets.
The Legislative Council Complex Greenhouse Gas Accounting Report 2017-2018
August 2018 Page 11
3.3 Data collection
i. Scope 1 - Stationary fuel combustion
The data of diesel consumption for three generators controlled by the Complex are
extracted from the monthly maintenance records.
Towngas consumption is based on the bills issued by The Hong Kong and China Gas
Company Limited.
ii. Scope 1 - Mobile fuel combustion
The vehicle type of the three cars owned by the Commission is specified as “Private Car”
on their licenses. Fuel consumption records are summarized from the invoices issued by
the suppliers. The type of fuel used is petrol, and the quantities for each of these vehicles
are listed.
iii. Scope 1 - Fugitive emissions
The quantities and specifications of the CO2 portable and FM 200 extinguishers are
provided by the Secretariat. The types and amounts of refrigerant used in the refrigerators
and the air conditioning equipment solely managed by the Complex are also provided. The
quantity of the refrigerant used in the central chiller plant (CCP), which is shared with the
Chief Executive's Office and Central Government Offices, was excluded from this report.
iv. Scope 2 - Electricity
The electricity used by the Complex is measured by two meters. One meter records the
electricity consumption of the building services installation solely controlled by the
Complex, such as the lighting system and the fresh water pumping system. The other meter
records the electricity consumption of the shared facilities in the Complex, the Chief
Executive's Office and the Central Government Offices, including CCP and the seawater
pump house (SWP). The electricity consumed by the Complex in air conditioning is
calculated by measuring the water consumption of the CCP and SWP of each building.
v. Scope 3 - Water
The fresh water consumption of the Complex is based on the readings from five freshwater
meters as recorded by the Secretariat and the Water Supplies Department (WSD) on a
monthly basis. The sewage generated is calculated on the basis of the default conversion
from fresh water amount, as specified in the EPD-EMSD Guidelines.
vi. Scope 3 - Paper
The paper consumption data for the Complex operation includes the paper procured by
the Secretariat and the LegCo Members’ offices. The paper consumption data of the
Secretariat is determined by making reference to the monthly inventory and the
The Legislative Council Complex Greenhouse Gas Accounting Report 2017-2018
August 2018 Page 12
procurement records. The paper consumption data of the LegCo Members’ Offices is
estimated according to the response submitted by the Council Members’ Offices in a
general survey.
As the current practice of paper collection and recycling in the Complex covers both
newspaper and office paper (including recyclable confidential paper), the quantity of paper
recycling of the Complex per year is estimated based on sampling conducted on a quarterly
basis. As newspapers do not form part of the Complex’s operation, their quantity has not
been included in the calculation.
vii. Scope 3 - General waste
Owing to the fact that the Complex does not maintain weight measurement records of
general waste disposals, the Secretariat agrees that the quantity of its general waste disposal
during the reporting period is to be estimated based on projection of sample data. Such
sampling process and projection method for both newspapers and the general waste have
been adopted consistently since the base-year study.
3.4 Data analysis
i. GHG emissions breakdown
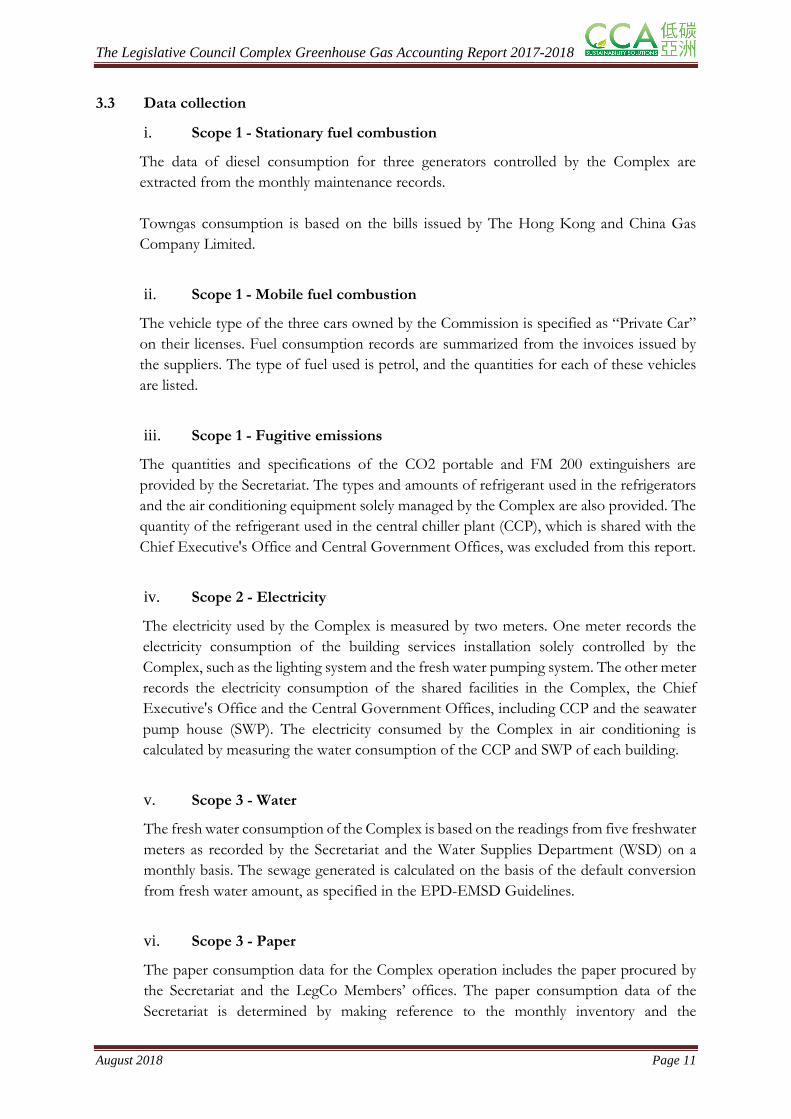
Figure 1. 2017-2018 GHG emissions profile by scope
Figure 1 summarizes the 2017-2018 GHG emissions profile of the Complex. Scope 2,
representing the indirect GHG emissions from purchased energy, constituted 97.10%
(8,121.10 tonnes) of the total GHG emissions (8,363.30 tonnes). Scope 1 and Scope 3,
representing the direct GHG emissions and other indirect GHG emissions, accounted for
1.75% (146.63 tonnes) and 1.14% (95.57 tonnes) of the total GHG emissions respectively.
1.75%
97.10%
1.14%
GHG emissions breakdown by scopes
Scope 1 - Direct GHG emissions
Scope 2 - Energy indirect GHGemissions
Scope 3 - Other indirect GHGemissions
The Legislative Council Complex Greenhouse Gas Accounting Report 2017-2018
August 2018 Page 13
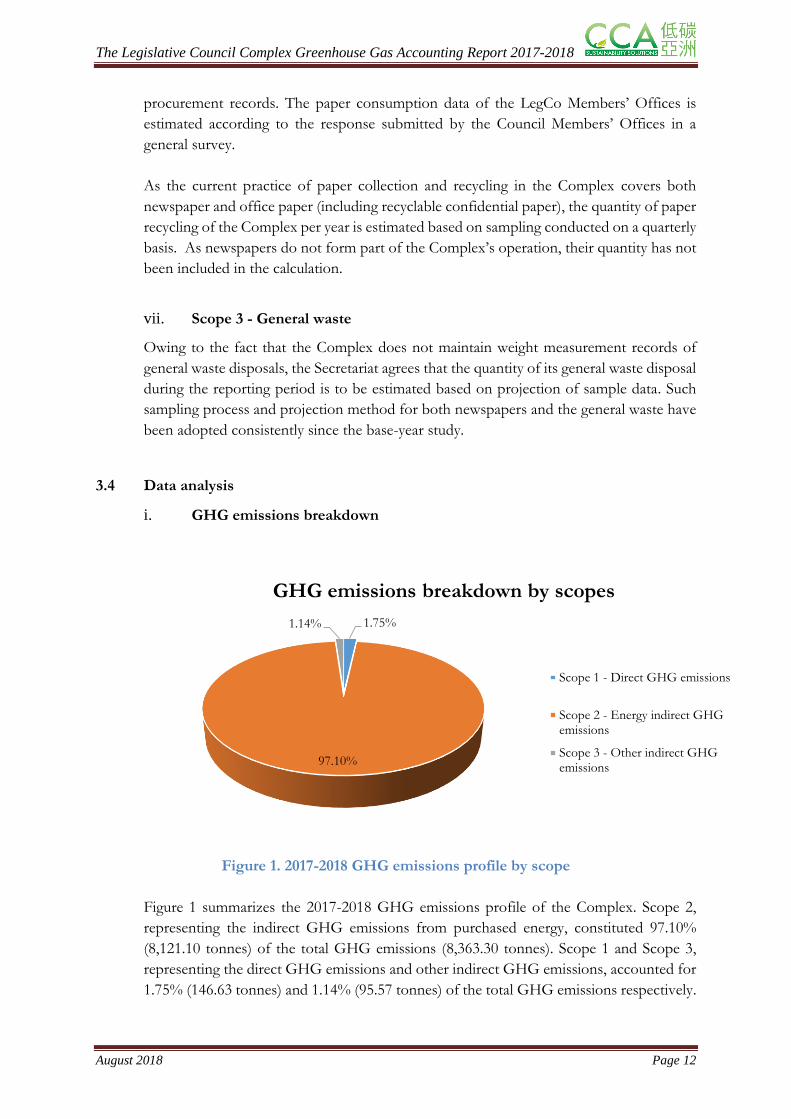
Figure 2. 2017-2018 GHG emissions profile by emission source
Figure 2 presents the distribution of the GHG emissions from different emission sources.
Electricity consumption was the dominant carbon emissions source of the Complex,
accounting for 8,118.28 tonnes CO2-e (97.07% of the reported emissions ), followed by
fugitive emissions (117.28 tonnes), general waste disposal (58.94 tonnes) and disposal of
paper waste (26.70 tonnes). The rest represented 0.51% of the total emissions profile.
0.001000.002000.003000.004000.005000.006000.007000.008000.009000.00
0.58 12.19 16.58 117.28
8118.28
2.82 26.70 6.65 3.28 58.94in t
on
nes
of
CO
2-e
GHG emissions breakdown by emission sources
The Legislative Council Complex Greenhouse Gas Accounting Report 2017-2018
August 2018 Page 14
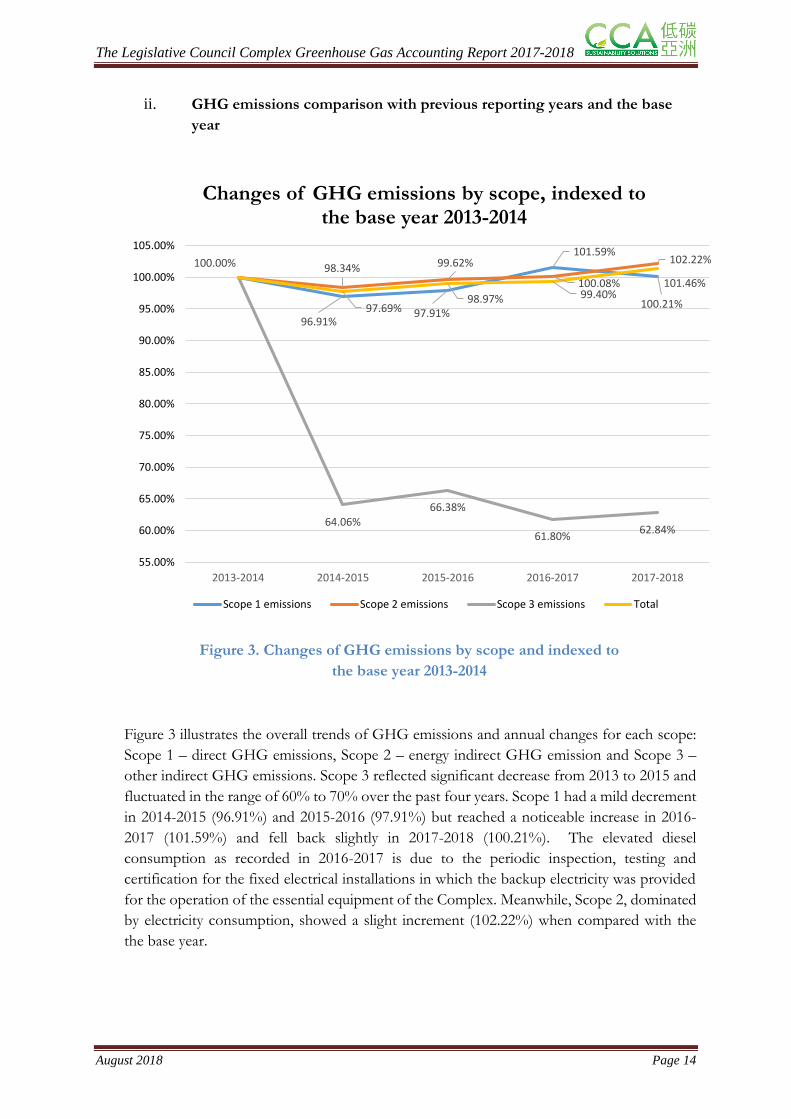
ii. GHG emissions comparison with previous reporting years and the base
year
Figure 3. Changes of GHG emissions by scope and indexed to
the base year 2013-2014
Figure 3 illustrates the overall trends of GHG emissions and annual changes for each scope:
Scope 1 – direct GHG emissions, Scope 2 – energy indirect GHG emission and Scope 3 –
other indirect GHG emissions. Scope 3 reflected significant decrease from 2013 to 2015 and
fluctuated in the range of 60% to 70% over the past four years. Scope 1 had a mild decrement
in 2014-2015 (96.91%) and 2015-2016 (97.91%) but reached a noticeable increase in 2016-
2017 (101.59%) and fell back slightly in 2017-2018 (100.21%). The elevated diesel
consumption as recorded in 2016-2017 is due to the periodic inspection, testing and
certification for the fixed electrical installations in which the backup electricity was provided
for the operation of the essential equipment of the Complex. Meanwhile, Scope 2, dominated
by electricity consumption, showed a slight increment (102.22%) when compared with the
the base year.
96.91%97.91%
101.59%
100.21%
98.34% 99.62%
100.08%
102.22%
64.06%66.38%
61.80%62.84%
100.00%
97.69%98.97% 99.40%
101.46%
55.00%
60.00%
65.00%
70.00%
75.00%
80.00%
85.00%
90.00%
95.00%
100.00%
105.00%
2013-2014 2014-2015 2015-2016 2016-2017 2017-2018
Changes of GHG emissions by scope, indexed to the base year 2013-2014
Scope 1 emissions Scope 2 emissions Scope 3 emissions Total
The Legislative Council Complex Greenhouse Gas Accounting Report 2017-2018
August 2018 Page 15
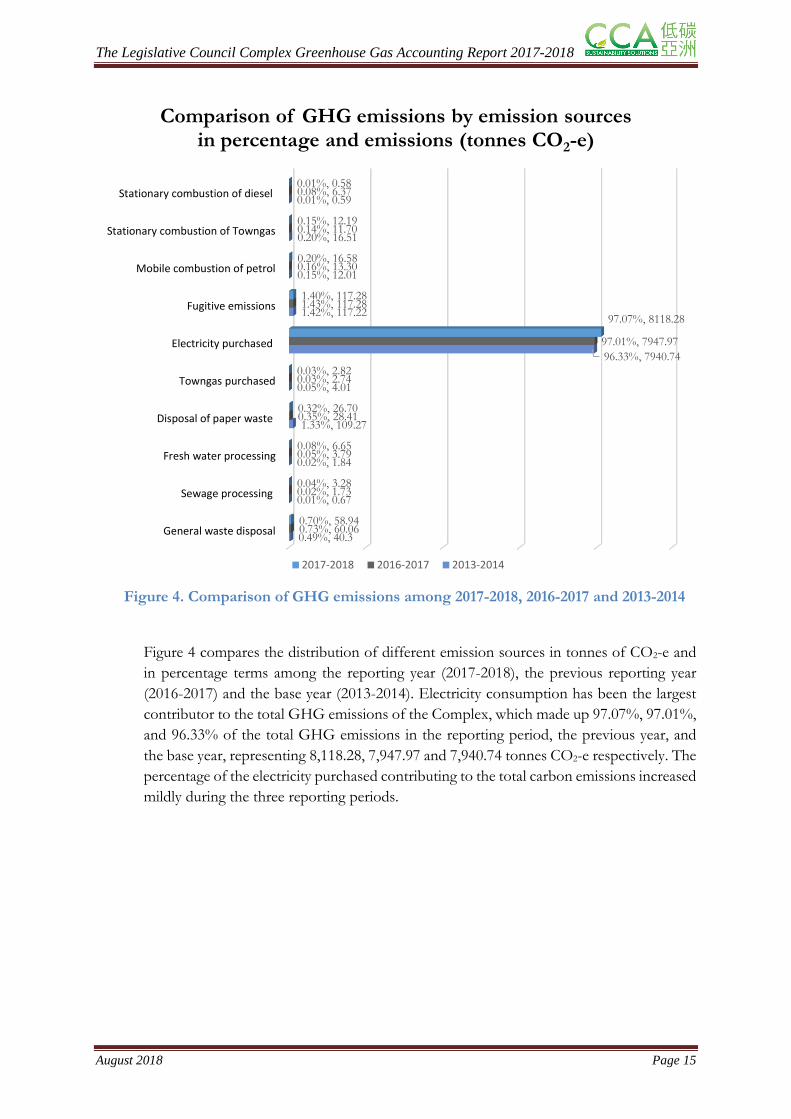
Figure 4. Comparison of GHG emissions among 2017-2018, 2016-2017 and 2013-2014
Figure 4 compares the distribution of different emission sources in tonnes of CO2-e and
in percentage terms among the reporting year (2017-2018), the previous reporting year
(2016-2017) and the base year (2013-2014). Electricity consumption has been the largest
contributor to the total GHG emissions of the Complex, which made up 97.07%, 97.01%,
and 96.33% of the total GHG emissions in the reporting period, the previous year, and
the base year, representing 8,118.28, 7,947.97 and 7,940.74 tonnes CO2-e respectively. The
percentage of the electricity purchased contributing to the total carbon emissions increased
mildly during the three reporting periods.
Stationary combustion of diesel
Stationary combustion of Towngas
Mobile combustion of petrol
Fugitive emissions
Electricity purchased
Towngas purchased
Disposal of paper waste
Fresh water processing
Sewage processing
General waste disposal
0.01%, 0.58
0.15%, 12.19
0.20%, 16.58
1.40%, 117.28
97.07%, 8118.28
0.03%, 2.82
0.32%, 26.70
0.08%, 6.65
0.04%, 3.28
0.70%, 58.94
0.08%, 6.37
0.14%, 11.70
0.16%, 13.30
1.43%, 117.28
97.01%, 7947.97
0.03%, 2.74
0.35%, 28.41
0.05%, 3.79
0.02%, 1.73
0.73%, 60.06
0.01%, 0.59
0.20%, 16.51
0.15%, 12.01
1.42%, 117.22
96.33%, 7940.74
0.05%, 4.01
1.33%, 109.27
0.02%, 1.84
0.01%, 0.67
0.49%, 40.3
Comparison of GHG emissions by emission sources in percentage and emissions (tonnes CO2-e)
2017-2018 2016-2017 2013-2014
The Legislative Council Complex Greenhouse Gas Accounting Report 2017-2018
August 2018 Page 16
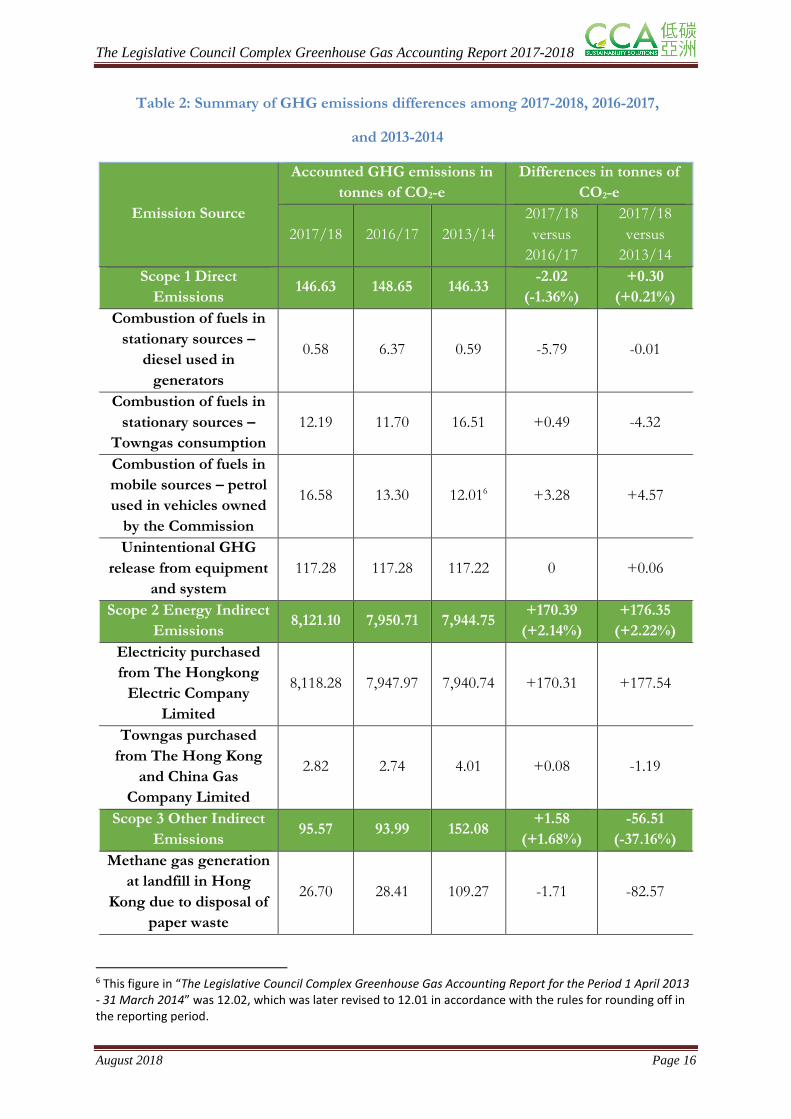
Table 2: Summary of GHG emissions differences among 2017-2018, 2016-2017,
and 2013-2014
Emission Source
Accounted GHG emissions in
tonnes of CO2-e
Differences in tonnes of
CO2-e
2017/18 2016/17 2013/14
2017/18
versus
2016/17
2017/18
versus
2013/14
Scope 1 Direct
Emissions 146.63 148.65 146.33
-2.02
(-1.36%)
+0.30
(+0.21%)
Combustion of fuels in
stationary sources –
diesel used in
generators
0.58 6.37 0.59 -5.79 -0.01
Combustion of fuels in
stationary sources –
Towngas consumption
12.19 11.70 16.51 +0.49 -4.32
Combustion of fuels in
mobile sources – petrol
used in vehicles owned
by the Commission
16.58 13.30 12.016 +3.28 +4.57
Unintentional GHG
release from equipment
and system
117.28 117.28 117.22 0 +0.06
Scope 2 Energy Indirect
Emissions 8,121.10 7,950.71 7,944.75
+170.39
(+2.14%)
+176.35
(+2.22%)
Electricity purchased
from The Hongkong
Electric Company
Limited
8,118.28 7,947.97 7,940.74 +170.31 +177.54
Towngas purchased
from The Hong Kong
and China Gas
Company Limited
2.82 2.74 4.01 +0.08 -1.19
Scope 3 Other Indirect
Emissions 95.57 93.99 152.08
+1.58
(+1.68%)
-56.51
(-37.16%)
Methane gas generation
at landfill in Hong
Kong due to disposal of
paper waste
26.70 28.41 109.27 -1.71 -82.57
6 This figure in “The Legislative Council Complex Greenhouse Gas Accounting Report for the Period 1 April 2013 - 31 March 2014” was 12.02, which was later revised to 12.01 in accordance with the rules for rounding off in the reporting period.
The Legislative Council Complex Greenhouse Gas Accounting Report 2017-2018
August 2018 Page 17
Emission Source
Accounted GHG emissions in
tonnes of CO2-e
Differences in tonnes of
CO2-e
2017/18 2016/17 2013/14
2017/18
versus
2016/17
2017/18
versus
2013/14
GHG emissions due to
electricity for fresh
water processing by
WSD
6.65 3.79 1.847 +2.86 +4.81
GHG emissions due to
electricity used for
sewage processing by
DSD
3.28 1.73 0.67 +1.55 +2.61
Methane gas generation
at landfill in Hong
Kong due to general
waste disposal
58.94 60.06 40.30 -1.12 +18.64
Sum-total 8,363.30 8,193.35 8,243.16 +169.95
(+2.07%)
+120.14
(+1.46%)
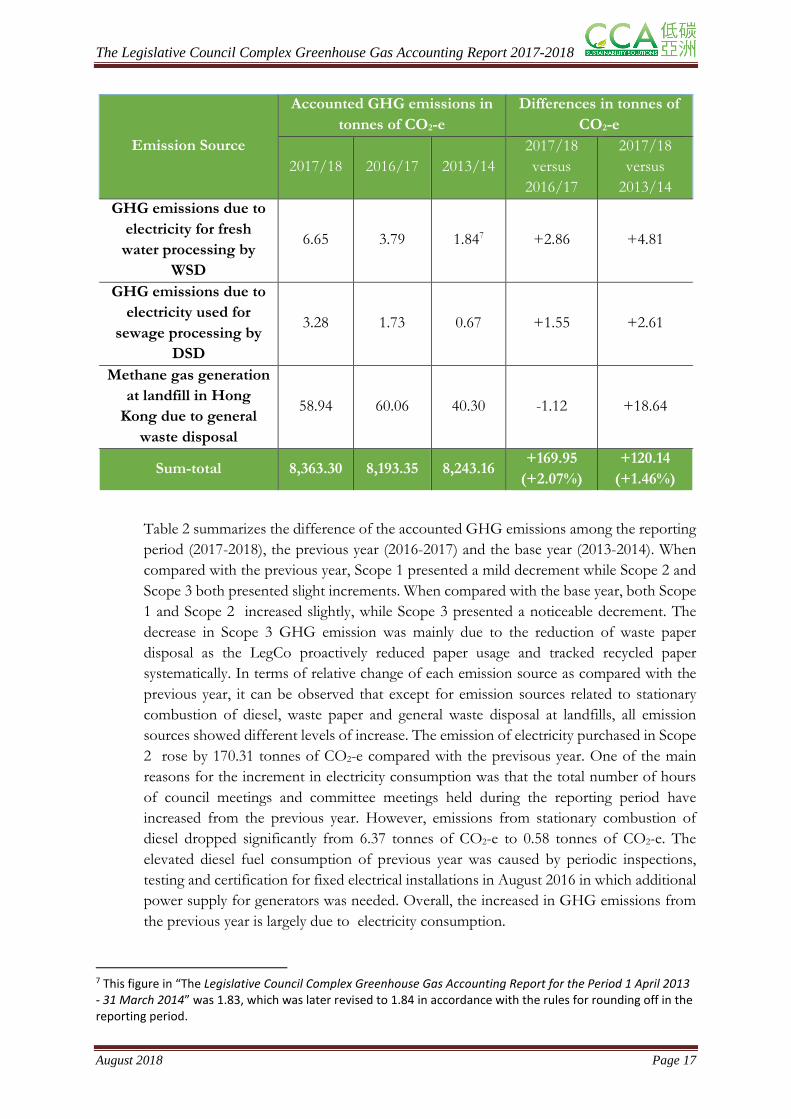
Table 2 summarizes the difference of the accounted GHG emissions among the reporting
period (2017-2018), the previous year (2016-2017) and the base year (2013-2014). When
compared with the previous year, Scope 1 presented a mild decrement while Scope 2 and
Scope 3 both presented slight increments. When compared with the base year, both Scope
1 and Scope 2 increased slightly, while Scope 3 presented a noticeable decrement. The
decrease in Scope 3 GHG emission was mainly due to the reduction of waste paper
disposal as the LegCo proactively reduced paper usage and tracked recycled paper
systematically. In terms of relative change of each emission source as compared with the
previous year, it can be observed that except for emission sources related to stationary
combustion of diesel, waste paper and general waste disposal at landfills, all emission
sources showed different levels of increase. The emission of electricity purchased in Scope
2 rose by 170.31 tonnes of CO2-e compared with the previsous year. One of the main
reasons for the increment in electricity consumption was that the total number of hours
of council meetings and committee meetings held during the reporting period have
increased from the previous year. However, emissions from stationary combustion of
diesel dropped significantly from 6.37 tonnes of CO2-e to 0.58 tonnes of CO2-e. The
elevated diesel fuel consumption of previous year was caused by periodic inspections,
testing and certification for fixed electrical installations in August 2016 in which additional
power supply for generators was needed. Overall, the increased in GHG emissions from
the previous year is largely due to electricity consumption.
7 This figure in “The Legislative Council Complex Greenhouse Gas Accounting Report for the Period 1 April 2013 - 31 March 2014” was 1.83, which was later revised to 1.84 in accordance with the rules for rounding off in the reporting period.
The Legislative Council Complex Greenhouse Gas Accounting Report 2017-2018
August 2018 Page 18
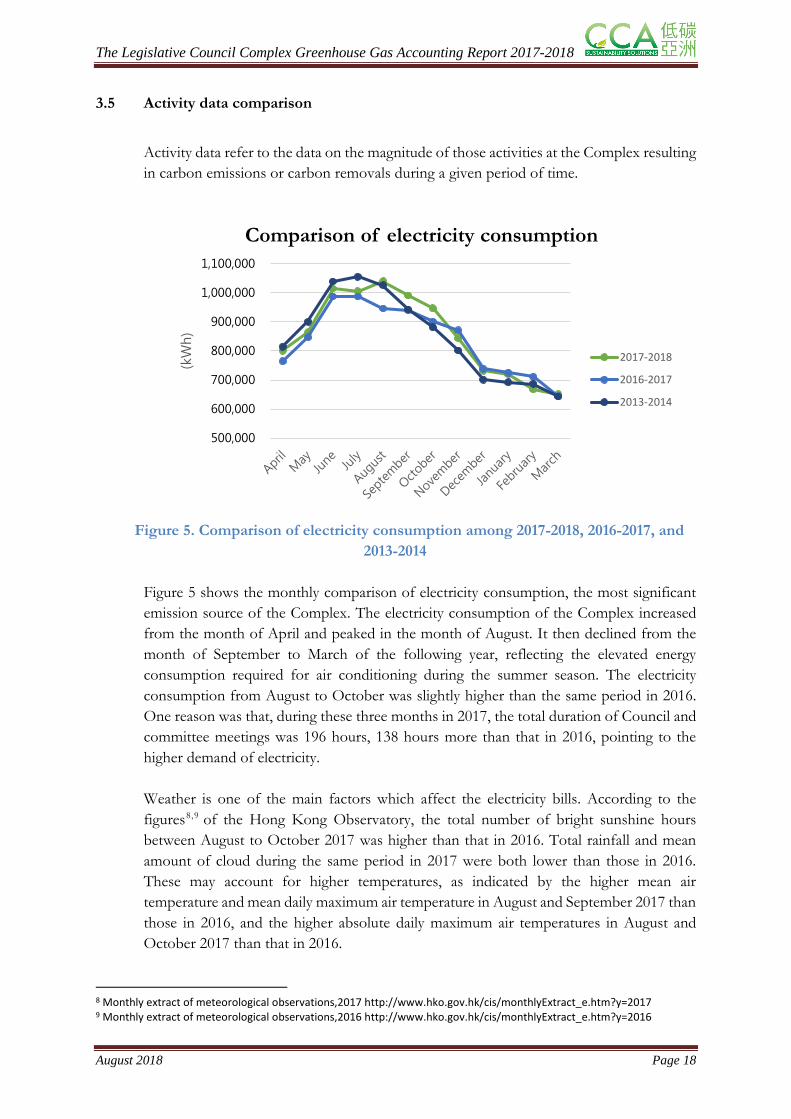
3.5 Activity data comparison
Activity data refer to the data on the magnitude of those activities at the Complex resulting
in carbon emissions or carbon removals during a given period of time.
Figure 5. Comparison of electricity consumption among 2017-2018, 2016-2017, and
2013-2014
Figure 5 shows the monthly comparison of electricity consumption, the most significant
emission source of the Complex. The electricity consumption of the Complex increased
from the month of April and peaked in the month of August. It then declined from the
month of September to March of the following year, reflecting the elevated energy
consumption required for air conditioning during the summer season. The electricity
consumption from August to October was slightly higher than the same period in 2016.
One reason was that, during these three months in 2017, the total duration of Council and
committee meetings was 196 hours, 138 hours more than that in 2016, pointing to the
higher demand of electricity.
Weather is one of the main factors which affect the electricity bills. According to the
figures8,9 of the Hong Kong Observatory, the total number of bright sunshine hours
between August to October 2017 was higher than that in 2016. Total rainfall and mean
amount of cloud during the same period in 2017 were both lower than those in 2016.
These may account for higher temperatures, as indicated by the higher mean air
temperature and mean daily maximum air temperature in August and September 2017 than
those in 2016, and the higher absolute daily maximum air temperatures in August and
October 2017 than that in 2016.
8 Monthly extract of meteorological observations,2017 http://www.hko.gov.hk/cis/monthlyExtract_e.htm?y=2017 9 Monthly extract of meteorological observations,2016 http://www.hko.gov.hk/cis/monthlyExtract_e.htm?y=2016
500,000
600,000
700,000
800,000
900,000
1,000,000
1,100,000
(kWh)
Comparison of electricity consumption
2017-2018
2016-2017
2013-2014

The Legislative Council Complex Greenhouse Gas Accounting Report 2017-2018
August 2018 Page 19
In summer, air conditioners consume more electricity as the outdoor temperature is higher.
It is because to maintain the same room temperature, the actual working hours for the
compressor, which is controlled by the thermostat, are longer. In other words, although
the daily operating hours of an air conditioning system are the same on days with different
outdoor temperatures, higher outdoor temperature leads to higher electricity
consumption10.
3.6 Implementation of the GHG emission reduction measures
Since the base year, the GHG emissions reduction measures have been summarized in the
dedicated document – “Green Measures taken in the Complex”, which is reviewed and updated
annually by the Secretariat. The details of the reduction measures include:
- Outer layer filters and inner layer filters of the air handling units of the air
conditioning system are replaced quarterly and annually respectively. Air filters of fan
coils are cleaned quarterly;
- Indoor temperature is set at 25.5oC as far as practicable;
- Maintenance of refrigeration and air conditioning systems are done in accordance
with EMSD’s maintenance manual;
- Continuously explore opportunities for the replacement of the existing lighting
system with the more energy-efficient LED lighting when refurbishment works are
taken11;
- Use energy efficient electrical appliances and IT equipment with Grade 1 Energy
Label issued by the EMSD or Energy Star;
- In the purchase of office and IT equipment, energy-efficient products are preferred;
- Recycling bins for glass bottles are provided in designated locations to promote
recycling;
- Issue useful tips for handling general waste and waste reduction to the Secretariat’s
staff and Members’ offices;
- Staff are encouraged to use double-sided printing;
- Expanded the types of documents of which only soft copies are provided to LegCo
Members. These documents include the Legislative Council Briefs provided by the
10 This information is from Hong Kong Electric Investments. 11 When the Members’ Activity Room was refurbished in December 2017, the lighting system was replaced with LED lighting.
The Legislative Council Complex Greenhouse Gas Accounting Report 2017-2018
August 2018 Page 20
Government, most of the minutes of open meetings, and the circulars issued by
certain Divisions of the Secretariat, etc.;
- Suppliers are encouraged to take green measures; and
- LegCo Members and Secretariat staff are encouraged to use soft copies instead of
printed copies of documents. Some LegCo Members have opted to receive discussion
papers for committee meetings in soft copy only.

The Legislative Council Complex Greenhouse Gas Accounting Report 2017-2018
August 2018 Page 21
4. DISCUSSION AND RECOMMENDATIONS
4.1 Discussion
4.1.1 Scope 1 - Direct Emissions
The carbon emissions from Scope 1 which include the stationary and mobile combustion
as well as fugitive emissions, were 146.63 tonnes CO2-e, similar to the figure in the previous
reporting year (148.65 tonnes CO2-e).
For stationary sources, the decline of diesel consumption as recorded during the reporting
period is due to the fact that the Complex was not required to conduct the periodic
inspection, testing and certification for fixed electrical installations in the current reporting
year. The percentage of carbon emissions from diesel consumption was 0.01%, which was
not considered significant when compared with other sources of emission. For mobile
sources, fuel consumption slightly increased when comparing with past reporting years.
The magnitude of carbon emissions from fugitive emissions during the reporting period
remained consistent from 2013 to 2018.
4.1.2 Scope 2 – Indirect Emissions from Purchase of Energy
The carbon emissions from Scope 2 which include the procurement of electricity and
Towngas, were 8,121.10 tonnes CO2-e and recorded an increment as compared with the
previous reporting year (7,950.71 tonnes CO2-e).
The consumption of electricity and Towngas during the reporting period (Electricity:
10,276,307 kWh; Towngas: 4,776 units) increased as compared with the previous reporting
year (Electricity: 10,060,723 kWh; Towngas: 4,585 units). The increase in the total carbon
emissions are believed to be due to the noticeable increase of the duration of Council
meetings and committee meetings by 58 hours and 310 hours, or an increase of 12.31%
and 25.83% respectively in contrast to the previous year. On the other hand, it is worth
mentioning that as the number of building users in the Complex dropped from 878 to 867,
the GHG emission intensity of the Complex in terms of building users is 9.65 tonnes CO2-
e/person, indicating a 3.5% increase compared with the previous year. As remarked by
the Secretariat, the air conditioning system is operated in summer mode and winter mode
respectively in order to minimize energy consumption.
The Legislative Council Complex Greenhouse Gas Accounting Report 2017-2018
August 2018 Page 22
4.1.3 Scope 3 – Other Indirect Emissions
The carbon emissions from Scope 3 which include the disposal of paper waste and general
waste together with the energy used for the processing of fresh water and sewage treatment
were 95.57 tonnes CO2-e, showing a 1.68% increase when compared with the figure in
the previous reporting year (93.99 tonnes CO2-e).
Carbon emissions from the disposal of paper waste had decreased by 75.6% since the base
year to 26.70 tonnes CO2-e. In estimating paper recycling which is carried out using the
same sampling methodology throughout the five years, the paper consumption of the
Secretariat office was found to be fewer than the paper recycled. The reason may be that
the amount of the recycled paper as collected in the Complex included paper not procured
by the Secretariat. It may also be due to some random error of the statistical results
obtained from the waste sampling conducted on quarterly basis. The indirect emissions
from the paper consumption and recycling under the control of the Secretariat cannot be
presented as negative values and the paper recycling cannot be offset for other emission
sources, and therefore the value was adjusted to zero.
Carbon emissions caused by the energy used for fresh water processing were 6.65 tonnes
CO2-e, an increase of 75.46% when comparing with previous year. It is worth noticing
that some of the water meters malfunctioned in the previous year but functioned properly
during the reporting period, resulted in a significant increase of fresh water usage. On the
other hand, the carbon emissions caused by the energy used for sewage treatment were
3.28 tonnes CO2-e.
The amount of general waste generated in the reporting period was 58.94 tonnes CO2-e, a
decrease of 1.9% compared with the previous reporting year. The LegCo Secretariat
prepared environmentally friendly tips for the staff of the Secretariat and Members’ offices
to reduce waste generation and handle general waste properly, as well as to encourage them
to participate in glass bottles recycling. The continuous promotion of reduction and
recycling achieved a positive result.
The Legislative Council Complex Greenhouse Gas Accounting Report 2017-2018
August 2018 Page 23
4.2 Recommendations
4.2.1 Operational Improvement
Air Conditioning System, Lighting System and Office Equipment
The operation of the air conditioning system, the lighting system and office equipment
consumes the majority of electricity of the Complex. Apparently, some measures have
been taken to improve energy efficiency in the Complex, including the adoption of
seawater cooled chiller plants, the use of a natural light funnel and switching to energy-
efficient electrical appliances. However, to enhance carbon performance of the Complex,
it is important to keep the existing practices in place as well as explore further improvement
opportunities continuously. It is recommended that the Secretariat consider the application
of automated air conditioning control systems in the Complex that can reduce redundant
energy use by turning off the air conditioners when no occupants are using the facilities.
In addition, a feasibility study on the application of anti-UV films on windows for reducing
excessive heat gain through windows and achieving energy savings can be carried out.
Lift Check and Potential Replacement
The lifts are another common electricity end-use in buildings. Regular checks and
maintenance of lifts and escalators not only provide higher assurance on user safety, but
also reduce the possibility of inefficient use of energy due to suboptimal functioning.
Conventional lifts are recommended to be replaced by lifts equipped with regenerative
power feature as the latter obtain power from electricity supply network when phrasing
out old models. Regenerative lifts can capture and condition the regenerated electricity for
feeding directly into power grid for immediate consumption by the Complex. Study shows
that regenerative lifts are 20% to 30% more energy efficient than conventional lifts12.
Solar Panel Installation
The government has announced a new feed-in tariff scheme13. The Commission may
conduct a study to install more solar panels on available open space. The new feed-in tariff
should allow a pay-back period of less than 10 years. If the Commission implements this
scheme successfully, the installation can be included in public tours and serve as a showcase
for educational purpose on renewable energy.
12 Information from Electrical and Mechanical Services Department – Lift & Escalator: https://www.emsd.gov.hk/filemanager/en/content_764/applctn_lift_rgnrt_pwr.pdf 13 HK RE Net, http://re.emsd.gov.hk/english/fit/int/fit_int.html
The Legislative Council Complex Greenhouse Gas Accounting Report 2017-2018
August 2018 Page 24
4.2.2 Waste Audit
Guidance has been provided to the staff and users of the Complex to encourage recycling,
reduction and reuse of paper and glass in order to reduce the carbon footprint from waste.
Waste audit for the entire operation of the Complex is recommended in order to facilitate
the review of the different types of waste produced and to formulate effective waste
reduction measures. This will also be a timely preparation for the introduction of the
forthcoming waste-charging system in Hong Kong.
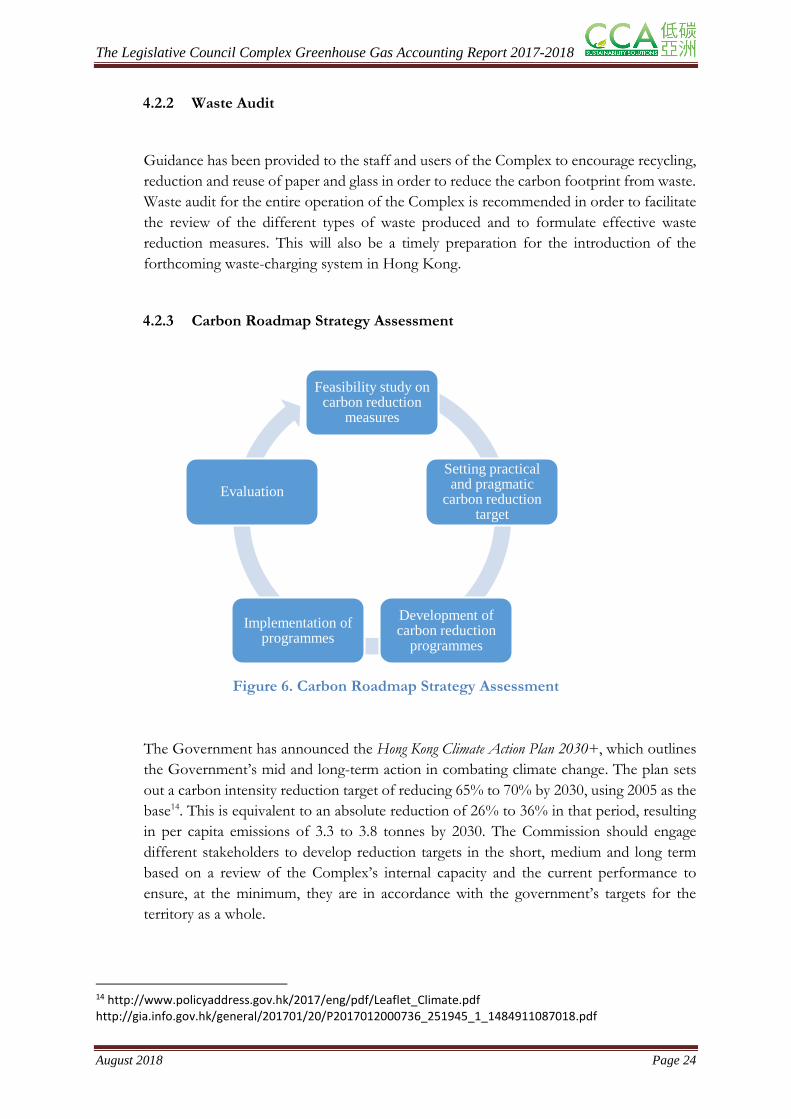
4.2.3 Carbon Roadmap Strategy Assessment
Figure 6. Carbon Roadmap Strategy Assessment
The Government has announced the Hong Kong Climate Action Plan 2030+, which outlines
the Government’s mid and long-term action in combating climate change. The plan sets
out a carbon intensity reduction target of reducing 65% to 70% by 2030, using 2005 as the
base14. This is equivalent to an absolute reduction of 26% to 36% in that period, resulting
in per capita emissions of 3.3 to 3.8 tonnes by 2030. The Commission should engage
different stakeholders to develop reduction targets in the short, medium and long term
based on a review of the Complex’s internal capacity and the current performance to
ensure, at the minimum, they are in accordance with the government’s targets for the
territory as a whole.
14 http://www.policyaddress.gov.hk/2017/eng/pdf/Leaflet_Climate.pdf http://gia.info.gov.hk/general/201701/20/P2017012000736_251945_1_1484911087018.pdf
Feasibility study on carbon reduction
measures
Setting practical and pragmatic
carbon reduction target
Development of carbon reduction
programmes
Implementation of programmes
Evaluation

The Legislative Council Complex Greenhouse Gas Accounting Report 2017-2018
August 2018 Page 25
4.2.4 Communication and Engagement
Programs for engaging internal and external stakeholders to support and implement GHG
reduction actions should be carried out to promote sustainability awareness and support
carbon friendly practices.
Engaging Suppliers: The Commission should continue to encourage and influence its
service providers to care for the environment. More engagement with the suppliers
would mean stronger support to the Commission for introducing more innovative and
effective carbon reduction measures.
Engaging Employees and Users: In addition to the recommendations contained in the
previous GHG accounting report, the Commission can explore further engagement
programmes. Incentive programmes, for example, are new ways to encourage
participation in energy efficiency and waste reduction projects. Green Day Events can
be organized by internal or external party to engage the Complex users in exciting and
thought-provoking activities such as workshops and sharing bazaar to promote the
concept of low-carbon lifestyle and environmentally recycling. Carbon reduction
competitions can also be organized to encourage green office practices amongst the
Complex users. A self-assessment tool can be developed in terms of a checklist listing
different aspects of office culture where carbon reduction practices can be integrated.
Monthly reports can be used to track, compare and benchmark the performance of
participants. Awards will then be given to the best performing individual or
department. A carbon innovation competition can also be held to encourage
suggestions on carbon reduction solutions from Complex users, through giving out
prizes or other forms of recognition. It is recommended that the Commission set up
Stakeholder Engagement
Suppliers
Complex Users
Employees
The Legislative Council Complex Greenhouse Gas Accounting Report 2017-2018
August 2018 Page 26
an internal communications platform to encourage the sharing of innovative ideas on
sustainability and carbon reduction.
//end of text//
The Legislative Council Complex Greenhouse Gas Accounting Report 2017-2018
August 2018 Page 27
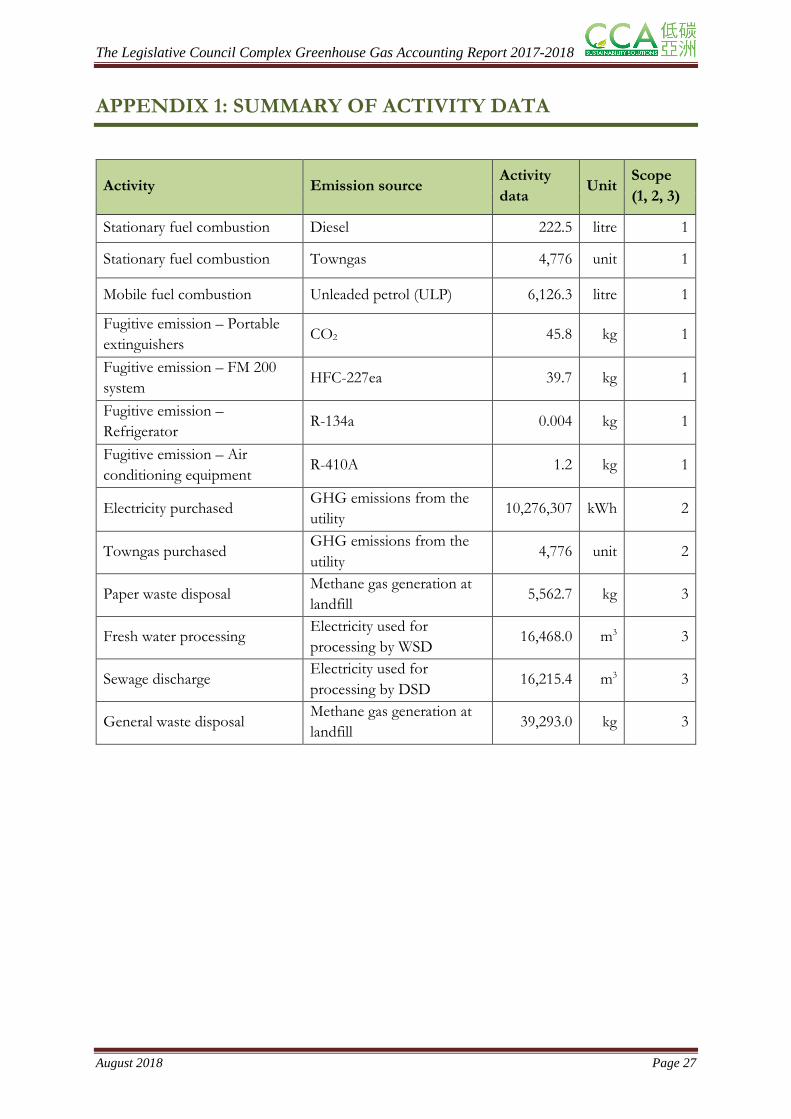
APPENDIX 1: SUMMARY OF ACTIVITY DATA
Activity Emission source Activity
data Unit
Scope
(1, 2, 3)
Stationary fuel combustion Diesel 222.5 litre 1
Stationary fuel combustion Towngas 4,776 unit 1
Mobile fuel combustion Unleaded petrol (ULP) 6,126.3 litre 1
Fugitive emission – Portable
extinguishers CO2 45.8 kg 1
Fugitive emission – FM 200
system HFC-227ea 39.7 kg 1
Fugitive emission –
Refrigerator R-134a 0.004 kg 1
Fugitive emission – Air
conditioning equipment R-410A 1.2 kg 1
Electricity purchased GHG emissions from the
utility 10,276,307 kWh 2
Towngas purchased GHG emissions from the
utility 4,776 unit 2
Paper waste disposal Methane gas generation at
landfill 5,562.7 kg 3
Fresh water processing Electricity used for
processing by WSD 16,468.0 m3 3
Sewage discharge Electricity used for
processing by DSD 16,215.4 m3 3
General waste disposal Methane gas generation at
landfill 39,293.0 kg 3
The Legislative Council Complex Greenhouse Gas Accounting Report 2017-2018
August 2018 Page 28
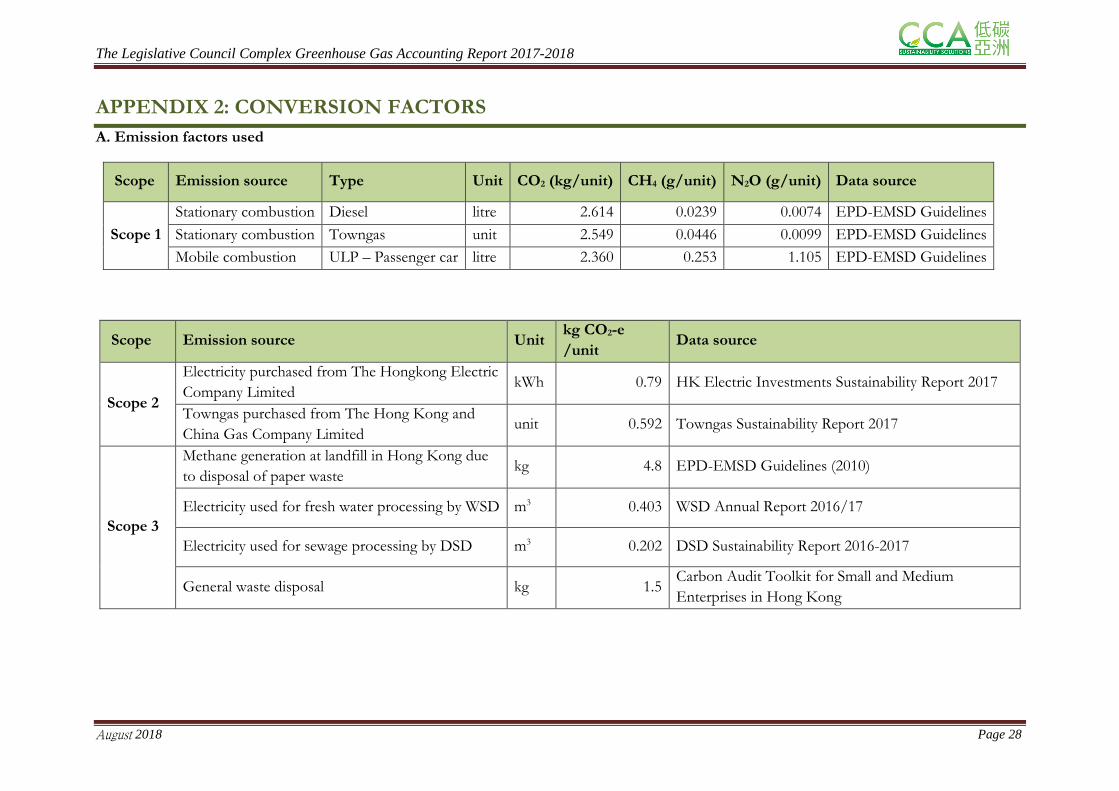
APPENDIX 2: CONVERSION FACTORS
A. Emission factors used
Scope Emission source Type Unit CO2 (kg/unit) CH4 (g/unit) N2O (g/unit) Data source
Scope 1
Stationary combustion Diesel litre 2.614 0.0239 0.0074 EPD-EMSD Guidelines
Stationary combustion Towngas unit 2.549 0.0446 0.0099 EPD-EMSD Guidelines
Mobile combustion ULP – Passenger car litre 2.360 0.253 1.105 EPD-EMSD Guidelines
Scope Emission source Unit kg CO2-e
/unit Data source
Scope 2
Electricity purchased from The Hongkong Electric
Company Limited kWh 0.79 HK Electric Investments Sustainability Report 2017
Towngas purchased from The Hong Kong and
China Gas Company Limited unit 0.592 Towngas Sustainability Report 2017
Scope 3
Methane generation at landfill in Hong Kong due
to disposal of paper waste kg 4.8 EPD-EMSD Guidelines (2010)
Electricity used for fresh water processing by WSD m3 0.403 WSD Annual Report 2016/17
Electricity used for sewage processing by DSD m3 0.202 DSD Sustainability Report 2016-2017
General waste disposal kg 1.5 Carbon Audit Toolkit for Small and Medium
Enterprises in Hong Kong
The Legislative Council Complex Greenhouse Gas Accounting Report 2017-2018
August 2018 Page 29
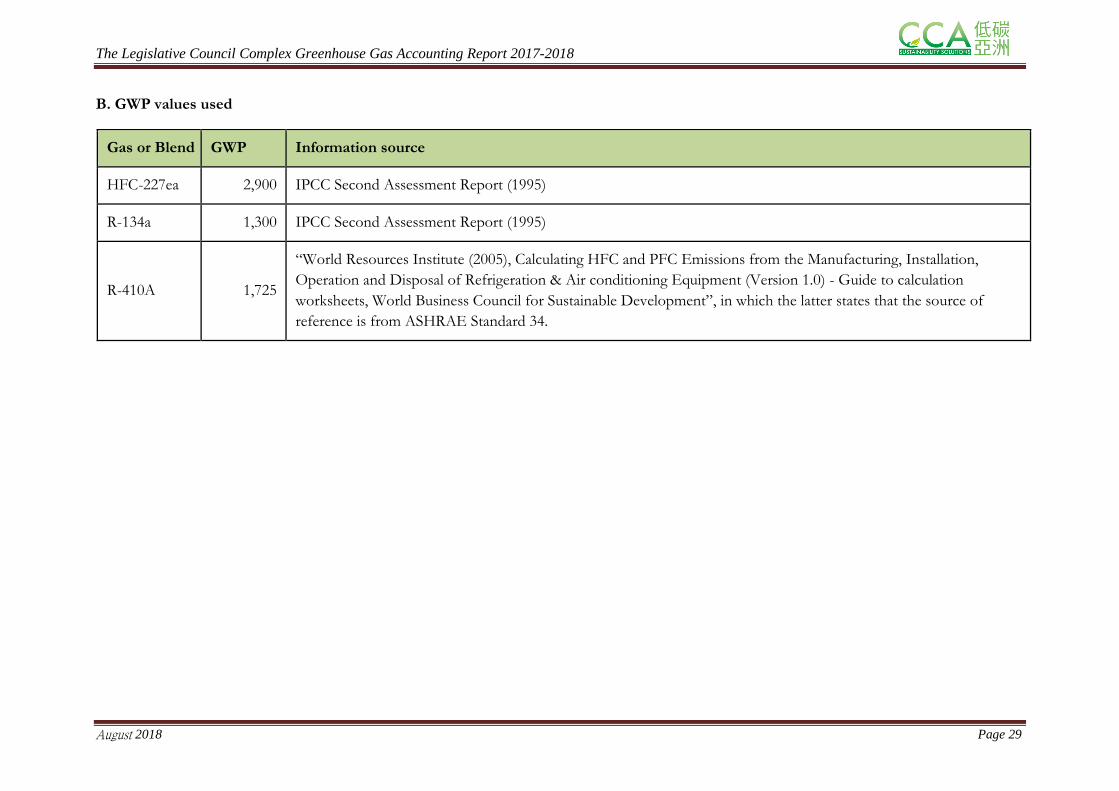
B. GWP values used
Gas or Blend GWP Information source
HFC-227ea 2,900 IPCC Second Assessment Report (1995)
R-134a 1,300 IPCC Second Assessment Report (1995)
R-410A 1,725
“World Resources Institute (2005), Calculating HFC and PFC Emissions from the Manufacturing, Installation,
Operation and Disposal of Refrigeration & Air conditioning Equipment (Version 1.0) - Guide to calculation
worksheets, World Business Council for Sustainable Development”, in which the latter states that the source of
reference is from ASHRAE Standard 34.
The Legislative Council Complex Greenhouse Gas Accounting Report 2017-2018
August 2018 Page 30
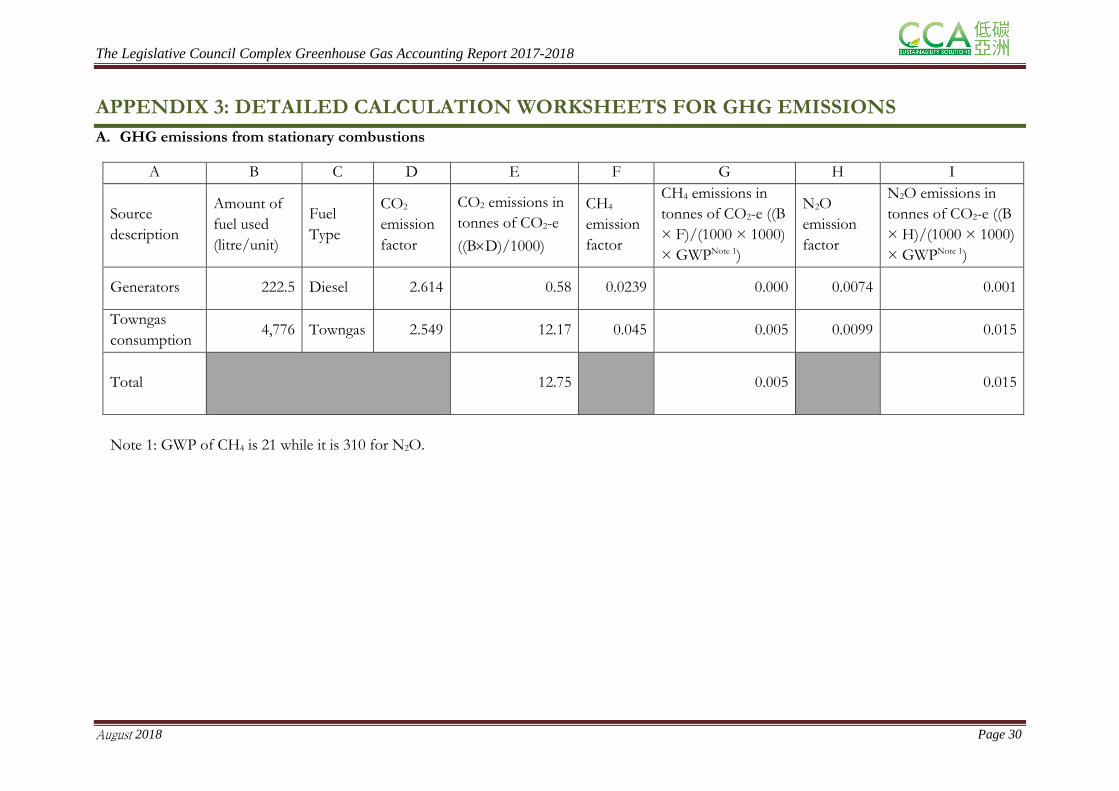
APPENDIX 3: DETAILED CALCULATION WORKSHEETS FOR GHG EMISSIONS
A. GHG emissions from stationary combustions
A B C D E F G H I
Source
description
Amount of
fuel used
(litre/unit)
Fuel
Type
CO2
emission
factor
CO2 emissions in
tonnes of CO2-e
((BD)/1000)
CH4
emission
factor
CH4 emissions in
tonnes of CO2-e ((B
× F)/(1000 × 1000)
× GWPNote 1)
N2O
emission
factor
N2O emissions in
tonnes of CO2-e ((B
× H)/(1000 × 1000)
× GWPNote 1)
Generators 222.5 Diesel 2.614 0.58 0.0239 0.000 0.0074 0.001
Towngas
consumption 4,776 Towngas 2.549 12.17 0.045 0.005 0.0099 0.015
Total
12.75 0.005 0.015
Note 1: GWP of CH4 is 21 while it is 310 for N2O.
The Legislative Council Complex Greenhouse Gas Accounting Report 2017-2018
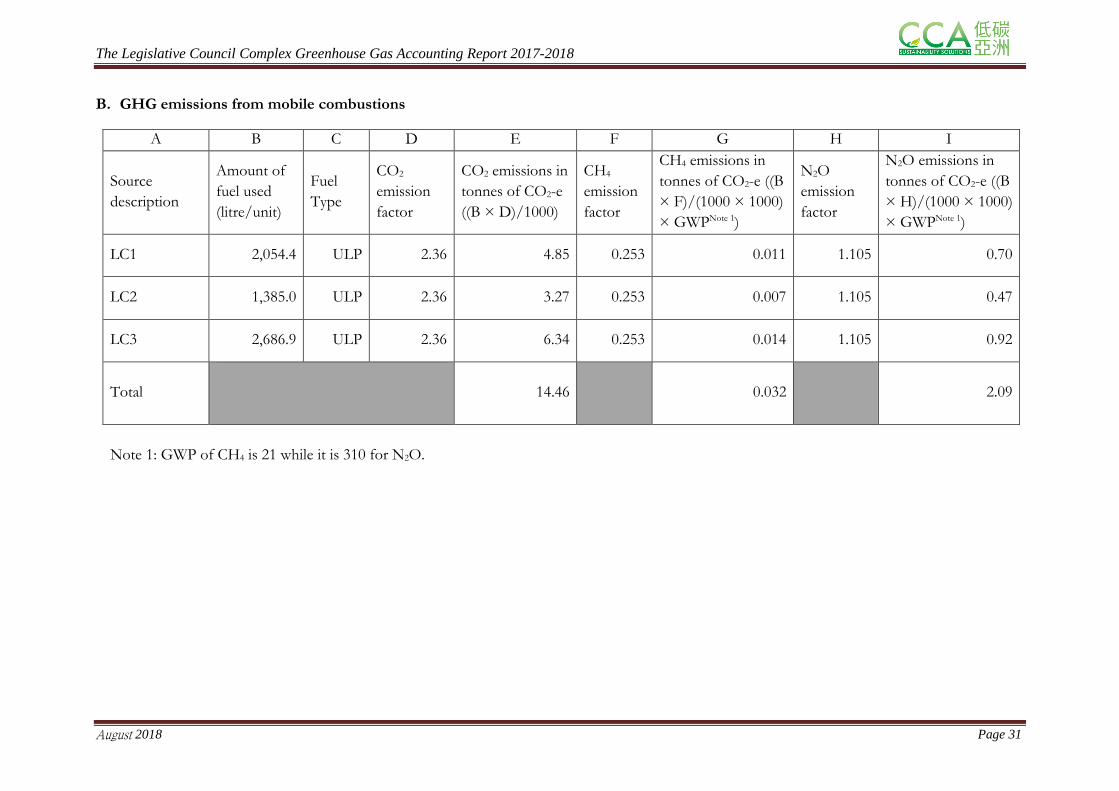
August 2018 Page 31
B. GHG emissions from mobile combustions
A B C D E F G H I
Source
description
Amount of
fuel used
(litre/unit)
Fuel
Type
CO2
emission
factor
CO2 emissions in
tonnes of CO2-e
((B × D)/1000)
CH4
emission
factor
CH4 emissions in
tonnes of CO2-e ((B
× F)/(1000 × 1000)
× GWPNote 1)
N2O
emission
factor
N2O emissions in
tonnes of CO2-e ((B
× H)/(1000 × 1000)
× GWPNote 1)
LC1 2,054.4 ULP 2.36 4.85 0.253 0.011 1.105 0.70
LC2 1,385.0 ULP 2.36 3.27 0.253 0.007 1.105 0.47
LC3 2,686.9 ULP 2.36 6.34 0.253 0.014 1.105 0.92
Total
14.46 0.032 2.09
Note 1: GWP of CH4 is 21 while it is 310 for N2O.
The Legislative Council Complex Greenhouse Gas Accounting Report 2017-2018
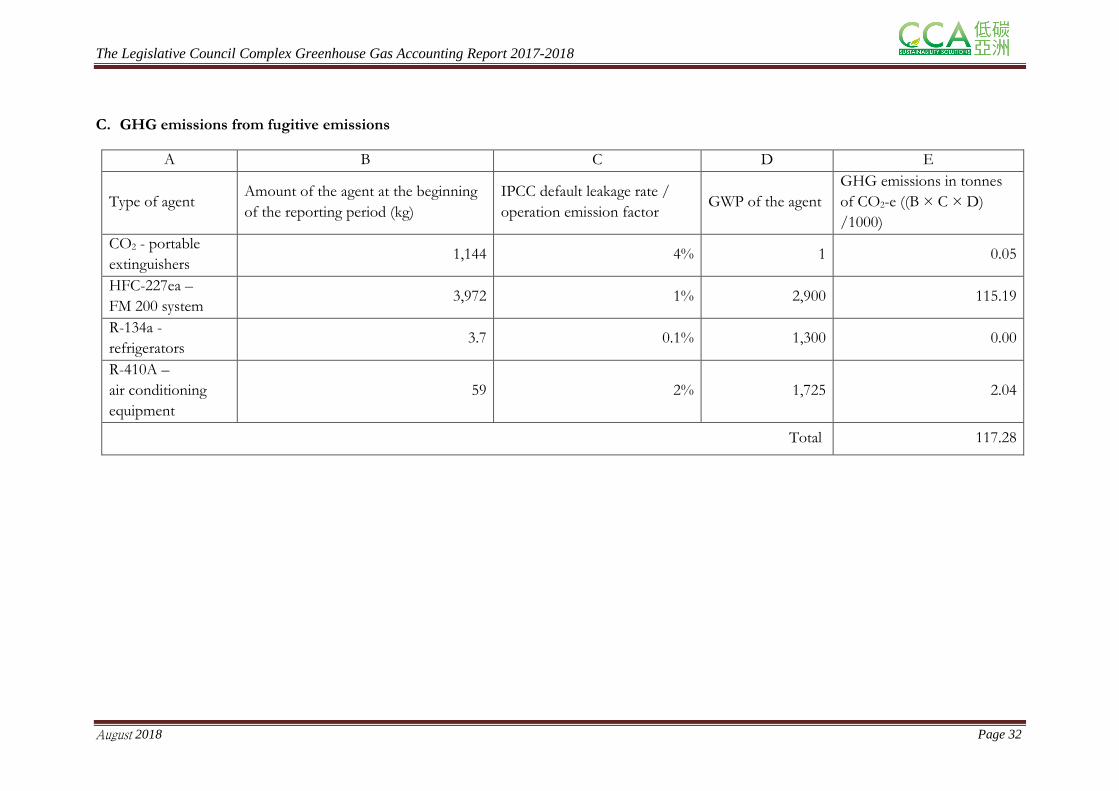
August 2018 Page 32
C. GHG emissions from fugitive emissions
A B C D E
Type of agent Amount of the agent at the beginning
of the reporting period (kg)
IPCC default leakage rate /
operation emission factor GWP of the agent
GHG emissions in tonnes
of CO2-e ((B × C × D)
/1000)
CO2 - portable
extinguishers 1,144 4% 1 0.05
HFC-227ea –
FM 200 system 3,972 1% 2,900 115.19
R-134a -
refrigerators 3.7 0.1% 1,300 0.00
R-410A –
air conditioning
equipment
59 2% 1,725 2.04
Total 117.28
The Legislative Council Complex Greenhouse Gas Accounting Report 2017-2018
August 2018 Page 33
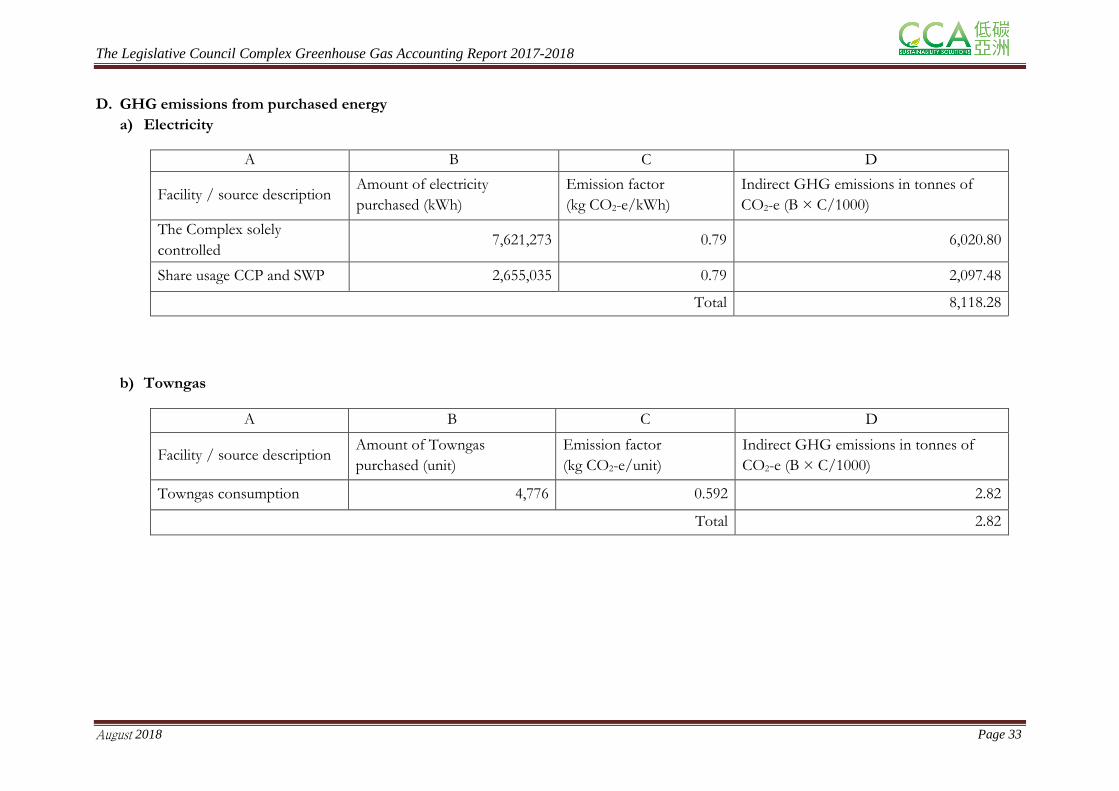
D. GHG emissions from purchased energy
a) Electricity
A B C D
Facility / source description Amount of electricity
purchased (kWh)
Emission factor
(kg CO2-e/kWh)
Indirect GHG emissions in tonnes of
CO2-e (B × C/1000)
The Complex solely
controlled 7,621,273 0.79 6,020.80
Share usage CCP and SWP 2,655,035 0.79 2,097.48
Total 8,118.28
b) Towngas
A B C D
Facility / source description Amount of Towngas
purchased (unit)
Emission factor
(kg CO2-e/unit)
Indirect GHG emissions in tonnes of
CO2-e (B × C/1000)
Towngas consumption 4,776 0.592 2.82
Total 2.82
The Legislative Council Complex Greenhouse Gas Accounting Report 2017-2018
August 2018 Page 34
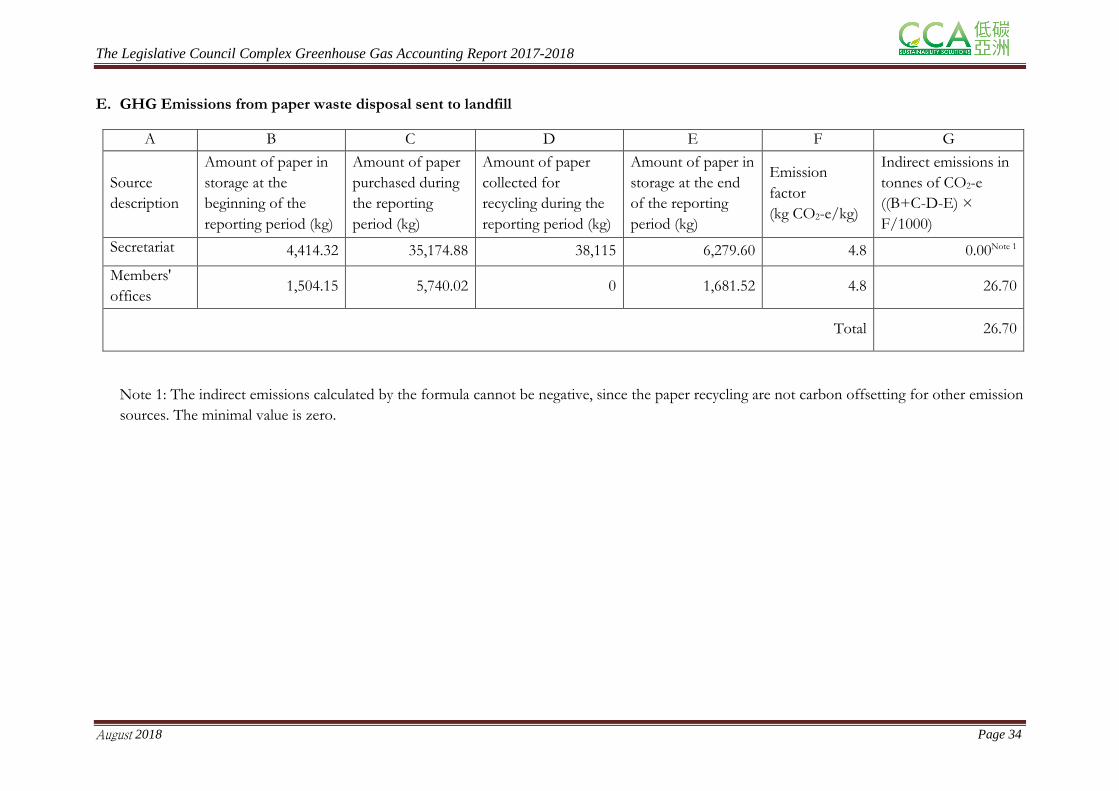
E. GHG Emissions from paper waste disposal sent to landfill
A B C D E F G
Source
description
Amount of paper in
storage at the
beginning of the
reporting period (kg)
Amount of paper
purchased during
the reporting
period (kg)
Amount of paper
collected for
recycling during the
reporting period (kg)
Amount of paper in
storage at the end
of the reporting
period (kg)
Emission
factor
(kg CO2-e/kg)
Indirect emissions in
tonnes of CO2-e
((B+C-D-E) ×
F/1000)
Secretariat 4,414.32 35,174.88 38,115 6,279.60 4.8 0.00Note 1
Members'
offices 1,504.15 5,740.02 0 1,681.52 4.8 26.70
Total 26.70
Note 1: The indirect emissions calculated by the formula cannot be negative, since the paper recycling are not carbon offsetting for other emission
sources. The minimal value is zero.
The Legislative Council Complex Greenhouse Gas Accounting Report 2017-2018
August 2018 Page 35
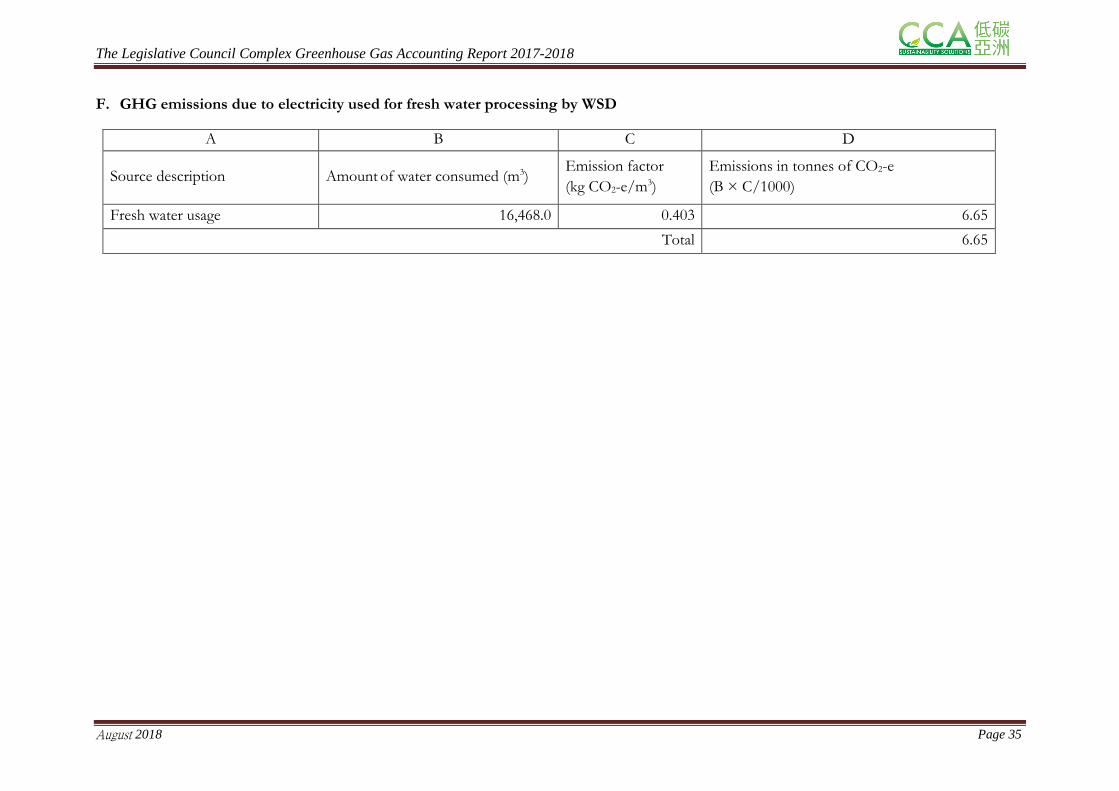
F. GHG emissions due to electricity used for fresh water processing by WSD
A B C D
Source description Amount of water consumed (m3) Emission factor
(kg CO2-e/m3)
Emissions in tonnes of CO2-e
(B × C/1000)
Fresh water usage 16,468.0 0.403 6.65
Total 6.65
The Legislative Council Complex Greenhouse Gas Accounting Report 2017-2018
August 2018 Page 36
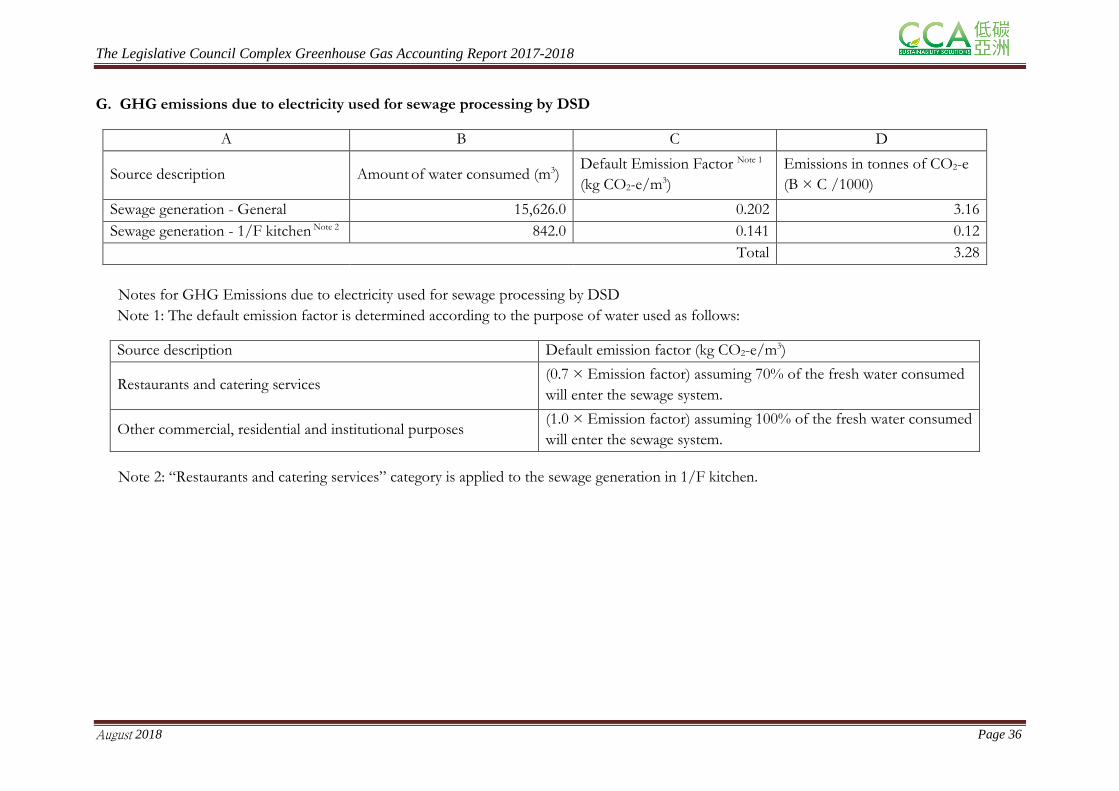
G. GHG emissions due to electricity used for sewage processing by DSD
A B C D
Source description Amount of water consumed (m3) Default Emission Factor Note 1
(kg CO2-e/m3)
Emissions in tonnes of CO2-e
(B × C /1000)
Sewage generation - General 15,626.0 0.202 3.16
Sewage generation - 1/F kitchen Note 2 842.0 0.141 0.12
Total 3.28
Notes for GHG Emissions due to electricity used for sewage processing by DSD
Note 1: The default emission factor is determined according to the purpose of water used as follows:
Source description Default emission factor (kg CO2-e/m3)
Restaurants and catering services (0.7 × Emission factor) assuming 70% of the fresh water consumed
will enter the sewage system.
Other commercial, residential and institutional purposes (1.0 × Emission factor) assuming 100% of the fresh water consumed
will enter the sewage system.
Note 2: “Restaurants and catering services” category is applied to the sewage generation in 1/F kitchen.
The Legislative Council Complex Greenhouse Gas Accounting Report 2017-2018
August 2018 Page 37
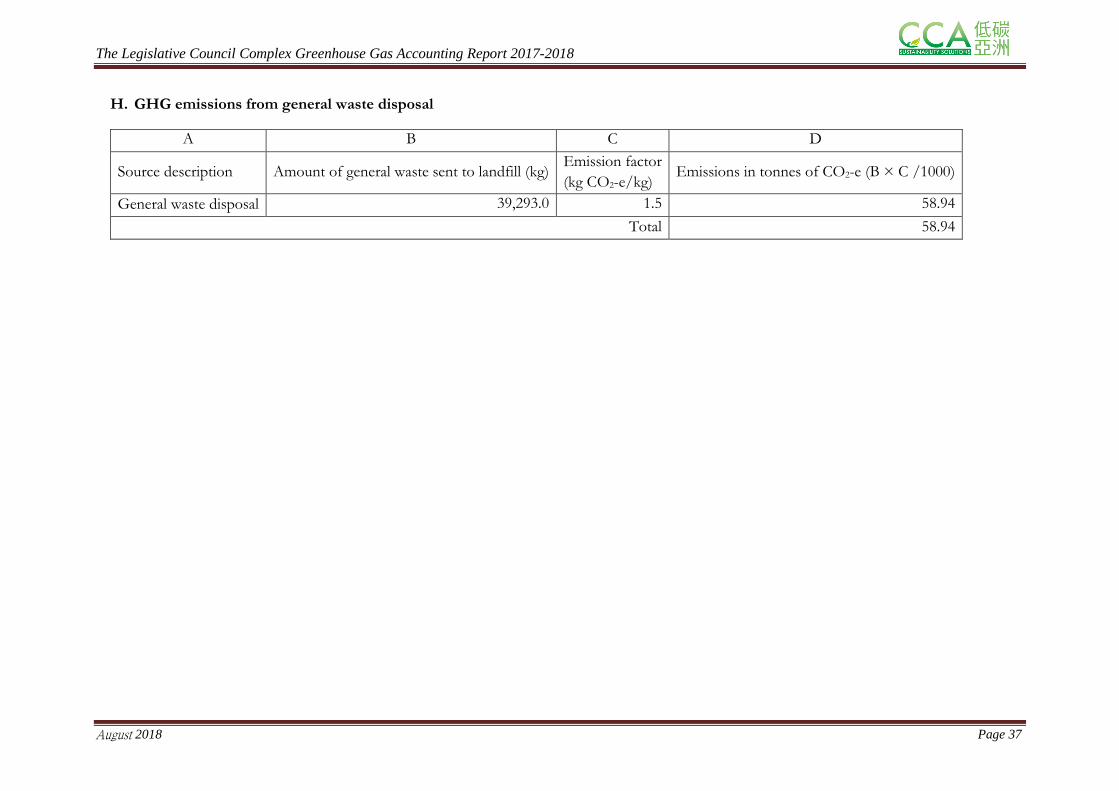
H. GHG emissions from general waste disposal
A B C D
Source description Amount of general waste sent to landfill (kg) Emission factor
(kg CO2-e/kg) Emissions in tonnes of CO2-e (B × C /1000)
General waste disposal 39,293.0 1.5 58.94
Total 58.94

The Legislative Council Complex Greenhouse Gas Accounting Report 2017-2018
August 2018 Page 38
APPENDIX 4: GHG EMISSIONS SUMMARY IN THE BASE YEAR
Summary of GHG emissions accounted for the Complex from 1 April 2013 to 31 March 2014
Emission source in tonnes of CO2-e
CO2 CH4 N2O HFCs PFCs SF6 Sub-total
Scope 1 Direct Emissions
Combustion of fuels in stationary sources – diesel used in generators 6.36 0.00 0.01 N/A N/A N/A 6.37
Combustion of fuels in stationary sources – Towngas consumption 11.68 0.00 0.01 N/A N/A N/A 11.70
Combustion of fuels in mobile sources – petrol used in the
Commission owned vehicles 11.59 0.03 1.68 N/A N/A N/A 13.30
Unintentional GHG release from equipment and system 0.05 N/A N/A 117.23 N/A N/A 117.28
Scope 2 Energy Indirect Emissions (To be reported in general without being classified into specific gas type)
Electricity purchased from The Hongkong Electric Company
Limited 7,947.97
Towngas purchased from The Hong Kong and China Gas Company
Limited 2.74
Scope 3 Other Indirect Emissions ( GHG emission from fresh water processing and sewage discharge disposal to be reported in
general without being classified into specific gas type)
Methane gas generation at landfill in Hong Kong due to disposal of
paper waste N/A 28.41 N/A N/A N/A N/A 28.41
GHG emissions due to electricity for fresh water processing by WSD
3.79
GHG emissions due to electricity used for sewage processing by
DSD 1.73
Methane gas generation at landfill in Hong Kong due to general
waste disposal N/A 40.30 N/A N/A N/A N/A 60.06