the late-stage analytical method lifecycle - risk-based validation and extension strategies (cder...
TRANSCRIPT

1
The Late-Stage Analytical Method Lifecycle: Risk-based Validation and Extension Strategies
CDER/OBP CMC Reviewer TrainingBethesda, MD 25June12
Stephan O. Krause, Ph.D.
Principal Scientist, Analytical Biochemistry
MedImmune

2
The Late-Stage Analytical Method Lifecycle: Risk-based Validation and Extension Strategies
Agenda:
Overview of Analytical Method Validation and Transfer for Biotechnological Products (PDA Technical Report)
AMV - Readiness Assessment Process
Risk-Based Acceptance Criteria
Analytical Method Validation (AMV) Studies and Compendial Method Verification Studies for each Method Type
Analytical Method Transfer (AMT)
Analytical Method Replacement (AMR)
Analytical Method Maintenance (AMM)
Dealing with AMV Failures
(Not covered in detail)
(Covered here in some detail with brief case studies)
Krause/PDA, 2012

3
AMV/AMT TR Task Force Team Members
AUTHORSStephan O. Krause, Ph.D., Chair, MedImmune, USAFlorence Baudoux, Ph.D., GlaxoSmithKline, BelgiumPierre Douette, Ph.D., Eurogentec S.A., BelgiumNicole Gibelin, Ph.D., Sanofi Pasteur, FranceAlice E. Grebanier, Ph.D., Centocor R&D, USARajesh Krishnamurthy, Ph.D., Zyngenia, Inc., USACarl-Gustav, Millinger, Ph.D., Swedish Orphan Biovitrum, SwedenFrank Moffatt, Ph.D., Solvias AG, SwitzerlandDwayne Neal, SAIC-Frederick, Inc., USAPhillip Ramsey, SAIC-Frederick, Inc., USAMichael Rooney, Ph.D., BioTechLogic, USAMelissa J. Smith, MJ Quality Solutions, USAMichael Warncke, Ph.D., Bayer HealthCare, USAEarl K. Zablackis, Ph.D., Sanofi Pasteur, USA
CONTRIBUTORSPatricia W. Cash, Ph.D., MedImmune, USALarissa Chirkova, Novozymes, AustraliaMarta Germano, Pharming Technologies, The NetherlandsSiegfried Giess, Ph.D., Paul-Ehrlich Institute, GermanyRichard V. Levy, Ph.D., Parenteral Drug Association, USAGenevieve Lovitt-Wood, G.I. Lovitt & Associates, USARashmi Rawat, Ph.D., Food and Drug Administration/CDER, USA
Krause/PDA, 2012

4
AMV/AMT TR - Peer Review
FDA (CDER), PEI (European perspective), and PDA scientific and biotech advisory boards (all members voted in favor of publishing) reviewed and positively commented on our TR document.
“Many thanks for giving me the opportunity to review your Draft Technical Report. I think you have developed a document which covers the topic of method validation and transfer in a very comprehensive way. The combination of a risk based guidance, taking into account the analytical method life cycle, and the basic ICH Q2(R1) guideline gives a good basis for an up to date approach to analytical method validation. From my point of view the advantage of this report is that it covers not only the classical validation process but also method transfer, comparability and maintenance. Another advantage is that the report gives a lot of guidance regarding the details of the different validation steps. I think you have developed a very helpful document not only for lab people but also for assessors. I hope that many companies will use this document in the future.”
(Dr. Siegfried Giess
Head, Section of Immunochemistry
Paul-Ehrlich-Institute)
Krause/PDA, 2012

5
AMV TR Introduction – The Analytical Method Life Cycle
Not covered in AMV TR (in AMD TR !)
Sections 1 and 3 in AMV TR
Section 4 in AMV TR
Sections 5-8 in AMV TR
Krause/PDA, 2012
An
aly
tica
l Meth
od
De
ve
lop
me
nt
An
aly
tica
l Meth
od
V
alid
atio
n
(Po
st-V
alid
atio
n) L
ife
Cy
cle
Ste
ps
Select and Design – Establish Intended Use of Analytical Procedure
Development and Optimization
Performance Review, Qualification
Validation Acceptance Criteria
Validation
Post-Validation Life Cycle Steps
Transfer of Methods
Validation Prerequisites Assessment
IdentityImpurity
LimitImpurity Quantity
Assay / Potency
Tech Transfer
Resource Assessment
Standards and Controls
StabilityVerify Product Specifications
Maintenance Transfer Comparability Study
OOS/Valiation Failures
(Covered in more detail with brief case studies)

6
SpecificityPrecisionAccuracy
QL/DLLinearityRange
Robustness Data
Regulatory Requirements
Validation Risk Assessment that method meets intended use
StandardsControls
Stability of Reagents, Samples
Existing Knowledge
(Product and Process)
AMV Protocol
No
Is Method ready for
Validation?
Collect more data
and/or optimize method
AMV Acceptance Criteria
Specification to meet
Documented Summary of
Method Performance
Characteristics (Handover Package,
Development Report)
Yes
Documented Intended Use
Example of Assessment Process of AMV Readiness
Krause/PDA, 2012

7
General AMV Risk Assessment Strategy
The purpose of risk assessment(s) for AMV studies is to provide measurable results for:
1) The desired amount of formal validation studies to be executed.
2) The level of method performance needed as manifested in the AMV protocol acceptance criteria.
Krause/PDA, 2012

8
The Five General AMV Classes and Prospective AMV Studies
AMV Class Description Typical Risk /
Uncertainty Level (1=Low, 5=High)
Suggested Prospective AMV Studies
AMV Class No.
Analytical MethodProduct /
Process Sample
A New New 4-5 Full Validation
B New Old (Validated) 3-4(1) Full Validation Plus AMR(2) Studies
CAnalytical Platform
Technology (not validated “as run”)
New 2-3 Partial Validation
D Old (Validated) New 1-2Partial Validation or
Verification
E Compendial New 1-2Verification per USP
<1226>
(1) If a new analytical method (forced method replacement) is needed due to supply reasons, the risk level can be generally considered higherbecause no other option may exist. Unforced test method replacements can be considered to be a lower risk level as more time may be availableto optimize the method performance.
(2) AMR = Analytical Method Replacement. A study to confirm that a new analytical method can perform equally or better than the existing one.
From Krause, PDA/DHI 2007.
9
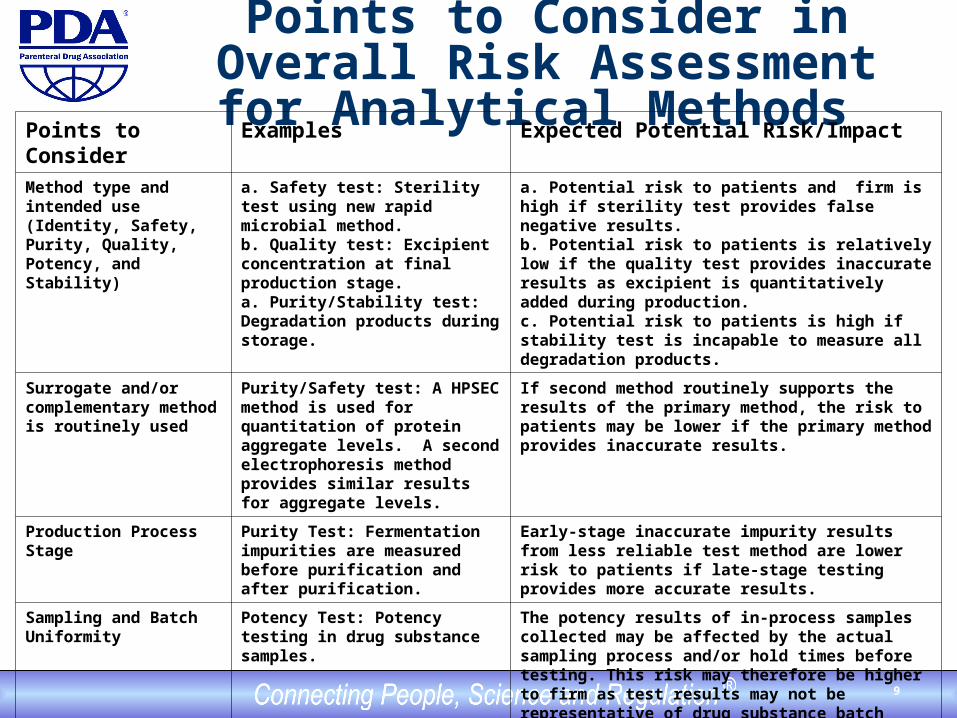
Points to Consider in Overall Risk Assessment for Analytical Methods
Points to Consider Examples Expected Potential Risk/Impact
Method type and intended use (Identity, Safety, Purity, Quality, Potency, and Stability)
a. Safety test: Sterility test using new rapid microbial method.b. Quality test: Excipient concentration at final production stage.a. Purity/Stability test: Degradation products during storage.
a. Potential risk to patients and firm is high if sterility test provides false negative results.b. Potential risk to patients is relatively low if the quality test provides inaccurate results as excipient is quantitatively added during production.c. Potential risk to patients is high if stability test is incapable to measure all degradation products.
Surrogate and/or complementary method is routinely used
Purity/Safety test: A HPSEC method is used for quantitation of protein aggregate levels. A second electrophoresis method provides similar results for aggregate levels.
If second method routinely supports the results of the primary method, the risk to patients may be lower if the primary method provides inaccurate results.
Production Process Stage Purity Test: Fermentation impurities are measured before purification and after purification.
Early-stage inaccurate impurity results from less reliable test method are lower risk to patients if late-stage testing provides more accurate results.
Sampling and Batch Uniformity
Potency Test: Potency testing in drug substance samples.
The potency results of in-process samples collected may be affected by the actual sampling process and/or hold times before testing. This risk may therefore be higher to firm as test results may not be representative of drug substance batch prior to filling.
Analytical Platform Technology (APT)
Purity test: APT HPSEC method is used to test in-process samples.
Current QC experience with this method performance should lower the risk to patient and/or firm if the effect of different sample types is insignificant.

10
Risk-Based AMV Protocol Acceptance Criteria
Specifications
Consider Type of
Specifications
Acceptance Criteria
Existing Knowledge
One-Sided Specifications(NMT, NLT, LT)
Two-Sided Specifications
(Range)
Regulatory Requirements
Historical Method
Performance
Historical Data from this
Product and Process
Knowledge from Similar Product and
Process
Krause/PDA, 2012
11
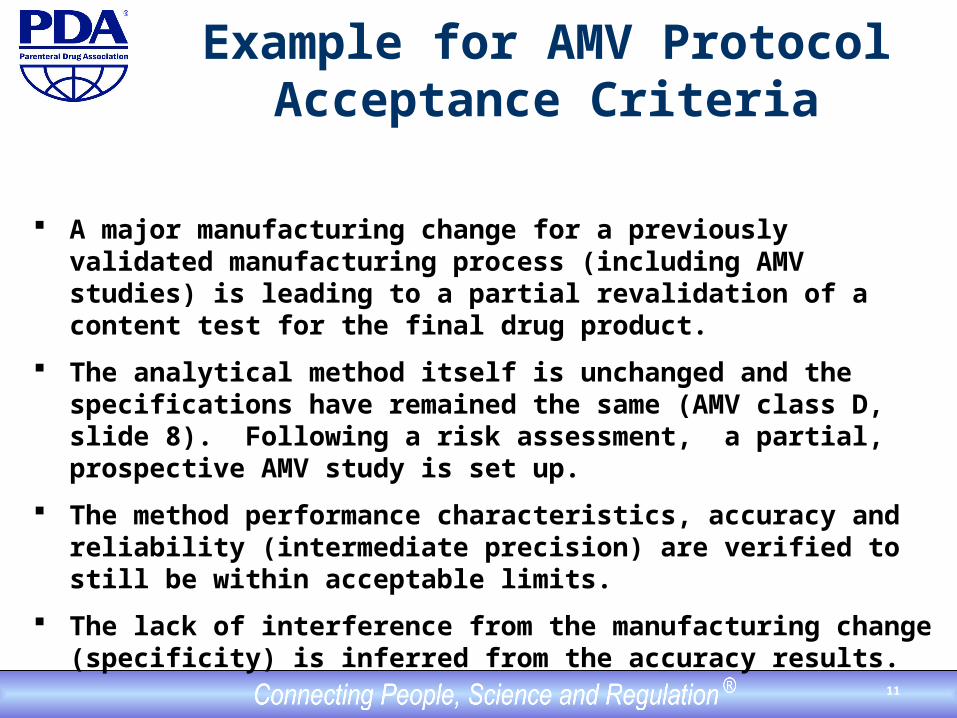
Example for AMV Protocol Acceptance Criteria
A major manufacturing change for a previously validated manufacturing process (including AMV studies) is leading to a partial revalidation of a content test for the final drug product.
The analytical method itself is unchanged and the specifications have remained the same (AMV class D, slide 8). Following a risk assessment, a partial, prospective AMV study is set up.
The method performance characteristics, accuracy and reliability (intermediate precision) are verified to still be within acceptable limits.
The lack of interference from the manufacturing change (specificity) is inferred from the accuracy results.

12
Historical Data for Manufacturing Process, Assay Performance, and Suggested Limits for Accuracy and (Intermediate) Precision
Specifications 90 – 110 %
Statistics Mean (in %) SD (in %)
Statistical Process Control: Manufacturing Process Performance (last n=30)
100.2 5.0
Assay Control Performance (last n=30)1 102.3 3.0
From Previous AMV Studies: Intermediate Precision of Assay Control (total n=36)
99 2.0
From equation 3.2.1-1: Actual (True) Process Performance (estimate) (100) (4.0)
Suggested AMV Limits for Overall Accuracy 98 – 102 -------
Suggested AMV Limits for Intermediate Precision ------- 3.0
2actual process mfg 2
method analytical2
observed process mfg
222 %0.4%0.3%0.5
Relationship of Variation Sources:
1The current assay control limits were set during/after AMV studies and have remained unchanged. Results are routinely
reported to the specification units (100 %) while descriptive statistics are given to the 1/10th of the reported unit (100.0 %).

13
Acceptance Criteria Justification
Accuracy: When using the acceptance criteria of 98 – 102 %, a resulting worse-case midpoint shift of up to 2% is considered acceptable. The specifications are still more than two standard deviations away is the worse-case (result drift of 2%). The previous AMV study results for accuracy of 99 % mean recovery, in addition to the recent assay control data (unchanged), suggest that these acceptance criteria should be readily passed and appears to be sufficiently “balanced”.
(Intermediate) Precision: When using the acceptance criteria of 3.0 % under similar AMV conditions as previously executed (2.0 %; n=36 total results for Intermediate Precision), an equal-or-better performance is expected when compared to the historical assay control performance (3.0%) which was generated over several months with a maximum variety of method components. Compared to the previous AMV study results (2.0 %) and the historical assay control data variation (3.0%), the acceptance criteria for Intermediate Precision appear to be properly “balanced”.

14
Verification Characteristics to be Evaluated for Typical Compendial Method Types
Method Types Typical SpecificationsTypical Minimum Verification Characteristics To be Evaluated
Identification Yes/NoPresent/AbsentPass/FailConsistent/Inconsistent
Selected or prepared relevant (blind) samples should be correctly identified to demonstrate specificity. Positive and, if applicable, negative identification should be demonstrated.
Impurity (Quantitative)
No More Than Accuracy (against an acceptable reference standard) and repeatability and/or intermediate precision should be demonstrated using representative sample(s) below and above the QL.
Impurity (Limit) Less Than It should be demonstrated that impurity levels at or above the DL are reliable and can be detected in routine QC testing conditions.
Assay (Content, Potency, and/or Purity)
Range (for Content, Potency)No Less Than (for Purity)
Accuracy (against an acceptable reference standard) and repeatability and/or intermediate precision should be demonstrated using representative sample(s) within below and above the specifications.

15
General AMT Strategy
Co-validation/Co-qualification – this may be used early in the life cycle of a test method when appropriate.
Comparative study – AMT study performed concurrently by sending and receiving laboratories. Acceptance criteria determine the equivalence of the two laboratories. Historical and validation data may be used when appropriate for parts of the method transfer study. The sending laboratory typically has collected a significant amount of historical data for test method performance results in addition to test results for the samples to be tested at the receiving laboratory.
Performance Verification - The receiving laboratory may already perform the method for a similar product or for another type of sample for the same product. In this case, a formal method transfer may not be required. Any reduced prospective study considered should be properly justified.
Krause/PDA, 2012

16
“Fixed” vs. “Variable” AMT Execution Matrix
A fixed execution matrix does not integrate test method result variation. A fixed execution matrix can be more advantageous when transferring multiple products to/from multiple locations.
A variable execution matrix does consider test method result variation and may require a larger data comparison, especially for test methods with relatively high result variation. For example, a variable execution matrix may be advantageous when transferring bioassays with an expected high degree of test result variation.
Krause/PDA, 2012

17
Typical “Fixed” AMT Execution Matrix for Late-Stage/Commercial Products
Laboratory Day Analyst Instrument Replicates Lot Number
Sending 1 1 1 3 1 Sending 1 2 2 3 1 Sending 2 1 1 3 2 Sending 2 2 2 3 2 Sending 3 1 1 3 3 Sending 3 2 2 3 3 Receiving 1 1 1 3 1 Receiving 1 2 2 3 1 Receiving 2 1 1 3 2 Receiving 2 2 2 3 2 Receiving 3 1 1 3 3 Receiving 3 2 2 3 3
From Krause, PDA/DHI 2007.

18
Analytical Method Transfer (AMT) Example
A validated analytical method for potency is to be transferred from the original QC laboratory to another QC laboratory to release drug product (DP). The analytical method generates potency (dose) results for lyophilized DP.
The vials are available in three nominal doses between 500 – 2000 IU/vial using an identical formulation. Release testing is performed using three replicate preparations from each of three vials.
Before analysis the content of a vial is reconstituted with 5.0 mL of WFI water and the potency is measured in IU/mL (100 – 400 IU/mL).
The samples and a product-specific reference standard are prepared similarly. The analytical method procedure and statistical evaluation are performed with the parallel-line concept.
The “variable” AMT model is used.

19
AMT Study Design and Acceptance Criteria
Characteristics Evaluated
Accuracy/Matching:The relative difference between lab means should at 90% confidence not be less than -Θ= 10% and not more than +Θ = 10%. The 10% difference limit was set with consideration of product specification.Intermediate Precision:RSD 6 % for all sample types, with appropriate homoscedasticity throughout the potency range (from validation results). This means that any RSD from a sample of n=8 should not exceed 9.43 % (1)
Number of Replicates
Nreplicates = at least 23 independent replicates(2)
The confidence interval for the lab-to-lab difference for N determinations to less than the [10%, +10%]. As above the 10% difference limit was set with consideration of product specification.
Samples to test Nlevel = 3
The range of potency/dosing results is covered by: Lowest dose 500 IU/vial or 100 IU/mLMedium dose 1000 IU/vial or 200 IU/mLHighest dose 2000 IU/vial or 400 IU/mL
Testing design, each sample
Number of operators, n = 2Number of days, n = 2Number of replicates per day per operator, n = 2N = 8 in each lab for each of n= 3 potency levels. Results are converted to “% recoveries vs. expected” to allow pooling Total NTotal = 24 individual observations will be recorded for each laboratory. N=24 individual
observations are needed as N=23 is the minimum number of replicates calculated.
2343.92
22
2
222/
10
)6449.196.1(22
IPszzn

20
AMT Results from Sending and Receiving Labs
Theoretical Potency Level
in IU/mLOperator Day Replicate
Sending lab Receiving lab
Experimental Potency in IU/mL
%Recovery vs. Theoretical
Potency
Experimental Potency in IU/mL
%Recovery vs. Theoretical
Potency
100 1 1 1 103 103.0 95 95.0
100 1 1 2 104 104.0 99 99.0
100 1 2 1 108 108.0 104 104.0
100 1 2 2 101 101.0 103 103.0
100 2 1 1 94 94.0 93 93.0
100 2 1 2 99 99.0 96 96.0
100 2 2 1 102 102.0 92 92.0
100 2 2 2 104 104.0 100 100.0
200 1 1 1 212 106.0 208 104.0
200 1 1 2 208 104.0 192 96.0
200 1 2 1 191 95.5 199 99.5
200 1 2 2 201 100.5 195 97.5
200 2 1 1 204 102.0 208 104.0
200 2 1 2 206 103.0 211 105.5
200 2 2 1 198 99.0 203 101.5
200 2 2 2 200 100.0 183 91.5
400 1 1 1 375 93.8 383 95.8
400 1 1 2 401 100.3 401 100.3
400 1 2 1 408 102.0 389 97.3
400 1 2 2 388 97.0 391 97.8
400 2 1 1 402 100.5 408 102.0
400 2 1 2 415 103.8 421 105.3
400 2 2 1 406 101.5 415 103.8
400 2 2 2 410 102.5 403 100.8

21
AMT Result Summary from Sending and Receiving Labs
(1) Raw data was used unrounded. Upper and lower 90% CIs were calculated using equation:
(2) Equal variance was confirmed using an F-test to justify the pooling of the standard deviation.
Separate and Pooled Potency Levels Evaluated
Sending lab Receiving lab
Statistical Parameters
%Recovery vs. Theoretical
Potency
Statistical Parameters
%Recovery vs. Theoretical
Potency
TOST with acceptance criteria [-10%, +10%] (1)
N1 24 N2 24
Mean1 101.1 Mean2 99.3
SD 3.5 SD 4.2
RSD 3.4 RSD 4.2
Pooled SD(2) 3.9
Mean1-Mean2 1.8
t-value 1.679
Upper 90% CI limit(1) 4 (3.6)
Lower 90% CI limit(1) 0 (-0.1)
Transfer Acceptance Conclusion Pass
212,2121
11)(
21 nnstxx pnn

22
Graphical Representation of Potency Results Per Potency Level Between Laboratories
The boxes represent the 25th – 75th percentile distribution of the results for the two laboratories. Medians (line in the box) and means (cross in the box) are approximately centered while the medians are equidistant from the box hinges, providing a visual indication for a normal data distribution(s) among data points within each laboratory set.
One potential outlier (lower open circle outside of the whiskers) is observed in the sending lab, however, this does not change the overall interpretation for the demonstration of lab-to-lab equivalence.
The variation in the test results (wider 25th – 75th percentile boxes) appears to be higher in the receiving laboratory which may be attributed to less test method execution experience.
80
90
100
110
120
Sending lab Receiving lab
%R
eco
very
ver
sus
theo
reti
cal
po
ten
cy (
in%
)

23
Graphical Representation of the Combined Percent Recoveries Between Laboratories for all Concentration Levels

24
Analytical Method Replacement (AMR) Categories (from ICH E9)
Equivalence
Non-inferiority
Superiority
Krause/PDA, 2012

25
Analytical Method Replacement Suggested Performance Comparison Characteristics and Statistics
ICH Q2(R1) Category
Identification Test
(Qualitative)
Limit Test (Qualitative)
Limit Test (Quantitative)
Potency or Content (Purity
or Range) (Quantitative)
Accuracy Not Required Not Required T-test, TOST; Some Data could be at QL level
T-test, TOST
Intermediate Precision
Not Required Not Required ANOVA, mixed linear model, or other F-test statistics
ANOVA, mixed linear model, or other F-test statistics
Specificity Probability and/or Chi-Squared for Number of Correct Observations
Probability and/or Chi-Squared for Number of Correct Observations
Not Required Not Required
Detection Limit
Not Required Depends on how DL was established. Probability calculations may be used
Not Required Not Required
Krause/PDA, 2012

26
Demonstrating Equivalence
Equ
ival
ence
Lim
it
-90
% C
I
- Delta 0 + Delta
+90
% C
I New Method
“Lower Results”New Method
“Higher Results”
Equ
ival
ence
Lim
it
No difference
Mea
n D
iffer
enc
e
Equivalence Testing (ICH E9)Current Method = ReferenceEquivalence Demonstrated
Krause/PDA, 2012

27
Demonstrating Non-Inferiority
Non
-Inf
erio
rity
Lim
it
-95
% C
I
- Delta 0
+95
% C
I
Current Method “Better Results”
New Method “Better Results”
No difference
Mea
n D
iffer
ence
Non-inferiority Testing (ICH E9)Current Method = ReferenceNon-Inferiority Demonstrated
Desirable Direction/Range
Krause/PDA, 2012

28
Demonstrating Superiority
-95
% C
I
0
+95
% C
I
Current Method “Better Results”
New Method “Better Results”No difference
Mea
n D
iffer
ence
Superiority Testing (ICH E9)Current Method = Reference
Superiority Demonstrated
Sup
erio
rity
Lim
it (0
)
Desirable Direction/Range
Krause/PDA, 2012

29
Demonstrating EquivalenceSimplified Case Study
Because of anticipated supply problems for critical SDS-PAGE materials, it was decided to develop and validate a capillary zone electrophoresis (CZE) method that will replace the current (licensed) electrophoretic method. The method performance characteristics for a quantitative limit test, accuracy and intermediate precision, are compared. For accuracy: A delta of plus/minus 1.0% was chosen for the equivalence category between both impurity levels from the analysis of historical release and stability data with respect to the current specifications (for SDS-PAGE). Both methods were run simultaneously (side-by-side) for each of a total of n=30 reported results were compared by two-sided matched-paired t-test statistics with pre-specified equivalence limits of plus/minus 1.0% (% = reported percent and not relative percent).
Krause/PDA, 2012

30
Demonstrating Equivalence Results
Equivalence Test Results Comparing Current Method to CZE: Sample Size (n): 30 Hypothesized Difference in Mean: 0% Minus Delta: -1.0% Plus Delta: +1.0% SDS-PAGE Mean (n=30): 3.8% CZE Mean (n=30): 5.1% 90% confidence interval of CZE results (vs. SDS-PAGE): 4.88-5.32%
Krause/PDA, 2012

31
Equivalence of New Method Not Demonstrated(New method’s result are different)
Krause/PDA, 2012
Equ
ival
ence
Lim
it
- Delta 0 + Delta
New Method “Lower Results”
New Method “Higher Results”
Equ
ival
ence
Lim
it
No difference
- 9
0% C
I
+ 9
0% C
I
- 9
0% C
I
+ 9
0% C
I
- 9
0% C
I
+ 9
0% C
I
- 9
0% C
I
+ 9
0% C
I
- 9
0% C
I
+ 9
0% C
I Passes Equivalence (stat. different)
Passes Equivalence (stat. not different)
Passes Equivalence (stat. different)
Equivalence Unclear(stat. different)
Fails Equivalence (stat. different)

32
Demonstrating Non-InferiorityIntroduction
A faster and technologically advanced method for sterility testing was validated and compared to the compendial EP/USP Sterility Test.
The non-inferiority comparison at the 95% confidence level (p=0.05) was
chosen with a pre-specified delta of –10% versus the compendial (current) method.
Justification: Non-inferiority, equivalence, and superiority are all acceptable
outcomes, and the increased testing frequency of daily (n=7 per week) for the new sterility versus twice weekly (n=2 per week) for the EP/USP Sterility test significantly increases the likelihood of detecting organisms with the new method.
Results/Conclusion: The 95% confidence level includes 0 (no difference) and
lies entirely to the right of the pre-specified delta of –10%. The comparison results obtained indicate that the candidate method is not inferior to the EP/USP sterility test method.
Krause/PDA, 2012

33
Demonstrating Non-InferiorityResults for the Non-Inferiority Test: Candidate Method vs. USP Sterility
Krause/PDA, 2012
Method Positives Total Samples Positives-to-Fail Ratios
Candidate 225 300 0.75
EP/USP 232 300 0.77
Statistical Results
Difference = p (new method) - p (EP/USP)Estimate for difference: -0.02395% lower confidence interval limit for difference: -0.08
Results/Conclusion: The 95% confidence level includes 0 (no difference) and lies entirely to the right of the pre-specified delta of –10%. The comparison results obtained indicate that the candidate method is not inferior to the EP/USP sterility test method.

34
Non-Inferiority of New Method (vs. Current/Compendial) Demonstrated
Krause/PDA, 2012
No
n-I
nfe
rio
rity
Lim
it
-9
5%
CI
- Delta 0
+9
5%
CI
EP/USP Method “Better Results”
Candidate Method “Better Results”No difference
Me
an
Diff
ere
nce

35
Demonstrating SuperiorityIntroduction
From the previous example for non-inferiority: When the relative testing frequency of our example of n=7 (new method) versus n=2 for the compendial method is integrated in our comparison studies, the superiority of the new method could be demonstrated.
Krause/PDA, 2012

36
Demonstrating SuperiorityResults
Candidate Method (7x) vs. EP/USP Sterility (2x): Sample Positives Total Probability 95% CI for Probability Candidate 225 300 0.9999 0.9997 – 1.0000 EP/USP 232 300 0.947 0.921 – 0.967
Krause/PDA, 2012
Results/Conclusions: Superiority at the 95% confidence level could be demonstrated because the new method’s 95% confidence interval (0.9997-1.0000) for the positive-to-fail probability (0.9999) lies entirely to the right of the 95% confidence interval (0.921-0.967) of the compendial method’s positive-to-fail probability (0.947).
The superiority test was passed with a much greater relative margin than the non-inferiority test. This is a good example why we should always consider upfront which comparison study to select and how to defend our strategy in regulatory submission.

37
Superiority of New Method (vs. Current/Compendial) Demonstrated
Krause/PDA, 2012
92
.1%
94
.7%
91% 92% 93% 94% 95% 96% 97% 98% 99% 100%
96
.7%
USP/EP Method “Better”
Candidate Method “Better”
USP/EP
Probability:
99
.97
%
99
.99
%
10
0.0
0%
Candidate Method(not drawn to scale)

38
Analytical Method Maintenance (AMM)
VMP for Analytical Methods
AMC AMM
AMVProcess Map Steps
Method Modifications Method Review
Critical Method Elements
Standards and Controls Critical Reagents
Software/Computer Analytical Instrumentation
Statistical Data Reduction New/Additional Operator
Emergency Reviews(OOS, many invalids)
Periodic Reviews(Short and Long Term)
Quarterly or Annual Reviews Extensive Reviews
Prospective Retrospective
Krause, 2005.

39
AMM - Continuous Review Example: Combining Laboratory and Manufacturing Control Charts
88
92
96
100
104
108
112
0 10 20 30 40 50 60
Sequential Batches Tested (last n=60)
Po
ten
cy
(in
un
its
/mL
)
SPC
Assay Control
Upper Specifications
Lower Specifications
SPC Mean
(101.0 units/mL)
Assay ControlMean (99.0 units/mL)
Krause/PDA/DHI, 2007.

40
AMM - Simplified Example: Extensive Method Performance Evaluation
Krause/PDA/DHI, 2007.
AMV and Method Performance Verification Checklist Results Comments
Test Method Number/Title/Revision:
Process Step/Product Sampling Point(s):
Most Recent Validation/Verification Date:
Specifications Supported:
ICH Q2(R1) Test Method Category:
Suitable Overall Performance Demonstrated in AMV Report ?
Changes to Test System After AMV Studies ?If yes, provide more information:
Number of Valid Test Runs Over Last 12 Months
Number of Invalid Test Runs Over Last 12 Months
Calculate Invalid Rate/Percentage:
Current System Control Limits (ex., 3 Standard Deviations):
Test System in Control ?
Method Performance Acceptable ?If no, provide more information:
QC Signature:
QA Signature:

41
Dealing with AMV Failures
Justify Wider Acceptance Criteria
Keeping Original Data
InitiateInvestigation
Optimize Analytical Method
Tighten Operational Limits
CorrectExecution Error
Re-executeValidation
Validation “Successful” and
“Compliant”
OriginalAcceptance CriteriaMet and Validation
Completed
Evaluate AMV Acceptance Criteria
IdentifiedRoot Cause
Method Determined Unacceptable
ValidationAcceptance
CriteriaFailure
Krause/PDA/DHI, 2007.

42
Summary
PDA’s TR contains many practical guidance and case studies for all late-stage analytical method life cycle steps.
All validation and post-validation steps described in this TR follow common risk-based concepts and are aligned with current regulatory guidelines (ICH Q8-11).
Many thanks to:• Rashmi Rawat (Product Quality Reviewer, CDER)
• Pat Cash (Sr. Director, Analytical Biochemistry, MedImmune)
• Mark Schenerman (VP, Analytical Biochemistry, MedImmune)
• Martin Van Trieste (SVP, Quality, Amgen)
• Rich Levy (SVP, PDA)
Krause/PDA, 2012