the labour market story: the uk following recession labour market story: the uk following recession...
TRANSCRIPT
Briefing PaperJuly 2014
The Labour Market Story: The UK Following Recession
The Labour Market Story: The UK Following Recession
The Labour Market Story: The UK Following Recession
Briefing Paper
July 2014
The Labour Market Story: The UK Following Recession
Table of Contents
Executive Summary ............................................................................................. v
1 The UK economy: recession, recovery and potential .............................. 1
1.1 Recession and recovery ......................................................................................... 1
1.2 Productivity .............................................................................................................. 6
1.3 Competitiveness ...................................................................................................... 8
1.4 Industry sectors ..................................................................................................... 12
1.5 Spatial variation in economic performance ........................................................ 15
2 The labour market ..................................................................................... 19
2.1 Unemployment and job creation .......................................................................... 19
2.2 Employment: a range of experiences .................................................................. 23
2.3 Changing employment practices ......................................................................... 27
2.4 Migration and the labour market .......................................................................... 28
2.5 Labour markets across nations and regions ...................................................... 29
2.6 Matching skills to needs ....................................................................................... 31
3 Skills, pay, and mobility ............................................................................ 36
3.1 The link between skills and employment and earnings outcomes .................. 36
3.2 Earnings and living standards ............................................................................. 37
3.3 Occupational change and job prospects ............................................................ 39
3.4 Inequalities in the labour market .......................................................................... 41
4 Skills and policy: challenges and possibilities ....................................... 42
4.1 Skills and economic growth ................................................................................. 42
4.2 The state of the labour market ............................................................................. 43
4.3 Policy challenges ................................................................................................... 44
Bibliography ....................................................................................................... 47
iii

The Labour Market Story: The UK Following Recession
Tables and figures Figure 1.1 UK GDP growth and economic sentiment, 2000-2013 ......................................... 2
Figure 1.2 UK macroeconomic performance since 2006 Q1 ................................................. 4
Figure 1.3 Change in output and unemployment across advanced economies, 2007-2013 ................................................................................................................................... 4
Figure 1.4 Output growth and unemployment across advanced economies, 2013............ 5
Figure 1.6 GDP per hour worked, 2000-2012, selected advanced economies (2007=100) . 7
Figure 1.7 Workforce qualification levels, % economically active, 2004-2013 .................. 10
Table 1.1 Global Competitiveness Index 2013-2014 rankings ........................................... 11
Table 1.2 Growing and contracting industry sectors, 2002-2012 ...................................... 13 Figure 1.8 Output per hour worked, by sector, 2005-2013 .................................................. 14
Figure 1.9 Output per head and employment rate across nations and regions, 2012...... 16
Figure 1.11 Change in output and employment across LEP areas, 2007-2012 ................... 17
Figure 2.1 Output and employment in three UK recessions ............................................... 20
Figure 2.2 UK Beveridge Curve 2001-2014 ............................................................................ 21
Figure 2.4 Change in employment and unemployment, by age group, 2007-2013 ........... 25 Figure 2.5 Youth unemployment and earning while learning, EU member states, 2012 .. 26
Figure 2.6 Unemployment by duration, 16-64 ....................................................................... 26
Figure 2.7 Temporary employees, 1997 to 2013 quarterly, 000s employees ..................... 28
Figure 2.9 Workforce with no qualifications and change in unemployment, 2007-2013 .. 30
Figure 2.10 Vacancies and unemployed by industry, before, during, after recession ....... 34 Figure 3.1 Growth in average real wages, 2001-2013 ........................................................... 38
Figure 3.3 Past and future net change in SOC2010 Major Groups ..................................... 40
The Labour Market Story is based on research undertaken by the Institute of Employment Studies, the Warwick Institute for Employment Research, Cambridge Econometrics and UKCES. We would also like to acknowledge the assistance of expert reviewers who provided comments on early drafts.
iv
The Labour Market Story: The UK Following Recession
Executive Summary
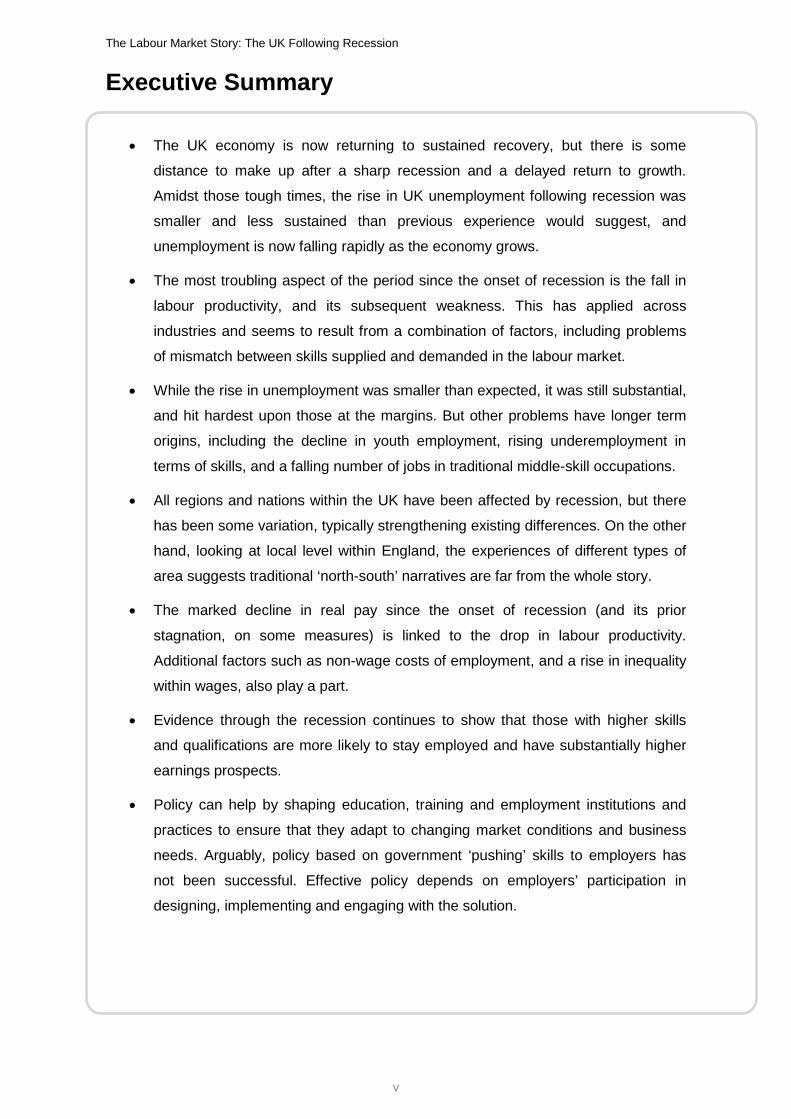
• The UK economy is now returning to sustained recovery, but there is some
distance to make up after a sharp recession and a delayed return to growth.
Amidst those tough times, the rise in UK unemployment following recession was
smaller and less sustained than previous experience would suggest, and
unemployment is now falling rapidly as the economy grows.
• The most troubling aspect of the period since the onset of recession is the fall in
labour productivity, and its subsequent weakness. This has applied across
industries and seems to result from a combination of factors, including problems
of mismatch between skills supplied and demanded in the labour market.
• While the rise in unemployment was smaller than expected, it was still substantial,
and hit hardest upon those at the margins. But other problems have longer term
origins, including the decline in youth employment, rising underemployment in
terms of skills, and a falling number of jobs in traditional middle-skill occupations.
• All regions and nations within the UK have been affected by recession, but there
has been some variation, typically strengthening existing differences. On the other
hand, looking at local level within England, the experiences of different types of
area suggests traditional ‘north-south’ narratives are far from the whole story.
• The marked decline in real pay since the onset of recession (and its prior
stagnation, on some measures) is linked to the drop in labour productivity.
Additional factors such as non-wage costs of employment, and a rise in inequality
within wages, also play a part.
• Evidence through the recession continues to show that those with higher skills
and qualifications are more likely to stay employed and have substantially higher
earnings prospects.
• Policy can help by shaping education, training and employment institutions and
practices to ensure that they adapt to changing market conditions and business
needs. Arguably, policy based on government ‘pushing’ skills to employers has
not been successful. Effective policy depends on employers’ participation in
designing, implementing and engaging with the solution.
v
The Labour Market Story: The UK Following Recession
1 The UK economy: recession, recovery and potential
The recession of 2008 and 2009 brought to an end the longest period of sustained, stable
economic growth the UK has known with one of its sharpest contractions. Years of
continued progress in closing the longstanding gap in productivity with leading advanced
economies such as the US and Germany saw significant reverses. Recovery has taken
longer than before, not helped by severe problems in the Eurozone, one of the UK’s
largest export markets. While employment fared better than historic and international
experience would have suggested, productivity has struggled to recover as the recession
and its aftermath cast a harsh light on the weak points in the UK economy.
1.1 Recession and recovery
From the end of the early 1990s recession until 2008, the British economy experienced a
continued expansion in output, alongside low and stable inflation and high and growing
employment. Improved macroeconomic stability and increased market flexibility,
combined with greater opportunities in a growing global economy, created benign
conditions for growth. During the 2000s, a combination of structural weakness,
commodity price shocks, and the arrival of a global financial crisis in 2007-08 contributed
to falling business and consumer confidence, and an extremely sharp recession during
2008 and 2009 (Figure 1.1).
1

The Labour Market Story: The UK Following Recession Figure 1.1 UK GDP growth and economic sentiment, 2000-2013
Source: ONS GDP at constant prices, SA, and European Commission ECOFIN Economic Sentiment Indicator
The UK’s high profile in financial services, and close proximity to the particularly troubled
Eurozone export markets contributed not only to the depth of the recession but also a
weak recovery. As a consequence, at the time of writing, UK output remains below its
pre-recession peak.
The particular set of circumstances driving the deep recession and relatively weak
recovery (compared to previous recessions) show through in the macroeconomic
indicators (Figure 1.2). Clearly, the fall in confidence led to sharp cutbacks in household
consumer expenditure and businesses’ investment plans. In particular, business
investment has remained stalled around the lower levels seen early in the recession,
some 20 per cent below the pre-recession peak of 2008.1 Meanwhile, while exports have
recovered from the depths, after more than a 10 per cent fall during the recession,
problems in key export markets including the Eurozone have restrained their role in
powering further recovery.
Also hinted at is one of the less expected features of recession and recovery – that the
demand for labour did not fall along with output, and recovered much more rapidly than
has output. Marking a departure from the UK’s recent history, the combination of a sharp
drop in output but a mild fall in employment sets the British economy apart from many of
the other advanced economies.
1 It is worth noting that this was very much a peak level, as the panel in Figure 1.2 suggests; growth in business investment in fixed capital was limited for some years before the recession.
50
60
70
80
90
100
110
120
130
-12.0
-10.0
-8.0
-6.0
-4.0
-2.0
0.0
2.0
4.0
6.0
8.0
2000
Q1
2001
Q1
2002
Q1
2003
Q1
2004
Q1
2005
Q1
2006
Q1
2007
Q1
2008
Q1
2009
Q1
2010
Q1
2011
Q1
2012
Q1
2013
Q1
ECFI
N E
cono
mic
Sen
timen
t Ind
icat
or
% g
row
th G
DP
q-o-
q an
nual
ised
GDP (ABMI) qoq ann ECFIN ESI
2

The Labour Market Story: The UK Following Recession As Figure 1.3 shows, the UK’s experience across the period 2007 to 2012 is worse than
many other leading economies in terms of output growth, but its unemployment rate
changed only moderately; indeed, it was slightly better than the US and not much worse
than Australia, both of which fared much better in terms of output growth. The German
experience, of falling unemployment, has not been matched by particularly strong growth
in output, sharing with the UK the symptoms of struggling productivity, with employment
outpacing output.
It is now becoming clear that starting in the second half of 2013, the UK economy began
to reach the pace of recovery long hoped for, demonstrating across 2013 a leading
performance among advanced economies (Figure 1.3). The return of robust business and
household confidence (see Figure 1.1), of growing strength in asset markets (especially
housing) and increases in household spending all point to a long-awaited recovery.
The Office of Budget Responsibility’s (OBR) latest (March 2014) forecasts suggest GDP
growth of 2.7 per cent in 2014 and 2.3 per cent in 2015; growth thereafter depends on
improvements in business investment and exports raising prospects for household
incomes. There remain substantial risks in the global economy, and significant domestic
challenges, such as the need to consolidate the public budget deficit, to manage a
smooth exit from unconventional monetary policy, and to tackle the supply-side weak
points that have become clear these past few years.
3

The Labour Market Story: The UK Following Recession Figure 1.2 UK macroeconomic performance since 2006 Q1
Source: ONS data (2014)
707580859095
100105110115
2006
Q1
2007
Q1
2008
Q1
2009
Q1
2010
Q1
2011
Q1
2012
Q1
2013
Q1
2008
Q1
= 10
0
Household final consumption expenditure
707580859095
100105110115
2006
Q1
2007
Q1
2008
Q1
2009
Q1
2010
Q1
2011
Q1
2012
Q1
2013
Q1
2008
Q1
= 10
0 Gross domestic
product
707580859095
100105110115
2006
Q1
2007
Q1
2008
Q1
2009
Q1
2010
Q1
2011
Q1
2012
Q1
2013
Q1
2008
Q1
= 10
0
General government final consumption expenditure
707580859095
100105110115
2006
Q1
2007
Q1
2008
Q1
2009
Q1
2010
Q1
2011
Q1
2012
Q1
2013
Q1
2008
Q1
= 10
0 Gross fixed capital formation:
Business investment
707580859095
100105110115
2006
Q1
2007
Q1
2008
Q1
2009
Q1
2010
Q1
2011
Q1
2012
Q1
2013
Q1
2008
Q1
= 10
0
Total exports of goods and services
707580859095
100105110115
2006
Q1
2007
Q1
2008
Q1
2009
Q1
2010
Q1
2011
Q1
2012
Q1
2013
Q1
2008
Q1
= 10
0
Total weekly hours worked
4
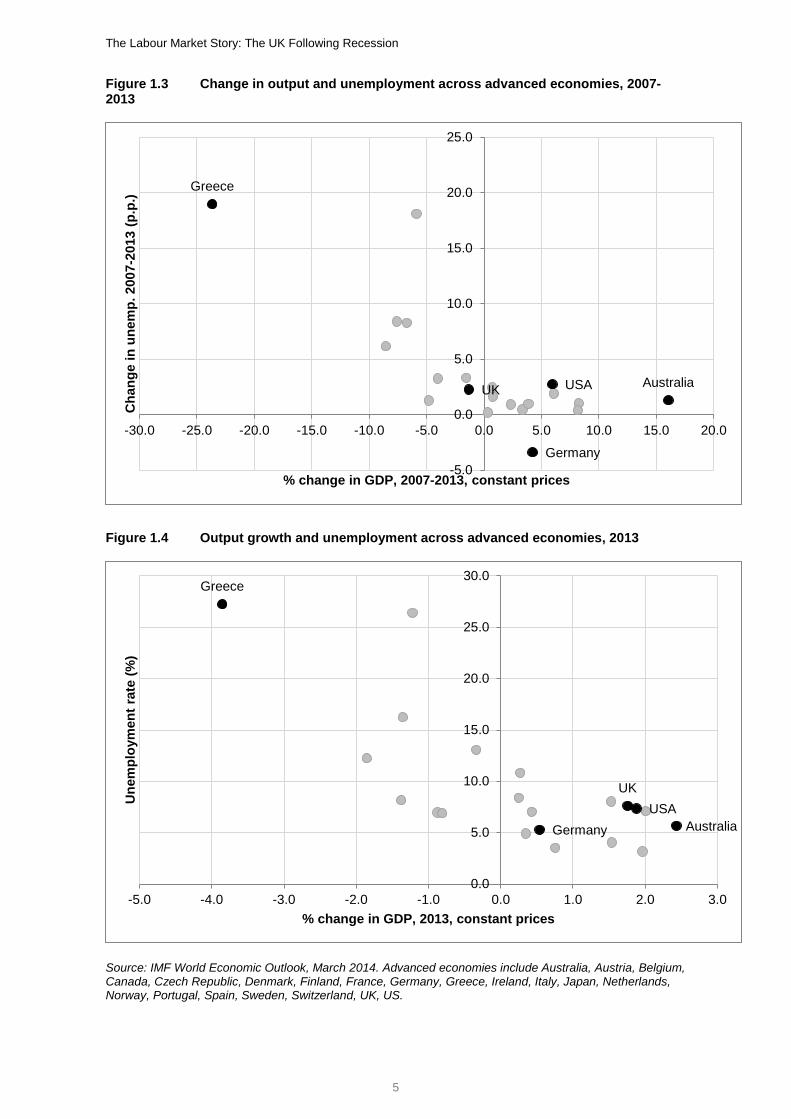
The Labour Market Story: The UK Following Recession Figure 1.3 Change in output and unemployment across advanced economies, 2007-2013
Figure 1.4 Output growth and unemployment across advanced economies, 2013
Source: IMF World Economic Outlook, March 2014. Advanced economies include Australia, Austria, Belgium, Canada, Czech Republic, Denmark, Finland, France, Germany, Greece, Ireland, Italy, Japan, Netherlands, Norway, Portugal, Spain, Sweden, Switzerland, UK, US.
Australia
Germany
Greece
UK USA
-5.0
0.0
5.0
10.0
15.0
20.0
25.0
-30.0 -25.0 -20.0 -15.0 -10.0 -5.0 0.0 5.0 10.0 15.0 20.0
Cha
nge
in u
nem
p. 2
007-
2013
(p.p
.)
% change in GDP, 2007-2013, constant prices
Australia Germany
Greece
UK USA
0.0
5.0
10.0
15.0
20.0
25.0
30.0
-5.0 -4.0 -3.0 -2.0 -1.0 0.0 1.0 2.0 3.0
Une
mpl
oym
ent r
ate
(%)
% change in GDP, 2013, constant prices
5

The Labour Market Story: The UK Following Recession Some of those weak points may be within the labour market. There are concentrations of
unemployment and evidence of mismatches whether quantitative (wanting more or fewer
working hours) or qualitative (underskilled or overskilled for jobs). For young people in
particular, there are concerns that sustained unemployment leaves a ‘scarring’ effect (see
e.g. Bell and Blanchflower, 2011), with a permanent loss in human capital lowering their
future earnings and employment outcomes.
But it remains the case that the UK labour market has been efficient in keeping people in
work, considering the experience of recession and recovery. Unemployment has fallen
below the seven per cent level identified as a guidepost for monetary policy by the Bank
of England. Employment has now surpassed pre-recession peaks in terms of jobs (2012)
and hours worked (2013). In keeping with the different experience of output growth, per
capita output remains significantly below its pre-recession peak; and on the OBR’s
forecasts will not surpass previous levels until 2017.
1.2 Productivity
In the period before 2008, the so-called ‘Great Moderation’, the UK made significant
progress in making up the gap in labour productivity against other advanced economies
(most notably, the US and several northern European countries). The particular
experience of recession and recovery in the UK since 2008 brought that progress to a
halt, and indeed reversed some of it, as UK productivity declined slightly while that of
other nations continued to increase.
As Figure 1.5 shows, after the recession there therefore remains a substantial gap in
labour productivity for the UK compared with leading advanced economies. Compared
with some of those advanced economies, the UK might consider its higher levels of
employment a desirable trade-off. But the Netherlands, Germany and the US, each of
which have similar or better employment rates, all have a 30 per cent or greater
advantage in the output generated for every hour worked.
Figure 1.6 shows that the UK’s story is marked by a stronger contrast between pre-
recession and post-recession than other advanced economies. The UK’s growth in
productivity through the ‘Great Moderation’ was strong and sustained, outpacing even the
US case. By contrast, many European countries had seen relatively modest growth in
productivity in those years, and across the 2000s, Italy had barely made any gains at all.
But where the US and Canada continued to see productivity growth through the
recession, and countries such as France saw a return to growth after seeing a fall during
recession, the UK changed from a high performer to stagnation.
6

The Labour Market Story: The UK Following Recession Figure 1.5 2012 Productivity and employment performance, advanced economies
Source: ONS International Comparisons of Productivity 2012 (February 2014) and OECD Employment Rates by Age Group
Figure 1.6 GDP per hour worked, 2000-2012, selected advanced economies (2007=100)
Source: ONS International Comparisons of Productivity 2012 (February 2014), Table 3
Canada
France
Germany
Italy
Japan UK
US
Netherlands
Ireland Belgium
Spain
50
55
60
65
70
75
80
80 90 100 110 120 130 140 150 160
Empl
oym
ent r
ate,
15-
64, 2
012
GDP per hour worked (UK=100), 2012
85
90
95
100
105
110
UK
85
90
95
100
105
110
Canada
85
90
95
100
105
110
France
85
90
95
100
105
110
Germany
85
90
95
100
105
110
Italy
85
90
95
100
105
110
US
7
The Labour Market Story: The UK Following Recession The UK’s weak productivity performance could be seen as the consequence of its
combination of poor output growth and resurgent employment. As a matter of simple
arithmetic, the new highs in hours worked and a failure to surpass pre-recession peaks in
output means labour productivity is lower. The comparable post-recession experience of
Germany, with a less sharp recession in output, but a fall in unemployment across the
period, supports the idea.
There certainly seems to be some truth that during the years immediately after the
recession hit, UK firms held on to (‘hoarded’) employees amidst constrained demand, at
the expense of measured productivity (Martin and Rowthorn, 2012; Barnett et al., 2014).
But given their lasting nature, changes in the composition of output and employment
seem likely to be more a reflection of sustained adverse shocks in the UK’s terms of trade
(Broadbent, 2014), weaknesses in reallocation of resources between firms (Barnett et al.,
2014) especially in the context of a banking crisis (Broadbent, 2012; Oulton, 2013), as
well as measurement issues relating to the rising importance of ‘intangibles’ investment
(Goodridge et al., 2013). As the global economy moves to a more stable growth path, and
especially as the largest emerging economies continue to develop and increase their
demand for the high-value services in which the UK is a leading exporter, there is
potential for productivity growth to return to the levels of the 1990s and 2000s (Besley
and Van Reenen, 2013).
1.3 Competitiveness
However, leaving aside some of the progress lost in recession and recovery, there
remains that substantial gap between the UK’s productivity performance and those of the
leading advanced economies. And many of those institutional weaknesses, in domestic
markets and the way many British firms manage and operate, will continue to limit the
success of efforts to close the gap in labour productivity.
Given growth in the global economy, export demand for high-value products and services
means that some of the UK’s most advanced, forward-thinking businesses will continue
to grow and succeed. Their performance will in turn provide the basis for a solid growth
performance across the UK economy, creating an increased demand for domestic private
services and growing tax revenues to fund public services.
8
The Labour Market Story: The UK Following Recession But it is in these domestic sectors that we know that there is a ‘long tail’ of firms with
weak management practices. Insulated in markets with limited competition and with poor
accountability, too many of these firms ‘make do’ rather than seeking to drive continuous
improvements and innovation. All countries have these firms; but on average, in
management practices the UK falls behind many of those countries with similar or better
productivity, with the difference made up by the number of poorly managed firms (Bloom
and Van Reenen, 2010).
Our particular concern here is with the interface between firm performance and the labour
market. Weaknesses in productivity relate not only to the direct issue of poor
management, but also the complex connection between the role of firms, employees and
government in investing in human capital. The Department for Business, Innovation and
Skills (BIS, 2012), drawing on a wide range of evidence, identifies the following
competitive weaknesses in the UK’s workforce:
• the quality of education in the UK is moderate, with the quality of mathematics and
science education perceived to be low;
• the percentage of people aged 25 to 64 years of age with below upper secondary
education is relatively high;
• UK workers compare unfavourably with their counterparts in the OECD with
respect to basic numeracy and literacy skills; and
• management capability is less well developed in the UK than in countries such as
the USA, and UK businesses feel constrained in developing their management
effectiveness by an inadequate supply of managerial human capital.
As that summary suggests, the picture is mixed. Concentrating on multinational
companies’ perceptions of the workforce available to them as they consider investment,
recent research for BIS finds the UK ranked second out of seven countries for the overall
skills of its workforce, just behind Germany and ahead of the USA (Tingle et al., 2014).
Generally, the perception is that the UK workforce performs well on relevant qualifications
and communication skills, but less well on areas such as business development, team
working, management, or technical competence.
Indeed, for all that there are substantial issues with the lower skill workforce, and general
weaknesses in maths, science and management, the expansion of higher education over
several decades has resulted in a substantial and sustained growth in the number of
graduates available to UK businesses (Figure 1.7). Almost certainly, that has been an
important base for the growth of the financial and business services sector, and the shift
of UK manufacturing to focus on its high-value specialisms, although there are questions
over how well this expanded graduate skills base is being used by employers.
9

The Labour Market Story: The UK Following Recession Likewise, wider perceptions of UK competitiveness suggest some weaknesses, but some
strengths on which to build as well. For example, the World Economic Forum (2013, pp3-
4; also Table 1.1 for the top 25) finds that:
The United Kingdom rounds out the top 10, falling by two places in this year’s assessment… Overall, the United Kingdom benefits from clear strengths such as the efficiency of its labor market (5th), in sharp contrast to the rigidity of those of many other European countries. The country continues to have sophisticated (9th) and innovative (12th) businesses that are highly adept at harnessing the latest technologies for productivity improvements and operating in a very large market (it is ranked 6th for market size). The highly developed financial market also remains a strength overall, despite some weaknesses last year.
The UK has many well-managed firms, and has an efficient labour market and deep
capital markets. But it has a long tail of low-performing firms operating in markets
characterised by limited competition, a workforce characterised by general weaknesses
in important skill areas, and a sense (explored below) that although the labour market
gets people into work, it may be efficient in doing so, rather than effective: skills are
variable, but enhanced skills are not always fully used in the workplace.
Figure 1.7 Workforce qualification levels, % economically active, 2004-2013
Source: ONS Annual Population Survey
0%
10%
20%
30%
40%
50%
60%
70%
80%
90%
100%
2004 2005 2006 2007 2008 2009 2010 2011 2012 2013
% e
cono
mic
ally
act
ive,
16-
64
No qualifications NVQ1 NVQ2 NVQ3 NVQ4+
10
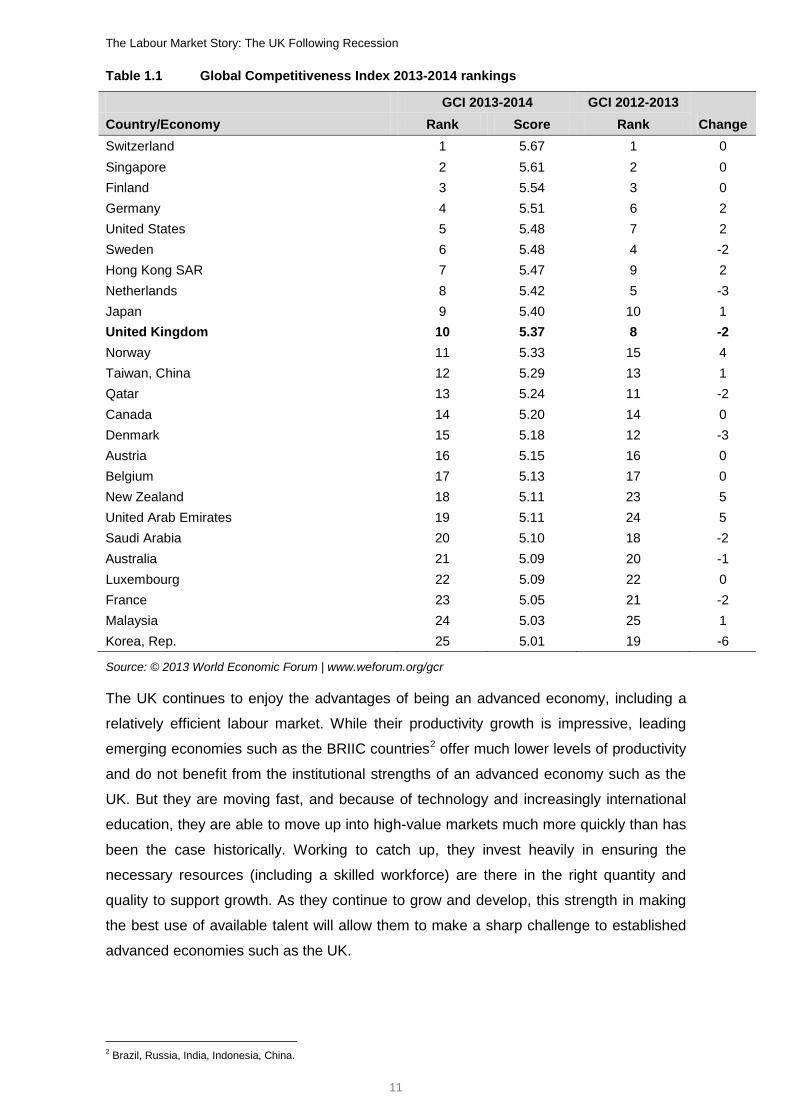
The Labour Market Story: The UK Following Recession Table 1.1 Global Competitiveness Index 2013-2014 rankings
GCI 2013-2014 GCI 2012-2013 Country/Economy Rank Score Rank Change Switzerland 1 5.67 1 0 Singapore 2 5.61 2 0 Finland 3 5.54 3 0 Germany 4 5.51 6 2 United States 5 5.48 7 2 Sweden 6 5.48 4 -2 Hong Kong SAR 7 5.47 9 2 Netherlands 8 5.42 5 -3 Japan 9 5.40 10 1 United Kingdom 10 5.37 8 -2 Norway 11 5.33 15 4 Taiwan, China 12 5.29 13 1 Qatar 13 5.24 11 -2 Canada 14 5.20 14 0 Denmark 15 5.18 12 -3 Austria 16 5.15 16 0 Belgium 17 5.13 17 0 New Zealand 18 5.11 23 5 United Arab Emirates 19 5.11 24 5 Saudi Arabia 20 5.10 18 -2 Australia 21 5.09 20 -1 Luxembourg 22 5.09 22 0 France 23 5.05 21 -2 Malaysia 24 5.03 25 1 Korea, Rep. 25 5.01 19 -6
Source: © 2013 World Economic Forum | www.weforum.org/gcr
The UK continues to enjoy the advantages of being an advanced economy, including a
relatively efficient labour market. While their productivity growth is impressive, leading
emerging economies such as the BRIIC countries2 offer much lower levels of productivity
and do not benefit from the institutional strengths of an advanced economy such as the
UK. But they are moving fast, and because of technology and increasingly international
education, they are able to move up into high-value markets much more quickly than has
been the case historically. Working to catch up, they invest heavily in ensuring the
necessary resources (including a skilled workforce) are there in the right quantity and
quality to support growth. As they continue to grow and develop, this strength in making
the best use of available talent will allow them to make a sharp challenge to established
advanced economies such as the UK.
2 Brazil, Russia, India, Indonesia, China.
11
The Labour Market Story: The UK Following Recession 1.4 Industry sectors
Following the recession, the government identified a key challenge for the UK as being
“to achieve strong, sustainable and balanced growth that is more evenly shared across
the country and between industries” (HM Treasury, 2011). The UK economy has a large
concentration in business services, and especially in finance, alongside a substantial
public sector, reflecting a large public role in education and health.
During the ‘Great Moderation’ of the 1990s and 2000s, financial and business services
generated much of the expansion in output, in turn leading to increased tax revenues
which financed a sustained growth in public sector output and employment. That same
pattern of growth also led to a substantial division in the sources of growth across nations
and regions, with London having a high share of growth in the high value added sectors,
especially in finance, while the growing public sector accounted for much of the
expansion in other parts of the country.
The sectoral composition of economic activity reflects a number of long term changes in
economic conditions, and especially in terms of global competition and technological
change. Like most advanced economies, the UK has seen a substantial fall in the role of
manufacturing and a shift to services. That in large part reflects the emergence of
increased competition, first of all in lower-value products but rising in sophistication over
time, from developing economies. Falling trade barriers (generally, but also for the UK in
the shape of the single European Market) have encouraged the trend, promoting trade
but also increasing the trend to specialisation according to comparative advantages.
While initially losing much of its low-value manufacturing base, the UK (like other
advanced economies) has in time gained greatly in the shape of low cost imports and
new markets for high value products and services.
Technological change has also played a major role. In particular, those sectors leading
growth over the past three decades, including specialist engineering, information
technology and financial services, have been highly dependent on new technology. Their
growth has been highly dependent on the supply of high level science, technology,
engineering and mathematics skills (UKCES/Bosworth et al., 2013). A relatively strong
supply of graduates, especially in the sciences, has enabled the UK’s specialisation in
these sectors. The UK has successfully attracted foreign direct investment (FDI),
especially where the UK has ready access to European markets such as car production.
12
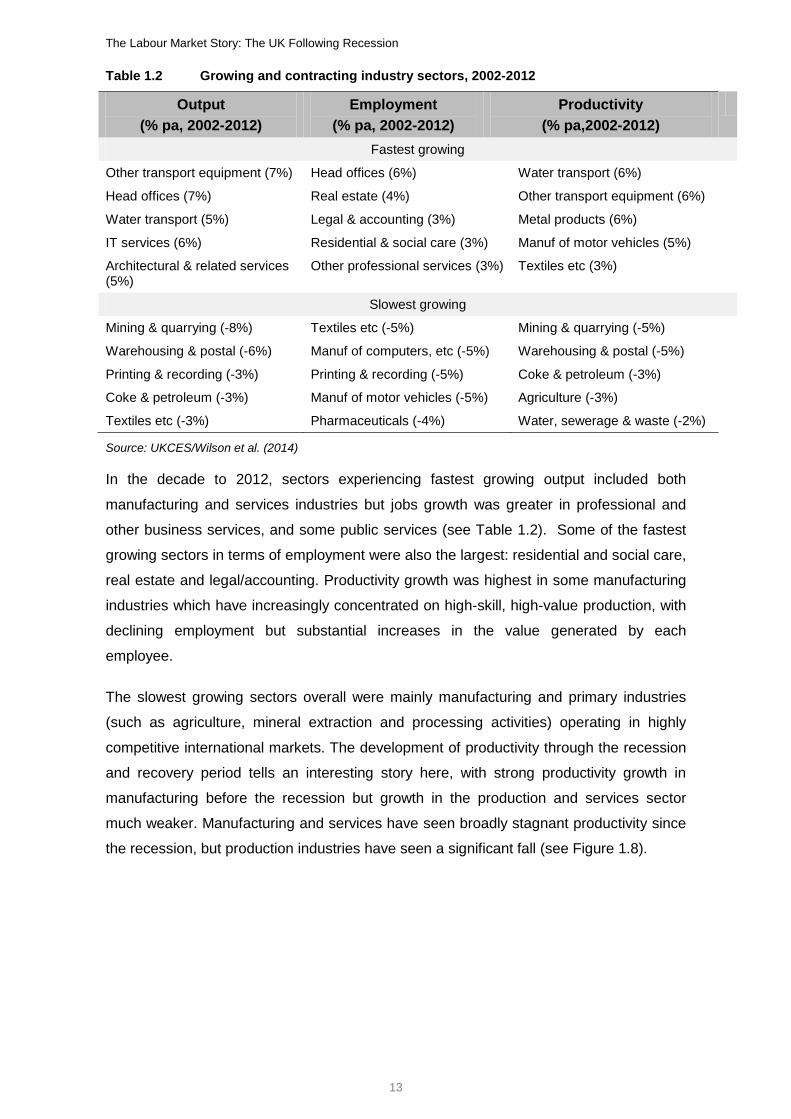
The Labour Market Story: The UK Following Recession Table 1.2 Growing and contracting industry sectors, 2002-2012
Output (% pa, 2002-2012)
Employment (% pa, 2002-2012)
Productivity (% pa,2002-2012)
Fastest growing
Other transport equipment (7%) Head offices (6%) Water transport (6%)
Head offices (7%) Real estate (4%) Other transport equipment (6%)
Water transport (5%) Legal & accounting (3%) Metal products (6%)
IT services (6%) Residential & social care (3%) Manuf of motor vehicles (5%)
Architectural & related services (5%)
Other professional services (3%) Textiles etc (3%)
Slowest growing
Mining & quarrying (-8%) Textiles etc (-5%) Mining & quarrying (-5%)
Warehousing & postal (-6%) Manuf of computers, etc (-5%) Warehousing & postal (-5%)
Printing & recording (-3%) Printing & recording (-5%) Coke & petroleum (-3%)
Coke & petroleum (-3%) Manuf of motor vehicles (-5%) Agriculture (-3%)
Textiles etc (-3%) Pharmaceuticals (-4%) Water, sewerage & waste (-2%)
Source: UKCES/Wilson et al. (2014)
In the decade to 2012, sectors experiencing fastest growing output included both
manufacturing and services industries but jobs growth was greater in professional and
other business services, and some public services (see Table 1.2). Some of the fastest
growing sectors in terms of employment were also the largest: residential and social care,
real estate and legal/accounting. Productivity growth was highest in some manufacturing
industries which have increasingly concentrated on high-skill, high-value production, with
declining employment but substantial increases in the value generated by each
employee.
The slowest growing sectors overall were mainly manufacturing and primary industries
(such as agriculture, mineral extraction and processing activities) operating in highly
competitive international markets. The development of productivity through the recession
and recovery period tells an interesting story here, with strong productivity growth in
manufacturing before the recession but growth in the production and services sector
much weaker. Manufacturing and services have seen broadly stagnant productivity since
the recession, but production industries have seen a significant fall (see Figure 1.8).
13
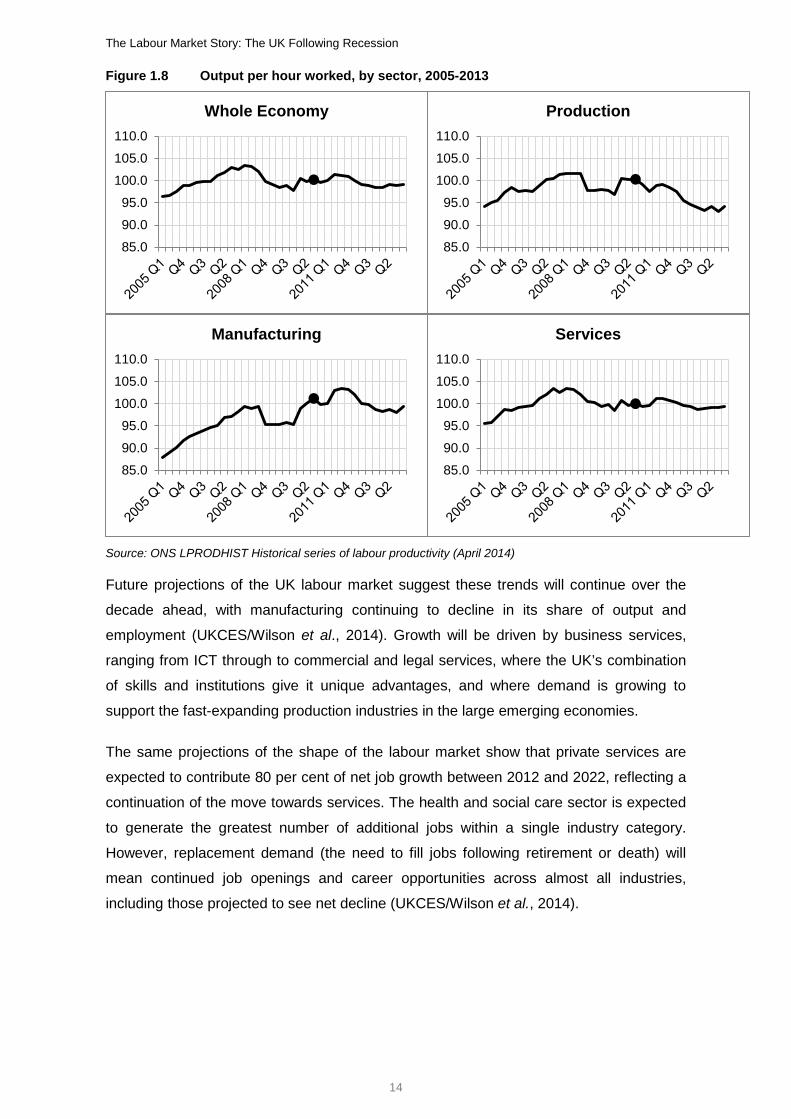
The Labour Market Story: The UK Following Recession Figure 1.8 Output per hour worked, by sector, 2005-2013
Source: ONS LPRODHIST Historical series of labour productivity (April 2014)
Future projections of the UK labour market suggest these trends will continue over the
decade ahead, with manufacturing continuing to decline in its share of output and
employment (UKCES/Wilson et al., 2014). Growth will be driven by business services,
ranging from ICT through to commercial and legal services, where the UK’s combination
of skills and institutions give it unique advantages, and where demand is growing to
support the fast-expanding production industries in the large emerging economies.
The same projections of the shape of the labour market show that private services are
expected to contribute 80 per cent of net job growth between 2012 and 2022, reflecting a
continuation of the move towards services. The health and social care sector is expected
to generate the greatest number of additional jobs within a single industry category.
However, replacement demand (the need to fill jobs following retirement or death) will
mean continued job openings and career opportunities across almost all industries,
including those projected to see net decline (UKCES/Wilson et al., 2014).
85.0
90.0
95.0
100.0
105.0
110.0
Whole Economy
85.0
90.0
95.0
100.0
105.0
110.0
Production
85.0
90.0
95.0
100.0
105.0
110.0
Manufacturing
85.0
90.0
95.0
100.0
105.0
110.0
Services
14
The Labour Market Story: The UK Following Recession The projections suggest continuation of another trend - a polarisation of the labour market
tilted towards higher skilled jobs, with 2.3 million additional high level jobs (for managers,
professionals, associate professionals); 800,000 fewer middle ranking administrative,
skilled manual and routine blue collar jobs; and 600,000 additional jobs in lower skilled
caring, leisure and other service roles. But again, replacement demand means that even
in declining middle skill roles there will still be substantial new job opportunities. The shift
to a higher skill workforce will continue through to 2022, when more than half of all jobs
are projected to be held by people qualified at degree level.
High skilled, high value work is increasingly found in emerging economies such as India
and China. In several competitor countries industrial policy has nurtured growth in sectors
such as ICT, pharmaceuticals and nano-technology, which have developed rapidly and
become internationally competitive. Previously emerging, developing economies are
increasingly providing direct competition to UK firms in higher value markets, and the
place of the UK within these markets is less and less assured.
1.5 Spatial variation in economic performance
The UK economy has long been characterised by substantial disparities in output and
employment between the different nations and regions. In particular, since the interwar
period, southern England has benefited from the expansion of service industries while the
rest of the UK has remained dependent on traditional, often declining industries. After it
too had seen a decline over many decades, London’s economy has become the focus in
recent decades, with a dramatic expansion in employment and output, driven in large part
by the clustering of financial and business services in and around the City.
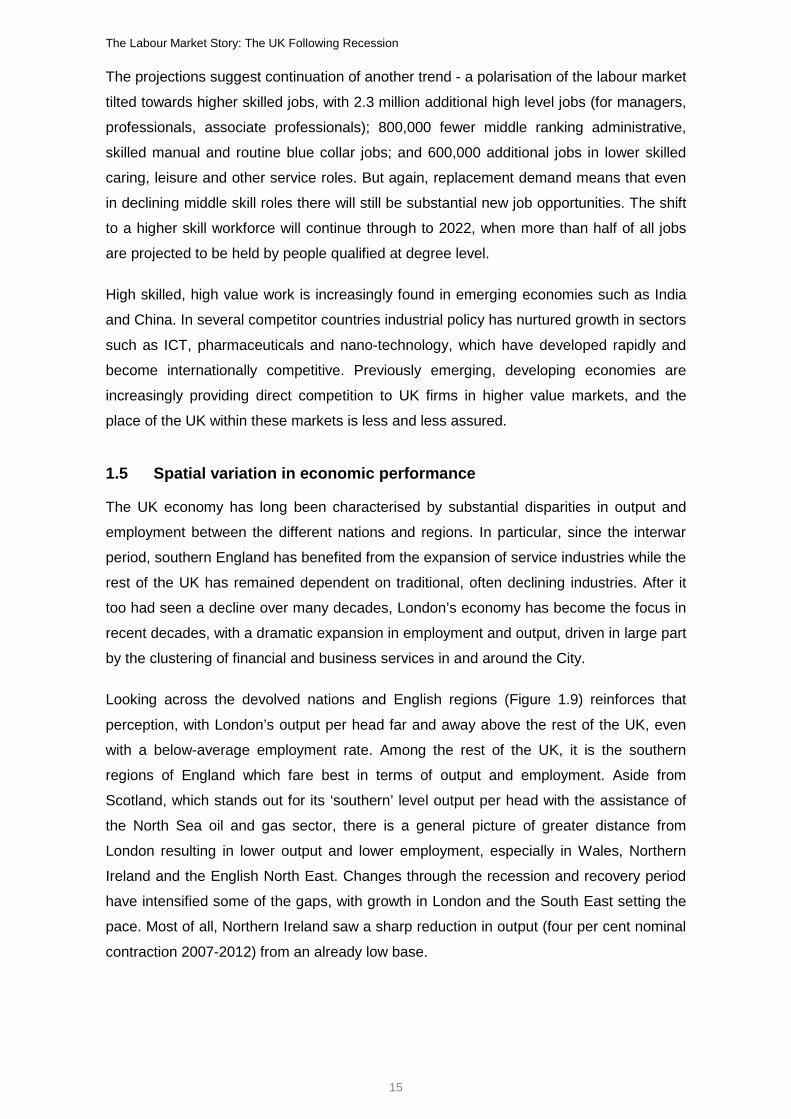
Looking across the devolved nations and English regions (Figure 1.9) reinforces that
perception, with London’s output per head far and away above the rest of the UK, even
with a below-average employment rate. Among the rest of the UK, it is the southern
regions of England which fare best in terms of output and employment. Aside from
Scotland, which stands out for its ‘southern’ level output per head with the assistance of
the North Sea oil and gas sector, there is a general picture of greater distance from
London resulting in lower output and lower employment, especially in Wales, Northern
Ireland and the English North East. Changes through the recession and recovery period
have intensified some of the gaps, with growth in London and the South East setting the
pace. Most of all, Northern Ireland saw a sharp reduction in output (four per cent nominal
contraction 2007-2012) from an already low base.
15
The Labour Market Story: The UK Following Recession Figure 1.9 Output per head and employment rate across nations and regions, 2012
Source: ONS Regional Gross Value Added (Income Approach) NUTS1 Tables, Table 1.1; Annual Population Survey
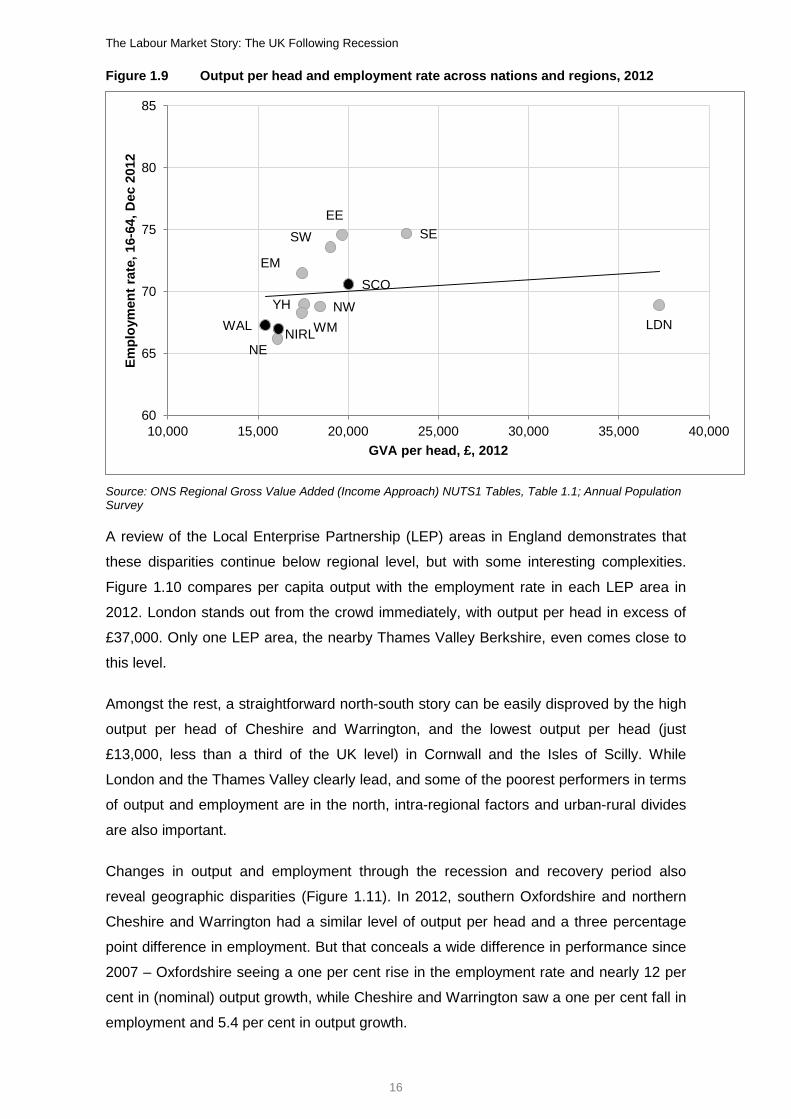
A review of the Local Enterprise Partnership (LEP) areas in England demonstrates that
these disparities continue below regional level, but with some interesting complexities.
Figure 1.10 compares per capita output with the employment rate in each LEP area in
2012. London stands out from the crowd immediately, with output per head in excess of
£37,000. Only one LEP area, the nearby Thames Valley Berkshire, even comes close to
this level.
Amongst the rest, a straightforward north-south story can be easily disproved by the high
output per head of Cheshire and Warrington, and the lowest output per head (just
£13,000, less than a third of the UK level) in Cornwall and the Isles of Scilly. While
London and the Thames Valley clearly lead, and some of the poorest performers in terms
of output and employment are in the north, intra-regional factors and urban-rural divides
are also important.
Changes in output and employment through the recession and recovery period also
reveal geographic disparities (Figure 1.11). In 2012, southern Oxfordshire and northern
Cheshire and Warrington had a similar level of output per head and a three percentage
point difference in employment. But that conceals a wide difference in performance since
2007 – Oxfordshire seeing a one per cent rise in the employment rate and nearly 12 per
cent in (nominal) output growth, while Cheshire and Warrington saw a one per cent fall in
employment and 5.4 per cent in output growth.
NE
NW YH
EM
WM
EE
LDN
SE SW
WAL
SCO
NIRL
60
65
70
75
80
85
10,000 15,000 20,000 25,000 30,000 35,000 40,000
Empl
oym
ent r
ate,
16-
64, D
ec 2
012
GVA per head, £, 2012
16
The Labour Market Story: The UK Following Recession Figure 1.10 Output per head and employment across LEP areas, 2012
Figure 1.11 Change in output and employment across LEP areas, 2007-2012
Source: ONS LEP Gross Value Added release (April 2014) and Annual Population Survey employment rates
Cheshire & Warrington
Cornwall & IoS Liverpool CR
London
Oxfordshire
Swindon & Wilts
Tees Valley
Thames Valley Berkshire
60
65
70
75
80
85
10,000 15,000 20,000 25,000 30,000 35,000 40,000
Empl
oym
ent r
ate,
16-
64, D
ec 2
012
GVA per head, £, 2012
Swindon & Wilts
Cornwall & IoS
Tees Valley
Thames Valley Berkshire
Cheshire & Warrington
London
Liverpool CR
Oxfordshire
-8.0
-7.0
-6.0
-5.0
-4.0
-3.0
-2.0
-1.0
-
1.0
2.0
-4.0 -2.0 - 2.0 4.0 6.0 8.0 10.0 12.0 14.0
Cha
nge
in e
mpl
oym
ent r
ate,
200
7-20
12
Growth in GVA per head, 2007-2012 (nominal)
17

The Labour Market Story: The UK Following Recession Low output, low employment LEP areas in the north such as Tees Valley and Liverpool
saw output growth between 2007 and 2012; nine per cent in Liverpool’s case, the third
fastest of all LEP areas. Meanwhile in the south, high output Thames Valley Berkshire
saw relatively modest output growth, and Swindon and Wiltshire (above-average for
output and employment) saw one of the sharpest falls in the employment rate (six per
cent) and in nominal output (1.7 per cent).
18

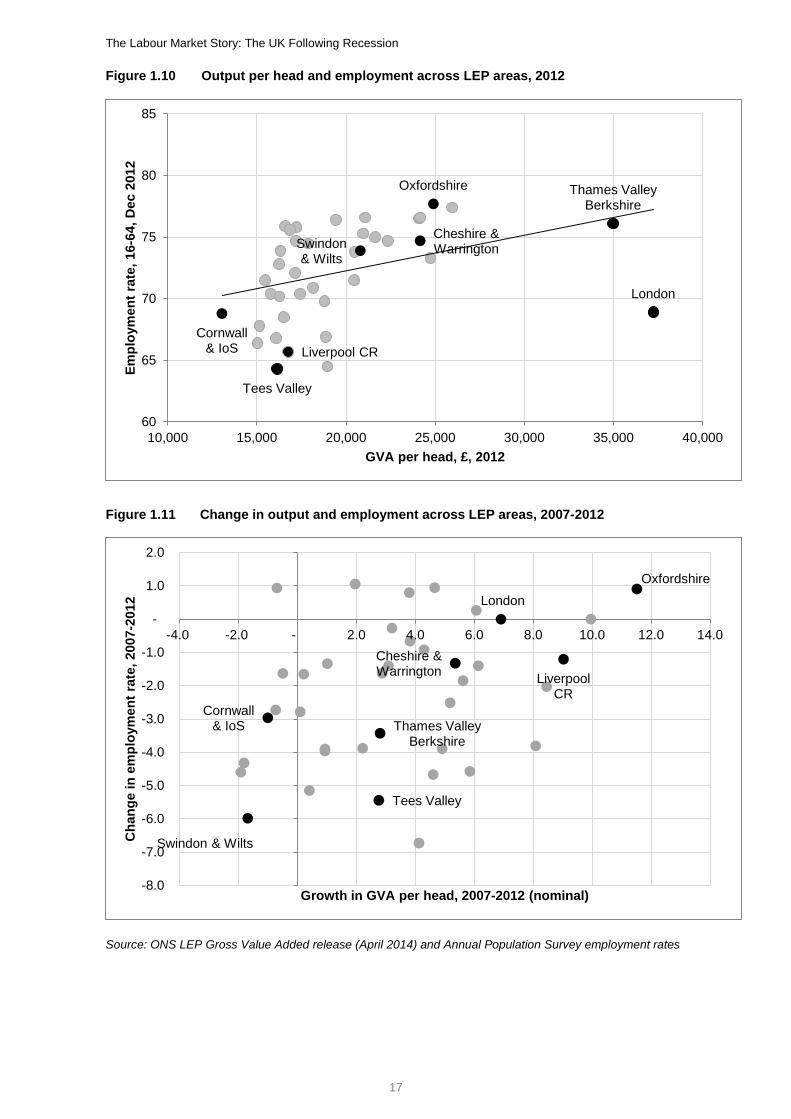
The Labour Market Story: The UK Following Recession 2 The labour market The clearest insight into the strengths of the UK labour market has come from the very
different experience of the 2008 recession compared to previous episodes. In 1980 and
1990-1991, contractions in output were shallower than in 2008 and recovered much
sooner. But in each of those recessions, employment effects magnified the falls in output,
with employment falling and not recovering until many years later.
2.1 Unemployment and job creation
The 2008 recession was much sharper in terms of the contraction in output (Figure 2.1),
twice as deep as the 1980 recession, and still some way from recovery five years after
the pre-recession peak. But the fall in employment was much less, and had been
recovered within five years; although an increase in the size of the workforce means that
unemployment has not returned to previous levels, it is far from the levels seen in the
1980s long after the recession had ended and the UK economy was experiencing robust
growth.
In a recent review of unemployment in the ‘Great Recession’ across countries, Pissarides
(2013) explores the UK and US experience through a Beveridge curve analysis, mapping
the unemployment and vacancy rates against each other. In particular, he notes the
much smaller initial shift outwards in the curve (resulting in a higher vacancy rate relative
to the unemployment rate) during the recession in the UK, but the much faster rebound in
the US where the vacancy rate quickly recovered (see also Smith, 2012). He concludes
that the UK suffered a slower return to job creation because of macroeconomic rigidity
(the same rigidities clear in the slow response of output following the recession), but at
the microeconomic level unemployment did not increase as much as in the US, for a
similar contraction in the vacancy rate:
The UK case can easily be explained. The reforms to the institutional structure of the labour market in the 1980s, and their consolidation in the 1990s and 2000s, clearly had an effect. The reforms shifted the labour market policy incentives to employment through tax reductions and tougher unemployment (and non-participation) support, and increased the institutional flexibility of the labour market. Important reforms took place in the role of trade unions and employment protection legislation. (2013, 395)
19
The Labour Market Story: The UK Following Recession Figure 2.1 Output and employment in three UK recessions
Source: ONS GDP at constant prices, SA (ABMI) and Total actual weekly hours worked (millions) (YBUS)
85
90
95
100
105
110
115
-8 -7 -6 -5 -4 -3 -2 -1 0 1 2 3 4 5 6 7 8 9 10 11 12 13 14 15 16 17 18 19 20
Out
put (
Pre-
rece
ssio
n pe
ak =
100
)
Quarters from pre-recession peak
1979Q4 1990Q2 2008Q1
85
90
95
100
105
110
115
-8 -7 -6 -5 -4 -3 -2 -1 0 1 2 3 4 5 6 7 8 9 10 11 12 13 14 15 16 17 18 19 20
Hou
rs w
orke
d (P
re-r
eces
sion
pea
k =
100)
Quarters from pre-recession peak
1979Q4 1990Q2 2008Q1
20

The Labour Market Story: The UK Following Recession Figure 2.2 UK Beveridge Curve 2001-2014
Source: ONS LFS unemployment rate (MGSX) and vacancy rate (= AP2Y / (AP2Y+MGRZ))
An updated Beveridge curve is presented at Figure 2.2. It shows the decisive shift as
recession took hold: from September 2008 to May 2009, the vacancy rate fell by more
than a quarter, and unemployment increased by two percentage points. For the following
three years, the UK labour market remained around this new steady state, with labour
demand increasing enough to absorb the growing workforce, but with fewer vacancies
and higher unemployment.
In keeping with the wider picture on recovery, from the middle of 2013 there finally seems
to be signs of an inward shift, with increasing vacancies driving falling unemployment.
Vacancies remain below pre-recession levels, in contrast to their rapid recovery in the
US, while unemployment is responding more slowly in recovery than in decline; the latest
vacancy rate matches a 6.9 per cent unemployment rate, but the same level of vacancies
saw unemployment between six and 6.2 per cent in the autumn of 2008. That may simply
be because vacancies are changing faster than unemployment, or it may be that there
has been a permanent outward shift in the operation of the Beveridge curve, so that the
vacancy rate is higher for any given unemployment rate than has been the historical
experience; only time will tell.
Jun01
Aug08
Nov11
Jun13
Feb14
1
1.2
1.4
1.6
1.8
2
2.2
2.4
2.6
2.8
3
3.5 4.5 5.5 6.5 7.5 8.5 9.5
Vaca
ncy
Rat
e
Unemployment Rate
21

The Labour Market Story: The UK Following Recession Certainly in a European context, the UK seems to have fared much better than many
other member states, despite suffering a sharper contraction in output than many of
them. The UK unemployment rate peaked at 8.4 per cent at the end of 2011 and has
since fallen back down below seven per cent. By contrast, the EU average remained at
10.7 per cent at the end of 2013, higher than the UK peak unemployment rate. However,
the EU average obscures some very large differences. Because of debt crises in several
Eurozone member states, there are extreme cases of macroeconomic rigidity driving
increases in unemployment, with Greece and Spain both seeing 2007 unemployment
rates of 8.3 per cent, rising to 27.3 per cent and 26.4 per cent by 2013 (Eurostat).
In accounting for the improved efficiency of the labour market in adapting to a sharp
recession, there are arguments that add to the straightforward explanation of greater
flexibility. For example, Brinkley (2009) argues that firms’ increasing reliance on and
investment in human capital makes skilled workers prized assets which employers are
resistant to losing even as trading conditions decline.
The greater stability of business investment in training (UKCES/Felstead et al., 2013)
compared to fixed capital provides one indication that this may be going on. So also does
the composition of changes in employment through the recession and recovery, which
have favoured higher skilled roles. Magnifying long term trends towards a more
‘polarised’ labour market, and one favouring higher skilled, managerial and professional
roles, jobs characterised by more routine tasks (whether cognitive or manual) suffered a
sharp fall in recession (see Figure 2.3), with little recovered even as employment as a
whole has reached new highs.
Meanwhile managerial and professional roles, but also those service roles characterised
by a need for personal contact, saw little decline through the recession, with growth just
stalling for a while. Figure 2.3 summarises the changes across four headline categories.
The experience presented here suggests that, in keeping with evidence from the US
(Jaimovich and Siu, 2012), longer term shifts in workforce composition may be
concentrated in episodes such as the 2008-2009 recession.
22

The Labour Market Story: The UK Following Recession 2.2 Employment: a range of experiences
For such a sharp and serious recession, the UK has seen only a moderate increase in
unemployment. But as the occupational composition of the fall in employment shows, the
effects have not been uniform, and some parts of the workforce have fared better and
worse than others in the years since 2008; and before then, too. Tough times in the
labour market hit those at the margins especially harshly, and the recession and recovery
period has been no different here.
Figure 2.3 Growth in employment by sets of occupational groups, 2005-2013
Source: ONS Annual Population Survey via NOMIS, employment by SOC 2010 Major Group. ‘Managers and professionals’ = Major Groups 1-3; ‘Admin and skilled trades’ = Major Groups 4 and 5; ‘Care, leisure and sales’ = Major Groups 6 and 7; ‘Elementary and process’ = Major Groups 8 and 9.
Chief among those affected by tough labour market conditions have been young people,
with much media attention as youth unemployment went above the one million mark. It is
certainly true that youth unemployment has been particularly high during recession. And
the decline in jobs in elementary occupations has hit the young particularly harshly, as
they account for a substantial proportion of jobs taken by young people; understandably
given the need for education and experience, numbers of young people in high-skill
occupations are limited.
-5-4-3-2-1012345
2005
Q4
2006
Q4
2007
Q4
2008
Q4
2009
Q4
2010
Q4
2011
Q4
2012
Q4
2013
Q4
% c
hang
e y-
o-y
Managers and professionals
-5-4-3-2-1012345
2005
Q4
2006
Q4
2007
Q4
2008
Q4
2009
Q4
2010
Q4
2011
Q4
2012
Q4
2013
Q4
% c
hang
e y-
o-y
Admin and skilled trades
-5-4-3-2-1012345
2005
Q4
2006
Q4
2007
Q4
2008
Q4
2009
Q4
2010
Q4
2011
Q4
2012
Q4
2013
Q4
% c
hang
e y-
o-y
Care, leisure and sales
-5-4-3-2-1012345
2005
Q4
2006
Q4
2007
Q4
2008
Q4
2009
Q4
2010
Q4
2011
Q4
2012
Q4
2013
Q4
% c
hang
e y-
o-y
Elementary and process
23
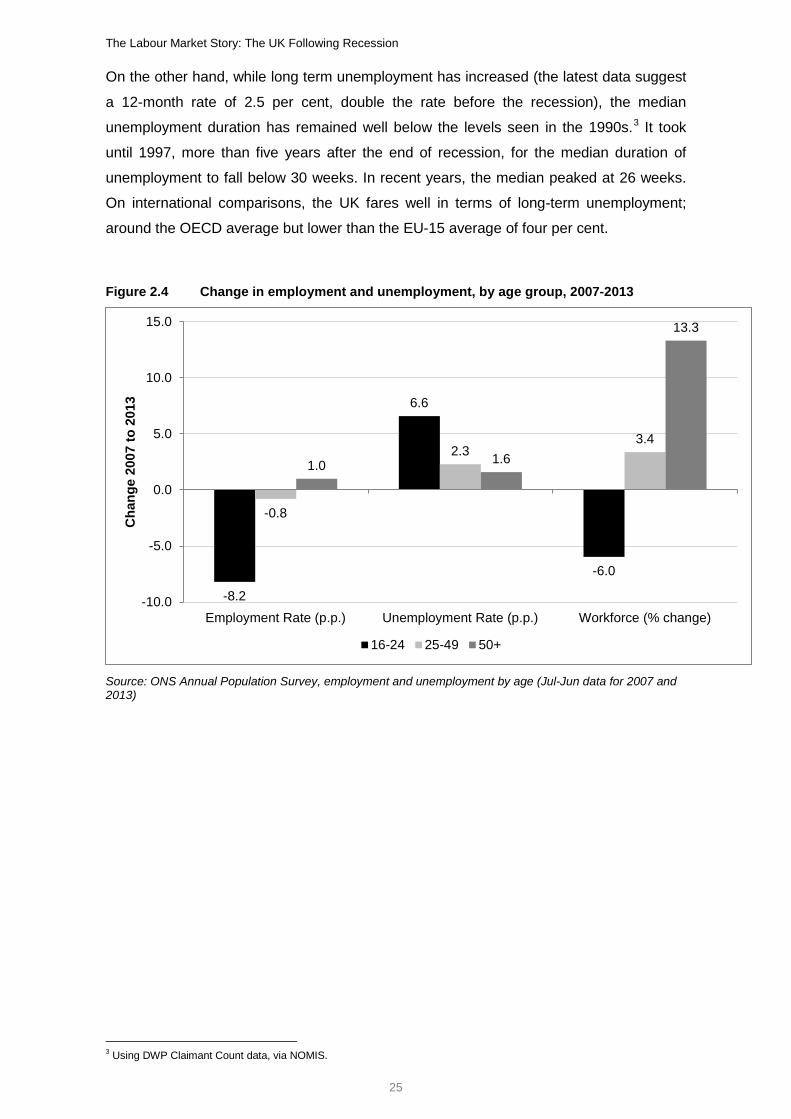
The Labour Market Story: The UK Following Recession But it is also true that there is a longer term shift at work here, with the employment
participation of young people diverging markedly from the rest of the workforce from
around 2004. The greater change in the recession in part reflected that earlier
divergence, where youth unemployment had already increased relative to the rest of the
labour market. Figure 2.4 helps to see some of the changes through the years of
recession and recovery, with large falls in 16-24 employment and a large rise in the
unemployment rate.
Perhaps the most interesting comparison is with the 50+ age group, which has seen an
increase in the employment rate through the period; the difference is all the greater
considering the decline in the size of the young people’s workforce and a substantial
growth in the workforce of those over 50. The consequence of changing employment
rates amidst changing workforce size is that, between 2007 and 2013 1.2 million more
over-50s found work while 400,000 fewer young people were employed.
One of the complexities in understanding the youth unemployment problem is that, in
international comparison, institutional differences in the level of education participation
can lead to different unemployment rates. Because unemployment rates are measured
against those working and looking to work, variations in the proportion of those in
education and not looking for work can obscure the picture. For that reason,
unemployment proportions (comparing against the total age group population) are often a
more reliable guide and here, the UK is a poor performer, substantially above the EU
average (12.4 per cent in the UK, 9.7 per cent EU average in 2012).
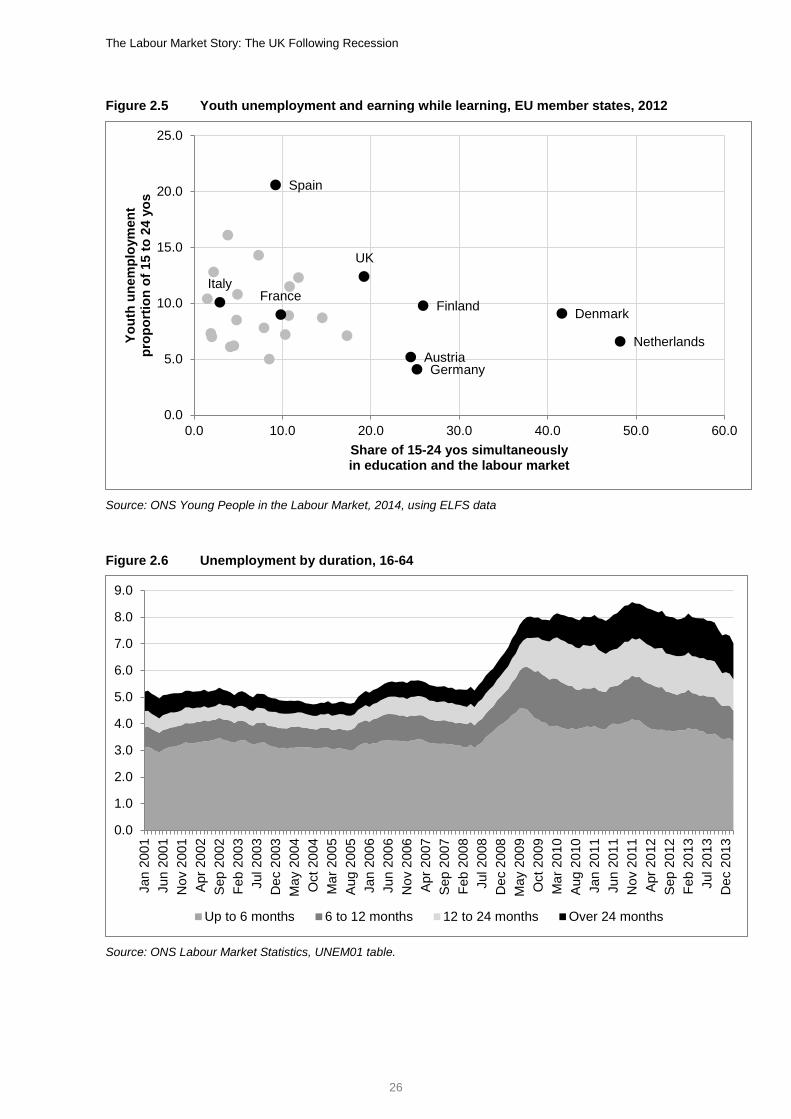
An interesting feature of the evidence on young people and the labour market is the
changing overlap between work and education. Paradoxically, given the increasing profile
of apprenticeships, there has been a sustained decline in the number of British young
people combining study and employment. Where the UK used to have a relatively high
proportion of those combining study and employment, it has declined through the 2000s
and is now middling. Figure 2.5 suggests that among north European economies (which
often share the UK’s low overall unemployment), the continuing high levels of combined
work and study play a part in maintaining low overall youth unemployment.
Both because of the new arrivals into unemployment, and the greater difficulty in finding
work, a recession in the labour market is often associated with increased long term
unemployment. This is a particular concern where recovery in the overall economy has
taken so long. Figure 2.6 highlights the breakdown between durations of unemployment,
with an increase in short term unemployment feeding through into the longer duration
categories.
24
The Labour Market Story: The UK Following Recession On the other hand, while long term unemployment has increased (the latest data suggest
a 12-month rate of 2.5 per cent, double the rate before the recession), the median
unemployment duration has remained well below the levels seen in the 1990s.3 It took
until 1997, more than five years after the end of recession, for the median duration of
unemployment to fall below 30 weeks. In recent years, the median peaked at 26 weeks.
On international comparisons, the UK fares well in terms of long-term unemployment;
around the OECD average but lower than the EU-15 average of four per cent.
Figure 2.4 Change in employment and unemployment, by age group, 2007-2013
Source: ONS Annual Population Survey, employment and unemployment by age (Jul-Jun data for 2007 and 2013)
3 Using DWP Claimant Count data, via NOMIS.
-8.2
6.6
-6.0
-0.8
2.3 3.4
1.0 1.6
13.3
-10.0
-5.0
0.0
5.0
10.0
15.0
Employment Rate (p.p.) Unemployment Rate (p.p.) Workforce (% change)
Cha
nge
2007
to 2
013
16-24 25-49 50+
25
The Labour Market Story: The UK Following Recession
Figure 2.5 Youth unemployment and earning while learning, EU member states, 2012
Source: ONS Young People in the Labour Market, 2014, using ELFS data
Figure 2.6 Unemployment by duration, 16-64
Source: ONS Labour Market Statistics, UNEM01 table.
Denmark
Germany
Spain
France Italy
Netherlands Austria
Finland
UK
0.0
5.0
10.0
15.0
20.0
25.0
0.0 10.0 20.0 30.0 40.0 50.0 60.0
Yout
h un
empl
oym
ent
prop
ortio
n of
15
to 2
4 yo
s
Share of 15-24 yos simultaneously in education and the labour market
0.0
1.0
2.0
3.0
4.0
5.0
6.0
7.0
8.0
9.0
Jan
2001
Jun
2001
Nov
200
1A
pr 2
002
Sep
200
2Fe
b 20
03Ju
l 200
3D
ec 2
003
May
200
4O
ct 2
004
Mar
200
5A
ug 2
005
Jan
2006
Jun
2006
Nov
200
6A
pr 2
007
Sep
200
7Fe
b 20
08Ju
l 200
8D
ec 2
008
May
200
9O
ct 2
009
Mar
201
0A
ug 2
010
Jan
2011
Jun
2011
Nov
201
1A
pr 2
012
Sep
201
2Fe
b 20
13Ju
l 201
3D
ec 2
013
Up to 6 months 6 to 12 months 12 to 24 months Over 24 months
26
The Labour Market Story: The UK Following Recession 2.3 Changing employment practices
One particular dimension of the labour market recovery has been the substantial role
played by self-employment. While most advanced economies, including the US, have
seen significant falls in self-employment, the UK has seen a sustained growth, accounting
for 83 per cent of the net gains in employment since 2007 (Ashworth et al., 2014). That
development builds on an already high rate of self-employment, and has taken place
across regions. The move to self-employment seems to be concentrated among two
groups. Among the UK-born, it is overwhelmingly concentrated among the over-50s;
among the non-UK-born, almost half belong to the 30-39 years age bracket (Ashworth et
al., 2014, p7).
The significance of this development for the long term health of the economy is not yet
fully clear. The increase seems to have taken place alongside a fall in the relative
earnings from self-employment, with a substantial real terms reduction in income. On the
other hand, recent survey research for the Resolution Foundation4 shows that 72 per cent
of self-employed people preferred their current situation, while among the newly self-
employed, 28 per cent expressed a preference to be an employee. As the recovery
develops, it will be interesting to see how the choices made by the recently self-employed
continue to evolve: whether their incomes rise, they seek to return to employment, or they
settle with limited income from self-employment (perhaps to supplement a pension).
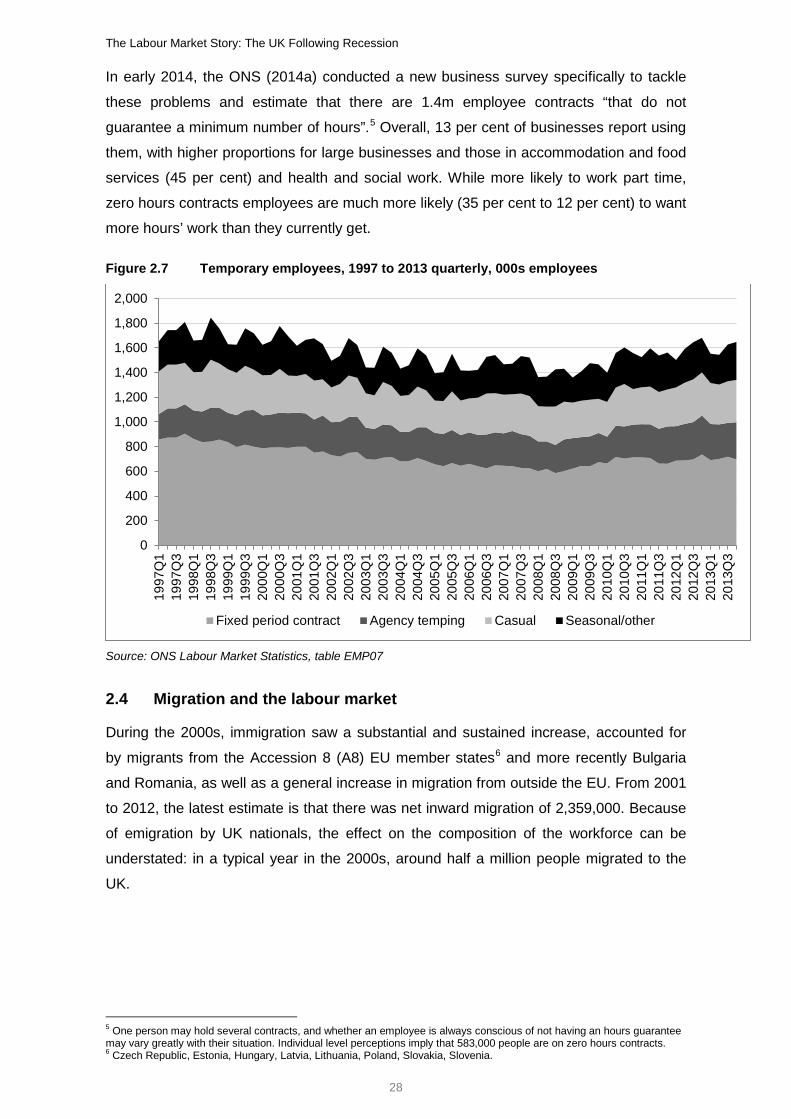
Another change in employment practice comes from the rise of ‘precarious’ forms of
employment, including casual, very short-term arrangements or those with ‘zero hours’
guaranteed. In terms of temporary contract arrangements, the long term trend before the
onset of recession was for a slow decline in these arrangements (even as employment
increased). Recession has led to a moderate reversal of this trend, with a sustained
increase in the use of fixed period contracts and casual employment (Figure 2.7).
Again, it will be interesting to see the extent to which this change is a symptom of
recession and recovery, and whether a return to sustained growth will see a decline once
again. Temporary employment has advantages in offering flexibility, but there are
concerns over its increased use. In particular, zero-hours contracts require that
employees only attend work and are paid when there is work to be done.
4 http://www.resolutionfoundation.org/press/self-employed-survey/
27
The Labour Market Story: The UK Following Recession In early 2014, the ONS (2014a) conducted a new business survey specifically to tackle
these problems and estimate that there are 1.4m employee contracts “that do not
guarantee a minimum number of hours”.5 Overall, 13 per cent of businesses report using
them, with higher proportions for large businesses and those in accommodation and food
services (45 per cent) and health and social work. While more likely to work part time,
zero hours contracts employees are much more likely (35 per cent to 12 per cent) to want
more hours’ work than they currently get.
Figure 2.7 Temporary employees, 1997 to 2013 quarterly, 000s employees
Source: ONS Labour Market Statistics, table EMP07
2.4 Migration and the labour market
During the 2000s, immigration saw a substantial and sustained increase, accounted for
by migrants from the Accession 8 (A8) EU member states6 and more recently Bulgaria
and Romania, as well as a general increase in migration from outside the EU. From 2001
to 2012, the latest estimate is that there was net inward migration of 2,359,000. Because
of emigration by UK nationals, the effect on the composition of the workforce can be
understated: in a typical year in the 2000s, around half a million people migrated to the
UK.
5 One person may hold several contracts, and whether an employee is always conscious of not having an hours guarantee may vary greatly with their situation. Individual level perceptions imply that 583,000 people are on zero hours contracts. 6 Czech Republic, Estonia, Hungary, Latvia, Lithuania, Poland, Slovakia, Slovenia.
0
200
400
600
800
1,000
1,200
1,400
1,600
1,800
2,000
1997
Q1
1997
Q3
1998
Q1
1998
Q3
1999
Q1
1999
Q3
2000
Q1
2000
Q3
2001
Q1
2001
Q3
2002
Q1
2002
Q3
2003
Q1
2003
Q3
2004
Q1
2004
Q3
2005
Q1
2005
Q3
2006
Q1
2006
Q3
2007
Q1
2007
Q3
2008
Q1
2008
Q3
2009
Q1
2009
Q3
2010
Q1
2010
Q3
2011
Q1
2011
Q3
2012
Q1
2012
Q3
2013
Q1
2013
Q3
Fixed period contract Agency temping Casual Seasonal/other
28
The Labour Market Story: The UK Following Recession From 2004 to 2012, the UK added to its resident population an estimated 949,000 A8
citizens, 141,000 citizens from the previous EU member states, and 647,000 non-EU
citizens.7 During the same period, the labour market performance of migrants improved.
Where previously, migrants typically had higher unemployment, migrant men became
more likely to be in work than native men (Frontier Economics, 2013, p87). These
changes have had substantial implications for the composition of the workforce, with
much subsequent discussion on their implications.
Recent migrants have been more likely to be employed in low-skilled work; over a
decade, migrant shares in low skilled sectors increased by six percentage points, rather
than three percentage points in other sectors, with similar results for occupations. Sectors
with high levels of temporary working seem more likely to employ migrants, and agency
working is also an important route for migrant employment, especially among A8 workers.
Paradoxically, while more likely to be employed in less skilled work, recent migrants are
on average better educated than native workers (Frontier Economics, 2013, pp87-89).
While there is some evidence of employers viewing young native workers as having
‘attitude problems’, there is little evidence of a general desire to hire migrant workers in
preference to native workers (Green et al., 2013). There is on the other hand evidence
that the arrival of migrants into lower skilled work has encouraged low-skilled native
workers to move into more communication-intensive roles, while migrants, often less
skilled in the English language, focus on manual task-intensive roles (Bisello, 2014).
2.5 Labour markets across nations and regions
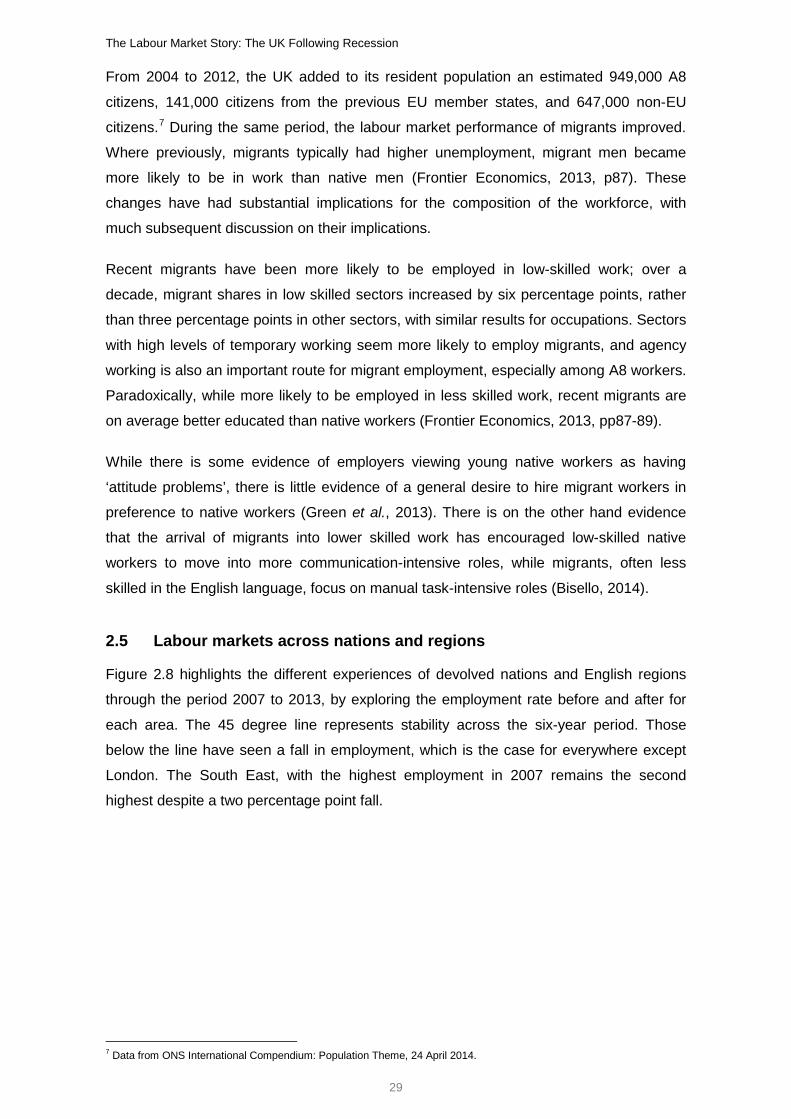
Figure 2.8 highlights the different experiences of devolved nations and English regions
through the period 2007 to 2013, by exploring the employment rate before and after for
each area. The 45 degree line represents stability across the six-year period. Those
below the line have seen a fall in employment, which is the case for everywhere except
London. The South East, with the highest employment in 2007 remains the second
highest despite a two percentage point fall.
7 Data from ONS International Compendium: Population Theme, 24 April 2014.
29
The Labour Market Story: The UK Following Recession
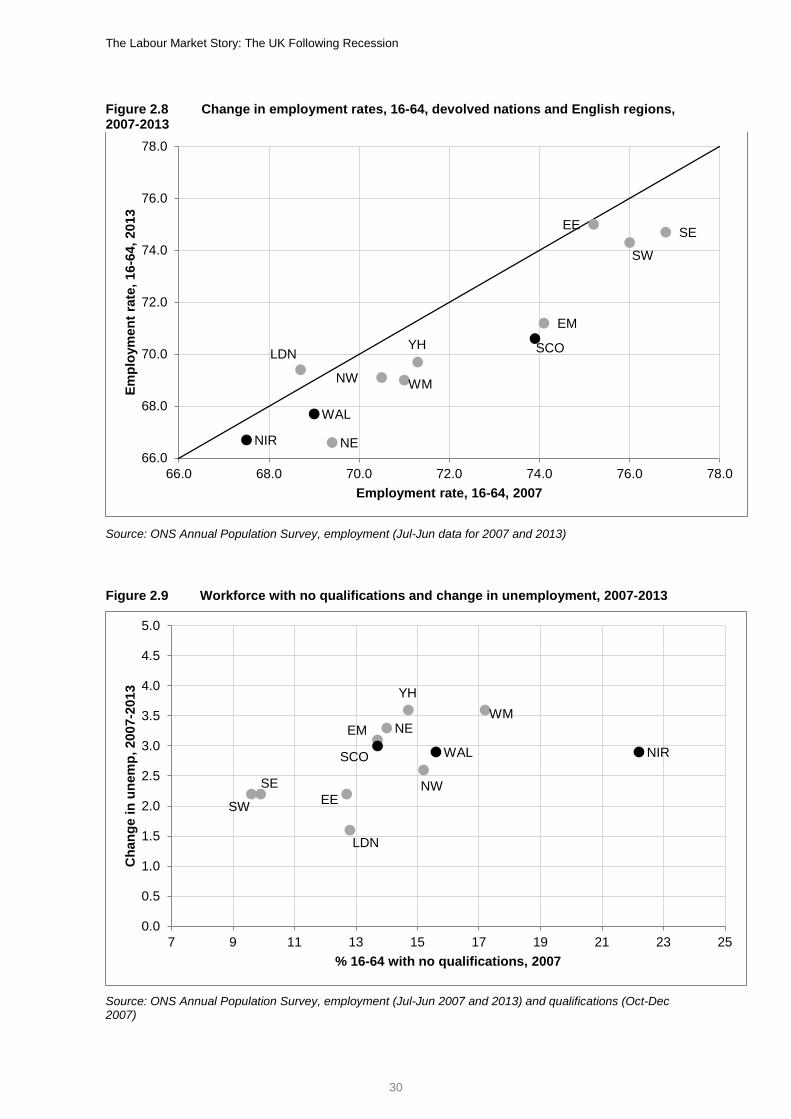
Figure 2.8 Change in employment rates, 16-64, devolved nations and English regions, 2007-2013
Source: ONS Annual Population Survey, employment (Jul-Jun data for 2007 and 2013)
Figure 2.9 Workforce with no qualifications and change in unemployment, 2007-2013
Source: ONS Annual Population Survey, employment (Jul-Jun 2007 and 2013) and qualifications (Oct-Dec 2007)
NE
NW
YH EM
WM
EE
LDN
SE
SW
WAL
SCO
NIR 66.0
68.0
70.0
72.0
74.0
76.0
78.0
66.0 68.0 70.0 72.0 74.0 76.0 78.0
Empl
oym
ent r
ate,
16-
64, 2
013
Employment rate, 16-64, 2007
NE
NW
YH
EM WM
EE
LDN
SE
SW
WAL SCO NIR
0.0
0.5
1.0
1.5
2.0
2.5
3.0
3.5
4.0
4.5
5.0
7 9 11 13 15 17 19 21 23 25
Cha
nge
in u
nem
p, 2
007-
2013
% 16-64 with no qualifications, 2007
30
The Labour Market Story: The UK Following Recession Interestingly, the largest falls in the employment rate are in two areas with higher-than-
average employment levels in 2007: Scotland and the East Midlands, with both seeing a
fall of around three percentage points. Those nations and regions with the lowest
prevailing rates (again, excepting London) such as Northern Ireland, Wales, and the
North East, also all saw falls by 2013. Excepting London (and, narrowly, the East of
England), all nations and regions shared in lower employment rates by 2013. However,
those areas already suffering employment problems have not been spared further
increases in unemployment either. At the local level too, areas with relatively high levels
of unemployment at the start of the decade also had them in 2010 (Ormerod, 2014).
Spatial employment differences are especially pronounced for those people with no or
low qualifications. London and the surrounding regions of the ‘Greater South East’ have
disproportionately high shares of jobs requiring higher level qualifications in the UK, while
areas such as the North East and the North West have the lowest rates. Given that we
know those with no qualifications face poorer prospects for employment and earnings
(see below), it is unsurprising that regions and nations with more people with no
qualifications saw greater rises in unemployment (Figure 2.9).
2.6 Matching skills to needs
While the UK labour market has performed very well in efficiency terms through the tough
times of recession and a slow recovery, there are larger question marks about its
effectiveness in matching labour supply to employer needs. At the macro level, there are
certainly questions about the level of underemployment in the workforce, with substantial
numbers reporting a wish for greater or fewer hours of work than they currently have.
Such arguments are summarised in the Bell-Blanchflower underemployment index,8
which adds to the conventional unemployment rate an estimate of net additional hours’
work which is desired but not fulfilled. That index suggests substantial additional potential
in the labour market, if employees can be matched to the right job opportunities. A similar
approach is taken in Weale (2014), but with further adjustments made to account for
revealed preference in changes to hours worked, and for the distribution of hours
according to productivity, which again suggests some slack in the labour market, but only
a little under one per cent of GDP.
8 http://bellblanchflowerunderemployment.com/
31
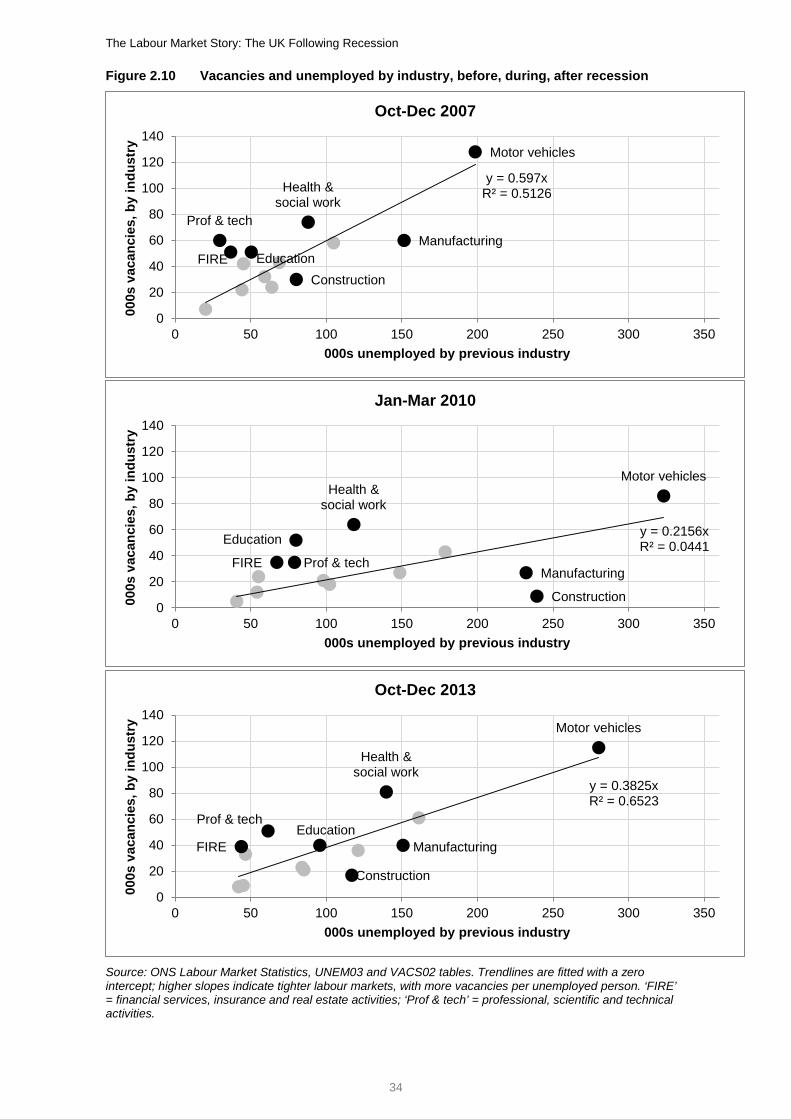
The Labour Market Story: The UK Following Recession Perhaps more interesting is how well the labour market is adapting to the substantial and
continuing supply-side changes to the UK economy. Figure 2.10 sets out the way industry
sector labour markets have adapted over the past few years, plotting each sector in terms
of its unemployed past workers and its available industries. The trendlines help to identify
the relative tightness of different sectors. Those above the line are those with a higher
ratio of vacancies to unemployment, and those below have relatively fewer vacancies.
A snapshot is taken at three points: the pre-recession low for unemployment; the post-
recession peak; and the most recently available data. There is some stability in relative
positions around the economy-wide trend, with the same major sectors above the line
(financial, professional services, education, health and social work) and below the line
(construction and manufacturing). Interestingly, it is those sectors initially below the line
which see the most substantial changes amidst recession. This is particularly significant
given ambitions to grow the share of export-led manufacturing in the economy.
Also worth noting is that the broad picture across sectors is clearly returning to a similar
pattern to that seen before the recession, with a tightening even in those sectors which
were most clearly affected, and an upward shift in the slope of the trendline. That
reversion corresponds to the path of the overall ratio of unemployment to the number of
vacancies (2.4 in late 2007, 5.5 in early 2010 and moving back down to 4.1 at the end of
2013).
That said, given the troubled recent record on productivity growth and the particular weak
points in the British economy, it is worth considering whether labour market mismatch is
leaving some of the workforce underused while some firms can’t grow because they can’t
find the right skills. Certainly, the 2013 UK Commission’s Employer Skills Survey
(UKCESS) provides evidence on both counts. In that year, a tightening labour market
saw 22 per cent of vacancies characterised by skills shortages, up from 16 per cent two
years before. In Scotland, skills shortages accounted for 25 per cent of vacancies up from
15 per cent. (UKCES/Winterbotham et al., 2014, p27)
Altogether, the estimate was of 146,000 skills shortage vacancies in the UK labour
market in 2013; a small number in a workforce of 30 million. But there is clear evidence
that skills shortage vacancies are likely to occur precisely where firms need those skills,
and that employers end up facing higher wage costs or seeking to ‘make do’ with less
skilled employees, both hindering productivity growth (Haskel and Martin, 1993).
Alongside skills shortages during recruitment, 15 per cent of establishments report skills
gap with their existing workforce, accounting for an estimated 1.4m employees in 2013
(UKCES/Winterbotham et al., 2014, p39).
32
The Labour Market Story: The UK Following Recession At the same time, we find nearly half (48 per cent) of establishments reporting employees
with both qualifications and skills more advanced than is required for their current job
role, accounting for some 16 per cent of the total workforce, an estimated 4.3 million
workers; more than are considered to have skills gaps (UKCES/Winterbotham et al.,
2014, pp49-50). The coincidence of skills shortages and skills gaps in some firms with
underemployment of skills in other firms seems a paradox, but there are some likely
explanations: for one, that the composition of workforce skills is not the same as that
needed by employers. For a second explanation, it may be that even where the skills are
available in the workforce, the labour market is not as effective as we would like at
matching those skills to employers’ needs. (See ‘The Labour Market Story: The State of
UK Skills’ for further discussion of skills shortage vacancies, gaps and under-use of
skills).
33
The Labour Market Story: The UK Following Recession Figure 2.10 Vacancies and unemployed by industry, before, during, after recession
Source: ONS Labour Market Statistics, UNEM03 and VACS02 tables. Trendlines are fitted with a zero intercept; higher slopes indicate tighter labour markets, with more vacancies per unemployed person. ‘FIRE’ = financial services, insurance and real estate activities; ‘Prof & tech’ = professional, scientific and technical activities.
Manufacturing
Construction
Motor vehicles
FIRE
Prof & tech
Education
Health & social work
y = 0.597x R² = 0.5126
0
20
40
60
80
100
120
140
0 50 100 150 200 250 300 350
000s
vac
anci
es, b
y in
dust
ry
000s unemployed by previous industry
Oct-Dec 2007
Manufacturing
Construction
Motor vehicles
FIRE Prof & tech
Education
Health & social work
y = 0.2156x R² = 0.0441
0
20
40
60
80
100
120
140
0 50 100 150 200 250 300 350
000s
vac
anci
es, b
y in
dust
ry
000s unemployed by previous industry
Jan-Mar 2010
Manufacturing
Construction
Motor vehicles
FIRE
Prof & tech Education
Health & social work
y = 0.3825x R² = 0.6523
0
20
40
60
80
100
120
140
0 50 100 150 200 250 300 350
000s
vac
anci
es, b
y in
dust
ry
000s unemployed by previous industry
Oct-Dec 2013
34
The Labour Market Story: The UK Following Recession Patterson et al. (2013) explore the question of mismatch between workers and jobs in the
UK, by estimating a matching function with Labour Force Survey data. They find
‘imbalances between vacancies and unemployed workers may be much more important
for skilled (high wage) workers’, and that such imbalances have increased with
persistence as a result of recession, perhaps reflecting the continued tightness in growth
sector labour markets seen in Figure 2.10. The same analysis does not find mismatch to
have worsened across geographic areas.
Comparing the UK with the US, there appears to be a lower level of mismatch in the UK
but the recession saw a much steeper rise, perhaps because of its particular exposure to
change in the financial sector and the Eurozone export markets. Also, interestingly,
where the US seems to have seen the level of mismatch fall consistently since the end of
the recession, in the UK it saw a sharp fall and then a growth through 2011 and 2012
(Patterson et al., 2013, p14). This could reflect underlying structural issues such as
demand deficiency.
35

The Labour Market Story: The UK Following Recession 3 Skills, pay, and mobility Labour markets matter not only in the aggregate sense of matching available labour to
employers’ demands, but also in creating opportunities for individuals to earn and to
develop their careers. As a society, we want the labour market to not only be efficient at
keeping people in work and effective at matching skills requirements, but also to afford
people the opportunity to do fulfilling work, earn decent wages, and progress according to
their skills and merit.
3.1 The link between skills and employment and earnings outcomes
Skills matter a great deal for individuals’ labour market outcomes. They maximise the
prospects of being in work:
So, do less educated workers bear the brunt of unemployment? [The data] suggest that they do … Workers who left school prior to age 18 not only face significantly higher rates of entry into unemployment, they also experience substantially longer jobless spells relative to their more educated counterparts. Thus, higher rates of unemployment among the low-skilled appear to be a consequence of both increased incidence and increased duration of unemployment spells. (Elsby et al., 2011, 361)
The same applies to earnings potential. Using the OECD PIAAC survey to look at skills
rather than qualification, Hanushek et al. (2013) find the UK to have a high lifetime
returns to skill in comparison with the majority of advanced economies: 23 per cent
additional earnings for a one standard deviation improvement in numeracy skills,
compared to 18 per cent across 22 countries.
Recent research by the Social Market Foundation highlights the fifth of the UK workforce
employed on low rates of pay (defined as earning less than two-thirds of the median
hourly wage). While a high proportion among advanced economies, more concerning is
that the majority do not move out of the low paid category after a year. One in eight
workers are in low pay and will still be so a year later; of those currently in work paid
above the two-thirds median hourly wage, only five per cent will be low paid a year later
(Keohane and Hupkau, 2014).
More than half of those on low pay are educated to GCSE level or below; 51 per cent of
those with no qualifications are on low pay (Keohane and Hupkau, 2014, p27). Not that
all is lost due to prior educational attainment: those least likely to move occupational
group were those on low pay who did not receive training in the past year (Keohane and
Hupkau, 2014, p28).
36

The Labour Market Story: The UK Following Recession Skills play a critical role in shaping employment and earning. That includes the addition of
new skills, and it is not only limited to graduate skills. Recent analysis for BIS estimates
that a Level 2 Apprenticeship adds a net present value between £48,000 and £74,000 to
lifetime earnings, and a Level 3 Apprenticeship between £77,000 and £117,000.
Likewise, holding a Level 3 NVQ makes men nine percentage points more likely to be
employed compared to holding Level 2 or lower qualifications; for women, the difference
is 17 percentage points (Conlon et al., 2011).
3.2 Earnings and living standards
One of the biggest changes in the UK labour market since the onset of recession is the
sustained decline in real wages. Starting in 2008, wages have not grown as fast as
consumer prices, and so real wages have declined (Figure 3.1). Such has been the
strength of the decline that real wages at the end of 2013 were around the levels first
achieved a decade earlier.
There is an argument that this change started earlier: across much of the wage
distribution, wages stagnated as early as 2003. Given the growing economy for the years
from 2003 to 2008, these trends have led to concerns that wages have ‘decoupled’ from
productivity, with calls to set policy to increase the share of GDP paid out in wages
(Lansley and Reed, 2013).
In a recent review of the path of real wages, the ONS (Taylor et al., 2014) concluded that
the decline since the onset of recession seems to be ‘the response to the fall in
productivity in 2008 and 2009 and its subsequent weakness’. While they see a role for
both rising hours worked and sectoral composition cutting into pay during the recession,
both of these were factors during the downturn and have since been offset to some
extent.
37
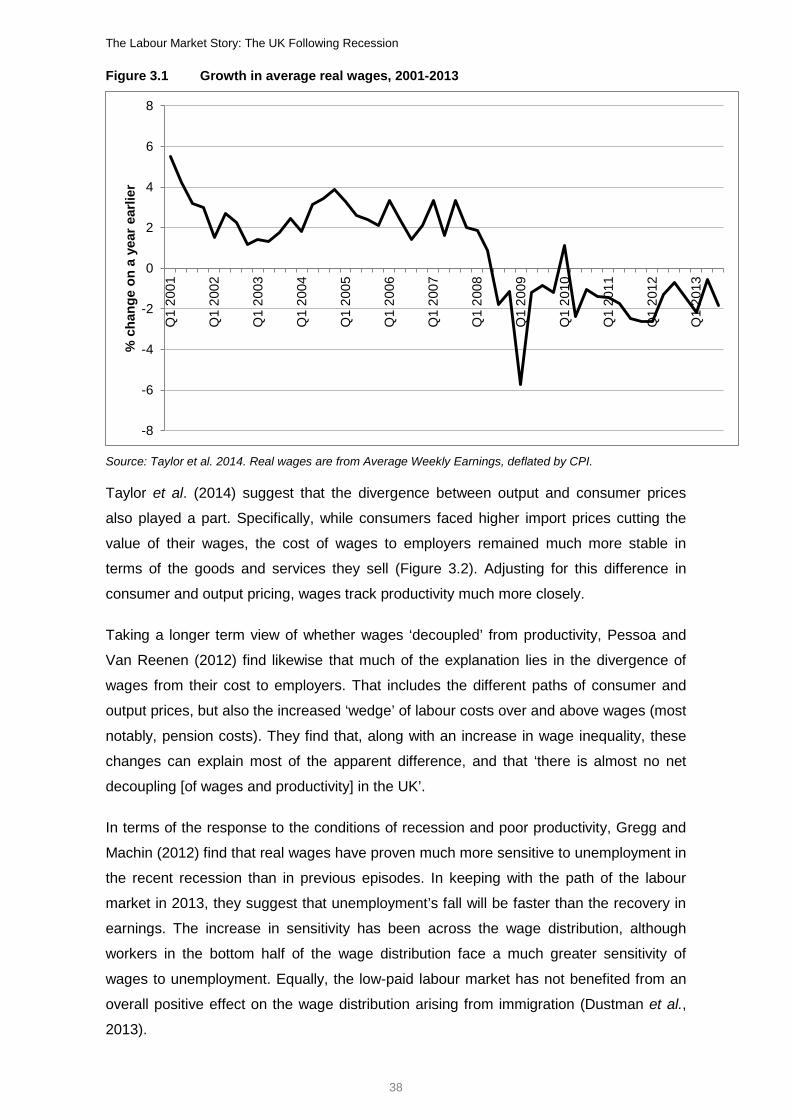
The Labour Market Story: The UK Following Recession Figure 3.1 Growth in average real wages, 2001-2013
Source: Taylor et al. 2014. Real wages are from Average Weekly Earnings, deflated by CPI.
Taylor et al. (2014) suggest that the divergence between output and consumer prices
also played a part. Specifically, while consumers faced higher import prices cutting the
value of their wages, the cost of wages to employers remained much more stable in
terms of the goods and services they sell (Figure 3.2). Adjusting for this difference in
consumer and output pricing, wages track productivity much more closely.
Taking a longer term view of whether wages ‘decoupled’ from productivity, Pessoa and
Van Reenen (2012) find likewise that much of the explanation lies in the divergence of
wages from their cost to employers. That includes the different paths of consumer and
output prices, but also the increased ‘wedge’ of labour costs over and above wages (most
notably, pension costs). They find that, along with an increase in wage inequality, these
changes can explain most of the apparent difference, and that ‘there is almost no net
decoupling [of wages and productivity] in the UK’.
In terms of the response to the conditions of recession and poor productivity, Gregg and
Machin (2012) find that real wages have proven much more sensitive to unemployment in
the recent recession than in previous episodes. In keeping with the path of the labour
market in 2013, they suggest that unemployment’s fall will be faster than the recovery in
earnings. The increase in sensitivity has been across the wage distribution, although
workers in the bottom half of the wage distribution face a much greater sensitivity of
wages to unemployment. Equally, the low-paid labour market has not benefited from an
overall positive effect on the wage distribution arising from immigration (Dustman et al.,
2013).
-8
-6
-4
-2
0
2
4
6
8
Q1
2001
Q1
2002
Q1
2003
Q1
2004
Q1
2005
Q1
2006
Q1
2007
Q1
2008
Q1
2009
Q1
2010
Q1
2011
Q1
2012
Q1
2013
% c
hang
e on
a y
ear e
arlie
r
38
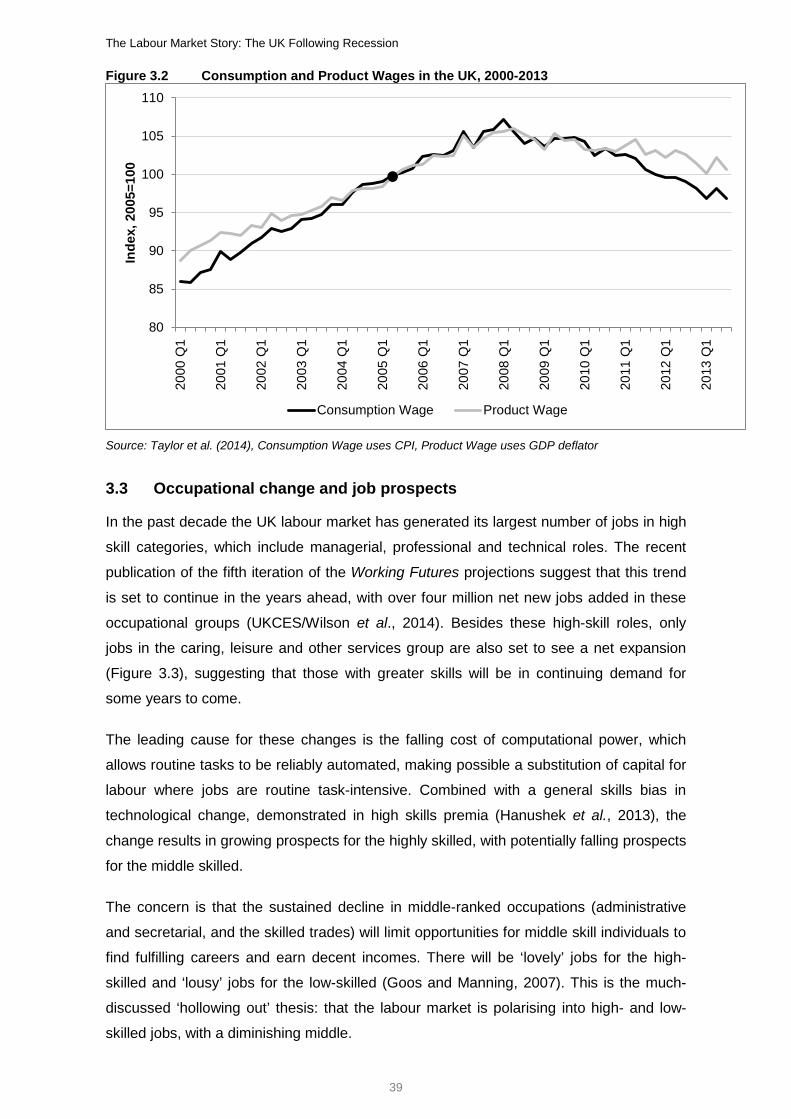
The Labour Market Story: The UK Following Recession Figure 3.2 Consumption and Product Wages in the UK, 2000-2013
Source: Taylor et al. (2014), Consumption Wage uses CPI, Product Wage uses GDP deflator
3.3 Occupational change and job prospects
In the past decade the UK labour market has generated its largest number of jobs in high
skill categories, which include managerial, professional and technical roles. The recent
publication of the fifth iteration of the Working Futures projections suggest that this trend
is set to continue in the years ahead, with over four million net new jobs added in these
occupational groups (UKCES/Wilson et al., 2014). Besides these high-skill roles, only
jobs in the caring, leisure and other services group are also set to see a net expansion
(Figure 3.3), suggesting that those with greater skills will be in continuing demand for
some years to come.
The leading cause for these changes is the falling cost of computational power, which
allows routine tasks to be reliably automated, making possible a substitution of capital for
labour where jobs are routine task-intensive. Combined with a general skills bias in
technological change, demonstrated in high skills premia (Hanushek et al., 2013), the
change results in growing prospects for the highly skilled, with potentially falling prospects
for the middle skilled.
The concern is that the sustained decline in middle-ranked occupations (administrative
and secretarial, and the skilled trades) will limit opportunities for middle skill individuals to
find fulfilling careers and earn decent incomes. There will be ‘lovely’ jobs for the high-
skilled and ‘lousy’ jobs for the low-skilled (Goos and Manning, 2007). This is the much-
discussed ‘hollowing out’ thesis: that the labour market is polarising into high- and low-
skilled jobs, with a diminishing middle.
80
85
90
95
100
105
110
2000
Q1
2001
Q1
2002
Q1
2003
Q1
2004
Q1
2005
Q1
2006
Q1
2007
Q1
2008
Q1
2009
Q1
2010
Q1
2011
Q1
2012
Q1
2013
Q1
Inde
x, 2
005=
100
Consumption Wage Product Wage
39
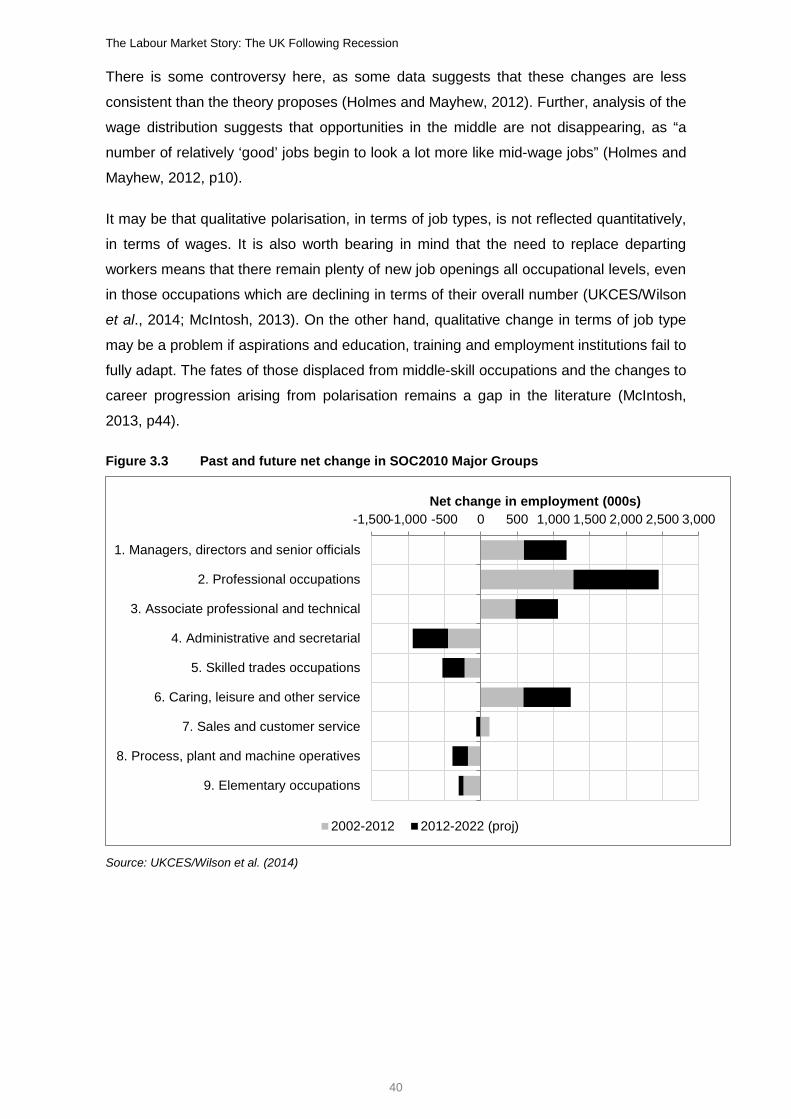
The Labour Market Story: The UK Following Recession There is some controversy here, as some data suggests that these changes are less
consistent than the theory proposes (Holmes and Mayhew, 2012). Further, analysis of the
wage distribution suggests that opportunities in the middle are not disappearing, as “a
number of relatively ‘good’ jobs begin to look a lot more like mid-wage jobs” (Holmes and
Mayhew, 2012, p10).
It may be that qualitative polarisation, in terms of job types, is not reflected quantitatively,
in terms of wages. It is also worth bearing in mind that the need to replace departing
workers means that there remain plenty of new job openings all occupational levels, even
in those occupations which are declining in terms of their overall number (UKCES/Wilson
et al., 2014; McIntosh, 2013). On the other hand, qualitative change in terms of job type
may be a problem if aspirations and education, training and employment institutions fail to
fully adapt. The fates of those displaced from middle-skill occupations and the changes to
career progression arising from polarisation remains a gap in the literature (McIntosh,
2013, p44).
Figure 3.3 Past and future net change in SOC2010 Major Groups
Source: UKCES/Wilson et al. (2014)
-1,500-1,000 -500 0 500 1,000 1,500 2,000 2,500 3,000
1. Managers, directors and senior officials
2. Professional occupations
3. Associate professional and technical
4. Administrative and secretarial
5. Skilled trades occupations
6. Caring, leisure and other service
7. Sales and customer service
8. Process, plant and machine operatives
9. Elementary occupations
Net change in employment (000s)
2002-2012 2012-2022 (proj)
40

The Labour Market Story: The UK Following Recession 3.4 Inequalities in the labour market
There are significant differences in labour outcomes between various groups in the UK,
including in income and earnings, economic activity, and employment and unemployment
rates. For example, some groups in the population struggle to enter employment and
maintain their position in the labour market. Women, people from minority ethnic groups,
people with disabilities, and those aged under 25 and over 55 years are all more likely to
be either unemployed or economically inactive (Brewer et al., 2012).
The differences in the labour market position of men compared to women (including the
distribution of workers by occupation and industry) have significant effects on the
observed gender pay gap. Men typically work more hours than women and are more
likely to work in higher-level occupations, which typically attract higher pay. The gender
pay gap (the difference between men’s and women’s median hourly pay excluding
overtime for full-time employees) was 9.6 per cent in April 2012 compared to 10.5 per
cent in 2011 (data from Annual Survey of Hours and Earnings, 2012).
There is also variation across ethnic groups in the labour market. Employment,
unemployment and inactivity for White and Indian individuals are close to the overall
average. People from Pakistani and Bangladeshi ethnic groups tend to perform most
poorly on measures of economic activity, with relatively high unemployment, low
employment and high inactivity rates. However, within ethnic groups there are additional
differences by gender, age and educational attainment, such that there is a complex
relationship between groups’ characteristics and their performance in the labour market.
There are also marked differences according to disability status with the unemployment
rate for individuals with a long term health problem or disability being much higher than
for people without a long term health problem or disability. Economic activity and
employment rates are also considerably lower for people with disabilities compared to
people without disabilities. The unemployment rate is nearly twice as high amongst
people with a disability and the inactivity rate for people with a long-term health problem
or disability is more than three times the rate for people without a disability. People with a
disability have a number of labour market disadvantages – they are more likely to be part-
time employees or self-employed than full-time employees compared with people without
disabilities. People with a disability in employment are more likely to have no or low level
qualifications and are, on average, older than workers without a disability (although this
varies by type of disability).
41
The Labour Market Story: The UK Following Recession 4 Skills and policy: challenges and possibilities In the long run, a return to sustained economic growth sufficient to make up lost progress
in closing the productivity gap with leading advanced economies will require the UK to
tackle limits on innovation, competition, infrastructure and investment. For an increasingly
knowledge-driven service economy such as the UK, it is investment in ‘intangibles’ such
as research and development, software, reputation, organisational improvement and
training which increasingly matters the most: together, intangible investment was £37bn
greater than traditional physical investment in 2008. Such investments are also highly
complementary, with new technologies requiring new processes and new skills (Dal
Borgo et al., 2013).
4.1 Skills and economic growth
For an advanced economy such as the UK, investment in improved skills makes a critical
contribution to ensure that the right human capital is in place to take advantage of new
market opportunities and new technologies. Recent research suggests that a one per
cent increase in the graduate workforce results in an increase of 0.2 to 0.5 per cent in
productivity (Holland et al., 2013).
Decomposition of the gap in productivity between the UK and leading advanced
economies finds labour quality (primarily determined by skill levels) to account for around
a fifth of the gap in the early 2000s (O’Mahony and de Boer, 2002). An analysis of the
effects of skills shortages on firm performance in the 1980s suggests that if they had
been reduced to European average levels, the UK would have seen 0.4 per cent faster
productivity growth through the decade (Haskel and Martin, 1993).
At firm level, evidence shows that provision of skills training is associated with firm
survival (Collier et al., 2007). Improving productivity performance depends on possessing
appropriate skills to develop ambitious product market strategies and then implementing
them, which depends in turn on management capability (UKCES/Mason and Constable,
2012). Various training programmes, such as Apprenticeships, are associated with
achieving a relatively good fit between the skills of employees and the needs of the
workplace which contributes to overall organisational performance and growth (see for
example Hogarth et al., 2012).
UKCESS shows that firms which develop their workforce are less likely to experience skill
shortages or skill gaps, and are consequently less likely to lose business to competitors,
experience delays in developing new products and services, or encounter problems
achieving quality and customer expectations (UKCES/Winterbotham et al., 2014).
42

The Labour Market Story: The UK Following Recession
4.2 The state of the labour market
In this paper, we have presented an overview of the state of the labour market within the
UK economy in early 2014, as it moves into sustained recovery after some tough years.
The recession which started that period saw a sharper contraction than faced by most
other advanced economies as an immediate result of the financial crisis. It is unsurprising
that such a large shock uncovered a series of weaknesses with the UK economy, and in
particular the labour market.
In fact, the greater surprise is that at the headline level the labour market performed as
efficiently as it did; given the fall in output, experience of past recessions would have
suggested a far greater and more sustained rise in unemployment. That said, there was
still a substantial rise in the numbers unemployed, and this increase hit hardest on many
at the fringes of the labour market, least able to withstand the shock, including especially
young people and the long-term unemployed.
Alongside the unemployed are those for whom labour market outcomes have meant
employment, but not necessarily the type of employment they are seeking. There is
certainly evidence of many people quantitatively underemployed (wanting more hours
than they have) and only able to find temporary work. The large rise in self-employment
may also be a last resort for some of those involved; better than unemployment, but not
as they would prefer. These are all fair criticisms of the limits of the labour market’s
efficiency; although, on the other hand, they are all likely superior outcomes than
consigning those involved to lasting unemployment.
The larger issues are longer lasting ones, in many ways already existing and crystallised
by the recession. Youth employment, for example, may have fallen sharply in the
recession, but it had been falling for some years previously, amidst a tight labour market.
Then there is the wider problem that while our labour market seems efficient, it may not
always be so effective. Alongside that quantitative underemployment (hours), we seem to
have plenty of qualitative underemployment, where people are unable to find work that
properly utilises their skills. Worse still, we seem also to have many firms facing limits on
growth because they can’t find the skills they need.
43
The Labour Market Story: The UK Following Recession To some extent, these problems will always be with us; but given the UK’s particularly
poor record on labour productivity performance since the onset of recession, tackling the
rate of mismatches must become a top priority. While they remain they present yet more
limits to the potential for longer term growth, for the wider economy but also for
individuals, limiting their prospects to work and earn. For firms too, they represent lost
opportunities to win new sales, improve efficiency or innovate new products and services.
Whether through improving the skills of workers, improving firms’ ability to match workers
to job needs, or wider changes, investments in improving labour market effectiveness
surely will have great value in the years ahead.
4.3 Policy challenges
In a time of great change in technology and global trading conditions, the UK labour
market needs to continue to evolve and adapt if it is to match the skills of the workforce to
the needs of firms as well as provide opportunities for people to earn a living and build a
career. In particular, it must adapt to a number of major challenges:
• Sustaining the fall in unemployment, and working to ensure that those left long-
term unemployed, especially those young when recession hit, can return to
employment.
• Evolving education and training institutions to ensure that they support successful
transitions from education and into employment.
• Ensuring that the supply of skills, and its matching, minimises unmet skills needs
among firms, which in turn contribute to lower productivity growth.
• Adapting labour market institutions (education, employment and training) to match
a world where traditional ideas about middle- and high-skill occupations are
changing fast.
Perhaps most of all, the biggest challenge is encouraging a return to sustained
productivity growth, which will contribute to rising wages, profit margins, and so greater
investment and expanding opportunity. This point is fundamental to any policy discussion:
improving labour market outcomes for individuals depends critically on creating the
conditions for rising employer demands, as firms pursue opportunities for business
growth. There are no magic wands that will lower unemployment, increase wages
(especially for the low paid) and allow for more people to be challenged and promoted; all
of these things depend on a successful business sector which embraces innovation and
thrives on competition.
44

The Labour Market Story: The UK Following Recession What do these challenges mean in practice? Sometimes, it is simpler to start with what
they do not. As Lloyd and Mayhew (2010) point out, past attempts to move the UK labour
market to deliver progression and higher wages by a general upskilling of those in the
workforce without a qualification were not successful (see also Wolf et al., 2006). The
polarisation of the labour market means that there continues to be demand for labour-
intensive, low-skill work, leaving aside the often multiple barriers facing those at the
bottom of the labour market, not always so simply solved.
None of this should be surprising if we consider the role of skills investments as
complements to technological and organisational changes. For that reason, skills needs
are often very particular to the issues in local or sectoral labour markets, and solutions
need to respond to those. The weakness is in ensuring the level of coordination
necessary to form those solutions. It is in tackling these coordination problems at local
level that the Government is channelling investment through Local Enterprise
Partnerships, as well as the Regional Growth Fund and City Deals.
Economic policy plays a fundamental role in shaping employer behaviour and the
operation of the labour market. Government’s role is to create the ‘framework conditions’
in which businesses can operate effectively, by ensuring macroeconomic stability and
supporting growth. Since the recession, the Government has implemented a range of
structural reforms which support increased business investment, improved productivity
and wider economic recovery (HM Treasury, 2011). Industrial strategies for key sectors
are being developed to support effective long-term cross-working between government
and industry, including co-investment. At the sectoral level, the Government has backed
the Employer Ownership Pilots, to co-invest with employers, helping to create the
infrastructure for lasting coordination improvements. These pilots have a wide variety of
approaches, with some investing in recruitment, some in developing new qualifications,
and some focused on training arrangements.
So too, Lloyd and Mayhew (2010) make the point that it is only changes in the structure
and design of jobs, emanating from the demand-side (the employer side) of the labour
market that will make a difference to prospects for pay and progression. Here again,
Government efforts to improve the business environment, improving infrastructure and
making investment attractive through lower Corporation Tax and removing unnecessary
regulation are important, as well as the more targeted supply-side actions to address
business and housing finance. In the longer term, Government commitment to invest in
science will ensure a flow of research and development knowledge with the potential for
substantial ‘spillovers’ into business opportunity.
45
The Labour Market Story: The UK Following Recession It is in the connection between education, training and employment institutions that a lot
of work will need to be done. Analysis of labour market change in the US suggests that
the contraction in middle-skill roles has limited opportunities most for young people and
the currently not employed, and that the expansion of high-skill roles is concentrated on
graduates (Smith, 2013). Acting to ensure that our vocational training model is fit-for-
purpose, attractive for young people, and delivers guaranteed high standards of skills, will
be particularly important. That is why Government has invested heavily in
Apprenticeships, is seeking to change them to improve their quality, and looking to
employers to take the lead.
At the macro level, the UK needs to create and retain high skill jobs. At the micro level,
we need to ensure that these jobs are in high performing organisations. Just as success
of UK firms will be the ultimate constraint to improved labour market performance,
employer action will be needed to meet challenges successfully. Labour market
outcomes are determined by firms deciding to employ and to invest in the talents of their
employees. Policy can seek to shape the conditions, to make hiring and investment more
likely to succeed. The more that we can assure employers that those conditions are
there, especially by involving them in their development, the more likely it will be that
policy measures will themselves be successful.
46
The Labour Market Story: The UK Following Recession
Bibliography Acemoglu, D., and Autor, D. (2010) ‘Skills, tasks and technologies: Implications for
employment and earnings’, in Card, D. and Ashenfelter, O. (eds.) Handbook of
Labor Economics, vol.4B. Elsevier, Amsterdam.
Ashworth, J., Goodhart, C.A.E., and Baker, M. (2014) The UK’s self-employment
phenomenon: why the labour market isn’t so strong after all. UK Economics, April 7.
Morgan Stanley Research Europe, London.
Barnett, A., Chiu, A., Franklin, J., and Sebastia-Barrel, M. (2014) The productivity puzzle:
a firm-level investigation into employment behaviour and resource allocation over
the crisis. Working Paper No.495 (April). Bank of England, London.
Bell, D.N.F. and Blanchflower, D.G. (2011) Youth unemployment in Europe and the
United States. Discussion Paper No.5673 (April). IZA, Bonn.
Besley, T. and Van Reenen, J. (eds.) (2013) Investing for Growth: A manifesto for growth.
Centre for Economic Performance. London School of Economics, London.
BIS (2012) Benchmarking UK Competitiveness in the Global Economy. BIS Economics
Paper No. 19. Department of Business Innovation and Skills, London.
Bisello, M. (2014) How does immigration affect natives’ task-specialisation? Evidence
from the United Kingdom. ISER Working Paper Series No.2014-12 (March).
Institute for Social and Economic Research. University of Essex, Colchester.
Bloom, N., and Van Reenen, J. (2010) ‘Why do management practices differ across firms
and countries?’, Journal of Economic Perspectives, Vol. 24 No.1, pp. 203-224.
Brewer, M., Gambin, L., Joyce, R. and Wilson, R. (2012) Who Gains from Growth? Living
standards in 2020. Resolution Foundation, London.
Brinkley, I. (2009) Recession and recovery to 2020: A knowledge economy report. The
Work Foundation, London.
Broadbent, B. (2012) ‘Productivity and the allocation of resources’. Speech given at
Durham Business School, 12th September. Bank of England, London.
Broadbent, B. (2014) ‘The balance of growth’. Speech given at London School of
Economics, 17th January. Bank of England: London.
47
The Labour Market Story: The UK Following Recession Collier, W., Green, F. and Young-Bae, K. (2007) Training and establishment survival.
Research Report 20. Sector Skills Development Agency, Wath-upon-Dearne.
Conlon, G., Patrignani, P. and Chapman, J. (2011) Returns to intermediate and low level
vocational qualifications. BIS Research Paper No.53. Department of Business
Innovation and Skills, London.
Dal Borgo, M., Goodridge, P., Haskel, J. and Pesole, A. (2013) ‘Productivity and Growth
in UK Industries: An Intangible Investment Approach’, Oxford Bulletin of Economics
and Statistics, Vol. 75, No.6, pp. 806-834.
Dustman, C., Frattini, T., and Preston, I.P. (2013) ‘The effect of immigration on the
distribution of wages’, Review of Economic Studies, Vol. 80, No. 1, pp. 145-173.
Elsby, M. W. L., Smith, J. C. and Wadsworth, J. (2011) ‘The role of worker flows in the
dynamics and distribution of UK unemployment’, Oxford Review of Economic
Policy, Vol. 27, No. 2, pp. 338-363.
Frontier Economics (2013) Labour force composition in low skilled sectors of the UK
economy. Migration Advisory Committee, London.
Goodridge, P., Haskel, J., and Wallis, G. (2013) 'Can intangible investment explain the
UK productivity puzzle?', National Institute Economic Review, Vol. 224, No, 1, R48-
R58.
Goos, M., and Manning, A. (2007) ‘Lousy and lovely jobs: The rising polarization of work
in Britain’, Review of Economics and Statistics, Vol. 89, No. 1, pp. 118–133.
Green, A., Atfield, G., Adam, D. and Staniewicz, T. (2013) Determinants of the
composition of the workforce in low skilled Sectors of the UK Economy. Migration
Advisory Committee, London.
Gregg, P., and Machin, S. (2012) What a drag: The chilling impact of unemployment on
real wages. Resolution Foundation, London.
Haskel, J. and Martin, C. (1993) ‘Do skill shortages reduce productivity? Theory and
evidence from the United Kingdom’, Economic Journal, Vol. 103, No. 417, pp. 386-
394.
Hanushek, E. A., Schwerdt, G., Wiederhold, S., and Woessmann, L. (2013) Returns to
Skills around the World: Evidence from PIAAC. OECD Education Working Papers
No.101. OECD, Paris.
48

The Labour Market Story: The UK Following Recession Hogarth, T., Gambin, L., Winterbotham, M., Baldauf, B., Briscoe, G., Gunstone, B.,
Hasluck, C., Koerbitz, C. and Taylor, C. (2012) Employer Investment in
Apprenticeships and Workplace Learning: The Fifth Net Benefits of Training to
Employers Study. BIS Research Paper No.67. Department for Business Innovation
and Skills, London.
HM Treasury (2011) The Plan for Growth. HM Treasury, London.
Holland, D., Liadze, I., Rienzo, C. and Wilkinson, D. (2013) The relationship between
graduates and economic growth across countries. BIS Research Paper No.112.
Department for Business Innovation and Skills, London.
Holmes, C. and Mayhew, K. (2012) The changing shape of the UK labour market and its
implications for the bottom half of earners. Resolution Foundation, London.
Jaimovich, N. and Siu, H.E. (2012) The trend is the cycle: job polarization and jobless
recoveries. NBER Working Papers 18334. National Bureau of Economic Research,
Cambridge, MA.
Keohane, N. and Hupkau, C. (2014) Making progress: Boosting the skills and wage
prospects of the low paid. Social Market Foundation, London.
Lansley, S. and Reed, H. (2013) How to boost the wage share. Touchstone Pamphlet No.
13. Trades Unions Congress, London.
Lloyd, C. and Mayhew, K. (2010) ‘Skills: the solution to low wage work?’, Industrial
Relations Journal, Vol. 41, No. 5, pp. 429-445.
Martin, B. and Rowthorn, R. (2012) Is the British economy supply constrained II? A
renewed critique of productivity pessimism. Centre for Business Research and UK-
IRC, University of Cambridge, Cambridge.
McIntosh, S. (2013) Hollowing out and the future of the labour market. BIS Research
Paper No.134. Department for Business Innovation and Skills, London.
O’Mahony M. and de Boer, W. (2002) ‘Britain’s Relative Productivity Performance: Has
Anything Changed?’, National Institute Economic Review, Vol. 179, No. 1, pp. 38-
43.
ONS (2014) Data tables http://www.ons.gov.uk/ons/datasets-and-tables/index.html
ONS (2014a) Analysis of Employee Contracts that do not guarantee a minimum number
of hours. Office of National Statistics, Newport.
49

The Labour Market Story: The UK Following Recession Ormerod, P. (2014) ‘The persistence of unemployment at the local area level: evidence
from the US and the UK’, Applied Economics Letters, Vol. 21, No. 1, pp. 28-30.
Oulton, N. (2013) Medium and long run prospects for UK growth in the aftermath of the
financial crisis. CEP Occasional Papers 37. Centre for Economic Performance,
London School of Economics, London.
Patterson, C., Sahin, A., Topa, G. and Violante, G.L. (2013) Mismatch Unemployment in
the UK, Staff Working Paper, Federal Reserve Bank of New York, New York.
Pissarides, C. (2013) ‘Unemployment in the Great Recession’, in Economica, Vol. 80, No.
319, pp. 385-403.
Smith, C.L. (2013) The dynamics of labor market polarisation. Finance and Economic
Discussion Series 2013-57. Federal Reserve Board, Washington, D.C.
Smith, J.C. (2012) Unemployment and mismatch in the UK. Paper presented to the Bank
of England. University of Warwick, Coventry.
Taylor, C., Jowett, A. and Hardie, M. (2014) An examination of falling real wages, 2010-
2013. Office for National Statistics, Newport.
Tingle, A., Large, A. and Shury, J. (2014) Multinational employers’ perceptions of the UK
workforce. Research Paper 170. Department for Business Innovation and Skills,
London.
Pessoa, J.P. and Van Reenen, J. (2012) Decoupling of wage growth and productivity
growth? Myth and reality. Report to the Commission on Living Standards.
Resolution Foundation, London.
Weale, M. (2014) ‘Slack and the labour market’, speech given to the Thames Valley
Chamber of Commerce, 20th March. Bank of England, London.
UKCES / Bosworth, D., Lyonette, C., and Wilson, R., Fathers, S. and Bayliss, M. (2013)
The Supply of and Demand for High Level STEM Skills. UKCES Evidence Report
77. UK Commission for Employment and Skills, Wath-upon-Dearne.
UKCES / Felstead, A., Green, F., Jewson, N. and Casey, P. (2013) Training in the
Recession: The impact of the 2008-2009 recession on training at work. Evidence
Report 72. UK Commission for Employment and Skills, Wath-upon-Dearne.
50
The Labour Market Story: The UK Following Recession UKCES / Mason, G. and Constable, S. (2012) Product strategies, skills shortages and
skill updating needs in England: New evidence from the National Employer Skills
Survey 2009. Evidence Report 30. UK Commission for Employment and Skills,
Wath-upon-Dearne.
UKCES / Wilson, R.A., Beaven, R., May-Gillings, M., Hay, G. and Stevens, J. (2014)
Working Futures 2012–2022. Evidence Report 83. UK Commission for Employment
and Skills, Wath-upon-Dearne.
UKCES / Winterbotham, M., Vivian, D., Shury, J., Davies, B. and Kik, G. (2014) The UK
Commission’s Employer Skills Survey 2013: UK Results. Evidence Report 81. UK
Commission for Employment and Skills, Wath-upon-Dearne.
Weale, M. (2014) ‘Slack and the labour market’. Speech given to the Thames Valley
Chamber of Commerce, Windsor, Thursday 20 March 2014.
http://www.bankofengland.co.uk/publications/Documents/speeches/2014/speech71
6.pdf
Wolf, A., Jenkins, A. and Vignoles, A. (2006) ‘Certifying the workforce: economic
imperative or failed social policy?’, Journal of Education Policy, Vol. 21 No.5, pp.
535-565.
World Economic Forum (2013) Country Profile Highlights: The Global Competitiveness
Report 2013-2014. World Economic Forum, Davos.
51

The UK Commission for Employment and Skills is a social partnership, led by Commissioners from large and small employers, trade unions and the voluntary sector. Our mission is to raise skill levels to help drive enterprise, create more and better jobs and economic growth.
UKCESRenaissance HouseAdwick ParkWath-upon-DearneRotherhamS63 5NBT +44 (0)1709 774 800F +44 (0)1709 774 801
UKCESSanctuary Buildings Great Smith St.Westminster LondonSW1P 3BTT +44 (0)20 7227 7800
© UKCES 1st Ed/07.14