the labor market effects of offshoring by u.s. multinational
TRANSCRIPT

The Labor Market Effects of Offshoring by U.S. Multinational Firms∗
Brian K. KovakCarnegie Mellon University
NBER and IZA
Lindsay OldenskiGeorgetown University
and PIIE
Nicholas SlyFederal Reserve Bank
of Kansas City and CESifo
Abstract
We use firm-level data on U.S. multinationals to show how offshoring affects domes-tic employment within and across firms. We introduce a new instrument for offshoring:Bilateral Tax Treaties, which reduce the cost of offshore activities. We find substantialheterogeneity in effects. A 10 percent increase in affiliate employment drives a 1.3percent increase in employment at the U.S. parent firm, with smaller effects at theindustry and regional levels. In contrast, offshoring by vertical multinationals drivesdeclining employment among non-multinationals in the same industry, and firms open-ing new affiliates exhibit smaller domestic employment growth than those expandingexisting affiliates.JEL Classification: F16, F23, F66, J20, J30
∗The statistical analysis of firm-level data on U.S. multinational companies was conducted at the Bureauof Economic Analysis, U.S. Department of Commerce under arrangements that maintain legal confidential-ity requirements. The authors would like to thank William Zeile, Raymond Mataloni, and James Fetzer forassistance with the BEA data and James Albertus, Nathan Anderson, David Atkin, Brian Cadena, DaveDonaldson, Andrew Goodman-Bacon, Jim Hines, David Hummels, Ben Keys, Peter Morrow, Greg Wright,and participants at various conferences and seminars for helpful discussions. Benjamin Mayer providedexcellent research assistance. The views expressed herein are those of the authors and do not reflect offi-cial positions of the U.S. Department of Commerce nor the views of the Federal Reserve Bank of KansasCity or Federal Reserve System. Nicholas Sly gratefully acknowledges financial support from the WE Up-john Institute received while at the University of Oregon. Contacts – Kovak: [email protected], Oldenski:[email protected], Sly: [email protected]
1 Introduction
In recent years, the question of how offshoring affects domestic employment has been at theforefront of political and popular discussions of international economic policy. In spite of thesalience of this question, there is little agreement among academic economists regarding thesign of offshoring’s effects on domestic labor market outcomes, let alone the magnitude.1 Thisis in large part because the term “offshoring” comprises many different activities. Offshoringmay take place within a multinational firm or at arm’s length. Firms may relocate U.S.production to new plants in other countries, or they may increase their output at existingoffshore locations. The work performed in the U.S. may differ from the work performedoffshore. These different dimensions of offshoring decisions could have different effects notonly on the workers at the firm doing the offshoring, but also on workers at competing firmswithin the same industry or in supporting industries within the same geographic location.
We present a consistent framework to study the effects of offshoring on employmentwithin U.S. multinational firms, at all firms in a given U.S. industry, and for all workers in agiven region, with changes in effective tax rates of foreign affiliates serving as an instrumentfor offshore employment. We combine data on U.S. multinational enterprises (MNEs) fromthe U.S. Bureau of Economic Analysis (BEA) and broader industry employment withinCounty Business Patterns data to highlight differences in the effects of offshoring acrossindustries (with high vs. low reliance on royalties, interest, and dividends), due to variousoffshoring margins (extensive vs. intensive), and between organizational forms (domestic vs.multinational). Our results show that these distinctions matter. A 10 percent increase inaffiliate employment drives a 1.3 percent increase in employment at the U.S. parent firm,with smaller effects at the industry and regional levels. In contrast, increased foreign affiliateactivity in vertically oriented multinational firms drives declining employment among non-multinationals in the same industry, and multinational firms opening new affiliates exhibitsmaller domestic employment growth than those expanding existing affiliates. Overall, ourresults indicate that greater offshore activity modestly raises net employment by U.S. firms,albeit with substantial job loss and employment reallocation.
Any empirical analysis of the labor market effects of offshoring is complicated by the1For example, Desai et al. (2009) find a positive relationship between domestic labor market outcomes
and offshoring activities of U.S. multinationals, while Muendler and Becker (2010) find negative effects forGerman multinational firms, and Monarch et al. (2014) find negative employment effects of offshoring forU.S. firms participating in the Trade Adjustment Assistance program. Harrison and McMillan (2011) provideevidence from the U.S. that the association between offshore and domestic employment may depend on thetype of offshoring activity. The destination of offshore activities may also alter the relationship betweendomestic and foreign employment; see Brainard and Riker (1997). Rather than positive or negative effects,several studies find null impacts of offshoring on domestic labor market outcomes, e.g. Slaughter (2000,2001), Ottaviano et al. (2013), and Antras et al. (2017).
1
fact that offshore activity and domestic employment both reflect choices made by firms,making it difficult to disentangle the causal relationships between the two phenomena. Toovercome this inherent simultaneity between domestic and offshore employment, we exploita policy instrument that alters the relative costs of offshore activity and is exogenous tofirm choices — bilateral tax treaties (BTTs). These treaties allow U.S. firms to avoid doubletaxation, in which foreign affiliate income is taxed in two jurisdictions due to constraints onthe size of the foreign tax credit available to U.S.-owned firms. BTTs make this constraintless likely to bind, lowering the average effective tax rate on income from foreign affiliates,hence lowering the overall cost of offshore activity. During our sample period of 1987-2007,countries accounting for 23 percent of total foreign affiliate employment of U.S. multinationalfirms received new BTTs with the U.S. We leverage variation in the timing of these treaties,the pre-existing country mix of multinational firms’ affiliates, and the incidence of doubletaxation across industries to infer the causal effect of BTT-induced changes in foreign affiliateemployment on changes in U.S. domestic employment.
To motivate our empirical analysis we use the model of multinational firm organizationdeveloped by Antras and Helpman (2004).2 This framework i) demonstrates the simultaneityof employment decisions at a domestic parent and its foreign affiliates, ii) characterizes thedivision of revenue between multinational parents and affiliates, which is necessary to addressdouble-taxation, iii) characterizes sourcing decisions within and across both country and firmboundaries, dimensions of offshoring that have different implications for U.S. employment,and iv) yields a panel difference-in-differences estimation strategy, with changes in effectivetax rates of foreign affiliates serving as an instrument for offshore employment.
We rule out the presence of confounding pre-trends using an event-study frameworkdemonstrating similar employment trends for affected and unaffected firms prior to BTTimplementation. This analysis also documents positive (reduced-form) effects of BTTs ondomestic employment in multinational firms, with results concentrated in industries withrelatively high royalty, interest, and dividend payments (RID) to the parent. This is to beexpected since the pre-treaty incidence of double-taxation – and thus the benefit of a BTT –is larger for firms in high RID industries.3 RID payments are subject to foreign withholdingtaxes, which often place total foreign tax payments above the maximum level of the U.S.foreign tax credit, resulting in double taxation. We also find a strong positive (first-stage)
2See Feenstra and Hanson (2005) and Defever and Toubal (2013) for empirical support of the propertyrights/incomplete contracts theory of multinational firms.
3Blonigen et al. (2014) provides evidence that the effects of BTTs vary across U.S. industries accordingto the use of differentiated inputs. Highly differentiated products tend to have higher markups and so morerevenue that is exposed to double taxation. Rather than use a proxy for the degree to which income issubject to double taxation, here we use initial royalty, interest, and dividend payments at the industry levelto assess directly the exposure to treatment from BTTs.
2

effect of BTTs on foreign-affiliate employment, but only in high RID industries. The absenceof effects in low RID industries helps rule out identification concerns regarding other policyreforms that might have occurred simultaneously with BTTs.
For our exclusion restriction to hold, it must be the case that BTTs only impact thedomestic hiring decisions of U.S. firms through their effect on foreign affiliates. We offerseveral pieces of evidence supporting this assumption. First, BTTs reduce the tax burden onforeign affiliate activities, leaving the taxation of domestic activity unchanged. Second, thevast majority of double-taxation cases involving U.S.-owned firms are raised in the foreignaffiliate’s country, suggesting that this is where the costs of double taxation are incurred(Ernst and Young, 2015). Third, we show that firms in industries that are less likely tobe subject to double taxation exhibit no reduced-form relationship between BTTs and U.S.employment, nor do they have significant first stage results linking BTTs with foreign affil-iate employment. These relationships only exist for the sample of firms in industries withrelatively large royalty, interest, and dividend payments to the parent, payments that arethe source of double taxation, again supporting the exclusion assumption (Angrist and Pis-chke 2009 p.131). Finally, our IV estimates are significantly smaller than the correspondingOLS results and are less than one third the magnitude of estimates in the most closely re-lated prior literature (Desai et al., 2009), which suggests that our instrument substantiallyameliorates upward simultaneity bias.
In addition to our firm-level analysis we use County Business Patterns data to study em-ployment outcomes for overall national industries and regional labor markets. The industryperspective allows us to capture two margins that are absent in the analysis of multinationalfirms alone. First, changes in employment at multinational parents may be partly offset byequilibrium employment adjustment at other domestic firms in the same industry. Second,declining costs of offshore activity will likely motivate some firms to become multinationalfirms by opening new affiliates. Both margins predict smaller effects at the industry levelthan at the multinational parent level, and this is what we find. The effect within multina-tional parents is much smaller than the overall industry employment effect, and employmentat non-multinational firms significantly declines in response to increased offshore activityat vertically oriented multinational firms in the same industry, suggesting substitution ofintermediate input purchases from domestic suppliers to foreign affiliates adversely affectsdomestic employment. Finally, we examine effects at the regional level, capturing potentialspillovers across industries in the same metropolitan area. We generate a regional measure ofoffshoring exposure as a weighted average of industry-level foreign affiliate employment, withweights reflecting the market’s initial industry mix, using a procedure similar to Topalova(2010), Autor et al. (2013), and Kovak (2013). As before, we instrument for observed affiliate
3

employment using BTTs. The metro-area estimates are somewhat larger in magnitude thanthe industry results, consistent with the presence of cross-industry spillovers at the regionallevel.
Our paper contributes in a variety of ways to the literature on the labor market effectsof offshoring. We introduce Bilateral Tax Treaties as a new source of identifying policyvariation in the effective cost of offshore activity.4 Although BTTs have been extensivelystudied in prior work, to our knowledge they have not been used to examine the domesticlabor market effects of offshoring.5
Other work has documented that the relationship between offshore and domestic em-ployment varies according to the affiliate country (Brainard and Riker, 1997) and the typeof offshoring activity (Harrison and McMillan, 2011). By examining outcomes at differentlevels of aggregation and for different subsamples, we are also able to capture heterogene-ity in the effects of offshoring across firms with different organizational forms and differentoffshoring margins. For example, our parent-level analysis suggests that extensive-marginoffshoring (opening new affiliates in response to cost reductions) does not significantly affectdomestic employment within multinationals, while intensive-margin adjustments (increasingemployment at existing affiliates) increase domestic employment. These findings suggestthat there is not a single effect of increased offshore activity on domestic employment, butthat the effects vary depending on the circumstances, potentially explaining differences inempirical findings across research papers.6
This observation also has important implications for relating our findings to others in thebroader literature on the effects of increased imports, which tends to find negative effectsof total imports on labor market outcomes (e.g. Autor et al. (2013), and Hummels et al.(2014)). Total imports include final goods, inputs purchased abroad at arms-length, andinputs purchased from foreign affiliates of domestic multinationals. Each of these trade flowsmay have a different effect on domestic labor market outcomes and is subject to different
4Closely related prior work uses variation based at least partly on year-to-year changes in affiliate-countryGDP (Desai et al., 2009) or wages (Brainard and Riker, 1997; Slaughter, 2000; Muendler and Becker, 2010;Harrison and McMillan, 2011). Permanent reductions in the cost of offshore activity following a a BTT moreclosely parallel the secular declines in offshoring costs during recent decades
5See, for example, Blonigen and Davies (2004), Davies (2004), di Giovanni (2005), Egger et al. (2006),Louie and Rousslang (2008), Davies et al. (2009), and Blonigen et al. (2014).
6For example, we find positive net effects on domestic employment while a recent paper by Boehm et al.(2017) find declining domestic employment in response to offshoring. Their analysis restricts attention toU.S. manufacturing establishments, omitting the headquarters establishments where positive scale effectsare most likely to emerge. They also observe offshoring at arms-length and extensive margin offshoring atnewly formed multinationals. Both of these margins likely contribute to domestic employment declines butare unobservable in the BEA data. In contrast, Suarez Serrato (2018) examines the effects of an effective taxincrease on firms with existing affiliates, in which scale effects are most likely to dominate, finding domesticemployment effects consistent with ours.
4

policy interventions. We focus on the effects of increased employment at foreign affiliates ofU.S. multinational firms, both to take advantage of a compelling policy-based identificationstrategy and because the potential effects of offshoring by multinational firms have been thetopic of much attention in political debates and the popular press, distinct from discussionsof trade more broadly. Moreover, the U.S. Census Bureau reports that about 50 percentof U.S. imports are between related parties, and Slaughter (2009) discusses evidence thatMNEs account for approximately 20 percent of total employment in the U.S. Hence, the typeof offshoring we consider here is of first-order importance to U.S. labor market outcomes.
Our research design explicitly measures the overall effects of declining costs of offshoreactivity, including potential substitution and scale effects. This approach is distinct fromthat in papers estimating substitution parameters in multinational firm-level cost functions,which explicitly hold firm output fixed to isolate substitution effects.7 In our framework,the key mechanism driving the positive relationship between domestic and offshore affiliateemployment is that firms may expand output, and thus employment, as offshoring costsfall. Hence, our positive estimates are entirely consistent with prior work finding that for-eign and domestic employment are substitutes, since our estimates reflect a combination ofsubstitution and scale effects. Moreover, we find independent evidence for the quantitativeimportance of substitution effects by showing smaller employment growth in firms openingnew affiliates in BTT countries, a margin in which substitution effects are most important.
The following section describes Bilateral Tax Treaties and the data we utilize to studytheir effects. Section 3 estimates the reduced-form effect of BTTs on domestic employmentin multinational firms, emphasizing that the appearance of BTTs was uncorrelated withpre-existing firm employment growth. Section 4 presents our main analysis, studying howincreased offshore employment affects domestic employment. This includes the theoreticalframework, analysis of how BTTs affect foreign affiliate employment, and results for theeffects of offshoring at the multinational parent, industry, and regional levels. Section 5concludes.
2 Background and Data
This paper identifies the effects of offshore employment on domestic employment using vari-ation in offshore activity driven by Bilateral Tax Treaties (BTTs). BTTs resolve a problemcalled “double taxation” in which limits on the amount of foreign tax credits available to
7e.g. Slaughter (2000) and Muendler and Becker (2010). Harrison and McMillan (2011) control for outputby assuming that firm output depends only upon domestic and foreign prices and then empirically proxyingfor those prices using industry sales.
5

U.S. MNEs result in the same income being taxed in two jurisdictions, potentially raisingthe effective tax rate for foreign affiliates well above the statutory level in either jurisdiction.
In particular, during our sample period the U.S. corporate tax applied to worldwideprofits, meaning that profits resulting from a U.S. multinational firm’s activities both athome and abroad were subject to the U.S. corporate tax. This is in contrast to territorialsystems, in which foreign affiliate activity is only taxed by the country in which the affiliateis located.8 Under the U.S.’s worldwide system, any foreign tax on foreign affiliate activitywould subject the firm to double taxation in the absence of some compensation. In an effortto limit this possibility, the U.S. government offers a foreign tax credit to U.S. firms to offsettheir foreign tax liabilities.9 However, a U.S. multinational firm may not claim a foreign taxcredit that exceeds the U.S. tax on foreign taxable income, otherwise the U.S. IRS wouldimplicitly subsidize the foreign tax authority. When the foreign tax liability exceeds thislimit, a portion of the firm’s income is taxed by both the U.S. and foreign taxing authoritieswithout an offsetting credit.
Double taxation of this kind is most likely to arise when the foreign jurisdiction imposesa substantial tax on royalties, interest, or dividends, known as a “withholding tax.” Theserates can be quite high, so that the combined corporate income tax and withholding tax inmany foreign jurisdictions can exceed the relatively high U.S. corporate tax rate. In thiscircumstance, the firm owes withholding taxes to the foreign tax authority without receivinga fully offsetting credit, resulting in double taxation and imposing additional costs on theforeign activities of the firm.
To see how lowering withholding tax rates helps avoid double taxation, consider a hy-pothetical situation in which a U.S. multinational firm has an affiliate in Mexico that earns$100 of taxable income, $60 of which is paid to the U.S. parent in the form of royalties.Before a BTT is in place, the Mexican tax authority levies a 25 percent withholding tax onthe $60 of royalty payments plus a 35 percent tax on the $40 earned in its jurisdiction. Inthis scenario the foreign tax authority collects $29 (= 0.25 ∗ 60 + 0.35 ∗ 40) from the foreignaffiliate. Yet, the U.S. foreign tax credit limit is $14 (= 0.35 ∗ 40), reflecting the 35 percentU.S. corporate tax rate applied to the value of Mexican activity. As a result, the foreignaffiliate is left with $15 in un-credited foreign tax liabilities, subjecting the multinationalenterprise to double taxation. If signing a BTT were to eliminate the withholding tax, thenthe U.S. foreign tax credit would be sufficient to fully offset the taxes paid to the foreigntax authority. Albeit an overly simplified example, this scenario demonstrates how limits on
8With the Tax Cuts and Jobs Act of 2017, the U.S. adopted a more territorial corporate tax system soour identification strategy does will not apply after 2017.
9See Desai et al. (2001) for an introduction to the U.S. foreign tax credit and Doernberg (2016) Ch. 8and Misey and Schadewald (2015) Ch. 4 for detailed treatments.
6

foreign tax credits can lead to double taxation, and how BTTs can mitigate the problem byreducing withholding tax rates on royalty, interest, and dividend income.10
Table 1 provides information on each of the U.S. BTTs that entered into force duringour sample period 1987-2007.11 These treaty partner countries account for approximately 23percent of total foreign affiliate employment of U.S. MNEs during our sample period.12 Table1 also reports withholding tax rates on royalty, interest, and dividend income facing U.S.multinational firms just before and just after the relevant BTT entered into force. Note thewithholding rates under the treaty are often substantially lower than they were prior to thetreaty. By reducing these withholding rates, BTTs reduce the probability of double taxation,lowering the effective tax rate faced by multinational firms and incentivizing offshore activityin treaty countries.
Even though BTTs apply to all industries, the effects of BTTs on effective tax ratesmay vary by industry because of differences in the initial incidence of double taxation. Formultinational firms in industries where royalties, interest, and dividends (RID) are higher,the amount of withholding tax levied on foreign affiliate activity is also higher, and doubletaxation is more likely. In contrast, industries that rely minimally on royalty, interest,and dividend payments are much less likely to face double taxation. Hence, we expect theeffects of BTTs to be larger in industries with relatively high RID payments. Appendix A.2describes in detail our categorization of industries with high or low RID payments.
Our empirical analyses examine the effects of BTTs on employment in U.S. multinationalfirms, their foreign affiliates, and the broader labor market. Information on multinationalfirms comes from the 1987-2007 Surveys of U.S. Direct Investment Abroad, collected bythe Bureau of Economic Analysis (BEA). These data provide a quasi-exhaustive sampleof U.S. multinational firms and their affiliates in foreign countries. Our analysis utilizesinformation on domestic employment at the U.S. parent firm and employment in each ofits majority-owned foreign affiliates, along with information on each parent firm’s 3-digitprimary industry.13 Firm-level data are ideal in this context, as they allow us to control for
10Note that the prospect of double taxation arising from withholding taxes may deter firms from makingroyalty, interest, or dividend payments (Desai et al., 2001). Even in this case, lowering withholding taxesthrough a BTT lowers effective costs, since it allows the firm to allocate resources with less distortion.
11Treaties are often signed in years prior to when they become effective, and several BTTs have beenrenegotiated over time. We use the date in which the original signing entered into force to indicate whencountries have a treaty in place. See IRS.gov, United States Income Tax Treaties A-Z for treaty text,including relevant dates. Our event-study analysis in Figure 1 below shows no sign of anticipatory effects,supporting this timing definition. See Appendix A.1 for a visualization of our sample’s time coverage relativeto BTT dates.
12Authors’ calculations using the BEA Surveys of U.S. Direct Investment Abroad.13We classify affiliates based on their parent’s primary industry. The BEA uses 3-digit SIC-based ISI codes
prior to 1999 and uses 4-digit NAICS-based ISI codes afterwards. For consistency, we convert NAICS-basedcodes to 3-digit SIC-based codes for the relevant years.
7

time-invariant unobservable firm or affiliate characteristics and to investigate heterogeneityin effects based on offshoring margin and firm organizational structure. Our sample includes5,715 firms with 46,498 foreign affiliates spanning 121 3-digit industries and operating in 130countries from 1987 to 2007. Note that our sample includes all multinational firms, includingthose outside manufacturing.
After examining outcomes within multinational firms, we consider employment effects atthe industry and regional levels using data on employment by industry and metropolitanstatistical area (MSA) from the U.S. Census Bureaus’s County Business Patterns (CBP).These data report total employment at private business establishments in covered industriesby industry and county.14 We aggregate industries to match the 3-digit classification usedin the BEA data and aggregate counties to construct 304 time-consistent metropolitan areasspanning our sample period.
Throughout our analyses, we present specifications controlling for a standard set of time-varying country-level determinants of offshoring, using data compiled from several sources.15
Control variable names appear in square brackets. To capture the regularities that greaternational incomes promote foreign affiliate activity, while large differences in national in-come reduce it, we control for the log of the sum of U.S. and affiliate country’s real GDP[ln(GDPus + GDPd)] and the log of the squared difference in the two countries’ GDPs[ln((GDPus − GDPd)2)]. Information regarding real GDP and trade costs come from thePenn World Tables, with national incomes expressed in trillions of U.S. dollars. Tradecosts are measured using a standard definition of openness: the log of 100 minus the tradeshare of total GDP [ln(Trade Costs)]. The skill difference between the U.S. and a foreignaffiliate country is measured as the log of the difference in average educational attainment[ln(Skill Difference)] from Barro and Lee (2010). Educational attainment measures are avail-able every five years, so we linearly interpolate data for years between observations. Dataindicating whether the U.S. has a bilateral investment treaty [BIT] with the destination coun-try are from the United Nations Conference on Trade and Development. The presence offree trade agreements [FTA] across countries is available from the U.S. Trade Representative.Annual exchange rate data [Exchange Rate] are from the World Bank.
Table 2 reports summary statistics for the all foreign affiliates in our sample and the U.S.parent firms that own them. The average firm in our sample has roughly 9 foreign affiliateswith total foreign employment of 3513 workers and total U.S. employment of 7906 workers.
14The CBP data provide full coverage in all industries except crop and animal production; rail trans-portation; National Postal Service; pension, health, welfare, and vacation funds; trusts, estates, and agencyaccounts; private households; and public administration.
15See Carr et al. (2001), di Giovanni (2005), and Blonigen et al. (2014) for papers motivating thesecontrols.
8

3 Effects of BTTs at U.S. Multinationals
Before moving on to our theoretically motivated IV estimates of the effects of offshoring onU.S. employment, we begin our empirical analyses by estimating the effect of BTTs on U.S.parent firm employment. This analysis is the reduced form of the simultaneous equationsframework introduced in Section 4.1, and serves two purposes. First, the effect of BTTs onmultinational firm hiring in the U.S. is of independent interest, as tax treaties are among themost commonly implemented policy tools affecting the incentives to engage in cross-borderproduction, and they help inform us about the broader consequences of changes in effectivetax rates for multinational firms. Second, this analysis allows us to rule out the presence ofconfounding trends, in which faster growing multinational firms are systematically more orless likely to have affiliates in countries signing new BTTs with the U.S.
We estimate the effect of BTTs on parent employment using a panel difference-in-differencesresearch design (Bertrand et al., 2004). In order to have a single well-defined treatment pe-riod for each parent firm, here we focus on the first BTT received by one of the parent’saffiliates during our sample period. A parent firm is treated when at least one of the countrieshosting its affiliates has enacted a new BTT with the U.S. during our sample period. Definetf as the first year in which an affiliate of firm f receives a BTT, so the firm is treated whent ≥ tf . To account for differences in the relative importance of the first affiliate receiving aBTT, we scale the treatment indicator by that affiliate’s pre-BTT share of the parent firm’stotal affiliate employment, ϕf estimate the following:16
ln sft = βRF[ϕf1(t ≥ tf )
]+ ΓXft + λf + νit + εft, (1)
where sft is U.S. employment at parent firm f in year t; 1(t ≥ tf ) is a treatment indicator foryears in which at least one of firm f ’s affiliates has received a BTT; this treatment indicator isscaled by that affiliate’s initial employment share, ϕf ; Xft is the vector of standard offshoringcontrols described in Section 2; λf are parent firm fixed effects; νit are industry-year fixedeffects; and εft is an error term. Because (1) includes fixed effects for each parent firm and foreach industry-year combination, βRF measures the (reduced form) difference in employmentgrowth for parent firms in the same industry whose affiliates do and do not receive BTTs.
16To be precise, let tc be the year in which country c enacts a BTT with the U.S., and tc =∞ if the countrydoes not enact a BTT. Cf is the set of countries in which firm f initially has affiliates. Then tf ≡ minc∈Cf
{tc}.Note that tf = ∞ if none of f ’s affiliates have a BTT during our sample period, so 1(t ≥ tf ) = 0, and f isnot treated. Let cf ≡ arg minc∈Cf
{tc} be the first of firm f ’s affiliate countries to receive a BTT. Affiliatecf ’s pre-BTT share of affiliate employment is then ϕf ≡ (mf,cf ,tf−1)/(
∑c∈Cf
mf,c,tf−1), where mf,c,t isemployment at parent firm f ’s affiliate in country c in year t. We scale by the pre-BTT affiliate employmentto avoid including any endogenous employment adjustments.
9

We calculate two-way cluster-robust standard errors, clustering by parent firm and by year.The results appear in Table 3. The first column includes firms from all industries, while
columns (2) and (3) separately estimate the effects of BTTs in industries with high and lowlevels of royalty, interest, and dividend (RID) payments. A positive point estimates for theBTT indicator’s coefficient implies that parent firms whose affiliates receive BTTs expandemployment on average in comparison to parents whose affiliates do not. The effect on allparents in column (1) is statistically insignificant.17 However, when restricting the sampleto parents in high RID industries, BTTs have large and statistically significant effects. Thisis expected since double taxation is more likely in these industries prior to BTT implemen-tation. In contrast, the estimates for low RID industries are much smaller and statisticallyindistinguishable from zero. Introducing additional controls in columns (4)-(6) yields similarresults. The coefficient in column (5) implies that a BTT for a multinational firm with singleaffiliate in high RID industries increases domestic employment by 6.6 percent.18
In order to interpret the estimates from (1) as the causal effect of BTTs on MNE parentfirm employment, it must be true that parents whose affiliates did and did not receive BTTswould have experienced equal average employment growth in the absence of new BTTs. Wetest for pre-existing differences in employment trends using the event-study framework ofJacobson et al. (1993), in which we examine the employment effect of a parent’s first newBTT in each year before and after it enters into force. The estimation equation, whichstrictly generalizes the difference-in-differences specification in (1), is
ln sft =+6∑j=−6
βRFj[ϕf1
(t− tf = j
)]+ ΓXft + λf + νit + εft. (2)
The estimates of βRFj measure the difference in employment growth for parent firms inthe same industry whose affiliates do and do not receive new BTTs, in year j before orafter the BTT was implemented. To rule out potentially confounding pre-BTT trends inparent firm employment growth, we expect βRFj ≈ 0 ∀j < 0. We focus on high RIDindustries, since they exhibited substantial responses to BTTs in Table 3. Figure 1 plots theestimated coefficients along with their 95 percent confidence intervals, with the year beforeBTT implementation (j = −1) as the omitted category, equal to zero. The coefficients onthe pre-BTT βRFj are flat and nearly identical to zero, and there is no sign of pre-BTTdifferences in employment growth for firms that would and would not later be treated.Only in the period of BTT implementation and later do treated and non-treated firms’
17di Giovanni (2005), Blonigen and Davies (2005), and Davies et al. (2009) also find no robust relationshipbetween BTTs and FDI activity at an aggregate level.
18100 ∗ (exp(0.064)− 1) = 6.6.
10
employment growth rates diverge, as indicated by the jump in period 0, in which the BTTwas implemented, and growth in the effects over the subsequent years. These results areconsistent with prior evidence that increased multinational activity occurs only after BTTsenter into force (Blonigen et al., 2014), and show that BTT assignment is uncorrelated withpreexisting firm performance.19
Together, the results in this section show that decreasing effective tax rates on foreignaffiliate activity by enacting a BTT increases employment at the U.S. parent firm. As wewill discuss in detail below, these positive estimates suggest that scale effects, in which lowercosts drive increases in overall firm activity, outweigh substitution effects, in which firms shiftactivity toward the newly cheaper affiliate activities. Statistically and economically signif-icant results appear for parents in high RID industries, which benefit most from removingdouble taxation, while the effects in low RID industries are indistinguishable from zero.
These findings support the notion that BTTs are exogenous to counterfactual firm em-ployment growth in a variety of ways. The lack of confounding pre-BTT trends in parentemployment rules out concerns in which firms that were experiencing stronger employmentgrowth were systematically more likely to have affiliates receiving BTTs. Another potentialconcern is the presence other time-varying confounders that are correlated with BTTs. Apotential example is that some countries listed in Table 1 (e.g. India) implemented othermarket-based policy reforms around the time their BTT entered into force, potentially con-founding the effects of BTTs on employment growth. Unlike BTTs, broader market reformsshould affect both high- and low-RID industries, so the lack of any observed effect of BTTs inlow RID industries rules out substantial confounding from simultaneous policy reforms. Inthe following section, we similarly find that BTTs have no effect on affiliate employment inlow RID industries. As Angrist and Pischke (2009) argue (p.131), the lack of reduced-form(parent) effect in a subsample with no first-stage (affiliate) effect helps reinforce the idea thatBTTs satisfy the exclusion restriction required for the IV analysis in the following section.
4 Effects of Offshoring on Domestic Employment
We now turn to studying the more general question of how changes in foreign affiliate hiringaffect domestic employment at multinational parent firms and in the broader U.S. labormarket. Although this question has been the subject of prior research and is of interest to
19In Appendix A.3 we implement two alternative versions of this parent-level reduced form analysis. First,we remove the affiliate employment scaling factor, ϕf , and examine the effect of an average BTT irrespectiveof the relative size of the affected affiliate. Second, we utilize information on all new BTTs experienced bya parent firm’s affiliates, not just the first one. In each case we find results consistent with our preferredspecification.
11
policy makers, it is difficult to answer credibly due to the inherent simultaneity betweenoffshore and domestic activity.
4.1 Theoretical Framework
We utilize the Antras and Helpman (2004) global sourcing model to motivate an estimationstrategy using BTTs to resolve this simultaneity problem. This particular model suits ourcontext for three reasons. First, it defines the boundary of the firm in an environment withincomplete contracts, allowing us to characterize how the effects of offshoring vary acrossfirms with different organizational forms. Since BTTs only influence effective tax ratesfor integrated multinationals (not those transacting at arm’s length), the firm boundarydistinction is essential. Second, by specifying each agent’s bargaining position, the frameworkdescribes the economic division of revenue across tax jurisdictions, thereby characterizing therespective tax liabilities, and subsequently the potential for double taxation. Finally, themodel explicitly characterizes the simultaneity of parent and offshore affiliate employment,yielding a system of linear simultaneous equations justifying a panel difference-in-differencesresearch design using variation in BTTs as an instrument for affiliate employment.
4.1.1 Fundamentals
The world economy consists of one home country and C foreign countries. Consumers inall countries are laborers with identical quasi-linear preferences over a homogeneous good,xt0, and a series of composite goods, Xti, across industries i = 1...I, given by Ut = xt0 +1µ
∑Ii=1X
µti, with 0 < µ < 1. Consumers have constant elasticity of substitution preferences
over unique varieties, f , among the set Fti of varieties available in industry i and periodt specified as Xti =
[∫f∈Fti xti(f)αidf
]1/αi, with 0 < αi < 1. It follows that, within each
period, monopolistically competitive firms each producing a unique variety, f , face an inversedemand function pti(f) = Xµ−αi
ti xti(f)αi−1.Labor is the only factor of production, with a perfectly elastic supply in all countries.
Let ω be the wage in the home country and wc be the wage in each Foreign country withω > wc. Workers may either perform headquarters services, s, or assembly, m, in producingthe variety of the final good sold by the firm. Each worker can provide a single unit ofheadquarters services or assembly services, and the final product for each firm is deliveredto consumers by combining headquarters services and assembly according to
xti(f) = θ(f)[st(f)ηi
]ηi [mct(f)1− ηi
]1−ηi, (3)
12

where θ(f) is a firm-level productivity parameter. Headquarters services, st(f), can only beperformed domestically, while assembly can take place domestically or at factories in anycountry c ∈ C.20 Regardless of where assembly occurs, the process is firm-specific.
4.1.2 Offshoring and Double Taxation in Integrated Multinationals
Firms face an inability to write ex-ante enforceable contracts over the delivery of specializedinputs like R&D, design, marketing, or the specific processes used during assembly at thefactory. Instead, the parent firm and affiliate engage in Nash bargaining over the surplusfrom their relationship after goods are sold. A multinational enterprise is comprised ofa parent firm that supplies headquarters services and integrates with its offshore assemblyfactory, giving the parent the right to seize outputs from the affiliate after they are produced.However, in the case of seizure the parent loses a share (1−δc) ∈ (0, 1) of final output, whichcan vary by the location of offshore assembly c. The parent’s outside option is thereforeto seize the goods produced and sell them directly, receiving only a proportion δαic of therevenue that would result had the parent not exercised its rights to claim the assembledoutput. Thus, the surplus generated by cooperation between the parent and affiliate is afraction (1− δαic ) of total revenue. The parent company receives a fraction β of this surplus,with the remainder going to the foreign affiliate supplier.
The parent’s problem is therefore to choose its employment, equivalent to choosing itsproduction of headquarters services st(f), in order to maximize its profits:
maxst(f)
[δαic + β(1− δαic )] rti(f)− ωst(f), (4)
where revenue is rti(f) = θ(f)αiXµ−αiti
[st(f)ηi
]αiηi [mct(f)1−ηi
]αi(1−ηi). The corresponding problemfor the affiliate performing assembly in foreign location c is
maxmct(f)
[(1− β)(1− δαic )] rti(f)− τctiwcmct(f) . (5)
The term τcti ≥ 1 is our addition to the Antras and Helpman (2004) model, reflecting thepossibility that the multinational firm faces double taxation. We model double taxation suchthat the affiliate must hire τcti > 1 workers to provide one unit of assembly services. The nextsubsection discusses the motivation for and implications of assuming that the incidence ofdouble taxation falls on the affiliate while leaving the parent’s problem unchanged. Note that
20For simplicity, we assume that domestic and offshore labor inputs are perfect substitutes in performingassembly. Muendler and Becker (2010) find that in the German context they are substitutes, but imperfectones.
13
τcti may vary by affiliate country, year, and industry, capturing variation in the timing andpresence of BTTs with particular countries, and the fact that the incidence of double taxationis greater in industries with more reliance on royalties, interest, and dividend payments.
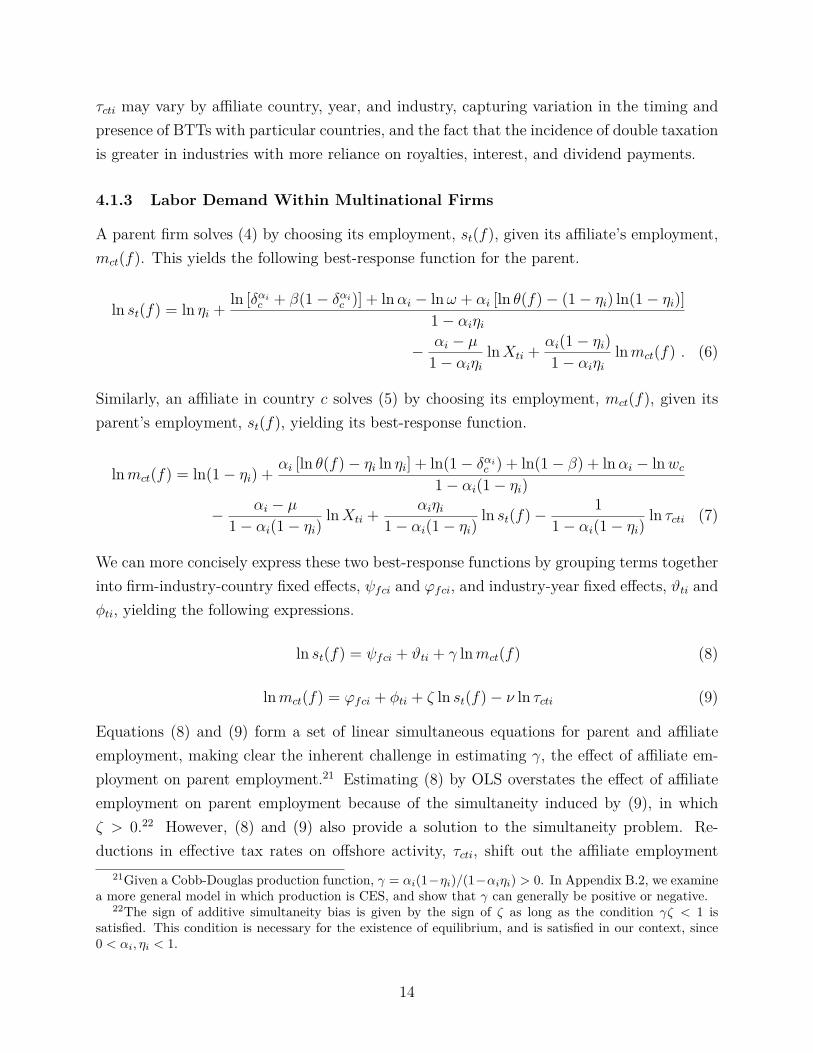
4.1.3 Labor Demand Within Multinational Firms
A parent firm solves (4) by choosing its employment, st(f), given its affiliate’s employment,mct(f). This yields the following best-response function for the parent.
ln st(f) = ln ηi + ln [δαic + β(1− δαic )] + lnαi − lnω + αi [ln θ(f)− (1− ηi) ln(1− ηi)]1− αiηi
− αi − µ1− αiηi
lnXti + αi(1− ηi)1− αiηi
lnmct(f) . (6)
Similarly, an affiliate in country c solves (5) by choosing its employment, mct(f), given itsparent’s employment, st(f), yielding its best-response function.
lnmct(f) = ln(1− ηi) + αi [ln θ(f)− ηi ln ηi] + ln(1− δαic ) + ln(1− β) + lnαi − lnwc1− αi(1− ηi)
− αi − µ1− αi(1− ηi)
lnXti + αiηi1− αi(1− ηi)
ln st(f)− 11− αi(1− ηi)
ln τcti (7)
We can more concisely express these two best-response functions by grouping terms togetherinto firm-industry-country fixed effects, ψfci and ϕfci, and industry-year fixed effects, ϑti andφti, yielding the following expressions.
ln st(f) = ψfci + ϑti + γ lnmct(f) (8)
lnmct(f) = ϕfci + φti + ζ ln st(f)− ν ln τcti (9)
Equations (8) and (9) form a set of linear simultaneous equations for parent and affiliateemployment, making clear the inherent challenge in estimating γ, the effect of affiliate em-ployment on parent employment.21 Estimating (8) by OLS overstates the effect of affiliateemployment on parent employment because of the simultaneity induced by (9), in whichζ > 0.22 However, (8) and (9) also provide a solution to the simultaneity problem. Re-ductions in effective tax rates on offshore activity, τcti, shift out the affiliate employment
21Given a Cobb-Douglas production function, γ = αi(1−ηi)/(1−αiηi) > 0. In Appendix B.2, we examinea more general model in which production is CES, and show that γ can generally be positive or negative.
22The sign of additive simultaneity bias is given by the sign of ζ as long as the condition γζ < 1 issatisfied. This condition is necessary for the existence of equilibrium, and is satisfied in our context, since0 < αi, ηi < 1.
14

profile in (9), while leaving the parent profile in (8) unchanged. Therefore, when analyzingthe effect of affiliate employment on multinational parent employment, we utilize a paneldifference-in-differences research design based upon (8) in which we instrument for affiliateemployment using BTTs.23
For this approach to succeed, τcti must be excluded from the parent’s best-responsefunction. In Appendix B.1 we explicitly model BTT-induced reductions in withholding taxrates in the context of the U.S. corporate tax system. There, we show that if multinationalparents insulate themselves from changes in double taxation by adjusting transfers betweenthemselves and their affiliates, then the implementation of a new BTT satisfies the exclusionrestriction. If instead new BTTs reduce the costs faced by both parents and affiliates, theIV estimates will not entirely resolve the simultaneity issue. In that case, some portion ofthe upward bias will remain, and our estimates will reflect an upper bound on the true effectof affiliate employment on domestic employment. As discussed below, our results are lessthan one third the magnitude of the most closely related estimates in the literature (Desaiet al., 2009). Therefore, in spite of the potential theoretical concern regarding exclusion, ourapproach appears to substantially ameliorate the simultaneity issue in practice.
4.1.4 Industry Labor Demand
Total industry employment in the home country includes hiring for headquarters services stacross all firms, along with domestic labor used in assembly, mt, either in-house or at arm’slength. Let Oti be the set of firms in industry i that choose to offshore assembly within anaffiliate in a foreign country during period t, while Ati is the set of firms that source assemblyservices from an arms-length provider in a foreign country. Likewise let Iti denote the setof non-multinational firms that hire local workers in the home country to assemble outputin-house, while Uti is the set of firms that source assembly from local arms-length providersin the home country. In total, domestic employment for industry i is given by
Lti ≡∫
f∈Oti⊂Fti
st(f)df +∫
f∈Ati⊂Fti
st(f)df
+∫
f∈Iti⊂Fti
[mct(f) + st(f)]df +∫
f∈Uti⊂Fti
[mct(f) + st(f)]df . (10)
Equation (10) shows that a decline in the effective cost of offshore activity resulting23An alternative approach to our empirical strategy is to exploit the variation in the changes in individual
tax rates across countries shown in Table 1. We prefer the binary treatment indicator as it is the mostconservative and transparent approach, but the results (available in Appendix A.4) are unaffected when wescale the BTT indicator according to country-specific changes in withholding tax rates.
15

from a BTT (dτcti < 0) may affect total industry employment, Lti, in a variety of ways.First, existing integrated multinational firms (Oti) will increase offshore employment withthe decline in its effective cost, and this change will affect headquarters employment basedon γ in (9). Based on the positive reduced-form results for continuing multinational firmsdiscussed in Section 3, this intensive margin effect is likely to increase domestic employment.Other firms will change organizational form to become new integrated multinationals. Ifthese firms had previously assembled goods domestically (Iti or Uti), this extensive marginshift will lower domestic employment (Boehm et al., 2017). We therefore expect to find morenegative (less positive) domestic employment effects of increased offshore activity amongfirms opening new affiliates in BTT countries than among firms maintaining continuingaffiliates. Finally, because the costs of production for integrated multinationals fall, otherfirms face stiffer competition in product markets and may contract as a result (Groizard et al.,2015). Given the various positive and negative components, the overall effect on industryemployment may be positive or negative. We therefore empirically examine both the overalleffect on industry employment along with separate effects for existing multinationals, forfirms opening new affiliates in BTT countries, and for non-multinationals, confirming theheterogeneity in effects just described.
4.2 Empirical Analysis
4.2.1 The Effect of BTTs on Foreign Affiliate Employment
Solving the system in (9) and (8) yields a first-stage estimating equation the effect of BTTson foreign affiliate employment:
lnmat = βABTTct + ΓXat + aa + bti + εat. (11)
Affiliates are defined by thier parent f , in country c, and industry i, which we consolidateone subscript a indicating an individual affiliate.24 The term mat is employment for affiliatea, BTTct is an indicator for the presence of a BTT between the U.S. and affiliate country cin year t, and Xat is a vector of controls. Affiliate and industry-year fixed effects are givenby aa and bti, respectively, and εat is an error term. We two-way cluster standard errorsby affiliate country and by year. The coefficient of interest is βA, reflecting the differencein employment growth for affiliates in the same industry, located in countries that do anddo not receive BTTs during our sample period. BTTs lower the effective cost of offshore
24The BEA survey allows firms the option of aggregating sibling affiliates in the same industry and countrywhen reporting, so we apply this aggregation to all firms for consistency.
16
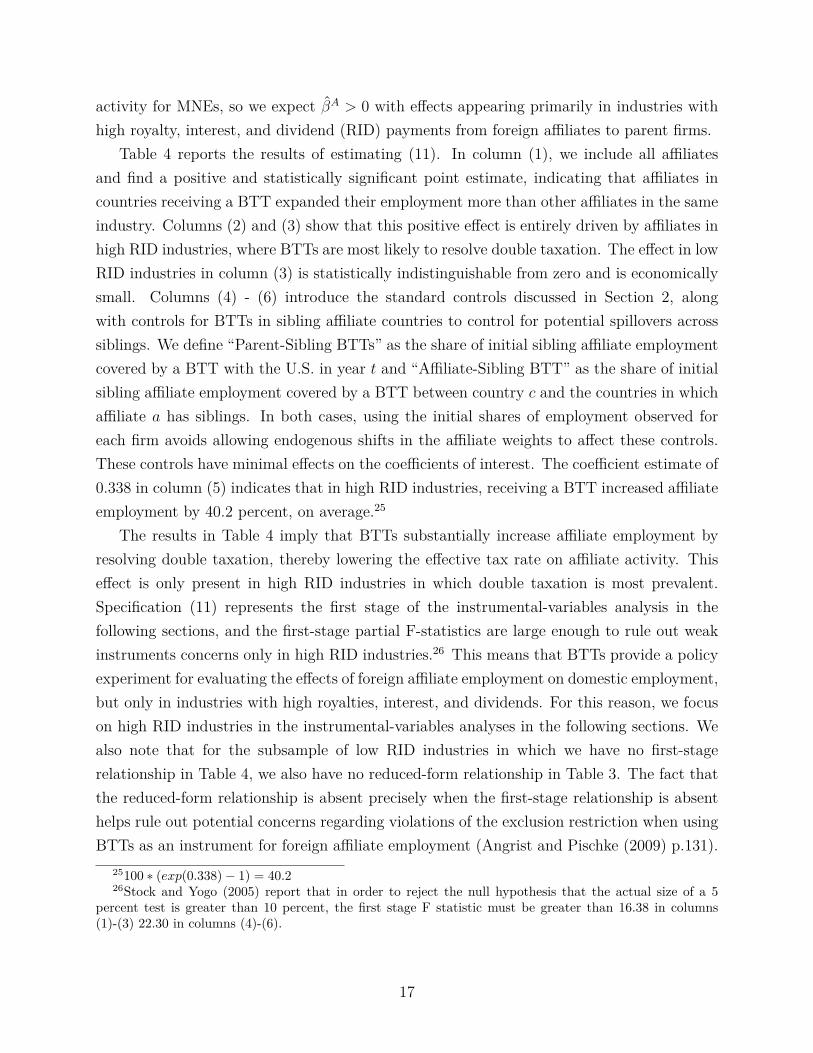
activity for MNEs, so we expect βA > 0 with effects appearing primarily in industries withhigh royalty, interest, and dividend (RID) payments from foreign affiliates to parent firms.
Table 4 reports the results of estimating (11). In column (1), we include all affiliatesand find a positive and statistically significant point estimate, indicating that affiliates incountries receiving a BTT expanded their employment more than other affiliates in the sameindustry. Columns (2) and (3) show that this positive effect is entirely driven by affiliates inhigh RID industries, where BTTs are most likely to resolve double taxation. The effect in lowRID industries in column (3) is statistically indistinguishable from zero and is economicallysmall. Columns (4) - (6) introduce the standard controls discussed in Section 2, alongwith controls for BTTs in sibling affiliate countries to control for potential spillovers acrosssiblings. We define “Parent-Sibling BTTs” as the share of initial sibling affiliate employmentcovered by a BTT with the U.S. in year t and “Affiliate-Sibling BTT” as the share of initialsibling affiliate employment covered by a BTT between country c and the countries in whichaffiliate a has siblings. In both cases, using the initial shares of employment observed foreach firm avoids allowing endogenous shifts in the affiliate weights to affect these controls.These controls have minimal effects on the coefficients of interest. The coefficient estimate of0.338 in column (5) indicates that in high RID industries, receiving a BTT increased affiliateemployment by 40.2 percent, on average.25
The results in Table 4 imply that BTTs substantially increase affiliate employment byresolving double taxation, thereby lowering the effective tax rate on affiliate activity. Thiseffect is only present in high RID industries in which double taxation is most prevalent.Specification (11) represents the first stage of the instrumental-variables analysis in thefollowing sections, and the first-stage partial F-statistics are large enough to rule out weakinstruments concerns only in high RID industries.26 This means that BTTs provide a policyexperiment for evaluating the effects of foreign affiliate employment on domestic employment,but only in industries with high royalties, interest, and dividends. For this reason, we focuson high RID industries in the instrumental-variables analyses in the following sections. Wealso note that for the subsample of low RID industries in which we have no first-stagerelationship in Table 4, we also have no reduced-form relationship in Table 3. The fact thatthe reduced-form relationship is absent precisely when the first-stage relationship is absenthelps rule out potential concerns regarding violations of the exclusion restriction when usingBTTs as an instrument for foreign affiliate employment (Angrist and Pischke (2009) p.131).
25100 ∗ (exp(0.338)− 1) = 40.226Stock and Yogo (2005) report that in order to reject the null hypothesis that the actual size of a 5
percent test is greater than 10 percent, the first stage F statistic must be greater than 16.38 in columns(1)-(3) 22.30 in columns (4)-(6).
17
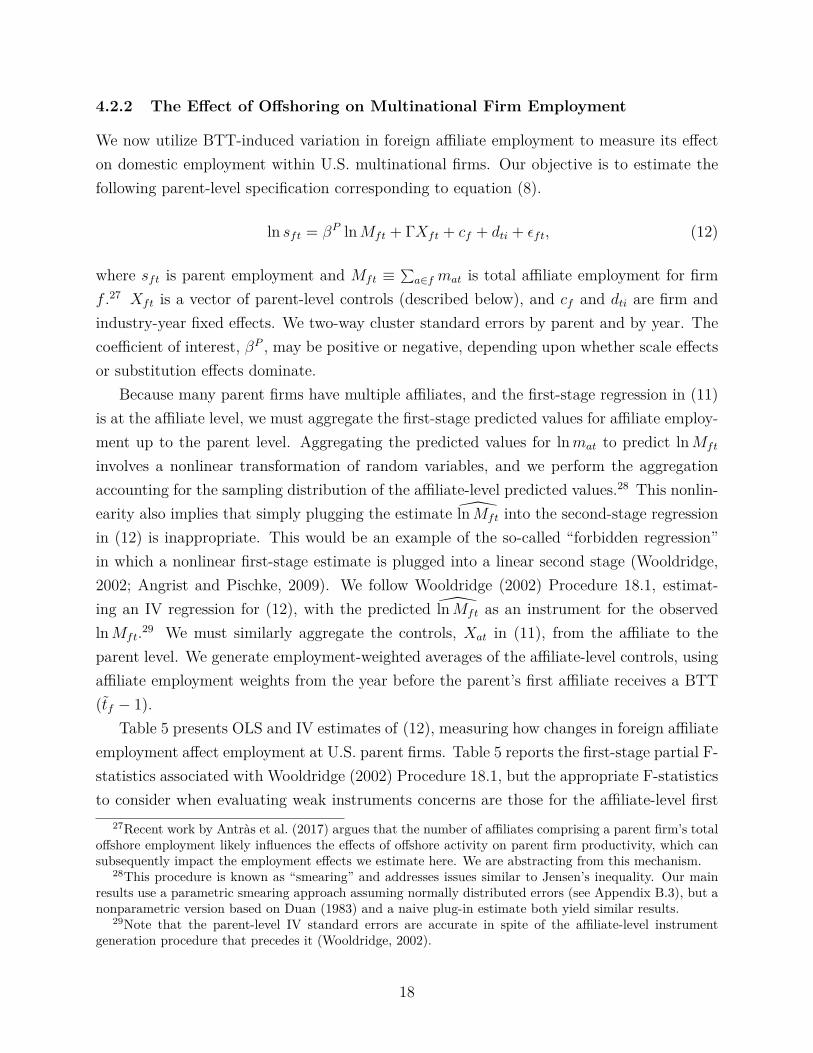
4.2.2 The Effect of Offshoring on Multinational Firm Employment
We now utilize BTT-induced variation in foreign affiliate employment to measure its effecton domestic employment within U.S. multinational firms. Our objective is to estimate thefollowing parent-level specification corresponding to equation (8).
ln sft = βP lnMft + ΓXft + cf + dti + εft, (12)
where sft is parent employment and Mft ≡∑a∈f mat is total affiliate employment for firm
f .27 Xft is a vector of parent-level controls (described below), and cf and dti are firm andindustry-year fixed effects. We two-way cluster standard errors by parent and by year. Thecoefficient of interest, βP , may be positive or negative, depending upon whether scale effectsor substitution effects dominate.
Because many parent firms have multiple affiliates, and the first-stage regression in (11)is at the affiliate level, we must aggregate the first-stage predicted values for affiliate employ-ment up to the parent level. Aggregating the predicted values for lnmat to predict lnMft
involves a nonlinear transformation of random variables, and we perform the aggregationaccounting for the sampling distribution of the affiliate-level predicted values.28 This nonlin-earity also implies that simply plugging the estimate lnMft into the second-stage regressionin (12) is inappropriate. This would be an example of the so-called “forbidden regression”in which a nonlinear first-stage estimate is plugged into a linear second stage (Wooldridge,2002; Angrist and Pischke, 2009). We follow Wooldridge (2002) Procedure 18.1, estimat-ing an IV regression for (12), with the predicted lnMft as an instrument for the observedlnMft.29 We must similarly aggregate the controls, Xat in (11), from the affiliate to theparent level. We generate employment-weighted averages of the affiliate-level controls, usingaffiliate employment weights from the year before the parent’s first affiliate receives a BTT(tf − 1).
Table 5 presents OLS and IV estimates of (12), measuring how changes in foreign affiliateemployment affect employment at U.S. parent firms. Table 5 reports the first-stage partial F-statistics associated with Wooldridge (2002) Procedure 18.1, but the appropriate F-statisticsto consider when evaluating weak instruments concerns are those for the affiliate-level first
27Recent work by Antras et al. (2017) argues that the number of affiliates comprising a parent firm’s totaloffshore employment likely influences the effects of offshore activity on parent firm productivity, which cansubsequently impact the employment effects we estimate here. We are abstracting from this mechanism.
28This procedure is known as “smearing” and addresses issues similar to Jensen’s inequality. Our mainresults use a parametric smearing approach assuming normally distributed errors (see Appendix B.3), but anonparametric version based on Duan (1983) and a naive plug-in estimate both yield similar results.
29Note that the parent-level IV standard errors are accurate in spite of the affiliate-level instrumentgeneration procedure that precedes it (Wooldridge, 2002).
18

stage in Table 4.30 Because we only have a strong first-stage relationship between BTTs andforeign affiliate employment within certain industries, we restrict our sample of parents inTable 5 to those in high RID industries.
Columns (1) and (2) of Table 5 implement naive OLS regressions of domestic parent em-ployment on total foreign affiliate employment. The very large positive correlation betweenparent and affiliate employment likely reflects upward simultaneity bias, as discussed in Sec-tion 4.1.3. The IV results in columns (3) and (4) confirm this point, finding much smallerpoint estimates and rejecting the equality of OLS and IV results at conventional levels. TheIV coefficient on lnMft in column (4) is positive and statistically significant, suggesting thata 10 percent increase in foreign affiliate employment drives a 1.3 percent increase in domes-tic employment at the U.S. parent firm. As shown in column (5) of Table 4, a new BTTincreases employment at affected affiliates in highly RID industries by approximately 40.2percent. Using the estimate from column (4) of Table 5, this corresponds to about a 5.2percent increase in domestic employment, or about 413 new U.S. workers for the averageparent firm. The coefficients of interest in columns (3) and (4) are quite similar, indicatingthat our results are robust to including or excluding the controls, Xft.
As mentioned in Section 4.1.3, our instrumental variables strategy requires that BTTsshift affiliates’ best response functions while leaving those of parents unchanged. If thisassumption is violated, then the IV results in Table 5 may retain some upward bias. Yet,even in that case, the estimates remain informative. First, the IV estimates in columns (3)and (4) are significantly smaller than the OLS estimates in columns (1) and (2), implyingthat our IV strategy is substantively addressing the simultaneity between parent and affiliateemployment. Second, the most closely related result in the prior literature is found in Desaiet al. (2009), which reports an effect that is 5 times larger than our estimates in column (4)of Table 5.31 Our estimates reflect an upper bound on the true effect of affiliate employmenton parent employment, yet they are significantly below the OLS estimates and imply a muchless positive effect than one would expect based upon prior work.
As discussed in Section 4.1.4, we expect the expansion of existing affiliates to increasedomestic employment because parent firms benefit from scale effects when the effective cost oftheir offshore activity falls with a BTT. However, extensive margin effects, in which firms shiftactivity from domestic to offshore locations, may decrease domestic employment within theU.S. parent firm. Although we cannot observe employment for newly formed multinationalfirms before they begin offshoring, we can examine effects for continuing multinationals thatopen or acquire new affiliates in BTT countries during our sample period. We expect the
30Large F-statistics are common when implementing Wooldridge (2002) Procedure 18.1.31See Table 5, column (4) in Desai et al. (2009).
19

domestic employment growth to be less positive for these firms exhibiting extensive marginoffshoring. This is precisely what we find in columns (5) and (6) of Table 5. When restrictingattention to multinationals opening new affiliates in BTT countries (column (5)), the effecton domestic employment is not statistically significant, while larger statistically significanteffects appear for multinationals that exhibit only intensive margin behavior (column (6)).
4.2.3 Industry Level Effects of Offshoring
We now address the employment effects of offshoring on overall industry employment inthe U.S. This broader analysis allows us to capture two margins that are absent whenexamining multinational firms alone. First, the changes in employment at multinationalparents may be partly offset by equilibrium employment adjustment at other domestic firmsin the industry. Second, declining costs of offshore activity will likely motivate some firms tobecome multinational firms by opening new affiliates. Both of these margins contribute toindustry-level employment responses. We measure U.S. industry employment using CountyBusiness Patterns data at the 3-digit SIC level and link to the BEA International SurveysIndustry (ISI) classification, resulting in 61 consistently identifiable high-RID industries.Even though we only consider industries with high royalty, interest, and dividend payments,these industries employ an average of about 111 million U.S. workers annually in our sample.
We study the relationship between log domestic employment and log total affiliate em-ployment at the industry level using the following specification.
lnLit = βI lnMit + ΓXit + fi + gt + εit, (13)
where Lit is total domestic employment in industry i in year t, Mit is total foreign affil-iate employment in the industry, and fi and gt are industry and year fixed effects. Wecalculate two-way clustered standard errors by industry and year. As with the parent-levelregressions, we aggregate from the affiliate level to the industry level, taking care to addressthe nonlinearity of the aggregation. We then instrument for observed log industry affiliateemployment lnMit, using predicted log industry affiliate employment lnMit. Because theincreases in employment within continuing multinational firms may be partly or entirelyoffset by reductions in employment at newly offshoring firms or competing domestic firms,the estimate of βI may be positive or negative.
Table 6 shows the relationship between U.S. employment and offshore affiliate employ-ment at the industry level. Columns (1) and (2) present the OLS results, and columns (3)and (4) show the instrumental variables results. As in the multinational parent-level analysis,the estimates are positive, implying that the various margins just discussed combine to yield
20
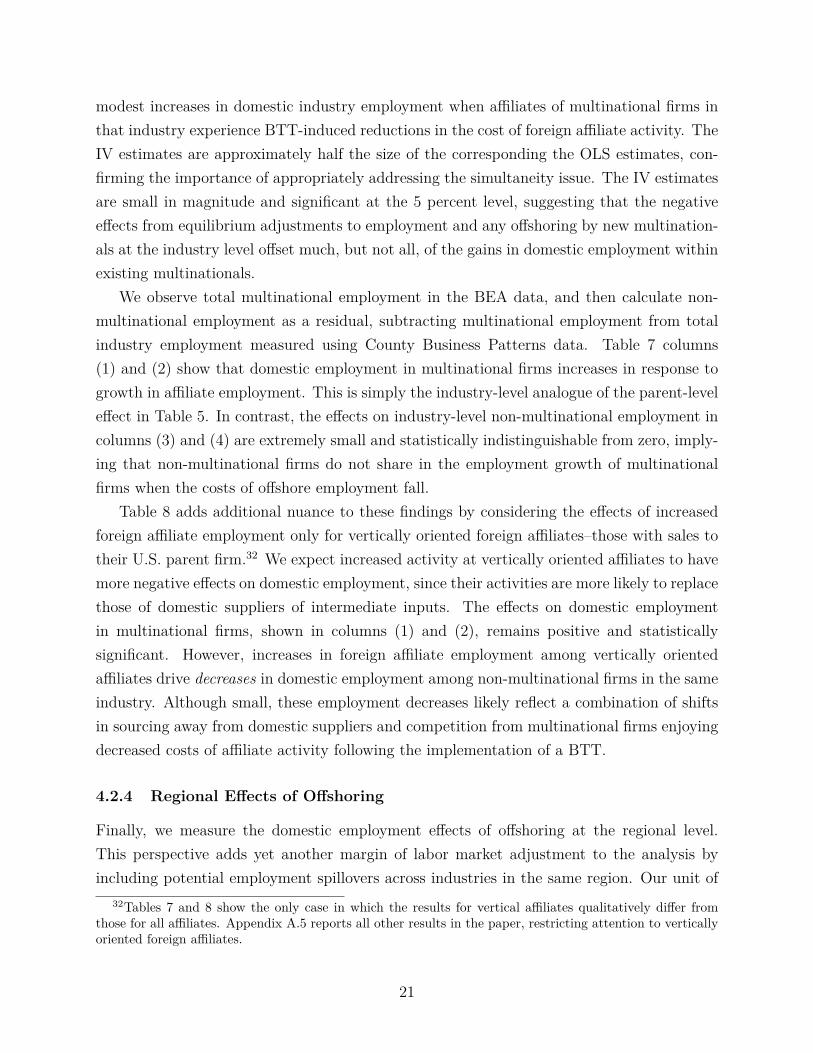
modest increases in domestic industry employment when affiliates of multinational firms inthat industry experience BTT-induced reductions in the cost of foreign affiliate activity. TheIV estimates are approximately half the size of the corresponding the OLS estimates, con-firming the importance of appropriately addressing the simultaneity issue. The IV estimatesare small in magnitude and significant at the 5 percent level, suggesting that the negativeeffects from equilibrium adjustments to employment and any offshoring by new multination-als at the industry level offset much, but not all, of the gains in domestic employment withinexisting multinationals.
We observe total multinational employment in the BEA data, and then calculate non-multinational employment as a residual, subtracting multinational employment from totalindustry employment measured using County Business Patterns data. Table 7 columns(1) and (2) show that domestic employment in multinational firms increases in response togrowth in affiliate employment. This is simply the industry-level analogue of the parent-leveleffect in Table 5. In contrast, the effects on industry-level non-multinational employment incolumns (3) and (4) are extremely small and statistically indistinguishable from zero, imply-ing that non-multinational firms do not share in the employment growth of multinationalfirms when the costs of offshore employment fall.
Table 8 adds additional nuance to these findings by considering the effects of increasedforeign affiliate employment only for vertically oriented foreign affiliates–those with sales totheir U.S. parent firm.32 We expect increased activity at vertically oriented affiliates to havemore negative effects on domestic employment, since their activities are more likely to replacethose of domestic suppliers of intermediate inputs. The effects on domestic employmentin multinational firms, shown in columns (1) and (2), remains positive and statisticallysignificant. However, increases in foreign affiliate employment among vertically orientedaffiliates drive decreases in domestic employment among non-multinational firms in the sameindustry. Although small, these employment decreases likely reflect a combination of shiftsin sourcing away from domestic suppliers and competition from multinational firms enjoyingdecreased costs of affiliate activity following the implementation of a BTT.
4.2.4 Regional Effects of Offshoring
Finally, we measure the domestic employment effects of offshoring at the regional level.This perspective adds yet another margin of labor market adjustment to the analysis byincluding potential employment spillovers across industries in the same region. Our unit of
32Tables 7 and 8 show the only case in which the results for vertical affiliates qualitatively differ fromthose for all affiliates. Appendix A.5 reports all other results in the paper, restricting attention to verticallyoriented foreign affiliates.
21

analysis is the metropolitan area, and we use 304 time-consistent metro areas, constructedfrom underlying county-level employment in the County Business Patterns data.33 Ourmetro-area estimation equation is
lnLmt = βM lnMmt + hm + kt + εmt, (14)
where Lmt is metro area m employment in year t, and hm and kt are metro area and yearfixed effects. Standard errors are two-way clustered by metro area and year. Our regionalmeasure of offshoring exposure, Mmt is a weighted average of industry-level foreign affiliateemployment. We construct industry-level foreign affiliate employment as described above,and the industry weights reflect the distribution of employment across covered industries in1986, just before the start of our main analysis sample: Mmt ≡
∑i σ
1986mi Mit where σ1986
mi ≡L1986mi /
∑i′ L
1986mi′ . This measure captures each metro area m’s exposure to foreign affiliate
employment, following a procedure similar to Topalova (2010), Autor et al. (2013), Kovak(2013), and others. We generate an instrument for lnMmt by constructing an otherwiseidentical measure that replaces observed industry affiliate employment, Mit, with predictedindustry affiliate employment, Mit, as in the industry-level analysis.
Table 9 shows the region-level results, with OLS estimates in columns (1) and (2) andIV estimates in columns (3) and (4). As with the aggregate industry-level results, therelationship between offshoring and employment is positive, and the IV estimates are smallerthan the OLS results. The estimate in column (4) implies that a metro area whose industriesexperience on average a 10 percent increase in affiliate employment exhibit a 0.17 percentincrease in metro area employment. While this is a modest positive effect, it is larger inmagnitude than the industry-level results in Table 6, suggesting the possibility of cross-industry spillovers between industries directly affected by offshoring and other industries inthe region that are indirectly affected by changes in local economic conditions.
5 Conclusion
The consequences of ever rising levels of offshoring activity by U.S. multinational firms areconsistently a source of debate for both the public and policy makers. However, amongother challenges, the fact that offshore hiring and domestic employment are determinedsimultaneously has made it difficult for economists to provide clear answers about the re-lationship between the two. We contribute to this discussion by providing estimates that
33In order to maintain confidentiality, in small counties the CBP data report employment ranges ratherthan precise employment counts. Appendix A.6 describes our approach to imputing these values and presentssimilar results treating suppressed values as zeros.
22
rely on relevant and exogenous variation in offshoring costs, allowing us to infer the causalimplications of greater offshore employment for U.S. labor market outcomes. We provideclear evidence that changes in the global tax structure influence the hiring activity of U.S.multinational firms both domestically and abroad, with spillover effects to regional U.S. em-ployment outcomes. These changes in hiring activity demonstrate how shifts in global taxstructure can alter the geographic distribution of economic activity both across and withinnational borders.
Our results also highlight important nuances in the effects of various international eco-nomic activities, demonstrating that the effects of offshoring differ across firms’ organiza-tional structures and across different margins of offshoring activities. Within existing multi-nationals, a fall in the cost of offshoring has a net positive effect on U.S. hiring. However,when the costs of offshore activity fall, some firms may alter their global sourcing strategiesand begin to substitute offshore facilities for activities that had previously been completed lo-cally. This substitution can adversely affect employment outcomes for U.S. workers. Amongmultinational firms that open new affiliates in countries that realize lower offshoring costs,we find that domestic employment responds only modestly to BTTs, suggesting that positivescale effects are largely offset by negative substitution effects in these firms.
23

ReferencesJoshua D. Angrist and Jorn-Steffen Pischke. Mostly Harmless Econometrics: An Empiricist’s
Companion. Princeton University Press, Princeton, NJ, 2009.
Pol Antras and Elhanan Helpman. Global sourcing. Journal of Political Economy, 112(3):552–580, 2004.
Pol Antras, Teresa Fort, and Felix Tintelnot. The margins of global sourcing: Theory andevidence from u.s. firms. American Economic Review, 107(9):2514–2564, 2017.
David Autor, David Dorn, and Gordon Hanson. The china syndrome: Local labor marketeffects of import competition in the united states. American Economic Review, 103(6):2121–2168, 2013.
Robert J. Barro and Jong-Wha Lee. A new data set of educational attainment in the world,1950-2010. NBER working paper 15902, 2010.
Marianne Bertrand, Esther Duflo, and Sendhil Mullainathan. How much should we trustdifferences-in-differences estimates? The Quarterly Journal of Economics, pages 249–275,2004.
Bruce A. Blonigen and Ronald B. Davies. The effects of bilateral tax treaties on u.s. fdiactivity. International Tax and Public Finance, 11:601–622, 2004.
Bruce A. Blonigen and Ronald B. Davies. Do bilateral tax treaties promote foreign di-rect investment. In James Hartigan, editor, Handbook of International Trade Volume II:Economic and Legal Analysis of Laws and Institutions. Blackwell Publishing Ltd, 2005.
Bruce A. Blonigen, Lindsay Oldenski, and Nicholas Sly. The differential effects of bilateraltax treaties. American Economic Journal: Economic Policy, 6(2):1–18, 2014. NBERworking paper 17480.
Christoph E. Boehm, Aaron Flaaen, and Nitya Pandalai-Nayar. Multinationals, offshoringand the decline of u.s. manufacturing. mimeo, 2017.
S Lael Brainard and David A Riker. Are us multinationals exporting us jobs? Technicalreport, National Bureau of Economic Research, 1997.
David L. Carr, James R. Markusen, and Keith E. Maskus. Testing the knowledge-capitalmodel of the multinational enterprise. The American Economic Review, 91(3):995–1001,2001.
Ronald B. Davies. Tax treaties and foreign direct investment: potential versus performance.International Tax and Public Finance, 11:775–802, 2004.
Ronald B. Davies, Pehr-Johan Norback, and Ayca Tekin-Koru. The effect of tax treaties onmultinational firms: new evidence from micro-data. The World Economy, 32(1):77–110,2009.
24

Fabrice Defever and Farid Toubal. Productivity, relationship-specific inputs and the sourcingmodes on multinationals. Journal of Economic Behavior and Organization, 94:345–57,2013.
Mihir A. Desai, C. Fritz Foley, and James R. Hines. Repatriation taxes and dividend distor-tions. National Tax Journal, 54(4):829–851, 2001.
Mihir A Desai, C Fritz Foley, and James R Hines. Domestic effects of the foreign activitiesof us multinationals. American Economic Journal: Economic Policy, 1(1):181–203, 2009.
Julian di Giovanni. What drives capital flows? the case of cross-border m&a activity andfinancial deepening. Journal of International Economics, 65(1):127–149, 2005.
Richard L. Doernberg. International Taxation in a Nutshell. West Academic Publishing,10th edition edition, 2016.
Naihua Duan. Smearing estimate: A nonparametric retransformation method. Journal ofthe American Statistical Association, 78(383):605–610, 1983.
Peter Egger, Mario Larch, Michael Pfaffermayr, and Hannes Winner. The impact of endoge-nous tax treaties on foreign direct investment: Theory and empirical evidence. CanadianJournal of Economics, 39(3):901–931, 2006.
Ernst and Young. International tax alert: News from transfer pricing. 2015.
Robert C Feenstra and Gordon H Hanson. Ownership and control in outsourcing to china:Estimating the property-rights theory of the firm. Quarterly Journal of Economics, (2):729–761, 2005.
Jose L. Groizard, Priya Ranjan, and Antonio Rodriguez-Lopez. Trade costs and job flows:evidence from establishment-level data. Economic Inquiry, 53(1):173–204, 2015.
Ann Harrison and Margaret McMillan. Offshoring jobs? multinationals and us manufactur-ing employment. Review of Economics and Statistics, 93(3):857–875, 2011.
David Hummels, Rasmus Jørgensen, Jakob Munch, and Chong Xiang. The wage effects ofoffshoring: Evidence from danish matched worker-firm data. The American EconomicReview, 104(6):1597–1629, 2014.
Louis S Jacobson, Robert John LaLonde, and Daniel Gerard Sullivan. Earnings losses ofdisplaced workers. The American Economic Review, 83:685–709, 1993.
Brian Kovak. Regional efects of trade reform: What is the correct measure of liberalization?American Economic Review, 103(5):1960–1976, 2013.
Henry J. Louie and Donald J. Rousslang. Host-country governance, tax treaties and us directinvestment abroad. International Tax and Public Finance, 15(3):256–273, 2008.
Jr. Misey, Robert J. and Michael S. Schadewald. Practical Guide to U.S. Taxation of Inter-national Transactions. Wolters Kluwer, 10th edition edition, 2015.
25

Ryan Monarch, Jooyoun Park, and Jagadeesh Sivadasan. Gains from offshoring? evidencefrom u.s. microdata. University of Michigan, 2014.
Marc-Andreas Muendler and Sascha O. Becker. Margins of multinational labor substitution.The American Economic Review, 100(5):1999–2030, 2010.
Gianmarco I.P. Ottaviano, Giovanni Peri, and Greg C. Wright. Immigration, offshoring andamerican jobs. American Economic Review, 103(5), 2013.
Matthew J. Slaughter. Production transfer within multinational enterprises and americanwages. Journal of International Economics, 50(2), 2000.
Matthew J. Slaughter. International trade and labor-demand elasticities. Journal of Inter-national Economics, 54(1):27–56, 2001.
Matthew J. Slaughter. How u.s. multinational companies strengthen the u.s. economy. Tech-nical report, Business Roundtable and Business Roundtable and The United States Coun-cil Foundation, 2009.
James H Stock and Motohiro Yogo. Testing for weak instruments in linear iv regression.In Donald W. K. Andrews and James H. Stock, editors, Identification and Inference forEconometric Models: Essays in Honor of Thomas Rothenberg, pages 80–108. CambridgeUniversity Press, 2005.
Juan Carlos Suarez Serrato. Unintended consequences of eliminating tax havens. mimeo,2018.
Petia Topalova. Factor immobility and regional impacts of trade liberalization: Evidence onpoverty from india. American Economic Journal: Applied Economics, 2(4), 2010.
Jeffrey M. Wooldridge. Econometric Analysis of Cross Section and Panel Data. MIT Press,Cambridge, MA, 2002.
26

Figure 1: Effect of BTTs on U.S. Multinational Firm Employmentin High Royalty, Interest and Dividend Industries
-0.06
-0.04
-0.02
0.00
0.02
0.04
0.06
0.08
0.10
0.12
0.14
-6 -5 -4 -3 -2 -1 0 1 2 3 4 5 6
Coef
ficie
nt E
stim
ate:
Eff
ect o
f Firs
t BTT
on
Pare
nt E
mpl
oym
ent
Years Since BTT Effective Date
event-study estimates
diff-in-diff estimate
Source: Authors’ calculations based on BEA Annual Surveys of U.S. Direct Investment Abroad 1987-2007. Sample restricted tofirms in industries with high RID payments to U.S. parent firms. Each point on the black line represents a coefficient estimatefrom the event study specification in (2). Dashed lines reflect 95 percent confidence intervals for these event-study estimateswhen clustering standard errors by both parent firm and year. Gray lines reflects the diff-in-diff estimate described in (1),located so the lower line corresponds to the average of pre-BTT event study coefficients. Both specifications include firm andindustry × time fixed effects and a full set of controls, as in column (5) of Table 3.
27

Tabl
e1:
Cou
ntrie
sw
ithN
ewTr
eatie
sin
Effec
tD
urin
gSa
mpl
ePe
riod
(198
7-20
07)
Trea
tyYe
arB
TT
Pre-
Trea
tyR
ates
Post
-Tre
aty
Rat
esPa
rtne
rEn
tere
din
toFo
rce
Div
iden
dsIn
tere
stR
oyal
ties
Div
iden
dsIn
tere
stR
oyal
ties
Indi
a19
9025
2530
1515
20In
done
sia19
9020
2020
150,
1510
,15
Spai
n19
9025
2525
10,1
510
5-10
Tuni
siaa
1990
--
--
--
Mex
ico
1993
015
-35
15-3
55-
1510
,15
10R
ussia
1993
1515
205,
100
0Is
rael
1994
2525
2512
.5-2
510
,17.
510
,15
Port
ugal
1995
25,3
020
1515
1010
Tha
iland
1997
1015
1510
10,1
55,
8,15
Turk
ey19
9720
,22
13.2
2215
,20
155,
10Es
toni
a19
9926
2615
0,5,
1510
5,10
Latv
ia19
9910
0,5,
105,
1510
0,5,
102,
5,10
Lith
uani
a19
9929
24-2
924
-29
1510
10Ve
nezu
elab
1999
--
-5,
150,
4.95
,10
0,5,
10U
krai
ne20
0015
0,15
05,
150
10Sl
oven
iaa
2001
25-
-5,
155
5Sr
iLan
ka20
0410
1515
1510
5,10
Ban
glad
esha
2007
--
--
--
Sour
ces:
Yea
rB
TT
ente
red
into
forc
ede
term
ined
from
tax
trea
tyte
xt,a
vaila
ble
from
IRS
Uni
ted
Stat
esIn
com
eTa
xTr
eatie
s-
Ato
Z.N
ote
that
Rus
sia
had
been
cove
red
bya
pre-
exis
ting
tax
trea
tybe
twee
nth
eU
.S.a
ndU
.S.S
.R.,
but
this
trea
tydi
dno
tin
clud
est
anda
rdm
easu
res
tore
duce
doub
leta
xati
on,s
ow
eco
unt
the
1993
trea
tyw
ith
Rus
sia
asa
new
trea
ty.
Tax
rate
sfro
mP
rice
Wat
erho
use
Coo
pers
(Pw
C)p
ublic
atio
ns,C
orpo
rate
Taxe
s:A
Wor
ldw
ide
Sum
mar
y,ac
ross
vari
ousy
ears
.W
hen
mul
tipl
era
tesa
pply
indi
ffere
ntci
rcum
stan
ces,
each
rate
ora
rang
eis
repo
rted
.P
re-a
ndpo
st-t
reat
yda
taar
efr
ompu
blic
atio
nsin
the
follo
win
gye
ars
for
each
coun
try:
Indi
a(1
990,
1991
),In
done
sia
(199
0,19
91),
Spai
n(1
990,
1991
),M
exic
o(1
993,
1994
),R
ussi
a(1
993,
1994
),Is
rael
(199
5,19
95),
Por
tuga
l(19
95,1
996)
,Tha
iland
(199
7,19
99-2
000)
,Tur
key
(199
9-20
00,1
999-
2000
),E
ston
ia(1
997,
2001
-200
2),L
atvi
a(1
999-
2000
,200
3-20
04),
Lith
uani
a(1
999-
2000
,200
1-20
02),
Ven
ezue
la(1
999-
2000
,200
4),U
krai
ne(1
999-
2000
,200
1-20
02),
Slov
enia
(200
0-20
01,2
004)
,Sri
Lank
a(2
004,
2005
).N
ote
that
Isra
elre
port
s19
95no
n-tr
eaty
rate
for
the
pre-
trea
type
riod
(doe
sn’t
appe
arin
prio
ris
sues
),an
dTu
rkey
repo
rts
1991
-200
0no
n-tr
eaty
rate
for
the
pre-
trea
type
riod
.a
Tuni
sia
and
Ban
glad
esh
are
omit
ted
from
the
Pw
Cpu
blic
atio
ns,a
sar
eSl
oven
ia’s
pre-
trea
tyw
ithh
oldi
ngta
xra
tes
for
inte
rest
and
roya
ltie
s.b
Ven
ezue
la’s
pre-
trea
tyw
ithh
oldi
ngta
xst
ruct
ure
isto
oco
mpl
exto
repo
rtw
ith
asi
mpl
ese
tof
rate
s.
28

Table 2: Summary Statistics.
Mean Std. Dev. Min MaxFOREIGN AFFILIATES (342,239 obs.)Employment 474.30 2394.8 (confidential)ln(Employment) 4.3788 1.9213 (confidential)Av. Annual Emp Growth (%) 0.0909 0.7876 (confidential)BTT 0.8099 0.3924 0 1High RID Indicator 0.5763 0.4941 0 1ln(GDPus +GDPd) 9.3112 0.2040 8.8665 10.093ln(GDPus −GDPd)2 18.184 0.4946 14.841 18.933ln(Skill Difference) 1.0984 0.7194 0 2.494ln(Trade Cost) 2.6727 2.3737 0 4.5940BIT 0.0516 0.2212 0 1FTA 0.1216 0.3269 0 1Exchange Rate 140.50 819.37 0 16105Parent-Sibling BTTsa 0.5645 0.2053 0 1Affiliate-Sibling BTTsb 0.2944 0.3888 0 1
U.S. PARENT FIRMS (43,233 obs.)Foreign Affiliate Employment 3513.2 16010 (confidential)ln(Aff Emp) 5.6966 2.3485 (confidential)Av Annual Aff Emp Growth (%) 0.1090 0.7911 (confidential)Parent Firm Employment 7906.7 28649 (confidential)ln(Parent Emp) 7.2009 2.0656 (confidential)Number of Affiliates 8.6924 18.445 (confidential)ln(GDPus +GDPd)c 4.5246 3.610 0 29.618ln(GDPus −GDPd)2 c 8.8243 7.0513 0 58.087ln(Skill Difference)c 0.4759 0.5094 0 4.240ln(Trade Cost)c 1.4748 1.6564 0 10.940BITc 0.0178 0.0717 0 1FTAc 0.1538 0.3261 0 1Exchange Ratec 21.485 217.81 0 23573
Authors’ calculations from BEA Annual Surveys of U.S. Direct Investment Abroad 1987-2007 and various other data sources,described in Section 2. aWeighted average share of total sibling employment covered by a BTT with the U.S., using fixedaffiliate employment shares. bWeighted average share of total sibling employment covered by a BTT with the affiliate’s country,using fixed affiliate employment shares. cParent-level versions of affiliate country controls are aggregated from the country tothe parent firm level using a weighted average, using fixed affiliate employment shares as weights.
29

Table 3: Reduced Form Difference-in-Differences Analysis:The Effect of BTTs on Parent Employment
Dependent variable: log parent employment: ln(sft)(1) (2) (3) (4) (5) (6)
Sample: All High RID Low RID All High RID Low RIDBTT
[ϕf1(t ≥ tf )
]0.027 0.055*** -0.009 0.012 0.064*** -0.027
(0.007) (0.014) (0.013) (0.090) (0.023) (0.018)ln(GDPus +GDPd) 0.025 -0.076 0.196
(0.123) (0.147) (0.189)ln(GDPus −GDPd)2 -0.054 -0.006 -0.135
(0.061) (0.072) (0.094)ln(Skill Difference) -0.077 -0.084 -0.066
(0.050) (0.059) (0.095)ln(Trade Costs) 0.003 0.012 0.003
(0.015) (0.017) (0.030)BIT -0.287 -0.242 -0.259
(0.177) (0.244) (0.23)FTA -0.008 -0.08 0.02
(0.062) (0.088) (0.079)Exchange Rate -0.0001 -0.0001 0.0001
(0.000) (0.000) (0.000)Parent FE YES YES YES YES YES YESIndustry-Year FE YES YES YES YES YES YESN 43233 29765 13468 43233 29765 13468R-sq 0.0021 0.0033 0.0002 0.0573 0.0644 0.0431
Notes: Documents the effects of newly signed bilateral tax treaties (BTTs) on parent employment at multinational firms. “HighRID” and “Low RID” refer to firms within industries that exhibit ratios of total payments in royalties, interest, and dividendsrelative to total industry sales that are above and below the median sector (see Appendix A.2 for details). Sample covers1987-2007. Standard errors clustered by both parent firm and year are in parentheses. *,**, and *** indicate significance atthe 10, 5, and 1 percent levels, respectively.
30

Table 4: Foreign Affiliate-Level Analysis:The Effect of BTTs on Offshore Employment
Dependent variable: log affiliate employment: ln(mat)(1) (2) (3) (4) (5) (6)
Sample: All High RID Low RID All High RID Low RIDBTT 0.232*** 0.461*** -0.022 0.132* 0.338*** -0.089
(0.066) (0.077) (0.086) (0.072) (0.083) (0.088)ln(GDPus +GDPd) 7.062** 6.658* 7.331***
(3.129) (3.451) (2.800)ln(GDPus −GDPd)2 0.480* 0.512* 0.416*
(0.264) (0.286) (0.244)ln(Skill Difference) -0.185* -0.173* -0.195**
(0.095) (0.102) (0.087)ln(Trade Costs) 0.031 0.029 0.033
(0.034) (0.036) (0.032)BIT -0.548** -0.528* -0.566**
(0.258) (0.279) (0.240)FTA 0.016 0.075 -0.05
(0.105) (0.099) (0.112)Exchange Rate -0.00002 -0.00003 -0.00001
(0.000) (0.000) (0.000)Parent-Sibling BTTs -0.044* -0.046** -0.044
(0.026) (0.021) (0.033)Affiliate-Sibling BTTs 0.133* 0.173** 0.083
(0.075) (0.081) (0.090)Affiliate FE YES YES YES YES YES YESIndustry-Year FE YES YES YES YES YES YESN 342239 197116 145123 342239 197116 145123R-sq 0.0014 0.0047 0.0001 0.0131 0.015 0.0145F-Statistic 12.47 35.58 0.06 7.31 24.31 4.12
Notes: Documents the effect of newly-signed Bilateral Tax Treaties (BTTs) on foreign affiliate employment. “High RID” and“Low RID” refer to firms within industries that exhibit ratios of total payments in royalties, interest, and dividends relativeto total industry sales that are above and below the median sector (see Appendix A.2 for details). Sample covers 1987-2007.Standard errors clustered by both affiliate country and year are in parentheses. *,**, and *** indicate significance at the 10,5, and 1 percent levels, respectively.
31

Table 5: U.S. Parent-Level Analysis:The Effect of Offshore Employment on Domestic MNE Employment
Dependent variable: log parent employment: ln(sft)(1) (2) (3) (4) (5) (6)
Specification: OLS OLS IV IV IV IVSample: All All All All New Aff Cont Afflog affiliate employment: 0.289*** 0.263*** 0.174*** 0.130*** 0.103 0.139***
(lnMit) (0.017) (0.017) (0.017) (0.015) (0.116) (0.016)ln(GDPus +GDPd) -0.039 0.006 -0.331 -0.004
(0.126) (0.092) (0.366) (0.088)ln(GDPus −GDPd)2 -0.006 -0.007 0.148 -0.001
(0.064) (0.047) (0.189) ( 0.045)ln(Skill Difference) -0.167*** -0.097** 0.093 -0.118**
(0.057) (0.044) (0.106) (0.047)ln(Trade Costs) 0.005 -0.017 0.017 -0.02
(0.018) (0.013) (0.035) (0.014)BIT -0.473* -0.432** -0.335 -0.460**
(0.25) (0.167) (0.208) (0.201)FTA -0.016 -0.004 0.083 -0.009
(0.082) (0.048) (0.125) (0.053)Exchange Rate -0.000 -0.000 0.000 -0.000
(0.000) (0.000) (0.000) (0.000)Parent FE YES YES YES YES YES YESYear FE YES YES YES YES YES YESN 29765 29765 29765 29765 6077 23688R-sq 0.1865 0.2189 0.1406 0.1581 0.3536 0.1663First Stage F-Stat - - 508.14 413.36 117.5 402.53Endog Test P-Val - - 0.0017 0.0019 0.0022 0.0015
Notes: Documents the effects of BTT-induced changes in foreign-affiliate employment on domestic employment of multinationalfirms in industries that exhibit high ratios of royalty, interest, and dividend payments relative to total industry sales. Columns(5) and (6) respectively restrict the sample to parent firms that did and did not open new affiliates in countries newly receivinga BTT. First-stage F-statistics are large for all IV specifications, though the relevant F-statistics for weak-instrument concernsappear in columns (2) and (5) of Table 4 (see text for discussion). In all IV specifications, the equality of OLS and IV isrejected. Sample covers 1987-2007. Standard errors clustered by parent firm and year are in parentheses. *,**, and *** indicatesignificance at the 10, 5, and 1 percent levels, respectively.
32
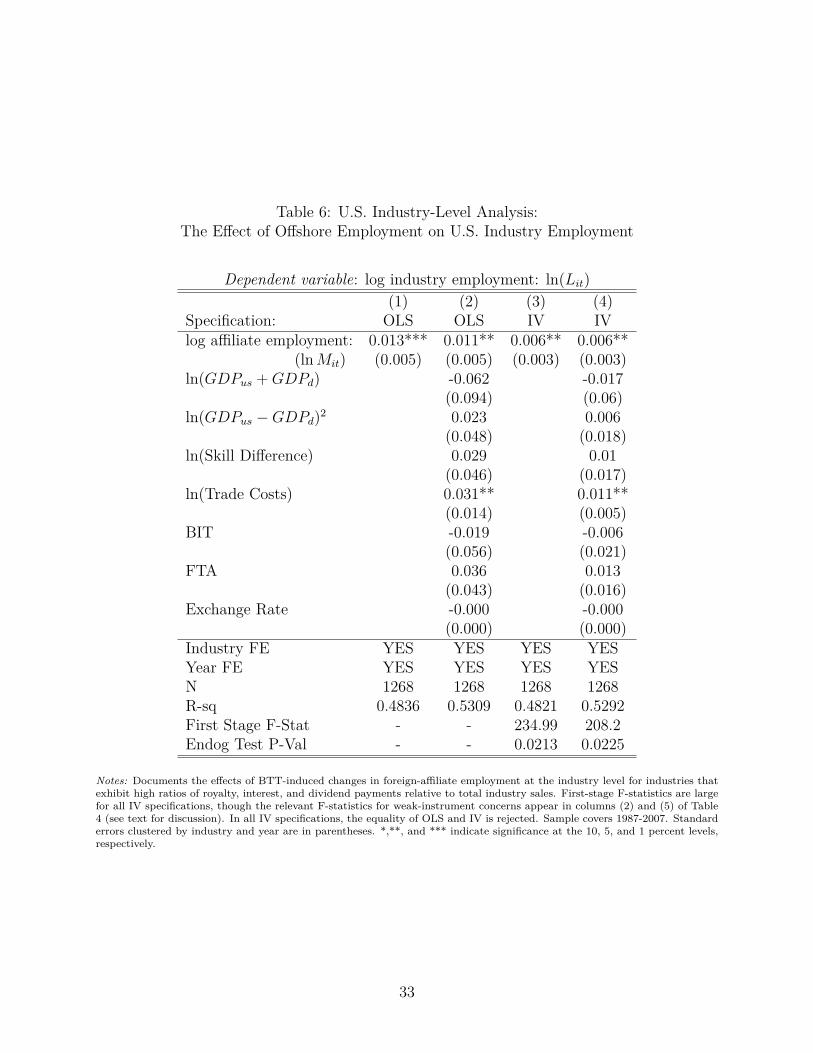
Table 6: U.S. Industry-Level Analysis:The Effect of Offshore Employment on U.S. Industry Employment
Dependent variable: log industry employment: ln(Lit)(1) (2) (3) (4)
Specification: OLS OLS IV IVlog affiliate employment: 0.013*** 0.011** 0.006** 0.006**
(lnMit) (0.005) (0.005) (0.003) (0.003)ln(GDPus +GDPd) -0.062 -0.017
(0.094) (0.06)ln(GDPus −GDPd)2 0.023 0.006
(0.048) (0.018)ln(Skill Difference) 0.029 0.01
(0.046) (0.017)ln(Trade Costs) 0.031** 0.011**
(0.014) (0.005)BIT -0.019 -0.006
(0.056) (0.021)FTA 0.036 0.013
(0.043) (0.016)Exchange Rate -0.000 -0.000
(0.000) (0.000)Industry FE YES YES YES YESYear FE YES YES YES YESN 1268 1268 1268 1268R-sq 0.4836 0.5309 0.4821 0.5292First Stage F-Stat - - 234.99 208.2Endog Test P-Val - - 0.0213 0.0225
Notes: Documents the effects of BTT-induced changes in foreign-affiliate employment at the industry level for industries thatexhibit high ratios of royalty, interest, and dividend payments relative to total industry sales. First-stage F-statistics are largefor all IV specifications, though the relevant F-statistics for weak-instrument concerns appear in columns (2) and (5) of Table4 (see text for discussion). In all IV specifications, the equality of OLS and IV is rejected. Sample covers 1987-2007. Standarderrors clustered by industry and year are in parentheses. *,**, and *** indicate significance at the 10, 5, and 1 percent levels,respectively.
33

Table 7: U.S. Industry Level Analysis:The Effect of Offshore Employment on U.S. MNE vs. non-MNE Employment
Dependent variable: log industry employment: ln(Lit)(1) (2) (3) (4)
Specification: IV IV IV IVSample: MNE MNE non-MNE non-MNEindustry log affiliate employment: 0.042*** 0.043*** 0.0009 -0.001
(lnMit) (0.005) (0.005) (0.004) (0.005)ln(GDPus +GDPd) 0.097 -0.036
(0.093) (0.046)ln(GDPus −GDPd)2 -0.048 0.015
(0.048) (0.024)ln(Skill Difference) -0.06 0.015
(0.037) (0.022)ln(Trade Costs) -0.006 0.011
(0.007) (0.009)BIT 0.047 -0.009
(0.066) (0.026)FTA 0.06 0.015
(0.036) (0.016)Exchange Rate -0.00002 -0.00001
(0.000) (0.000)Industry FE YES YES YES YESYear FE YES YES YES YESN 1268 1268 1268 1268R-sq 0.2678 0.3086 0.4244 0.4702First Stage F-Stat 276.32 205.84 214.75 189.12Endog Test P-Val 0.0089 0.0052 0.0198 0.0187
Notes: Documents the effects of BTT-induced changes in foreign-affiliate employment at the industry level for industries thatexhibit high ratios of royalty, interest, and dividend payments relative to total industry sales. Columns (1) and (2) examineemployment for multinational parents in the U.S. industry while columns (3) and (4) examine all other employment in eachindustry. First-stage F-statistics are large for all IV specifications, though the relevant F-statistics for weak-instrument concernsappear in columns (2) and (5) of Table 4 (see text for discussion). In all IV specifications, the equality of OLS and IV is rejected.Sample covers 1987-2007. Standard errors clustered by industry and year are in parentheses. *,**, and *** indicate significanceat the 10, 5, and 1 percent levels, respectively.
34
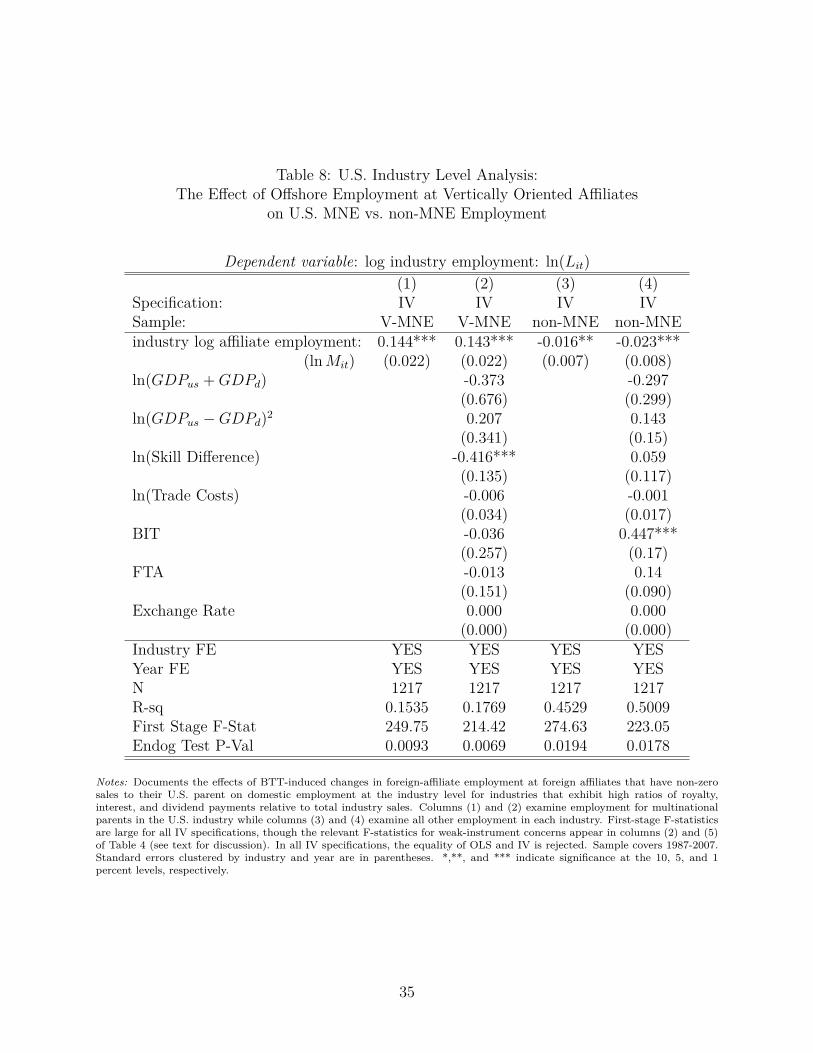
Table 8: U.S. Industry Level Analysis:The Effect of Offshore Employment at Vertically Oriented Affiliates
on U.S. MNE vs. non-MNE Employment
Dependent variable: log industry employment: ln(Lit)(1) (2) (3) (4)
Specification: IV IV IV IVSample: V-MNE V-MNE non-MNE non-MNEindustry log affiliate employment: 0.144*** 0.143*** -0.016** -0.023***
(lnMit) (0.022) (0.022) (0.007) (0.008)ln(GDPus +GDPd) -0.373 -0.297
(0.676) (0.299)ln(GDPus −GDPd)2 0.207 0.143
(0.341) (0.15)ln(Skill Difference) -0.416*** 0.059
(0.135) (0.117)ln(Trade Costs) -0.006 -0.001
(0.034) (0.017)BIT -0.036 0.447***
(0.257) (0.17)FTA -0.013 0.14
(0.151) (0.090)Exchange Rate 0.000 0.000
(0.000) (0.000)Industry FE YES YES YES YESYear FE YES YES YES YESN 1217 1217 1217 1217R-sq 0.1535 0.1769 0.4529 0.5009First Stage F-Stat 249.75 214.42 274.63 223.05Endog Test P-Val 0.0093 0.0069 0.0194 0.0178
Notes: Documents the effects of BTT-induced changes in foreign-affiliate employment at foreign affiliates that have non-zerosales to their U.S. parent on domestic employment at the industry level for industries that exhibit high ratios of royalty,interest, and dividend payments relative to total industry sales. Columns (1) and (2) examine employment for multinationalparents in the U.S. industry while columns (3) and (4) examine all other employment in each industry. First-stage F-statisticsare large for all IV specifications, though the relevant F-statistics for weak-instrument concerns appear in columns (2) and (5)of Table 4 (see text for discussion). In all IV specifications, the equality of OLS and IV is rejected. Sample covers 1987-2007.Standard errors clustered by industry and year are in parentheses. *,**, and *** indicate significance at the 10, 5, and 1percent levels, respectively.
35

Table 9: U.S. Metro Area Level Analysis:The Effect of Offshore Employment on U.S. Regional Employment
Dependent variable: log regional employment: ln(Lmt)(1) (2) (3) (4)
Specification: OLS OLS IV IVregional log affiliate employment: 0.035*** 0.033*** 0.018*** 0.017***
(lnMmt) (0.008) (0.008) (0.004) (0.004)ln(GDPus +GDPd) -0.756** -0.326**
(0.343) (0.152)ln(GDPus −GDPd)2 0.365** 0.158**
(0.173) (0.077)ln(Skill Difference) 0.209 0.094
(0.129) (0.057)ln(Trade Costs) 0.058 0.022
(0.060) (0.026)BIT 0.077 0.030
(0.289) (0.127)FTA 0.010 0.003
(0.091) (0.040)Exchange Rate -0.0009 -0.0004
(0.001) (0.000)Industry FE YES YES YES YESYear FE YES YES YES YESN 6080 6080 6080 6080R-sq 0.7312 0.7377 0.7308 0.7374First Stage F-Stat - - 165.96 171.84Endog Test P-Val - - 0.0205 0.0249
Notes: Documents the effects of BTT-induced changes in foreign-affiliate employment on domestic employment at the regionlevel. First-stage F-statistics are large for all IV specifications, though the relevant F-statistics for weak-instrument concernsappear in columns (2) and (5) of Table 4 (see text for discussion). In all IV specifications, the equality of OLS and IV isrejected. Sample covers 1987-2007. Standard errors clustered by parent firm and year are in parentheses. *,**, and *** indicatesignificance at the 10, 5, and 1 percent levels, respectively.
36

Online Appendices(Not for publication)
A Data, Definitions, and Supplemental Empirical Results 2A.1 Yearly Coverage Relative to BTT Dates . . . . . . . . . . . . . . . . . . . . 2A.2 High versus Low RID Industries . . . . . . . . . . . . . . . . . . . . . . . . . 3A.3 Alternative Specifications for BTTs’ Effects on Employment at U.S. Multina-
tionals . . . . . . . . . . . . . . . . . . . . . . . . . . . . . . . . . . . . . . . 5A.4 Empirical Results Using Variation in the Change in Withholding Tax Rates . 9A.5 Empirical Results for Vertically Oriented Multinational Firms . . . . . . . . 17A.6 Imputation in CBP Employment Data . . . . . . . . . . . . . . . . . . . . . 25
B Supplemental Theoretical and Econometric Results 27B.1 Detailed Model of Double Taxation . . . . . . . . . . . . . . . . . . . . . . . 27B.2 Model with CES Production . . . . . . . . . . . . . . . . . . . . . . . . . . . 30B.3 Smearing . . . . . . . . . . . . . . . . . . . . . . . . . . . . . . . . . . . . . . 32
1
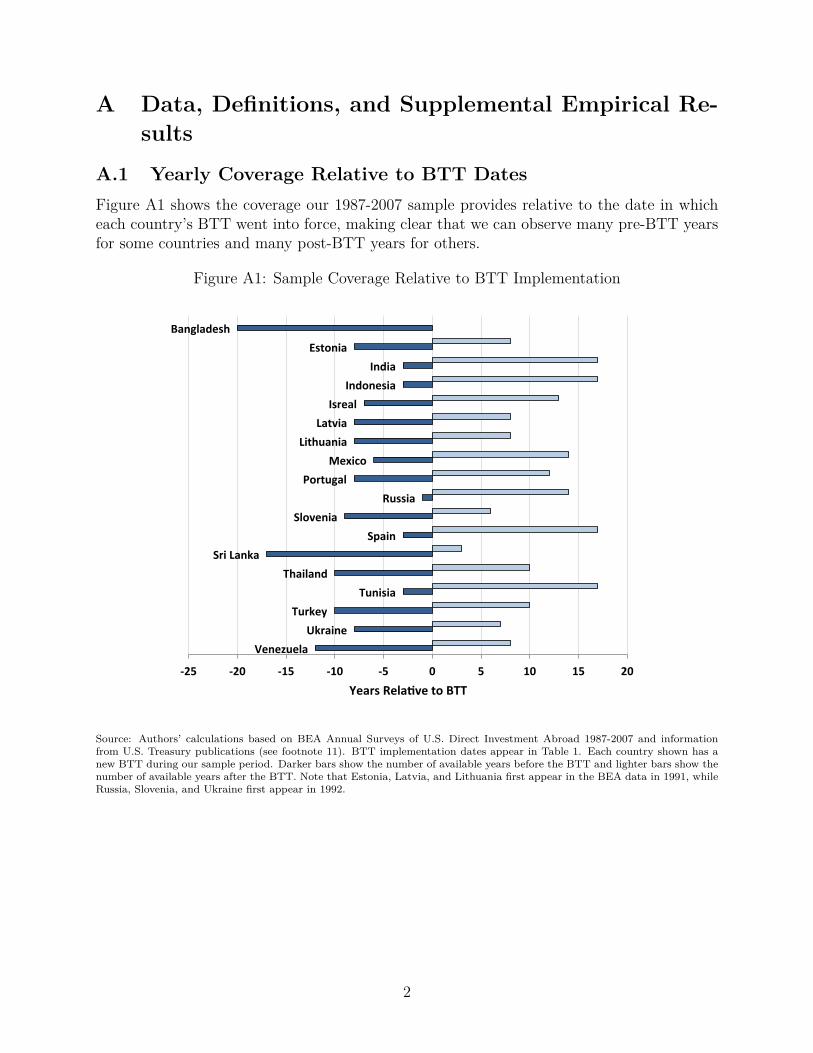
A Data, Definitions, and Supplemental Empirical Re-sults
A.1 Yearly Coverage Relative to BTT DatesFigure A1 shows the coverage our 1987-2007 sample provides relative to the date in whicheach country’s BTT went into force, making clear that we can observe many pre-BTT yearsfor some countries and many post-BTT years for others.
Figure A1: Sample Coverage Relative to BTT Implementation
Venezuela Ukraine
Turkey Tunisia
Thailand Sri Lanka
Spain Slovenia
Russia Portugal
Mexico Lithuania
Latvia Isreal
Indonesia India
Estonia Bangladesh
-‐25 -‐20 -‐15 -‐10 -‐5 0 5 10 15 20 Years RelaGve to BTT
Source: Authors’ calculations based on BEA Annual Surveys of U.S. Direct Investment Abroad 1987-2007 and informationfrom U.S. Treasury publications (see footnote 11). BTT implementation dates appear in Table 1. Each country shown has anew BTT during our sample period. Darker bars show the number of available years before the BTT and lighter bars show thenumber of available years after the BTT. Note that Estonia, Latvia, and Lithuania first appear in the BEA data in 1991, whileRussia, Slovenia, and Ukraine first appear in 1992.
2

A.2 High versus Low RID IndustriesAs discussed in Section 2, double taxation is more likely to occur in industries where thevalue of withholding taxes paid to foreign tax authorities is large. Limits on the foreigntax credit available to U.S. multinational firms are more likely to bind when the amount ofincome subject to taxation by a foreign authority – in the form of royalties, interest, anddividends – is high. Appendix B.1 formally demonstrates this argument in a general contextof payments from a foreign affiliate to a U.S. parent firm. The purpose of this section isto provide details on how we delineate industries with high versus low royalty, interest, anddividend payments (RID), and thus high and low exposure to treatment from a BTT.
The BEA collects information on the total value of royalty, interest, and dividend pay-ments from each foreign affiliate to its U.S. multinational parent firm in their BenchmarkSurveys of U.S. Foreign Direct Investment Abroad. These surveys are conducted every fiveyears and contain information such as details about royalty, interest, and dividend payments,that are not available in the annual surveys. We use information on the value of RID pay-ments from the 1989 benchmark survey, which is the earliest available benchmark year, tominimize concerns about endogeneity. We aggregate total RID payments by 3-digit industryand country, and then calculate the ratio of total RID payments to total foreign affiliate salesfor each industry-by-country cell. We then regress this ratio on an industry fixed effect anda country fixed effect. The value of the industry fixed effect is our measure of RID intensityfor a particular industry, independent of country-specific factors that may otherwise affectRID payments. We classify those industries with RID intensity above the observed medianas being high RID industries and those below the median as being low RID industries, asshown in Table A1
3

Table A1: Industry Classification by Royalties, Interest, and Dividend Payments as a Shareof Total Foreign Affiliate Sales
Low RID High RIDRank SIC SIC Name Rank SIC SIC Name1 505 Metals and minerals, except petroleum Wholesale 61 477 Transportation, nec, and related services2 250 Furniture and fixtures Mfg 62 742 Information retrieval services3 530 General merchandise retail stores 63 554 Gasoline service stations4 120 Coal mining 64 352 Farm and garden machinery Mfg5 631 Life insurance 65 483 Other communications services6 810 Legal services 66 461 Pipelines, petroleum and natural gas7 540 Food retail stores 67 873 Research, development, and testing services8 449 Water transportation 68 752 Automotive parking, repair, and other services9 470 Petroleum storage for hire 69 262 Pulp, paper, and board mills Mfg10 507 Hardware, & plumbing & heating equipment Wholesale 70 501 Motor vehicles and equipment Wholesale11 515 Farm product raw materials Wholesale 71 590 Retail, nec12 503 Lumber and other construction materials Wholesale 72 560 Apparel and accessory retail stores13 871 Engineering, architectural, and surveying services 73 230 Apparel and other textile products Mfg14 379 Other transportation equipment, nec Mfg 74 201 Meat products Mfg15 639 Other insurance 75 204 Grain mill products Mfg16 632 Accident and health insurance 76 354 Metalworking machinery Mfg17 800 Health services 77 331 Ferrous Metals Mfg18 363 Household appliances Mfg 78 205 Bakery products Mfg19 138 Oil and gas field services 79 481 Telephone and telegraph communications20 292 Petroleum refining without extraction 80 351 Engines and turbines Mfg21 600 Depository Institutions 81 353 Construction, mining, & materials handling Mfg22 140 Nonmetallic minerals mining, except fuels 82 355 Special industry machinery Mfg23 511 Paper and paper products Wholesale 83 780 Motion pictures, including television tape and film24 514 Groceries and related products Wholesale 84 208 Beverages Mfg25 731 Advertising 85 508 Machinery, equipment, and supplies Wholesale26 20 Agricultural production–livestock and animal 86 450 Transportation by air27 341 Metal cans, forgings, and stampings Mfg 87 743 Computer related services, nec28 349 Metal services, ordinance, & fabricated metal Mfg 88 272 Miscellaneous publishing Mfg29 751 Automotive rental and leasing, without drivers 89 749 Business sevices, nec30 202 Dairy products Mfg 90 369 Electronic and other electric equipment, nec Mfg31 359 Industrial machinery and equipment, nec Mfg 91 512 Drugs, proprietaries, & sundries Wholesale32 358 Refrigeration and service industry machinery Mfg 92 102 Copper, lead, zinc, gold, and silver ores mining33 203 Preserved fruits and vegetables Mfg 93 390 Miscellaneous manufacturing industries34 240 Lumber and wood products Mfg 94 736 Personnel supply services35 335 Nonferrous Metals Mfg 95 872 Accounting, auditing, and bookkeeping services36 265 Other paper and allied products Mfg 96 890 Other services provided on a commercial basis37 519 Nondurable goods, nec Wholesale 97 329 Stone, clay, concrete, gypsum, etc Mfg38 107 Other metallic ores mining 98 612 Other finance, including security and commodity br39 760 Miscellaneous repair services 99 650 Real estate40 90 Fishing, hunting, and trapping 100 284 Soap, cleaners, and toilet goods Mfg41 275 Commercial printing and services Mfg 101 367 Electronic components and accessories Mfg42 308 Miscellaneous plastics products Mfg 102 509 Durable goods, nec Wholesale43 513 Apparel, piece goods, & notions Wholesale 103 291 Integrated petroleum refining and extraction44 386 Photographic equipment and supplies Mfg 104 343 Heating equipment, plumbing fixtures, etc Mfg45 305 Rubber products Mfg 105 366 Household audio & video, & communications Mfg46 289 Chemical products, nec Mfg 106 741 Computer processing and data preparation services47 210 Tobacco products Mfg 107 735 Equipment rental and leasing, exc automobiles48 299 Petroleum and coal products, nec 108 504 Professional & commerical eq & supplies Wholesale49 310 Leather and leather products Mfg 109 10 Agricultural production–crops50 506 Electrical goods Wholesale 110 283 Drugs Mfg51 321 Glass products Mfg 111 220 Textile mill products Mfg52 108 Metal mining services 112 342 Cutlery, hardware, and screw products Mfg53 381 Measuring, scientific, & optical instruments Mfg 113 357 Computer and office equipment Mfg54 281 Industrial chemicals and synthetics Mfg 114 133 Crude petroleum (no refining) and natural gas55 384 Medical instruments & supplies and ophthalmic Mfg 115 287 Agricultural chemicals Mfg56 150 Construction 116 874 Management and public relations services57 700 Hotels and other lodging places 117 820 Educational services58 356 General industrial machinery Mfg 118 580 Eating and drinking places59 209 Other food and kindred products Mfg 119 790 Amusement and recreation services60 371 Motor vehicles and equipment Mfg 120 671 Holding companies
121 679 Franchising, business – selling or licensing
Classification of industries into high-RID and low-RID groups. Ranks listed from low to high RID. See text for details.
4

A.3 Alternative Specifications for BTTs’ Effects on Employmentat U.S. Multinationals
This section presents reduced-form specifications examining the effects of BTTs on domesticemployment at U.S. multinational firms. The main results use the specifications in equations(1) and (2), with results in Table 3 and Figure 1.
We also estimate alternative difference-in-difference specifications that employ differentweighting schemes to assign the value of treatment from a BTT. Our first alternative spec-ification drops the affiliate employment rescaling term, ϕf from the BTT indicator, so thevariable of interest is simply 1(t ≥ tf ). The difference-in-difference and event study resultsappear in Table A2 and Figure A2. As in the main specification, the effect of BTTs is posi-tive, and significant only for high RID firms. The scale of the coefficients is smaller however,reflecting the fact that the scale of the regressor is larger without the affiliate employmentshare adjustment. As in the main specification, there is no sign of pre-BTT differentialemployment growth between firms with and without affiliates receiving a BTT, and theemployment effects emerge in the period of BTT implementation (t = 0 in Figure A2).
Our second alternative integrates information from all BTTs faced by affiliates duringour sample period, not just the first one as in the main analysis or the previous alternative.For a given multinational firm f , we examine the share of initial affiliate employment coveredby BTTs in year t (see footnote 16 for notation definitions).
BTT ft ≡∑c∈Cf
ϕf,c1(t ≥ tc), ϕf,c ≡mf,c,tf−1∑
c′∈Cf mf,c′,tf−1(15)
where ϕf,c is affiliate c’s initial share of firm f ’s total affiliate employment. We measureaffiliate employment in the year prior to the first BTT faced by the firm (tf − 1) to avoidincluding any endogenous employment adjustments. Because a given parent firm may be“treated” multiple times by receiving BTTs in multiple affiliate countries over time, we cannot implement a traditional event study, as we did when focusing only on the first BTT a firmexperiences. However, we can use a similar approach to rule out the presence of confoundingpre-BTT trends by including leads and lags of the BTT coverage measure in (15). Figure A3plots the associated coefficients, confirming the similarity of pre-existing employment growthrates for firms that would and would not later experience increases BTT coverage.
5

Table A2: Reduced Form Difference-in-Differences Analysis Without Affiliate Scaling:The Effect of BTTs on Parent Employment
Dependent variable: log parent employment: ln(sft)(1) (2) (3) (4) (5) (6)
Sample: All High RID Low RID All High RID Low RIDBTT
[1(t ≥ tf )
]0.013 0.022*** -0.008 0.015 0.039*** -0.008
(0.015) (0.008) (0.025) (0.05) (0.015) (0.025)ln(GDPus +GDPd) 0.02 -0.063 0.163
(0.121) (0.145) (0.193)ln(GDPus −GDPd)2 -0.052 -0.013 -0.118
(0.059) (0.071) (0.096)ln(Skill Difference) -0.074 -0.093 -0.048
(0.047) (0.057) (0.095)ln(Trade Costs) 0.002 0.015 -0.002
(0.015) (0.018) (0.030)BIT -0.281 -0.259 -0.246
(0.172) (0.237) (0.237)FTA -0.008 -0.078 0.013
(0.062) (0.088) (0.079)Exchange Rate -0.0001 -0.0001 0.0001
(0.000) (0.000) (0.000)Parent FE YES YES YES YES YES YESIndustry-Year FE YES YES YES YES YES YESN 43233 29765 13468 43233 29765 13468R-sq 0.0014 0.0023 0.0004 0.0573 0.0643 0.0416
Notes: Documents the effects of newly signed bilateral tax treaties (BTTs) on parent employment at multinational firms. “HighRID” and “Low RID” refer to firms within industries that exhibit ratios of total payments in royalties, interest and dividendsrelative to total industry sales that are above and below the median sector (see Appendix A.2 for details). Sample covers1987-2007. Standard errors clustered by both parent firm and year are in parentheses. *,**, and *** indicate significance atthe 10, 5, and 1 percent levels, respectively.
6

Figure A2: Effect of BTTs on U.S. Multinational Firm Employment Without AffiliateScaling
in High Royalty, Interest, and Dividend Industries
-0.06
-0.04
-0.02
0.00
0.02
0.04
0.06
0.08
0.10
-6 -5 -4 -3 -2 -1 0 1 2 3 4 5 6
Coef
ficie
nt E
stim
ate:
Eff
ect o
f Firs
t BTT
on
Pare
nt E
mpl
oym
ent
Years Since BTT Effective Date
event-study estimates
diff-in-diff estimate
Source: Authors’ calculations based on BEA Annual Surveys of U.S. Direct Investment Abroad 1987-2007. Sample restricted tofirms in industries with high RID payments to U.S. parent firms. Each point on the black line represents a coefficient estimatefrom the event study specification in (2). Dashed lines reflect 95 percent confidence intervals for these event-study estimateswhen clustering standard errors by both parent firm and year. Gray lines reflects the diff-in-diff estimate described in (1),located so the lower line corresponds to the average of pre-BTT event study coefficients. Both specifications include firm andindustry × time fixed effects and a full set of controls, as in column (5) of Table 3.
7

Figure A3: Effect of BTTs on U.S. Multinational Firm Employment Using All BTTsin High Royalty, Interest, and Dividend Industries
-0.15
-0.10
-0.05
0.00
0.05
0.10
0.15
-5 -4 -3 -2 -1 0 1 2 3 4 5
Effe
ct o
f BTT
Cov
erag
e on
Par
ent
Empl
oym
ent
Years Since BTT Effective Date
Source: Authors’ calculations based on BEA Annual Surveys of U.S. Direct Investment Abroad 1987-2007. Sample restricted tofirms in industries with high RID payments to U.S. parent firms. Each point on the black line represents a coefficient estimateon leads or lags of the BTT coverage measure in (15). Dashed lines reflect 95 percent confidence intervals for these estimateswhen clustering standard errors by both parent firm and year. The regressions include firm and industry × time fixed effectsand a full set of controls, as in column (5) of Table 3.
8

A.4 Empirical Results Using Variation in the Change in With-holding Tax Rates
This section presents all of the main empirical results utilizing additional variation in themagnitude of the withholding tax changes across the various countries signing new BTTswith the U.S. As shown in Table 1, the decline in withholding rate varied across treaties andacross the relevant financial flows (royalties, interest, and dividends) for a given treaty. Itis therefore plausible that countries whose affiliates faced larger declines in withholding taxrates would exhibit larger effects. Accounting for these differences might therefore improvethe statistical power of our analysis.
The results of such an analysis appear in Tables A3 - A8. We refer to the treaty-inducedchange in withholding tax rate as the “dosage” for affiliates in that country. In order tocalculate this dosage measure, we made a number of decisions. First, the analysis presentedhere omits affiliates in Tunisia, Venezuela, Slovenia, and Bangladesh, since we do not havepre- and post-treaty tax rates for those countries (Table 1). This leaves us with 14 treatedcountries rather than the 18 we use in the main analysis. Second, in many cases withholdingrates are reported as a range, rather than a specific value (see Table 1). We use the maximumpossible change in the tax rate for each type of income (results based on the minimum possiblechange are extremely similar).
Third, since countries generally apply different withholding tax rates to each of the threedifferent types of payments (royalties, interest, and dividends - RID), we weight these threefinancial flows by their importance for a given affiliate. In order to avoid endogeneity concernsin which withholding rates distort the size of each financial flow, we created country-levelweights using data for RID payments from the 1989 BEA Benchmark Survey. However, theformer Soviet republics in our sample did not exist in 1989, and most of them did not haveRID payments in 1994, so we use data from 1999 for this set of countries (and 1989 for allothers).
Fourth, after aggregating across royalty, interest, and dividend payments using the weightsjust described, we had to choose a functional form for how the change in average withholdingtax rate influenced the size of the BTT’s effects on employment outcomes. In Appendix B.1equation (26), the withholding tax rate is parameterized as
ln τcti = ln [(1 + t− t∗c)(1− φci)− h∗φci] , (16)
where h∗ is the withholding tax rate. For simplicity, assume t ≈ t∗c and φci ≈ 0.5. Withthose assumptions,
ln τcti ≈ ln(0.5) + ln(1− h∗) (17)A BTT changes h∗, such that the change in the effective tax on offshore activity is
d ln τcti ≈ d ln(1− h∗) (18)
We use the righthand side of this expression as our measure of the magnitude of a givenBTT. For example, if a country’s withholding tax rate fell from 25% to 10%, then thedosage measure will be 0.182 = ln(1 − 0.10) − ln(1 − 0.25). One way to think about thismeasure is by noting that ln(1− x) ≈ 1− x when x is small. So, for small values of h∗, our
9

measure is just the negative of the change in withholding tax rate.Given these choices, we take the withholding tax rates from Table 1 and multiply the
BTT indicator in the main analysis by this dosage measure. We then use this dosage-scaledBTT indicator in Tables A3 - A8. The affiliate-level first-stage analysis in Table A3 is indeedstronger, with larger partial F-statistics than in the main analysis. However, this differencein the first stage does not lead to substantive changes in the second-stage results at theparent, industry, or region level, showing that our findings are robust to utilizing variationin withholding tax changes across BTTs. Also note that even though the affiliate-level first-stage coefficients are roughly ten times higher than the corresponding coefficients on thebinary BTT treatment variable in Table 4 of the paper, the predicted effects are very similaracross the two specifications, as the average “dosage” is approximately 0.1.
10
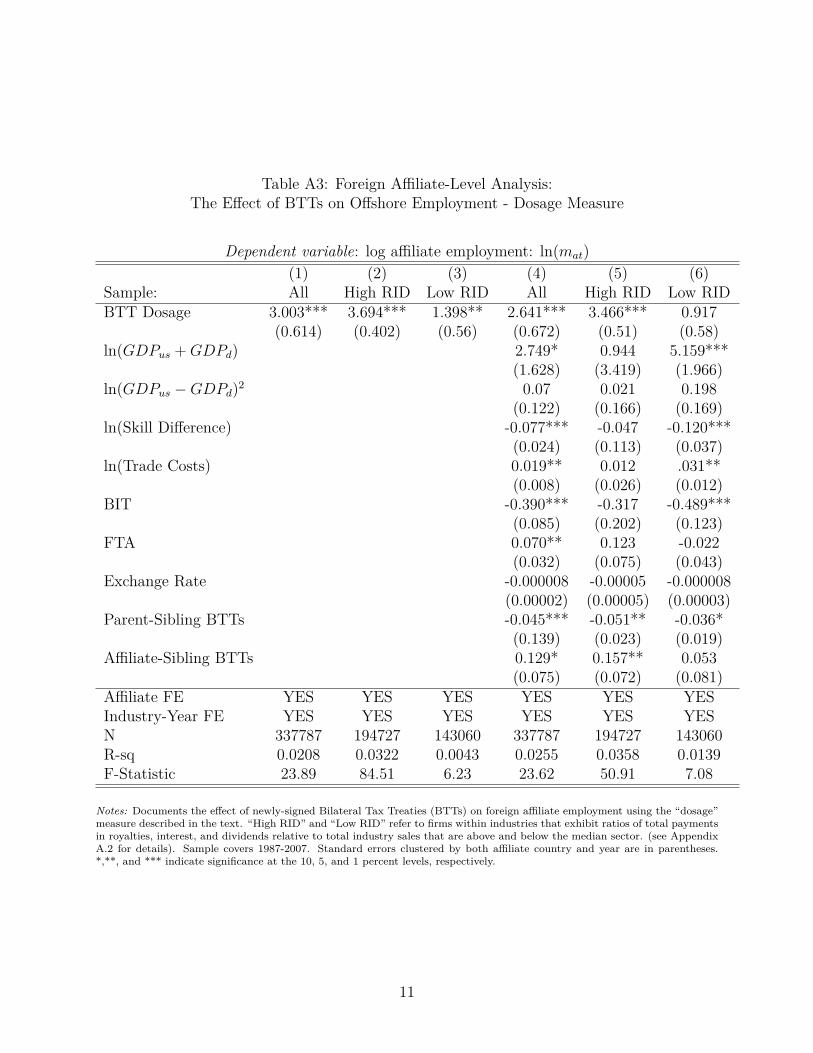
Table A3: Foreign Affiliate-Level Analysis:The Effect of BTTs on Offshore Employment - Dosage Measure
Dependent variable: log affiliate employment: ln(mat)(1) (2) (3) (4) (5) (6)
Sample: All High RID Low RID All High RID Low RIDBTT Dosage 3.003*** 3.694*** 1.398** 2.641*** 3.466*** 0.917
(0.614) (0.402) (0.56) (0.672) (0.51) (0.58)ln(GDPus +GDPd) 2.749* 0.944 5.159***
(1.628) (3.419) (1.966)ln(GDPus −GDPd)2 0.07 0.021 0.198
(0.122) (0.166) (0.169)ln(Skill Difference) -0.077*** -0.047 -0.120***
(0.024) (0.113) (0.037)ln(Trade Costs) 0.019** 0.012 .031**
(0.008) (0.026) (0.012)BIT -0.390*** -0.317 -0.489***
(0.085) (0.202) (0.123)FTA 0.070** 0.123 -0.022
(0.032) (0.075) (0.043)Exchange Rate -0.000008 -0.00005 -0.000008
(0.00002) (0.00005) (0.00003)Parent-Sibling BTTs -0.045*** -0.051** -0.036*
(0.139) (0.023) (0.019)Affiliate-Sibling BTTs 0.129* 0.157** 0.053
(0.075) (0.072) (0.081)Affiliate FE YES YES YES YES YES YESIndustry-Year FE YES YES YES YES YES YESN 337787 194727 143060 337787 194727 143060R-sq 0.0208 0.0322 0.0043 0.0255 0.0358 0.0139F-Statistic 23.89 84.51 6.23 23.62 50.91 7.08
Notes: Documents the effect of newly-signed Bilateral Tax Treaties (BTTs) on foreign affiliate employment using the “dosage”measure described in the text. “High RID” and “Low RID” refer to firms within industries that exhibit ratios of total paymentsin royalties, interest, and dividends relative to total industry sales that are above and below the median sector. (see AppendixA.2 for details). Sample covers 1987-2007. Standard errors clustered by both affiliate country and year are in parentheses.*,**, and *** indicate significance at the 10, 5, and 1 percent levels, respectively.
11
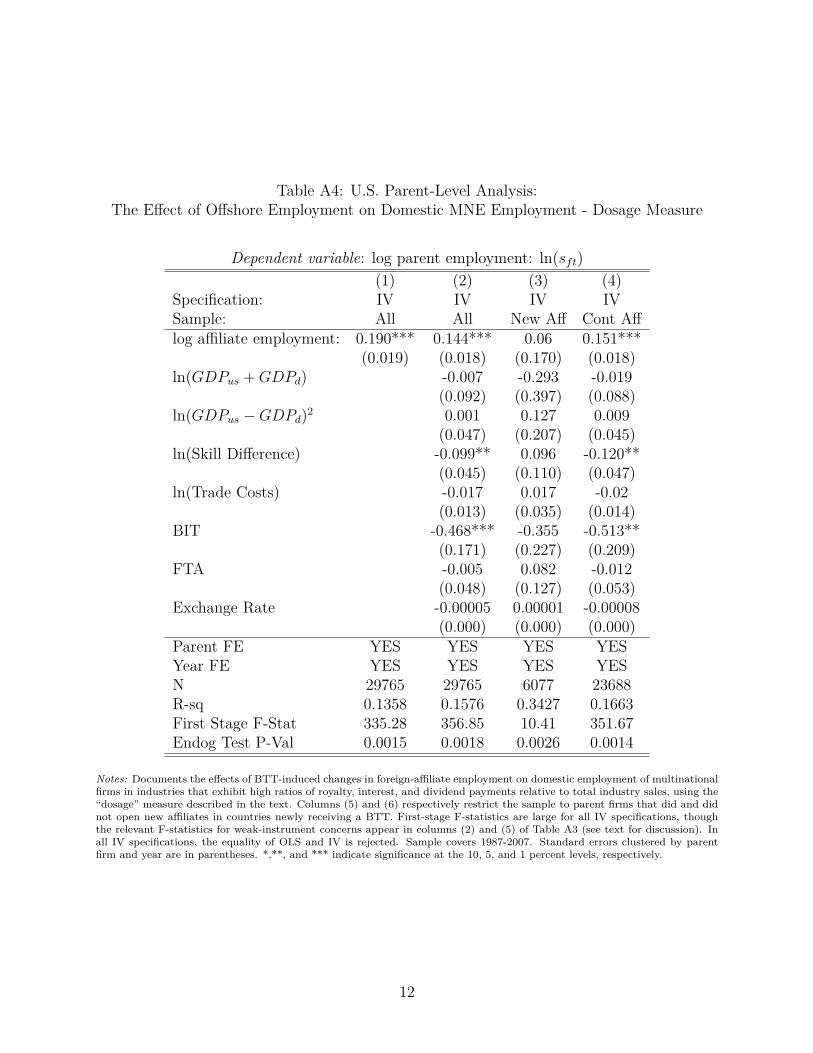
Table A4: U.S. Parent-Level Analysis:The Effect of Offshore Employment on Domestic MNE Employment - Dosage Measure
Dependent variable: log parent employment: ln(sft)(1) (2) (3) (4)
Specification: IV IV IV IVSample: All All New Aff Cont Afflog affiliate employment: 0.190*** 0.144*** 0.06 0.151***
(0.019) (0.018) (0.170) (0.018)ln(GDPus +GDPd) -0.007 -0.293 -0.019
(0.092) (0.397) (0.088)ln(GDPus −GDPd)2 0.001 0.127 0.009
(0.047) (0.207) (0.045)ln(Skill Difference) -0.099** 0.096 -0.120**
(0.045) (0.110) (0.047)ln(Trade Costs) -0.017 0.017 -0.02
(0.013) (0.035) (0.014)BIT -0.468*** -0.355 -0.513**
(0.171) (0.227) (0.209)FTA -0.005 0.082 -0.012
(0.048) (0.127) (0.053)Exchange Rate -0.00005 0.00001 -0.00008
(0.000) (0.000) (0.000)Parent FE YES YES YES YESYear FE YES YES YES YESN 29765 29765 6077 23688R-sq 0.1358 0.1576 0.3427 0.1663First Stage F-Stat 335.28 356.85 10.41 351.67Endog Test P-Val 0.0015 0.0018 0.0026 0.0014
Notes: Documents the effects of BTT-induced changes in foreign-affiliate employment on domestic employment of multinationalfirms in industries that exhibit high ratios of royalty, interest, and dividend payments relative to total industry sales, using the“dosage” measure described in the text. Columns (5) and (6) respectively restrict the sample to parent firms that did and didnot open new affiliates in countries newly receiving a BTT. First-stage F-statistics are large for all IV specifications, thoughthe relevant F-statistics for weak-instrument concerns appear in columns (2) and (5) of Table A3 (see text for discussion). Inall IV specifications, the equality of OLS and IV is rejected. Sample covers 1987-2007. Standard errors clustered by parentfirm and year are in parentheses. *,**, and *** indicate significance at the 10, 5, and 1 percent levels, respectively.
12

Table A5: U.S. Industry-Level Analysis:The Effect of Offshore Employment on U.S. Industry Employment - Dosage Measure
Dependent variable: log industry employment: ln(Lit)(1) (2)
Specification: IV IVindustry log affiliate employment: 0.007*** 0.008***
(0.003) (0.003)ln(GDPus +GDPd) -0.013
(0.036)ln(GDPus −GDPd)2 0.004
(0.018)ln(Skill Difference) 0.01
(0.018)ln(Trade Costs) 0.011**
(0.005)BIT -0.005
(0.021)FTA 0.013
(0.016)Exchange Rate -0.00003
(0.000)Industry FE YES YESYear FE YES YESN 1268 1268R-sq 0.4796 0.5252First Stage F-Stat 200.08 106.93Endog Test P-Val 0.0254 0.0298
Notes: Documents the effects of BTT-induced changes in foreign-affiliate employment at the industry level for industriesthat exhibit high ratios of royalty, interest, and dividend payments relative to total industry sales, using the “dosage”measure described in the text. First-stage F-statistics are large for all IV specifications, though the relevant F-statisticsfor weak-instrument concerns appear in columns (2) and (5) of Table A3 (see text for discussion). In all IV specifications,the equality of OLS and IV is rejected. Sample covers 1987-2007. Standard errors clustered by industry and year are inparentheses. *,**, and *** indicate significance at the 10, 5, and 1 percent levels, respectively.
13

Table A6: U.S. Industry Level Analysis:The Effect of Offshore Employment on U.S. MNE vs. non-MNE Employment - Dosage
Measure
Dependent variable: log industry employment: ln(Lit)(1) (2) (3) (4)
Specification: IV IV IV IVSample: MNE MNE non-MNE non-MNEindustry log affiliate employment: 0.044*** 0.044*** 0.002 0.001
(0.005) (0.005) (0.004) (0.005)ln(GDPus +GDPd) 0.101 -0.029
(0.092) (0.046)ln(GDPus −GDPd)2 -0.05 0.012
(0.047) (0.024)ln(Skill Difference) -0.06 0.014
(0.037) (0.022)ln(Trade Costs) -0.007 0.011
(0.007) (0.009)BIT 0.047 -0.007
(0.067) (0.026)FTA 0.06 0.015
(0.037) (0.016)Exchange Rate -0.00002 -0.00001
(0.000) (0.000)Industry FE YES YES YES YESYear FE YES YES YES YESN 1268 1268 1268 1268R-sq 0.2555 0.2984 0.4236 0.4697First Stage F-Stat 151.44 82.25 182.04 98.39Endog Test P-Val 0.0091 0.0053 0.0201 0.0189
Notes: Documents the effects of BTT-induced changes in foreign-affiliate employment at the industry level for industries thatexhibit high ratios of royalty, interest, and dividend payments relative to total industry sales, using the “dosage” measuredescribed in the text. Columns (1) and (2) examine employment for multinational parents in the U.S. industry while columns(3) and (4) examine all other employment in each industry. First-stage F-statistics are large for all IV specifications, thoughthe relevant F-statistics for weak-instrument concerns appear in columns (2) and (5) of Table A3 (see text for discussion). Inall IV specifications, the equality of OLS and IV is rejected. Sample covers 1987-2007. Standard errors clustered by industryand year are in parentheses. *,**, and *** indicate significance at the 10, 5, and 1 percent levels, respectively.
14
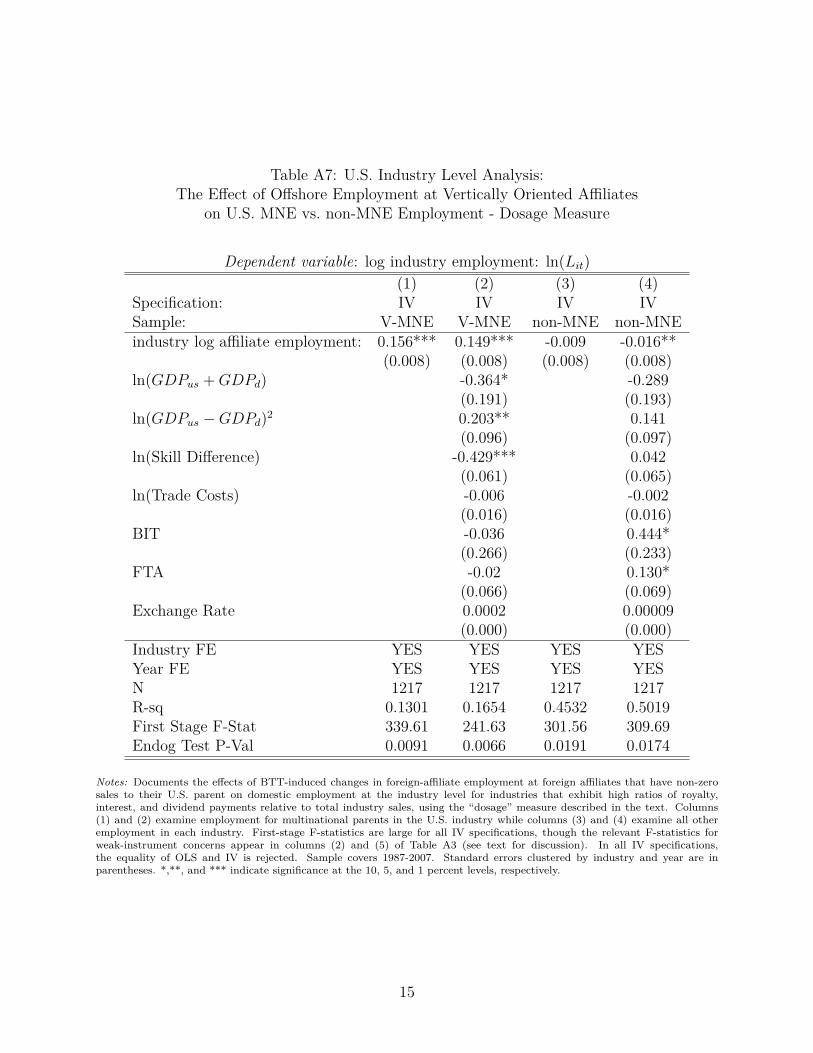
Table A7: U.S. Industry Level Analysis:The Effect of Offshore Employment at Vertically Oriented Affiliates
on U.S. MNE vs. non-MNE Employment - Dosage Measure
Dependent variable: log industry employment: ln(Lit)(1) (2) (3) (4)
Specification: IV IV IV IVSample: V-MNE V-MNE non-MNE non-MNEindustry log affiliate employment: 0.156*** 0.149*** -0.009 -0.016**
(0.008) (0.008) (0.008) (0.008)ln(GDPus +GDPd) -0.364* -0.289
(0.191) (0.193)ln(GDPus −GDPd)2 0.203** 0.141
(0.096) (0.097)ln(Skill Difference) -0.429*** 0.042
(0.061) (0.065)ln(Trade Costs) -0.006 -0.002
(0.016) (0.016)BIT -0.036 0.444*
(0.266) (0.233)FTA -0.02 0.130*
(0.066) (0.069)Exchange Rate 0.0002 0.00009
(0.000) (0.000)Industry FE YES YES YES YESYear FE YES YES YES YESN 1217 1217 1217 1217R-sq 0.1301 0.1654 0.4532 0.5019First Stage F-Stat 339.61 241.63 301.56 309.69Endog Test P-Val 0.0091 0.0066 0.0191 0.0174
Notes: Documents the effects of BTT-induced changes in foreign-affiliate employment at foreign affiliates that have non-zerosales to their U.S. parent on domestic employment at the industry level for industries that exhibit high ratios of royalty,interest, and dividend payments relative to total industry sales, using the “dosage” measure described in the text. Columns(1) and (2) examine employment for multinational parents in the U.S. industry while columns (3) and (4) examine all otheremployment in each industry. First-stage F-statistics are large for all IV specifications, though the relevant F-statistics forweak-instrument concerns appear in columns (2) and (5) of Table A3 (see text for discussion). In all IV specifications,the equality of OLS and IV is rejected. Sample covers 1987-2007. Standard errors clustered by industry and year are inparentheses. *,**, and *** indicate significance at the 10, 5, and 1 percent levels, respectively.
15
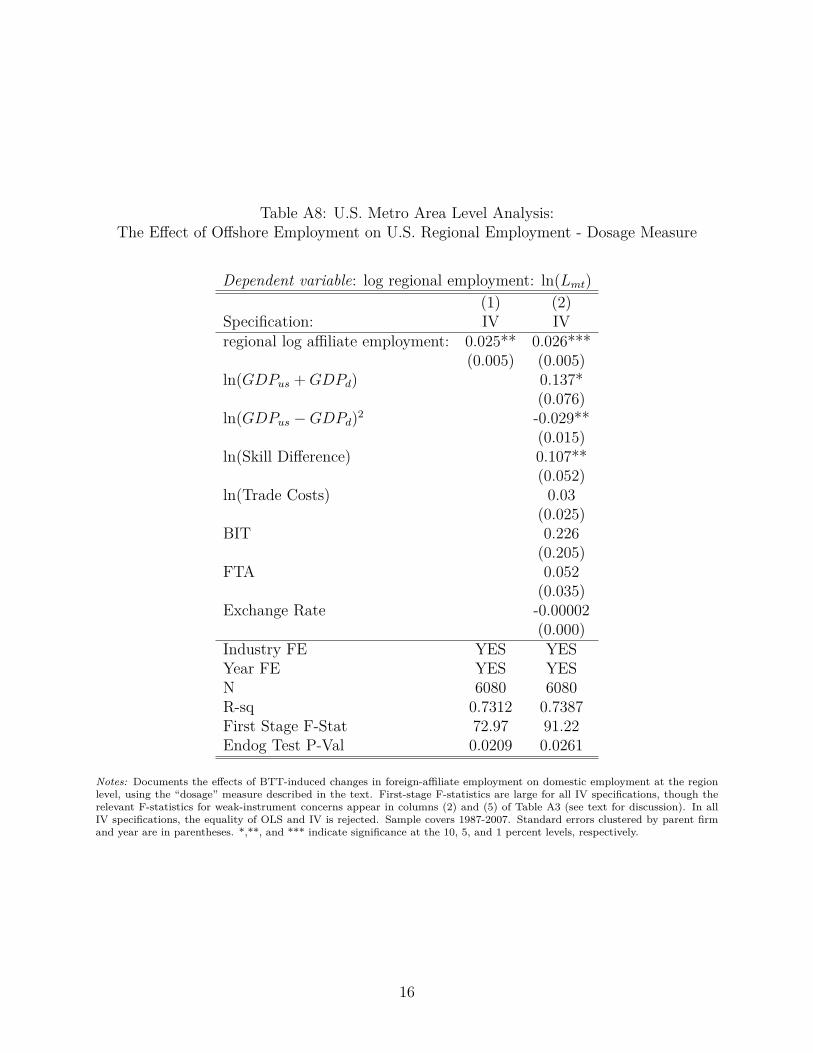
Table A8: U.S. Metro Area Level Analysis:The Effect of Offshore Employment on U.S. Regional Employment - Dosage Measure
Dependent variable: log regional employment: ln(Lmt)(1) (2)
Specification: IV IVregional log affiliate employment: 0.025** 0.026***
(0.005) (0.005)ln(GDPus +GDPd) 0.137*
(0.076)ln(GDPus −GDPd)2 -0.029**
(0.015)ln(Skill Difference) 0.107**
(0.052)ln(Trade Costs) 0.03
(0.025)BIT 0.226
(0.205)FTA 0.052
(0.035)Exchange Rate -0.00002
(0.000)Industry FE YES YESYear FE YES YESN 6080 6080R-sq 0.7312 0.7387First Stage F-Stat 72.97 91.22Endog Test P-Val 0.0209 0.0261
Notes: Documents the effects of BTT-induced changes in foreign-affiliate employment on domestic employment at the regionlevel, using the “dosage” measure described in the text. First-stage F-statistics are large for all IV specifications, though therelevant F-statistics for weak-instrument concerns appear in columns (2) and (5) of Table A3 (see text for discussion). In allIV specifications, the equality of OLS and IV is rejected. Sample covers 1987-2007. Standard errors clustered by parent firmand year are in parentheses. *,**, and *** indicate significance at the 10, 5, and 1 percent levels, respectively.
16

A.5 Empirical Results for Vertically Oriented Multinational FirmsThis appendix replicates the empirical results in the main text for a subsample of verticallyoriented multinational firms, i.e. those whose foreign affiliates exhibit sales back to the U.S.parent. The results are similar to those in the main text, which use the full sample of multi-nationals irrespective of vertical or horizontal orientation. One exception is the industry-leveleffect of offshoring activity on non-multinational firm employment, which is why we includethe effects for vertically oriented firms in Table 8 in the main text and discuss the differencesin Section 4.2.3.
For reference, Appendix Figure A4 corresponds to Figure 1 in the main text, Table A9corresponds to Table 2, Table A10 corresponds to Table 3, Table A11 corresponds to Table4, Table A12 corresponds to Table 5, Table A13 corresponds to Table 6, and Table A14corresponds to Table 9.
17
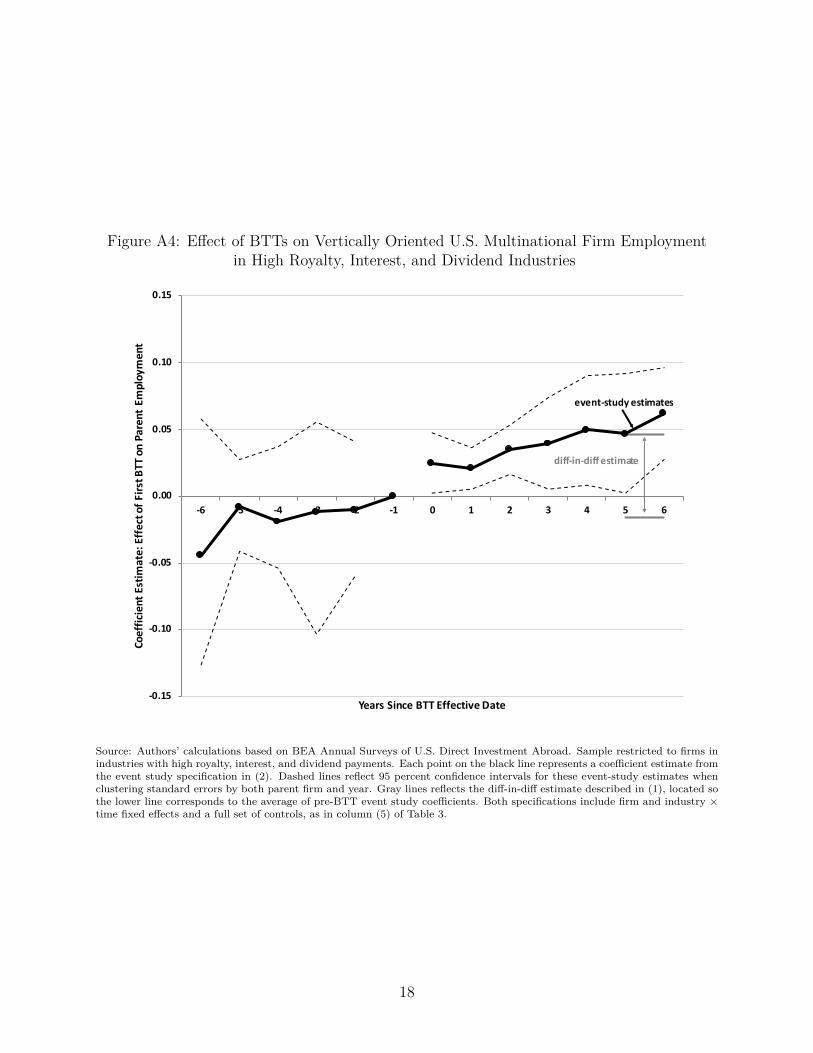
Figure A4: Effect of BTTs on Vertically Oriented U.S. Multinational Firm Employmentin High Royalty, Interest, and Dividend Industries
-0.15
-0.10
-0.05
0.00
0.05
0.10
0.15
-6 -5 -4 -3 -2 -1 0 1 2 3 4 5 6
Coef
ficie
nt E
stim
ate:
Eff
ect o
f Firs
t BTT
on
Pare
nt E
mpl
oym
ent
Years Since BTT Effective Date
event-study estimates
diff-in-diff estimate
Source: Authors’ calculations based on BEA Annual Surveys of U.S. Direct Investment Abroad. Sample restricted to firms inindustries with high royalty, interest, and dividend payments. Each point on the black line represents a coefficient estimate fromthe event study specification in (2). Dashed lines reflect 95 percent confidence intervals for these event-study estimates whenclustering standard errors by both parent firm and year. Gray lines reflects the diff-in-diff estimate described in (1), located sothe lower line corresponds to the average of pre-BTT event study coefficients. Both specifications include firm and industry ×time fixed effects and a full set of controls, as in column (5) of Table 3.
18

Table A9: Summary Statistics for Vertically Oriented Multinational Firms
Mean Std. Dev. Min MaxFOREIGN AFFILIATES (107,458 obs.)Employment 647.65 2158.0 (confidential)ln(Employment) 4.8569 1.9544 (confidential)Av. Annual Emp Growth (%) 0.1074 0.8576 (confidential)BTT 0.8315 0.3743 0 1High RID Indicator 0.5481 0.4977 0 1ln(GDPus +GDPd) 9.3503 0.215 8.8665 10.093ln(GDPus −GDPd)2 18.219 0.5496 14.841 18.933ln(Skill Difference) 1.0233 0.7481 0 2.4850ln(Trade Cost) 2.6179 2.3767 0 4.4888BIT 0.0384 0.1921 0 1FTA 0.1712 0.3767 0 1Exchange Rate 115.44 762.15 0 16105Parent-Sibling BTTsa 0.5513 0.2010 0 1Affiliate-Sibling BTTsb 0.2935 0.3797 0 3.3712
U.S. PARENT FIRMS (26,418 obs.)Foreign Affiliate Employment 2778.4 10855 (confidential)ln(Aff Emp) 5.9015 2.1264 (confidential)Av Annual Aff Emp Growth (%) 0.1355 0.8722 (confidential)Parent Firm Employment 9236.3 28622 (confidential)ln(Parent Employment) 7.5790 1.9188 (confidential)Number of Affiliates 4.5014 7.3598 (confidential)ln(GDPus +GDPd)c 4.0454 3.5220 0 29.618ln(GDPus −GDPd)2 c 7.8928 6.8857 0 58.087ln(Skill Difference)c 0.4125 0.4980 0 4.1650ln(Trade Cost)c 1.2377 1.5908 0 10.328BITc 0.0048 0.0560 0 1FTAc 0.1437 0.3116 0 1Exchange Ratec 17.835 178.47 0 23574
Authors’ calculations from BEA Annual Surveys of U.S. Direct Investment Abroad and various other data sources, described inSection 2. aWeighted average share of total sibling employment covered by a BTT with the U.S., using fixed affiliate employmentshares. bWeighted average share of total sibling employment covered by a BTT with the affiliate’s country, using fixed affiliateemployment shares. cParent-level versions of affiliate country controls are aggregated from the country to the parent firm levelusing a weighted average, using fixed affiliate employment shares as weights.
19

Table A10: Reduced Form Difference-in-Differences Analysis:The Effect of BTTs on Parent Employment, Vertically Oriented Firms
Dependent variable: log parent employment: ln(sft)(1) (2) (3) (4) (5) (6)
Sample: All High RID Low RID All High RID Low RIDBTT
[ϕf1(t ≥ tf )
]0.011 0.034** -0.014 0.013 0.046*** -0.015
(0.014) (0.017) (0.022) (0.019) (0.012) (0.062)ln(GDPus +GDPd) 0.722* 1.649 0.244
(0.413) (1.307) (0.986)ln(GDPus −GDPd)2 -0.388* -0.275 -2.381
(0.209) (0.655) (1.932)ln(Skill Difference) -0.006 -0.731** 0.733
(0.041) (0.288) (0.65)ln(Trade Costs) 0.541 -0.782 0.127
(0.704) (0.966) (0.286)BIT 0.577 -0.405 -0.623
(0.389) (0.308) (1.069)FTA 0.314 -0.374 0.721
(0.793) (0.328) (1.499)Exchange Rate 0.000 0.000 0.000
(0.002) (0.0002) (0.002)Parent FE YES YES YES YES YES YESIndustry-Year FE YES YES YES YES YES YESN 26418 15092 11326 26418 15092 11326R-sq 0.0894 0.1137 0.0732 0.1023 0.1481 0.0896
Notes: Documents the effect of newly-signed Bilateral Tax Treaties (BTTs) on parent employment in U.S. multinationalenterprises. “High RID” and “Low RID” refer to firms within industries that exhibit ratios of total payments in royalties,interest and dividends relative to total industry sales that are above and below the median sector (see Appendix A.2 fordetails). Standard errors clustered by both parent firm and year are in parentheses. *,**, and *** indicate significance at the10, 5, and 1 percent levels, respectively.
20

Table A11: Foreign Affiliate-Level Analysis:The Effect of BTTs on Offshore Employment, Vertically Oriented Firms
Dependent variable: log affiliate employment: ln(mat)(1) (2) (3) (4) (5) (6)
Sample: All High RID Low RID All High RID Low RIDBTT 0.133 0.337*** -0.083 0.085 0.312*** -0.152
(0.082) (0.069) (0.139) (0.085) (0.059) (0.113)ln(GDPus +GDPd) 1.302 -2.958 6.943***
(2.826) (3.649) (2.334)ln(GDPus −GDPd)2 0.079 -0.222 0.478**
(0.171) (0.186) (0.198)ln(Skill Difference) -0.122 -0.096 -0.161**
(0.095) (0.121) (0.072)ln(Trade Costs) 0.035 0.02 0.053
(0.039) (0.040) (0.039)BIT -0.907** -0.889** -0.947*
(0.416) (0.383) (0.489)FTA 0.061 0.135 -0.032
(0.064) (0.073) (0.062)Exchange Rate -0.0001 -0.0001 -0.0001
(0.0001) (0.0001) (0.0001)Parent-Sibling BTTs -0.031** -0.038*** -0.025
(0.013) (0.008) (0.032)Affiliate-Sibling BTTs 0.076 0.051 0.109*
(0.053) (0.032) (0.065)Affiliate FE YES YES YES YES YES YESIndustry-Year FE YES YES YES YES YES YESN 107458 59775 47683 107458 59775 47683R-sq 0.0005 0.0028 0.0002 0.0135 0.0154 0.0222F-Statistic 2.61 21.86 0.35 8.97 23.18 5.36
Notes: Documents the effect of newly-signed Bilateral Tax Treaties (BTTs) on foreign affiliate employment. “High RID” and“Low RID” refer to firms within industries that exhibit ratios of total payments in royalties, interest and dividends relativeto total industry sales that are above and below the median sector (see Appendix A.2 for details). Standard errors clusteredby both affiliate country and year are in parentheses. *,**, and *** indicate significance at the 10, 5, and 1 percent levels,respectively.
21

Table A12: U.S. Parent-Level Analysis:The Effect of Offshore Employment on Domestic MNE Employment, Vertically Oriented
Firms
Dependent variable: log parent employment: ln(sft)(1) (2) (3) (4) (5) (6)
Specification: OLS OLS IV IV IV IVSample: All All All New Aff Cont Afflog affiliate employment: 0.285*** 0.264*** 0.120*** 0.089*** 0.056** 0.102***
(0.021) (0.019) (0.019) (0.015) (0.029) (0.016)ln(GDPus +GDPd) -0.281 -0.198 -0.309 -0.297*
(0.203) (0.144) (0.226) (0.164)ln(GDPus −GDPd)2 0.084 0.091 0.153 0.133
(0.102) (0.073) (0.116) (0.082)ln(Skill Difference) -0.026 -0.093 -0.152* 0.082
(0.098) (0.079) (0.089) (0.139)ln(Trade Costs) 0.002 0.002 0.018 -0.024
(0.022) (0.016) (0.016) (0.025)BIT -0.932* -0.814* -0.831** 0.439
(0.498) (0.489) (0.419) (0.813)FTA -0.155 -0.129* -0.056 -0.285*
(0.108) (0.069) (0.071) (0.160)Exchange Rate 0.0006 0.00016 0.00001 -0.00002
(0.000) (0.0003) (0.0001) (0.0001)Parent FE YES YES YES YES YES YESYear FE YES YES YES YES YES YESN 15092 15092 15092 15092 4678 10414R-sq 0.1722 0.2646 0.1589 0.1779 0.2771 0.2295First Stage F-Stat - - 412.66 443.21 206.88 341.83Endog Test P-Val - - 0.0089 0.0081 0.0096 0.0084
Notes: Documents the effects of BTT-induced changes in foreign-affiliate employment on domestic employment of multinationalfirms in high RID industries. Columns (5) and (6) respectively restrict the sample to parent firms that did and did notopen new affiliates in countries newly receiving a BTT. First-stage F-statistics are large for all IV specifications, though therelevant F-statistics for weak-instrument concerns appear in columns (2) and (5) of Table 4 (see text for discussion). In all IVspecifications, the equality of OLS and IV is rejected. Standard errors clustered by parent firm and year are in parentheses.*,**, and *** indicate significance at the 10, 5, and 1 percent levels, respectively.
22
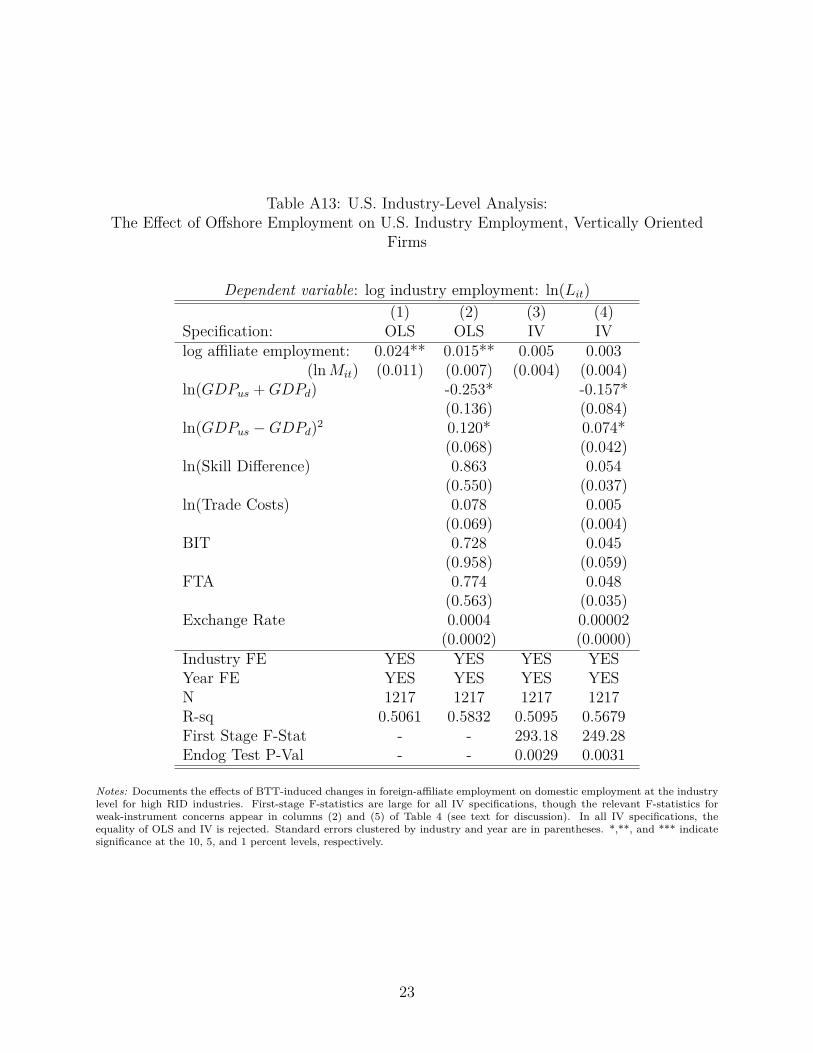
Table A13: U.S. Industry-Level Analysis:The Effect of Offshore Employment on U.S. Industry Employment, Vertically Oriented
Firms
Dependent variable: log industry employment: ln(Lit)(1) (2) (3) (4)
Specification: OLS OLS IV IVlog affiliate employment: 0.024** 0.015** 0.005 0.003
(lnMit) (0.011) (0.007) (0.004) (0.004)ln(GDPus +GDPd) -0.253* -0.157*
(0.136) (0.084)ln(GDPus −GDPd)2 0.120* 0.074*
(0.068) (0.042)ln(Skill Difference) 0.863 0.054
(0.550) (0.037)ln(Trade Costs) 0.078 0.005
(0.069) (0.004)BIT 0.728 0.045
(0.958) (0.059)FTA 0.774 0.048
(0.563) (0.035)Exchange Rate 0.0004 0.00002
(0.0002) (0.0000)Industry FE YES YES YES YESYear FE YES YES YES YESN 1217 1217 1217 1217R-sq 0.5061 0.5832 0.5095 0.5679First Stage F-Stat - - 293.18 249.28Endog Test P-Val - - 0.0029 0.0031
Notes: Documents the effects of BTT-induced changes in foreign-affiliate employment on domestic employment at the industrylevel for high RID industries. First-stage F-statistics are large for all IV specifications, though the relevant F-statistics forweak-instrument concerns appear in columns (2) and (5) of Table 4 (see text for discussion). In all IV specifications, theequality of OLS and IV is rejected. Standard errors clustered by industry and year are in parentheses. *,**, and *** indicatesignificance at the 10, 5, and 1 percent levels, respectively.
23
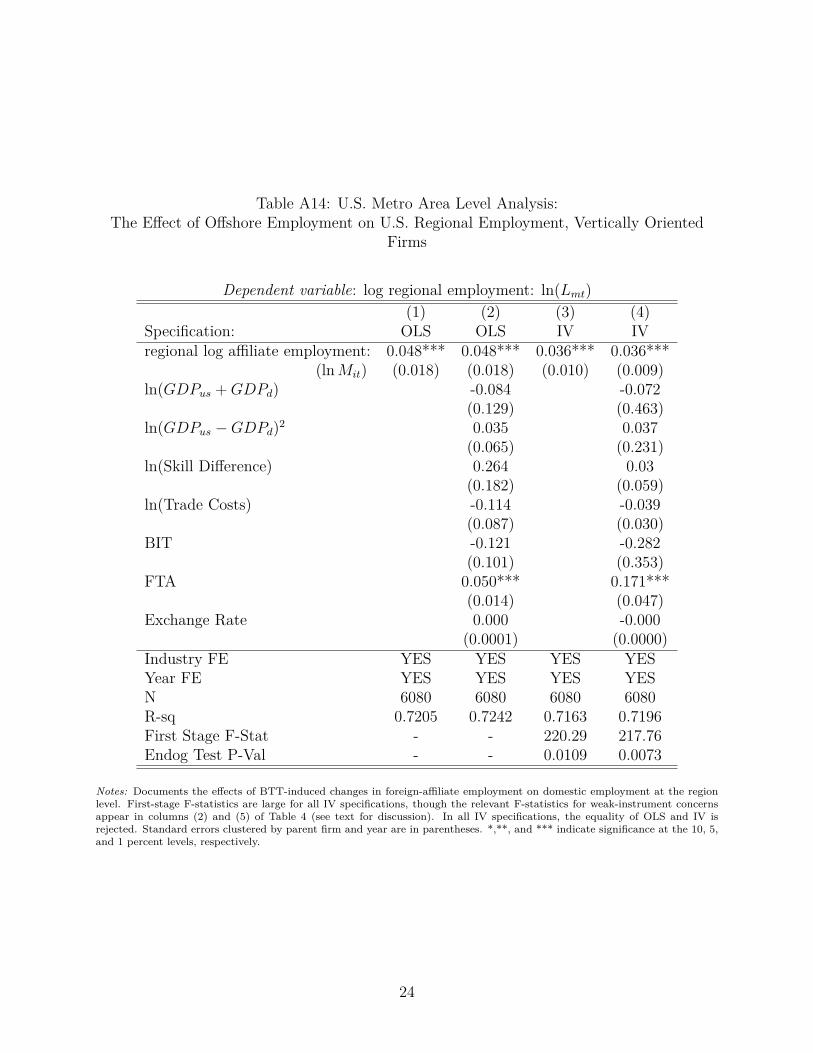
Table A14: U.S. Metro Area Level Analysis:The Effect of Offshore Employment on U.S. Regional Employment, Vertically Oriented
Firms
Dependent variable: log regional employment: ln(Lmt)(1) (2) (3) (4)
Specification: OLS OLS IV IVregional log affiliate employment: 0.048*** 0.048*** 0.036*** 0.036***
(lnMit) (0.018) (0.018) (0.010) (0.009)ln(GDPus +GDPd) -0.084 -0.072
(0.129) (0.463)ln(GDPus −GDPd)2 0.035 0.037
(0.065) (0.231)ln(Skill Difference) 0.264 0.03
(0.182) (0.059)ln(Trade Costs) -0.114 -0.039
(0.087) (0.030)BIT -0.121 -0.282
(0.101) (0.353)FTA 0.050*** 0.171***
(0.014) (0.047)Exchange Rate 0.000 -0.000
(0.0001) (0.0000)Industry FE YES YES YES YESYear FE YES YES YES YESN 6080 6080 6080 6080R-sq 0.7205 0.7242 0.7163 0.7196First Stage F-Stat - - 220.29 217.76Endog Test P-Val - - 0.0109 0.0073
Notes: Documents the effects of BTT-induced changes in foreign-affiliate employment on domestic employment at the regionlevel. First-stage F-statistics are large for all IV specifications, though the relevant F-statistics for weak-instrument concernsappear in columns (2) and (5) of Table 4 (see text for discussion). In all IV specifications, the equality of OLS and IV isrejected. Standard errors clustered by parent firm and year are in parentheses. *,**, and *** indicate significance at the 10, 5,and 1 percent levels, respectively.
24

A.6 Imputation in CBP Employment DataWhen the size of a particular cell would risk violating data confidentiality requirements,the County Business Patterns data report an employment range rather than the preciseemployment count. This issue does not arise in the industry-level analysis in Section 4.2.3,but does appear in the county-level data that we use to generate metro-area employmentin Section 4.2.4. The results presented in the main text (Table 9) utilize an imputationprocedure that replaces the employment ranges with their midpoints. For example, whenthe CBP data report an employment range of 0-19 employees, we impute a value of 10. Weuse the midpoint of each reported range and impute 175,000 employees when the CBP datareport employment ≥ 100,000.
In order to ensure that this imputation procedure is not substantively affecting our find-ings, Table A15 presents metro-area results in which we treat the suppressed employmentvalues as zeros rather than imputing them at the midpoint of the reported ranges. Compar-ing against Table 9, the results are quite similar, with the more careful imputation in themain text implying somewhat smaller magnitudes, but a similar qualitative interpretation.
25

Table A15: U.S. Metro Area Level Analysis:The Effect of Offshore Employment on U.S. Regional Employment
Alternative Imputation
Dependent variable: log regional employment: ln(Lmt)(1) (2) (3) (4)
Specification: OLS OLS IV IVregional log affiliate employment: 0.043*** 0.042*** 0.026** 0.025***
(lnMit) (0.012) (0.013) (0.005) (0.005)ln(GDPus +GDPd) 0.201 0.111*
(0.210) (0.065)ln(GDPus −GDPd)2 -0.132 -0.067**
(0.070) (0.033)ln(Skill Difference) 0.336* 0.110*
(0.191) (0.064)ln(Trade Costs) -0.011 0.002
(0.068) (0.022)BIT 0.06 0.042
(0.129) (0.044)FTA 0.268*** 0.096***
(0.099) (0.035)Exchange Rate -0.0003* -0.000
(0.000) (0.000)Industry FE YES YES YES YESYear FE YES YES YES YESN 6080 6080 6080 6080R-sq 0.7229 0.7271 0.7189 0.7239First Stage F-Stat - - 182.15 175.54Endog Test P-Val - - 0.0211 0.0265
Notes: Documents the effects of BTT-induced changes in foreign-affiliate employment on domestic employment at theregion level. Suppressed county employment values in the County Business Patterns are treated as zeros when computingregional employment. See Table 9 for the results using a more careful imputation. First-stage F-statistics are large for all IVspecifications, though the relevant F-statistics for weak-instrument concerns appear in columns (2) and (5) of Table 4 (seetext for discussion). In all IV specifications, the equality of OLS and IV is rejected. Sample covers 1987-2007. Standard errorsclustered by parent firm and year are in parentheses. *,**, and *** indicate significance at the 10, 5, and 1 percent levels,respectively.
26

B Supplemental Theoretical and Econometric Results
B.1 Detailed Model of Double TaxationIn this section, we consider double taxation in the context of the U.S. corporate tax, demon-strating the conditions under which we can model double taxation as a proportional increasein the costs of foreign affiliate employment, τcti in equation (5) of the main text.
The U.S. taxes worldwide profits, but provides a credit for foreign tax liabilities in aneffort to avoid double taxation. However, the U.S. offers only a limited credit, such that amultinational firm cannot claim a credit larger than the tax the U.S. would levy on foreignearnings (otherwise the U.S. tax authority would effectively subsidize foreign tax liabilities).The limited tax credit for foreign taxes paid can then subject the multinational firm todouble taxation. To see how the incidence of double taxation arises with a limited foreigntax credit, here we derive the total taxes paid in each jurisdiction and the total tax liabilityof the multinational enterprise
Let φ denote the share of revenue that is remitted to the U.S. parent firm.34 The domesticand foreign tax rates are t and t∗, where we assume t > t∗ reflecting the fact that the U.S.has one of the highest corporate tax rates in the world. Moreover, the foreign tax authoritycollects an additional withholding tax on royalties, interest, and dividends. We denote theforeign withholding rate by h∗.
Given this notation, the taxes paid to the foreign tax authority are the corporate tax onthe income of the affiliate plus the withholding tax:
t∗[(1− φ)r − wcm]︸ ︷︷ ︸foreign corporate tax
+ h∗φr︸ ︷︷ ︸withholding tax
. (19)
The U.S. tax liability for the multinational enterprise is the tax on worldwide income lessany credit for foreign taxes paid. The tax on worldwide income can be written as t[φr −ωs] + t[(1−φ)r−wcm] to reflect the domestic and foreign components of worldwide income.The firm is then eligible for a foreign tax credit designed to avoid double taxation, butthis credit is limited so that it can not exceed the U.S. tax liability on foreign activities,t[(1− φ)r − wcm]. Thus, if this value is smaller than the foreign tax payments in (19), theforeign tax credit limit binds, and the firm faces double taxation. Combining terms, the U.S.tax liability, including the potentially limited foreign tax credit is
t[φr − ωs] + t[(1− φ)r − wcm]︸ ︷︷ ︸U.S. worldwide corporate tax
−min{t∗[(1− φ)r − wcm] + h∗φr, t[(1− φ)r − wcm]}︸ ︷︷ ︸foreign tax credit
,
(20)Summing the foreign and domestic tax liabilities yields the total tax burden of the multi-
national firm.
t[φr − ωs− wcm] + max{0, t∗[(1− φ)r − wcm] + h∗φr − t[(1− φ)r − wcm]} (21)34In the context of the Antras and Helpman (2004) model outlined in Section 4.1, the U.S. parent earns a
share φ ≡ [δαic +β(1− δαi
c )] of total revenue, while the foreign affiliate earns a share 1−φ ≡ (1−β)(1− δαic ).
Yet, the following discussion about limits on foreign tax credits and the efficacy of BTTs holds for anydetermination of φ.
27

The first term reflects the U.S. worldwide tax system, which in the absence of double taxationimposes the U.S. tax rate on global taxable income. The second term reflects the possibilityof double taxation, which occurs only when the foreign tax credit limit binds, increasingthe total tax liability above what the U.S. worldwide system would impose. This expressionmakes clear two important points. First, higher withholding tax rates, h∗, make it morelikely that double taxation occurs, which explains why BTTs aim to reduce withholdingrates as a mechanism for lowering double taxation. Second, the double taxation relief froma reduction in the withholding tax rate is increasing in φr; i.e., the total payments to theU.S. parent. This fact motivates our delineation between high and low RID industries as wemeasure treatment arising from BTTs.
We now consider the implications of this tax structure for the multinational parents’ andaffiliates’ employment choices. We assume that any foreign tax credit goes to the affiliate fortheir foreign tax payments. Generally, we require only that any burden of double taxationto the parent is uncorrelated with the change in withholding rates following a new BTT. Inthis case, the parent’s problem is
maxsφr − ωs− t[φr − ωs]. (22)
Note that the withholding tax rate h∗ does not enter the parent’s problem in (22), explicitlydemonstrating that the effects of BTTs in reducing withholding rates are excluded fromparent hiring decisions. Solving the parent’s problem and reintroducing subscripts yields thefollowing first order condition.
ln st(f) =
ln ηi + lnαi − lnω − ln(1− t) + αi[ln θ(f)− (1− ηi) ln(1− ηi)] + ln(φci(1− t))1− αiηi︸ ︷︷ ︸
ψfci
− αi − µ1− αiηi
lnXti︸ ︷︷ ︸ϑti
+ αi(1− ηi)1− αiηi
lnmct(f) . (23)
We can collect the terms in the first line on the right side of the equal sign in an affiliate-levelfixed effect, ψfci, and the first term on the second line into an industry-time fixed effect, ϑti.This expression corresponds to (6) in the main text.
The affiliate pays the foreign tax and faces partial reimbursement when the foreign taxcredit limit is reached. Specifically, the affiliate’s problem is
maxm
(1− φ)r − wcm− t∗[(1− φ)r − wcm]− h∗φr (24)
+ min{t∗[(1− φ)r − wcm] + h∗φr, t[(1− φ)r − wcm]}.
When the foreign tax credit does not bind, the affiliate is fully reimbursed for its tax pay-ments and the withholding tax rate drops out of the problem. In this case, a change in thewithholding tax resulting from a BTT would have no effect on firm incentives, and we wouldnot observe the various empirical effects that we document. If instead double taxation is
28
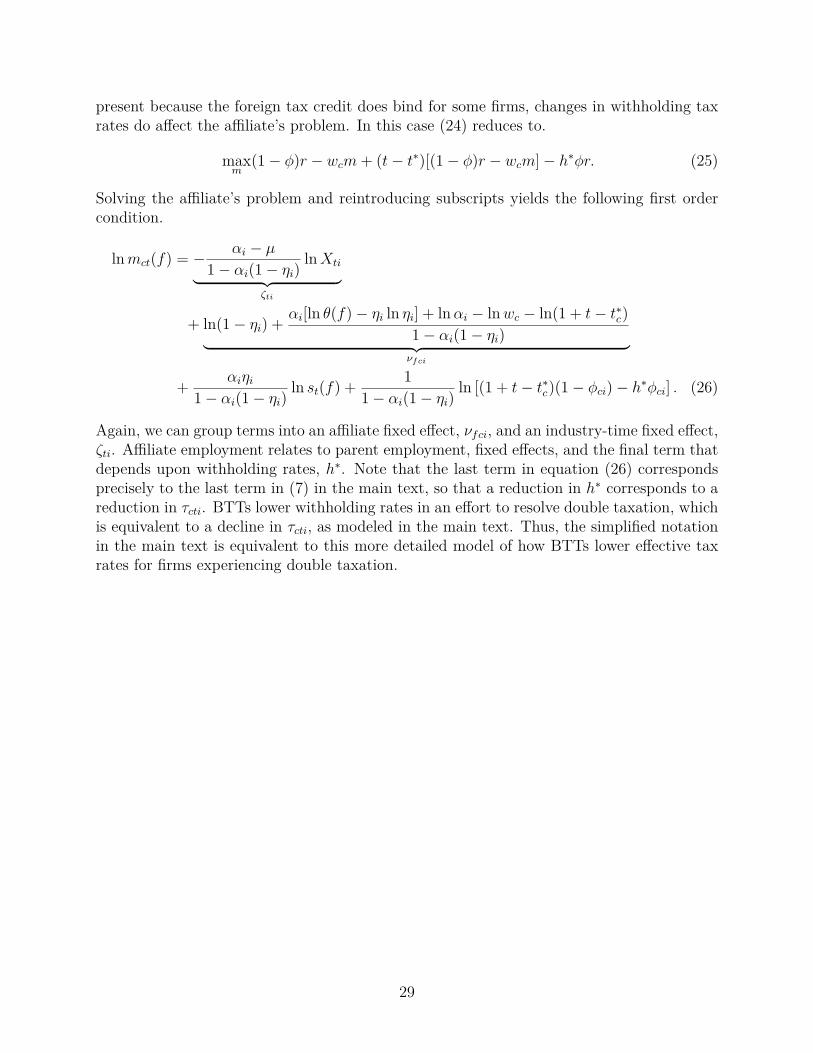
present because the foreign tax credit does bind for some firms, changes in withholding taxrates do affect the affiliate’s problem. In this case (24) reduces to.
maxm
(1− φ)r − wcm+ (t− t∗)[(1− φ)r − wcm]− h∗φr. (25)
Solving the affiliate’s problem and reintroducing subscripts yields the following first ordercondition.
lnmct(f) = − αi − µ1− αi(1− ηi)
lnXti︸ ︷︷ ︸ζti
+ ln(1− ηi) + αi[ln θ(f)− ηi ln ηi] + lnαi − lnwc − ln(1 + t− t∗c)1− αi(1− ηi)︸ ︷︷ ︸νfci
+ αiηi1− αi(1− ηi)
ln st(f) + 11− αi(1− ηi)
ln [(1 + t− t∗c)(1− φci)− h∗φci] . (26)
Again, we can group terms into an affiliate fixed effect, νfci, and an industry-time fixed effect,ζti. Affiliate employment relates to parent employment, fixed effects, and the final term thatdepends upon withholding rates, h∗. Note that the last term in equation (26) correspondsprecisely to the last term in (7) in the main text, so that a reduction in h∗ corresponds to areduction in τcti. BTTs lower withholding rates in an effort to resolve double taxation, whichis equivalent to a decline in τcti, as modeled in the main text. Thus, the simplified notationin the main text is equivalent to this more detailed model of how BTTs lower effective taxrates for firms experiencing double taxation.
29

B.2 Model with CES ProductionIn Section 4 we consider a model with a Cobb-Douglas production function, following Antrasand Helpman (2004). In this section we derive the relationship between foreign affiliateemployment and domestic parent employment using a CES production production function.In this more general setting, the effect of affiliate employment on parent employment maybe positive or negative, depending upon the relative size of scale and substitution effects.
We suppress subscripts to simplify notation. The CES production function is given by
x = θ(ηsρ + (1− η)mρ)1ρ . (27)
where σ = 11−ρ indicates the elasticity of substitution between domestic and foreign labor.
The parent’s problem is maxsAsr − ωs, where r = Xµ−αxα, and As ≡ δα + β(1 − δα).Let Bs ≡ AsX
µ−ααηθρ , so that the parent’s first-order condition can be written
Bsxα−ρsρ−1 = ω. (28)
The affiliate’s problem is maxmAmr − wcm, where Am ≡ (1− β)(1− δα).Let Bm ≡ AmX
µ−αα(1− η)θρ, so the affiliate’s first-order condition can be written
Bmxα−ρmρ−1 = wc. (29)
Combining the first-order conditions, we can solve for parent hiring s as a function ofparameters, which yields
s = B1
1−αs ω
−11−α θ
α−ρ1−α
(η + (1− η)
(ωBm
wcBs
)σ−1) α−ρρ(1−α)
(30)
Our goal is to determine the effect of a change in the cost of foreign hiring wc on s (notethat the effect of a change in wc is isomorphic to a change in the τ in the main body of thetext). Thus, we want to obtain
d ln sd lnwc
= d ln sdwc
wc. (31)
We first calculate
d ln sdwc
= α− ρρ(1− α) ·
1η + (1− η)
(ωBmwcBs
)σ−1 · (1− η)(ωBm
Bs
)σ−1(1− σ)w−σc . (32)
Then, simplifying and using 1−σρ
= −σ and the expression in (31) we have
d ln sd lnwc
= (ρ− α)︸ ︷︷ ︸determines sign
· (1− η)σ1− α︸ ︷︷ ︸>0
· wσ−1c
η + (1− η)(ωBmwcBs
)σ−1
︸ ︷︷ ︸>0
(33)
The sign of (33) is determined by the sign of ρ−α and may generally be positive or negative.
30

The parameter-dependent relationship between foreign affiliate hiring and parent employ-ment is intuitive. The substitution effect between s and m contributes a positive componentto (33), since a decrease in wc drives a decrease in the demand for s, holding output fixed.As ρ approaches 1, the inputs become stronger substitutes, so this substitution effect growsin magnitude. The scale effect contributes a negative component to (33), since a decreasein wc drives a decrease in output price, an increase in output quantity, and an increase ins. The demand elasticity is 1
1−α , so as α gets larger, demand becomes more elastic, andthe scale effect gets larger. The balance between ρ and α corresponds to the balance be-tween substitution and scale effects determining the overall sign of the effect. Under theCobb-Douglas restriction ρ = 0, so ρ − α < 0 and a decrease in offshore costs increasesdomestic employment. Our empirical results confirm that scale effect dominates on averagein our sample, and additional offshore hiring by U.S. multinational firms leads to greateremployment at domestic parent firms.
31

B.3 SmearingIn Section 4.2.2, we discuss the need to aggregate affiliate-level predicted values from thefirst-stage regression in (11) up to the parent-firm level. Because this aggregation involvesnonlinear transformations, we must account for the sampling distribution of the affiliate-levelpredictions using a procedure known as “smearing.”
The affiliate-level first-stage regression in (11) yields predicted values for log affiliateemployment, lnmat. Our objective is to generate an unbiased estimate of log total affili-ate employment at the parent firm level, lnMft, where Mft ≡
∑a∈f mat. Rewriting this
aggregation definition to incorporate logs,
lnMft = ln∑a∈f
exp (lnmat) . (34)
This expression makes clear that there are three steps in constructing an estimate of lnMft
from the constituent lnmat.First, we generate unbiased estimates of mat = exp (lnmat). Assume that the errors
in (11) are i.i.d. and normally distributed, εat ∼ N(0, σ2), and refer to the regressors andcoefficients on the right side of (11) as Xaβ. Then mat is lognormally distributed withlocation parameter Xaβ and variance parameter σ2. Thus, E[mat] = exp
(Xaβ + σ2
2
),
which we can estimate as mat = exp(Xaβ + σ2
2
). Similarly, we can use the variance of the
lognormal distribution to estimate ˆvar(mat) = (exp(σ2)− 1) · exp(2Xaβ + σ2).Second, we must sum across sibling affiliates to estimate Mft ≡
∑a∈f mat. Since the
summation operator is linear, we can construct
Mft =∑a∈f
mat =∑a∈f
exp(Xaβ + σ2
2
). (35)
Assuming zero covariance between errors for sibling affiliates, the variance estimate for Mft
isˆvar(Mft
)=∑a∈f
ˆvar(mat) =∑a∈f
[(exp(σ2)− 1) · exp(2Xaβ + σ2)
]. (36)
Finally, we need to estimate the log of total affiliate employment at the parent level,lnMft. Note that the sum of lognormal random variables is well approximated by a lognormaldistribution (Mehta et al., 2007). Thus, we simply implement the reverse of the lognormaltransformation from the first step. Therefore, our estimate of parent-level log total affiliateemployment is
lnMft = lnµ− 12 ln
(s2
µ2 + 1), (37)
where µ = Mft =∑a∈p
exp(Xaβ + σ2
2
)
and s2 = ˆvar(Mft
)=∑a∈p
[(exp(σ2)− 1) · exp(2Xaβ + σ2)
].
32

Our parent-level estimates of predicted total affiliate employment are constructed following(37). Because the final step of this process involves an approximation, we implementedalternatives including a naive plug-in estimate and a nonparametric smearing procedurefollowing Duan (1983), finding very similar results.
33

ReferencesPol Antras and Elhanan Helpman. Global sourcing. Journal of Political Economy, 112(3):
552–580, 2004.
Naihua Duan. Smearing estimate: A nonparametric retransformation method. Journal ofthe American Statistical Association, 78(383):605–610, 1983.
Neelesh Mehta, Jingxian Wu, Andreas Molish, and Jin Zhang. Approximating a sum ofrandom variables with a lognormal. IEEE Transactions on Wireless Communications, 6(7), 2007.
34