the king county family treatment court: what is it? what have we learned from our evaluation?
DESCRIPTION
Eric Bruns Mike Pullmann Ericka Wiggins University of Washington School of Medicine Division of Public Behavioral Health and Justice Policy www.uwhelpingfamilies.org. The King County Family Treatment Court: What is it? What Have We Learned from our Evaluation?. - PowerPoint PPT PresentationTRANSCRIPT

11
Eric BrunsMike Pullmann Ericka Wiggins
University of Washington School of MedicineDivision of Public Behavioral Health and Justice Policy
www.uwhelpingfamilies.org
Jill MurphyAubrey Glines
King County Family Treatment CourtKing County Superior Court
University of WashingtonEducation Series for Child Welfare Professionals
April 11, 2012
The King County Family Treatment Court:What is it? What Have We Learned from our Evaluation?

Substance Abuse and Child Welfare
• 80% of children in foster care have a parent with a substance abuse problem– Parents with substance problems have the
lowest rate of reunification with their children– Their children stay in foster care over twice as
long on average
• Initiation of treatment takes an average of 4-6 months after entry to CW system
2

The need for a solution
• Treatment completion is associated with:– Less time in foster care– Reunification rates
• More rapid treatment entry and longer treatment duration is associated with:– Treatment completion– Treatment success– Less time in foster care– Reunification rates
3

Drug Courts
• Interdisciplinary, coordinated, team-based approach to avoiding future involvement in (criminal) justice system
• As of 2010: 2,459 drug courts in U.S.– Number increased by 50% from 2004 – 2010
• Seven meta-analyses– Rigor of studies often lacking; however, positive
effects found• Positive treatment outcomes• Reduced re-arrest
4

Family Treatment Drug Courts
• Apply drug court approach to cases of child abuse and neglect
• Goal = enhance possibility of family reunification within legal timeframes by:– Facilitating entry and completion of treatment– Supporting parent to remain abstinent– Improving child safety/family functioning
• As of 2009, NADCP reports 322 FTDCs– 13% of all drug courts in U.S.– Increase of 66% from 2005
5

Today’s presentation
• The King County Family Treatment Court– Goals– Population of focus– Program description– Case flow process
• What we have learned from an evaluation– Process evaluation – Outcome evaluation
6

The King County Family Treatment Court
Jill Murphy
KCFTC Program Supervisor
Aubrey Glines
KCFTC Graduate
7


9
King County FTC Primary Goals• Children have safe and permanent homes within
permanency planning guidelines;• Families of color have outcomes from
dependency cases similar to families not of color;
• Parents are better able to care for themselves and their children and seek resources to do so; and
• The cost to society of dependency cases involving substances is reduced.
9

1010
KCFTC PROCESSES AND FUNCTIONS•Comprehensive SB Assessment•High quality, appropriate CD Services•Timely/effective MH and other services•Effective care planning and management•Expanded and more frequent visitation•Consistent, timely incentives & sanctions•Random UA Screens•Effective pre-hearing case conferences•Effective judicial interaction
SHORT-TERM OUTCOMES•Eligibility/enrollment completed quickly•Enrollment in appropriate CD services•Parents compliant with/complete treatment•Parents ultimately able to remain sober•Parents/children more fully engaged in svcs•Parents/children receive needed services•Decreased placement disruptions•Parents compliant with court orders•Less negative effect on child well-being•Less disruption of child-parent bonds•Increased family reunification rates•Earlier determination. of alternate placement options
NATIONAL BEST PRACTICES•Communication bw Court and providers•Judge plays active role in Tx process•Judge responds to positive & noncompliant beh.•Mechanisms for shared decision making•Accountability for Tx services•Strategy for responding to noncompliance•MIS allow data to be assembled/reviewed•Enhancement of due process•Team members provided adeq resources
The King County Family Treatment Court
11
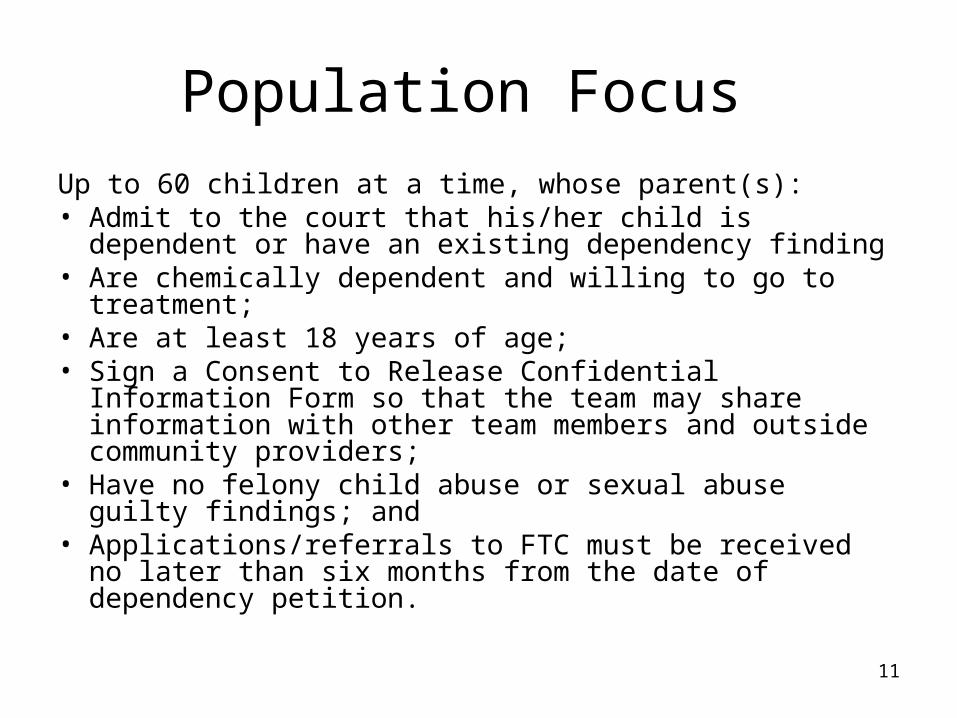
Population Focus
Up to 60 children at a time, whose parent(s):• Admit to the court that his/her child is dependent or have
an existing dependency finding• Are chemically dependent and willing to go to treatment;• Are at least 18 years of age;• Sign a Consent to Release Confidential Information
Form so that the team may share information with other team members and outside community providers;
• Have no felony child abuse or sexual abuse guilty findings; and
• Applications/referrals to FTC must be received no later than six months from the date of dependency petition.

12
KCFTC Program Model• Parents agree to enter a more intensive court process
– Expectation = 12 mos – 2 years duration• Case management to ensure connection to appropriate
chemical dependency treatment• Cross-disciplinary pre-hearing staffings to present a
unified approach at hearings• Case review hearings every other week until frequency
can be stepped down• Treatment Liaison who monitors parent’s progress in CD
and MH treatment and provides case management• Formal Wraparound Process for approx 1/3 of families
(15 at a time)• Social Workers dedicated to the FTC with reduced
caseloads (12:1)
13
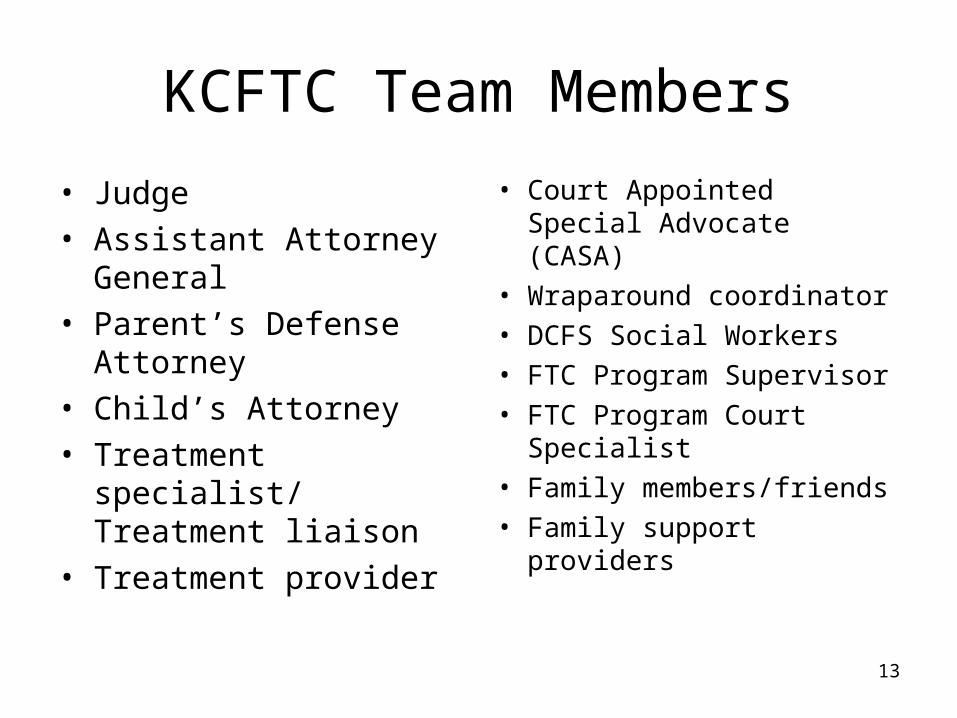
KCFTC Team Members
• Judge• Assistant Attorney
General• Parent’s Defense
Attorney• Child’s Attorney• Treatment specialist/
Treatment liaison• Treatment provider
• Court Appointed Special Advocate (CASA)
• Wraparound coordinator• DCFS Social Workers• FTC Program Supervisor• FTC Program Court
Specialist• Family members/friends• Family support providers

1414
Placement in Shelter Care
Dependency Petition Filed
Shelter Care Hearing(w/in 72 hours of place-ment or filing, whichever
occurs first)
Pre-TrialConference(21 days prior to
fact-finding)
Fact-Finding Hearing
(w/in 75 daysof filing)
Disposition Hearing
(same day as or w/in 14 days of dep finding)
Review Hearing(the sooner of 90 days from Dispo. or 6 mos.
from date of placement)
Permanency Planning Hearing(12 months from date of placement & every 12
months thereafter)
Review Hearing(w/in 6 months after
permanency planning hearing)
PetitionApproved
DependencyContinued
Exit System
Yes
PermanencyGoal Achieved?
Yes
PermanencyGoal Achieved?
Petition forParental Rights Termination?
No
No
Petition forParental Rights Termination?
No
No
Petition for Termination of Parental Rights
Filed
Yes
Yes
PetitionDismissed
PetitionDismissed
PetitionDismissed
PetitionDismissed
30-Day Shelter Care Review(w/in 30 days of
placement)
Shelter Care Case Conf.(30 days prior to
fact-finding)
PetitionDismissed
Dept. supervision
continues for 6 mos.
Childreturned
home
Review Hearing
PetitionDismissed
Dependency Stipulated
Enter FTC*(See separate
flow chart)
Enter FTC*(See separate
flow chart)
Exit FTC w/o Permanency Goal Achieved
Exit FTC w/o Permanency Goal Achieved
Original Chart prepared by Michael Curtis on January 12,
2006
*There can be entry into FTC anytime after dependency is established as long as a referral is made to FTC within 6 months of the filed petition date.
*There can be entry into FTC anytime after dependency is established as long as a referral is made to FTC within 6 months of the filed petition date.
Juvenile Dependency Case Flow (noting FTC)

1515
FAMILY TREATMENT COURT CASE PROCESSING FLOW CHART
Check In Hearing: Set for following week after positive/missed UA or noncompliance w/ tx
Compliance Clock Hearing: Can be applied
after 5th response and set 60 days out from
current hearing
Motion Hearing: Can be set anytime there is a contested issue. Not
heard during regular FTC calendar
Discharge/Opt Out Hearing: Dependency
dismissed or discharged
to regular dependency
Other FTC Hearings:
Box Color Legend:
Red: Not a hearing
Green: Beginning and end of FTC Process
Blue: FTC Review Hearings
Graduated Blue: Does not occur on every case
Orange: Not unique to FTC
Purple: Unique to FTC and can occur throughout FTC process

16

17

Evaluation of the King County Family Treatment Court
Division of Public Behavioral Health and Justice Policy
University of Washington School of Medicine
UWHelpingFamilies.org
18

Needs for the Evaluation
• Provide information needed by the KCFTC and its stakeholders
• Expand the research base on FTDCs– Do FTDCs achieve their stated goals and outcomes?– Do they contribute positively to federal priorities for
CW systems?– Do common criticisms of drug courts apply to FTDCs?
• Widening the net of involvement in justice system• Mandate longer involvement in justice system• Limit access to or completion of treatments• Not cost effective
19

20
Summary of the FTDC Literature• Four studies of FTC model (Boles et al., 2007; Edwards et al.,
2005; Green et al., 2007, 2009; Worcel et al., 2008;)• All four studies show positive outcomes:
– Parents enrolled in treatment more quickly– Parents received treatment services for a longer mean duration– Parents were more likely to successfully complete treatment– Children placed in permanent living situations more quickly– Children more likely to be reunified (e.g., 42% vs. 27% at 2
years; 70% vs. 45% at 3-4 years)• No study found between-group differences in future abuse/neglect
reports

21
Summary of the FTDC Literature• NPC Research, the most active evaluators of
FTCs and drug treatment courts, has completed several cost-benefit analyses at sites across the nation. The table below summarizes their findings:
Location Cost savings per participant
Return on investment
Areas of savings
Harford Co., MD
$12,000 over 1 year
350% Foster care days, Criminal justice, Court Cases
Jackson Co., OR
$5,593 over 4 years
106% Foster care days, Probation/Parole, Court Cases
CA "Court 1" $1,657 over 4 years
130% Not provided
CA "Court 2" $2,141 over 5 years
Not provided
Not provided
Baltimore, MD
$5,022 over 1 year
Not provided
Foster care days (did not examine other areas)

2222
Components of the KCFTC Evaluation
• Process evaluation– Interviews with team members and
stakeholders, 2006 and 2008– Parent interviews, 2007-2009
• Outcomes evaluation– Analysis of child placement data from Children’s
Administration and adult treatment data from the Division of Behavioral Health and Recovery
• Cost-benefit analysis– Currently underway

Respondent Type N % N %
Advisory Group Member 8 21% 5 14%
DSHS Social Worker/Social Worker Supervisor 5 13% 5 14%
Court Appointed Special Advocate (CASA)/CASA Manager or Supervisor
7 18% 4 11%
Attorney (Parent or Child) 6 15% 6 16%
Judge 2 5% 3 8%
UW PCAP Representative 2 5% 1 3%
AAG /AAG Supervisor 1 3% 2 5%
Treatment Provider/Treatment Provider Superv. 4 10% 3 8%
FTC Coordinators/Specialists 2 5% 3 8%
Wraparound staff/supervisors 2 5% 1 3%
Other (e.g., Bailiff, Alumni) 1 3% 4 11%
2006 (n=39) 2008 (n=37)
Respondents

0%
10%
20%
30%
40%
50%
60%
70%
Overall Success of Accomplishing Goals"How successful do you feel the court has been in accomplishing its goals
overall?" 2006-2008 (n=38, 37)
2006 3% 3% 53% 34% 8%
2008 0% 5% 24% 62% 8%
Not at all successful
A little bit successful
Somewhat successful
Moderately successful
Extremely successful
2006: Mean= 3.4 Std. Dev= .793
2008: Mean= 3.73 Std. Dev= .693
0%
5%
10%
15%
20%
25%
30%
35%
40%
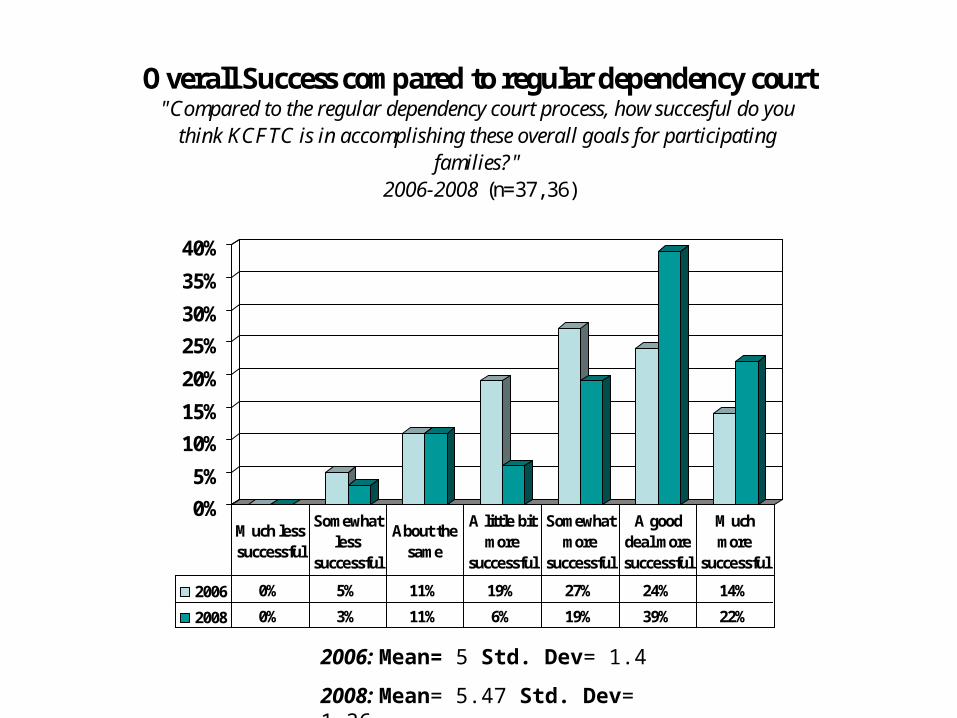
Overall Success compared to regular dependency court"Compared to the regular dependency court process, how succesful do you
think KCFTC is in accomplishing these overall goals for participating families?"
2006-2008 (n=37, 36)
2006 0% 5% 11% 19% 27% 24% 14%
2008 0% 3% 11% 6% 19% 39% 22%
Much less successful
Somewhat less
successful
About the same
A little bit more
successful
Somewhat more
successful
A good deal more successful
Much more
successful
2006: Mean= 5 Std. Dev= 1.4
2008: Mean= 5.47 Std. Dev= 1.36
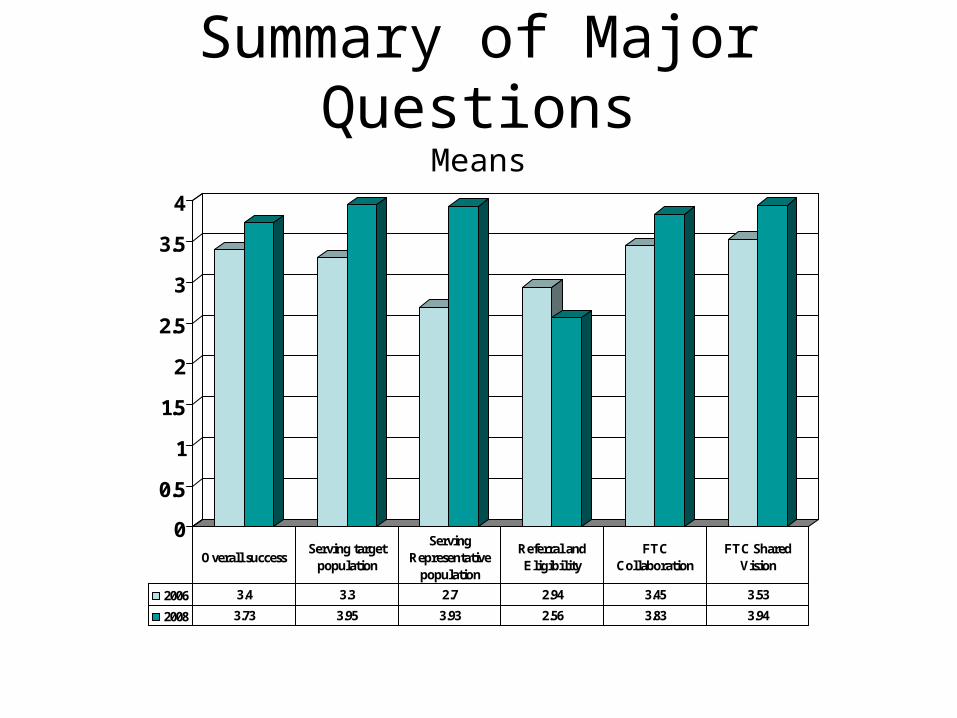
Summary of Major QuestionsMeans
0
0.5
1
1.5
2
2.5
3
3.5
4
2006 3.4 3.3 2.7 2.94 3.45 3.53
2008 3.73 3.95 3.93 2.56 3.83 3.94
Overall successServing target population
Serving Representative
population
Referral and Eligibility
FTC Collaboration
FTC Shared Vision
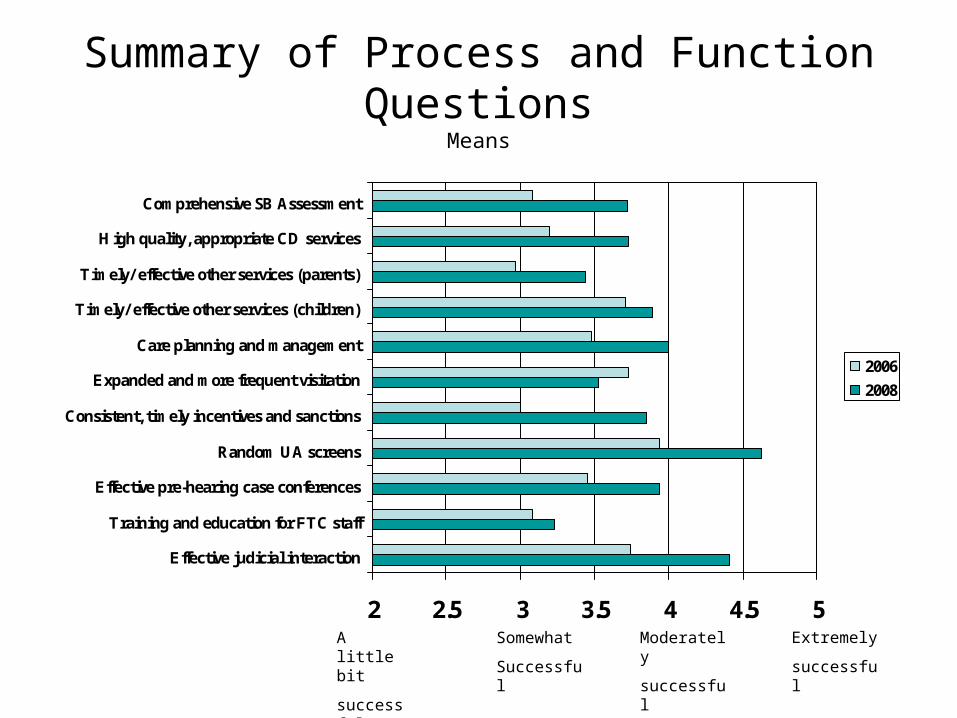
Summary of Process and Function Questions
Means
2 2.5 3 3.5 4 4.5 5
Effective judicial interaction
Training and education for FTC staff
Effective pre-hearing case conferences
Random UA screens
Consistent, timely incentives and sanctions
Expanded and more frequent visitation
Care planning and management
Timely/ effective other services (children)
Timely/ effective other services (parents)
High quality, appropriate CD services
Comprehensive SB Assessment
2006
2008
A little bit
successful
Somewhat
Successful
Moderately
successful
Extremely
successful

2828
What we learned from process evaluation
• Strengths– Strong opinions about the positive impact of KCFTC– Most processes and functions viewed as successfully being
accomplished by 2008• Relative Weaknesses
– Respondents less confident that goal of serving a representative population was being met
– Respondents believed client load was less than optimal (serving too few families)
– Mixed opinions on the amount of shared vision among team members
– Certain processes and functions:• Efficiency of eligibility determination and intake• Consistency and effectiveness of incentives and sanctions• Resources and training for KCFTC staff and team members

29
Outcome Evaluation:Research Question 1
• When compared to comparable non-FTDC participants, do FTDC participants differ in terms of their experience with the court and treatment system?
• Hypotheses – FTDC participants would:– Have more court hearings; – Enter treatment more often;– Enter treatment more quickly;– Attend treatment sessions more consistently;– Receive more treatment events;– Receive a broader treatment array;– Remain in treatment longer; and– Successfully discharge from treatment more often.

Research Question 2
• When compared to children of non-FTDC participants, do children of FTDC participants demonstrate more positive child welfare outcomes?
• Hypotheses – KCFTC children would:– Spend less time in out-of-home placements;– Reunify with their parents more often;– Get placed in permanent living situations more quickly;
and– Have fewer subsequent child welfare investigations and
founded investigations30
Research Question 3
• Do families of color have outcomes similar to families not of color?– Treatment outcomes– Child welfare outcomes
31

32
Outcome Evaluation• Administrative data:
– Treatment data from Division of Behavioral Health and Recovery – Child welfare data from Children’s Administration– Hearing data from King County Superior Court– Data collected September 2010
• Family Treatment Court group:– Selected all parents admitted to the FTC between March 2006
and October 2009
• Comparison group:– Eligible parents referred but not admitted to the Family
Treatment Court– Randomly selected a reasonable number– Statistically matched (propensity score methods) on caregiver
age and race, number of prior child welfare investigations, whether parent was in treatment at petition, number of prior treatment episodes, and primary drug of choice

33
Reasons why parent is in comparison group
Percent
Attorney not responding 42%
Over 6 months without referral 18%
Chose not to participate 8%
No known address/can’t locate/on run 7%
Other 8%
Reason missing 17%
34
44%
1%
6%
1%3%
1%
7%
1%
14%
23%
56%
15%
40%
59%
18%
Parentwhite
Parent ofcolor
AfricanAmerican
AmericanIndian
Asian Hispanic PacificIslander
Missing
Comparison
FTC
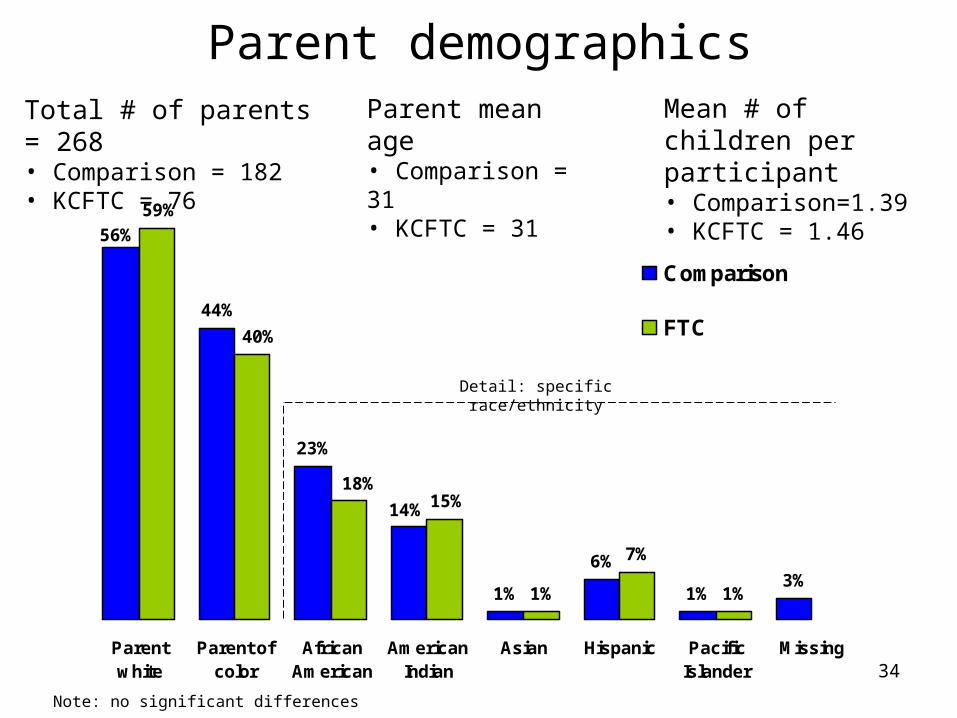
Parent mean age• Comparison = 31• KCFTC = 31
Mean # of children per participant• Comparison=1.39• KCFTC = 1.46
Detail: specific race/ethnicity
Total # of parents = 268• Comparison = 182• KCFTC = 76
Parent demographics
Note: no significant differences

35
Prior Investigations
Comparison %or Mean (SD)
KCFTC %or Mean (SD)
Any investigation completed prior to petition 83% 79%
Type of Allegation (index petition)
Neglect 83% 77%
Abuse 36% 36%
Prenatal Injury 8% 9%
Medical Neglect 8% 7%
Abandonment 2% 3%
Number of investigations prior to petition 2.1 (2.1) 1.8 (2.3)
Note: No statistically significant differences

36
50%
4%
10%
2%
26%
6%
1%
17%
50%
35%32%
38%
54%
46%
28%
Female Male White AfricanAmerican
Asian/PI NativeAmerican
Hispanic Unknown
Comparison
FTC
Child Mean Age• Comparison = 4.2• KCFTC = 3.5
Number of children• Comparison = 235• KCFTC = 89
Child demographics
Note: Statistically significant difference for Native American

3737
Status of FTC parent at time of data collection
FTC(n=76)
Discharged 33%
Graduated 26%
Currently enrolled 22%
Opted out of program 11%
Certificate of participation 7%
Dismissed 1%

38
Note on Analytic Approach…• 1). “Intent to treat”
– All parents who were admitted to FTC were included in all analyses, even if they opted out or had an unsuccessful outcome.
• No parent who was ever in FTC was ever included in the comparison group
• 2). Index Petition Date– “Time Zero” or comparable start point for both groups
was the petition date, not date of entry into FTC (comparison group had no date of entry)
These decisions likely result in more conservative findings

39
• Question 1: Do FTC participants have different treatment and court experiences than comparable non-FTC parents?– Do they experience more court hearings?– Are they more likely to enter treatment?– Do they enter treatment more quickly?– Are they more likely to attend treatment?– Do they remain in treatment longer?– Are they more likely to be successfully
discharged from treatment?

FTC parents have more court hearings
• 11 months post petition (mean follow up time for overall sample):– FTC: mean 16.1 (SD = 4.8) hearings– Comp: 5.9 (2.4)
– (p<.001)
• Review hearings were 4.5 times more frequent for FTC (accounted for 75% of all FTC hearings)
40

41
FTC parents are more likely to enter treatment
40%
20%
53% 52%59%
32%
88%84%
Admittedprior topetition
In treatmentat petition
Admittedafter
petition
Received txafter
petition
Comparison
FTC
Note: All differences statistically significant
FTC parents were 63% more likely to be admitted to treatment.

42
FTC parents enter treatment three times as fast
Of those parents entering treatment who were not already in treatment at the index petition, the median days until treatment entry were:
• Comparison: 120
• KCFTC: 36
Note: Statistically significant difference, p < .001
Pro
por
tion
not
adm
itted

43
FTC parents received broader service array
Of those admitted to any treatment
Comparison(n=52)
KCFTC(n=68)
Long term Residential* 46% 65%
Intensive Outpatient 40% 56%
Outpatient 50% 50%
Intensive Inpatient 44% 35%
Methadone 23% 27%
Recovery House* 2% 9%
Housing Support 8% 3%
* Statistically significant difference, p < .05

44
FTC parents received broader service array
Of those who received any treatment
Comparison(n=44)
KCFTC(n=64)
Individual therapy* 89% 100%
Group therapy 90% 97%
Case management 81% 89%
Urinalysis 43% 52%
Methadone/opiate subst. 15% 25%
Childcare* 11% 25%
* Statistically significant difference, p < .05

45
FTC parents received more treatment but were not
significantly more likely to attend treatment
Comparisonn=6,188
FTCn=8,357
Attended treatment episode 88% 90%
Excused by provider 6% 4%
No show, unexcused 8% 6%
Note: Statistically significant difference, p < .05
Avg. # of treatment events per person who received treatment:
• KCFTC = 116 (SD=97)
• Comparison = 51 (SD=57)
Note: Not statistically significant difference, p =.40

46
FTC parents remain in treatment longer
(Of those entering treatment; N=110)
Of those parents who entered treatment, the median days in treatment were:
• Comparison: 44
• FTC: 109
Note: Statistically significant difference at beginning and
middle, p < .05

47
Success in treatment
• FTC parents remained in treatment twice as long (median of 109 days compared to 44)
• FTC parents 37% more likely to be successfully discharged from treatment (72% compared to 54%)
Note: Statistically significant differences, p < .05

48
• Question 2: Do FTC families, compared to similar families who did not receive FTC services, have more positive child welfare outcomes? Specifically:– Do the children of FTC participants spend less time in
out of home placement?– Are the children of FTC participants placed in
permanent living situations more quickly overall?– Are FTC children more likely to have a permanent
placement?– Are FTC participants less likely to have subsequent
CPS investigations?

49
FTC children spend less time in out-of-home placements
Note: Statistically significant difference, p < .05
Median days in out of home placement:
• Comparison: 689
• FTC: 476

50
FTC children end involvement with the child welfare system more quickly
Note: Statistically significant difference, p < .05
Median days until permanent placement:
• Comparison: 813
• FTC: 718
51
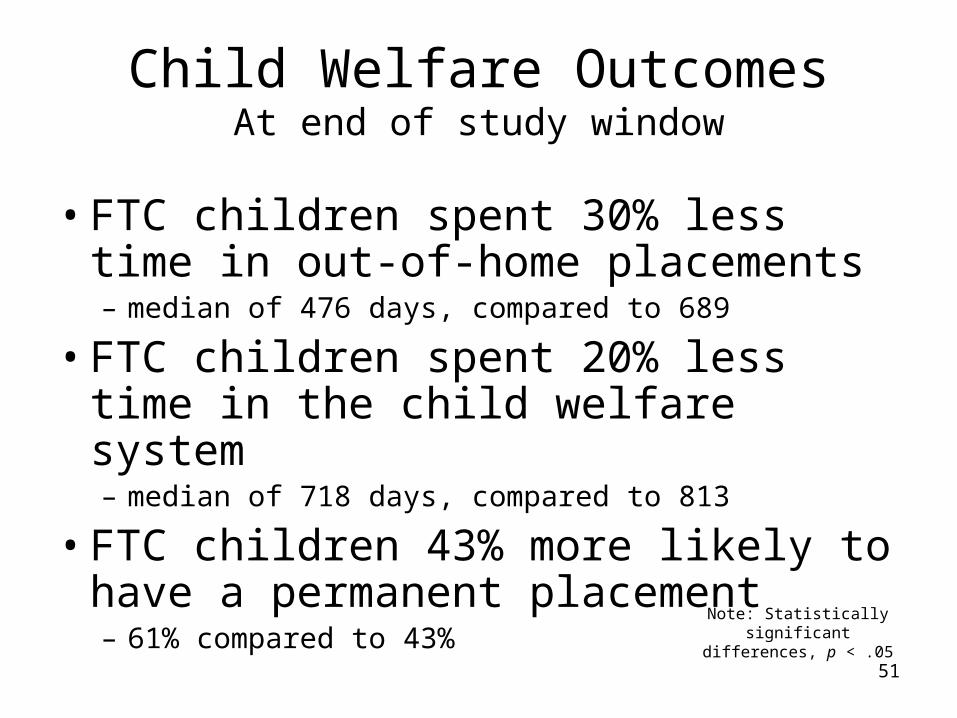
Child Welfare OutcomesAt end of study window
• FTC children spent 30% less time in out-of-home placements– median of 476 days, compared to 689
• FTC children spent 20% less time in the child welfare system– median of 718 days, compared to 813
• FTC children 43% more likely to have a permanent placement– 61% compared to 43%
Note: Statistically significant differences, p < .05

52
Placement types/ReunificationAt end of study window
• FTC children 2.5 times more likely to return to the custody of their parent (27% compared to 11%)
• FTC children half as likely to be in an out of home placement (24% compared to 46%)
• FTC children 1.9 times more likely to be returned home (in parental custody, reunified, trial home visit; 55% compared to 29%)
Note: Statistically significant differences, p < .05

53
Subsequent child welfare investigations: All parents
At end of study window
Note: Not statistically significant difference

54
Subsequent child welfare investigations: Only parents with child returned home
At end of study window
p=.09 p=.13

55
Subsequent child welfare investigations: All children
At end of study window
Note: Not statistically significant difference

56
Subsequent child welfare investigations: Only children who returned home
At end of study window
Subsequent removals: 3% for FTC group (n=1) vs. 13% for Comparison (n=3); p=.13

Findings similar to other FTDC studies
57
Current Study
Ashford, 20041
Boles et al., 2007
Green et al., 2007
Worcel et al., 2008
Burrus et al., 2011
% Enrolled in treatment
FTDCComp.
84%57%
97%67%
56%2
56%2
89%69%
82%59%
Mean days until treatment entry
FTDCComp.
6399
73182
84122
5788
Mean days in first treatment
FTDCComp.
14296
893
1143
303184
306148
13882
% completed treatment
FTDCComp.
72%54%
48%31%
64%2
64%2
44%34%
65%33%
64%36%
% children reaching permanency
FTDCComp.
61%43%
57%44%
35%38%
Mean days until permanency
FTDCComp.
475502
251341
359435
288228
249325
% children reunified
FTDCComp.
55%29%
52%36%
42%27%
43%32%
69%39%
70%35%
Subsequent founded investigation4
FTDCComp.
28%29%
23%15%
Subsequent removal from home5
FTDCComp.
3%13%
46%50%
11%23%

58
Question 3: Do families of color have outcomes similar to families
not of color?

59
Question 3: Do families of color have outcomes similar to families
not of color?

6060
52%
87%
56%
90%
Comparison FTC
Parent white
Parent white
Parent of
color
Parent of
color
Parents of color did not differ from white parents in their likelihood to:
• Be in treatment when petition was filed
• Be admitted to treatment after petition
• Schedule treatment episode after petition is filed
Note: No statistically significant differences
Admitted to treatment through DBHR after petition
All parents

6161
Note: White-white, p < .05
POC-POC, p < .10
81
5149
152
Comparison FTC
Parent white
Parent of color
Parent white
Parent of color
Median days until treatment entry
Of those not in treatment at petition

6262
Median days in first treatment
Note: White-white, p < .05
POC-POC, p < .10
FTC: POC-White mixed
43
77
151
53
Comparison FTC
Parent white Parent
of color
Parent white
Parent of color

6363
Length of time in first treatment episode
Of those parents entering treatment, the median days in first treatment episode:
• Comparison, parent of color: 43
• Comparison, white: 53
• KCFTC, parent of color: 77
• KCFTC, white: 151
Note: No statistically significant differences

6464
Percentage successfully completing a treatment episode
Of those receiving treatment
Note: POC-POC p < .05
No other significant differences
52%
68%
55%
82%
Comparison FTC
Parent white
Parent white
Parent of
color
Parent of
color
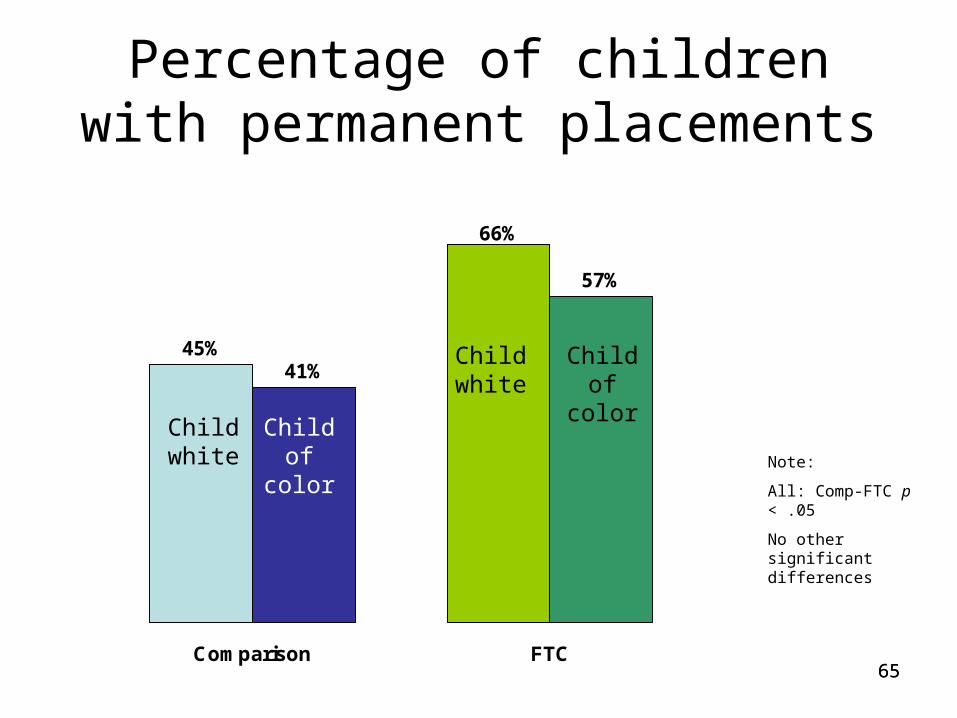
6565
Percentage of children with permanent placements
Note:
All: Comp-FTC p < .05
No other significant differences
45%
66%
41%
57%
Comparison FTC
Child white
Child of color
Child white
Child of color

6666
Percentage of children remaining in out of home placement
Note:
All: Comp-FTC p < .05
FTC: COC – Child white, p < .10
No other significant differences
45%
11%
47%
28%
Comparison FTC
Child white
Child of color
Child white
Child of color

67
Comparing FTC to regular court for families of color
• Generally indicate that families of color in FTC had more positive outcomes than families of color in the comparison group– 61% more likely to enter treatment– Enter treatment 63% faster– Remain in treatment nearly twice as long– 49% more likely to complete treatment– Children 39% more likely to be permanently placed– Children 54% more likely to be returned home

68
Comparisons by race in FTC
• Parents of color in the FTC were not significantly different than white parents on:– Percentage admitted to treatment– Speed of admission to treatment– Percentage successfully completing treatment
• Parents of color spent less time than white parents in treatment
• Children of color might be more likely to remain in out-of-home placements (borderline significance)

69
Outcome Study Summary• The King County Family Treatment Court is one of a
variety of problem-solving courts• Staff from several disciplines and agencies collaborate
on supervision and support• Stakeholders generally have positive opinions about the
development and functioning of the court• Parents have more successful substance use treatment
outcomes• Children are more likely to exit the child welfare system
and be returned to the care of their parents• Other research with similar findings to our research also
found significant long-term cost savings

Internal vs. External costs and benefits
Overall costs/benefits to society
County government
State government
Federal government
Participants
Child Welfare DSHS (treatment)
Citizens and communities
Family Treatment
Court
• External benefits underproduction of the service (i.e. too little Family Treatment Court)
• External costs overproduction of the service

71
Child Welfare
Placements
Caseworker time
Caregiver-child visitations
Substance Use and Mental Health treatment
DSHS-provided treatment services
Private pay or insurance treatment services
Justice System
Dependency court hearings
Adult contacts with law: prison, jail, criminal hearings, probation, etc.
Child contacts with law: prison, jail, criminal hearings, probation, etc.
Damages to victims
Non-monetary costs
Emotional pain from loss of child/parent
Broken communities
Emotional pain to victims
Others
Employment
Education
Physical health care
Public assistance
Costs and Benefits

72
Please contact us with any questions
Eric [email protected] Pullmann
Mark [email protected]
Jill [email protected]