the kansas next-generation land use/land cover … · the kansas next-generation land use/land...
TRANSCRIPT
ASPRS 2009 Annual Conference Baltimore, Maryland March 9-13, 2009
THE KANSAS NEXT-GENERATION LAND USE/LAND COVER MAPPING INITIATIVE
Dana Peterson, Research Assistant1 Jerry Whistler, Research Associate1
Chris Bishop, Graduate Research Assistant1, 2 Stephen Egbert, Associate Scientist, Associate Professor1, 2
Ed Martinko, Director, Professor1, 3 1Kansas Applied Remote Sensing Program
University of Kansas Lawrence, KS 66047
2Department of Geography 3Department of Ecology and Evolutionary Biology
University of Kansas Lawrence, KS 66045 [email protected] [email protected] [email protected] [email protected]
ABSTRACT
The Kansas Next-Generation Land Cover Mapping Initiative is a two-phase 18-month mapping endeavor to be accomplished over a three-year period. The mapping methodology uses a hybrid, hierarchical classification of multi-temporal, multi-resolution imagery (Landsat TM and MODIS NDVI time-series) to develop modified Anderson Level I and Anderson Level II land cover maps of Kansas.
During Phase I (July ’06 – Dec. ’07), a modified Level I land cover digital dataset was produced from multi-seasonal Landsat TM imagery using an unsupervised classifier. A formal accuracy assessment reported the map to have an overall accuracy level of 90.7%.
In Phase II (Jan. ’08 – June ’09), subclasses of cropland and grassland are being mapped using a decision tree classifier to produce a modified Level II digital dataset. The Kansas GAP database and the attributed USDA Common Land Unit (CLU) dataset were used for training and validation. MODIS NDVI imagery was used to map cropland subclasses and multi-seasonal Landsat TM imagery was used to map grassland subclasses. Cropland and grassland were separated using the 30-meter Level I map as a mask to isolate cropland pixels in the MODIS imagery and grassland pixels in the Landsat TM imagery. Using results from the decision tree classifier, cropland and grassland pixels in the Level I map will be reassigned to their respective subclasses to produce the 30-meter modified Anderson Level II map of Kansas. Preliminary classification results show the cropland map to have an average model accuracy of 93.7%.
Irrigation status is also being mapped during Phase II using time-series MODIS NDVI imagery, USDA Census of Agriculture data, and unattributed CLU boundaries. The average maximum NDVI value per CLU was calculated and used to identify irrigated cropland. Irrigation status will be added to the cropland subclasses. A formal accuracy assessment of the Level II map will be performed.
INTRODUCTION Land cover maps represent a snapshot in time, therefore periodic updates are a necessity to provide current
inventories of the landscape and to provide opportunities for identifying and monitoring changes. Using remotely sensed data is an efficient means to produce regional land cover maps and subsequent updates. To this end, the Kansas Applied Remote Sensing (KARS) Program of the Kansas Biological Survey is developing the fourth publicly available statewide land cover map of Kansas. The three other statewide land cover maps were (1) Kansas Land-Use Patterns: Summer 1973 (non-digital, hard copy only) (KARS, 1973), (2) the 1990 Kansas Land Cover Patterns map (KARS, 1997; Whistler et al., 1995), and (3) the 1992 Kansas Vegetation Map created for the Gap
ASPRS 2009 Annual Conference Baltimore, Maryland March 9-13, 2009
Analysis Program (Egbert et al., 2001; KARS, 2002). The overall objective of the current mapping initiative is to provide a statewide update of the 1990s Kansas Land Cover Patterns Map.
Specific objectives of The Kansas Next-Generation Land Cover Mapping Initiative are to produce two land use/land cover maps (modified Anderson Level I and modified Anderson Level II) using a hybrid, hierarchical classification approach of multi-temporal, multi-resolution imagery (Landsat TM and MODIS NDVI time-series). The mapping initiative is a two-phase 18-month endeavor. The classification approach utilizes the spatial resolution of Landsat TM data and the dense temporal resolution of MODIS time-series data.
During Phase I, a modified Anderson Level I land cover map was created and designed to be explicitly comparable to the 1990 Kansas Land Cover Patterns map in terms of source data, classification scheme, classification approach and spatial resolution. The objective was to provide an update and allow end users to identify and assess potential change in the Kansas landscape.
During Phase II, subclasses of grassland (cool- and warm-season) and cropland (row crop, small grains, fallow, alfalfa, and irrigation status) are being mapped to produce a modified Anderson Level II map of Kansas. To map grassland subclasses, our initial plan was to use MODIS NDVI time-series data; however, preliminary results indicated that TM data provided a better representation in the pilot study area (Flint Hills region). The use of TM data for grassland mapping is supported by previous research conducted at the KARS Program where TM data accurately discriminated between cool- and warm-season grasslands (Egbert et al., 2001; Peterson et al., 2002) and management practices in eastern Kansas (Guo et al., 2003). In Egbert et al. (2001), multi-seasonal TM data accurately depicted the regional trends in warm season grasslands (i.e. shortgrass, mixed grass, and tallgrass prairie) across the state.
In terms of cropland mapping, previous research conducted at the KARS Program has shown that multi-seasonal Landsat TM data can accurately map crop types (Price et al., 1997). However, TM image dates need to be selected to capture the phenology of spring, summer, late summer and winter crops. With the limited availability of cloud-free TM images, mapping crop subclasses and irrigation status for the entire state is unfeasible. Meanwhile, previous research conducted at the KARS Program has shown that MODIS NDVI time-series data can be used to accurately map crop types (Wardlow and Egbert, 2002; Wardlow and Egbert, 2005; Wardlow and Egbert, 2008). Although the spatial resolution of MODIS time-series data is relatively coarse, the methodology we describe utilizes the high temporal resolution of the MODIS time-series data to map crop subclasses and then integrates the classes into the 30m spatial resolution of the Level I map footprint utilizing USDA Farm Service Agency (FSA) Common Land Unit (CLU) boundaries.
METHODS Study Area
The Kansas landscape is predominantly a mix of cropland and grassland. Grassland and cropland types and management practices utilized across the state are primarily influenced by the strong west-to-east precipitation gradient. Annual precipitation in western Kansas ranges from 25-50cm while central Kansas ranges from 50-76 cm and eastern Kansas ranges from 76-127cm (Daly, 2000).
Over 46% of the landscape is reported as cropland with varying crop types and crop management practices utilized across the state, primarily influenced by water availability. The dominant crop types in Kansas are winter wheat (Triticum aestivum), sorghum (Sorghum bicolor), corn (Zea mays), soybeans (Glycine max) and alfalfa (Medicago sativa). In western Kansas, where precipitation is low, irrigation and dryland farming practices are utilized. No-till and crop-fallow rotations, two dryland farming practices, are required to sustain wheat and sorghum production. Where groundwater from aquifers is accessible, irrigation is used to grow higher water demanding crops such as corn, soybeans and alfalfa. Irrigation is less common in eastern Kansas, where precipitation is sufficient to support corn and soybean crops. The small percentage of irrigation found in eastern Kansas typically occurs along floodplains in river valleys. Double cropping of wheat and soybeans is a common practice in southeast Kansas.
While a large percentage of Kansas is cultivated, relatively large tracts of grassland remain. Native grasslands in Kansas refer to prairies that are dominated by perennial warm-season grass and forb species. The various prairie types follow the precipitation gradient with shortgrass prairie in western Kansas, mixed-grass prairie in central Kansas, and tallgrass prairie in eastern Kansas. The peak period of productivity for native warm season grasslands is mid-summer (Weaver, 1954). Non-native grassland in Kansas refers to planted pastures that are dominated by the perennial cool-season smooth brome (Bromus inermis Leyss.) and tall fescue (Festuca arundinacea Schreb.). These

ASPRS 2009 Annual Conference Baltimore, Maryland March 9-13, 2009
cool-season species require moderate precipitation and therefore are not located in semi-arid western Kansas. Cool-season grasslands experience their peak growth rate in the spring and with conditions permitting, a secondary growth rate in the fall (Weaver, 1954). Fertilizing, grazing and haying are common land management practices for cool-season grassland in Kansas while prescribed burning, grazing, haying are common land management practices for warm-season grassland in Kansas.
Phase I
Data Source. The Level I map was derived using three-date multi-seasonal (spring, summer, and fall) Landsat Thematic Mapper (TM) images from the 2004-2005 Kansas Satellite Image Database (KSID) (Whistler et al., 2006), a database previously developed by the Kansas Applied Remote Sensing Program and funded by the Kansas State GIS Policy Board with assistance from the USGS AmericaView program.
Image Preprocessing. For each path/row, bands 3, 4, 5, and 7 were subset from each scene and combined into one file to create a 12-band multi-seasonal image. Previous experience has shown this band combination to be most effective in multi-date land cover classification for Kansas (Egbert et al., 1995; Price et al., 1997). Images were inspected for cloud contamination. Where clouds existed, a two-date multi-seasonal image was used for classification. The spatial extents of some processing units (a processing unit corresponds to either the entire path/row scene, or a subset of the scene) were reduced to minimize the overlap between adjacent path/rows with preference or priority given (i.e. the spatial extent was maximized) to processing units containing intra-annual triplicates (all within the same year) and to the 2005 TM data (vs. 2004).
Using a heads-up digitizing approach, developed areas exceeding 40 acres were digitized on a displayed image of the 2005 NAIP air photos using ArcGIS 9.1 software (ESRI, 2005) to create an urban mask. The urban mask was then used to create both a rural layer stack and an urban layer stack for each processing unit for image classification.
Image classification. Eleven land use/land cover (LULC) classes were mapped (Table 1). The goal for overall map accuracy was 85% or greater. An unsupervised classification approach (using the ISODATA clustering
algorithm and the Maximum Likelihood classifier (Leica Geosystems, 2005) was used for Level I mapping because time-consuming and expensive signature development and training is not required and because our previous experience with land cover mapping has underscored the value of using unsupervised classification to identify these land cover classes. One hundred spectral clusters were generated for rural classification and 50
spectral clusters were generated for urban classification. An unsupervised cluster-busting technique (Jensen, 1996) was used for confused spectral classes.
Image classification was broken into four tasks, conducted in parallel, with specific mapping objectives for each task. The tasks were: 1) create a map of cropland and grassland; 2) create a map of woodland; 3) create a map of water; and 4) create a map of urban classes. After all four tasks were completed, they were merged and the map generalized according to the minimum map unit defined for each class.
Map Generalization. Cartographic generalization of the classified Landsat TM data was performed to eliminate “noise” in the classification and simplify the map. Noise is comprised of either extraneous misclassified pixels or small clumps of pixels that are insignificant at the suggested mapping scale of the map (1:50,000) (Figure 1a). Noise tends to create visual confusion and obscure overall patterns. Before designing and running the generalization procedures, the minimum mapping unit (MMU) was chosen for each land use/land cover (LULC) class. MMUs varied by LULC class and match the MMU’s used in the 1990 Kansas Land Cover Patterns database (Table 2).
Table 1. The modified Anderson Level I land use/land cover classes mapped.
Level I Class Code and Name Level II 10, Urban 11, Urban Commercial/Industrial
12, Urban Residential
13, Urban Openland (typically grassland)
14, Urban Woodland
15, Urban Water
20, Cropland
30, Grassland (including rangeland and pasture)
31, Conservation Reserve Program (CRP)
40, Woodland
50, Water
60, Other (including sandbars, quarries, segments of major highways)

ASPRS 2009 Annual Conference Baltimore, Maryland March 9-13, 2009
Map generalization was accomplished in three stages using ERDAS Imagine and ArcGIS.9.3 software. The first stage consisted of visually examining the four classified component maps (i.e., urban, cropland/grassland, woodland and water), scanning for large misclassified areas, and manually correcting them.
In the second stage, conventional automated generalization procedures were used to simplify the manually cleaned classification by removing misclassified or spatially insignificant clumps of pixels (Figure 1b). During this stage, the objective was to achieve the MMU standard for the individual classes. Area and shape indices were used to identify and eliminate clusters of pixels less than the designated MMUs. After all processing units had gone
through the second generalization, the individual units were brought together, or mosaicked, into a single raster.
In the third stage, the USDA Farm Service Agency (FSA) Common Land Unit (CLU) field boundary dataset was used to fit the Cropland and Grassland classes from the mosaic into fields delineated in the CLU data (Figure 1c).
The objective was to utilize the spatial precision of field boundaries provided by the CLU data to better depict the spatial extent of “Cropland” and “Grassland” classes. To conduct the third stage of generalization, individual unattributed CLU field-boundary shapefiles, that roughly correspond to a county, were merged into one file covering the state and then converted to a raster grid. Output raster cells were assigned the feature identifier (FID) of the shapefile during the conversion to a grid because the value was unique and thus could be used to identify unique zones. Cropland and grassland classes were subset into a temporary map, to insure that the extent of the urban, woodland and water classes would not be affected. For each CLU zone, the zonal majority of the temporary map was calculated and assigned to that value. The zonal majority values were then burned back into the original land cover map.
Figure 1. An example of the map (a) prior to generalization, (b) following generalization using
traditional techniques and (c) following generalization using CLU data.
(a) (b) (c)
Accuracy Assessment. Field campaigns for accuracy assessments are often costly and time-consuming
endeavors. Rather than conducting an independent field campaign for the accuracy assessment, two existing databases were used to assess the accuracy of the 2005 land cover map. The 2005 Common Land Unit (CLU) dataset for Kansas (65 counties) was used to assess the accuracy of mapped grassland and cropland and the Kansas GAP vegetation database was used to assess the accuracy of mapped woodlands. The Kansas GAP vegetation database is a digital database of sample sites used for training and validation of the Kansas Vegetation Map (Egbert et al., 2001). Urban and water databases were unavailable, and therefore, manual photo interpretation of high-resolution digital aerial photography was used to assess the accuracy of these land cover classes.
Since the land cover map depicts landscape features (i.e., fields of cropland or grassland, stands of trees, etc.), polygon features were selected as the most appropriate sampling unit for the accuracy assessment. According to Congalton and Green (1991), the sampling unit dictates the level of detail in the accuracy assessment and the same MMU used for map development should also be used for reference data development. The MMU for each land cover class was used as an area threshold for site selection (i.e. polygon features less than the MMU were excluded from the accuracy assessment).
Table 2. M inimum mapping units by LULC class.
LULC Class TM Pixels Acres Urban C om m ercial/Indu strial, R esidential a nd O penland 15 3.11
Urban W oodland and Rural W oodland 3 0.67
Urban W ater and Rural W ater 1 0 .22
Cropland, G rassland a nd CR P 23 5.12
O ther 15 3.11
ASPRS 2009 Annual Conference Baltimore, Maryland March 9-13, 2009
A stratified random sample by LULC class was used to select sites for the accuracy assessment. A total of 31,298 sites were used to assess the accuracy of the Level I land cover map. Sample size was roughly proportionate to the percent area mapped for each LULC class. The number of samples selected for map classes was determined using a sample-size-to-area-mapped ratio, with the exception the woodland class, which lacked the available data to maintain a similar proportion. The “Other” class was not included in the accuracy assessment since the class represents such a small percentage (0.07%) of the study area and is a rare, catch-all class, (e.g. the class represents bare earth (other than tilled cropland), rock outcrops, sandbars, and man-made features). Therefore, a random, non-clustered dataset for use in accuracy assessment could not be developed for the “Other class”.
Phase II
Data Source. Landsat TM data imagery used to create the Level I map was used to map grassland subclasses. Terra MODIS NDVI time-series data dating from the 2005 growing season were used to map cropland subclasses and irrigation status.
Image Classification of Grassland Subclasses. A supervised classification approach using See5 decision tree software (Rulequest Research Pty Ltd., 2007) of multi-seasonal Landsat TM imagery is the methodology tested to map grassland subclasses. The NLCD mapping tool (MDA Federal, Inc., 2001) was used to interface the See5 with ERDAS Imagine and to generate random samples for decision trees. TM path/row 28/34 was selected to test the methodology. This path/row is centered over the city of Wichita and extends into the Flint Hills, a large tract of tallgrass prairie, and captures the more fragmented grassland to the west. We hypothesize that if warm-season grasslands are spectrally distinct from cool-season grasslands in this area, the methods to map grassland subclasses described here can be extended to other regions in the state.
Grassland pixels in the Level I map were used to identify and isolate cropland pixels in the TM imagery. The Kansas Vegetation Survey and the attributed CLU data were used for training and validation of the decision tree classifier. An area threshold of 10 acres was used to select sites, and only pixels internal to the CLU boundaries were used for training and validation. There were 2,033 cool- and 1,768 warm-season sites used in the decision tree classifier for path/row 28/34.
An 80/20 data split using a stratified random sampling scheme was used for model training and validation. The default global pruning of 25% and a minimum number of cases of two was used for the classification. The sampling procedure was repeated five times to generate five different random samples used to build decision trees. This repetition was used to assess model reliability. A boosting option of ten was used as a method to reduce the error rate in the classification. Boosting sequentially applies the classification algorithm to the training data, and at each of the ten iterations, gives more weight to misclassified cases identified in the previous tree. When the ten trees are developed, a weighted majority vote determines the final class for each pixel. Once the classifications for individual processing units are completed and evaluated, they will be mosaicked into a statewide grassland map.
Image Classification of Cropland Subclasses. A decision tree classifier using 231-meter resolution MODIS NDVI time-series data (16-day composites) from the 2005 growing season (March 22 to November 1) was used to map cropland subclasses. Cropland pixels in the Level I map were used to identify and isolate cropland pixels in the MODIS imagery.
The attributed 2005 CLU dataset was used for model training and validation. A random sample of fields greater than 80 acres in size was selected for each crop type (Table 3). Only pixels interior to the CLU boundaries were extracted and used for the image classification. A representative sample of individual crop types (i.e. corn, soybean, sorghum) was included in the row crop training and validation dataset. Using the NLCD mapping tool, a stratified random sample was used to create an 80/20 data split for model training and validation. Using the See5 software, a statewide classification was generated using the default settings for global pruning (25%) and minimum cases (two). As with the grassland classification, a boosting option of ten was used to reduce classification errors. The sampling procedure was repeated ten times to generate ten different stratified random draws of training and validation data to assess the reliability of the model.
Image Classification of Irrigation Status. Irrigated croplands were mapped using a methodology based on Brown, et al., 2007. The methodology uses four data sources: (1) the Terra MODIS NDVI data, (2) the Level I map produced in Phase I, (3) the unattributed USDA Common Land Unit (CLU) data, and (4) the USDA 2002 Census of Agriculture data (farm owners are required by law to report farm acreages every five years for the Census, making it the most reliable source for farm statistics) (USDA, 2004). The methodology described here differs from Brown, et al. in that the unattributed CLU dataset was used to constrain mapped irrigated cropland to CLU defined fields. The
Table 3. Sample size used for mapping cropland subclasses.
Crop Type Sample Size
Row Crops 737
Small Grains 318
Alfalfa 124
Fallow 185
Total 1 ,364

ASPRS 2009 Annual Conference Baltimore, Maryland March 9-13, 2009
work described below used USDA 2002 Census of Agriculture data to create target acreage values. The 2007 Census will be released in February 2009, and since the 2007 Census is closer in time to the 2005 MODIS NDVI data, the above procedures will be run again to create a final map of irrigated lands. Although USDA-NASS Quick Stats are available by year, it is not mandatory that land owners report crop acreages, irrigated or not, rendering Quick Stats unsuited for this application.
A basic assumption of this approach is that irrigated crops possess a peak NDVI higher than non-irrigated crops, therefore the maximum NDVI (denoted by ‘max NDVI’) for the 2005 calendar year was extracted from a time-series of 16-day composite data for the study area. The ‘max NDVI’ image was then resampled from the original 231.6 m to 30 m to match the resolution of the Level 1 map. The year 2005 was selected because it coincides with the year that the majority of the Landsat TM imagery used to construct the Level 1 Land Cover data. Figure 1 depicts the maximum NDVI for an area roughly centered on Garden City, Kansas.
The “Cropland” class from the Level 1 land cover map was use to extract ‘max NDVI’ values for cropland areas. Once extracted, the zonal average for ‘max NDVI’ was calculated using CLU fields as the zone grid. This procedure assigns the same ‘max NDVI’ value to each pixel comprising the CLU field (i.e., zone). Figure 2 depicts the zonal average ‘max NDVI’ for individual CLUs, with non-agricultural areas masked out.
For each county in the study, a threshold value for ‘max NDVI’ was used to classify individual CLUs as irrigated. The threshold value is determined by calculating the running total area for ‘max NDVI’ in descending order and then identifying the ‘max NDVI’ value (i.e., target value) where the running total area most closely matches the area stated in the USDA 2002 Census of Agriculture data. All CLUs with ‘max NDVI’ values greater than and equal to the target value are mapped as irrigated. Figure 3 depicts the CLUs identified as irrigated.
Map Generalization. The Level II cropland and grassland maps will be generalized. For each map, the zonal majority for each CLU in the unattributed CLU dataset will be calculated and the subclass representing the zonal majority in the CLU will be assigned to all the pixels comprising the CLU. Once the maps are generalized, cropland and grassland pixels in the Level I map will be reassigned to their respective subclasses to produce the 30-meter modified Anderson Level II map of Kansas.
Accuracy Assessment. Before release of the Phase II map later in 2009, a formal accuracy assessment will be conducted using an out of sample validation set from the attributed 2005 CLU dataset. Although the 2005 data is not as rigorously collected as the five year Census data, the 2005 dataset is coincident with respect to time and represents the only readily available spatial dataset that can be used as “ground truth”.
RESULTS & DISCUSSION Phase I
The end product for Phase I of the Next-Generation Kansas Land Cover mapping project is an updated digital Level 1 land cover map of Kansas (Figure 2). The broad patterns of land cover are readily apparent in the table and the map. The effects of human activity upon the Kansas landscape is clearly reflected in the fact that nearly 46% of the state’s land area is devoted to cropland while an additional 5% are Conservation Reserve Program (CRP) land. The major grassland areas of Kansas, including the Flint Hills of eastern Kansas, the Smoky Hills of north-central Kansas, and the Red Hills of south-central Kansas are easily identified, as are grasslands along the rivers and streams in western Kansas. The map indicates grasslands cover 42% of the state’s land. Large areas of nearly continuous cropland dominate the western two thirds of the state, with large tracts of CRP land evident. Woodlands, 4% of the state’s land, are interspersed within grasslands, and croplands characterize the heterogeneous eastern third of Kansas. The eastern third of Kansas also contains a major portion of the state’s population, and the major population centers of Kansas City, Lawrence, Manhattan, Pittsburgh, Topeka, and Wichita, as well as numerous smaller towns can be seen.

ASPRS 2009 Annual Conference Baltimore, Maryland March 9-13, 2009
Figure 2. The 2005 Kansas Land Cover Patterns map developed using multi-seasonal Landsat Thematic Mapper (TM) imagery.
The Cohen KAPPA statistic (Cohen, 1960) was 83.54%. These results represent the highest overall accuracy
level for a publicly available Level I map produced by the Kansas Applied Remote Sensing Program to date. Even though user and producer accuracy levels for cropland and grassland were relatively high (88-93%), there were
some misclassification errors (omission and commission errors) between these two land cover classes. The sections below explore and discuss multiple scenarios in which these misclassification errors occur.
Difficulties Mapping Grass-lands. Of 13,278 grassland reference sites used in the accuracy assessment, 1,457 fields, or features, were misclassified as cropland. Approximately 47% of these grassland areas were cool-season grasslands and 53% were warm-season grasslands. The majority of these fields were relatively small (less than 6 acres). Seventy-six percent (527 fields) of the cool-season grasslands misclassified as cropland
were either fescue or smooth brome fields and were located primarily in the eastern half of the state. Common management practices on cool-season grasslands include fertilizing, grazing, and haying, and the frequency and duration of these management practices varies. It is likely that these management practices caused spectral confusion between cool-season grasslands and cropland in the image classification. Using three dates of TM
Table 1. User and Producer accuracy levels by land use/land cover class.
LULC Class LULC Code
User Accuracy
(%)
Producer Accuracy
(%) Urban Commercial Industrial 11 61.05 74.36
Urban Residential 12 48.35 77.19
Urban Openland 13 78.43 64.17
Cropland 20 90.92 93.37
Grassland 30 91.23 88.58
CRP 31 NA NA
Woodland (rural and urban) 14 & 40 95.77 80.68
Water (rural and urban) 15 & 50 95.81 92.93
Other 60 NA NA

ASPRS 2009 Annual Conference Baltimore, Maryland March 9-13, 2009
imagery, the lush spring vegetation in brome fields was spectrally similar to winter wheat fields, while haying events generated a spectral response similar to a harvested spring or summer crop, depending on the timing of the haying event.
There were 768 fields of warm-season grassland inaccurately mapped as cropland. Eighty percent of these warm-season grasslands were located in western half of the state. Upon further investigation, we found that a large number of these features were the corners of center pivot fields (Figure 3). While some of these small corners were not detectable or mapped using TM data, others were successfully mapped, but subsequently eliminated during the generalization process.
Center pivot corners less than the MMU (5 acres or 23 pixels) were eliminated in stage 2 of the generalization procedure. And some of the center pivot corner features exceeding the MMU were eliminated during stage 3 of the generalization procedure. During stage 3 of the generalization procedure, which used the unattributed CLU data, the zonal majority within each CLU polygon was calculated and pixels within the CLU were reassigned to the zonal majority value. Unfortunately, there were discrepancies in the level of detail between the 63-county attributed data (used for the accuracy assessment) and the statewide unattributed data (used for stage 3 of the generalization). More specifically, there were instances where center pivot corners were delineated in the attributed CLU data but not delineated in the unattributed CLU dataset (Figure 3).
Figure 3a shows center pivot corners mapped as grasslands that were larger than the MMU (after stage 2 of the generalization) with the attributed CLU data overlaid. Figure 3b shows how these center pivot corners were eliminated during stage 3 of the generalization due to the coarser field representation in the unattributed CLU data. Although the use of the unattributed CLU data in the generalization process caused undesirable outcomes such as this, we believe the overall benefits of its use in terms of cleaning up misclassified areas and improving class cartographic representation far exceeds the loss of some of these smaller landscape features.
Difficulties Mapping Cropland Features. Of 15,836 cropland reference sites used in the accuracy assessment, 1,012 were misclassified as grassland. The majority of cropland areas misclassified as grassland were due to non-optimal dates for the TM scene triplicates and spectral confusion. Because of cloud contamination, some non-optimal spring and summer dates were used for image classification. For example, a large number of soybean fields in path/row 27/33 were misclassified as grassland. This path/row triplicate had a summer date of June 22, 2005, a date that is likely too early in the growing season to classify all instances of late summer crops such as soybeans.
There were also non-irrigated winter wheat fields misclassified as grassland. The date for some of the spring imagery may have been too early (mid- to late-March) to differentiate all non-irrigated winter wheat from grassland. In contrast, irrigated wheat fields in these same areas were lush and consequently were more spectrally distinct from grassland in the spring.
Of the 1,012 cropland sites misclassified as grassland, 246 (24%) were labeled as fallow land in the CLU dataset. The potential for fallow land to be defined as a land use and also as a land cover type explains a large portion of these “classification errors”. From a land use perspective, fallow land has been temporarily removed from cultivation as a land management strategy for weed control and/or to conserve soil nutrients and soil moisture. However, from a land cover perspective, during the first year fallow land is composed of crop stubble and bare soil, with varying degrees of weed cover depending on cultivation practices. Lands removed from cultivation for one or more years, would no longer be bare soil but would be in the early stages of plant succession. Therefore, bare fields were typically mapped as cropland, while fields idle or fallow for one or more years with established vegetation cover were mapped based on the dominant land cover type. And in many instances the dominant vegetation cover was (weedy) grassland and in rare instances, woodlands. The CLU data lacks information regarding the timing or duration of fallow status.
Figure 3. (a) An example of grassland corners mapped andmaintained following stage 2 of the generalization procedureshown with the attributed CLU data (used for accuracyassessment) overlaid. (b) Same area after stage 3 of thegeneralization with the unattributed CLU overlaid. Theunattributed CLU data does not include all center pivot cornersand therefore many of these areas were recoded to the zonalmajority land cover class, cropland.
(a) (b)
ASPRS 2009 Annual Conference Baltimore, Maryland March 9-13, 2009
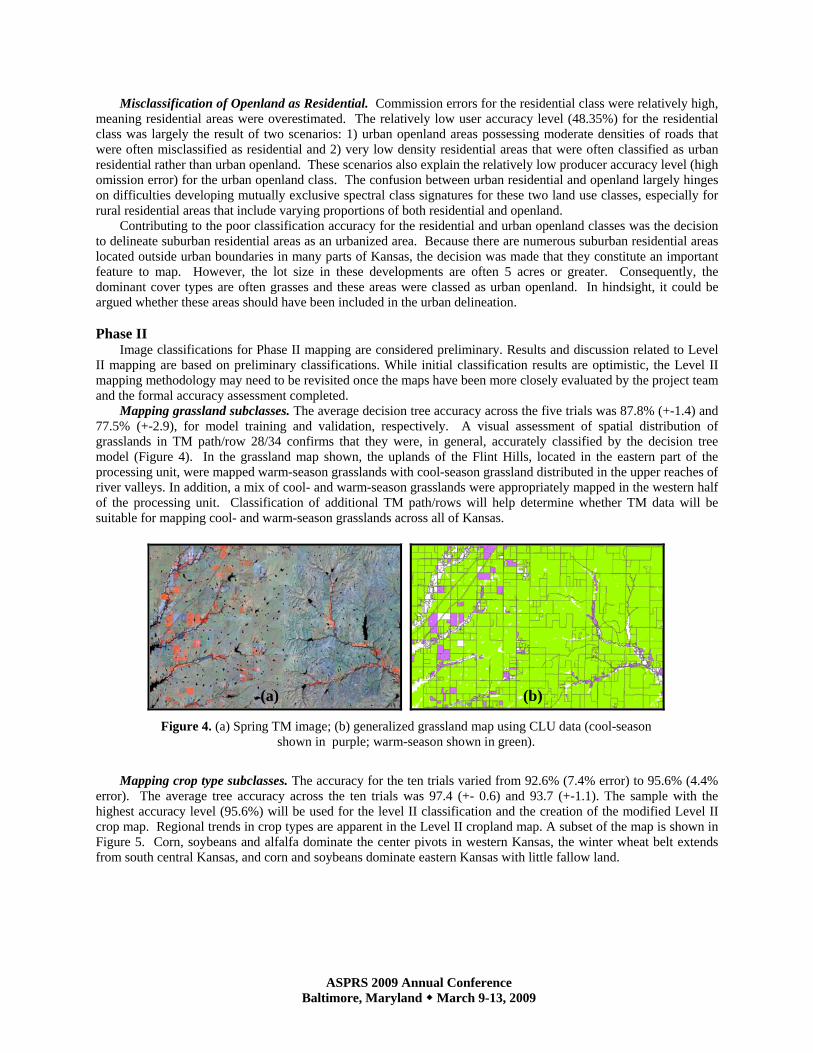
Figure 4. (a) Spring TM image; (b) generalized grassland map using CLU data (cool-season
shown in purple; warm-season shown in green).
(a) (b)
Misclassification of Openland as Residential. Commission errors for the residential class were relatively high, meaning residential areas were overestimated. The relatively low user accuracy level (48.35%) for the residential class was largely the result of two scenarios: 1) urban openland areas possessing moderate densities of roads that were often misclassified as residential and 2) very low density residential areas that were often classified as urban residential rather than urban openland. These scenarios also explain the relatively low producer accuracy level (high omission error) for the urban openland class. The confusion between urban residential and openland largely hinges on difficulties developing mutually exclusive spectral class signatures for these two land use classes, especially for rural residential areas that include varying proportions of both residential and openland.
Contributing to the poor classification accuracy for the residential and urban openland classes was the decision to delineate suburban residential areas as an urbanized area. Because there are numerous suburban residential areas located outside urban boundaries in many parts of Kansas, the decision was made that they constitute an important feature to map. However, the lot size in these developments are often 5 acres or greater. Consequently, the dominant cover types are often grasses and these areas were classed as urban openland. In hindsight, it could be argued whether these areas should have been included in the urban delineation.
Phase II
Image classifications for Phase II mapping are considered preliminary. Results and discussion related to Level II mapping are based on preliminary classifications. While initial classification results are optimistic, the Level II mapping methodology may need to be revisited once the maps have been more closely evaluated by the project team and the formal accuracy assessment completed.
Mapping grassland subclasses. The average decision tree accuracy across the five trials was 87.8% (+-1.4) and 77.5% (+-2.9), for model training and validation, respectively. A visual assessment of spatial distribution of grasslands in TM path/row 28/34 confirms that they were, in general, accurately classified by the decision tree model (Figure 4). In the grassland map shown, the uplands of the Flint Hills, located in the eastern part of the processing unit, were mapped warm-season grasslands with cool-season grassland distributed in the upper reaches of river valleys. In addition, a mix of cool- and warm-season grasslands were appropriately mapped in the western half of the processing unit. Classification of additional TM path/rows will help determine whether TM data will be suitable for mapping cool- and warm-season grasslands across all of Kansas.
Mapping crop type subclasses. The accuracy for the ten trials varied from 92.6% (7.4% error) to 95.6% (4.4%
error). The average tree accuracy across the ten trials was 97.4 (+- 0.6) and 93.7 (+-1.1). The sample with the highest accuracy level (95.6%) will be used for the level II classification and the creation of the modified Level II crop map. Regional trends in crop types are apparent in the Level II cropland map. A subset of the map is shown in Figure 5. Corn, soybeans and alfalfa dominate the center pivots in western Kansas, the winter wheat belt extends from south central Kansas, and corn and soybeans dominate eastern Kansas with little fallow land.

ASPRS 2009 Annual Conference Baltimore, Maryland March 9-13, 2009
Figure 5. (a) 231 m resolution crop type map using MODIS imagery from the 2005 growing season; (b) 30 m crop map where the 231 m map was resampled to 30 m and pixels in the Level I map were
reassigned their respective crop subclass. Area shown is centered over Finney County.
(a) (b)
Mapping irrigation status. On a large-scale, the results look similar to the distribution of irrigation land
mapped by in Brown et al. (2007). As illustrated by Figure 6, the distribution patterns of irrigated cropland appears correct, however we will apply the 2007 USDA Census of Agriculture data and then assess the accuracy of the mapping technique using the attributed CLU data.
Figure 6. (a) MODIS-derived image of maximum NDVI; (b) Average maximum NDVI by
CLU (non-cropland areas shown in purple); (c) CLUs whose average maximum NDVI exceeded the threshold to classify them as irrigated; (d) Irrigated lands integrated with Level I map.
(a)
(c)
(b)
(d)

ASPRS 2009 Annual Conference Baltimore, Maryland March 9-13, 2009
SUMMARY The Kansas-Next Generation Mapping Initiative is a two-phase mapping initiative occurring over a three-year
period. The 2005 Kansas Land Cover Patterns map generated in Phase I is designed to be explicitly comparable to the 1990 Kansas Land Cover Patterns map. Using a similar mapping methodology (i.e. source data, classification scheme, classification approach and spatial resolution) to produce the 2005 Kansas Land Cover Patterns map provides opportunities to identify and examine how the Kansas landscape has changed over a 15-year period. The map contains eleven land use/land cover classes. The formal accuracy assessment reports an overall accuracy level of 90.72%. User and Producer accuracies vary by land cover class, and rural classes have higher accuracy levels (88-95%) than urban classes (48-78%). Digital versions of the map, metadata, and accuracy assessment can be accessed from the Data Access and Support Center (DASC) website of the Kansas Geological Survey (http://www.kansasgis.org/).
During Phase II, grassland and cropland subclasses will be mapped to produce an Anderson Level II map of Kansas. Using a decision tree classifier and MODIS NDVI time-series data, cropland subclasses will be mapped. Grassland subclasses will be mapped using a decision tree classifier and TM imagery. Preliminary classification results of grassland and cropland subclasses are promising, although further visual assessments along with a formal accuracy assessment are needed to validate the image classifications. Although our described methodology for mapping grassland subclasses utilizes Landsat TM data, the use of MODIS data for this portion of the mapping may need to be revisited if TM data are unable to accurately map grassland types throughout the state. Once grassland and cropland subclasses are mapped, grassland and cropland pixels in the Level I map will be reassigned to their respective subclass. A formal accuracy assessment of the Level II map will be performed and distributed through the DASC website along with the digital map and final report.
ACKNOWLEDGEMENTS This project was conducted at the Kansas Applied Remote Sensing (KARS) Program (Edward A. Martinko,
Director). The research described in this paper was co-funded by the Kansas GIS Policy Board with funds from the Kansas Water Plan that are administered by the Kansas Water Office under the grant titled “Kansas Next-Generation Land Use/Land Cover Mapping Initiative” and the National Science Foundation EPSCoR Program under the research project titled “Understanding and Forecasting Ecological Change: Causes, Trajectories and Consequences of Environmental Change in the Central Plains”.
REFERENCES
Brown, J.F., S. Maxwell, S.Pervew, B. Wardlow, and K. Callahan, 2007. A new automated assessment of national irrigated area from MODIS, Earth Observations.
Cohen, J., 1960. A coefficient of agreement for nominal scales, Educational and Psychological Measurement, 20(1):37-40.
Congalton, R.G. and K. Green, 1999. Assessing the Accuracy of Remotely Sensed Data: Principles and Practices, Lewis Publishers: Boca Raton, Florida.
Daly, C and G. Taylor, 2000. United States Average Annual Precipitation, 1961-1990, Spatial Climate Analysis Service, Oregon State University; USDA - NRCS National Water and Climate Center, Portland, Oregon; USDA - NRCS National Cartography and Geospatial Center, Fort Worth, Texas, Corvallis, OR, USA. http://nationalatlas.gov/atlasftp.html?openChapters=chpclim#chpclim
Egbert, S.L., K.P. Price, M.D. Nellis, and R. Lee, 1995. Developing a land cover modelling protocol for the high plains using multi-seasonal Thematic Mapper imagery, Proceedings, ASPRS/ACSM Annual Meeting, Charlotte, North Carolina, Vol. 3.: 836-845, February 27-March 2.
Egbert, S.L., D.L. Peterson, A.M. Stewart, C.L. Lauver, C.F. Blodgett, K.P. Price, and E.A. Martinko, 2001. The Kansas GAP land cover map final report, Kansas Biological Survey Report #99, University of Kansas, Lawrence, Kansas.
ESRI, 2005. ArcGIS Version 9.0, ESRI. Redlands, CA. Guo, X., K.P. Price and J.M. Stiles, 2003. Grasslands discriminant analysis using Landsat TM multitemporal data,
PE&RS, 69(11):1255-1262.

ASPRS 2009 Annual Conference Baltimore, Maryland March 9-13, 2009
Jensen, J.R., 1996. Introductory Digital Image Processing, Prentice-Hall, Upper Saddle River, NJ. KARS (Kansas Applied Remote Sensing), 1973. Kansas Land Use Patterns, Lawrence, Kansas: Kansas Biological
Survey, University of Kansas, Lawrence, Kansas.KARS, 1996. Kansas Land Cover Patterns, Lawrence, Kansas: Kansas Biological Survey, University of Kansas Lawrence, Kansas.
KARS, 2002. Kansas Vegetation Map, Lawrence, Kansas: Kansas Biological Survey, University of Kansas Lawrence, Kansas.
Leica Geosystems, 2005. Erdas Imagine 9.0., Leica Geosystems Geospatial Imaging, LLC. Norcross, GA. MDA Federal, Inc., 2001. NLCD Mapping Tool, MDA Federal Inc., Rockville, MD. Peterson, D.L., K.P. Price, and E.A. Martinko, 2002. Discriminating between native warm season and non-native
cool season grasslands in northeastern Kansas, International Journal of Remote Sensing, 23(23): 5015-5030.
Price, K.P., Egbert, S.L., Nellis, M.D., Lee, R.Y., and Boyce, R., 1997. Mapping Land Cover in a High Plains Agro-Ecosystem Using a Multi-Date Landsat Thematic Mapper Modeling Approach, Transactions, Kansas Academy of Sciences, 100(1-2): 21-33.
Rulequest Research Pty Ltd., 2007. See 5 Version 2.05, Rulequest Research Pty Ltd, St Ives, Australia. U.S. Department of Agriculture, National Agricultural Statistics Service, 2004. 2002 Census of Agriculture
(Colorado, Kansas, Missouri). http://www.nass.usda.gov/Census/Create_Census_US_CNTY.jsp. Wardlow, B.D. and S.L. Egbert, 2002. Discriminating cropping patterns in the U.S. Central Great Plains region
using time-series MODIS 250-meter NDVI data, Proceedings, Pecora 15 and Land Satellite Information IV Conference, Denver, CO, November 10-15.
Wardlow, B.D. and S.L. Egbert, 2005. State-level crop mapping in the U.S. Central Great Plains agroecosystem using MODIS 250-meter NDVI data, Proceedings, Pecora 16, Sioux Falls, SD, October 23-27.
Wardlow, B.D. and S.L. Egbert, 2008. Large-area crop mapping using time-series MODIS 250 m NDVI data: An assessment for the U.S. Central Great Plains, Remote Sensing of Environment, 112(3):1096-1116.
Whistler, J.L., B.N. Mosiman, J. Campbell, and D.L. Peterson, 2006. The Kansas Satellite Image Database 2004-2005: Final Report, Kansas Biological Survey Report #127, Lawrence, Kansas.
Whistler, J., M.E. Jakubauskas, S.L. Egbert, E.A. Martinko, D.W. Baumgartner, and R. Lee, 1995. Kansas Land Cover Mapping Project: Regional Scale Land Use/Land Cover Mapping Using Landsat Thematic Mapper Data, ACSM/ASPRS Annual Convention and Exposition Technical Papers, 3:773-785.
Weaver, J. E., 1954. North American Prairie, Johnsen Publishing Company, Lincoln, Nebraska, 348 pp.