the journey from loyalty to brand advocacy
TRANSCRIPT
The journey from Loyalty to
Brand Advocacy
University of Amsterdam
MSc in Business Administration
Master Thesis
Author: Adriana Frasin
Student number: 6140491
Supervisor: Prof. A.C.J. Meulemans
Co-reader: Prof. J. A. Tettero
Brand Advocates 2016
A. Frasin Page 2

Brand Advocates 2016
A. Frasin Page 3
Contents
Contents………………………………………………………………………………………………………….3
Statement of Originality…………………………………………………………………………………….4
Preface……………………………………………………………………………………………………………5
Keywords………………………………………………………………………………………………………..6
Executive Summary………………………………………………………………………………………….7
Chapter 1. Introduction…………………………………………………………………………………….8 Subchapter 1.1. Chapter Overview Subchapter 1.2. Context and motivation of the thesis Subchapter 1.3. Research questions Subchapter 1.4. Research objectives Chapter 2. Theoretical research: Literature review……………………………………………..12 Subchapter 2.1. Introduction Subchapter 2.2. The link between Perceived Quality and Satisfaction Subchapter 2.3. The concepts of Trust and Commitment Subchapter 2.4. Loyalty as a key concept Subchapter 2.5. The concept of WOM? Subchapter 2.6. What is Brand Advocacy? Subchapter 2.7. What is a Super Promoter? Subchapter 2.8. Conclusion Chapter 3. Empirical Research: Design and Methodology……………………………………26 Subchapter 3.1. Research Method Subchapter 3.2. Questionnaire Design Subchapter 3.3. Data Collection Chapter 4. Empirical Research: Data Analysis……………………………………………………32 Chapter 5. Conclusions and Recommendations………………………………………………….43 List of Figures…………………………………………………………………………………………………45 List of Tables………………………………………………………………………………………………….45 List of References…………………………………………………………………………………………..46
Appendix A: Survey Design……………………………………………………………………………..53
Appendix B: Survey Results…………………………………………………………………………….66

Brand Advocates 2016
A. Frasin Page 4
Statement of Originality
This document is written by Student Adriana Frasin, who declares to take full
responsibility for the contents of this document.
I declare that the text and the work presented in this document is original and that no
sources other than those mentioned in the text and its references have been used in
creating it.
The Faculty of Economics and Business is responsible solely for the supervision of
completion of the work, not for the contents.

Brand Advocates 2016
A. Frasin Page 5
Preface
As part of my MSc in Business Administration, I have written this paper focused on
Super Promoters and Brand Advocates mainly because I am big admirer of people with
passion, people with enthusiasm and people who do not shy away from sharing it with
the world. These are the dreamers, the change makers, the influential and the thought
leaders in their social circles. Also, as a marketer, I am conducting my job daily with the
consumer’s needs at heart, and investigating the stages that he/she is passing through
towards the status of Brand Advocate, has helped me tremendously in figuring out how
to target them.
My thesis is dedicated to my mother, to whom I am extremely grateful and forever in
debt, for being by side during my decision to study abroad, for supporting me
emotionally during the times I have started balancing school and work. She has been
my role model, my inspiration and my #1 fan. As well, I give thanks to my sister and to
my best friend, for cheering me up and encouraging me to finalize the paper and
graduate.
I would like to thank my supervisor, Prof. Meulemans, who has shown great support and
outstanding flexibility throughout the time that I was writing this thesis. I am thankful
for giving me the chance to work with him and for all the good advice he has shared
with me. The process has been long, due to the fact that I have been working more
than 50 hours per week, at the same time with my studies. But the moment has come
to close another chapter of my life, at least for some time: the student years.
On this closing note, I am looking forward towards a world where consumers are not
only satisfied with the products that brands develop for them, but actually thrilled and
delighted, sharing their excitement and spreading their happiness with people around.

Brand Advocates 2016
A. Frasin Page 6
Keywords:
satisfaction, trust, commitment (affective, normative, continuance), loyalty (behavioral and attitudinal), enthusiasm, WOM, willingness to recommend, repurchase intentions, customer retention, brand preference, consumer advocacy, brand advocacy, evangelism marketing, market mavens, opinion leadership, co-creation, social influence, C2C engagement, NPS, Super Promoters
Figure 1. Brand advocacy word cloud
Brand Advocates 2016
A. Frasin Page 7
Executive Summary
“What causes consumers to become enthusiastic and affectively committed advocates
on behalf of their preferred brands?” is the central question of this paper.
At first glance, it might seem that all that product/service providers have to do is to
create satisfied customers. But eventually, the drivers of the various types of loyalty
behaviors will assert more influence on the process of becoming brand advocates. If we
start with first time customers – they have to be satisfied with the product they
purchased, have to trust its brand and become committed to it. If they would
recommend it to their family and friends, according to the NPS methodology, they would
be considered loyal to the brand.
This paper aims to investigate and pin point the constructs that mediate the journey and
transformation of loyal consumers into brand advocates, or Super Promoters, via means
of a survey which was sent to a database of Philips promoters, Senseo owners who
registered their product and had the highest NPS scores of 9 and 10. 200 responses
were returned, enabling an analysis that used simple logistic and multiple regressions to
probe the influence that a selected set of variables have on the Super Promoter status.
The survey probed their satisfaction, trust and commitment with the Senseo brand,
asked them to self-assess their enthusiasm towards the product or to answer socio-
demographic inquiries. It also tested their influence in their network in terms of opinion
leadership and market knowledge (mavenism), which the theory considered critical pre-
requisites for becoming Super Promoters or brand advocates.
The results show that the hypothesized model with trust, affective commitment and
market knowledge mediating the relationship between satisfaction and Super Promoter
status was supported. Furthermore, market knowledge appears to be especially
important in the path of becoming a Super Promoter.

Brand Advocates 2016
A. Frasin Page 8
Chapter 1 – Introduction
1.1 Chapter Overview
The study encompasses 5 chapters (see Figure 2), which are based on a pre-research
on available literature and online information on Brand Advocacy by using a set of
keywords depicted in the word cloud above (see Figure 1).
Chapter 1 sets the ground basis of this paper by defining the context of the study, the
objectives and the research questions.
To compliment the introduction, Chapter 2 provides an extensive overview on
academic literature and introduces the concepts of NPS and Super Promoters from the
business managerial world.
Chapter 3 explains how empirical research was started by collecting data via a
questionnaire, designed to survey a set of loyal consumers on their self-assessment of
various constructs the literature review has introduced.
Chapter 4 includes the data analysis which shows the relationships between these
constructs and supports the hypotheses.
Chapter 5 closes the research with conclusions and recommendations for further
research and for managerial implications.
Figure 2. Chapter overview
Pre-research:
Information on
Brand
Advocacy by
using different
keywords
Chapter 1
Goals and
research
questions
Research
Model
Chapter 2
Theoretical
Framework
Chapter 3
Empirical
Research
Data
Collection
Questionnaire
Chapter 5 Conclusions and Recommendations
Chapter 4
Analysis
Satisfaction
Trust
Commitment
Market knowledge
Advocacy

Brand Advocates 2016
A. Frasin Page 9
1.2 Context and Problem Statement
The Consumer Relationship Lifecycle (MCorp Consulting, 2011) has been used as a
starting point, in order to place the topic of the research in the context of the customer
buying decision process. The relationship between the last three touchpoints,
constituting the Post-Purchase section, is further explored.
Figure 3. Consumer Relationship Lifecycle (MCorp Consulting, 2011)
Every company has developed relationships with its stakeholders - suppliers, employees,
partners, media, the government, etc. - who have a high impact on the company’s
ability to retain customers and grow. Not all companies manage to handle these
relations in a constructive way that would reach a large key audience, would draw them
closer by building their loyalty, would drive retention, WOM and referrals and would
create advocates of the brand. All of these, while growing year after year. The
touchpoints presented in Figure 1 are steps which companies are struggling to identify
and improve.
When having a closer look (see Figure 3) to the post-purchase stages – Satisfaction,
Loyalty and Advocacy – the strength of the relationship intensifies as the consumer
further advances the path towards becoming an advocate. As the consumer discovers
that the performance of the service/product meets expectations, he will need even more
a branded experience which is delivered in a consistent manner, where trust, price and
performance are key determinants of his loyalty. Many consumers will not move beyond
loyalty. But those who do become advocates will be the engine of growth and will
Brand Advocates 2016
A. Frasin Page 10
provide countless benefits through their active and enthusiastic recommendations of the
company’s products/services.
1.3 Research Objectives
The research objectives are two-fold and they aim at contributing something new on the
topic of brand advocacy to the existing body of literature and to offer tools to the
marketers to identify and recruit brand advocates:
First, enriching the academic literature with the concept of Super Promoters,
another name for Brand Advocates, understanding their journey and triggers
from being loyal to becoming a Super Promoter
Second, proposing a method of identification, design a new instrument for
selecting them and identifying the Super Promoters from a pool of loyal
consumers, in order to build a strong army of well-equipped brand advocates
that a brand can employ in broadcasting its message
1.4 Research Questions
The central question examines what causes loyal consumers to become enthusiastic and
affectively committed advocates on behalf of their preferred brands.
“What causes consumers to become enthusiastic and affectively committed advocates
on behalf of their preferred brands?”
1. What criteria, according to the Super Promoter methodology
(Vogelaar, 2011) could be used to classify Super Promoters as such,
by selecting them from a pool of loyal consumers?
2. Can the Super Promoter status be explained a proposed mediational
customer advocacy model, including Satisfaction, Trust, Affective
Commitment and Market Knowledge (see Figure 4)?

Brand Advocates 2016
A. Frasin Page 11
(a) How does Satisfaction predict Super Promoter status?
(b) How does Satisfaction predict each of the other mediators: trust, affective
commitment and market knowledge?
(c) What is the relationship between each of the moderators and Super
Promoter status?
(d) Are the 3 variables Trust, Affective Commitment and Market Knowledge
mediating the relationship between Satisfaction and Super Promoter
status?
(e) Which one of them is a better predictor of Super Promoter status?
Figure 4. Mediational customer advocacy model
Satisfaction Brand Advocates
Trust Affective Commitment
Market Knowledge
Antecedent Variables Mediators Consequence

Brand Advocates 2016
A. Frasin Page 12
Chapter 2 – Literature review
2.1 Introduction
Companies start to understand more and more that long term, sustainable competitive
advantage that enables growth is connected to their ability to attract, retain, sustain and
nurture the customer base (Anderson, Fornell and Mazvancheryl, 2004; Gruca and Rego,
2005; Rego, Billet and Morgan, 2009). To measure their performance, companies are
looking at customer-based metrics such as trust and commitment (Bansal, Irving and
Taylor, 2004; Garbarino and Johnson 1999; Palmatier et al., 2006; Verhoef, 2003),
service quality perceptions (Zeithaml, Berry and PArasuraman, 1996), brand experience
(Brakus, Schmitt and Sarantonello, 2009), brand-consumer connections (Fournier et al.,
1998; Muñiz and O’Guinn, 2001), consumer identification (Ahearne, Bhattacharaya and
Gruen, 2005), customer equity (Rust, Lemon and Zeithaml, 2004), etc.
This thesis aims at providing a framework that reflects the customer engagement
process from the prospective stage to the partnership stage, with all its underlining
mediating variables like satisfaction, loyalty, trust, affective commitment, positive WOM
and advocacy. The research tries to capture which drivers the company has to mediate,
in order to transform a prospective customer into an advocate of the brand or even a
partner in co-creation.
From a strategic perspective, the template developed allows scholars and managers to
fully understand how these behaviors are intertwined and to examine the descriptive
and causative analysis of the relations between the components of the model and how
strong their correlations are, if any.
Chapter 2 gives a theoretical overview on all the variables employed in the research
topic. It starts by building on the definitions of Perceived Quality & Satisfaction, Trust &
Commitment and Loyalty in order to identify what is missing in the literature and to
select the most appropriate research questions for the present study. These three
Brand Advocates 2016
A. Frasin Page 13
concepts are seen as the main antecedent drivers that finally create Brand Advocacy
through the mediation of positive WOM.
2.2 The link between Perceived Quality and Satisfaction
Perceived quality is defined as the result of the comparison that a customer makes
between the expectations about a product or a service and the perception of how that
product or service has been performed (Caruana, 2002; Parasuraman, Zeithaml and
Berry, 1994). Perceived quality is considered a core customer-based brand equity factor
because it has been associated with the willingness to pay a price premium, brand
purchase intent and brand choice (Aaker, 1991).
Satisfaction is one of the most studied constructs in the history of marketing
scholarship (Fournier and Mick, 1999; Szymanski and Henard, 2001). Advocacy is a key
consequence of positive evaluations of the service (Anderson, 1998; Swan and Oliver,
1989; Zeithaml et al., 1996). Anderson shows in his study that delighted customers are
more likely to give recommendations than those who had a more neutral satisfaction
evaluation.
The link between perceived quality and satisfaction has been strongly supported
by several studies (Chiou and Droge, 2006; Cronin, Brady and Hult, 2000; Olsen, 2002),
but it has also been theoretically questioned (Henning-Thurau and Klee, 1997; Pappu
and Quester, 2006). Oliver (1997) demonstrated that perceptions of high quality lead to
brand loyalty because it is the basis of consumer satisfaction. Cronin and Taylor (1992)
assess a few models and conclude that perceived quality leads to satisfaction. Lee and
Back (2008) similarly found empirical evidence supporting this relationship in the
branding context.

Brand Advocates 2016
A. Frasin Page 14
2.3 The concepts of Trust and Commitment
Trust and Commitment have been identified as the most important concepts in the field
of relationship marketing (Morgan and Hunt, 1994). In the same article, the authors
define trust as the level of confidence that the consumer has in the reliability and
integrity of the company, level which is achieved when expectations are fulfilled and the
quality of the service is consistent. Commitment is usually defined as the extent to
which an exchange partner desires to continue a valued relationship (Moorman et al.,
1992), as an attitude towards the act of maintaining a relationship with a partner
(Bansal et al., 2004; Fullerton, 2003). At its core, commitment consists of three distinct
components: affective commitment, continuance commitment and normative
commitment (Meyer et al., 2002).
Affective commitment has been defined as the extent to which a customer identifies
with and feels a positive attachment for a partner (Bansal et al., 2004; Fullerton, 2003;
Gruen et al., 2000). The affective commitment is the psychological attachment, based
on loyalty and affiliation of one exchange partner to the other (Bahttacharaya, Rao and
Glynn, 1995; Gundlach, Achrol and Mentzer, 1995).
Continuance commitment is defined as the extent to which a customer feels bound
to a relational partner (Bansal et al., 2004; Fullerton, 2003; Gruen et al., 2000) whereas
normative commitment is defined as the construct to which a customer feels
obligated to do business with a partner (Bansal et al., 2004; Gruen et al., 2000).
To further underpin the hypotheses of this thesis, it has been found that commitment
positively affects loyalty (Garbarino and Johnson, 1999; Morgan and Hunt, 1994).
Amongst the findings of Fullerton’s study (2011) is the one that demonstrates that the
degree to which customers will become advocates depends on the components of
commitment. Thus, consistent with the previous literature on the topic, Fullerton finds
that affective commitment is the strongest and most significant determinant of customer
advocacy, but also that normative commitment has a considerable influence (Fullerton,
2003; Bloemer and Odekerken-Schroder, 2007).

Brand Advocates 2016
A. Frasin Page 15
2.4 Loyalty – as a key concept
Brand loyalty can be defined as “a deeply held commitment to re-buy or re-patronize a
preferred product/service in the future, thereby causing repetitive same-brand
purchasing, despite situational influences and marketing efforts having the potential to
cause switching behavior” (Oliver, 1999, p.34). Dick and Basu (1994) propose that
customer loyalty is the result of psychological processes and has behavioral
manifestations and should therefore incorporate both attitudinal and behavioral
components.
The relationship between satisfaction and brand loyalty has been the focus of a study
that investigates the effects of satisfaction and commitment on loyalty (Gustafsson,
Johnson and Roos, 2005). Jones and Sasser (1995) argue that satisfaction does not
necessarily lead to behavioral brand loyalty.
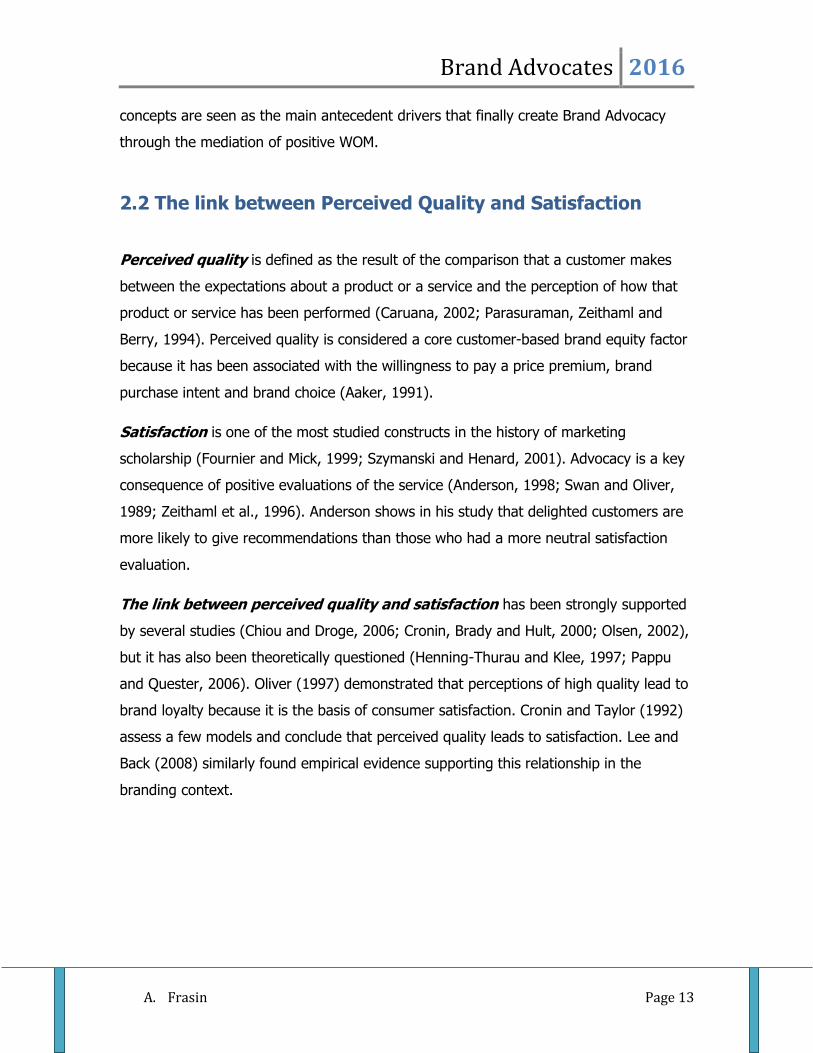
To measure loyalty, Reichheld (2003) has proposed the Net Promoter Score, an 11
points scale tool that ascertains customer’s loyalty towards certain products with one
simple question: “Based on your experience with this product, how likely are you to
recommend your <branded> product to a friend, relative or colleague?” Based on the
answers to this question, the consumers can be categorized as “Promoters”, “Passives”
or “Detractors”. The Net Promoter Score, NPS in Figure 5, is calculated by taking the
percentage of customers who are Promoters (score 9 to 10) and subtracting the
percentage of Detractors (score 0 to 6).
Brand Advocates 2016
A. Frasin Page 16
Figure 5. NPS formula
If Reichheld is right in his assumption that willingness to provide recommendations is
the strongest indicator of customer loyalty, then it is important to consider all drivers of
advocacy, beyond mere satisfaction.
2.5 The concept of WOM
Word of mouth has suffered some alterations from the initial definition in which Arndt
(1967, p.190) sees WOM as “oral, face to face communication between a perceived non-
commercial communicator and a receiver concerning a brand, a product or a service
offered for sale”. Twenty years later, Westbrook (1987, p.261) defines it as “informal
communication directed at other consumers about the ownership, usage or
characteristics of particular goods and services and their sellers”. Another 20 years later,
Word of Mouth Marketing Association, founded in 2005, defines WOM as “consumers
providing information to other consumers” (WOMMA, 2008). All definitions convey WOM
as an organic, natural, inter-personal communication about brands, products or services
that can be either positive or negative.

Brand Advocates 2016
A. Frasin Page 17
In the past, as stated above, WOM has been viewed from the classic perspective of two
individual customers talking about a brand. This view appears incomplete today because
different customers affect each other in many ways, sometimes even unknowingly. A
broader view brings Customer-to-Customer (C2C) interactions in the spotlight, as the
transfer of information from one customer or a group of customers to another customer
or group of customers in such a way that influences their preferences, their purchasing
decision and even the way they interact with others in the future (Libai et al., 2010).
Companies have tried to influence the C2C interactions with the help of tools such as
WOM agent campaign, viral marketing, buzz marketing or even referral reward
programs (Godes et al., 2005).
WOMMA classifies WOM in two categories: organic WOM, that occurs naturally,
without the company’s intervention and amplified WOM that occurs when campaigns
that target creation or acceleration of WOM in new or existing communities, are
designed by marketers (WOMMA 2008).
WOM plays an important role in shaping recipients’ attitudes and intentions (Brown and
Reingen, 1987; Harrison-Walker, 2001; Keaveney and Parthasarathy, 2001; Libai, Muller
and Peres, 2009) as “WOM and especially personal recommendations have long been
more powerful than media advertising in driving both trial and repeat purchase
behavior” (Ostrom et al., 2010, p. 23).
Verlegh et al. (2008) answer the question of why do customers engage in WOM by
putting forward four reasons: product enthusiasm, self-presentation, helping consumers
and helping the firm. These motives appear similar to the ones Dichter (1966) and
Sundaraman et al. (1998) found, but at a smaller scale.
McKinsey (2010) signals how important trust and influence are in WOM propagation:
“marketers may spend millions of dollars on elaborately conceived advertising
campaigns, yet often what really makes up a consumer’s mind is not only simple, but
also free: a word-of-mouth recommendation from a trusted source”. Also they suggest
three approaches towards WOM marketing: a consumer’s direct experience with a
product or service – experiential WOM, a consumer exposed to traditional advertising

Brand Advocates 2016
A. Frasin Page 18
passes on the message – consequential WOM and a marketer that uses celebrity
endorsement – intentional WOM.
Figure 6. WOM process (McKinsey, 2010)
McKinsey (2010) points out in the process illustrated in Figure 6 that in order for a
company to have a strong equity, fewer messages should be sent in terms of volume,
by close/trusted, influential people that point out relevant key buying factors based on
their own experience.
The positive effects of the antecedents of WOM, such as satisfaction, loyalty, service
quality, commitment, trust and perceived quality are well established in the literature
(de Matos and Vargas Rossi, 2008). The level of Satisfaction has an influence on
repurchase intentions and recommendation intentions (Bearden and Tell, 1983; Maxham
and Netemeyer, 2002a, b; Oliver, 1980; Ranaweera and Prahbu, 2003; Richins, 1983).
Loyalty is hypothesized as an antecedent of WOM because when customers are more
loyal to a given provider, they are also more likely to give positive recommendations, to
have greater motivation to process new information about the company and to have
stronger resistance to being persuaded by contrary information (Dick and Basu, 1994).

Brand Advocates 2016
A. Frasin Page 19
Empirical studies have demonstrated that perceived quality is a relevant predictor of
WOM (Bloemer et al., 1999; Boulding et al., 1993; Harrison-Walker 2001; Zeithaml et
al., 1996). The positive relation presented in these studies demonstrates that the higher
the service quality, the higher the WOM activity. Customers with higher commitment
levels will have a greater likelihood of spreading positive WOM, being stimulated by a
high satisfaction condition. The study of de Matos and Vargas Rossi (2008) reveals that
commitment is the main correlate of WOM, followed by perceived value, quality, trust,
satisfaction and loyalty. Also the study points out that the influence of loyalty on WOM is
significantly higher when looking at actual repurchase behavior than when looking at
intentions. Another finding shows that satisfaction has a stronger relationship with
positive WOM than loyalty does and reinforces the notion that satisfied customers are
not necessarily loyal (Matos et al., 2007; Reichheld, 1994).
The antecedents of WOM were presented in order to give a better overview on what
triggers the process of word-of-mouth. This present study will attempt to find positive
links between satisfaction, loyalty, trust and commitment when seen as antecedent
variables of WOM, leading to Brand Advocacy.
Further research is needed to investigate which are the success factors of future WOM
communication, what are the conditions under which consumers make
recommendations, does WOM work equally well in all industries and products, how
reliable and valuable is electronic-WOM and is its effect similar to the one of traditional
WOM’s.
2.6 What is Brand Advocacy?
“The driving force behind brand evangelism is that individuals simply want to
make the world a better place. Evangelism is about selling your dream so that
other people believe in it as much as you do”
Guy Kawasaki, Chief Evangelist, Apple Computer, Inc.
Why do people give enthusiastic recommendations to their friends, family, colleagues
and acquaintances and what triggers them to become reliable advocates of the brands

Brand Advocates 2016
A. Frasin Page 20
they prefer? These questions have received consistent interest from many scholars over
the years.
Throughout the researched literature, advocacy has been labeled as customer reference,
evangelism marketing, C2C engagement, social influence and it has been correlated in
one way or another to opinion leadership or market mavenism (Stokburger-Sauer and
Hoyer, 2009).
According to Anderson (1998), Brown et al. (2005), Swan et al. (1989) advocacy is one
of the consequences of customer satisfaction. Advocacy has been defined as the
willingness of the customer to give strong recommendations and praise to other
consumers on behalf of a products or service supplier (Hill et al., 2006; Harrison-Walker,
2001). Companies are measuring more and more the willingness to recommend as a
perceived consequence by the consumer of the performance and evaluation of the firm
(Reichheld, 2006). It has even been forwarded the fact that the willingness to
recommend is a much bigger proof of loyalty than willingness to repurchase, because
people enthusiastically recommend products or services to others when they have
strong feelings of trust and commitment towards the brand (Mazzarol et al., 2007;
Reichheld, 2003).
It is clear that customers become advocates of the brand when they are systematically
pleased with level of service provided (White and Schneider, 2000). Advocacy is a kind
of behavior in which consumers who are actively and attitudinally loyal to the brand
engage (Bodet, 2008; Bontis et al., 2007; Ganesh et al., 2000). These consumers act as
endorsers towards the brand because they are comfortable recommending the product,
brand or service provider to the people they care for (Fullerton, 2003; Wangenheim and
Bayon, 2004). However, source credibility is crucial for a message to be effective and it
often depends on the sender being perceived as credible, believable, competent and
trustworthy (Petty and Cacioppo, 1986). Besides credibility, one of the most important
characteristics of a recommendation is its independence. The more positive the maker is
rated, the more positively is his recommendation received (Röthlingshöfer, 2008).
Fullerton (2010) has found in his study that affective commitment, described in the
previous section, is the most significant determinant of consumer advocacy and that
Brand Advocates 2016
A. Frasin Page 21
normative commitment also plays a positive and supporting role. This comes to support
why the satisfaction alone, which is still a direct driver of customer advocacy (Fullerton,
2010), does not lead to forms of positive WOM and does not always result in advocacy
in the absence of affective or normative commitment.
The brand advocacy is about creating a mission and a brand experience that are so
inspiring to consumers that they become committed to a company and share their
enthusiasm with others (Meiners et al., 2010). What makes brand advocacy so powerful
today is the connection of the most powerful old means of persuasion, word-of-mouth,
with the newest one, the social network (Fetherstonhaugh, 2009). The company has to
take into consideration three main factors: the need of a good and successful product,
being a strong brand that has emotional relationship with consumers and has a brand
community and the creation of an open and transparent corporate and marketing
communication that integrates the customer in the marketing process, gains their trust
and generates long term relationship marketing (Meiners et al., 2010).
C2C engagement studies have given considerable attention to people with substantial
social effects on others, sometimes labeled as opinion leaders, influentials, influencers
or hubs (Goldenberg et al., 2006; Goldenberg et al., 2009; Watts and Dodds, 2007). The
role of people with such characteristics should be further explored, especially the
mechanisms they use and the magnitude of their social influence in online and offline
environment interactions.
In their study about consumer advisors, Stokburger-Sauer and Hoyer (2009) identify the
drivers of market mavenism and opinion leadership and point out that consumer with
tendencies towards these two traits represent powerful forces in the marketplace due to
their influence on the buying decisions of the other consumers. The authors point out
that these individuals are more or less satisfied than other consumers and they can be
categorized according to their need for variation or to their product category
involvement. The conclusions of their study show that opinion leaders possess superior
knowledge and can be a valuable construct in the co-creation process for a company.
The same findings, when exploring the motives of WOM, were reached for the
personality characteristic of market mavenism by Feick and Price (1987).

Brand Advocates 2016
A. Frasin Page 22
According to Lusch and Vargo (2006), customer co-creation involves “the participation in
the creation of the core offering itself. It can occur through shared inventiveness, co-
design or shared production of related goods.” Clearly, behaviors such as making
suggestions to improve the consumption experience, helping and coaching service
providers and helping other customers to consume better are all aspects of co-creation
and consumer engagement.
The concept of brand community has received both academic attention from scholars
(Fullerton, 2010; Kozinets, 2001; Muniz and O’Guinn, 2001) and managerial practice,
from P&G with its Tremor consumer advocacy panel or from Harley-Davidson. The
emergence of brand related customer communities as a unique type of social network
has still to be researched in terms of how customers affect each other and create new
forms of relationships with brands (Libai et al., 2010).
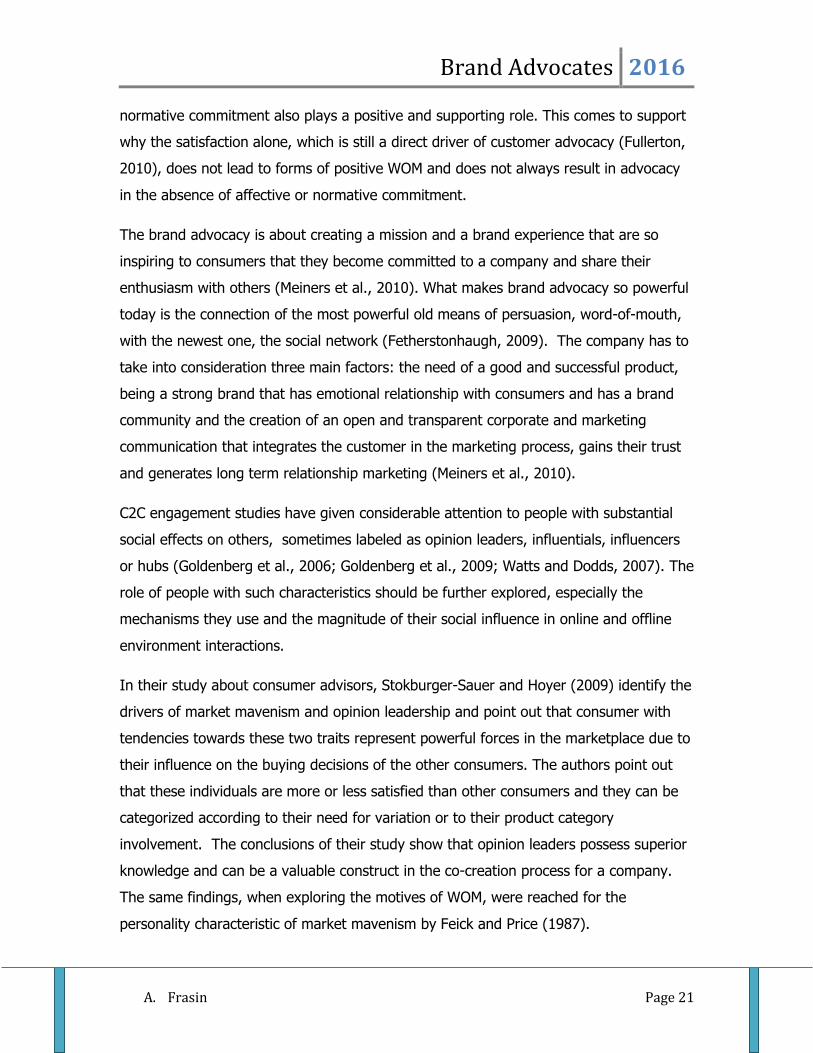
According to Figure 7, Kotler’s (1997, p.157) Customer Development Process, the
customer follows a step by step process from the moment he is just an element of the
market until he becomes a partner. The starting point is everyone who might
conceivably buy the products (suspects). A part of these suspects are considered by the
company prospects that it hopes to transform into first-time customers and if the is gap
between his quality expectations and the actual perceived one is small or inexistent,
their repurchase intentions will materialize and they will become repeat customers and
eventually clients, with whom the company will master the customer relationship
management. The challenge is now to transform these clients into members and then to
advocates who will enthusiastically recommend the brand others. After identifying them,
the last step is to turn them into partners and co-create tailored products and services
with their help. It is important to mention though, that at any given step of the process
the customer can become inactive or can defect.
Brand Advocates 2016
A. Frasin Page 23
Figure 7. Consumer Development Process (Kotler, 1997)
In the attempt of integrating the above described concepts in Kotler’s Customer
Development process, the framework in the present study could incorporate the
following hypotheses for further study (see Figure 8):
- Perceived quality and satisfaction links First-time customers and Repeat
customers.
- Loyalty links Repeat Customers to Clients
- Trust and Affective Commitment links Clients to Advocates
- Co-creation links Advocates to Partners
First-time customers
Repeat customers
Clients Advocates Partners
Suspects
Prospects
Disqualified prospects
Inactive or ex-customers

Brand Advocates 2016
A. Frasin Page 24
Figure 8. A conceptual framework for the process of engagement
2.7 What is a Super Promoter?
In his book, The Super Promoter (2011), Rijn Vogelaar introduces the concept of the
Super Promoter as someone who personifies the power of enthusiasm, shares the
enthusiasm and infects others with it, customers who make recommendations and bring
new customers in, employees who get really involved and change the work
environment, members from the public who stand up to defend something they believe
in, or people acting behind the scenes to ensure sales growth, building a good
reputation or creating more effective management.
In this study, the following definition of the concept will be used:
Super Promoters - Highly satisfied customers who share and wear their enthusiasm and
influence other people by spreading it around, through offline and online media.
First-time customers
Repeat customers
Clients Advocates Partners
Inactive or ex-customers
Perceived quality
Satisfaction Loyalty
Trust & Affective Commitment
Co-creation

Brand Advocates 2016
A. Frasin Page 25
The concept of the Super Promoter is built on three pillars: Enthusiasm, Sharing and
Influence. Enthusiasm is a result of experiencing new and exciting products, of having
a positive surprise after receiving unexpected excellent service, of authenticity without
advertorial hoax, of an open and honest company attitude towards its customers.
Sharing can be done spontaneously with active WOM, passively when prompted or by
copycat behavior: explicit invitation – making a recommendation or implicit invitation –
radiating enthusiasm. Influence can be attained by reciprocation, when the Super
Promoter makes recommendations to his social environment and expects his
environment to return the favor when chance permits it, by being committed and
consistent in opinions and behaviors, by social proof, when following the herd is a safe
choice and it simplifies decision making, by being liked and having charisma, the
influence increases and the Super Promoter is taken seriously by his own crowd of same
age, social class and attitudes, by having a certain degree of formal authority by virtue
or responsibilities, by having the perception of urgency, when people are more easily
persuaded and they take any advice as a hot tip.
2.8 Conclusion
When looking at all these constructs, we ask ourselves what causes consumers to
become enthusiastic and affectively committed advocates on behalf of their preferred
brands? At first glance, it might seem that all that product/service providers have to do
is to create satisfied customers. But eventually, the drivers of the various types of loyalty
behaviors will assert more influence on the process of becoming brand advocates.

Brand Advocates 2016
A. Frasin Page 26
Chapter 3 – Empirical Research: Design and Methodology
3.1 Research Method
The empirical study was started with some observations, followed by formulation of the
hypotheses. In order to investigate the proposed hypotheses and to show the strength
of the relationships between them, a survey method was put in place. The survey model
was tested on customers of Philips Senseo, using as a source an internal NPS database.
They were asked to respond to a series of questions ranging from self-assessing their
level of influence in a group, their level of satisfaction with the product, the actual state
of their enthusiasm towards the product to answering socio-demographic inquiries.
The primary purpose of this study was to address the research question: How do
consumers become enthusiastic and affectively committed advocates for their preferred
brands? This study tested a newly proposed model of customer engagement that
examines how other variables move customers through the Kotler’s Customer
Development Process to become strong brand advocates.
Model and Hypotheses
This study examines how loyal customers (satisfied first-time and repeat customers)
transform into Super Promoters (i.e., advocates and partners for the brand). Past
research documents the connection between satisfaction and customers’ loyalty, and
later advocacy on behalf of the brand (Gustafsson, Johnson and Roos, 2005). Once a
customer is loyal, his or her likelihood of becoming an advocate may be shaped by
developing trust and affective commitment that motivate sharing behaviors. This
motivation, combined with a strong knowledge of the market, may drive customers to
be extraordinary supporters of the brand. The present study tests a model of the
customer process, where trust, affective commitment, and market knowledge mediate
the relationship between customer satisfaction and Super Promoter status (see Figure
9).

Brand Advocates 2016
A. Frasin Page 27
Figure 9. Mediational customer advocacy model.
3.2 Questionnaire Design
Participants
Customers who purchased a Philips Senseo®, who previously registered their product
on the Customer Care web portal, and had responded to other questionnaires sent by
the company received an invitation to participate in the study. They were already
classified as loyal consumers (i.e. promoters with an NPS score of 9 and 10 in the Philips
database). Two hundred customers chose to participate and completed the survey.
Within the 200 participants, age ranged from 25 to 90 years old (M = 59.28, SD =
12.68), and gender was almost equally represented, with 45% (90) male participants
and 55% (110) female participants. The majority of participants had completed MBO
(56, 28%), followed by LBO/VMBO/MAVO (36, 18.0%), HBO (Bachelor; 36, 18.0%), and
HAVO/VWO (28, 14.0%). Some participants have only completed Geen/Basisschool (6,
3.0%), while others had completed WO (Master, PhD; 7, 3.5%). Almost all of the
participants either were currently unemployed (67, 33.5%) or had a vocational
occupation (63, 31.5%). While income levels ranged from less than €9,999 per year to
more than €100,000 per year, the most common income levels were €20,000 to €29,000
(26, 13.0%) and €30,000 to €39,999 (27, 13.5%).
Only loyal customers were included in the sample, as indicated by their ratings of how
likely they were to recommend Philips Senseo® to their friends, family, co-workers, and
Satisfaction Brand Advocates
Trust Affective Commitment
Market Knowledge

Brand Advocates 2016
A. Frasin Page 28
acquaintances on a scale from 0 (extremely unlikely) to 10 (extremely likely).
Responses to this item were scored similarly to Net Promoter Score introduced by
Reichheld (2003), with consumers categorized as “Promoters” if they rate
recommendation likelihood as a 9 or 10, “Passives” with ratings of 7 or 8, or
“Detractors” with ratings from 0 to 6. All of the participants had NPS of 9 or 10, which
classifies the entire sample as Promoters (i.e., loyal customers). Past research has
highlighted the importance of satisfaction, trust, and commitment in generating loyal
customers (Gustafsson, Johnson, and Roos, 2005). Thus, concurrent validity of
participants’ NPS was demonstrated by high satisfaction (M = 3.70, SD = 1.26), trust (M
= 3.95, SD = 1.00), and affective commitment (M = 2.64, SD = 1.27) ratings, with the
majority of respondents giving agree or strongly agree ratings for trust (67%) and
satisfaction (61%).
Measures
Participants completed a 40-question online survey. First, participants provided their
background and demographic information, including their name, gender, date of birth,
highest level of education completed, profession, income level, email address, and
telephone number. They also responded to several items about their attitudes and
behaviors, to be used only for a descriptive profile of Super Promoters. Specifically,
participants were asked to indicate the extent to which they agreed with several
statements using a 5-point Likert scale from strongly disagree to strongly agree.
Examples of the questions include, “People ask me about information on new products,
places to shop, sales, or discounts,” “I can easily convince other people of my ideas,”
and “I am seen by others as an enthusiastic person.” They also selected the statement
that described them best among three options: “I take decisions based on my feelings,”
“I take decisions based on facts,” and “I take decisions by consulting other people.”
They also provided information about their online and social networks (e.g., average
amount of hours spent online, number of contacts in their mobile phone, and number of
contacts on their social media accounts).
Sharing behaviors were measured using items asking about how and when participants
shared their enthusiasm about the Philips Senseo® with others. Specifically, they were
asked: (a) With whom do you share your enthusiasm about your Senseo? (b) In which

Brand Advocates 2016
A. Frasin Page 29
of the following situations have you recommended your Senseo? (c) Where you share
your enthusiasm about Senseo on the internet? and (d) their agreement with the
statement “I often share my opinions with others.” The sum of the number of different
groups of people, number of situations, number of online locations, and rating of
agreement indicated the participants’ degree of sharing behaviors (with missing values
replaced with 0 to permit the calculation of a sum).
Using a 5-point Likert scale from strongly disagree to strongly agree, participants rated
their agreement with the statement, “The quality of my Philips Senseo® meets my
expectations,” as measure of satisfaction, and, “I believe the brand Philips Senseo® is
trustworthy and keeps its promises,” as a measure of trust. To measure enthusiasm,
participants were asked if they are “more or less enthusiastic about [their] Senseo than
when [they] started using the product” (with less enthusiastic scored as -1, just as
enthusiastic scored as 0, and more enthusiastic scored as 1), and their level of
agreement with the statements, “I like talking about new products with my friends,” and
“I am seen by others as an enthusiastic person” (both scored on a 5-point Likert scale
from strongly disagree to strongly agree). The sum of 3 item responses indicated
enthusiasm level. All missing responses were replaced with a value of 0 to permit the
calculation of a sum for enthusiasm.
Three types of commitment were measured, affective, normative, and continuance,
using participant agreement ratings with 3 statements: “I feel emotionally attached to
the brand Philips Senseo,” “I am satisfied with my Philips Senseo because of its features
(design, ease of use, speed of preparation),” and “I have the feeling that Philips Senseo
is the only brand I can buy when I want to buy a coffee machine”), respectively. Only
the rating for affective commitment was used in this study, as normative commitment is
conceptually redundant with customer satisfaction, and continuance commitment is not
relevant to the theoretical examination of the behavior and characteristics of Super
Promoters.
Opinion leadership (a component of influence) was measured by the sum of the ratings
for 8 items: “People ask me about information on new products, places to shop, sales,
or discounts,” “People think of me as a good source of information when it comes to

Brand Advocates 2016
A. Frasin Page 30
new products or sales,” “I am a person who knows a lot about products and likes to help
people by sharing this info with others,” “In a group, I am often the central point,” “I
can easily convince other people o my ideas,” “In discussions about Philips Senseo, I
convince my friends of my ideas,” “Out of all these people, what percentage do you
think would/did by a Senseo, following your recommendations?” (coded as “0” for less
than 1% and “1” for 1% or more), and “Do you think you would/did play an important
role in other people’s decision to buy a Senseo?” (coded “0” for did not play a role and
“1” for played a role in at least one person’s decision). All missing responses were
replaced with a value of 0 to permit the calculation of a sum for opinion leadership.
Market knowledge (another component of influence) was measured by the sum of the
ratings on 3 items: “Compared to my circle of friends, I am very likely to be asked about
coffee machines,” “In general, I talk to my friends about coffee machines,” and “When I
talk about coffee machines, I give a great deal of information. All variables, together
with their respective questions, are summarized in Figure 10.
Figure 10. Overview of the variables employed in the survey
SatisfactionThe quality of my Philips Senseo® meets my expectations
TrustI believe the brand Philips Senseo® is trustworthy and
keeps its promises
CommitmentI feel emotionally attached to the brand Philips Senseo®
I am satisfied with my Philips Senseo® because of its features (design, ease of use, speed of preparation)
I have the feeling that Philips Senseo® is the only brand I can buy when I want to buy a coffee machine
Loyalty (NPS score)How likely are you to recommend Philips Senseo® to your
friends, family, co-workers and acquaintances?
Enthusiasm
Sharing/WOM
Influence/Opinion Leadership
Influence/ Market knowledgeI like talking about new products with my friends
I am seen by others as an enthusiastic person
Are you more or less enthusiastic about your Senseo® than when you started using this product?
Where do you share your enthusiasm about Senseo® on the internet?
In which of the following situations have you recommended your Senseo®?
With whom do you share your enthusiasm about your Senseo®?
People ask me about information on new products, places to shop, sales or discounts
How did you become a Senseo® owner?
People think of me as a good source of information when it comes to new products or sales
I am a person who knows a lot about products and likes to help people by sharing this info with others
In a group I am often the central point
I can easily convince other people of my ideas
I often share my opinions with others
In discussions about Philips Senseo®, I convince my friends of my ideas
Out of all these people, what percentage do you think would/did buy a Senseo®, following your recommendation?
Do you think you would/did play an important role in other people’s decision to buy a Senseo®?
Compared to my circle of friends, I am very likely to be asked about coffee machines
In general, I talk to my friends about coffee machines
When I talk to my friends about coffee machines, I give a great deal of information

Brand Advocates 2016
A. Frasin Page 31
3.3 Data Collection
Participants received an email inviting them to participate in the study, with the link to
the survey online. The introductory page of the survey explained to the participants the
purpose of the study, the estimated time needed to participate, and noted the risks and
benefits of participation before asking if they were willing to participate. People who
agreed to participate were presented with the survey items. After completing the survey
item, participants received a debriefing statement.

Brand Advocates 2016
A. Frasin Page 32
Chapter 4 – Empirical Research: Data Analysis
To summarize again the double purpose of this thesis study, the 2 main questions ask
about a set of criteria that would enable companies to identify the Super Promoters from
their database of loyal consumers and investigate the mediational relationship between
satisfaction, trust, affective commitment and market knowledge in relation with Super
Promoter status.
1. What criteria, according to the Super Promoter methodology
(Vogelaar, 2011) could be used to classify Super Promoters as such,
by selecting them from a pool of loyal consumers?
2. Can the Super Promoter status be explained a proposed mediational
customer advocacy model, including Satisfaction, Trust, Affective
Commitment and Market Knowledge (see Figure 4)?
(a) How does Satisfaction predict Super Promoter status?
(b) How does Satisfaction predict each of the other mediators: trust, affective
commitment and market knowledge?
(c) What is the relationship between each of the moderators and Super
Promoter status?
(d) Are the 3 variables Trust, Affective Commitment and Market Knowledge
mediating the relationship between Satisfaction and Super Promoter
status?
(e) Which one of them is a better predictor of Super Promoter status?
To answer the first question and establish the Super Promoter status, a classification
method that depended upon the three pillars established by past research has been
used: enthusiasm, sharing, and influence (Vogelaar, 2011). A participant was considered
a Super Promoter if he or she was in the top 25% of scores for each of the three
constructs of enthusiasm, opinion leadership and sharing. A total of 12% (24
Brand Advocates 2016
A. Frasin Page 33
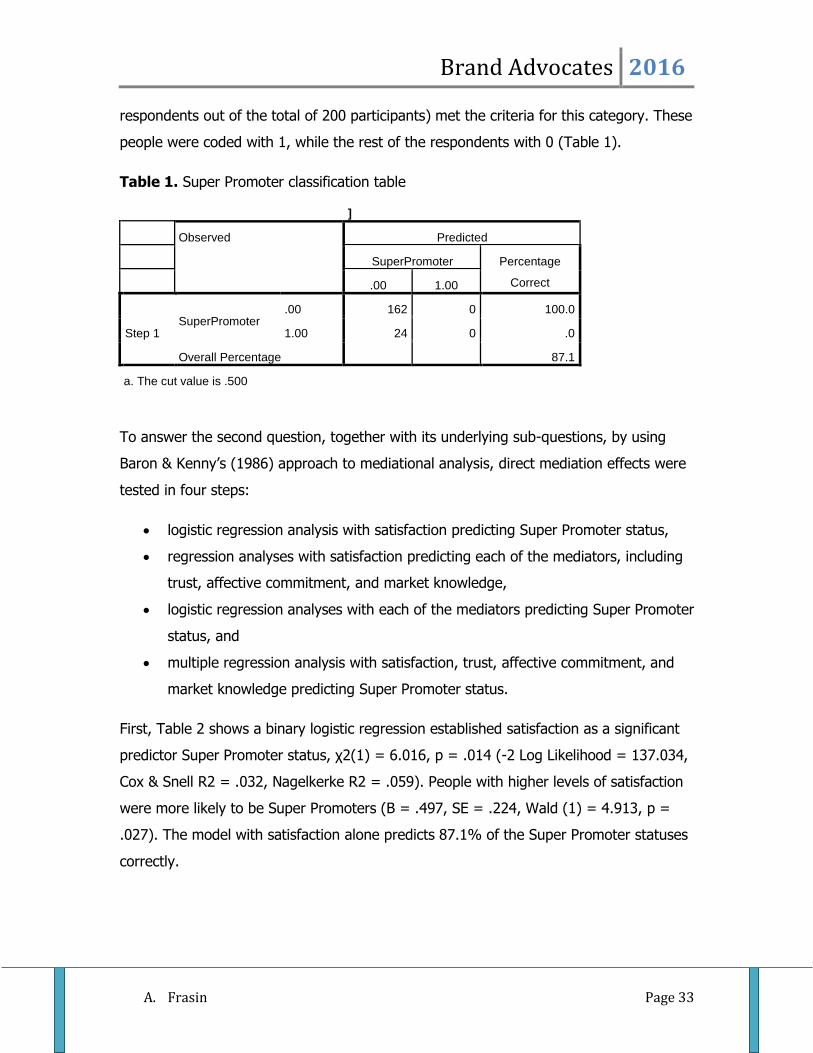
respondents out of the total of 200 participants) met the criteria for this category. These
people were coded with 1, while the rest of the respondents with 0 (Table 1).
Table 1. Super Promoter classification table
]
Observed Predicted
SuperPromoter Percentage
Correct .00 1.00
Step 1 SuperPromoter
.00 162 0 100.0
1.00 24 0 .0
Overall Percentage 87.1
a. The cut value is .500
To answer the second question, together with its underlying sub-questions, by using
Baron & Kenny’s (1986) approach to mediational analysis, direct mediation effects were
tested in four steps:
logistic regression analysis with satisfaction predicting Super Promoter status,
regression analyses with satisfaction predicting each of the mediators, including
trust, affective commitment, and market knowledge,
logistic regression analyses with each of the mediators predicting Super Promoter
status, and
multiple regression analysis with satisfaction, trust, affective commitment, and
market knowledge predicting Super Promoter status.
First, Table 2 shows a binary logistic regression established satisfaction as a significant
predictor Super Promoter status, χ2(1) = 6.016, p = .014 (-2 Log Likelihood = 137.034,
Cox & Snell R2 = .032, Nagelkerke R2 = .059). People with higher levels of satisfaction
were more likely to be Super Promoters (B = .497, SE = .224, Wald (1) = 4.913, p =
.027). The model with satisfaction alone predicts 87.1% of the Super Promoter statuses
correctly.

Brand Advocates 2016
A. Frasin Page 34
Table 2. Satisfaction as a predictor of Super Promoter status
Chi-square df Sig.
Step 6.016 1 .014
Block 6.016 1 .014
Model 6.016 1 .014
Model Summary
Step -2 Log likelihood Cox & Snell R Square Nagelkerke R Square
1 137.034a .032 .059
a. Estimation terminated at iteration number 6 because parameter estimates changed by less than .001.
Variables in the Equation
B S.E. Wald df Sig. Exp(B) 95% C.I.for
EXP(B)
Lower Upper
Step 1a Satisfaction .497 .224 4.913 1 .027 1.644 1.059 2.552
Constant -3.880 .967 16.108 1 .000 .021
a. Variable(s) entered on step 1: Satisfaction.
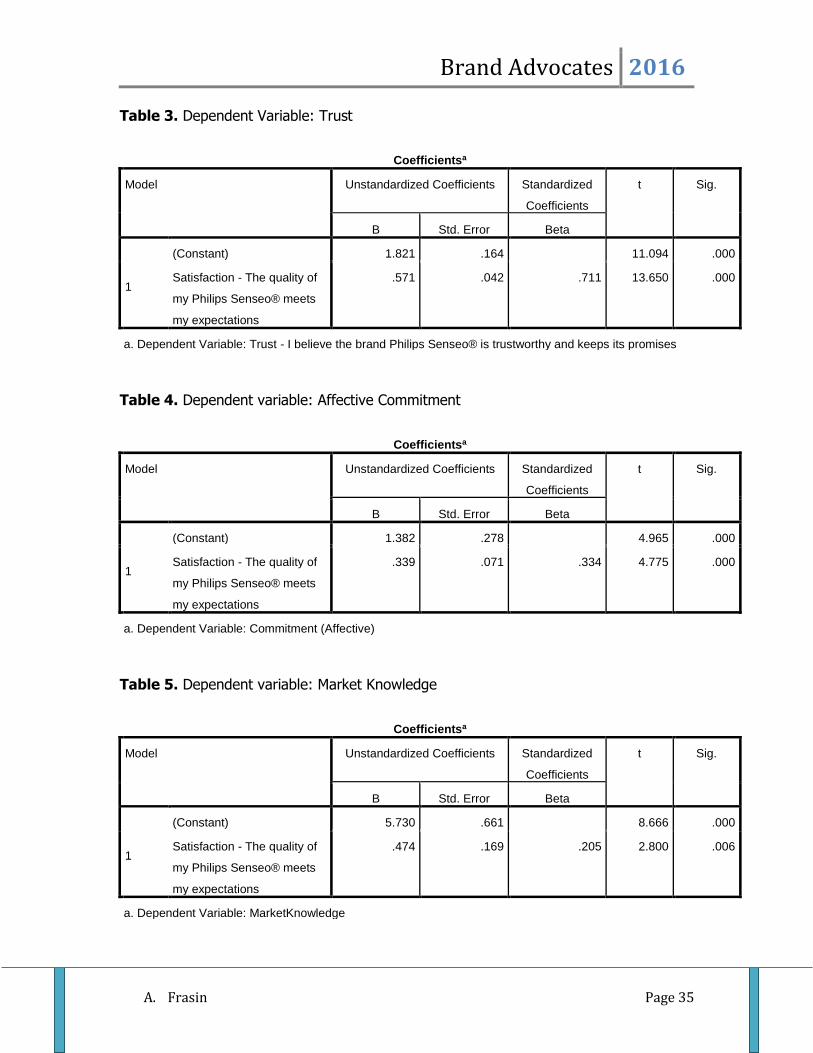
Second, simple regressions demonstrated that satisfaction significantly predicted each of
the mediators, including trust in Table 3 (β = .711, t(1)¬ = 13.65, p < .001), affective
commitment in Table 4 (β = .334, t(1)¬ = 4.78, p < .001), and market knowledge in
Table 5 (β = .205, t(1)¬ = 2.80, p = .006). People with higher levels of satisfaction
tended to have higher levels of trust, affective commitment, and market knowledge.
Brand Advocates 2016
A. Frasin Page 35
Table 3. Dependent Variable: Trust
Coefficientsa
Model Unstandardized Coefficients Standardized
Coefficients
t Sig.
B Std. Error Beta
1
(Constant) 1.821 .164 11.094 .000
Satisfaction - The quality of
my Philips Senseo® meets
my expectations
.571 .042 .711 13.650 .000
a. Dependent Variable: Trust - I believe the brand Philips Senseo® is trustworthy and keeps its promises
Table 4. Dependent variable: Affective Commitment
Coefficientsa
Model Unstandardized Coefficients Standardized
Coefficients
t Sig.
B Std. Error Beta
1
(Constant) 1.382 .278 4.965 .000
Satisfaction - The quality of
my Philips Senseo® meets
my expectations
.339 .071 .334 4.775 .000
a. Dependent Variable: Commitment (Affective)
Table 5. Dependent variable: Market Knowledge
Coefficientsa
Model Unstandardized Coefficients Standardized
Coefficients
t Sig.
B Std. Error Beta
1
(Constant) 5.730 .661 8.666 .000
Satisfaction - The quality of
my Philips Senseo® meets
my expectations
.474 .169 .205 2.800 .006
a. Dependent Variable: MarketKnowledge

Brand Advocates 2016
A. Frasin Page 36
Third, further logistic regressions examined the relationship between each mediator and
Super Promoter status. Trust in Table 6, χ2(1) = 12.257, p < 001 (87.0% correct
classification), affective commitment in Table 7, χ2(1) = 7.367, p = .007 (87.0% correct
classification), and market knowledge in Table 8, χ2(1) = 42.092, p < .001 (91.2%
correct classification) significantly predicted Super Promoter status. People were more
likely to be Super Promoters if they have higher levels of trust (B = .998, SE = .333,
Wald (1) = 8.975, p = .003), affective commitment (B = .477, SE = .182, Wald (1) =
6.909, p = .009), or market knowledge (B = .564, SE = .108, Wald (1) = 27.311, p <
.001).
Table 6. Trust as a predictor of Super Promoter status
Omnibus Tests of Model Coefficients
Chi-square df Sig.
Step 1
Step 12.257 1 .000
Block 12.257 1 .000
Model 12.257 1 .000
Classification Tablea
Observed Predicted
SuperPromoter Percentage
Correct .00 1.00
Step 1 SuperPromoter
.00 161 0 100.0
1.00 24 0 .0
Overall Percentage 87.0
a. The cut value is .500
Variables in the Equation
B S.E. Wald df Sig. Exp(B) 95% C.I.for
EXP(B)
Lower Upper
Step 1a Trust .998 .333 8.975 1 .003 2.714 1.412 5.215
Constant -6.146 1.512 16.531 1 .000 .002
a. Variable(s) entered on step 1: Trust.

Brand Advocates 2016
A. Frasin Page 37
Table 7. Affective commitment as a predictor of Super Promoter status
Omnibus Tests of Model Coefficients
Chi-square df Sig.
Step 1
Step 7.367 1 .007
Block 7.367 1 .007
Model 7.367 1 .007
Classification Tablea
Observed Predicted
SuperPromoter Percentage
Correct .00 1.00
Step 1 SuperPromoter
.00 161 0 100.0
1.00 24 0 .0
Overall Percentage 87.0
a. The cut value is .500
Variables in the Equation
B S.E. Wald df Sig. Exp(B) 95% C.I.for
EXP(B)
Lower Upper
Step 1a Commitment .477 .182 6.909 1 .009 1.612 1.129 2.301
Constant -3.296 .620 28.259 1 .000 .037
a. Variable(s) entered on step 1: Commitment.

Brand Advocates 2016
A. Frasin Page 38
Table 8. Market Knowledge as a predictor of Super Promoter status
Omnibus Tests of Model Coefficients
Chi-square df Sig.
Step 1
Step 42.092 1 .000
Block 42.092 1 .000
Model 42.092 1 .000
Classification Tablea
Observed Predicted
SuperPromoter Percentage
Correct .00 1.00
Step 1 SuperPromoter
.00 168 2 98.8
1.00 15 9 37.5
Overall Percentage 91.2
a. The cut value is .500
Variables in the Equation
B S.E. Wald df Sig. Exp(B) 95% C.I.for
EXP(B)
Lower Upper
Step 1a MarketKnowledge .564 .108 27.311 1 .000 1.758 1.423 2.173
Constant -7.078 1.120 39.911 1 .000 .001
a. Variable(s) entered on step 1: MarketKnowledge.
Lastly, the final step in the mediation analysis was a logistic regression including
satisfaction and all three of the mediators. The hypothesis that trust, affective
commitment, and market knowledge would mediate the relationship between customer
satisfaction and Super Promoter status was supported. Satisfaction significantly
predicted Super Promoter status in the first model, which excluded the mediators, but
was no longer a significant predictor once the mediators were added to the model.
A logistic regression with satisfaction and trust predicting Super Promoter status in Table
9 (χ2(2) = 12.203, p = .002) found that satisfaction was fully mediated (determined by
comparing the significance of the predictor without the mediator in the model, B = .497,
SE = .224, Wald (1) = 4.913, p = .027, to the significance of the predictor with the
mediator in the model, B = -.015, SE = .275, Wald (1) = .003, p = .955).

Brand Advocates 2016
A. Frasin Page 39
The lack of significance of satisfaction as a predictor when affective commitment (χ2(2)
= 9.743, p = .008, B = .344, SE = .232, Wald (1) = 2.199, p = .138) and market
knowledge (χ2(2) = 44.724, p < .001, B = .225, SE = .235, Wald (1) = .920, p = .337)
were in the model are evidence of full mediation for those variables, as well.
Trust (B = 1.007, SE = .418, Wald (1) = 5.790, p = .016), affective commitment (B =
.373, SE = .190, Wald (1) = 3.837, p = .05) and market knowledge (B = .562, SE =
.113, Wald (1) = 24.872, p < .001) remained significant predictors of Super Promoter
status, further supporting their roles as mediators.
Table 9. Satisfaction and Trust as predictors of Super Promoter status
Omnibus Tests of Model Coefficients
Chi-square df Sig.
Step 1
Step 12.203 2 .002
Block 12.203 2 .002
Model 12.203 2 .002
Variables in the Equation
B S.E. Wald df Sig. Exp(B)
Step 1a
Satisfaction -.015 .275 .003 1 .955 .985
Trust 1.007 .418 5.790 1 .016 2.737
Constant -6.114 1.507 16.466 1 .000 .002
a. Variable(s) entered on step 1: Satisfaction, Trust.

Brand Advocates 2016
A. Frasin Page 40
Table 10. Satisfaction and Affective Commitment as predictors of Super Promoter
status
Omnibus Tests of Model Coefficients
Chi-square df Sig.
Step 1
Step 9.743 2 .008
Block 9.743 2 .008
Model 9.743 2 .008
Variables in the Equation
B S.E. Wald df Sig. Exp(B)
Step 1a
Satisfaction .344 .232 2.199 1 .138 1.411
Commitment .373 .190 3.837 1 .050 1.452
Constant -4.351 1.001 18.898 1 .000 .013
a. Variable(s) entered on step 1: Satisfaction, Commitment.
Table 11. Satisfaction and Market Knowledge as predictors of Super Promoter status
Omnibus Tests of Model Coefficients
Chi-square df Sig.
Step 1
Step 44.724 2 .000
Block 44.724 2 .000
Model 44.724 2 .000
Variables in the Equation
B S.E. Wald df Sig. Exp(B)
Step 1a
Satisfaction .225 .235 .920 1 .337 1.253
MarketKnowledge .562 .113 24.872 1 .000 1.753
Constant -7.800 1.381 31.897 1 .000 .000
a. Variable(s) entered on step 1: Satisfaction, MarketKnowledge.
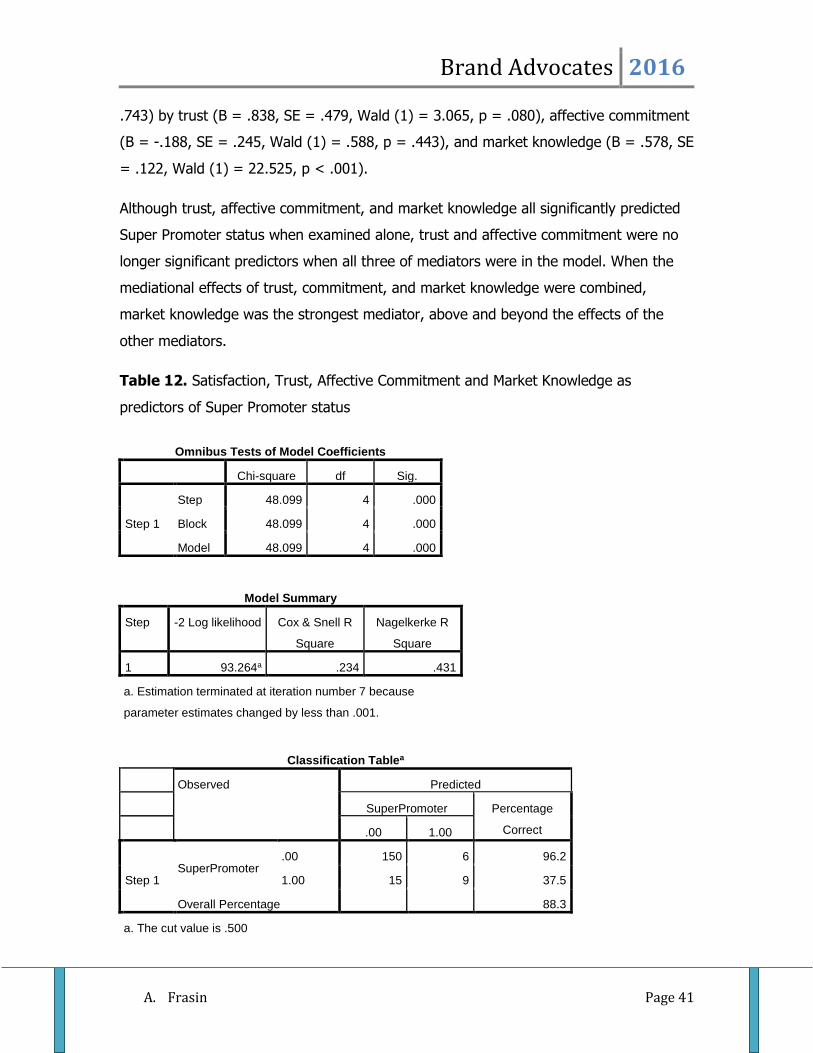
To examine whether one of the mediators was more or less influential than the others, a
multiple logistic regression included satisfaction and all of the mediators together in
Table 12, rather than in separate analyses, χ2(1) = 48.099, p < .001 (-2 Log Likelihood
= 93.264, Cox & Snell R2 = .234, Nagelkerke R2 = .431). The model predicted 88.3% of
the Super Promoter statuses correctly. As with the regressions with the individual
mediators, satisfaction was fully mediated (B = -.105, SE = .320, Wald (1) = .107, p =
Brand Advocates 2016
A. Frasin Page 41
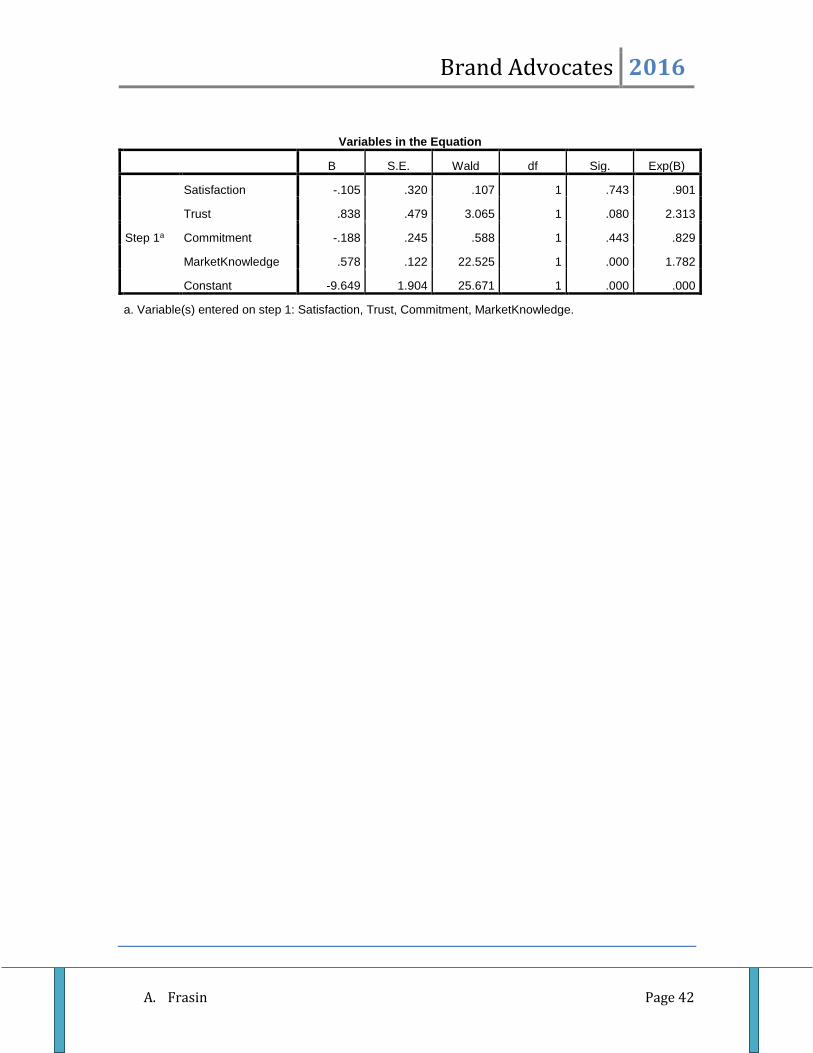
.743) by trust (B = .838, SE = .479, Wald (1) = 3.065, p = .080), affective commitment
(B = -.188, SE = .245, Wald (1) = .588, p = .443), and market knowledge (B = .578, SE
= .122, Wald (1) = 22.525, p < .001).
Although trust, affective commitment, and market knowledge all significantly predicted
Super Promoter status when examined alone, trust and affective commitment were no
longer significant predictors when all three of mediators were in the model. When the
mediational effects of trust, commitment, and market knowledge were combined,
market knowledge was the strongest mediator, above and beyond the effects of the
other mediators.
Table 12. Satisfaction, Trust, Affective Commitment and Market Knowledge as
predictors of Super Promoter status
Omnibus Tests of Model Coefficients
Chi-square df Sig.
Step 1
Step 48.099 4 .000
Block 48.099 4 .000
Model 48.099 4 .000
Model Summary
Step -2 Log likelihood Cox & Snell R
Square
Nagelkerke R
Square
1 93.264a .234 .431
a. Estimation terminated at iteration number 7 because
parameter estimates changed by less than .001.
Classification Tablea
Observed Predicted
SuperPromoter Percentage
Correct .00 1.00
Step 1 SuperPromoter
.00 150 6 96.2
1.00 15 9 37.5
Overall Percentage 88.3
a. The cut value is .500
Brand Advocates 2016
A. Frasin Page 42
Variables in the Equation
B S.E. Wald df Sig. Exp(B)
Step 1a
Satisfaction -.105 .320 .107 1 .743 .901
Trust .838 .479 3.065 1 .080 2.313
Commitment -.188 .245 .588 1 .443 .829
MarketKnowledge .578 .122 22.525 1 .000 1.782
Constant -9.649 1.904 25.671 1 .000 .000
a. Variable(s) entered on step 1: Satisfaction, Trust, Commitment, MarketKnowledge.
Brand Advocates 2016
A. Frasin Page 43
Chapter 5 – Conclusions and recommendations
Academic implications The hypothesized model with trust, affective commitment, and market knowledge
mediating the relationship between satisfaction and Super Promoter status was
supported. Satisfaction did not predict Super Promoter status, once the mediators were
accounted for. Rather, high satisfaction predicted higher levels of trust, commitment,
and market knowledge, which then predicted Super Promoter status. These findings
suggest that the transformation from loyal customer to Super Promoter takes more than
just satisfaction. Although satisfaction has been linked to advocacy in past research by
Anderson (1998), Brown et al. (2005), Swan et al. (1989), this study demonstrates that
loyal customers’ satisfaction contributes to their development of strong trust and
affective commitment to the brand, along with knowledge about the market. The
combination of high levels of trust, affective commitment, and market knowledge
encourages them to become Super Promoters. Managers today are in need of a different
method to measure how content their consumers are, besides only satisfaction or
market share. They need to measure their enthusiasm in a more accurate way, to make
sure the consumers are returning, they are happy and they share their positive feelings
with people around, recruiting more consumers.
Further, market knowledge appears to be especially important in the path to becoming a
Super Promoter. Market knowledge gives the consumer the title of market maven –
he/she can influence others’ opinions and behavior via the information possessed.
Managerial implications Advocates are incredible creators of reliable information and they influence opinions and
purchases of their friends. They love to help others, but they also like to be recognized
for it. They talk about their preferences, they are making decisions based on feelings or
reason and are willing to solve problems. They will be thankful you asked, appreciative
you have connected with them further and grateful for ongoing support and respect. A
company can look for them, give them exclusive membership to an advocacy platform,

Brand Advocates 2016
A. Frasin Page 44
offer them content that they can share with their audiences or use their knowledge for
co-creation purposes.
Future research Some limitations of the present study that come to mind might be that the paper has
been using a small sample size of only 200 respondents. As well, by selecting only loyal
customers opportunities might be missed in investigating what the passives (customers
with an NPS score of 7 or 8) need to become Super Promoters. Also, there is no
objective, established measure for classifying Super Promoters at this moment in
academic literature, no psychometrically-sound measures for satisfaction, or the rest of
the mediators. The analysis examines the direct effects of mediation, but not the indirect
effects. Another limitation of the study is that all responses given to the questionnaire
are based on self-perceived attitudes, rather than more objective measures. It appears
that a longitudinal design would be more appropriate for examining transformation or
changes from loyal customers to Super Promoters.
More research is needed to investigate which are the success factors of future WOM
communication, what are the conditions under which consumers make
recommendations, does WOM work equally well in all industries and products, how
reliable and valuable is electronic-WOM and is its effect similar to the one of traditional
WOM’s.
In the attempt of integrating the concepts in Kotler’s Customer Development process,
the framework in the present study can incorporate the following hypotheses for further
study (see Figure 8): Perceived quality and satisfaction links First-time customers and
Repeat customers; Loyalty links Repeat Customers to Clients; Trust and Affective
Commitment links Clients to Advocates; Co-creation links Advocates to Partners.

Brand Advocates 2016
A. Frasin Page 45
List of Figures:
Figure 1. Brand advocacy word cloud Figure 2. Chapter overview Figure 3. Consumer Relationship Lifecycle (MCorp Consulting, 2011) Figure 4. Mediational customer advocacy model Figure 5. NPS formula Figure 6. WOM process (McKinsey, 2010) Figure 7. Consumer Development Process (Kotler, 1997) Figure 8. A conceptual framework for the process of engagement Figure 9. Mediational customer advocacy model Figure 10. Overview of the variables employed in the survey
List of Tables:
Table 1. Super Promoter classification table Table 2. Satisfaction as a predictor of Super Promoter status Table 3. Dependent Variable: Trust Table 4. Dependent variable: Affective Commitment Table 5. Dependent variable: Market Knowledge Table 6. Trust as a predictor of Super Promoter status Table 7. Affective commitment as a predictor of Super Promoter status Table 8. Market Knowledge as a predictor of Super Promoter status Table 9. Satisfaction and Trust as predictors of Super Promoter status Table 10. Satisfaction and Affective Commitment as predictors of Super Promoter status Table 11. Satisfaction and Market Knowledge as predictors of Super Promoter status Table 12. Satisfaction, Trust, Affective Commitment and Market Knowledge as predictors of Super Promoter status

Brand Advocates 2016
A. Frasin Page 46
List of References
Aaker, D. A., (1991). Managing brand equity: Capitalising on the value of a brand name. The Free Press, New York.
Ahearne, M., Bhattacharaya, C. B., and Gruen, T., (2005). Antecedents and Consequences of Customer–Company Identification: Expanding the Role of Relationship Marketing. Journal of Applied Psychology, Vol. 90, No. 3, 574 –585.
Anderson, E. W., Fornell, C., and Mazvancheryl, S. K., (2004). Customer Satisfaction and Shareholder Value. Journal of Marketing 68 (October), 172 – 185.
Anderson, E., (1998). Customer satisfaction and word of mouth. Journal of Service Research 1 (1), 5–17.
Arndt, J., (1967). Role of product related conversations in the diffusion of a new product. Journal of Marketing Research 4, 291–295.
Bansal, H., Irving, G., and Taylor, S., (2004). A three-component model of customer commitment to service providers. Journal of the Academy of Marketing Science 32 (3), 234–250.
Baron, R. M., and Kenny, D. A., (1986). The moderator-mediator variable distinction in social psychological research: Conceptual, strategic, and statistical considerations. Journal of Personality and Social Psychology 51, 1173-1182.
Bearden, 0. W., and Teel, J. E., (1983). Selected determinants of consumer satisfaction and complaint behavior. Journal of Marketing Research 20, 21-28.
Bhattacharya, C.B., Rao, H., and Glynn, M. A., (1995). Understanding the Bond of Identification: An Investigation of Its Correlates Among Art Museum Members. Journal of Marketing 59 (October), 46–57.
Bloemer, J., de Ruyter, K., and Wetzels, M., (1999). Linking perceived service quality and service loyalty: a multi-dimensional perspective. European Journal of Marketing 33 (11/12), 1082-106.
Bloemer, J., and Odekerken-Schroder, G., (2007). The psychological antecedents of enduring customer relationships. Journal of Relationship Marketing 6 (1), 21–43.
Bodet, G., (2008). Customer satisfaction and loyalty in service: two concepts, four constructs, several relationships. Journal of Retailing and Consumer Services 12 (1), 156–162.
Bontis, N., Booker, L., and Serenko, A., (2007). The mediating effect of organizational reputation on customer loyalty and service recommendation in the banking industry. Management Decision 45 (9), 1426–1445.
Brand Advocates 2016
A. Frasin Page 47
Boulding, B., Kalra, A., Staelin, R., and Zeithaml, V., (1993). A Dynamic Process Model of Service Quality: From Expectations to Behavioral Intentions. Journal of Marketing Research (February), 7-27.
Brakus, J. J., Schmitt B. H., and Zarantonello, L., (2009). Brand Experience: What Is It? How Is It Measured? Does It Affect Loyalty?. Journal of Marketing 73 (May), 52- 68.
Brown, J. J., and Reingen, P. H., (1987). Social Ties and Word-of-Mouth Referral Behavior. Journal of Consumer Research 14 (3), 350-362.
Brown, T., Barry, T., Dacin, P., and Gunst, R., (2005). Spreading the word: investigating antecedents of consumers’ positive word of mouth intentions in a retailing context. Journal of the Academy of Marketing Science 33 (2), 123–138.
Caruana, A., (2002). Service Loyalty: The Effects of Service Quality and the Mediating role of Customer Satisfaction. European Journal of Marketing 36 (7), 811-828.
Chiou, J. S., and Droge, C., (2006). Service Quality, Trust, Specific Asset Investment, and Expertise: Direct and Indirect Effects in a Satisfaction-Loyalty Framework. Journal of the Academy of Marketing Science 34 (4), 613-627.
Cronin, J. J., and Taylor, S. A., (1992). Measuring service quality: A Reexamination and extension. Journal of Marketing 56, 55-68.
Cronin, J.J., Brady, M.K., and Hult, G.T.M., (2000). Assessing the effects of quality, value, and customer satisfaction on consumer behavioral intentions in service environments. Journal of Retailing 76(2), 193–218.
Dichter, E., (1966). How Word-of-Mouth Advertising Works. Harvard Business Review, (November-December), 147-166.
Dick, P., and Basu, K., (1994). Customerl oyalty: toward an integrated conceptual framework. Academy of Marketing Science Journal 22 (2), 99–113.
Feick, L. F., and Price, L. L., (1987). The market maven: A diffuser of market information. Journal of Marketing 51, 83–97.
Fetherstonhaugh, B., (2009). The 4Ps are out, the 4Es are in, retrieved July 22nd, 2012, from http://www.ogilvy.com/On-Our-Minds/Articles/the_4E_-are_in.aspx.
Fournier, S., Dobscha, S., and Mick, D., (1998). Preventing the premature death of relationship marketing. Harvard Business Review 76 (January–February), 42–51.
Fournier, S., and Mick, D., (1999). Rediscovering satisfaction. Journal of Marketing 63 (special), 5–23.
Fullerton, G., (2010). Creating advocates: The roles of satisfaction, trust and commitment. Journal of Retailing and Consumer Services
Fullerton, G., (2011). Creating advocates: the roles of satisfaction, trust and commitment. Journal of Retailing and Consumer Services 18, 92-100.

Brand Advocates 2016
A. Frasin Page 48
Ganesh, J., Arnold, M., and Reynolds, K., (2000). Understanding the customer base of service providers: an examination of the differences between switchers and stayers. Journal of Marketing 64 (3), 65–88.
Garbarino, E., and Johnson, M., (1999). The different roles of satisfaction, trust and commitment in customer relationships. Journal of Marketing 63 (2), 70–87.
Godes, D., Mayzlin, D., Chen, Y., Das, S., Dellarocas, C., Pfeiffer, B., Libai, B., and Sen, S., (2005). Marketing Letters 16 (3), 415-428.
Goldenberg, J., Barak, L., Muller, E., and Peres, R., (2006). Blazing Saddles: the Early and Mainstream Markets in the High-tech Product Life Cycle. Israel Economic Review 4, 85–108.
Goldenberg, J., Han, S., Lehman, D. R., and Hong, J. W., (2009). The role of hubs in the adoption process. Journal of Marketing 73(2), 1-13.
Gruca, T. S., and Rego, L. L., (2005). Customer Satisfaction, Cash Flow, and Shareholder Value. Journal of Marketing 69 (3), (July 2005), 1-130.
Gruen, T., Summers, J., and Acito, F., (2000). Relationship marketing activities, commitment and membership behaviors in professional associations. Journal of Marketing 64 (3), 34–49.
Gundlach, G. T., Achrol, R. S., and Mentzer, J. T., (1995). The Structure of Commitment in Exchange. Journal of Marketing 59 (January), 78-92.
Gustafsson, A., Johnson, M. D., and Roos, I., (2005). The Effects of Customer Satisfaction, Relationship Commitment Dimensions, and Triggers on Customer Retention. Journal of Marketing 69 (October), 210–18.
Harrison-Walker, J., (2001).The measurement of word-of-mouth communication and an investigation of service quality and customer commitment as potential antecedents. Journal of Service Research 4 (1), 60–75.
Harrison-Walker, L. J., (2001). The Measurement of Word-of-Mouth Communication and an Investigation of Service Quality and Customer Commitment as Potential Antecedents. Journal of Service Research 4, 60-75.
Hennig-Thurau, T., and Klee, A., (1997). The impact of customer satisfaction and relationship quality on customer retention: A critical reassessment and model development. Psychology and Marketing 14 (8): 737–764.
Hill, S., Provost, F., and Volinsky, C., (2006). Network based marketing: identifying likely adopters via consumer networks. Statistical Sciences 21 (2), 256–276.
Jones, T. O., and Sasser, W. E., Jr., (1995). Why satisfied customers defect. Harvard Business Review 73, 88-100.

Brand Advocates 2016
A. Frasin Page 49
Keaveney, S., and Parthasarathy, M., (2001). Customer Switching Behavior in Online Services: An Exploratory Study of the Role of Selected Attitudinal, Behavioral, and Demographic Factors. Journal of the Academy of Marketing Science 29 (4), 374-390.
Kotler, P., (1997). Marketing Management: Analysis, Planning, Implementation and Control. Hemel Hempstead: Prentice Hall International, 9th. Edition, 157.
Kozinets, R., (2001). Utopian enterprise: articulating the meanings of Star Trek’s culture of consumption. Journal of Consumer Research 28 (1), 67–88.
Lee, J. S., and Back K. J., (2008). Attendee-based brand equity. Tourism Management 29 (2)
Libai et al., (2010). Customer-to-Customer Interactions: Broadening the Scope of Word of Mouth Research. Journal of Service Research
Libai, B., Muller E., and Peres, R., (2009). The role of within-brand and cross-brand communications in competitive growth. Journal of Marketing 73 (3), 19-34.
Lusch, R. F., and Vargo, S. L., (2006). The service-dominant logic of marketing: Reactions, reflections, and refinements. Marketing Theory 6 (3), 281–288.
Matos, C., Henrique, J., and Rossi, C., (2007). Service recovery paradox: a meta-analysis. Journal of Service Research 10(1), 60-77.
Matos, C., Celso, A. de, and Vargas Rossi, A., (2008). Word-of-mouth communications in marketing: a meta-analytic review of the antecedents and moderators. Journal of the Academy of Marketing Science
Maxham, J. G. I., and Netemeyer, R. G., (2002a). A longitudinal study of complaining customers' evaluations of multiple service failures and recovery efforts. Journal of Marketing 66(4), 57- 71.
Maxham, J. G. I., and Netemeyer, R. G., (2002)b. Modeling customer perceptions of complaint handling over time: The effects of perceived justice on satisfaction and intent. Journal of Retailing 78(4), 239-252.
Mazzarol, T., Sweeney, J., and Soutar, G., (2007). Conceptualizing word of mouth activity, triggers and conditions: an exploratory study. European Journal of Marketing 41 (11/12), 1475–1494.
McKinsey (April 2010). A new way to measure word-of-mouth marketing. McKinsey Quarterly. Retrieved July 22nd, 2012, from https://www.mckinseyquarterly.com/A_new_way_to_measure_word-of-mouth_marketing_2567.
MCorp Consulting, Consumer Relationship Lifecycle, retrieved July 22nd, 2012, from http://www.mcorpcx.com/understanding-touchpoints-customer-relationship-lifecycle.

Brand Advocates 2016
A. Frasin Page 50
Meiners et al. (2010). The Renaissance of Word-of-Mouth Marketing: A 'New' Standard in Twenty-First Century Marketing Management?!. International Journal of Economic Sciences and Applied Research 3 (2), 79-97.
Meyer, J., Stanley, D., Herscovitch, L., and Topolnytsky, L., (2002). Affective, continuance and normative commitment to the organization: a meta-analysis of antecedents, correlates and consequences. Journal of Vocational Behavior 61, 20–52.
Moorman, C., Zaltman, G., and Deshpande, R., (1992). Relationships between buyers and users of market research: the dynamics of trust within and between organizations. Journal of Marketing Research 29 (3), 314–328.
Morgan, R., and Hunt, S., (1994). The commitment – trust theory of relationship marketing. Journal of Marketing 58 (2), 20–38.
Muniz, A., and O’Guinn, T., (2001). Brand community. Journal of Consumer Research 27 (4), 412–432.
Oliver, R. L., (1999). Whence consumer loyalty?. Journal of Marketing 63, 33-34.
Oliver, R. L., (1997). Satisfaction: A Behavioural Perspective on the Consumer, New York: McGraw Hill.
Olsen, S. O., (2002). Comparative Evaluation and the Relationship between Quality, Satisfaction, and Repurchase Loyalty. Academy of Marketing Science 30 (3), 240-249.
Ostrom, A.L., Bitner, M.J., Brown, S.W., Burkhard, K.A., Goul, M., Smith-Daniels, V., Demirkan, H., and Rabinovich, E., (2010). Moving forward and making a difference: Research priorities for the science of service. Journal of Service Research 13 (1), 23.
Palmatier, R., Dant, R., Grewal, D., and Evans, K., (2006). Factors influencing the effectiveness of relationship marketing: a meta-analysis. Journal of Marketing 70 (4), 136–173.
Pappu, R., and Quester, P., (2006). A consumer-based method for retailer equity measurement: Results of an empirical study. Journal of Retailing and Consumer Services 13 (5), 317-329.
Parasuraman, A., Zeithaml, V. A., and Berry, L. L., (1994). Reassessment of Expectations As A Comparison Standard in Measuring Service Quality: Implications for Further Research. Journal of Marketing 58 (Jan), 1, 111-124.
Petty, R. E., and Cacioppo, J. T., (1986). Communication and persuasion: Central and peripheral routes to attitude change. New York: Springer-Verlag.
Ranaweera, C., and Prabhu, J., (2003). The Influence of Satisfaction, Trust, and Switching Barriers on Customer Retention in a Continuous Purchasing Setting. International Journal of Service Industry Management, 14 (3/4), 374-395.
Rego, L. L., Billet, M. T., and Morgan, N. A., (2009). Consumer-Based Brand Equity and Firm Risk. Journal of Marketing 73 (November 2009), 47–60.

Brand Advocates 2016
A. Frasin Page 51
Reichheld, F., and Markey Jr., R. G., (2000). The loyalty effect – The relationship between loyalty and profits. European Business Journal 12(3), 134.
Reichheld, F., (2003). The one number you need to grow. Harvard Business Review 81 (December), 46–54.
Reichheld, F., (2006). The microeconomics of customer relationships. Sloan Management Review 47 (2), 73–78.
Richins, M.L., (1983). Negative Word-of-Mouth by Dissatisfied Consumers: A Pilot Study. Journal of Marketing 47 (Winter), 68-78.
Rust, R. T., Lemon, K. N., and Zeithaml, V. A., (2004). Return on Marketing: Using Customer Equity to focus Marketing Strategy. Journal of Marketing 68, 109-127.
Shi, M., and Verlegh, P., (2005). The Firm’s Management of Social Interactions.
Stokburger-Sauer, N.E., and Hoyer, W. D., (2009). Consumer advisors revisited: What drives those with market mavenism and opinion leadership and why? Journal of Consumer Behavior.
Sundaram, D.S., Mitra, K., and Webster, C., (1998). Wordof-Mouth Communications: A Motivational Analysis. Advances in Consumer Research 25, 527–531.
Swan, J., and Oliver, R., (1989). Post purchase communications by consumers. Journal of Retailing 65 (4), 516–563.
Szymanski, D., and Henard, D., (2001). Customer satisfaction: a meta-analysis of the empirical evidence. Journal of the Academy of Marketing Science 29 (1), 16–35.
Verhoef, Peter C., (2003). Understanding the Effect of Customer Relationship Management Efforts on Customers Retention and Customers Share Development. Journal of Marketing.
Verlegh et al., (2008). What drives Word of Mouth: A Multi-Disciplinary Perspective. Advances in Consumer Research 35.
Vogelaar, R., (2011). The Super Promoter. The power of Enthusiasm, Palgrave Macmillan.
Wangenheim, F.,and Bayon, T., (2004). Satisfaction, loyalty and word of mouth within the customer base of a utility provider: differences between stayers, switchers and referral switchers. Journal of Consumer Behaviour 3 (3), 211–220.
Watts, D.J., and Dodds, P.S., (2007). Influentials, Networks, and Public Opinion Formation. Journal of Consumer Research 34(4), 441-458.
Westbrook, R., (1987). Product/consumption based affective responses and post-purchase processes. Journal of Marketing Research 24 (3), 258–270.

Brand Advocates 2016
A. Frasin Page 52
White, S., and Schneider, B., (2000). Climbing the commitment ladder: the role of expectations disconfirmation and on customers’ behavioral intentions. Journal of Service Research 2 (3), 240–253.
WOMMA (2008). An Introduction to WOM Marketing with Definitions, retrieved July 22nd, 2012, from http://www.womma.org/wom101.
Zeithaml, V., Berry, L., and Parasuraman, A., (1996). The behavioral consequences of service quality. Journal of Marketing 60 (2), 31–46.

Brand Advocates 2016
A. Frasin Page 53
Appendix A: Survey Design
Page: 1
You and Your Senseo®
Dear Senseo® owner,
Thank you for purchasing Philips Senseo®!
Now that you have had time to use it, we'd love to know more about you and what Senseo®
means to you!
Would you mind taking 10 minutes to complete this survey? Just imagine the smell and taste of the coffee your Senseo makes and answer our questions.
Because we value your opinion, we would like to give you the best experience with our products.
Thank you and we look forward to hearing your opinion.
To open the survey please click on the link below.
Kind regards,
Philips Consumer Lifestyle
Start
Page: 2
You and Your Senseo®

Brand Advocates 2016
A. Frasin Page 54
First, we would like to find out a little more about you:
1.
Please indicate your name:
2
Please indicate your gender: *
Man
Woman
3.
What is your year of birth? *

Brand Advocates 2016
A. Frasin Page 55
4.
To what extent do you agree to these general statements?
Strongly Disagree Strongly Agree
I like talking about new products with my
friends
People ask me about information on new
products, places to shop, sales or discounts
People think of me as a good source of information when it comes to new products
or sales
I am a person who knows a lot about
products and likes to help people by sharing this info with others
5.
To what extent do these sentences apply to you?
Strongly Disagree Strongly Agree
In a group I am often the central point
I can easily convince other people of my ideas
I often share my opinions with others
I am seen by others as an enthusiastic person
6.
What describes you best?
I take decisions based on my feelings
I take decisions based on facts
I take decisions by consulting other people
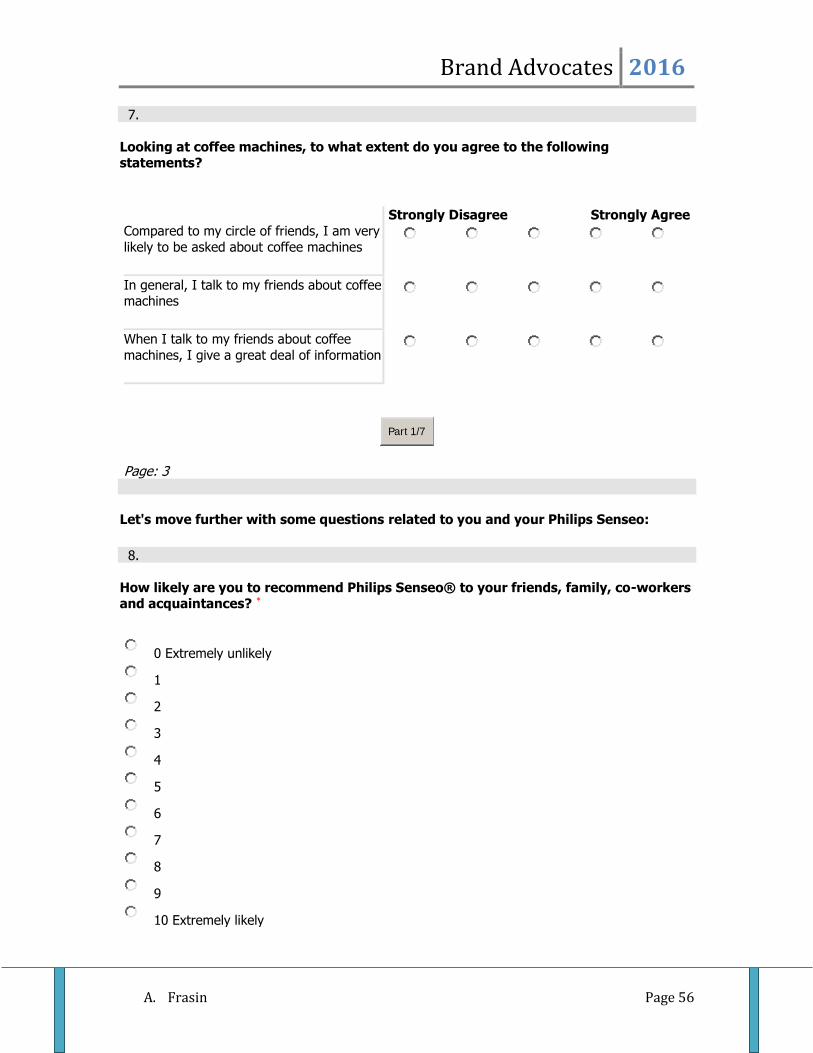
Brand Advocates 2016
A. Frasin Page 56
7.
Looking at coffee machines, to what extent do you agree to the following statements?
Strongly Disagree Strongly Agree
Compared to my circle of friends, I am very
likely to be asked about coffee machines
In general, I talk to my friends about coffee machines
When I talk to my friends about coffee
machines, I give a great deal of information
Part 1/7
Page: 3
Let's move further with some questions related to you and your Philips Senseo:
8.
How likely are you to recommend Philips Senseo® to your friends, family, co-workers and acquaintances? *
0 Extremely unlikely
1
2
3
4
5
6
7
8
9
10 Extremely likely
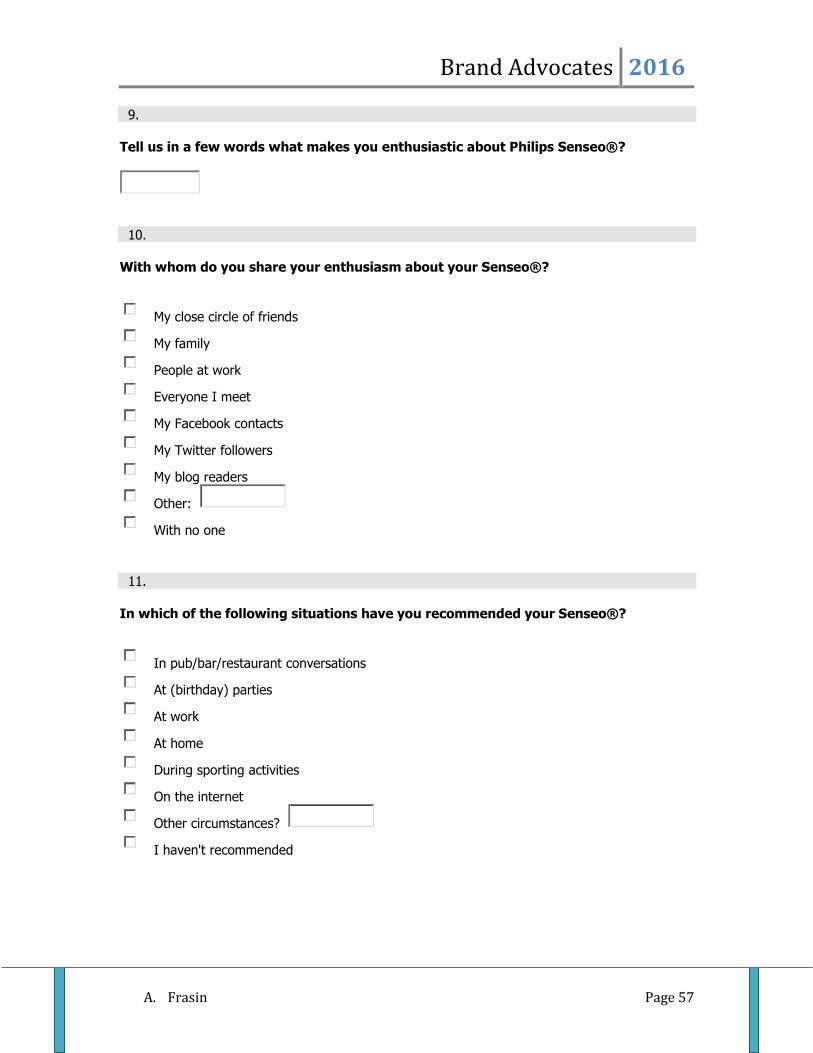
Brand Advocates 2016
A. Frasin Page 57
9.
Tell us in a few words what makes you enthusiastic about Philips Senseo®?
10.
With whom do you share your enthusiasm about your Senseo®?
My close circle of friends
My family
People at work
Everyone I meet
My Facebook contacts
My Twitter followers
My blog readers
Other:
With no one
11.
In which of the following situations have you recommended your Senseo®?
In pub/bar/restaurant conversations
At (birthday) parties
At work
At home
During sporting activities
On the internet
Other circumstances?
I haven't recommended
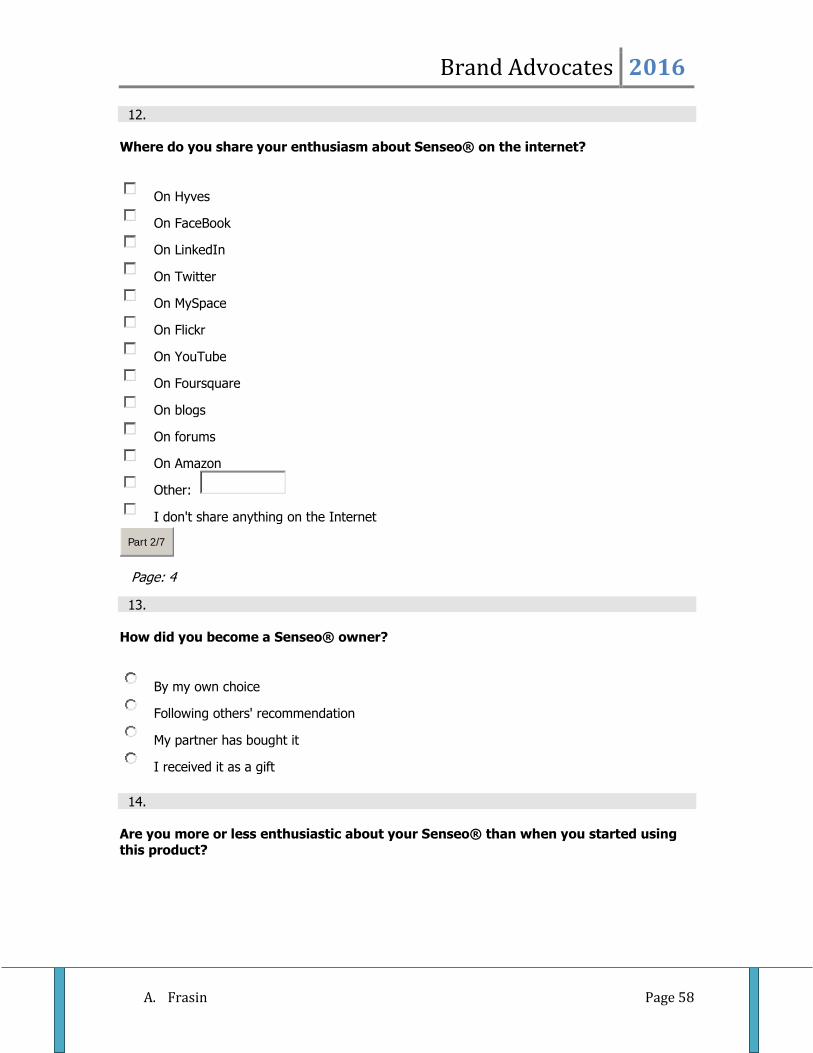
Brand Advocates 2016
A. Frasin Page 58
12.
Where do you share your enthusiasm about Senseo® on the internet?
On Hyves
On FaceBook
On LinkedIn
On Twitter
On MySpace
On Flickr
On YouTube
On Foursquare
On blogs
On forums
On Amazon
Other:
I don't share anything on the Internet
Part 2/7
Page: 4
13.
How did you become a Senseo® owner?
By my own choice
Following others' recommendation
My partner has bought it
I received it as a gift
14.
Are you more or less enthusiastic about your Senseo® than when you started using
this product?

Brand Advocates 2016
A. Frasin Page 59
More enthusiastic
Just as enthusiastic
Less enthusiastic
15.
Can you tell us why?
16.
In the last 6 months, how many times have you recommended Philips Senseo®?
17.
Out of all these people, what percentage do you think would/did buy a Senseo®, following your recommendation?
18.
Do you think you would/did play an important role in other people’s decision to buy a
Senseo®?
Yes, because people generally ask for my advice
Yes, because I communicate in a convincing way
Yes, because I give advice even if not asked for
Yes, because people see I own one
Yes, because:
No
Part 3/7

Brand Advocates 2016
A. Frasin Page 60
Page: 5
Below you can see some statements other people have made in relation to Senseo®. We would like to see how much you agree with each of them.
19.
How strongly do you agree with the following statements?
Strongly Disagree Strongly Agree
I believe the brand Philips Senseo® is trustworthy and keeps its promises
The quality of my Philips Senseo® meets
my expectations
I feel emotionally attached to the brand
Philips Senseo®
I am satisfied with my Philips Senseo® because of its features (design, ease of use,
speed of preparation)
I have the feeling that Philips Senseo® is
the only brand I can buy when I want to buy a coffee machine
In discussions about Philips Senseo®, I
convince my friends of my ideas
Part 4/7

Brand Advocates 2016
A. Frasin Page 61
Page: 6
20.
Did you show or explain to other people how Philips Senseo® works (design, ease of
use, taste of coffee) ?
Yes, in conversations
Yes, when friends are visiting my home
Yes, via mobile phone
Yes, via internet (movies, images)
Yes, other ways:
No
21.
If yes, what were the positive points people made?
22.
If yes, what were the negative points people made?
23.
If yes, what were the questions people asked?
24.
Is there anything Philips should do differently to make more and more people
appreciate Senseo?

Brand Advocates 2016
A. Frasin Page 62
Part 5/7
Page: 7 25.
What are three brands, no matter what product, that you are biggest fan of?
1.
2.
3.
26.
What could Senseo® learn from them?
27.
Do you own any other Philips products besides Senseo®? If yes, please mention which ones.
Yes:
No
Part 6/7

Brand Advocates 2016
A. Frasin Page 63
Page: 8
Almost at the end! Please tell us more about you, by answering the final questions.
28.
On average, for how many hours/week do you surf the Internet for personal activities (excluding time spent reading and writing emails)?
29.
How many contacts do you have in your mobile phone?
1-10
11-25
26-50
51-100
101-250
251-500
500+
30.
How many contacts do you have on your social media accounts?
Hyves:
FaceBook:
LinkedIn:
Twitter following (contacts you are following):
Twitter followers (contacts following you):
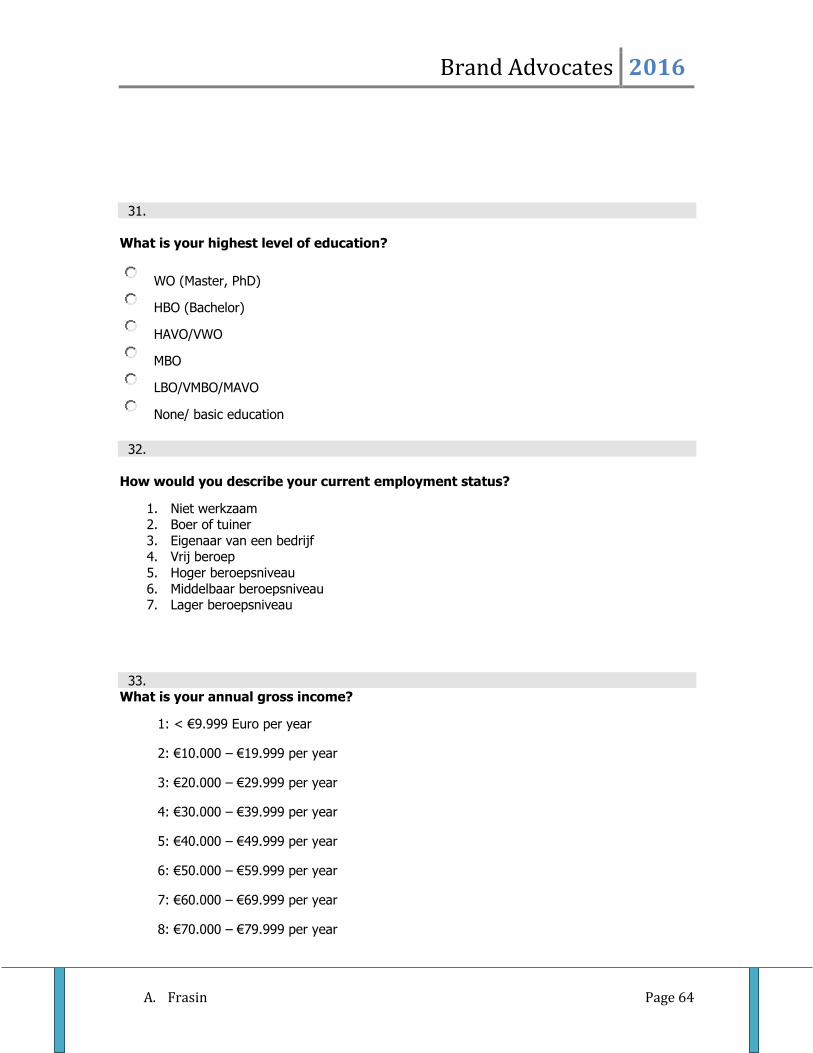
Brand Advocates 2016
A. Frasin Page 64
31.
What is your highest level of education?
WO (Master, PhD)
HBO (Bachelor)
HAVO/VWO
MBO
LBO/VMBO/MAVO
None/ basic education
32.
How would you describe your current employment status?
1. Niet werkzaam 2. Boer of tuiner
3. Eigenaar van een bedrijf 4. Vrij beroep
5. Hoger beroepsniveau
6. Middelbaar beroepsniveau 7. Lager beroepsniveau
33. What is your annual gross income?
1: < €9.999 Euro per year
2: €10.000 – €19.999 per year
3: €20.000 – €29.999 per year
4: €30.000 – €39.999 per year
5: €40.000 – €49.999 per year
6: €50.000 – €59.999 per year
7: €60.000 – €69.999 per year
8: €70.000 – €79.999 per year

Brand Advocates 2016
A. Frasin Page 65
9: €80.000 – €89.999 per year
10: €90.000 – €99.999 per year
11: €100.000 per year or more
99. Prefer not to answer
34.
In the future can Philips contact you again and ask for your opinion to help
improving our products?
Yes
No
35.
Would you have any objections if we re-contact you by email? If not, please provide
us with an email address on which we can reach you.
No objections, my email address is
Yes, I object
36.
Would you have any objections if we re-contact you by phone? If not, please provide
us with a phone number on which we can reach you.
No objections, my phone number is
Yes, I object
37.
Do you have any questions or comments?
Finish questionnaire

Brand Advocates 2016
A. Frasin Page 66
Appendix B: Survey results
Frequencies
Statistics
Sharing Enthusia
sm
OpinionLeaders
hip
N Valid 200 200 200 Missing 0 0 0
Mean 7.10 6.63 17.90 Std. Deviation 3.409 1.783 5.545 Percentiles 25 5.00 6.00 14.00
50 7.00 7.00 18.00
75 9.00 8.00 21.00
Frequencies
Statistics SuperProm
oter
N Valid 200
Missing 0
SuperPromoter
Frequency Percent
Valid Perce
nt
Cumulative
Percent
Valid .00 176 88.0 88.0 88.0
1.00 24 12.0 12.0 100.0
Total 200 100.0 100.0
Logistic

Brand Advocates 2016
A. Frasin Page 67
Regression
Case Processing Summary
Unweighted Cases N Percent
Selected Cases
Included in Analysis
186 93.0
Missing Cases
14 7.0
Total 200 100.0 Unselected Cases 0 0.0 Total 200 100.0
Dependent Variable
Encoding
Original Value
Internal Value
.00 0 1.00 1
Block 0: Beginning Block
Classification Table
Observed
Predicted
SuperPromoter Percentage
Correct
.00 1.00
Step 0 SuperPromoter
.00 162 0 100.0
1.00 24 0 0.0
Overall Percentage 87.1
Variables in the Equation
B S.E. Wald df Sig. Exp(B)

Brand Advocates 2016
A. Frasin Page 68
Step 0 Constant -1.910 .219
76.221
1 .000 .148
Variables not in the Equation
Score df Sig.
Step 0 Variables Satisfaction 5.274 1 .022
Overall Statistics 5.274 1 .022
Block 1: Method = Enter
Omnibus Tests of Model Coefficients
Chi-square df Sig.
Step 1 Step 6.016 1 .014
Block 6.016 1 .014
Model 6.016 1 .014
Model Summary
Step -2 Log
likelihood Cox & Snell R
Square
Nagelkerke R
Square
1 137.034 .032 .059
Hosmer and Lemeshow Test
Step Chi-
square df Sig.
1 .967 3 .809
Contingency Table for Hosmer and Lemeshow Test
SuperPromoter = .00 SuperPromoter
= 1.00
Total
Observed Expected Obser
ved Expect
ed
Step 1 1 13 13.540 1 .460 14
2 24 23.679 1 1.321 25

Brand Advocates 2016
A. Frasin Page 69
3 23 22.899 2 2.101 25
4 54 53.004 7 7.996 61
5 48 48.878 13 12.122 61
Classification Table
Observed
Predicted
SuperPromoter Percentage
Correct
.00 1.00
Step 1 SuperPromoter
.00 162 0 100.0
1.00 24 0 0.0
Overall Percentage 87.1
Variables in the Equation
B S.E. Wald df Sig. Exp(B)
95% C.I.for
EXP(B)
Lower Upper
Step 1 Satisfaction
.497 .224 4.913 1 .027 1.644 1.059 2.55
2
Constant -3.880 .967
16.108
1 .000 .021
Regression
Variables Entered/Removed
Model Variables Entered
Variables Removed Method
1 Satisfaction - The quality of my Philips Senseo® meets my expectations
Enter

Brand Advocates 2016
A. Frasin Page 70
Model Summary
Model R R Square Adjusted R Square
Std. Error of the Estim
ate
1 .711 .506 .503 .710
ANOVA
Model Sum of Squares df
Mean Squar
e F Sig.
1 Regression
93.814 1 93.81
4 186.31
1 .000
Residual 91.643 182 .504
Total 185.457 183
Coefficients
Model
Unstandardized Coefficients
Standardize
d Coefficients
t Sig.
B Std. Error Beta
1 (Constant)
1.821 .164 11.094 .000
Satisfaction - The quality of my Philips Senseo® meets my expectations
.571 .042 .711 13.650 .000
Regression

Brand Advocates 2016
A. Frasin Page 71
Variables Entered/Removed
Model Variables Entered
Variables Removed Method
1 Satisfaction - The quality of my Philips Senseo® meets my expectations
Enter
Model Summary
Model R R Square Adjusted R Square
Std. Error of the Estim
ate
1 .334 .111 .106 1.203
ANOVA
Model Sum of Squares df
Mean Squar
e F Sig.
1 Regression
32.985 1 32.98
5 22.796 .000
Residual 263.342 182 1.447
Total 296.326 183
Coefficients
Model
Unstandardized Coefficients
Standardize
d Coefficients
t Sig.
B Std. Error Beta
1 (Constant)
1.382 .278 4.965 .000
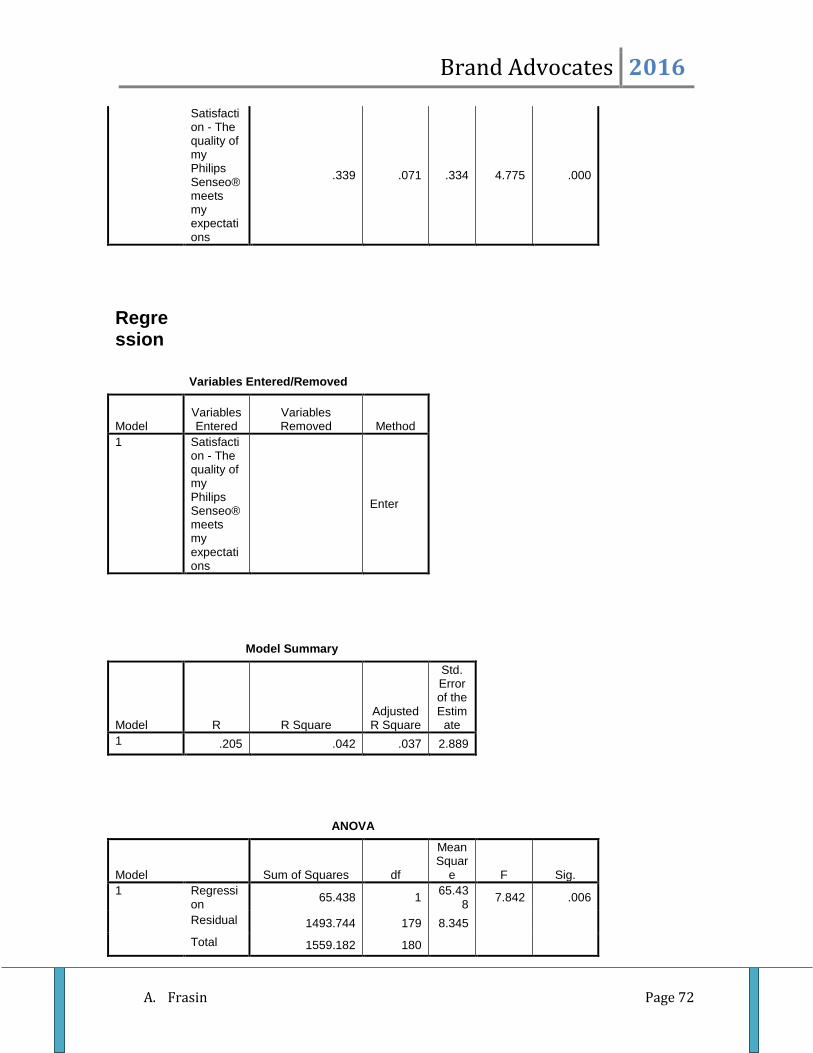
Brand Advocates 2016
A. Frasin Page 72
Satisfaction - The quality of my Philips Senseo® meets my expectations
.339 .071 .334 4.775 .000
Regression
Variables Entered/Removed
Model Variables Entered
Variables Removed Method
1 Satisfaction - The quality of my Philips Senseo® meets my expectations
Enter
Model Summary
Model R R Square Adjusted R Square
Std. Error of the Estim
ate
1 .205 .042 .037 2.889
ANOVA
Model Sum of Squares df
Mean Squar
e F Sig.
1 Regression
65.438 1 65.43
8 7.842 .006
Residual 1493.744 179 8.345
Total 1559.182 180

Brand Advocates 2016
A. Frasin Page 73
Coefficients
Model
Unstandardized Coefficients
Standardize
d Coefficients
t Sig.
B Std. Error Beta
1 (Constant)
5.730 .661 8.666 .000
Satisfaction - The quality of my Philips Senseo® meets my expectations
.474 .169 .205 2.800 .006
Logistic Regression
Case Processing Summary
Unweighted Cases N Percent
Selected Cases
Included in Analysis
185 92.5
Missing Cases
15 7.5
Total 200 100.0 Unselected Cases 0 0.0 Total 200 100.0
Dependent Variable
Encoding
Original Value
Internal Value
.00 0

Brand Advocates 2016
A. Frasin Page 74
1.00 1
Block 0: Beginning Block
Classification Table
Observed
Predicted
SuperPromoter Percentage
Correct
.00 1.00
Step 0 SuperPromoter
.00 161 0 100.0
1.00 24 0 0.0
Overall Percentage 87.0
Variables in the Equation
B S.E. Wald df Sig. Exp(B)
Step 0 Constant -1.903 .219
75.666
1 .000 .149
Variables not in the Equation
Score df Sig.
Step 0 Variables Trust 9.763 1 .002
Overall Statistics 9.763 1 .002
Block 1: Method = Enter
Omnibus Tests of Model Coefficients
Chi-square df Sig.
Step 1 Step 12.257 1 .000

Brand Advocates 2016
A. Frasin Page 75
Block 12.257 1 .000
Model 12.257 1 .000
Model Summary
Step -2 Log
likelihood Cox & Snell R
Square
Nagelkerke R
Square
1 130.515 .064 .119
Hosmer and Lemeshow Test
Step Chi-
square df Sig.
1 .470 2 .790
Contingency Table for Hosmer and Lemeshow Test
SuperPromoter = .00 SuperPromoter
= 1.00
Total
Observed Expected Obser
ved Expect
ed
Step 1 1 16 15.800 0 .200 16
2 33 33.563 2 1.437 35
3 65 64.503 7 7.497 72
4 47 47.134 15 14.866 62
Classification Table
Observed
Predicted
SuperPromoter Percentage
Correct
.00 1.00
Step 1 SuperPromoter
.00 161 0 100.0
1.00 24 0 0.0
Overall Percentage 87.0
Variables in the Equation
B S.E. Wald df Sig. Exp(B)
95% C.I.for
EXP(B)
Lower Upper

Brand Advocates 2016
A. Frasin Page 76
Step 1 Trust .998 .333 8.975 1 .003 2.714 1.412
5.215
Constant -6.146 1.512
16.531
1 .000 .002
Logistic Regression
Case Processing Summary
Unweighted Cases N Percent
Selected Cases
Included in Analysis
185 92.5
Missing Cases
15 7.5
Total 200 100.0 Unselected Cases 0 0.0 Total 200 100.0
Dependent Variable
Encoding
Original Value
Internal Value
.00 0 1.00 1
Block 0: Beginning Block
Classification Table
Observed
Predicted
SuperPromoter Percentage
Correct
.00 1.00
Step 0 .00 161 0 100.0
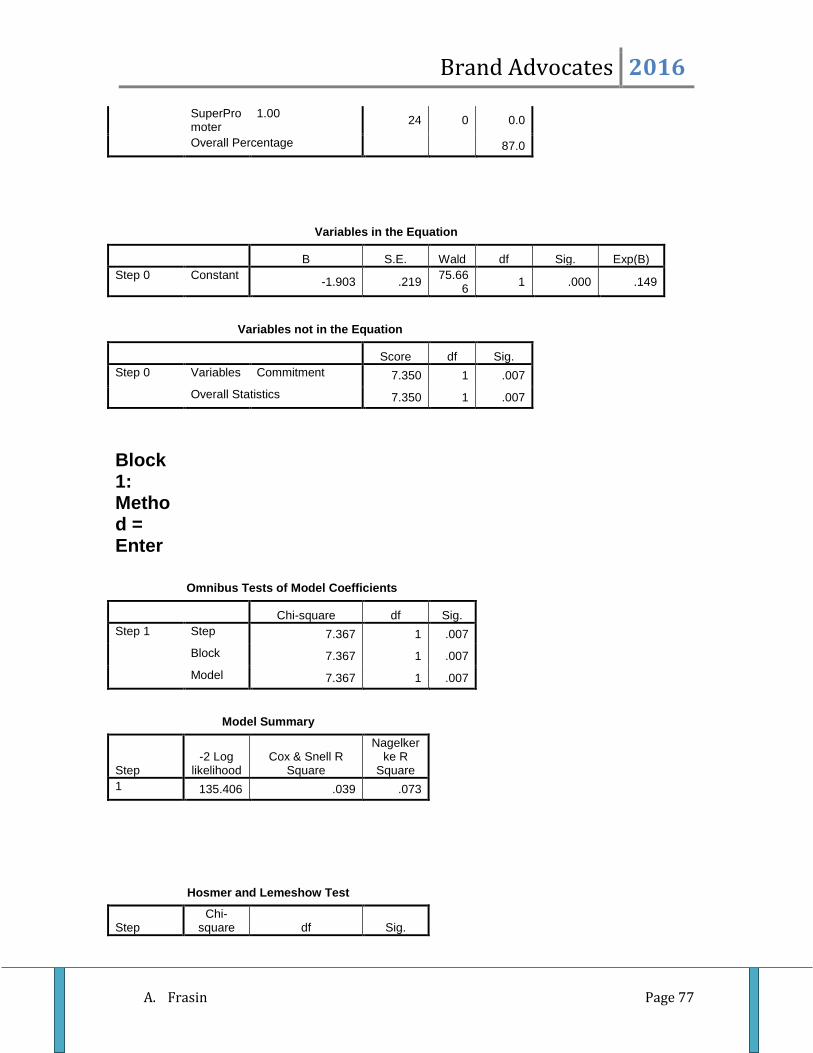
Brand Advocates 2016
A. Frasin Page 77
SuperPromoter
1.00 24 0 0.0
Overall Percentage 87.0
Variables in the Equation
B S.E. Wald df Sig. Exp(B)
Step 0 Constant -1.903 .219
75.666
1 .000 .149
Variables not in the Equation
Score df Sig.
Step 0 Variables Commitment 7.350 1 .007
Overall Statistics 7.350 1 .007
Block 1: Method = Enter
Omnibus Tests of Model Coefficients
Chi-square df Sig.
Step 1 Step 7.367 1 .007
Block 7.367 1 .007
Model 7.367 1 .007
Model Summary
Step -2 Log
likelihood Cox & Snell R
Square
Nagelkerke R
Square
1 135.406 .039 .073
Hosmer and Lemeshow Test
Step Chi-
square df Sig.

Brand Advocates 2016
A. Frasin Page 78
1 1.648 3 .649
Contingency Table for Hosmer and Lemeshow Test
SuperPromoter = .00 SuperPromoter
= 1.00
Total
Observed Expected Obser
ved Expect
ed
Step 1 1 45 45.297 3 2.703 48
2 31 31.016 3 2.984 34
3 48 48.482 8 7.518 56
4 27 24.801 4 6.199 31
5 10 11.405 6 4.595 16
Classification Table
Observed
Predicted
SuperPromoter Percentage
Correct
.00 1.00
Step 1 SuperPromoter
.00 161 0 100.0
1.00 24 0 0.0
Overall Percentage 87.0
Variables in the Equation
B S.E. Wald df Sig. Exp(B)
95% C.I.for
EXP(B)
Lower Upper
Step 1 Commitment
.477 .182 6.909 1 .009 1.612 1.129 2.30
1
Constant -3.296 .620
28.259
1 .000 .037
Logistic Regression
Case Processing Summary
Unweighted Cases N Percent

Brand Advocates 2016
A. Frasin Page 79
Selected Cases
Included in Analysis
194 97.0
Missing Cases
6 3.0
Total 200 100.0 Unselected Cases 0 0.0 Total 200 100.0
Dependent Variable
Encoding
Original Value
Internal Value
.00 0 1.00 1
Block 0: Beginning Block
Classification Table
Observed
Predicted
SuperPromoter Percentage
Correct
.00 1.00
Step 0 SuperPromoter
.00 170 0 100.0
1.00 24 0 0.0
Overall Percentage 87.6
Variables in the Equation
B S.E. Wald df Sig. Exp(B)
Step 0 Constant -1.958 .218
80.607
1 .000 .141
Variables not in the Equation
Score df Sig.
Step 0 Variables MarketKnowledge 39.981 1 .000

Brand Advocates 2016
A. Frasin Page 80
Overall Statistics 39.981 1 .000
Block 1: Method = Enter
Omnibus Tests of Model Coefficients
Chi-square df Sig.
Step 1 Step 42.092 1 .000
Block 42.092 1 .000
Model 42.092 1 .000
Model Summary
Step -2 Log
likelihood Cox & Snell R
Square
Nagelkerke R
Square
1 103.119 .195 .370
Hosmer and Lemeshow Test
Step Chi-
square df Sig.
1 6.764 6 .343
Contingency Table for Hosmer and Lemeshow Test
SuperPromoter = .00 SuperPromoter
= 1.00
Total
Observed Expected Obser
ved Expect
ed
Step 1 1 22 21.900 0 .100 22
2 26 26.689 1 .311 27
3 27 26.344 0 .656 27
4 25 23.951 0 1.049 25
5 15 15.785 2 1.215 17
6 26 26.424 4 3.576 30
7 13 15.348 6 3.652 19

Brand Advocates 2016
A. Frasin Page 81
8 16 13.559 11 13.441 27
Classification Table
Observed
Predicted
SuperPromoter Percentage
Correct
.00 1.00
Step 1 SuperPromoter
.00 168 2 98.8
1.00 15 9 37.5
Overall Percentage 91.2
Variables in the Equation
B S.E. Wald df Sig. Exp(B)
95% C.I.for
EXP(B)
Lower Upper
Step 1 MarketKnowledge
.564 .108 27.31
1 1 .000 1.758 1.423
2.173
Constant -7.078 1.120
39.911
1 .000 .001