the journal of business leadership
TRANSCRIPT

THE JOURNAL OF BUSINESS LEADERSHIP
Published by the
American National Business Hall of Fame
Austin Peay State University
Clarksville, TN 37044
Copyright 2013
Journal of Business Leadership
ISSN 2164-4454 (online) ISSN 2164-4462 (Print)

The Journal of Business Leadership
Editorial Staff
Journal Board of Editors
James McCabe, University of LouisvilleFaud Derakhshan, California State University-FresnoKamal Fatehi-Sedeh, Wichita State UniversityFred Fry, Bradley UniversityDavid Gardner, University of IllinoisEdmund Gray, Loyola Marymount UniversityLee Graf, Illinois State UniversityJohn Grant, Ohio Dominican UniversityRichard Hattwick, Western Illinois University (R)Gerald E. Hills, University of Illinois at Chicago CircleRobert Jefferson, Western Kentucky UniversityDarrell Jones, Western Michigan UniversityYanus Kathawala, Eastern Illinois UniversityEd Knod, Western Illinois UniversityVictoria McCarthy, Austin Peay State UniversityDouglas Naffziger, Ball State UniversityJohn Olyienk, Colorado State UniversityAnna Parkman, Ohio Dominican UniversityDavid Sprague, Central Michigan UniversityBecky Starnes, Austin Peay State UniversityJerry Wall, Northeast Louisiana UniversityLarry Wall, Western Illinois UniversityJay Young, Ohio Dominican University
Journal and Proceedings EditorRobyn W. Hulsart, Austin Peay State University
Copyright and Permission to Copy The Journal of Business Leadership owns the copyright of all content published within it. Permission to copy JBL content is subject to the fair use principles of U.S. copyright law. For permission to copy JBL materials, contact the Journal Editor by e-mail or mail at JBL, c/o R. Hulsart, APSU, P.O. Box 4455, Clarksville, TN 37044; or [email protected].
TABLE OF CONTENTS
Dressing for Success: How Does Attire, Social Media and the Law Impact Hiring
5………………………Nina Radojevich-Kelley, David L. Hoffman and Deborah Gillard
The Great Recession of 2008: An Exploratory Case Study of the Impact of the Recession of Five Small Businesses in Hawaii
28………………...………Nina Radojevich-Kelley, David L. Hoffman and Gregory Black
Water Rights Arrangements in Australia and Colorado: A Comparison Focused on Possible Lessons from the
Australian Water Reform Program57………………………………………………………………………Elizabeth McVicker
The Regulatory Trade-Off in Real & Financial Markets74…………...…………………………………………………………….…..Bodo Herzog
A Model of High-Tech Entrepreneurial Careers:The Life and Career of Steve Jobs
87..……………...Amy E. Hurley-Hanson, Cristina M. Giannantonio, and Richard Sudek
The Financial Literacy of Maori: Relative to Europeans in New Zealand102…………………………………………………………………….………Steve Agnew
Altruism and the family business: A blessing or a curse?117………………………....George S. Vozikis, Edward Reighard, and Robert M. Harper

The Journal of Business Leadership
Editor’s PrefaceThe Journal of Business Leadership [JBL] is the official journal of the American National Business Hall of Fame [ANBHF]. The ANBHF conducts an active research program with three primary objectives. The first objective is to collect and analyze information regarding the leadership skills of Hall of Fame members. The Hall believes that business success stories are an important part of American history and strives to document and preserve these stories.
The second objective of the research program is to support the research objectives of the associated academic journal, JBL, through support of certain areas of business leadership, ethical practices and management academic research.
The third objective is to evaluate the effectiveness of Hall of Fame classroom presentations. Evaluation instruments are developed and administered in classes following Hall of Fame presentations.
In support of the ANBHF mission, The Journal of Business Leadership is a multidisciplinary journal of interest to scholars, professionals, students, and practitioners in a broad range of management thinking. The purpose of the journal is to encourage the publication of case studies of business leadership. In keeping with the Hall’s longitudinal study, The Ethical Views of Business Leaders, University Faculty and Students in the United States, submissions highlighting ethical leadership practices are encouraged.
JBL offers both peer-reviewed and non-peer-reviewed articles. All peer-reviewed articles must meet the highest and most rigorous standards and are anonymously reviewed by at least two scholars in the field. Non-peer-reviewed materials can be essay, research-in-progress, pilot studies, or commentary on some topic relevant to the field of business leadership. All non-peer-reviewed materials will be reviewed by the Editorial Board for quality and appropriateness, but are not guaranteed publication.
Welcome to this issue of The Journal of Business Leadership.
Robyn Hulsart, Ed.D.Contributing Editor
The Journal of Business Leadership
5
Dressing for Success: How Does Attire, Social Media and the Law Impact Hiring?
Nina Radojevich-Kelley, David L. Hoffman and Deborah GilliardMetropolitan State University of Denver
ABSTRACT
Over the past 100 years, dress codes have gone through several changes. Before 1995, the traditional work attire reflected the IBM standard which included a dark suit, white shirt, and red tie. During the Silicon Valley boom if the 1990’s, informal work environments and casual dress spread throughout the country. In recent years, public attitudes shifted away from business casual, reverting towards more formal dress codes. Unfortunately, most young employees do not know what business formal looks like. This paper examines the role that attire, social media and the law have in the hiring, recruiting, retention and culture of the current workforce. An analysis of the law, discussion and suggestions for dressing appropriately during the hiring and recruiting process are included.
INTRODUCTION
Over the last 20 years and largely due to the dot-com era, dress codes were challenged
causing a tremendous shift in dress code policies among organizations in various industries
(Bliss, 2008). Historically, how people dressed told observers what an individuals job was, what
industry you worked in and what you did day to day (Gragg, 2004). Today it is not that simple,
dress codes are more complex (Gragg, 2004) and there is tremendous “meshing” among what
employees wear from industry to industry.
Through the years, dress code policies evolved (Dale, Bevill, Roach, and Glasgow, 2007)
from business formal attire towards business casual and more recently to business conservative
dress in the workplace. Unfortunately, many younger workers do not understand anything except
for casual work attire (Munoz, 2001; Dale et al, 2007). In addition, it is unlikely that younger
generations will accept a more uptight, formal dress code policy because it is foreign to them
(Munoz, 2001). Many younger employees simply consider the business suit one more option for
dressing in the workplace, but not a requirement nor necessity.
The Journal of Business Leadership
6
Due to the multitude of potential dress options, for most people the problem lies with
deciding what to wear to a job interview or during the first week of work. This uncertainty
becomes a huge burden, is stressful, confusing and complex for future employees. There are just
too many options, too much uncertainty and too much variation from business to business.
The terms business formal and business casual have different meanings for different
people. For some, business casual is a relaxed casual suit, while others interpret it as torn jeans
and a washed-out t-shirt. In fact, the old rule…’when in doubt employees should dress more
formal, rather than casual’ is no longer valid. Many hiring managers claim that a potential
candidate is judged on appropriateness of attire and if overdressed might get overlooked because
they are viewed as uptight (Gragg, 2004) or not a good “fit” for a relaxed corporate culture.
For decades, researchers have examined the role that appearance plays in the workforce,
thus confirming its importance in the workplace. Studies show time and again, that how
individuals decide to dress impacts and have consequences to the way that others perceive them
(Cullen, 2008). If an individual is dressed inappropriate, it may prevent them from getting hired.
The overarching problem is that the average employee may not know what is considered
appropriate or acceptable dress in the workplace.
Due to these concerns and for the purpose of this paper, the authors examined business
casual, business formal, the law and various uses of social media in the hiring and recruiting
process. The intent was to uncover what is considered acceptable or unacceptable dress, how
social media profiles are used today from business perspectives and what the law states in order
to make recommendations to help the newly emerging workforce.
BEAUTY AND APPEARANCE FACTS
Appearance has always been important in the workplace because it is the first thing a
customer is exposed to from an organizational perspective. Strong, positive first impressions are
crucial where as negative impressions are nearly impossible to overcome (Gragg, 2004).
Individuals or potential customers may like or dislike an organization based on the way
employees representing the business appear or look. Unfortunately, a multitude of stereotypes
are based on the way that someone looks or on their first impressions. Because of this,
The Journal of Business Leadership
7
individuals spend massive amounts of money on cosmetics and beauty supplies to enhance the
way they look, in the hope of being accepted or instilling a positive first impression.
It was recently reported that the Britons spend an estimated 38 million (Euros) on beauty
pills or aids to enhance their appearance; an increase of over 130% since 2002 (Parsons, 2007).
This trend is driven by an ageing society that is increasingly concerned about health and
appearance. It is estimated that Britons will spend nearly 63 million euros on appearance
enhancing products by 2012 (Parsons, 2007). This helps supports the notion that age is
unattractive, negatively impacts appearance and should be avoided at all costs, by using
cosmetics and aids to enhance looks. In another study, females that were interviewed stated that
they use age controlling techniques because their job requires it or they dislike the physical
changes that come with aging (Singer, 2008). It is evident through reports such as this, that the
manner in which individuals present themselves is not only important personally, but
professionally.
WHY APPEARANCE MATTERS IN LABOR MARKETS
Numerous qualitative and quantitative scholars confirm that appearance matters in the
workplace. A survey of 1,125 Korean workers in Chungchoeng Province found that 78.8 percent
admitted that they were treated differently in promotions and employment because of their
appearance (Si-soo, 2008). Another study found that 85 percent of employers believed that body
art would hinder a job candidate’s success (Chai, 2008). One third of Australian respondents
were worried that their employers would think that they look too old for their jobs (Pountney,
2008). Ninety- two percent of employers in a survey admitted that a candidate’s appearance
during the interview influenced their decisions and that the more attractive candidates got the
jobs (Attractive candidates have an edge over their bosses, 2008).
Dress codes and appearance are more important in some industries particularly sales,
banking, restaurants, pharmaceutical and insurance and less important in entertainment and
technology (Gardner, 2007) and ophthalmology (Bendix, 2008). Many ad agencies hire on the
basis of appearance (Yong, 2007). Interestingly, appearance biases are less apparent in
managerial positions compared to sales (Reuters, 2008).

The Journal of Business Leadership
8
Obesity has been the most extensively researched appearance variable with respect to
employment. A review of 25 years of research on weight biases concluded that obesity has
severe implications for careers at the application and evaluation stages with the effect decreasing
for promotions (Reuters, 2008). The bias also decreases with longer tenure at an organization.
Conversely, Roehling (1999) concluded that overweight individuals experience discrimination in
every aspect of their employment and non work lives (quoted in Brochu, Gawronski and Esses
2011). The stereotypes for overweight individuals are that they are lazy, sloppy, untidy, not
disciplined and will have more health problems (Reuters, 2008). This reinforces the weight bias
and hiring practices for many organizations.
THEORETICAL AND CONCEPUTAL BASIS FOR THIS RESEARCH
The theoretical and conceptual basis for this paper is that such beliefs about appearance
occur quickly, efficiently, effectively, and affect all employment aspects from hiring to
promotions. For example, appearance beliefs such as those towards the overweight flow from
stigma and prejudices that are used to stereotype, label, and categorize them. This causes people
to enact behaviors based on those preconceived belief sets. The concepts of stigmas,
stigmatization, and prejudice were coined by Goffman (1963) in his book Stigma: Notes on the
management of spoiled identity. Stigmas are beliefs that taint, label, and categorize other
individuals into devalued categories (Goffman, 1963, Brochu et al 2011). Today’s sociologists
identify four categories of prejudices: old-fashioned, modern, Brochu’s (2011) unnamed version,
and aversive (Dovidio and Gaertner, 2000).
The sociologists’ examples of old-fashioned prejudice included stereotypes about race
(racism) and gender (Swim, Aikin, Hall and Hunter, 1995) and stereotypes of the mentally ill -
that they may be violent (Corrigan, 2004). Swim et al (1995) explain aversive prejudice that is
held by individuals “…while rejecting old-fashioned discrimination and stereotypes, may
believe that discrimination against women is a thing of the past, feel antagonistic toward women
who are making political and economic demands, and feel resentment about special favors for
women… “(p.2000).

The Journal of Business Leadership
9
Brochu and her colleagues’(2011) created a new category that includes individuals who
may believe that “negative evaluations of disadvantaged social groups is okay” (p 433) but
believe that the subject group is not disadvantaged and therefore is prejudiced towards them.
Perhaps the best support for this new version is the finding that individuals will experience more
prejudice towards overweight individuals with a high calorie beverage in their hands as opposed
to overweight individuals with a low calorie beverage (Brochue et al, 2011).
Dovidio and Gaertner (2000) explain aversive discriminators as those individuals who
may support egalitarian efforts, may believe themselves to be non discriminatory but consciously
or subconsciously harbor negative feelings about the other group. In their study respondents
selected a black candidate for a job where the individual was clearly the better qualified (because
it would not conflict with their self views that they are egalitarian) but would choose the white
candidate where the job descriptions were ambiguous or not clearly defined (Dovidio and
Gaertner, 2000). Such discrimination is more subtle and less easily recognizable but still affects
others’ views of other individuals’ employability.
Application of these theories to Appearance Discrimination
Corrigan (2004) explains that stigmas and prejudices create stereotypes that are efficient
processes that quickly collect information about others and effectively lead to overt or covert
discrimination. The above theories including Corrigan’s findings (2004) that first impressions
occur quickly, effectively and efficiently (from that individual’s perspective) and are used to
sort, label, and categorize others. Employer based prejudices based on appearance, impact the
employment process from hiring to promotions and thus career, educational, and income
potentials.
The Case for Individual Appearance Management
Because employers hold a myriad of beliefs and prejudices that they bring to the
workplace, employees must be concerned with appearance. How an individual looks or dresses
clearly affects whether or not they are hired. Since the current civil rights laws (explained below)
do not eliminate more subtle forms of discrimination, appearance is extremely important to one’s
career. Just as corporations are now working to monitor, maintain, build corporate reputations
(Cravens, Oliver, Ramamoorti, 2003) individuals should actively manage their appearance.
The Journal of Business Leadership
10
The authors suggest that individuals engage in what is termed Individual Appearance
Management as part of their personal career planning.
APPEARANCE DISCRIMINATON AND THE CIVIL RIGHTS ACTS
OverviewAppearance discrimination is not covered in any of the Federal civil rights laws, thus
leaving employers to act on their beliefs and forcing employees to manage their appearance. In
most cases employers are allowed to discriminate on the basis of appearance unless they trigger
one of the discriminator factors (race, sex, religion, age, disability, color, national origin and
national ancestry). The following takes each of the discriminatory factors and explains the
appearance cases lost by employers. Based on past case law, in general appearance
discrimination is not covered and is generally legal. However, rising discussions from scholars
are advocating amendments to statutes to include appearance.
Gender Based Discrimination
Because sex discrimination is one of the original factors, the EEOC has vigorously
attacked “old-fashioned discrimination.” An example is the $50 million settlement by
Abercrombie and Fitch for its restrictive hiring practices and policies that limited minority and
female applications and promotions (EEOC agrees to Landmark Resolution of Discrimination
Case against Abercrombie & Fitch, 2004). The employer’s error was its system wide
discrimination which was verified by statistically examining hiring and promotion data.
In another case the employee won where the employer explained an employment decision
by referring to a female as “not hot enough “(Yanowitz v. L’Oreal, 2005).
Appearance discrimination using gender is increasingly difficult after the ruling in
Jespersen v. Harrah (2006). The court upheld the employer’s dress code that disallowed males
from having long hair or piercings. Women were required to have longer hair and wear
makeup. On the surface, the dress code policy clearly differentiated between the genders but
was defended by the court as being equal in its burden on the genders. Therefore employers can
implement dress codes based on their community concepts of feminine and masculine as “long
The Journal of Business Leadership
11
as the burden between the sexes is equal” (Jespersen v. Harrah, 2006). Almost any rational dress
code would be accepted if it met the equal burden test, made common sense, and was consistent
with community or industry dress standards. For example the courts upheld the termination of a
female employee for wearing revealing clothing (Schmitz v. ING Securities, Futures, and
Options, Inc. 1999).
The Americans with Disabilities Act (ADA)
The ADA protects individuals with congenital or accidental appearance issues but not
those self inflicted such as piercings or tattoos. The EEOC vigorously purses the former as
exemplified in EEOC v. R.P.H. Management (2003) where the McDonald’s franchisee refused to
allow an employee with a facial port wine stain from being promoted from the back into a
managerial position at the counter. Similarly, another employer lost a case to an employee with a
cleft palate (EEOC v. W.H. Braum, Inc., 2004). However, self inflicted tattoos and piercings do
not meet the definition of a disability and are not covered in the law, this making it legal to
discriminate against them.
Religion and Appearance
Employers cannot discriminate on the basis of religion, are required to attempt a religious
accommodation if requested, and have a minimal burden in terms of costs or effort to
accommodate an employee. The individual does not necessarily have to belong to an organized
religion but membership in mainstream religions helps their cases. For example, membership in
the KKK (Swarzentruber v. Gunite, 2000) or the Church of Body Modification did not qualify.
Most religious discrimination cases by police officers and firefighters claiming racial bases for
their tattoos are rejected by the state’s requirements for public safety and security (Riggs v. City
of Fort Worth, 2002; Montoya v. Gisto, 2002; Foster v. Maryland State Police, 2010).
The only religious discrimination case that an employer lost involved a member of the
Kemetic religion who successfully convinced the court that his belief to display his small wrist
tattoos were required by his religion (EEOC v. Red Robin Gourmet Burgers, 2005). The
employer’s suggested accommodation was to cover his tattoos while at work.

The Journal of Business Leadership
12
However, this ruling is rare and is limited to very few employees because they have a
large burden of proof. This burden includes evidence that the belief is sincere, is strongly held,
and that the accommodation to cover the body art at work outweighs the employer’s desire for
uniformity, professionalism, and or security. All the employer has to do is to attempt an
accommodation which consists of the requirement to cover the body art at work.
The Future of the Civil Rights Laws
Numerous scholars criticize the current laws as contradictory, incomplete, and unable to
attack the more subtle forms of discrimination including appearance (lookism in the legal
literature) (Bandsuch, 2009a, 2009b, 2009c; Gonzalez, 2003; Rhode, 2009; Danaher, 2010;
Ramachandran, 2006: Herald, 2007; Pizer, 2007; & Gross, 2008). Legal scholars particularly
suggest that appearance be added to the statues to eliminate appearance discrimination.
However, it is doubtful that any such amendment would be made given the current legal
environment. This lack of legal protection makes it more important for individuals to manage
their appearance. However, a problem exists because employees lack clarity on their
understanding of business casual attire.
DRESS CODES AND ATTIRE:
What is Business Casual?
When business casual first emerged in the mid 1990’s, it came to corporate America in
the form of casual Fridays. In the beginning, it seemed like a fabulous idea to allow a casual
dress day at work for many employees and employers (Gragg, 2004). However, over time this
relaxed attitude towards Friday dress evolved (Entzminger, 2005) and changed. During the early
2000’s, casual Friday dress quickly became casual dress all-week-long (Spitznagel, 2010;
Compton, 2007) with business casual becoming the new dress code norm. Today, we realize that
these less formal and relaxed dress-code rules provide low clarity, and guidance about what can
or cannot be worn (Gragg, 2004). In addition, there is little clarity about what is considered
appropriate casual business attire in the workplace.
As of 2001, more than three fourths of USA businesses allow some form of business
casual in the workplace (Munoz, 2001). A recent 2007 study, found that nearly forty percent of
all employees regularly wore business casual attire throughout the work week (Spitznagel, 2010).

The Journal of Business Leadership
13
However, nearly 30% of business executives believe that business casual attire has morphed
beyond acceptable limits (Munoz, 2001). As a result of this attitude and due to the overall belief
that employees are abusing casual dress code policies, employers are fighting back.
Before the invention of business casual, most employees in the business industry,
including bankers, sales staff, marketing staff, office personnel and executives wore coordinated
formal business suits (Gragg, 2004; Dale, Bevill, Roach, and Glasgow, 2007). Historically,
business formal was the norm and defined as a three-piece suit (Entzminger, 2005) or a matching
fabric suit (Gragg, 2004).
However, in today’s business world, many employers shifted towards business casual
dress codes bringing with it mass confusion. Business casual might be interpreted as mean nice
slacks, a dress, a blazer, nice pants, dark jean trousers, a sports jacket, coordinated separate
pieces, at-the-knee skirts and boots, a fitted skirt, a short-sleeve polo shirt, etc. There are many
varieties and interpretations as far as casual dress is concerned and little guidance is provided to
employees. In fact, if an employee looks for guidance or for a definition of business casual in
their employee handbook it is often not found (Cullen, 2008; Entzminger, 2005).
More recently, businesses are starting to include long, detailed lists (Gragg, 2004) of
what is considered appropriate to wear to work because employees are abusing (Munoz, 2001) or
misinterpreting the definition of business casual. Clarifications are being provided in the hope of
alleviating employee confusion of what to wear while on the job. Companies have started to limit
the number of days during the week that business casual attire is permitted. A recent 2010 study
found that one third of employers allowed business casual daily, compared to more than fifty
percent in 2002 (Cullen, 2008; Spitznagel, 2010). Another study found that the number of
businesses allowed to dress casually daily dropped from 50% in 2004, to nearly forty percent in
2007. Many businesses are turning to image consultants or professional dress consultants to help
them with their image and branding, including employee appearance (Entzminger, 2005;
Spitznagel, 2010).
Due to misinterpretations or because the ‘new’ business casual dress codes are ineffective
for various businesses, some organizations are reverting back to business formal attire
The Journal of Business Leadership
14
(Entzminger, 2005). Over time businesses, such as banks or law firms, found that upholding a
professional image at the highest level (Entzminger, 2005) was imperative for the company. For
certain organization, formal dress is an easy and great way to present a professional appearance
to customers, while casual dress can send the wrong message (Entzminger, 2005). In fact some
companies, such as Lehman Bros., have reverted to their business formal dress code which
includes mandatory daily-suits to be worn (Cullen, 2008).
Other organizations elect to retain their business casual dress-codes because it gives the
appearance that employees are just like or equal (Entzminger, 2005) to their customers. Research
shows that customers prefer to conduct business with organizations that mirror them
(Entzminger, 2005) instead of alienating them with uptight or stifling attire. Dress is one way to
foster relationship building among customers and employees (Entzminger, 2005). Customers are
more relaxed if they believe they can relate to employees, thus allowing for relationships to
develop long-term.
In addition, relaxed dress codes have the benefit of increasing corporate morale
especially when weather changes occur (Entzminger, 2005). Organizations such as IBM, have
thrown out their famous business formal dress code (Cullen, 2008), embracing business casual or
business conservative attire throughout the week because employees like it. Furthermore, during
hot or humid summer months, or during winter months many employees look forward to
dressing down to remain comfortable or practical when confronted with various weather
changes. Ultimately, the decision to require employees to dress formal, business casual or
business conservative is up to the specific business. If a company elects to allow business casual
throughout the week, a clear definition of business casual should be provided to the workforce to
prevent misinterpretation. A recent study found that nearly ninety percent of workers could not
explain the difference between business formal, business casual and relaxed casual (Spitznagel,
2010). If employees cannot define the difference between these three types of dress, how can
they be expected to dress appropriately?
In general, business casual is commonly defined as khakis, oxford shirt and blazer, dark
dress jeans or jean trousers, dress pants, nice polo shirt, mid-calf skirt, nice separate coordinating
pieces, dress and blazer (unbuttoned), pencil skirts, short/long sleeve button down without a tie,
The Journal of Business Leadership
15
at-the-knee length skirt and a nice cardigan for Fridays (Gragg, 2004). Business formal is defined
as a three piece suit (Entzminger, 2005), or a suit constructed from matching material.
Why are Dress Codes Important for Businesses?
Formal and informal dress codes have a variety of benefits depending on the type of
business, the industry the company works in and the type of customers an organization wants to
attract. Formal dress codes are appropriate when the product/service the company is selling is
serious, such as investing customer’s money. Relaxed casual dress is appropriate for employees
that interact with customers on a day-to-day basis, have physically demanding work or where
relationship building is necessary, such as a bank tellers, grocery store clerks, software engineers
or retail sales personnel. Perhaps the most important thing to remember is that dress codes can
help boost morale, turn-away customers, improve company image or give the wrong impression
to clients, employees or future employers (Entzminger, 2005).
With the above in mind, it is important for all organization to have clearly written dress
code policies, including a definition of business formal and business casual requirements. This is
simply to alleviate possible confusion, misinterpretation and abuse of business dress code
policies (Munoz, 2001). In addition, corporations must understand that the brand and image of
the business are reflected in how employees dress or present themselves to clients. Thus,
corporate dress codes should further the brand of the business and not detract from it
(Entzminger, 2005).
Why are First Impressions Important?
First impressions are tied to a multitude of factors, including social media profiles, how
an individual dresses or talks, how an individual presents themselves and their personal work
experience and education. First impressions are critical because once they are formed they are
extremely difficult to change (Gragg, 2004). An individual may be hired or not hired because of
how they look and appear. How an individual dresses projects their self image, how they behave
and how respectful they are (Compton, 2007) will either enhance or detract from what they are
saying. When an interviewee dresses for an interview they signify what they value, who they are,
what they believe in, what is important or not important and will either reinforce a positive self
image or not (Compton, 2007). It is imperative to remember that professionalism begins during
The Journal of Business Leadership
16
the interview stage. Once an interview is over, a candidate will rarely get a second chance to
make a positive impression
Dressing for Success RECOMMENDATIONS:
Before you go into a job interview, it is advisable to investigate your future employer to
see what others are wearing. Use social media sites such as LinkedIn, Jogsaw, Ryze and other
networking tools to inquire about the corporate culture (Varelas, 2009). Invite current employees
to join your social network and inquire about the company dress code policy. If these are
unavailable, call the Human Resource Department to inquire about what to wear during an
interview. In addition, be sure to take time to review the corporate website or visit the corporate
building to observe what people are wearing (Gragg, 2004; Varelas, 2009). Lastly, approach
your business wardrobe like a formal presentation and ask yourself if you are well put-together
or are projecting the image you want to project (Compton, 2007). For more information, please
see Table 1.
Table 1: Tips for Dressing for Success for Men and Women
Make sure you have:
Clean and polished dress shoes
Dress similar to how others dress in the organization
Call HRM to inquire how an interviewee should dress
Well-groomed hairstyle
Cleaned and trimmed fingernails
Minimal cologne or perfume
No visible body piercing beyond conservative ear piercings
No visible tattoos (until you know formal dress code policy)
Well-brushed teeth and fresh breath
No gum, candy, or other objects in your mouth
Keep color of clothing muted and understated
Avoid anything that could distract the interviewer
The focus should be on YOU -- not on your clothes

The Journal of Business Leadership
17
What Not to Wear?
It is crucial to remember that it is not advisable to wear flop-flops, light colored jeans,
tight clothing such as pants/jeans/shirts, see-through shirts, anything overtly sexy, anything that
can be worn out at night or while ‘bar-hopping’, anything that exposes your underwear, anything
that exposes cleavage, ripped or worn-out t-shirts/pants, no shorts or short skirts, or anything that
is distracting, or disrespectful. The bottom-line: how someone dresses in the workplace has
consequences for the business and for the individual (Cullen, 2008). An individual’s dress code
can prevent them from being hired and can even get them dismissed from their job (Cullen,
2008). Remember, generally speaking an employer has the legal right to regulate how workers
look, as far as dress and appearance while on the job (Cullen, 2008).
What is Social Media?
As if deciding how to dress is not enough, there is always the question of social media
usage and what is appropriate for the workplace. Social media is defined as an interactive media
that includes social networks such as Face book, Twitter, LinkedIn, and Yahoo! Groups; blogs;
and video websites such as YouTube, online forums and discussion boards such as Google
Groups; and online publications (Hunt 2010; Segal, 2011). Social media has become a popular
venue for companies to search for applicants, search for information about job candidates, post
job openings, share information about the company, or use as part of their background searches.
In fact, companies are beginning to hire full timer recruiters that are dedicated to researching on
social media websites (Light 2011). There is a high probability that job applicants will find a job
posting on Face book will fill out an application and move into the interview process (Hunt,
2010). Today, future employees looking for employment will use social media websites to find
job vacancies, to obtain information about a company, and to gather information about hiring
managers and interviewers.
A survey of 2,500 employers conducted by CareerBuilder indicates 35% of the
responding employers use social media to promote their company (Hunt, 2010). Of these
employers, 21% report using social media to recruit and research potential employees and 18%
use social media to promote their employment brands (Hunt, 2010). A different CareerBuilder
survey of 2,600 hiring managers found that 45% of the respondents report using social
networking sites to search for applicants and 35% stated they elected to not hire a job applicant
The Journal of Business Leadership
18
because of information found on social networking sites (Stamper, 2010). Seventy percent of
companies responding to a Cross-Tab Marketing Service study stated that job candidates were
rejected because of information posted on a social media website (Adenle 2011; Hill, 2010). In
2009, a Jump Start Social Media study reported that 75% of hiring managers use LinkedIn to
research job applicants prior to making an offer, 48% use Face book , and 26% use Twitter
(Gildea 2009).In 2011, Face book became the most popular social media site with over 2.6
million monthly users (Light, 2011).
How has social media helped/hindered the hiring process/recruiting process?
Often hiring managers visit social media websites to learn about job candidates. In fact,
either job candidates invite hiring managers to view their social profiles or hiring managers
purposely seek out social media profiles to verify information contained in a job applicant’s
resume or application.
Candidates have filed law suits against companies if they believe they were rejected for a
job based on information and content posted on a social media website (Cook, 2008; Stamper,
2010). Social media profiles often contain information about a job candidate’s protected class –
such as religious beliefs, age, race, gender, sexual orientation, disability, military status, etc. –
that would not be available on a traditional application (Dickenson Employment 2010).
Employers need to develop policies to identify when social media information should be used
and who in the company should review these social media sites.
It is suggested that use of social media profile information should be used after the initial
screening process to diminish the argument that a job candidate was screened out due to
protected class reasons (Segal, 2011). Employers need to ensure that all job candidates undergo
the same social media review during the screening and hiring process (Segal, 2011). Early on,
employers should disclose their recruiting/hiring processes that include social media profile
reviews (Cook, 2008). In fact, when using information posted on social media sites, employers
should disregard information that is not job relevant, disregard illegal information, and obtain
permission from the job applicant prior to reviewing personal social profiles (Cook, 2008).

The Journal of Business Leadership
19
Some companies are attempting to replace traditional hiring practices by using social
media websites (Hunt, 2010; Stamper, 2010) because they are perceived as easier, cheaper and
efficient. It is suggested that social media augment traditional hiring processes, but not replace
them. Hiring managers should use networking opportunities, recruiters, and intra-company
recommendations to find suitable job candidates. When companies do use social media outlets,
they must find and use appropriate channels, such as industry specific networking communities
rather than using a general approach. Monster.com has launched a Face book app – Be Known -
- because of the growing use of Face book as a recruiting tool. The application has over 800,000
monthly users (Light, 2011).
Stamper (2010) reports that many managers judge potential job candidates too harshly
when relying on social media information and profiles. Younger job candidates (Generation
Y/Millennial) are very comfortable mixing professional and personal lives, often sharing more
personal information than other job candidates.
Common social media mistakes made by job applicants
Information that individuals post on their social media profiles can provide potential
employers insight into their personality that may indicate a good fit with the company,
collaboration of professional qualifications, examples of creativity, good communication skills,
awards received, and indications that the candidate is a well-rounded individual (Adenle, 2010).
However, there are many items that job applicants are counseled to consider or not
include on their social media profiles. Please refer to Table 2 for a listing.
The Journal of Business Leadership
20
Table 2: What to consider or not include on a social media profile
Inappropriate photographs (Adenle, 2010; Bulles, 2010)
Indications of drinking or drug use (Adenle, 2010; Bulles, 2010)
Negative remarks about former employers, bosses, co-workers, customers
(Adenle, 2010; Bulles, 2010)
Discriminatory remarks (Adenle, 2010)
Use of poor communications skills, poor grammar, spelling errors (Adenle, 2010)
Discussing confidential company/employer information (Adenle, 2010)
Don’t link personal sites to professional business sites (Bulles, 2010).
Pictures or videos showing you doing something stupid (Bulles, 2010).
Personal and financial information (Bulles, 2010)
Social Media Recommendations
There are a number of actions job candidates can take to make sure that they present
themselves well on social media sites to potential employers. Individuals should regularly
“Google” their name to determine what online presence they have (Adenle, 2011). Social media
sites allow employers to gain a broader view of job applicants than what is presented on an
application and to determine if the applicant is a good fit for their company (Gildea, 2009).
Because recruiters and potential employers regularly visit LinkedIn, Face book and
Twitter, it is important to have a complete and professional profile on all 3 social media sites.
Individuals might consider including references or comments from previous employers or
managers (Adenle, 2011).
It is important to carefully consider information that is shared on social media.
Individuals might consider including links to news stories hosting discussions or joining
professional groups to participate in discussions (Adenle, 2011; Gildea, 2011). It is important to
keep social media files updated.
The Journal of Business Leadership
21
Potential employers may be checking all types of social media, so employers should consider
setting up a blog to show skills, vision, credentials (Adenle, 2011) and communication skills. In
addition, a web resume may be beneficial in providing another way for job hunters to get notice.
Select a one-page electronic online resume format that is visually appealing and combines video
and other links to your resume (Adenle, 2011).
Finally, it is recommended that job applicants develop a personal brand and keep all
social media sites aligned with that personal brand (Adenle, 2011; Gildea, 2011). A personal
brand represents the job candidate’s promise of value to an employer and allows the individual to
stand out.
How does one develop a personal brand? Meg Guiseppi (2009) suggests starting the
process by answering the following questions to gain insight into yourself:
1. What are you most passionate about? What do you care deeply about?
2. What are your top 3 or 4 personal attributes – the things that define how you make
things happen?
3. What are your 3 or 4 greatest strengths or top motivated skills that have benefitted
your companies/employers?
4. What differentiates you from your competition for your next job? What do you have
to offer that no one else does?
Once you have some insight into yourself, you can begin developing a 1 -2 sentence brand
statement that reflects (Sundberg, 2011):
What value do you provide, what problem do you solve
How do you do it uniquely (your unique setting point or USPs)
Who do you do it for (identify your target audience)
Sundberg (2011) suggests that you be very clear in identifying the value that you provide
and how you are able to provide that value in a unique manner. Don’t use ‘fluffy’ or vague
words. The audience may be a specific industry, geographic area, age demographic, etc. It is
important to stay focused on a sector of the market. A personal brand should be punchy,
The Journal of Business Leadership
22
memorable, and short. On an annual basis, a personal brand should be evaluated and changed,
especially if your professional skills or value have changed.
CONCLUSION AND FUTURE STUDY
After thoroughly examining various researches, it is evident that what is considered
appropriate to wear to work is complex, confusing and ever changing. Not to mention the fact
that social media is prevalent and utilized in a multitude of ways that can help or hinder an
individual’s potential for employment. Younger generations may have trouble understanding
what appropriate dress is or how to properly utilize social media and/or what the law allows from
an appearance perspective.
More research is needed to investigate whether corporate employee handbooks are
properly defining business dress codes and attire expectations for employees. In addition, more
research is needed to investigate how social media is being utilized from an employee
perspective, and to see if there is an overall awareness that a personal profile can impact
future/current employment. Finally, more research is needed at the collegiate level to examine if
students graduating from college understand what business casual means, how their social profile
impacts future employment and their general awareness of the law as far as appearance is
concerned. The authors in the paper are furthering their research and conducting surveys on
college students to examine the previous questions.
REFERENCES
Adenle, C. (2011). Social Media and the Hiring Process. Catherine’s Career Corner http://catherinescareercorner.com
Adenle, C. (2010, November 13). One wrong move, your Face book or Twitter could cost you your job. Catherine’s Career Corner. http://catherinescareercorner.com
Attractive candidates have an edge over bosses. (2008, March 27). Financial Advisor. Retrieved Jan. 7, 2010 0-find.galegroup.com.
Bandsuch, M. R. 2009a. The NBA dress code and other fashion fauz pas under Title VII. Villanova Sports and Entertainment Law Journal 16 1. Retrieved May 5, 2010 from Lexis-Nexus.

The Journal of Business Leadership
23
Bandsuch, M.R. 2009b. Dressing up Title VIIs analysis of workplace appearance policies. Columbia Human Rights Law Review 40 287. Retrieved May 5, 2010 from Lexis-Nexus.
Bandsuch, M.R. 2009c. Ten troubles with Title VII and trait discrimination plus one simple solution (a totality of the circumstances framework). Capital University Law Review 37 965. Retrieved May 5, 2010 from Lexis-Nexus.
Bliss, S. (2008). Clothing Arguments. Forbes, 18136-39. Retrieved from EBSCOhost.
Brochu, D.M., Gawronski, B., & Esses, V.M. (2011). The integrative prejudice framework and different forms of weight prejudice: An analysis and expansion. . [Electronic version]. Group Process and Intergroup Relations 14 (3) 429-444.
Burger Chain to pay $150,000 to resolve EEOC religious discrimination suit. (2005) http://www.eeoc.gov/press/9-16-05.
Bullas, J. (2010). 30 things you should not share on social media. www.jeffbullas.com/2010
Chai, C. (2008, July 5). Tattoos can mark a career. The Toronto Star. Retrieved August 15, 2008 0-find.galegroup.com.
Compton, M. (2007). DRESS the PART. Women in Business, 59(1), 12-14. Retrieved from EBSCOhost at http://0-web.ebscohost.com.skyline.ucdenver.edu/ehost/pdfviewer/pdfviewer?sid=5816947d-75e2-45a9-9c49-a2a923b167ea%40sessionmgr10&vid=4&hid=17
Cook, J. (2008, December). Social gets legal: Is it lawful to use information from social media profiles in the hiring/staff monitoring process? Credit Union Management
Corrigan, P. (2004). How stigma interferes with mental health care. American Psychologist 59 (7) 614-625.
Cravens, K., Oliver, E.G., & Ramamoorti, S. (2003). The reputation index: Measuring and managing corporate reputation. European Management Journal 21 (2) 201-212.
Cullen, L. (2008). What (Not) to Wear to Work. Time, 171(23), 49. Retrieved from EBSCOhost at http://0-web.ebscohost.com.skyline.ucdenver.edu/ehost/delivery?sid=5816947d-75e2-45a9-9c49-a2a923b167ea%40sessionmgr10&vid=5&hid=17
Dale, L.R. Bevill, S.; Roach, T. & Glasgow, S.(2007). To tattoo or not tattoo is the question. Proceedings of the Academy for Economics and Economic Education 10 (2) 11-18.
Dale, L.R. Bevill, S.; Roach, T. Glasgow, S.; & Bracy, C. (2009). Body adornment: a comparison of the attitudes of businesspeople and students in three states. Academy of Educational Leadership Journal 13 (1), 69. Retrieved Jan. 7, 2010.
The Journal of Business Leadership
24
Danaher, M.G. 2010. Adverse action based on gender-related behavior impermissible. Allegheny County Bar Association The Lawyers Journal 12. Retrieved May 5, 2010 from Lexis-Nexus.
Dovidio, J. F. & Gaertner, S.L. (2000). Aversive racism and selection decisions: 1989 and 1999. [Electronic version]. American Psychological Society 11 (4) 315-319.
Dickenson Employment and Labor Law Group (2010, April 15). Iowa Employer Law Blog: Insights on recent developments in employment & labor law. Blog at WordPress.com
EEOC Agrees to landmark resolution of discrimination case against Abercrombie & Fitch, (2004) http://www.eeoc.gov/pres/11-18-04.
EEOC Policy Guidelines (2010). Retrieved May 20, 2010 from www.eeoc.gov/policy/doc.
EEOC sues McDonald’s restaurant for disability bias against employee with facial disfigurement, (2003) http://www.eeoc.gov/pres/3-7-03.
Entzminger, A. (2005, Oct. ) Dress down or up? Banking dress codes continue to evolve. ABA Banking Journal, (Vol. 97). (10), 7. Retrieved September 15, 2011, from Academic OneFile via Gale: http://0-go.galegroup.com.skyline.ucdenver.edu/ps/start.do?p=AONE&u=auraria_main
Gardner, M. (2007, December 3). ‘Body Art’ gains acceptance in workplace. Christian Science Monitor. Retrieved Jan. 7, 2010 0-find.galegroup.com.
Gildea, C. (2009, June 12). Hiring managers use social media in hiring process. Electronic Recruiting News.
Goffman, E. (1963). Stigma: Notes on the management of spoiled identity. Englewood Cliffs, N.J.: Prentice-Hall
Gonzalez, R.J. (2003). Cultural Rights and the Immutability Requirement Doctrine. Stanford Law Review 55 2195.
Gragg, E. (2004,March-April) What do you mean "business casual"? It seemed so easy at first, and now it seems so complicated. OfficeSolutions, (Vol. 21). (2), 42. Retrieved September 15, 2011, from Academic OneFile via Gale: http://0-go.galegroup.com.skyline.ucdenver.edu/ps/start.do?p=AONE&u=auraria_main
Gross, D. (2008, March 26). Ordinance should protect us all. St. Petersburg Times (Florida). Retrieved Jan. 7, 2010 0-find.galegroup.com.
Greenwood, B. (2009, September). Face book: The next great vetting tool? Information Today. www.infotoday.com

The Journal of Business Leadership
25
Guiseppi, M. (2009). Creating your authentic personal branding statement. Job-hunt.org. www.job-hunt.org/personal-branding
Hearld, M. (2007.Deceptive Appearances: Judges, Cognitive Bias, and Dress Codes. University of San Francisco Law Review 41 299. Retrieved August 14, 2008 from Lexis-Nexus.
Hill, S. (2010, September 14). Social media and the hiring process: Your profile can sink or save you. aznow.biz
Hunt, K. G. (2010, November-December). Finders Keepers: Social media strategies help find top talent. www.irem.org/jpm
Light, J. (2011, August 8). Recruiters troll Face book for candidates they like. Wall Street Journal. Online.wsj.com.
MuñOz, L. (2001). The suit is back--or is it?. Fortune, 143(14), 202. Retrieved from EBSCOhost.
Parsons, E. (2007, August 28). E37m: what we spend in a year popping pills in search of beauty. The Evening Standard (London). Retrieved August 14, 2008 0-find.galegroup.com.
Pizer, J. C. (2007). Facial Discrimination: Darlene Jespersen’s fight against the Barbie-fiction of bartenders. Duke Journal of Gender Law & Policy 14 285. Retrieved August 15, 2008 from Lexis-Nexus.
Pountney, M. (2008, June 18). Age-old terrors lurk in mirror. Herald Sun(Australia). Retrieved August 8, 2008 0-find.galegroup.com 0-find.galegroup.com.
Price, J.H. (2007, February 7. Tattoos, piercings go ‘mainstream.’ The Washington Times. Retrieved August 15, 2008 0-find.galegroup.com.
Ramachandran, G. 2006. Freedom of dress; state and private regulation of clothing, hairstyle, jewelry, makeup, tattoos, and piercing. Maryland Law Review 66 11. Retrieved May 5, 2010 from Lexis-Nexus.
Reuters Staff. (2008). Obesity can weigh down a career: study; Bias strongest at job-application stage. The Globe and Mail (Canada) (February 27, 2008). Retrieved August 14, 2008 0-find.galegroup.com.
Rhode, D. L. 2009. The injustice of appearance. Stanford Law Review 61 1033. Retrieved May 5, 2010 from Lexis-Nexus.
Roehling, M.V. (1999). Weight-based discrimination in employment: psychological and legal aspects. Personnel Psychology 52. 969-1016.
The Journal of Business Leadership
26
Segal, J.A. (2011, April). Dancing on the Edge of a Volcano. From hiring to harassment, social media can explode on employers. HR Magazine.
Si-soo, P. (2008, January 1). Appearance seen as a factor for females. Korean Times. Retrieved August 14, 2008 0-find.galegroup.com.
Singer, N. (2008, January 24). Nice Resume. Have you considered Botox? The New York Times. Retrieved August 14, 2008 0-find.galegroup.com.
Spitznagel, E. (2010). The Tragic Decline Of Business Casual. Bloomberg Businessweek, (4199), 94-95. Retrieved from EBSCOhost at http://0-web.ebscohost.com.skyline.ucdenver.edu/ehost/detail?vid=3&hid=17&sid=5816947d-75e2-45a9-9c49-a2a923b167ea%40sessionmgr10&bdata=JnNpdGU9ZWhvc3QtbGl2ZQ%3d%3d#db=aph&AN=54379219
Stamper, C. (2010, April). Common mistakes companies make using social media tools in recruiting efforts. CMA Management.
Swim, J.K., Aikin, K.S., Hall, W.S., & Hunter, B.A., (1995). Sexism and racism: Old-fashioned and modern prejudices. Journal of Personality & Social Psychology 68 (2) 1999-214.
Sundberg, J. (2011). How to write your personal brand statement. http://jorgensundberg.net
Varelas, E. (2009). Sizing up Cultural Fit. T + D. 63(11), 76-77. Retrieved from EBSCO.host at http://0-web.ebscohost.com.skyline.ucdenver.edu/ehost/pdfviewer/pdfviewer?vid=3&hid=17&sid=5816947d-75e2-45a9-9c49-a2a923b167ea%40sessionmgr10
Yong, L.S. (2007, August 5). Never mind how popular they were before. When actresses get
pregnant, the jobs dry up. The Strait Times(Singapore). Retrieved August 14, 2008 0-find.galegroup.com.
Applicable Laws
Americans with Disabilities Act 42 U.S.C. sections 12101 et. seq 1990 as amended in 2009. 42 U.S.C. sections 20002-2(k), 2006 which put disparate impact into the law. 42 U.S.C. sections 2000e-2(m) which put mixed motives into the law.42 U.S.C. sections 2000 3(a) which put retaliation into the law. Michigan Elliot-Larsen Civil Rights Act, sections 101(1) and 102 (2).Title VII of the Civil Rights Act of 1964, 42 U.S.C.S. section 2000e et. Seq.
EEOC v. Red Robin Gourmet Burgers. (2005). (C04-1291, W.D. WA, 2005). This is also reported as “Burger Chain to Pay $150,000 to Resolve EEOC Religious Discrimination Suit” at www.eeoc.gov/pres/9-16-05.html. (Also at EEOC v. Red Robin 20005 U.S. Dist. LEXIS 36219 (W.D. WA, 2005).
The Journal of Business Leadership
27
EEOC v. R.P.H. Management, Inc. d/b/a McDonalds. (2003). Civil Action No. 03-RRA-502-J, 2003). Reported at www.eeoc/gov/press/3-7-03.html. EEOC v. W.H. Braum, Inc. d/b/a/ Braum’s Ice Cream & Dairy Store. (2004). No. 01-215-P (E.D. Okla. August 2, 2004). Reported at www.eeoc.gov/litigation/settlements08-04.html.
EEOC Agrees to Landmark Resolution of Discrimination Case Against Abercrombie & Fitch (2004). Reported at www.eeoc.gov/press/11-18-04. html.
Foster v. Maryland State Police 2010 U.S. Dist. LEXIS 4433 (D.C. MA, 2010).
Jespersen v. Harrah’s Operating Company 444 F.3d 1104 (9th Cir., 2006).
Montoya v. Giusto 2002 U.S. Lexis 27970 (OR., 2002).
Riggs v. City of Fort Worth 229 F. Supp. 2d 572 (N.D. TX, 2002).
Swarzentruber v. Gunite 99 F. Supp. 2d 976 (N.D. IN., 2000).
Yanowitz v. L’Oreal. 36 Cal.4th 1028 (Supreme Court of Cal. 2005).
The Journal of Business Leadership
28
The Great Recession of 2008: An exploratory case study of the impact of the
recession on five small businesses in Hawaii.
Nina Radojevich-Kelley, David L. Hoffman, and Gregory Black
Metropolitan State University of Denver
ABSTRACT
Small businesses residing on remote islands depend on larger economies for tourism. This paper investigates five Hawaiian small businesses impacted by tourism and the declining USA economy. The hope is to explore the experience of Hawaiian business owners recounting their survival tactics and the financial hardship faced during troubled times. The results of the study include an in-depth analysis of the experience of five Hawaiian business owners, the business strategies or tactics employed throughout the recession, challenges and obstacles faced during the recession, motivations for starting a business in paradise, and challenges associated with running a business in Hawaii. Similarities between the experiences were reported and conclusions were drawn including conclusions about Resource Based View. For the purpose of this study, only small businesses impacted by tourism were examined. All five businesses utilized in the study remain confidential and the names of the businesses were changed to protect the anonymity of those ventures.
Key words: Nascent ventures, start-up companies, recession, small business, Hawaiian small business, entrepreneurship, new ventures, Resource Based View, case study.
INTRODUCTION
The Great Recession of 2008 is the nastiest economic slump since the Great Depression
of 1929 as far as small business is concerned (State of Small Business Report, 2009). For
approximately 27 million small businesses residing in the USA, the economic dip challenged
business owners in ways they never imagined (State of Small Business Report, 2009). Business
owners continue to struggle, cope, compete, and remain innovative across the nation while facing
tremendous economic hardships. According to research, even though small businesses are
responsible for the majority of employment and growth in the USA economy, more than half of
the country’s net job losses were due to their failure to secure capital and expand during the
Great Recession of 2008 (State of Small Business Report, 2010). In fact, during the first two
years of the recession, the country experienced the closure of nearly 170 thousand small
The Journal of Business Leadership
29
businesses (Thomas, 2012; Kavoussi, 2012). Of the nearly 27 million small businesses registered
in the USA, only an estimated 6.7 million were in fact cash flow positive through 2010 (Thomas,
2012; State of Small Business Report, 2009). In 2007, out of nearly seven million American
businesses with positive balance sheets, about half a million were classified as nascent or new
firms (Strangler, 2010).
In today’s economy, it is extremely difficult for new ventures to obtain the funding
necessary for entrepreneurs to develop their businesses and their ideas, to expand, and to grow
(Isidore, 2008). This is simply because during periods of recession, less capital is available and
fewer customers spend money frivolously on products and services. Instead customers contract
their spending and save money in preparation for the hardships that lie ahead. Due to the lack of
customer spending, many small businesses and nascent firms struggle to survive, much less to
grow and expand.
From a historic perspective, small businesses are vital to the American economy both in
periods of economic growth (Small Business Administration, 2007) and during recessions (State
of Small Business, 2010). According to the US Census Bureau, America has 27 million small
businesses that employ 100 people or less, generate more than 40 million USA jobs annually and
gross more than $ 6 trillion in revenue per year. According to the State of Business Success
Index (2007), small businesses generate approximately half of the USA GDP, create about three-
quarters of the new jobs in our country and are responsible for a large portion of new innovation
(Small Business Administration, 2007). In fact, small businesses are responsible for half of all of
American payrolls that are non-farm related (Small Business Administration, 2010).
The Small Business Administration believes that new ventures and small businesses will
guide the U.S. economy out of the recession through new job creation and increased innovation
(State of Small Business Index, 2010). The USA economy is relying on a consistent flow of new
business formation to lead us out of the economic slump and help us continue leading the world
as an international powerhouse.
As a country relying on small businesses to revive its economy, a question that is worth
asking is how can a small business operating in a remote location, such as on a Hawaii island,
survive and grow during a recession when customers are traveling less and spend less money?
The Journal of Business Leadership
30
To help answer this question, an exploratory, multiple case study approach was utilized
to investigate five local Hawaiian small businesses impacted by tourism and the Great Recession
of 2008. The purpose of this paper was to explore the experiences of the Hawaiian business
owners, to examine the challenges and obstacles they faced and to review the unique strategies
employed throughout the recession. The hope is to report their experiences, recount their survival
tactics and discuss the hardship faced during troubled times.
Specifically, the exploratory case study addressed the following questions: 1) What were
the experiences of Hawaii business owners during the Great Recession of 2008? 2) How are
Hawaiian businesses which rely on tourism surviving the recession? 3) What tactics or strategies
did the business owners use throughout the recession to keep their businesses going? 4) How did
their experiences influence their decision making related to the business tactics/strategies utilized
5) What are the primary motivations of Hawaiian business owners for starting a business in
paradise? 6) What obstacles and challenges do Hawaii business owners face in Hawaii? 7) Can
the Resource Based View (RBV) explain these results?
Specifically the authors will uncover each business owner’s personal experiences and
examine how these experiences influenced decision making related to the business
tactics/strategies utilized. Various marketing and management strategies were explored, along
with discovering each founder’s motivation for starting a business in paradise. Obstacles and
challenges that the small businesses face in Hawaii are discussed.
For the purpose of this study, only small businesses impacted by tourism were examined.
All five businesses utilized in the study remain confidential and the names of the businesses were
changed to protect the anonymity of those ventures. Similarities and differences between
multiple case analyses are presented. For the purpose of this paper, a recession is defined as a
noteworthy decline in economic activity extending across the nation which lasts more than a few
months. The Great Recession officially started in December, 2007 (Isidore, 2008)
Hawaii
The Hawaiian Islands are a group of remote islands in the Pacific Ocean that make up the
Hawaiian State, the 50th state (Lawrence, 1959) of the United States of America. Hawaii is
famous for its sand beaches, surf waves, waterfalls, flowers, trade winds and majestic beauty
The Journal of Business Leadership
31
with approximately 7.4 million tourist visitors annually. The population size of Hawaii is
1,374,810, with nearly 30% of the population holding a bachelor degree (Hawaii Visitors Guide,
www.hawaii-guide.com). According to the Center of Budget and Policy Priorities, Hawaii has a
$500 million Fiscal Year 2013 Gap (8.6% shortfall), compared to a $ 540 million gap in FY
2012 (9.6% shortfall), and a $ 594 million FY 2011 gap (16.2% shortfall) (Oliff et al, 2012).
Hawaii has the highest cost of living in the nation, with Honolulu being the second most
expensive city after New York City www.hawaii-guide.com). The median rent in Hawaii is 50%
more than the national median, where 75% of Hawaiian households spend about half of their
household income on rent alone (Hawaii Visitors Guide (2012), www.hawaii-guide.com).
As a geographically remote state, people might expect Hawaii to be the first state to
experience economic hardship as a result of a declining USA economy or recession. However,
Hawaii reported economic slowdown in only a few key industries, such as construction and
tourism, which impacted the state’s economy slightly but not to the degree that other USA states
saw during the start of the Great Recession (Young, 2008). Federal and military spending were
considered “bright” spots for revenue in Hawaii, as were capital improvement projects funded by
the state of Hawaii which helped propel the Hawaiian economy into 2008, compared to other
state economies in the USA (Young, 2008). Thus, the overall Hawaiian economy avoided the
early financial hardships compared to other states during the start of the Great Recession of
2008.
However, just because the economic hardship did not impact Hawaii originally at a high
degree does not mean that Hawaii was problem free during the prolonged recession (Oliff et al,
2012; Thomas, 2012). Many local entrepreneurs and small business owners in Hawaii were
challenged throughout the recession as a result of prolonged decreased visitor counts, decreased
frequencies of leisure/business travelers, and decreased visitor spending on the islands. As the
recession progressed and financial hardships in the USA and internationally continued, growth of
the Hawaii economy stalled and contracted through 2009 (Young, 2008; Oliff et al, 2012).
The DBEDT report shows that Hawaii saw a ten percent decline in visitor travels to the
state in 2008 and an additional two percent decline in visitor travels in 2009 (Young, 2008).
Nearly 6.8 million visitors were expected to visit Hawaii in 2008, compared to approximately 6.7
The Journal of Business Leadership
32
million in 2009 (Young, 2008). Hawaii’s real GDP was projected to grow 0.3% in 2008, with a
negative two percent expected in 2009 (Young, 2008). Finally, wage/salary growth was expected
to be zero in 2009 and a negative job forecast growth of nearly half a percent was expected in
2009 (Young, 2008).
For a small business owner, the statistics reported above means that economic hardship
and hard times were ahead for many Hawaiian businesses, especially those relying on tourism
and visitor spending. During the Great Recession of 2008, Hawaii anticipated a reduced number
of tourists on the islands, thus anticipating decreased revenue for many Hawaii businesses
relying on tourism. Overall, the recession caused a decrease in the number of small businesses
formed in more than 93% of the USA markets (Thomas, 2012). Hawaii saw less entrepreneurs
establish businesses from 2008 to 2009, with 22,044 businesses formed in 2008 compared to
21,748 businesses formed in 2009 (Thomas, 2012). This in turn impacted the number of
employees that local Hawaiian businesses employed, supplies they purchased and therefore the
amount of revenue they created in the local Hawaiian economy. It is important to note that the
unemployment rates in Hawaii tripled from November 2006 thru 2011, with low income workers
hit the hardest (Oliff et al, 2012).
With the above in mind, the following examines the state of entrepreneurship itself in
Hawaii compared to other states in America between the years 2008 to 2011. According to the
State of Entrepreneurship Index of 2012, Hawaii was ranked 39th out of 50 states in 2008 as far
as business formation and innovation (Thompson and Walstad, 2012). In 2010, Hawaii slipped to
number 41 out of 50 states and in 2011 it dropped to number 45 out of 50 states on business
formation and innovation (Thompson and Walstad, 2012)
Hawaii experienced a decrease in the percentage of growth establishments, business
formation rates, patents per thousand people, and the average income per non-farm proprietor
compared to most of the states in America. Overall, this means that the entrepreneurship
environment was less attractive to small business owners and entrepreneurship from 2008 thru
2011 in Hawaii compared to other states in the USA.
Table 1 takes a closer look at the number of establishments and growth rate according to
the Entrepreneurship Index (Thompson and Walstad, 2012). As evident in the table, the actual
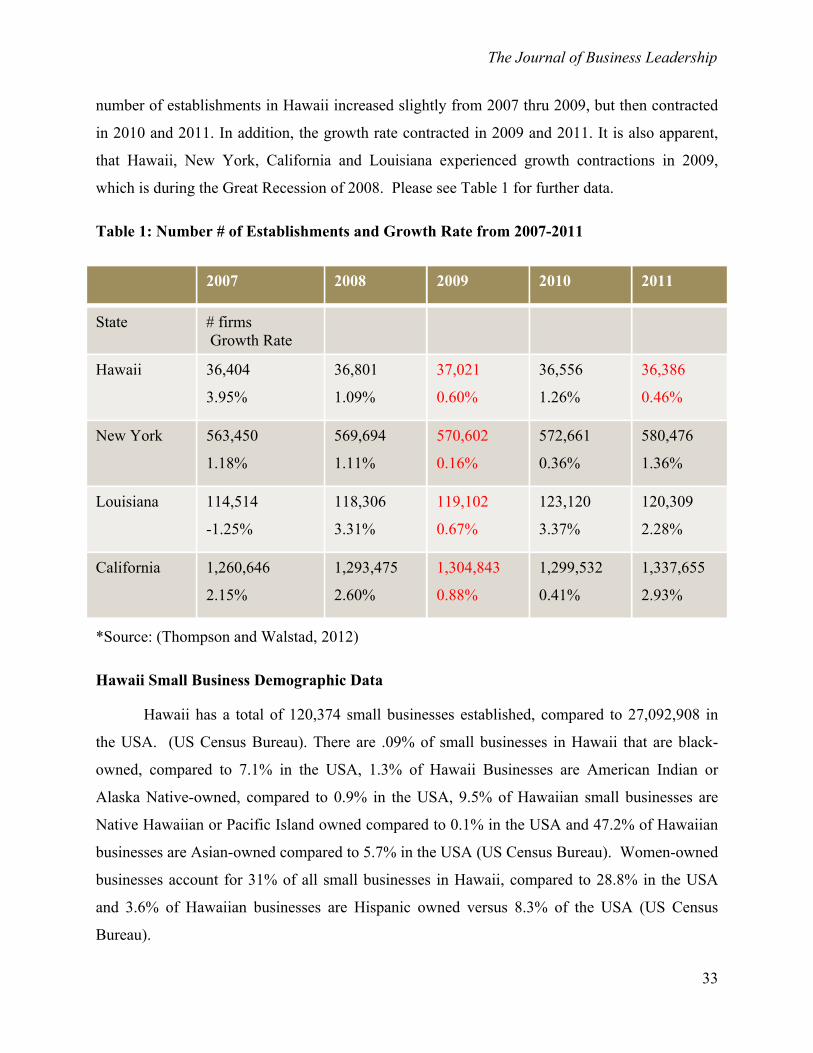
The Journal of Business Leadership
33
number of establishments in Hawaii increased slightly from 2007 thru 2009, but then contracted
in 2010 and 2011. In addition, the growth rate contracted in 2009 and 2011. It is also apparent,
that Hawaii, New York, California and Louisiana experienced growth contractions in 2009,
which is during the Great Recession of 2008. Please see Table 1 for further data.
Table 1: Number # of Establishments and Growth Rate from 2007-2011
2007 2008 2009 2010 2011
State # firms Growth Rate
Hawaii 36,404
3.95%
36,801
1.09%
37,021
0.60%
36,556
1.26%
36,386
0.46%
New York 563,450
1.18%
569,694
1.11%
570,602
0.16%
572,661
0.36%
580,476
1.36%
Louisiana 114,514
-1.25%
118,306
3.31%
119,102
0.67%
123,120
3.37%
120,309
2.28%
California 1,260,646
2.15%
1,293,475
2.60%
1,304,843
0.88%
1,299,532
0.41%
1,337,655
2.93%
*Source: (Thompson and Walstad, 2012)
Hawaii Small Business Demographic Data
Hawaii has a total of 120,374 small businesses established, compared to 27,092,908 in
the USA. (US Census Bureau). There are .09% of small businesses in Hawaii that are black-
owned, compared to 7.1% in the USA, 1.3% of Hawaii Businesses are American Indian or
Alaska Native-owned, compared to 0.9% in the USA, 9.5% of Hawaiian small businesses are
Native Hawaiian or Pacific Island owned compared to 0.1% in the USA and 47.2% of Hawaiian
businesses are Asian-owned compared to 5.7% in the USA (US Census Bureau). Women-owned
businesses account for 31% of all small businesses in Hawaii, compared to 28.8% in the USA
and 3.6% of Hawaiian businesses are Hispanic owned versus 8.3% of the USA (US Census
Bureau).
The Journal of Business Leadership
34
THEORETICAL AND CONCEPTUAL BASIS
The Resource Based View
The purpose of exploratory case analysis is to discover and understand situations that
lack a single set of distinct outcomes (Baxter & Jack, 2008). The value of case analysis is to
enrich theory and allow for a greater understanding of how the theory applies to the real world.
This may not be possible through statistical analysis alone (Nutall et al, 2011). The method
allows for the examination of a phenomena and the phenomena in a dynamic context. Therefore
this approach allowed the authors to examine the applicability of the Resource Based View of
the firm (RBV) to entrepreneurs dynamically reacting to their external and internal
environments.
The Resource Based View (RBV) views organizations as combinations of resources,
competencies, talents, and abilities (Penrose, 1959; Penrose 2003) that can provide unique
competitive advantages difficult for competitors to emulate. Such resources may enable
organizations to outpace their competitors, reduce internal flaws, provide superior products or
services, and more importantly provide something that customers value. Examples of such
competencies include but are not limited to: internal firm capabilities (Hart, 1995), specialized
equipment or location (Eisenhart and Martin, 2000), start up assistance (Radojevich-Kelley and
Hoffman, 2012), scientific expertise (Eisenhart and Martin, 2000), mentorship (Radojevich-
Kelley and Hoffman, 2012), internal firm processes (Miller and Ross, 2003), and lean production
(Womack, Jones, and Roos, 1991).
Eisenhart and Martin (2000) added the concept of “dynamic capabilities” or the ability to
reconfigure or “recombine” resources to reenergize the firm with “synergistic” combinations that
improve internal process or strategic matching of resources to customer needs. In a ten year
review of RBV, Barney, Wright, and Ketchen (2001) suggest that the concept can be applied to
entrepreneurs whose customer knowledge, market awareness, experience, and learning can
provide sustainable competitive advantages. However, these authors did not provide examples or
further explanation.
It is important to note that the RBV has been criticized by some scholars because
previous applications did not take into account the external environmental context, trends and
The Journal of Business Leadership
35
factors that impact businesses at large (De Toni & Tonchia, 2003; Hart, 1995). However, the
authors of this paper believe that this study of entrepreneurs reacting to the recession of 2008
may provide insights into whether RBV applies. Did these entrepreneurs exhibit “dynamic
capabilities” by realigning their resources into ways competitors could neither easily copy nor
replace without great effort? If these conditions hold true and their company’s bundle of
resources assisted in sustaining above average returns, especially during a recession, then there is
evidence present to support both RBV and its application to external environmental factors.
METHODOLOGY
Exploratory Case Study Methodology
Exploratory case study methodology is used to examine phenomenon, circumstances and
situations where there is no set or predictable outcome (Baxter & Jack, 2008; Hancock and
Algozzine, 2006; Tracy, 2010). Stake, 1995; Yin 1992). The examination of a phenomena or
occurrence can lead to theory or propositions where few exist and allows for examination of not
just a phenomena but the phenomena in its context such as relevant processes (Hoffman and
Radojevich-Kelley, 2012; Yin, 1992; Yin, 1981). Exploratory case study is not limited to
statistics or qualitative data; it allows researchers to observe multiple activities and outcomes
over time, and to study multiple participants in-depth (Hancock and Algozzine, 2006; Stake,
1995; Hoffman and Radojevich-Kelley, 2012). Case study has been widely utilized in family
business studies (Barach and Gantisky, 1995; Murray, 2003), franchise use of bootstrapping
(Falbe et al, 2011) and nurse-patient research (Baxter and Rideout, 2006; Baxter and Jack, 2008).
There are many common mistakes utilized during case study analysis. According to Yin
(2003) to avoid common pitfalls associated with case study analysis, researchers should place
limitations on a case and avoid trying to answer questions that are too broad in nature. In other
words, researchers should connect the case study by placing boundaries, such as place and time
to it. For this reason, the authors of this study bound the case study by using Hawaiian
entrepreneurs involved in tourism, during the Great Recession of 2008 as subjects for analysis.
The Journal of Business Leadership
36
Research Design
The research design utilized for the paper was an exploratory case study of five Hawaiian
small businesses reliant on tourism during the Great Recession of 2008. The case study approach
was selected because it allowed the authors to study an occurrence in an actual situation (Yin,
2003; Baxter & Jack, 2008; Hoffman and Radojevich-Kelley, 2012). The authors utilized
multiple methods for data collection during the qualitative study (Tracy, 2011; (Hoffman and
Radojevich-Kelley, 2012). Specifically, the authors observed case study participants during day-
to-day operations, interviewed and surveyed business owners, reviewed company information
and websites, analyzed relevant articles, reviewed social media sites, reviewed open-source
materials, and relevant marketing materials were reviewed.
Data Collection
Five Hawaiian small business owners were selected for the study. Subjects were selected
based on their convenience and willingness to participate and willingness to disclose information
for the study. Hawaiian business owners were contacted first by telephone, with follow-ups
conducted through email. Each participant was asked to fill out an open-ended questionnaire.
After the questionnaire was complete, additional follow-up phone calls and emails were
conducted; website reviews, social media sites were reviewed and marketing materials were
examined.
It is important to note that the sample was a convenience sample with business owners
who agreed to participate and who were directly involved with the day to day business
throughout the Great Recession of 2008. None of the authors had prior connection, contact or
involvement with any of the Hawaiian business owners who participated in the study.
Specifically, the authors contacted five potential Hawaiian Business Owners who 1) had
a business in operation during the Great Recession of 2008, 2) had two or more employees
working for them, 3) were located on a Hawaiian Island, 4) were involved in the tourism
industry, 5) were willing to disclose information and participate for the length of the study and 6)
had experiences they were willing to describe about running a business in Hawaii and during the
recession. All five business owners participate for the length of the study and throughout the
study.
The Journal of Business Leadership
37
The authors collected data and conducted in-depth analysis one company at a time. The
primary means for data collection methods were 1) qualitative, open-ended questions concerning
the experiences, strategies, challenges and obstacles that business owners faced throughout the
recession, 2) observation of the day-to-day operations of the business, interaction with customers
and interaction between employees and employer 3) review of company websites, social media,
personal interviews, relevant open-source materials and marketing materials located in the
community.
The results of the study included an analysis of the experience of five business owners,
the business strategies or tactics employed throughout the recession, challenges and obstacles
faced during the recession, motivations for starting a business in paradise and challenges
associated with running a business in Hawaii. Similarities between the experiences were reported
and conclusions were drawn. According to case study analysis, five in-depth case analysis is an
acceptable number of cases to study for the case study approach (Creswell, 1998)
Interview Data
All Hawaiian business owners were asked open-ended questions about their experience
with running a business during the recession, the business strategies or tactics employed
throughout the recession, challenges and obstacles faced during the recession, motivations for
starting a business in paradise, and challenges associated with running a business in Hawaii. This
research design was selected to allow subjects to elaborate when needed, and to select from
multiple choice questions where applicable. Business owners were asked to expand their
thoughts, answers and opinions where relevant.
Author’s Roles
It is recommended for authors to disclose their involvement during qualitative data
collection (Nutall et all, 2010) to help establish roles and assess whether the involvement added
or hindered the data collection and assessment processes throughout the study. The authors of
this study are faculty members and all three authors are small business owners. This allowed the
authors to understand the research process, the challenges and obstacles that owners experience
and enabled a greater understanding of small businesses ownership during troubled economic
times.

The Journal of Business Leadership
38
Results
Explanation of Results
Each case has commonalities in that they all reside on Hawaii, are reliant on tourism,
have employees and operated during the recession of 2008.
Hawaiian Business Information
As indicated in Table 2, the businesses in the study emphasized that eighty percent or
more of their business is reliant on tourism. Annual revenues for all the businesses surveyed
were half a million dollars or greater per year. Every Hawaiian business owner stated that they
saw a drop in revenue since the start of the 2008 recession. Four out of five companies surveyed
were currently cash-flow positive. One business owner reported that their business was not cash
flow positive at this time and that the recession had impacted their sales and revenue noticeably.
For greater details, please see Table 2.
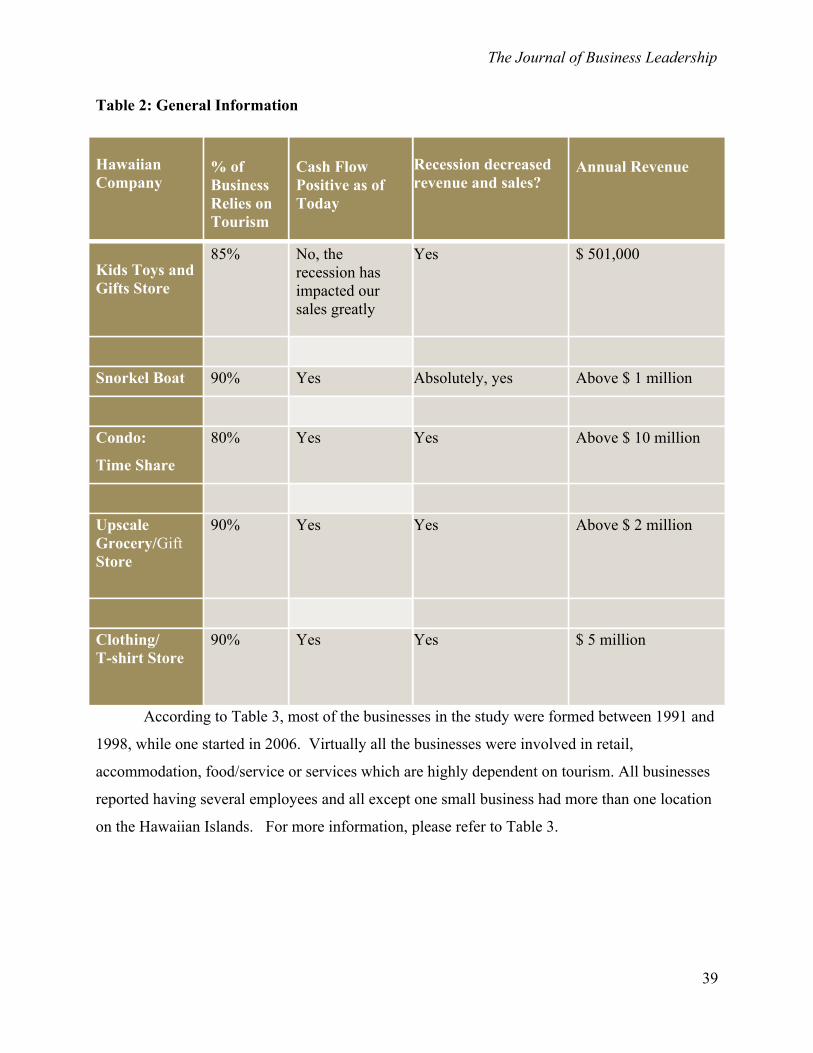
The Journal of Business Leadership
39
Table 2: General Information
Hawaiian Company
% of Business Relies on Tourism
Cash Flow Positive as of Today
Recession decreased revenue and sales?
Annual Revenue
Kids Toys and Gifts Store
85% No, the recession has impacted our sales greatly
Yes $ 501,000
Snorkel Boat 90% Yes Absolutely, yes Above $ 1 million
Condo:
Time Share
80% Yes Yes Above $ 10 million
Upscale Grocery/Gift Store
90% Yes Yes Above $ 2 million
Clothing/ T-shirt Store
90% Yes Yes $ 5 million
According to Table 3, most of the businesses in the study were formed between 1991 and
1998, while one started in 2006. Virtually all the businesses were involved in retail,
accommodation, food/service or services which are highly dependent on tourism. All businesses
reported having several employees and all except one small business had more than one location
on the Hawaiian Islands. For more information, please refer to Table 3.
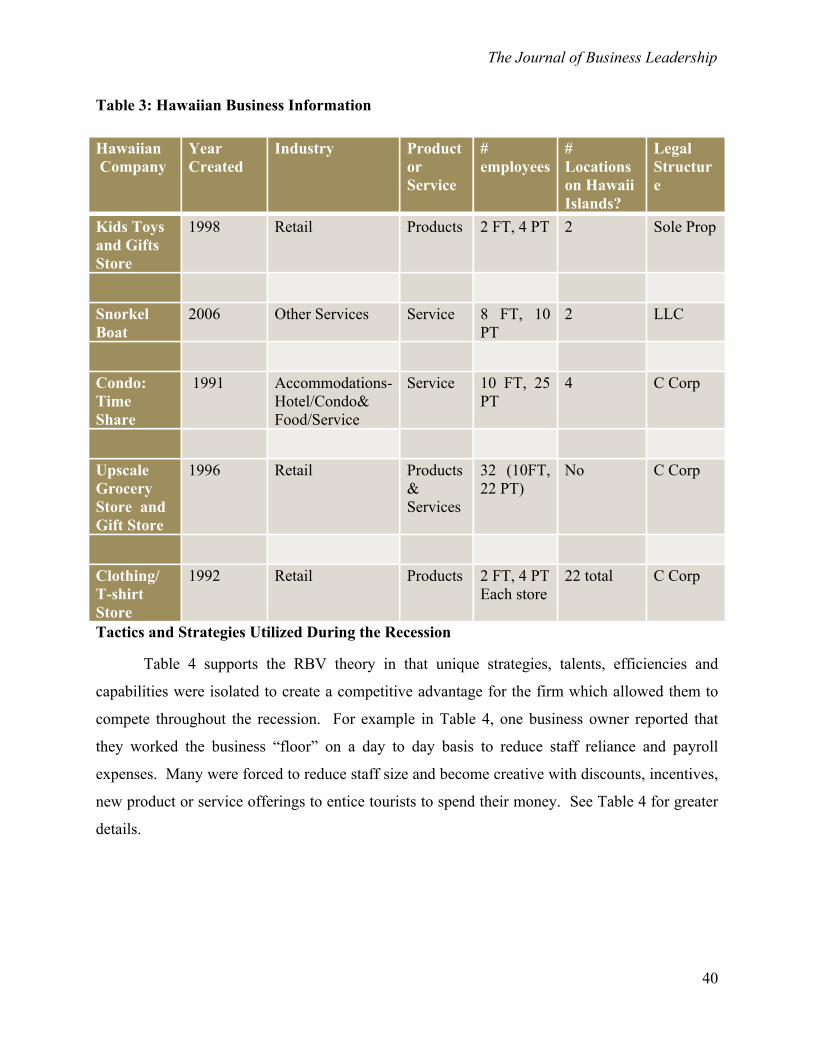
The Journal of Business Leadership
40
Table 3: Hawaiian Business Information
Hawaiian Company
Year Created
Industry Product or Service
# employees
# Locations on Hawaii Islands?
Legal Structure
Kids Toys and Gifts Store
1998 Retail Products 2 FT, 4 PT 2 Sole Prop
Snorkel Boat
2006 Other Services Service 8 FT, 10 PT
2 LLC
Condo: Time Share
1991 Accommodations-Hotel/Condo& Food/Service
Service 10 FT, 25 PT
4 C Corp
Upscale Grocery Store and Gift Store
1996 Retail Products & Services
32 (10FT, 22 PT)
No C Corp
Clothing/ T-shirt Store
1992 Retail Products 2 FT, 4 PTEach store
22 total C Corp
Tactics and Strategies Utilized During the Recession
Table 4 supports the RBV theory in that unique strategies, talents, efficiencies and
capabilities were isolated to create a competitive advantage for the firm which allowed them to
compete throughout the recession. For example in Table 4, one business owner reported that
they worked the business “floor” on a day to day basis to reduce staff reliance and payroll
expenses. Many were forced to reduce staff size and become creative with discounts, incentives,
new product or service offerings to entice tourists to spend their money. See Table 4 for greater
details.
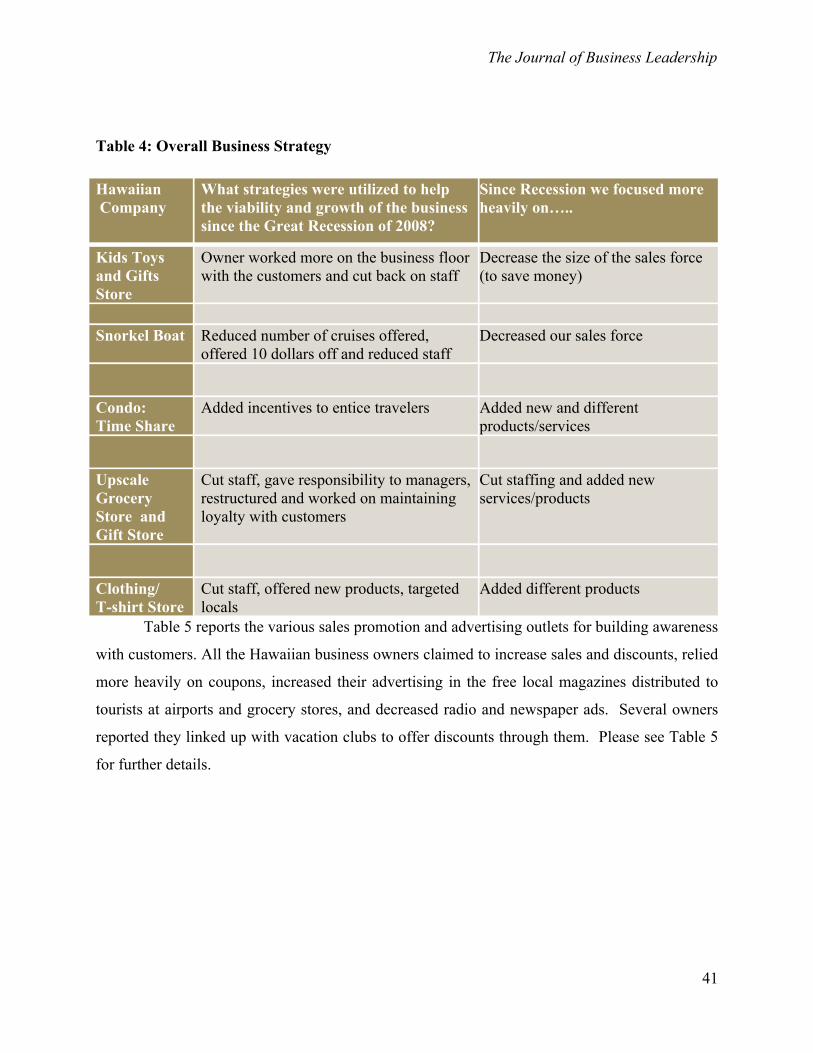
The Journal of Business Leadership
41
Table 4: Overall Business Strategy
Hawaiian Company
What strategies were utilized to help the viability and growth of the business since the Great Recession of 2008?
Since Recession we focused more heavily on…..
Kids Toys and Gifts Store
Owner worked more on the business floor with the customers and cut back on staff
Decrease the size of the sales force (to save money)
Snorkel Boat Reduced number of cruises offered,
offered 10 dollars off and reduced staff Decreased our sales force
Condo: Time Share
Added incentives to entice travelers Added new and different products/services
Upscale Grocery Store and Gift Store
Cut staff, gave responsibility to managers, restructured and worked on maintaining loyalty with customers
Cut staffing and added new services/products
Clothing/ T-shirt Store
Cut staff, offered new products, targeted locals
Added different products
Table 5 reports the various sales promotion and advertising outlets for building awareness
with customers. All the Hawaiian business owners claimed to increase sales and discounts, relied
more heavily on coupons, increased their advertising in the free local magazines distributed to
tourists at airports and grocery stores, and decreased radio and newspaper ads. Several owners
reported they linked up with vacation clubs to offer discounts through them. Please see Table 5
for further details.

The Journal of Business Leadership
42
Table 5: Marketing Strategy
Hawaiian Company
Since recession our sales promotions ….. Since the Great Recession what media outlet do we rely on for advertising?
Kids Toys and Gifts Store
Focused solely on targeting frequent customers, reduced formal advertising and flyers, increased number of sales to attract the local Hawaiians into the store, discounted products quicker
Reduced radio and newspapers and relied heavily on ads in local magazines found in stores
Snorkel Boat Offered a discount for seniors and kids, offered ten dollars off coupon, offered discounts on early morning cruises (when numbers are low), charged for alcohol and ran specials on the boat ride back to the docks. Announce drink specials throughout the cruise to lure, charged extra for pictures, for under water cameras and for scuba diving
Focused on adding ads in magazines found at airports and stores, negotiated discounts with vacation clubs (coupons and discounts)
Condo: Time Share
Offered more sales/incentive upgrades, more points with perks, gave-away a discount card for things on the island if sat through ‘sales’ pitch. Offered free week with purchase, increased “pressure” sell and person-to-person sell, rewarded frequent customer idea
Social media (Facebook), outdoor advertisements (billboards, bus-stop benches), word of mouth and person-to-person selling at strip- mall areas
Upscale Grocery Store and Gift Store
Offered “bundled” coffee and breakfast items for price conscious vacationers, increased “ready-made” food option sales, offered more variety and options to take away foods with discounts. Increased daily deals, increased discounts on alcohol products. Added more unique sauces and spices, Hawaiian products for sale. Offered a free gift with a 150$ purchase.
Banners and ads on windows of the store, prime location and daily sales. Joined vacation club “pitch” discount program.
Clothing/ T-shirt Store
Offered more sales and discounts. Bundling our products (buy one and get 50% off next product, or buy one and get a coffee mug free)
Magazines and Facebook..we reduced ALL other ads (no radio, newspaper because it was expensive). We use a lot of outdoor advertising on bus-stop benches and billboards)

The Journal of Business Leadership
43
As evident in Table 6, most of the Hawaii business owners sought to find one of a kind
products or services that were not easily substituted with competitor products. Many focused on
providing superior customer service, or offering high quality, unique products not found
elsewhere. See Table 6 for greater detail.
Table 6: Differentiation Strategy
Hawaiian Company
What differentiation strategies have been used since Great Recession began?
Kids Toys and Gifts Store
Unique offering that other toy stores do not have and cannot be bought just anywhere, we focused heavily on superior customer service, looked for quality products, and increased the variety of products that we offer
Snorkel Boat Offered more unique offerings, increased the drink specials, offered cameras and SNUBA which was not being offered elsewhere. Hired FUN crew members who entertain, focused on superior customer service, cook fresh on the boat, target finding new customers
Condo: Time Share
Offered more options, offer extra points for premium packages, targeted new customers, focus on impulse purchases…try to make it look better so they sign up without thinking too hard. Show how we are different from average vacation club
Upscale Grocery Store and Gift Store
More variety, more options, focused on high-end foods and ready made foods, focused on options for grab and go and also cook at condo. Increased alcohol offerings. Increased unique spices and local unusual products, and focused on improving customer service. Increased our focus to include the Japanese market and products they might buy. Translated several advertisements and promotions in Japanese.
Clothing/ T-shirt Store
Offered more products, focused on superior service, offer a warranty, offered unusual products, targeted new customers (translated coupons in various languages) and participated in local events to target local Hawaiians.
The Journal of Business Leadership
44
Challenges and Obstacles with Running a Business in Hawaii During the Recession
Table 7 identifies various obstacles and challenges reported by Hawaiian business
owners. All five Hawaiian business owners reported that their greatest obstacle was less
customers caused by a decrease of tourists on the islands due to the recession. In other words,
business owners reported hardship from the decreased tourism. These results support the
literature review which reported that Hawaii had a drop in tourism of 10 percent during 2008 and
twelve percent in 2009, thus impacting the local economy (Young, 2008; Thomas, 2012). In
addition, all of the business owners stated that electricity costs increased, thus causing extra
hardship for them. Several owners reported that due to higher energy bills, higher rent on the
Hawaiian Islands and because of its remote location, the overall cost for merchandise on
Hawaiian is higher compared to mainland USA. This is simply because shipping costs and
supply costs are higher in Hawaii due to its remote location. Owners reported frustration because
customers felt that they were being taken advantage of or felt “ripped off” because costs for
products/services were substantially more. According to Hawaiian business owners, the cost of
goods and costs of running a business in Hawaiian is higher, thus products/services cost more
which does not necessarily translate to increased sales. See Table 7 for more information.
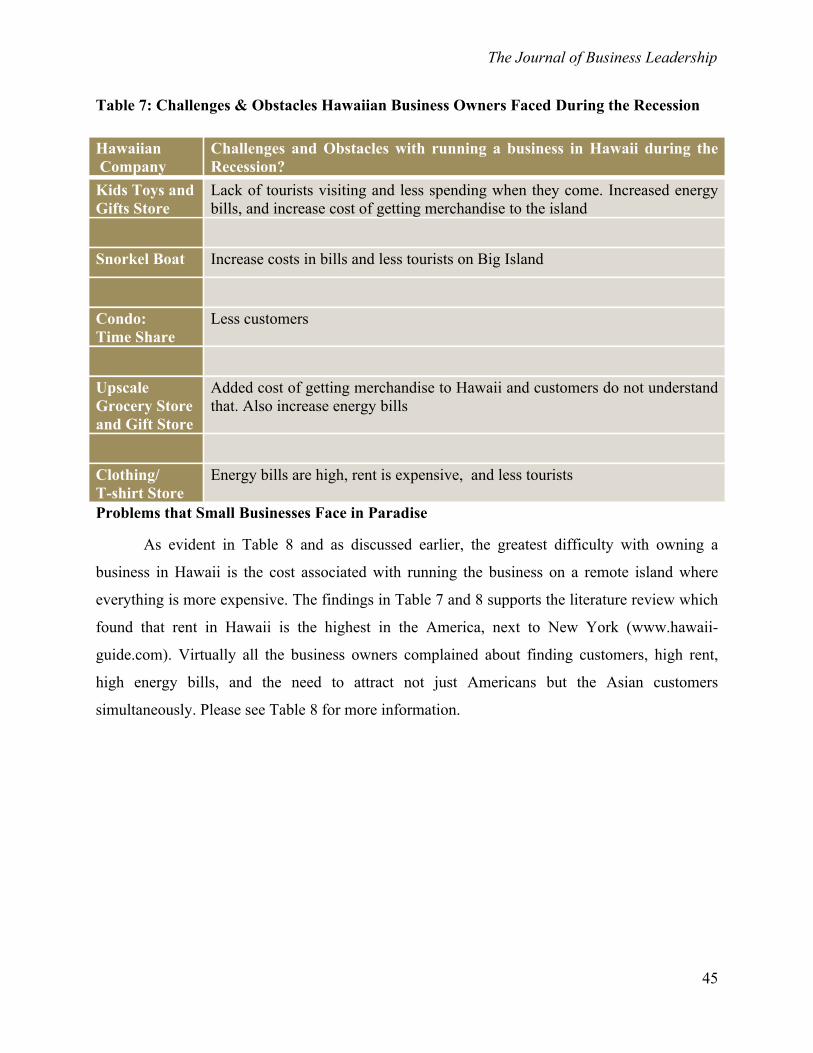
The Journal of Business Leadership
45
Table 7: Challenges & Obstacles Hawaiian Business Owners Faced During the Recession
Hawaiian Company
Challenges and Obstacles with running a business in Hawaii during the Recession?
Kids Toys and Gifts Store
Lack of tourists visiting and less spending when they come. Increased energy bills, and increase cost of getting merchandise to the island
Snorkel Boat Increase costs in bills and less tourists on Big Island
Condo: Time Share
Less customers
Upscale Grocery Store and Gift Store
Added cost of getting merchandise to Hawaii and customers do not understand that. Also increase energy bills
Clothing/ T-shirt Store
Energy bills are high, rent is expensive, and less tourists
Problems that Small Businesses Face in Paradise
As evident in Table 8 and as discussed earlier, the greatest difficulty with owning a
business in Hawaii is the cost associated with running the business on a remote island where
everything is more expensive. The findings in Table 7 and 8 supports the literature review which
found that rent in Hawaii is the highest in the America, next to New York (www.hawaii-
guide.com). Virtually all the business owners complained about finding customers, high rent,
high energy bills, and the need to attract not just Americans but the Asian customers
simultaneously. Please see Table 8 for more information.

The Journal of Business Leadership
46
Table 8: Problems with Having a Business in Paradise
Hawaiian Company
Problems with running a business in Paradise…
Kids Toys and Gifts Store
PRICING….Tourists think we are ripping them off with our prices, but it takes time and is expensive to get things shipped here. Also, we need more tourists on the Big Island to help support our businesses.
Snorkel Boat Getting customers, high costs of energy, taxes, mandatory insurance costs, high cost of products and rent
Condo: Time Share
Getting customers, rent is expensive
Upscale Grocery Store and Gift Store
Stocking a huge variety of products to entice tourists from all over (especially Asia) , pricing things affordably, high bills
Clothing/ T-shirt Store
Getting the word out about our business especially in different languages to cater to the tourist flow. High costs in Hawaii.
Motivations for Starting a Business in Paradise
Table 9 reports that the primary motivation for starting a business in paradise was for
freedom. One entrepreneur reported that they began a business to increase personal wealth,
while another entrepreneur created a venture to pursue a lifelong dream of owning a venture. No
entrepreneurs report that they start a business due to necessity or because they had no other
employment options. Please see Table 9 for details.
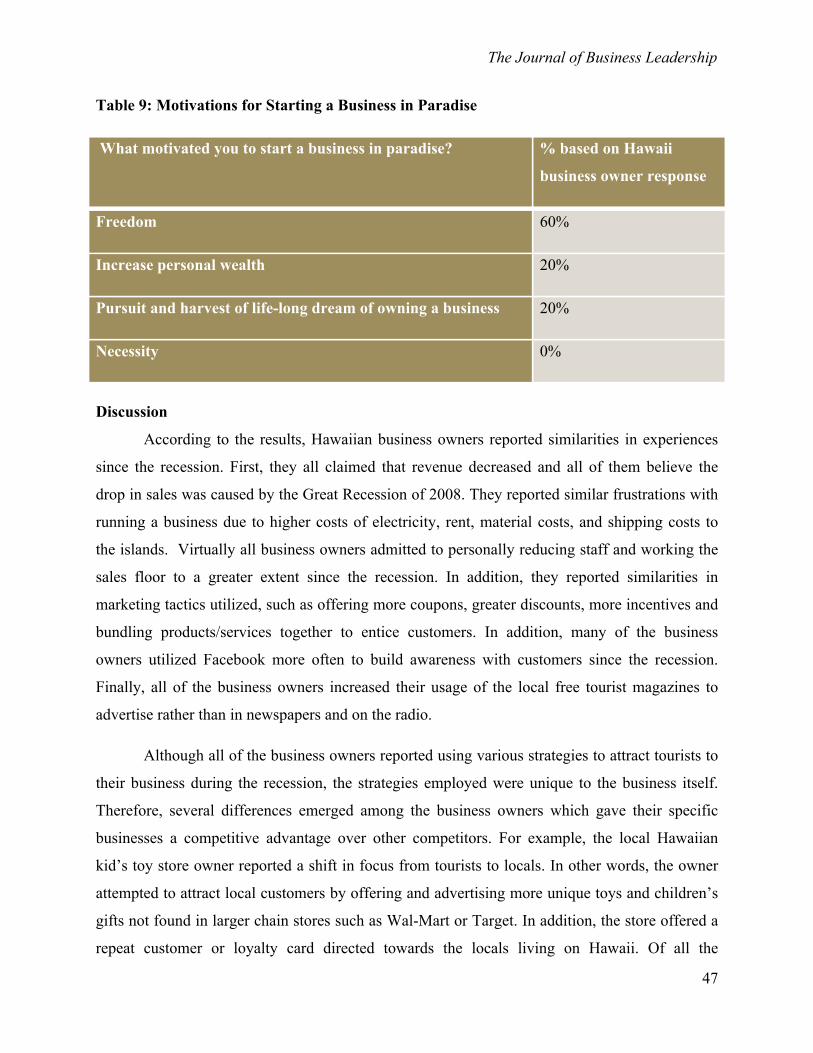
The Journal of Business Leadership
47
Table 9: Motivations for Starting a Business in Paradise
What motivated you to start a business in paradise? % based on Hawaii
business owner response
Freedom 60%
Increase personal wealth 20%
Pursuit and harvest of life-long dream of owning a business 20%
Necessity 0%
Discussion
According to the results, Hawaiian business owners reported similarities in experiences
since the recession. First, they all claimed that revenue decreased and all of them believe the
drop in sales was caused by the Great Recession of 2008. They reported similar frustrations with
running a business due to higher costs of electricity, rent, material costs, and shipping costs to
the islands. Virtually all business owners admitted to personally reducing staff and working the
sales floor to a greater extent since the recession. In addition, they reported similarities in
marketing tactics utilized, such as offering more coupons, greater discounts, more incentives and
bundling products/services together to entice customers. In addition, many of the business
owners utilized Facebook more often to build awareness with customers since the recession.
Finally, all of the business owners increased their usage of the local free tourist magazines to
advertise rather than in newspapers and on the radio.
Although all of the business owners reported using various strategies to attract tourists to
their business during the recession, the strategies employed were unique to the business itself.
Therefore, several differences emerged among the business owners which gave their specific
businesses a competitive advantage over other competitors. For example, the local Hawaiian
kid’s toy store owner reported a shift in focus from tourists to locals. In other words, the owner
attempted to attract local customers by offering and advertising more unique toys and children’s
gifts not found in larger chain stores such as Wal-Mart or Target. In addition, the store offered a
repeat customer or loyalty card directed towards the locals living on Hawaii. Of all the
The Journal of Business Leadership
48
businesses studied, the toy store was the only store that was cash-flow negative at the time of the
case study.
The upscale grocery store owner stated that they shifted their focus to the Japanese
market because they believed the Asian market was not as severely impacted by the recession.
This owner translated all their signage, marketing materials and advertising signs to include the
Japanese market. In addition, the store introduced more Japanese products meant to appeal to
their Japanese clients. Lastly, they offered more breakfast and lunch ‘ready-made’ items at
affordable prices to entice the price conscious tourists.
The snorkel boat owner explained that they expanded discounts for seniors and children,
and offered more drink specials on the boat rides. In addition, they offered a family rate and
extra discounts on the early morning excursions which had lower customer volumes. They also
focused more heavily on alcohol promotions and sales because they found that they had higher
margins on alcohol sales compared to other offerings. In addition, the owner explained that they
focused on improving customer service and improving the overall customer experience while on
the excursion. They offered a reduced rate for local Hawaiian residents with a valid driver’s
license. They also introduced SNUBA at an extra cost, which was unique and rarely offered on
most competitor excursions at the time. The company owner stated that they trained their staff to
understand that “fun” and entertainment is a competitive advantage unique to them and that crew
and staff were expected to entertain and provide stellar customer service at all times. They
started stocking, promoting and selling disposable underwater cameras, group pictures, DVD
video footage of the excursion itself, tubes of sunscreen, rash guard swim shirts and they offered
a unique, one of a kind beverage that combats/aids sea sickness all for an extra fee. The owner
stated that these strategies were successful and set them apart thus far.
The local t-shirt/gift shop owner stated that they bundled their shirts with local Hawaiian
tourist items, such as calendars and coffee mugs to entice customers. In addition, they translated
sales and discount offers in many languages to help build awareness in the market. The owner
also started to work the sales floor and reduce their reliance on staff to cut expenses.
The condo owner stated that they focused more heavily on pressure sales, impulse
purchases and by focusing less on the “hidden” extra costs associated with time-share and condo
The Journal of Business Leadership
49
ownership in Hawaii. In addition, they focused their sales pitches towards the idea that customers
are investing in a paid vacation for the rest of their life, their kids’ life, and their grandkids lives.
In other words, they focus sales on the emotional side to sell their condos and time-shares.
Lastly, the condo enticed customers to come see the condos by offering a free discount card that
provided customers with 20% off at many local retail stores, excursions and restaurants to reduce
the cost of their vacation. The discount card was free as long as customers listened to company
“sales pitches”. Once the customer is at the pitch, the sales personnel use pressure tactics,
emotional marketing and impulse purchases paid over a life time to ‘lock’ customers in.
General Comments
All of the Hawaiian business owners reported similar challenges and obstacles during the
recession. The single most identified complaint by the Hawaiian business owners was the
marked drop in the number of tourists on the Islands since the recession began. They reported
similar frustrations with drops in revenue caused by less tourists traveling to Hawaii to spend
money. In addition, many complained about the increased cost of living associated with running
a business, and increased energy costs which placed extra hardships on the business throughout
the economic downturn.
Application of Resource Based View to Results
Some of the benefits of the exploratory case study approach are insights into both
phenomena and their context and better connections of theories to the real world. The study
uncovered four such insights into RBV’s real world application: these owners’ actions utilized
both RBV’s structure and process, they reacted to their external environment - a recession, they
used a combination of internal and external actions to prosper, and they displayed “dynamic”
capabilities.
Resource Based View (RBV) suggests that businesses are a collection of resources, and
capabilities which create distinctive competitive advantages (Penrose, 2003; Ravenswood, 2011).
The structural portion of the theory emphasizes unique resources (Barney, 1991) while the
process portion emphasizes internal processes within a firm that creates efficiencies (Miller &
Ross, 2003).
The Journal of Business Leadership
50
First, Hawaiian businesses provide a good example of the “structure” portion of the RBV
because they each rely on unique resources. For example, business owners state that human
capital resources are critical and vital to the success of the business throughout the recession. The
staff and owners focused on quality customer services to remain cash flow positive.
The process portion of the RBV is evident through the competitive advantages
established by the Hawaii business owners. Business owners report efficiencies, such as working
the sales floor instead of relying on staff to sell products/services, reducing formal advertising in
newspapers and radio, and offering unique or one of a kind products/services to set the business
apart from competition, etc.
Next, entrepreneurs used a combination of internal and external activities, such as
streamlining internal operations, varying their marketing strategies and promotion tactics, and
marketed to a larger customer group- the Japanese.
Fourth, the authors believe that the owners displayed Eisehart and Martin’s (2000)
“dynamic capabilities” by accurately assessing their internal and external environments and by
changing or realigning their resources. The insight from the case study raises numerous
questions: 1) does this disprove the RBV critics who believe that the RBV does not account for
environmental changes, 2) what are the differences between the owners who changed and those
who did not, 3) is the dynamic capability a unique characteristic requiring both the ability to
conduct environmental assessment and the ability to change, 4) can this capability be taught, and
is it aligned with other entrepreneurial characteristics?
If future quantitative studies confirmed similar findings in competitive advantages and unique
resources, such results would enhance RBV.
Limitations of the Study
The main limitation on the study is that it is not generalizable to the population
(Sandelowski, 1986). The in-depth case study only examined five Hawaii business owners
during the recession. The study looked at the experiences occurring over a select period of time,
the Great Recession, which would be impossible to replicate. In addition, the study looked at
businesses impacted by tourist on Hawaii which is also challenging to replicate.
The Journal of Business Leadership
51
The results cannot be generalized to other business owners in the US. This is simply
because the unique circumstances that the Hawaii business owners faced and their personal
experiences were unique to where they lived and the economic times they faced. However, it is
recommended that a large quantitative study, surveying a large group of business owners across
the USA might add value to the findings from this study regarding business owner experience
during a recession. In addition, it is advised that a larger study be conducted on Hawaii business
owners to see if generalizations can be made.
Conclusions and Future Research
Propositions
Exploratory case study research should establish propositions to help promote discussions
in academics (Editors, 2011). Based on the results in the study, the authors believe that ensuing
research could determine the validity of the propositions created as a result of this research study.
Proposition 1: Small businesses are impacted by a down-turned economy, specifically
revenue decreases.
This proposition is a result of comments made by all of the Hawaii business owners
regarding the recession. All of the business owners stated that their revenue and sales decreased
due to a reduction of tourism caused by the recession of 2008. This can be verified in future
follow up surveys on business owners reliant on tourism.
Proposition 2: In a recession small businesses must rely on innovative, competitive
advantages to survive.
This proposition was established because all five business owners utilized innovative
tactics or strategies, such as focusing on stellar customer service, incorporating new and unusual
products, and targeting new customers. These strategies/tactics allowed Hawaii business owners
to compete successfully during the recession. This can be verified in follow-up studies which
examine marketing and management strategies/tactics employed by business owners to help gain
competitive advantages. Please see Tables 4, 5 and 6 for further information regarding specific
tactics and strategies.
The Journal of Business Leadership
52
Proposition 3: Hawaii business owners and founders face unique obstacles and challenges
during the recession.
Table 7 results support this proposition. Business owners discussed the reduction of
tourism that plagued the Hawaiian Islands and impacted their revenues.
Proposition 4: As small businesses are impacted by the recession they spend less money on
advertising and marketing.
This proposition was a result of all five Hawaiian business owners stating that they
switched from expensive media, such as radio and newspapers to lower cost, more visible and
affordable advertising. Each business owner admitted to advertising in the local free magazines
displayed at the airports and grocery stores. Owners found these magazines more visible, with
greater circulation and greater return for the money compared to radio and newspapers.
Proposition 5: Even without a recession, small businesses on remote islands are plagued by
higher cost of doing business which frustrates customers because products/services are
excessively expensive.
This proposition was established because virtually all the Hawaiian business owners
reported frustration with the lack of understanding from the customers. They expressed concern
with the high costs associated with running and operating a business on Hawaii, such as high
energy bills, high rent, high taxes, high cost of transportation and shipping and resource
shortages. They expressed frustration that customers do not take these into account when looking
at the overall price of products/services on the islands. Table 8 reports the results supporting this
proposition.
Proposition 6: The ability to both assess internal and external environments and the
willingness to adapt to those environments are unique “dynamic capabilities.”
This proposition is introduced because many Hawaii businesses faced the same recession
– some businesses changed, while many did not. Those that adapted gained competitive
advantages from their capability to shift or change.
The Journal of Business Leadership
53
Future Research
The authors of this study believe that more research needs to be done on Hawaiian
businesses in the form of a larger quantitative study. In addition, the authors believe it would be
worthwhile to examine small businesses on other islands, similar to Hawaii to see if their
experiences and frustrations are similar. Lastly, other states that are impacted by tourism, such as
ski resort states would be interesting to research and compare to Hawaiian business owners. If
further research is conducted, the validity of the propositions in this study should be examined.
Further quantitative analysis would establish whether proposition 6 is true opening a new
avenue of research into successful entrepreneurial characteristics.
REFERENCES
Barach, J.A. & Gantisky, J.B. (1995). Successful succession in family business. Family Business Review, 8(2), 131-155.
Barney, J.B. (1991). Firm resources and sustained competitive advantage. Journal of Management, 17 (1) 99-120.
Barney, J., Wright, M., & Ketchen, D.J. (2001). The resource-based view of the firm: Ten years after 1991. Journal of Management 27, 615-641.
Baxter, P., & Jack, S. (2008). Qualitative case study methodology: Study design and implementation for novice researchers. The Qualitative Report, 13(4), 544-559. Retrieved from http://www.nova.edu/ssss/QR/QR13-4/baxter.pdf
Baxter, P., & Rideout, L. (2006). Decision making of 2nd year baccalaureate nursing students. Journal of Nursing Education, 45(4), 121-128.
Creswell, J. (1998). Research design: Qualitative, quantitative, and mixed methods approaches (2nd ed.). Thousand Oaks, CA: Sage.
De Toni, A.& Tonchia, S. (2003). Strategic planning and firms’ competencies: Traditional approaches and new perspectives. International Journal of Operations and Production Management, 23 (9) 947-977.
Editors of the Academy of Management Journal. (2011). The coming of age for qualitative research: Embracing the diversity of qualitative methods. Academy of Management Journal, 54(2) 233-237.
The Journal of Business Leadership
54
Eisenhart, K.M. & Martin, J.A. (2000). Dynamic capabilities: What are they? Strategic Management Journal 21 (10/11)1105-1121.
Falbe, C.M., Kumar, A., & Welsch, D.H.B. (2011). Franchisee use of bootstrapping: An exploratory study of financing decisions. Small Business Institute Journal 7 (2) 63-70.
Hancock, D. R., & Algozzine, B. (2006). Doing case study research: A practical guide for beginning researchers. New York: Teachers College Press.
Hart, S.L. (1995). A natural-resource-based view of the firm. The Academy of Management Review, 20 (4) 986-1014.
Hawaii Visitor Guide Statistics. (n.d) Retrieved on September 20, 2012 at http://www.hawaii-guide.com/content/posts/hawaii_tourism_statistics
Hoffman, D.L., Radojevich-Kelley, N. (2012). Analysis of Accelerator Companies: An Exploratory Case Study of Their Programs, Processes, and Early Results. Small Business Institute Journal, 8(2).
Isidore, C. (2008). It’s official: recession since Dec. 07. CNN Money 1(1). Retrieved on August 12, 20012 at http://money.cnn.com/2008/12/01/news/economy/recession/index.htm
Kavoussi, B. (July, 2012). Recession Killed 170,000 Small Businesses Between 2008 and 2010: report. Huffington Post. Retreived at http://www.huffingtonpost.com/2012/07/25/us-lost-more-than-170000-small-businesses-2008-2010_n_1702358.html.
Lawrence, W.H. (1959, August). Hawaii becomes the 50th State. The New York Times retrieved a http://www.nytimes.com/learning/general/onthisday/big/0821.html#article.
Miller, S.R. & Ross, A.D. (2003). An exploratory analysis of resource utilization across organizational units: Understanding the resource-based view. International Journal of Operations and Production Management, 23 (9) 1062-1084.
Murray, B. (2003). The succession transition process: A longitudinal perspective. Family Business Review, 16 (17). Retrieved from http://fbr.sagepub.com/content/16/1/17
Nuttall, P.,Shankar, A., Beverland, M.B.& Hooper, C.S. (2011). Mapping the unarticulated potential of qualitative research: Stepping out from the shadow of quantitative studies. Journal of Advertising Research, 51 (1) 153-166.
Oliff, P., Mai, C. & Palacios, V. (2012). State continues to feel recessions impact. Center of Budget and Policy Priorities. Retrieved on September, 10, 2012 at http://www.cbpp.org/cms/index.cfm?fa=view&id=711.
Penrose, E.T. (1959). The Theory of the Growth of the Firm. Oxford: Oxford University Press. Also available in 2009 as the 4th edition.

The Journal of Business Leadership
55
Penrose, E.T. (2003). The Theory of the Growth of the Firm. Chapter 21 p 335-350 in The SMS Blackwell Handbook of Organizational Capability: Emergence, Development & Change MA: Blackwell Publishing Company.
Ravenswood, K. (July 01, 2011). Eisenhardt's impact on theory in case study research. Journal of Business Research, 64, (7), 680-686 Retrieved from http://0-www.sciencedirect.com.skyline.ucdenver.edu/science/article/pii/S0148296310001657
Sandelowski, M. (1986). The problem of rigor in qualitative research. Advances in Nursing Science, 8(3), 27-37.
Stake, R. E. (1995). The art of case study research. Thousand Oaks, CA: Sage.
Stangler, D. (March 2010). High-Growth firms and the future of the American economy. Kauffman Foundation. Retrieved from http://www.kauffman.org/uploadedfiles/high-growth-firms-study.pdf
Small Business Administration (2007). State of Small Business. GPO.
Small Business Administration (2010). State of Small Business. GPO.
State of Small Business Report: Wave 2 of the Small Business Success Index. (2009). State of Small Business Report. Retrieved from http://www.networksolutions.com/smallbusiness/wp-content/files/SBSIwave2.pdf.
Thomas, G.S. (2012). Recession claimed 170,000 small businesses in two years. The Business Journals. Retrieved August 12, 2012 at http://www.bizjournals.com/bizjournals/on-numbers/scott-thomas/2012/07/recession-claimed-170000-small.html
Thomas, G.S. (2012). Recession caused declines in number of businesses in 93% of US markets. The Business Journals. Retrieved August 12, 2012 at http://www.bizjournals.com/bizjournals/on-numbers/scott-thomas/2011/11/recession-caused-93-of-markets-to.html?s=print&appSession=789110327612187
Thompson, E., Walstad, W. (2012). State of Entrepreneurship Index Report. Business in Nebraska: UNL Bureau of Business research, 67 (704). Retrieved October 10, 2012 at http://bbr.unl.edu/documents/September_2012_BIN.pdf.
Tracy, S. J. (2010). Qualitative quality: Eight “Big-Tent” criteria for excellent qualitative research. Qualitative Inquiry, 16 (10) 837-851.
Unites States Census Bureau State Report. (n.d.) Retrieved October 1, 2012, from http://quickfacts.census.gov/qfd/states/15000.html

The Journal of Business Leadership
56
Womack, J.P., Jones, D.T., & Ross, D. (1991). The machine that changed the world: The story fo Lean production. New York: Harper Collins.
Yin, R.K. (1981). The case study as a serious research strategy. Science Communication 3, 97-114.
Yin, R.K. (1992). The case study method as a tool for doing evaluation. Current Sociology 40 (121). Retrieved from http://sagepublications.com
Yin, R.K. (2003). Case study research: Design and methods (3rd ed). Thousand Oaks, CA: Sage.
Young, D. (2008). Growth in Hawai‘i's Economy Slows. Department of Business Economic Development & Tourism (DBEDT). Retrieved at http://hawaii.gov/dbedt/main/news_releases/2008/news-release-0837/view?searchterm=gdp 2009
The Journal of Business Leadership
57
Water Rights Arrangements in Australia and Colorado:
A Comparison Focused on Possible Lessons
from the Australian Water Reform Program
Elizabeth McVicker
Metropolitan State University of Denver
ABSTRACT
The system of defining, monitoring and enforcing the right to use water is of critical importance in all regions of the world, but especially in areas like Australia and the southwestern United States where rainfall is low. Water law and water rights administration play pivotal roles in facilitating the efficient use of water. This paper examines legal frameworks of Australia and Colorado water allocation law, as well as government involvement in water resource management, environmental protection mechanisms, water rights administration and the criteria for efficient water rights uses, and asks what lessons can be learned from Australia’s new water reform program.
INTRODUCITON
The system of defining, monitoring and enforcing the right to use water is of critical
importance in all regions of the world, but especially in areas like Australia and the southwestern
United States where rainfall is low. Water law and water rights administration play pivotal roles
in facilitating the efficient use of water. Water is also an important part of a region’s economic
welfare — as in Australia, where irrigated agriculture constitutes one-fourth of the value of the
country’s total agricultural production, and in Colorado, where 86% of the state’s entire water
resources are devoted to agricultural use. But in both the southwestern United States and in
Australia, the current rate of water use in some of the main river basins is not commercially or
environmentally sustainable.
Australia and the American Southwest have similar climates and similar land uses.
Likewise, their complex water rights systems, both in the legal and the administrative arenas,
have similarities — but also some differences. An understanding of how these systems compare
will assist stakeholders in making difficult decisions arising from climate change and eras of
severe drought. This paper will examine legal frameworks of Australia and Colorado as well as
government involvement in water resource management, environmental protection mechanisms,
The Journal of Business Leadership
58
water rights administration and the criteria for efficient water rights uses and administration.
The right to use and control water is vested in the government in both jurisdictions, although
individual right-holders also can acquire a right to use an amount of water at a certain place and
time for their own benefit, albeit under different legal systems with different consequences.
Australia has effectively implemented changes in trading water and water rights as part of
its overall reform of legal and administrative systems as it reacted to its worst drought and fires
in recent history. This paper will consider how market efficiency can be improved, and if there
are lessons that can be learned from Australia’s embrace of competition and markets as its new
paradigm for water management. Australia has conducted multiple studies to investigate the
impact of its water reform program and how it can rectify some of the environmental problems
caused by the recent reforms. This paper will consider if and how these reforms could be
implemented in Colorado and the Colorado River Basin in the southwestern United States.
Climate Change and Drought: From New South Wales to Colorado
Australia’s “Big Dry” refers to an extended drought, from 2000 until 2010. The drought was
unprecedented; nothing like it had ever occurred on the continent. The largest river basin in
Australia, the Murray-Darling, experienced 40-50% reductions in runoff and the river ceased to
flow at its mouth. In 2009, fires erupted over parts of Australia that claimed 175 lives.
Temperatures reached 115 degrees Fahrenheit in Melbourne and 2,000-mile dust storms blew
across the lands. Farmers had nowhere to turn and many took their own lives (Udall, B, 2010).
Although it has eased somewhat, the drought continues; in 2012 and 2013, median rainfall from
South Australia to Central Australia was 60-70% below normal (Australian Bureau of
Meteorology).
Similarly, the southwestern states of the United States have experienced devastating droughts
in the last decade. In Colorado, 2002 was the driest year in recorded history. The Hayman fire
that year, the largest ever in the state’s history, burned 140,000 acres, destroyed more than 600
homes and left the Denver water supply system vulnerable (Eichenseher, T., 2012). Record heat
and severe drought conditions caused six major fires to surge through the state in the summer of
2012, burning more than 100,000 acres and hundreds of homes. The diminishing precipitation in

The Journal of Business Leadership
59
the Colorado River Basin affects not only Colorado but also citizens in the other six states that
depend upon the river — California, Nevada, Arizona, New Mexico, Wyoming and Utah (US
Drought Portal).
A theory first articulated in the 18th century by George Hadley, an English physicist and
meteorologist, described the trade winds and the associated (north-south) circulation pattern of
air near the equator that explains the shared drought conditions in the southwestern United States
and Australia (Udall, B., 2010). The ongoing effects of climate change increase the impact of
the Hadley Cells 101 theory such that the long-term meteorological forecast for both Australia
and Colorado is one of prolonged drought (Udall, B., 2010). Illustrative of this theory are studies
conducted by the Colorado Department of Water Resources that predict a water supply gap of
600,000 to 800,000 acre-feet (the amount of water needed to support a household of four for one
year) of additional water to meet growing municipal and industrial needs by the year 2050, when
the state’s population is expected to have doubled (Colorado Water Conservation Board). The
Commonwealth Scientific and Industrial Organization (CSIRO), an Australian government
agency, predicts that climate change is likely to reduce the Murray-Darling River’s flow by as
much as 5% in 20 years and 15% in 50 years. CSIRO cites a worst-case scenario of 20% less
water in 20 years and 50% in 50 years (CSIRO, 2013). Indeed, inflows to the Murray-Darling
have fallen to less than half of their long-term average over the past six years (CSIRO, 2013).
Water management is wise to proceed on the assumption that low flows are here to stay.
The disputes among farmers, municipalities and distinct regions of both Australia and
Colorado can either continue to be exacerbated by the looming water shortage or the
stakeholders can work toward a sustainable future. To their credit, neither Australia nor Colorado
passively await the continued crises that accompany prolonged drought conditions and severe
water shortages. Both commenced actions years ago to change long-entrenched legal and
administrative systems and policies that control the allocation of their water resources. Australia
has been much bolder in embracing these political and legal changes in ways that could lend
direction for Colorado and other states in the American Southwest.

The Journal of Business Leadership
60
Historical Water Law and Administrative Systems: Riparian Law vs. the Doctrine of Prior
Appropriation
History sheds light on the possibilities for the future. The courage to change traditional,
predictable, entrenched habits and legal traditions can only come from a recognition of the value,
as well as the shortcomings, of existing systems and practices. Colorado turned away from
traditional riparian doctrine in the mid-19th century, and Australia is taking bold steps to reform
its water laws and administration in the 21st century. A look back provides context for an
analysis of reform.
Australia and Riparian Water Rights
Riparian water rights, a system for allocating water based on ownership of land adjacent
to waterways—lakes, rivers and streams—have their origin in English common law and thus
exist in jurisdictions with a common-law heritage, such as Australia, Canada and the eastern
United States. The word “riparian” comes from the Latin word meaning “along the river,” and in
most states east of the 100th meridian—which runs along the western border of Kansas—as well
as in Australia, the riparian doctrine rules, just as it does in England, from which it was imported.
The general characteristics of the riparian doctrine of English common law were adopted in the
eastern United States because the humid climate and annual precipitation in these areas—above
30 inches, as opposed to Colorado’s annual precipitation of 12-17 inches—are similar to that in
Western Europe. In the Australian colonies, the riparian doctrine did not meet with resistance
because the primary economic activity was sheep grazing, which depended on surface water
sources. The British Crown, which owned all of the land, gave licenses for new settlers to use the
land and have access to the riparian lands along rivers and streams. The Crown also kept its
codes firmly in place, not allowing room for change via common law; indeed, between 1850 and
1870, only five cases came in front of the New South Wales judiciary, and all were resolved in
favor of maintaining the riparian system (Harris, 2007).
The riparian doctrine provided the framework for water law throughout the Roman Empire.
It stated that the water in a stream belonged to the public for fishing and navigation and could not
be controlled by individuals. The owner of property along the stream (a riparian landowner),
however, did have the right to make de minimus (reasonable) use of the water (a unsatisfactory
The Journal of Business Leadership
61
right) for milling, domestic and agricultural uses. These uses, however, could not injure others
who used the stream for navigation or fishing. The riparian landowner had to return diverted
water back to the stream unchanged in quantity and quality:
The public use of the banks of a river is a part of the law of nations, just as is that of the
river itself. All persons therefore are as much at liberty to bring their vessels to the bank,
to fasten ropes to the trees growing there, and to place any part of their cargo there, as to
navigate the river itself. But the banks of the river are the property of those whose land
they adjoin; and consequently the trees growing on them are also the property of the same
persons.” (Justinian Code, A.D. 533)
The Justinian Code of Roman law, along with Teutonic law, the Napoleonic Code and
English common law, guided decisions in the development of case law. The characteristics of the
riparian doctrine include the following (Cech, T., Jones, P.A., 2009):
1. Riparian rights are of equal priority.
2. Generally, the right to water is not quantified, but rather extends to the amount of water
that can be reasonably and beneficially used on the riparian parcel.
3. Riparian rights are correlative—during times of water shortage, the riparian landowners
share in any shortages.
4. Water may be used only on that portion of the riparian land parcel that is within the
watershed of the water source.
5. The riparian right does not extend to seasonal storage of water.
6. The riparian rights remain with the land when the land is sold.
7. When riparian lands are subdivided, parcels that are severed from the adjacent water
source lose their riparian rights unless the rights are reserved.
8. A riparian right is not lost by non-use.
New South Wales (NSW), Australia’s most populous state, located on the eastern coast of the
continent, provides a clear context to illustrate Australia’s historical development of water rights
laws. NSW inherited the common law of riparian rights by virtue of the Australian Courts Act
(1828), which established the date for the introduction of British common law, including riparian

The Journal of Business Leadership
62
rights, to the colony as July 25, 1828 (Harris, 2007). After that date, English court decisions did
not bind colonial courts, and thus NSW courts could adopt, adapt or ignore any or all aspects of
British precedent established after 1828 that might not be suitable to colonial conditions (Harris,
2007). Then as now, water scarcity in NSW was a condition to which new settlers, ranchers and
growing cities had to adjust. The NSW judiciary, therefore, had an opportunity to introduce a
different kind of legal system for the allocation of water resources. Given the aridity of the
lands, the NSW courts could have applied and adopted the prior appropriation doctrine that was
formalized in the American West after the gold rush in California in 1849, and was codified in
the Colorado Territorial Constitution and subsequently in the Colorado State Constitution in
1865.
The prior appropriation doctrine was enacted to facilitate the entrepreneurial activity of gold
mining, which could not have been sustained under the riparian doctrine. The NSW courts, on
the other hand, affirmed the riparian doctrine, and in so doing ignored one of the more flexible
responses to maximizing capital investments in an arid land (Harris, 2007). Instead, the historical
dependence on grazing—a non-capital intensive industry that can co-exist with correlative
rights—endured and was the only industry that could be efficient under the riparian doctrine.
Times change, however, and a variety of factors – from burgeoning metropolitan areas to tourism
to the emergence of viticulture and other lucrative industries (not to mention the historic, 10-year
drought)—presented Australian leaders with major political and legal challenges with regard to
water.
Colorado and the Prior Appropriation Doctrine
Colorado water law is a repudiation of riparian law, grounded in the right of prior
appropriation, constitutionally guaranteed by sections 5 and 6 of article XVI of the Constitution,
which establish and protect the right of any person or entity to appropriate the waters of the state
and put them to beneficial use. Those sections provide that:
“The water of every natural stream, not heretofore appropriated, within the state of
Colorado, is hereby declared to be the property of the public, and the same is dedicated to
the use of the people of the state, subject to appropriation as hereinafter provided….
The right to divert the unappropriated waters of any natural stream to beneficial uses shall
never be denied (Colorado Constitution, article VI).

The Journal of Business Leadership
63
Under the Colorado doctrine of prior appropriation, the person who first diverts water and puts it
to beneficial use has a right superior to any other person who subsequently appropriates water
from the same source. An appropriative water right is considered to be a “most valuable
property right” based on the owner’s right to use a certain amount of water, subject only to the
amount of water physically available for appropriation, and must satisfy senior priorities (Navajo
Dev. Co., Inc. v. Sanderson).
The right to appropriate water in Colorado is distinct from any ownership right in the
land through which the water flows (Cech, Jones, 2007). Unlike under the riparian doctrine, the
value of a water right in Colorado does not depend, in any way, on ownership of land next to or
beneath a waterway. In Colorado, the value of a water right is the priority to use a certain amount
of water from a specified source, such as a river or a lake.
Imagine the gold and silver miners in 1859 who depended on running water as an
essential element of their prospecting. Mining claims were often located on land away from
streams; the nature of the mining business hence depended on diverting water from a stream and
delivering it to those claims. The riparian principle of proximity was not suited to the arid
Western states and the new mining boom. Sharing water in the stream would not have worked
either, as a miner needed to depend on a specific flow of water to make his sluice work properly.
If flows in the stream were inadequate to supply multiple mining claims, it made no sense to
share the limited flows; sharing water, as in the riparian system, would give each miner a
“reasonable” amount of water, but not enough to operate multiple sluice boxes. It made more
sense, then, that one miner—the one who was the first to claim the right to the water for his
mining purposes—should carry on his operations, even if all others had to cease their operations
as a result of not having enough water.
Colorado, and other western states such as California, thus developed a new doctrine to
replace the riparian doctrine. The guiding principles of the prior appropriation doctrine are based
on a usufructory right. To establish a water right, a party had to divert the water and apply it to a
beneficial use. No person could “own” the stream or water in it, but he could develop a right to
use the water for a beneficial purpose. The earliest users of the water gained a right to use it—to
The Journal of Business Leadership
64
the exclusion of others—during times of shortage: “first in time, first in right.” On any river or
stream, users knew the order in which water diversions were developed. If there was not enough
water in the stream to satisfy all users, later users (those with “junior” water rights) had to stop
diverting water so the earlier users (those with “senior” rights) could divert all the water to which
they were entitled (Cech, Jones, 2007). Under the prior appropriation doctrine, water could be
removed from a stream and used in locations distant from the stream; ownership of riparian lands
was not a condition precedent to the use of water flowing in the stream. And finally, once a water
right had been established, the right to use the water could be sold to third parties, and the party
purchasing the water right also purchased the priority of the user from which he is purchasing the
right. So a miner who purchased a very senior water right had the right to use the water in a new
mining location, but had the same priority date that attached to the water right from the first
claim.
Water rights owners in Colorado, therefore, have a vested interest in their property right and
are hostile to the idea of government interference, except, of course, when their property right
has no value because there is no water. Farmers depend on government money to build large
reservoirs and other water infrastructure that can help assuage the affects of a long-term drought.
Municipalities and industries, which also are water rights holders, likewise look to states and the
federal government for assistance in finding ways to meet the growing gap between water supply
and water demand. Neither the pure prior appropriation doctrine developed in the mid-19th
century nor the pure riparian doctrine imported from England can solve the problems presented
in the increasing arid climate of the 21st century.
Colorado River Compact of 1922
In addition to the private property rights assigned to the decreed use of a water right,
Colorado also recognizes its obligations described in interstate compacts, the first of which was
the Colorado River Compact, a 1922 agreement among seven states in the basin of the Colorado
River that governs the allocation of rights to the river’s water. The Compact, by its very nature,
acknowledges the dependence on the Colorado River of all states and all citizens in the river
basin, regardless of contractual claims, property claims or jurisdictional claims.
Development was the prime concern of the Colorado River Compact when it was signed in
1922; unfortunately, environmental issues weren’t taken into consideration. Using and reusing
The Journal of Business Leadership
65
the river water as well as frequent damming results in an unfavorable environment for native fish
species. Dams block fish passage, reduce silt deposition and change water temperatures, all
negatively impacting the natural ecosystem. High water usage has also caused the river delta,
located in Mexico, to significantly deteriorate. Once a lush and green area from the high amounts
of silt deposit, the vibrant ecosystem has now all but disappeared. To begin to reduce the
damage, more water will need to be appropriated to Mexico.
The Australian governance of its largest river basin, the Murray-Darling, is strikingly similar;
and just as Colorado could have offered lessons for Australia in the 19th century, Australia now
is moving from its tragic reality to the hope of a better future, and can show the Colorado River
Basin stakeholders an avenue for a bold move forward.
Australian Water Reform Program
Australia’s longest river system, the Murray-Darling, drains a basin the size of France and
Spain combined, but it no longer carries enough water to reach the sea. Although it still hosts
anglers in its blue waters, pleasure boats that cruise its sandbanks toward the southern ocean and
beach strollers along its banks, its ability to run depends on the continual action of a mechanical
dredging vessel that runs around the clock to prevent the river mouth from silting up. After more
than a decade of drought, Australia’s central government continues to argue that the only hope of
restoring the river to health is a complete reformation of how it is managed. Forty percent of
Australia’s agriculture comes from the Murray-Darling basin but its vines and fruit trees are
dying and the economic consequences have been alarming (The Big Dry, 2007). Due to the
balkanization of Australia’s states and territories, negotiations over the federal constitution
dealing with water rights were so divided that the water of the river was over-exploited, resulting
in reduced flows and a threat to the security and quality of water supplies. States were allowing
irrigators to use too much water; the mouth of the river was silting up, the water was becoming
salty due to increased runoff from saline soils churned up by agriculture, the number of
indigenous fish was falling because floods that induce them to spawn were rarer and toxic algae
flourished in the warm, sluggish waters (The Big Dry, 2012). People worried that taps would run
dry and farmers were alarmed about the uncertain security and quality of their water supplies
(The Big Dry, 2012).
The Journal of Business Leadership
66
In 1994, the Coalition of Australian Governments (COAG) released its Water Reform
Framework, after meeting to discuss policy related to the future of water resources on the
continent (Council of Australian Governments’ Water Reform Framework, 1994). Since then,
Australia has enacted multiple initiatives and plans — with the approval of the states and the
Australian parliament — to attempt to overhaul the management of the continent’s rivers and
water resources (Langford, J., Briscoe, J. 2011).
Through such reforms — including the establishment of a National Water Commission, the
simplification of water rights in the legal system, the creation of water markets and the infusion
of more than $13 billion Australian dollars (AUD) into the initiatives (Udall, B., 2010) — the
central Australian government is urging the four states through which the Murray-Darling flows
to hand their authority over the river to the federal government (The Big Dry, 2012). Planning is
underway for the construction of large desalination plants in every major city, water recycling,
interbasin transfers, rainwater harvesting and investments in agricultural infrastructure to the
tune of $2 billion AUD (Udall, B., 2010). Other elements of the Australian water reform
program are a strong focus on conservation aimed at keeping outdoor watering to a minimum as
well as investing more than $3 billion AUD to purchase water from private owners of allocated
water sources, all to be held by the federal government (Udall, B., 2010).
Australia responded to its drought crisis with a management plan that could serve as a model
for management of the large, exploited rivers of the world, such as the Colorado River in the
southwestern United States. Among other things, three states (New South Wales, Victoria and
South Australia) agreed to: cap the amount of water taken from the river; maintain transparent
public records of water-use rights; work to reduce salinity and increase flows of water to sustain
fish and waterways, including the construction of fish ladders around dams and weirs and the
release of extra water into important breeding grounds, spawning a recovery in native species;
and spend more than $650 million AUD to boost environmental flows, mainly by stemming
losses from irrigation, leaving more water in the river (The Big Dry, 2012).
The states and the federal commonwealth agreed to the creation of the Murray-Darling Basin
Commission, a management body comprising the commonwealth and the multiple riparian
states, all of which would have equal representation, and with all decisions to be by consensus

The Journal of Business Leadership
67
(Young, D., 2010). The commonwealth representatives agreed to a set of principles by which
water should be managed throughout the country. These included a halt to irrigation subsidies; a
requirement that farmers would pay for maintenance of dams and channels; an agreement on the
level of water released for non-consumptive uses, as discussed above; and, of keen interest, the
use of water markets and trades for all water, both within and between states (Young, D., 2010).
Two basic sorts of transactions exist: the sale of part of a farmer’s water allocation for the
year, or a permanent transfer. Even as far back as 2003, temporary exchanges between farmers in
the same state accounted for one-tenth of all water used for agriculture, matching the cumulative
amount of water that has changed hands permanently within the same state.
The trade in water has met with success. One government assessment of a pilot program for
interstate trade found that such shifts prompted large investments in irrigation and food-
processing and that water trading helps reduce damage from droughts (The Big Dry, 2007). For
example, struggling dairy and rice farmers in New South Wales and Victoria have sold water to
the booming orchards and vineyards of South Australia.
Australia’s six biggest water reform policies can be further summarized as follows (Murray,
J., 2010):
1. Water for the Future program: the declared objective of this program, according to the
Federal Department of the Environment, Water, Heritage and the Arts, is to prepare
Australia for a future with less water by addressing climate change, promoting the wise
use of water, securing water supplies and supporting healthy rivers.
2. Private irrigation infrastructure program: through a government buy-back of water
entitlements, more efficient and productive use of water will be realized with the
assistance of major federal funding over a 10-year period.
3. On-farm irrigation efficiency program: improved efficiency and productivity of on-farm
water use and management will be realized through the modernization of irrigation
equipment and irrigation projects.
4. Non-urban water metering: non-urban water metering will be standardized nationally in
order to have more accurate measurements of water usage from both rivers and
The Journal of Business Leadership
68
groundwater systems, and identify possible efficiency improvements to minimize water
loss through delivery systems.
5. Menindee Lakes project: the reduction of evaporation of water in these lakes will
improve water efficiency and secure a major water supply (Broken Hill) while protecting
the local environment. This project will allow for surveys of groundwater resources and
aquifer storage options.
6. Water entitlement buybacks: the federal government uses the slogan “Restoring the
Balance in the Basins” for its promotion to buy back water entitlements from willing
sellers. The amount of water entitlements far overreaches the actual water in many of
Australia’s river systems, and especially in the Murray-Darling. As a result of these buy-
backs, water can remain in the rivers, enhancing the chances of their long-term survival. .
A number of problems persist, however. The reforms do not address groundwater, only
surface water in rivers. Farmers in some states can drill wells, establish plantations of trees that
use water that would otherwise reach the river and build dams on small streams that trap runoff.
(The drought undoubtedly encourages more dam-building that is out of compliance with
regulations.) The rules in each state to regulate such groundwater use or dams vary greatly and
enforcement is difficult. Each state has embraced water reforms differently and each continues to
promote irrigation rights along its own stretch of the river unequally — although negotiations on
a fair cap are ongoing. Still, a state such as New South Wales frequently exceeds its caps and
farmers have not yet adjusted to planting different crops. (The Big Dry, 2007).
The federal government is urging the states to surrender their powers over the basin to the
commonwealth in order for the government to develop a true picture of the use of water from
wells and dams; to identify new, sustainable caps on water usage; and to help farmers meet the
new restrictions by investing in more efficient irrigation or to allow the government to buy their
water rights. The commonwealth is backing its plea with big bucks, offering up to $10 billion
AUD for some of these plans. The trust in the central government’s ability to deliver, of course,
remains constant (The Big Dry, 2007).
The Journal of Business Leadership
69
Colorado Courage: Present and Future Possibilities for Water Reform
Top thinkers and researchers in the United States have looked to Australia for lessons for
Colorado and the Colorado River Basin, paying particular attention to the several remarkable
elements of the Australia water reform program (Udall, B., 2010):
1. It utilizes markets to move water to maximize economic return.
2. It puts in place independent bodies for water oversight, such as the National Water
Commission.
3. It advocates for the country to live within its limits; to this end, the central government is
investing in purchasing water from willing sellers in order to put water back into river
systems.
4. It finances the construction of a desalination plant for every major city.
5. It provides funding for water studies at levels unimagined in this country — upwards of
$200 billion AUD.
6. It has reached out to economists, scientists, citizens and other groups — beyond just
engineers and attorneys —to come forward to help design a new system.
7. It has moved forward to codify new statutory water management plans, new legislation, new
departments of water policy and procedures, and new metering programs that would apply on
a basin-wide and country-wide basis.
In Colorado, several proactive steps have been taken that parallel those taken in Australia.
For example, the state legislature in 2005 approved the Colorado Water for the 21st Century Act
Basin Roundtable Process, which envisions the negotiation of interbasin compacts on equitable
division of the state’s water, with a goal of replacing lengthy legal disputes over water allocation
with a cooperative and collaborative problem-solving process (IBCC, 2013).
In addition, the Colorado River Cooperative Agreement — a historic pact signed in spring
2012 by Denver Water, the primary provider for the state’s population, along with 40 other water
providers, local governments and even the ski industry—focuses on providing proper balance

The Journal of Business Leadership
70
among competing interests, a shared vision for better river health, reliable supply for all water
users, and a future of cooperation, not conflict (Colorado River Cooperative Agreement, Denver
Water, 2013). The visionary agreement provides for:
1. Resolution of longstanding conflicts and a holistic approach to resolving Colorado
water disputes
2. Cooperative, long-term efforts to improve the health of the Colorado River mainstem
and its tributaries
3. Additional water supply for those who live, work and play on the Western Slope and
for customers of Denver Water.
The agreement has the potential to yield benefits similar to those produced by the
Australian water reforms — ushering in a new era of cooperation, providing protections for river
flows and water quality along the entire reach of the mainstem of the Colorado River, and
improving the health of Colorado’s rivers and streams by dedicating funds to pay for water
treatment and aquatic habitat improvements in the Colorado River Basin (Colorado River
Cooperative Agreement, Denver Water, 2013).
Another potentially far-reaching pact signed in 2012, the U.S.-Mexico Colorado River
Agreement, provides for a series of joint cooperative actions between the United States and
Mexico aimed at enhancing water infrastructure and promoting sharing, storing and conserving
water as needed during both shortages and surpluses (Department of the Interior, 2012).
Possible Lessons from Australia for Colorado
Despite the promising steps that Colorado has taken in the recent past, its future depends
on brave leaps forward. Australia has advocated for a government-owned system that combines
private/public ownership and cooperation. Engineers who have worked in administering
Colorado River Basin and South Platte Basin water over the last half-century have proposed
establishing a single water power authority — operating outside of the prior appropriation
system — that could increase yields in the basin by 150%, based on the management of the
The Journal of Business Leadership
71
system as one large water district, as Australia is attempting to accomplish with the Murray-
Darling system (Spann, S., 2012).
All of the water could be government-owned, as in the Australian model, with the intent
of benefiting each water user in the basins. Lease-backs of agriculture water instead of “buy and
dry” could become commonplace — again, mimicking the Australian regime. Timing of share
releases, based on current mutual ditch operations coupled with the Murray-Darling protocol,
could lead to plentiful water supplies even in times of water scarcity. The Colorado River system
could be managed from the top of the Colorado Rockies to the Gulf of Mexico or the Gulf of
Cortez as one water basin, realizing the needs, obligations and assets of all stakeholders. Indeed,
the lessons of the Australian water reform program have much to offer for the southwestern river
basins of the United States.
REFERENCES
Australia Bureau of Meteorology, Drought Resource, http://www.bom.gov.au/climate/drought/
Australia's water shortage, The Big Dry, April 26, 2007, Retrieved February 10, 2013, from http://www.economist.com/node/9071007,
Carswell, C. (2011, October 10). Lessons for the Colorado River from drought-stricken Australia. High Country News, Retrieved February 10, 2013, from http://www.hcn.org/articles/lessons-for-the-colorado-river-from-drought-stricken-australia.
Cech, T., Jones, P.A. (2009), Colorado Water Law for Non-Lawyers. University of Colorado Press.
Colorado Constitution, article XVI, sections 5 & 6.
Colorado Wildfires 2012 (2012, July), Retrieved October 13, 2012, from http://www.huffingtonpost.com/2012/06/27/colorado-wildfires-2012-w_n_1630861.html.
Commonwealth Scientific and Industrial Research Organization Report on Climate Change (2013). Retrieved February 11, 2013, from http://www.climatechangeinaustralia.gov.au/.
Council of Australian Governments’ Water Reform Framework (1994). Retrieved October 13, 2012, from, http://www.environment.gov.au/water/publications/action/policyframework.html.

The Journal of Business Leadership
72
Davis, P. N. (1971). Australian Irrigation Law and Administration, Volume One, Thesis Submitted as part of the requirements for the Degree of Doctor of Juridical Science, University of Wisconsin, USA.
Doesken, N., Pielke, R. (2002). 2002 Drought History in Colorado—A brief summary. Retrieved October 13, 2012, from http://ccc.atmos.colostate.edu/presentations/2002DroughtHistory.pdf.
Eichenseher, T. (2012, July 3). Colorado Wildfires Threaten Water Supply. Retrieved October 13, 2012, from http://news.nationalgeographic.com/news/2012/07/120703/colorado-wildfires-waldo-high-park-hayman-threaten-water-supplies.
Harris, E. (2007). The persistence of riparian rights in colonial Australia: a theoretical contradiction? Monash University, Department of Economics, Retrieved February 11, 2013, from, http://www.isnie.org/assets/files/papers2007/harris.pdf
Historic Colorado River Water Agreement Ceremony (2012, November), Retrieved February 11, 2013, from http://www.doi.gov/news/pressreleases/secretary-salazar-joins-us-and-mexico-delegations-for-historic-colorado-river-water-agreement-ceremony.cfm.
Interbasin Compact Committees, Colorado Water for the 21st Century Act (2013), Retrieved October 13, 2012, from, http://cwcb.state.co.us/about-us/about-the-ibcc-brts/Pages/main.aspx/Templates/Home.aspx
Langford, J., Briscoe, J. (2011). The Australian Water Project (Vol. 1) Crisis and opportunity: Lessons of Australian water reform. Australian Water Project. CEDA.
Laurer, T.E. (1963). Common Law Background of the Riparian Doctrine. Missouri Law Review (28). Municipal and Industrial Water Supply and Demand Gap (2013). Retrieved February 11, 2013, from http://cwcb.state.co.us/water-management/water-supply-planning/Pages/TheWaterSupplyGap.aspx
Murray, J. (2010). Australia’s 6 Biggest Water Reform Policies. Retrieved October 13, 2012, from http://ezinearticles.com/?Australias-6-Biggest-Water-Reform-Policies&id=5323250.
National Integrated Drought Information System Drought Portal (2012). Retrieved October 13, 2012, from http://www.drought.gov/portal/server.pt/community/what_is_nidis/207.
NIDIS Weekly Climate, Water & Drought Assessment Survey of Colorado (2013). Retrieved February 10, 2013, from http://ccc.atmos.colostate.edu/pdfs/NIDIS_weekly_20130205.pdf.
Navajo Dev. Co., Inc. v. Sanderson, 665 P.2d 1374 (Colo. 1982)
Productivity Commission (2003). Water Rights Arrangements in Australia and Overseas, Commission Research Paper, Productivity Commission, Melbourne.
The Journal of Business Leadership
73
Sanders, T.C., (1970). The Institutes of Justinian with English Introduction. Westport, Conn. Greenwood.
Spann, S. (2012). Telephone interview. Denver, CO.
Udall, B. (2008). Overview of Climate Change Impacts and Implications for the U.S. West: The Perfect Drought. Retrieved October 13, 2012, from http://uscid.us/08gcc/Udall.PDF.
Udall, B. (2010, April). The Aussie Big Dry: Lessons from Australia for the Colorado River Basin. Retrieved October 13, 2012, from http://crc.nv.gov/docs/iolll_0410/Bradley%20Udall.pdf.
Udall, B. (2011). Twenty Years of Water Reform in Australia: Any Lessons for the American West? Retrieved October 13, 2012, from, http://wwa.colorado.edu/publications/presentations/.
Western Australian Government Response to A Blueprint for Water Reform in Western Australia (2007). Retrieved October 13, 2012, from, http://www.water.wa.gov.au/PublicationStore/first/73207.pdf.
Young, D., (2010). Environmental Effectiveness and Economic Efficiency of Water Use in Agriculture: The Experience of and Lessons from the Australian Water Reform Programme. Organization for Economic Co-Operation and Development (OECD). Retrieved on October 13, 2012, from www.oecd.org/water.
The Journal of Business Leadership
74
The Regulatory Trade-Off in Real & Financial Markets
Bodo Herzog
ESB Business School, Reutlingen University, Germany
ABSTRACT
It remains undeniable that the regulatory framework in place prior to the financial crisis is built on a flawed system. But does this automatically suggest that more regulation is better? In general, we have to distinguish between the quantity and quality of rules and in particular, the enforcement. The last issue does not necessarily mean we need more regulation – sometimes a better enforcement is enough. Still there remains the question about the degree of regulation. This paper builds a new theory on the optimal degree of the regulatory trade-off. We elucidate the optimal degree of efficacy in financial regulation and compare it with the optimal degree in goods market regulation. We prove that regulation does not follow a simple economic trade-off by costs and benefits in financial markets. In finance, the regulatory trade-off is a boundary solution, i.e. the efficient solution is either comprehensive or no regulation at all. Either way you prefer, financial markets must be regulated differently in comparison to the real economy.
INTRODUCTION
Many experts argue that the deficiencies of the regulatory system prior to the financial
crisis caused the recent mess. In fact, one problem is the mere focus on microprudential
regulation in banking and finance (Brunnermaier et al. 2009; French et al. 2010). The
microprudential approach is just aimed at preventing the failure of individual financial
institutions. Thus, it has a partial equilibrium view without taking into account network effects
and interdependencies over time. Consequently, to mitigate the systemic risks we have to add a
macroprudential approach that recognizes the general equilibrium effects, i.e. feedback loops,
interdependencies, bubbles and so on (Bernanke 2008). Interestingly, despite the on-going debate
about the Dodd-Frank Act in the US, there is no regulatory theory which indicates the optimal
degree of regulation. We provide a simple theory that identifies the regulatory trade-off in
different fields of market environments – real and financial markets. Subsequently, our model
closes a current gap in economics and has strong policy implications. But the new insights will
also help business leaders to prepare for the challenges ahead.
The Journal of Business Leadership
75
Putting together the existing insights from the literature on banking regulation and the
functioning of financial markets (Tirole 2011), we argue for a different approach to answer this
problem. We utilize an optimal control approach under specific constraints. Here, we model the
specific environments of real and financial markets and identify the differences. This new idea
allows us to analyse the regulatory trade-off and is in contrast to the standard approach by
Freixas and Gabillon (1999).
We find novel insights about what distinguishes regulation in real and financial markets.
First, the regulatory trade-off in the real economy and financial economy is different. While
regulation in the real economy follows more likely a typical cost and benefit analysis, regulation
in financial markets is rather different. In financial markets international regulation plays an
important role because financial assets are more mobile and regulatory arbitrage puts conflicting
incentives in place. Second, we show that international financial regulation has not only a
singular regulatory trade-off of balancing costs and benefits. It rather has a boundary solution,
i.e. either no international regulation or comprehensive regulation for all. Third, we find that the
regulatory trade-off in financial markets depends on the shadow price (effect on utility) for risky
assets and regulation costs. The higher the benefit from risky assets on utility in comparison to
the costs of regulation, the more likely no international regulation is the efficient solution. This
sounds astounding like a pure free-market or Hayekian view. However, on the contrary, it just
shows as long as all regulatory authorities do not agree on a level playing field in finance, it is
insufficient and unsuccessful. From a domestic point of view, an efficient or optimal
international regulatory framework in finance requires mutually agreed rules on the international
level. Only such a regulatory framework is able to consider the problem of systemic risks and
interdependencies.
The literature on banking regulation has a long tradition. There are different aspects
considered in this literature. The first and most important is the failure of financial institutions.
Dimond and Dybivd (1983) argue for a deposit insurance that could provide a solution to bank
runs. Another aspect in literature is solvency regulation and the implications of capital buffers
(Crouhy and Galai, 1986; Kim and Santomero, 1988). More in our interest is a small literature on
the question of who should be regulated. Laffont and Tirole (1986) argue that banks possess
better information regarding their own risks and returns and just regulators will never be
The Journal of Business Leadership
76
effective to regulate the dynamics of financial entities. However, we approach the existing
problem from a different angle, and thus get fresh answers to a current debate in politics and
business.
The rest of the paper is organized as follows. In section 2, we present the benchmark and
extended model and discuss the results. Section 3, concludes the paper.
The Model
Let us now develop a simple model that illustrates the main difference between the
regulatory trade-off in the financial and real market. In general, the basic trade-off in regulation
is due to the additional (transaction) costs of new rules which will reduce beneficial real or
financial investments. On the other hand regulation contains benefits because it ensures (real or
financial) market stability and mitigates institutional failures or a crisis. Next, we model this idea
in a rigorous analytical framework.
Let s(t) denote the stock of risky real or financial investments and l(t) the newly defined
regulatory safeguards or buffers. Both variables are dependent on time t. In financial markets it is
possible to imagine that s(t) is the stock of risky assets and l(t) the liquidity buffers. Furthermore,
in country i the benevolent regulator maximize the stability of real and financial markets given
the typical characteristics in the market environment. Suppose market stability is a scarce
resource in the economy. The relationship between the change of risky assets over time ds(t)/dt
and the safeguards l(t) gets
-�̇�(𝑡) = 𝑙(𝑡) (1)
Intuitively, the risky investments are a declining function of the regulatory requirements over
time. This reflects the regulatory trade-off: More regulation or safeguards l(t) imply higher costs
in terms of lower investments and thus a decline in investments over time -�̇�(𝑡). Hence, l(t)
produce either real or financial stability in markets and creates utility for the regulator. To
describe this idea analytically, we define a typical concave production function F(l(t)) where the
first derivative is positive F’(l(t)) > 0 and second derivative is negative F’’(l(t)) < 0.
However, the more regulation is in place the lower the investments in the economy. This
linkage implies less economic or financial growth and thus welfare costs. We model this by a
The Journal of Business Leadership
77
typical cost function Z(l(t)). The derivatives are as in standard economics: Z’(l(t)) > 0, and
Z’’(l(t)) > 0. Both functions are elements of the overall utility function U(F(l),Z(l)) of a
benevolent regulator in country i. Again, we suppose that the derivatives of the utility function is
as in standard economics: 𝑈(.)𝐹 > 0, 𝑈(.)𝑍 < 0, 𝑈(.)𝐹𝐹 < 0, 𝑈(.)𝑍𝑍 < 0, and 𝑈(.)𝐹𝑍 = 0. The first
derivatives demonstrate that marginal utility increases with more produced stability F(l(t)) and
decreases with higher costs Z(l(t)) due to new regulatory rules. The second derivatives indicate
that both functions have diminishing returns or costs of regulation.
Note that both functions inside the utility function are only dependent on l(t), i.e. the
regulatory safeguards. Thus, the primary control variable for the benevolent regulator in country
i is to find the optimal amount of regulatory safeguards or buffers l(t). Next, we solve the basic
model for real markets. We suppose that the benchmark model reflects the regulatory situation of
a real economy. On the contrary, financial markets are special because financial assets are highly
mobile and international financial regulation is still pretty diverse. Thus, regulatory arbitrage is a
specific problem in finance but not in the real economy. International trade in the real economy
is based on the mutual agreement of strict and rigorous product standards. This is the key
difference to finance. In financial markets the national safeguards l(t) behave differently –
sometimes even in contraction to rules in other countries – which gives incentives to regulatory
arbitrage. That means you move your financial assets to countries with less regulatory
requirements and safeguards to maximize your domestic profits. This simple difference between
real and financial markets may sound astonishing but it exactly reflects the current debate in
regulation. Today experts argue for more macropurdential regulation in finance (and not more
regulation in the real economy), i.e. taking into account the interdependencies, systemic risk, and
feedback effects in financial markets. Thus, the major difference between real and financial
markets is simply characterized by the issue of interdependencies which require both a level
playing field and regulation which accounts for those effects. Now, let us come back to the
regulatory problem in the real economy.
Suppose the benevolent regulatory in country i is maximizing utility by determining the
optimal time path of regulatory safeguards or buffers. In this case the regulator solves the
following problem
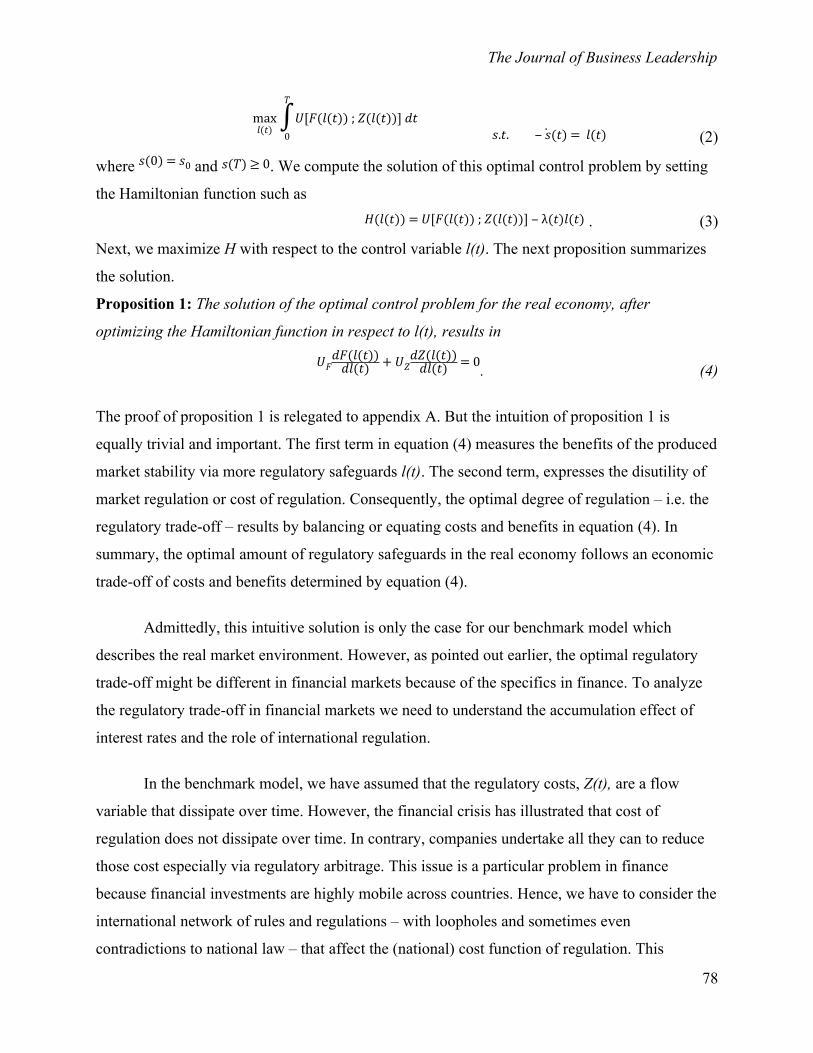
The Journal of Business Leadership
78
max𝑙(𝑡)
𝑇
∫0
𝑈[𝐹(𝑙(𝑡)) ; 𝑍(𝑙(𝑡))] 𝑑𝑡𝑠.𝑡. ‒ �̇�(𝑡) = 𝑙(𝑡) (2)
where 𝑠(0) = 𝑠0 and 𝑠(𝑇) ≥ 0. We compute the solution of this optimal control problem by setting
the Hamiltonian function such as𝐻(𝑙(𝑡)) = 𝑈[𝐹(𝑙(𝑡)) ; 𝑍(𝑙(𝑡))] ‒ λ(𝑡)𝑙(𝑡) . (3)
Next, we maximize H with respect to the control variable l(t). The next proposition summarizes
the solution.
Proposition 1: The solution of the optimal control problem for the real economy, after
optimizing the Hamiltonian function in respect to l(t), results in
𝑈𝐹𝑑𝐹(𝑙(𝑡))
𝑑𝑙(𝑡) + 𝑈𝑍𝑑𝑍(𝑙(𝑡))
𝑑𝑙(𝑡) = 0. (4)
The proof of proposition 1 is relegated to appendix A. But the intuition of proposition 1 is
equally trivial and important. The first term in equation (4) measures the benefits of the produced
market stability via more regulatory safeguards l(t). The second term, expresses the disutility of
market regulation or cost of regulation. Consequently, the optimal degree of regulation – i.e. the
regulatory trade-off – results by balancing or equating costs and benefits in equation (4). In
summary, the optimal amount of regulatory safeguards in the real economy follows an economic
trade-off of costs and benefits determined by equation (4).
Admittedly, this intuitive solution is only the case for our benchmark model which
describes the real market environment. However, as pointed out earlier, the optimal regulatory
trade-off might be different in financial markets because of the specifics in finance. To analyze
the regulatory trade-off in financial markets we need to understand the accumulation effect of
interest rates and the role of international regulation.
In the benchmark model, we have assumed that the regulatory costs, Z(t), are a flow
variable that dissipate over time. However, the financial crisis has illustrated that cost of
regulation does not dissipate over time. In contrary, companies undertake all they can to reduce
those cost especially via regulatory arbitrage. This issue is a particular problem in finance
because financial investments are highly mobile across countries. Hence, we have to consider the
international network of rules and regulations – with loopholes and sometimes even
contradictions to national law – that affect the (national) cost function of regulation. This

The Journal of Business Leadership
79
modelling takes into account that especially the accumulation of financial risks can only be
reduced by a consistent framework of international regulations. Suppose the following
relationship,�̇�(𝑙(𝑡)) = 𝑏𝑙(𝑡) ‒ 𝑐𝑎(𝑡) ‒ 𝑑𝑍(𝑡) (5)
where b,c > 0 and 0 < d < 1, and all parameters are constant coefficients. Intuitively, the change
of costs �̇�(𝑙(𝑡)) due to regulation depends on three terms. First, the national safeguards/rules l(t)
themselves. The higher the required safeguards, the higher the explicit and implicit costs due to
fewer money for investments s(t). Second, the consistency and amount of international regulation
a(t). A more consistent and sophisticated international structure of rules establishes a level
playing field and thus mitigates the costs of national regulation and regulatory arbitrage. Third, it
depends from the level of the cost function Z(t) too. Obviously, the potential increase of
regulatory costs over time should be less if the existing amount of safeguards and thus costs are
already high. To close the model, we take the variable a(t) – reflecting the international level of
regulation – as a further control variable into consideration such as�̇�(𝑡) =‒ 𝑎(𝑡) ‒ 𝑙(𝑡). (6)
Equation (6) states that higher national safeguards l(t) and higher international safeguards a(t)
reduce the growth of risky assets/investments over time. This is intuitive because the higher the
buffers a financial institution has to hold, the lower the amount of money for investments.
Consequently, the optimal control problem in financial markets for the benevolent regulatory in
country i results in
max𝑙(𝑡),𝑎(𝑡)
𝑇
∫0
𝑈[𝐹(𝑙(𝑡)) ; 𝑍(𝑙(𝑡),𝑎(𝑡),𝑍(𝑡))] 𝑑𝑡(7)
𝑠.𝑡. �̇�(𝑡) =‒ 𝑎(𝑡) ‒ 𝑙(𝑡)
�̇�(𝑙(𝑡)) = 𝑏𝑙(𝑡) ‒ 𝑐𝑎(𝑡) ‒ 𝑑𝑍(𝑡) where 𝑠(0) = 𝑠0, 𝑠(𝑇) ≥ 0, and 𝑍(0) = 𝑧0, 𝑍(𝑇) ≥ 0, and 0 ≤ 𝑎(𝑡) ≤ 𝐴. The last inequality captures the
international range of regulation which has an upper limit of A. This is a realistic assumption
because an agreement about international financial regulation is always limited by a
compromise, ̂𝑎(𝑡) ∈ [0,𝐴]. Achieving an international rule set is a sophisticated endeavour within
an international authority of conflicting interests across countries. This implies that international
regulation a(t) ranges always in this interval, i.e. no compromise and no common rules
(𝑎(𝑡) = 0), or all countries agree and choose the upper limit (𝑎(𝑡) = 𝐴), or something in between
The Journal of Business Leadership
80
the two extreme regimes, (𝑎(𝑡) = ̂𝑎(𝑡)). The Hamiltonian function for this problem – let me stress
that this is the optimal control problem for the financial sector – yields𝐻(𝑙𝑡,𝑎𝑡) = 𝑈[𝐹(𝑙𝑡);𝑍(𝑙𝑡,𝑎𝑡,𝑍(𝑡))] + λ𝑍(𝑡)[𝑏𝑙𝑡 ‒ 𝑐𝑎𝑡 ‒ 𝑑𝑍(𝑡)] ‒ λ𝑠(𝑡)[𝑙𝑡 + 𝑎𝑡] (8)
where the subscript of each costate variable λ𝑍 indicates the state variable associated with it and
the subscript t indicates time dependencies. The benevolent regulator in country i optimize the
Hamiltonian H with respect of l(t) and a(t). Note, that in this case we have to consider the Kuhn-
Tucker condition ∂𝐻/∂𝑙𝑡 ≤ 0, together with the complementary-slackness condition 𝑙(𝑡)(∂𝐻/∂𝑙𝑡) = 0. Both conditions show that we can rule out l(t) = 0, i.e. no national safeguards for
the financial sector is not a solution (Appendix B).
Theorem: The optimal choice of international regulation a(t) will never be in the interior of the
interval 𝑎(𝑡) ∈ (0,𝐴). The optimal choice of international regulation from the view of an
benevolent regulator in country i, gets a boundary solution with either a(t) = 0 or a(t) = A.
The proof is in appendix B. This Theorem provides an absolutely new insight into the
dilemma of financial regulation from a national point of view. The national regulatory system
who is maximizing the welfare of its citizens will never have an optimal solution in a financially
integrated and interdependent world because every weak compromise, ̂𝑎(𝑡), inside the interval is
not efficient. Intuitively, as long as one country x offers regulatory arbitrage every compromise
of course is ineffective. Hence, the firms in country i move assets and investments easily to
country x even this country is very small for instance an island. Even more surprising is the
implication that if all countries agree on a weak compromise, ̂𝑎(𝑡) < 𝐴, it’s not an optimal
solution. The reason is that international regulation in-between increase the cost of regulation
Z(l(t)) but does not produce sufficient (financial) stability F(l(t)). Consequently, only no
international regulation or regulation at the upper limit A are a necessary and sufficient solution
of the optimal control problem of the benevolent regulator in country i.
The final step is an in-depth analysis of the two boundary solutions a(t) = 0 or a(t) = A of
international regulation in financial markets. What determines both states? We are able to show
that the shadow price of risky assets (λ𝑠) as well as the shadow price of regulation (𝑏λ𝑍) are the
two distinguishing factors.
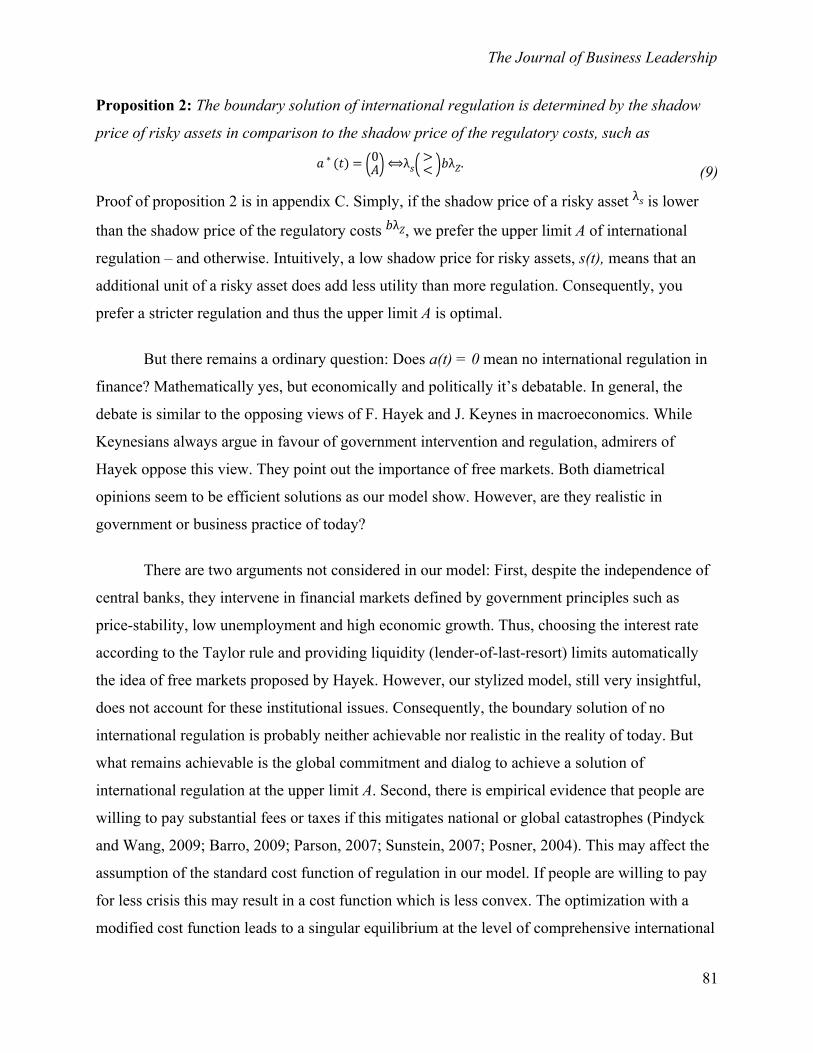
The Journal of Business Leadership
81
Proposition 2: The boundary solution of international regulation is determined by the shadow
price of risky assets in comparison to the shadow price of the regulatory costs, such as
𝑎 ∗ (𝑡) = (0𝐴) ⟺λ𝑠( >
< )𝑏λ𝑍. (9)
Proof of proposition 2 is in appendix C. Simply, if the shadow price of a risky asset λ𝑠 is lower
than the shadow price of the regulatory costs 𝑏λ𝑍, we prefer the upper limit A of international
regulation – and otherwise. Intuitively, a low shadow price for risky assets, s(t), means that an
additional unit of a risky asset does add less utility than more regulation. Consequently, you
prefer a stricter regulation and thus the upper limit A is optimal.
But there remains a ordinary question: Does a(t) = 0 mean no international regulation in
finance? Mathematically yes, but economically and politically it’s debatable. In general, the
debate is similar to the opposing views of F. Hayek and J. Keynes in macroeconomics. While
Keynesians always argue in favour of government intervention and regulation, admirers of
Hayek oppose this view. They point out the importance of free markets. Both diametrical
opinions seem to be efficient solutions as our model show. However, are they realistic in
government or business practice of today?
There are two arguments not considered in our model: First, despite the independence of
central banks, they intervene in financial markets defined by government principles such as
price-stability, low unemployment and high economic growth. Thus, choosing the interest rate
according to the Taylor rule and providing liquidity (lender-of-last-resort) limits automatically
the idea of free markets proposed by Hayek. However, our stylized model, still very insightful,
does not account for these institutional issues. Consequently, the boundary solution of no
international regulation is probably neither achievable nor realistic in the reality of today. But
what remains achievable is the global commitment and dialog to achieve a solution of
international regulation at the upper limit A. Second, there is empirical evidence that people are
willing to pay substantial fees or taxes if this mitigates national or global catastrophes (Pindyck
and Wang, 2009; Barro, 2009; Parson, 2007; Sunstein, 2007; Posner, 2004). This may affect the
assumption of the standard cost function of regulation in our model. If people are willing to pay
for less crisis this may result in a cost function which is less convex. The optimization with a
modified cost function leads to a singular equilibrium at the level of comprehensive international
The Journal of Business Leadership
82
regulation, A. The intuition is simple: the new cost function reduces the weight of costs and
increases the weight of benefits of the regulatory framework.
Interestingly, this model does not only reveal policy conclusions for the national and
international regulator. It also demonstrates both business and leadership implications. An
important business implication is the awareness that the regulatory trade-off is different between
the real and financial economy. Thus, in terms of regulation we have to treat both market
segments (real vs financial) differently. However, the leadership implications are even more
significant because investing in a financial environment and utilizing regulatory arbitrage,
despite the knowledge of the regulatory dilemma at home, is not automatically contradictory to
principals of corporate social responsibility (CSR). As matter of fact it is a global policy failure.
Policy-makers in all countries have failed to achieve a level playing field in financial markets
and that is not the fault of businesses.
CONCLUSION
This paper presents a unique contribution to the literature of regulation with strong
economic and business implications. We show that financial regulation is different due to higher
mobility of financial assets, the interdependencies of financial markets and the complexity of
international financial regulation. Trade relationships are usually based on mutually negotiated
trade agreements with certain standards for both sides. In financial markets this is not the case
due to different national rules and a few international rules with loopholes and incentives to
regulatory arbitrage. Given this difference we show that the regulatory trade-off of costs and
benefits is true in the real economy but false in a financial economy. The national and
international regulation of financial markets is even more surprising because an international
agreement based on a weak compromise does not lead to an efficient solution. International
regulation has two optimal regimes: No regulation or comprehensive regulation.
In summary, the model provides an innovative insight into the current debate about
regulating financial markets and the responsibility of regulators and businesses on this issue.
The Journal of Business Leadership
83
REFERNCES
Barro, R.J. (2009). Rare disaters and asset markets in the twentieth century. American Economic Reivew, 99(1), 243-254.
Bernanke, B. (2008). Reducing Systemic Risk. Speech at Federal Reserve Bank of Kansas City, Annual Economic Symposium, Jackson Hole, August 22, 2008.
Brunnermeier, M.K., and L.H. Pedersen (2009). Market Liquidity and Funding Liquidity. Review of Financial Studies, 22(6), 2201-2238.
Diamond, D. and P. Dybvig (1983). Bank runs, deposit insurance, and liquidity. Journal of Political Economy, 91(3), 401-419.
Crouhy, M. and D. Galai (1986). An economic assessment of capital requirements in the banking industry. Journal of Banking and Finance, 10, 231-241.
Freixas, X. and E. Gabillon (1999). Optimal regulation of a fully insured deposit banking system. Journal of Regulatory Economics, 15, 805-824.
French, K.R. et al. (2010). The Squam Lake Report: Fixing the Financial System. Princeton University Press.
Kim, D. and A. Santomero (1988). Risk in banking and capital regulation. Journal of Finance, 43, 1219-1233.
Laffont, J. and J. Tirole (1986). Using cost observations to regulate firms. Journal of Political Economy, 94, 614-641.
Parson, E.A. (2007). A review of Richard Posner’s catastrophe: Risk and response. Journal of Economic Literature, 45, 147-164.
Pindyck, R. and N. Wang (2009). The economic and policy consequences of catastrophes. MIT Sloan Working Paper, No 4751, 1-26.
Posner, R.A. (2004). Catastrophe: Risk and Response. Oxford University Press.
Rochet. J. (1992). Capital requirements and the behaviour of commercial banks. European Economic Review, 36, 1137-1170.
Sunstein, C.A. (2007). Worst-Case Scenario. Harvard University Press.
Tirole, J. (2011). Illiquidity and All Its Friends. Journal of Economic Literature, 49:2, 287-325.
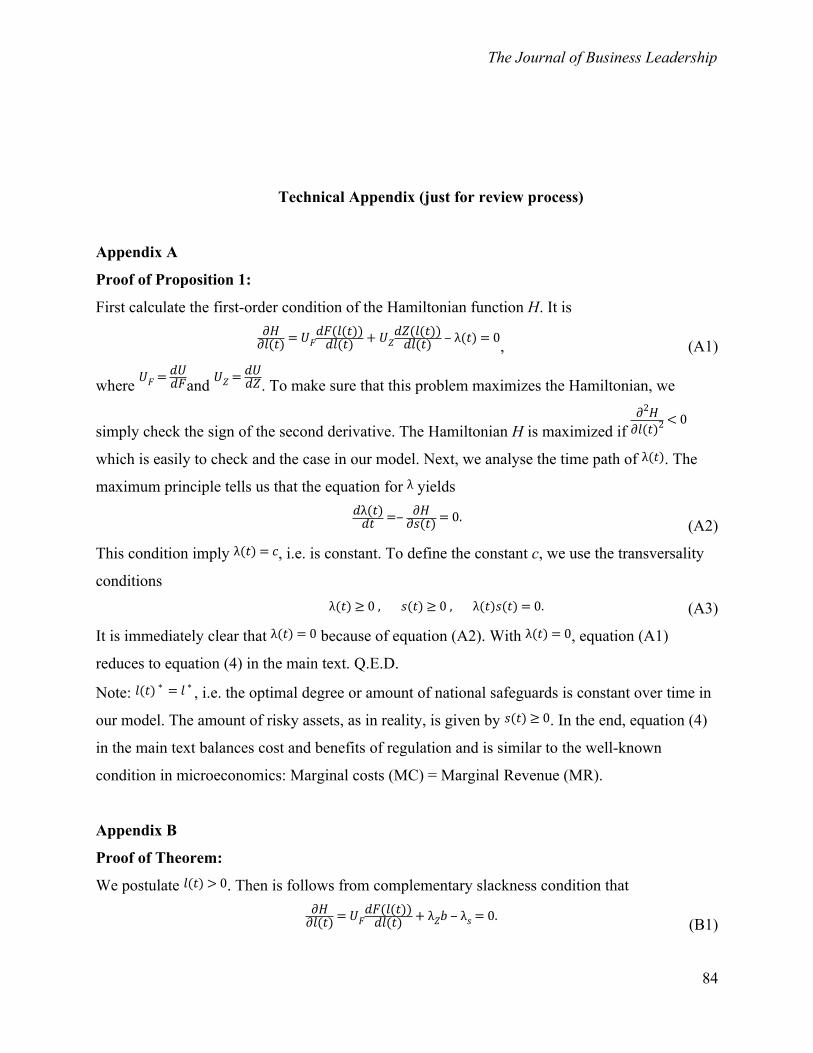
The Journal of Business Leadership
84
Technical Appendix (just for review process)
Appendix A
Proof of Proposition 1:
First calculate the first-order condition of the Hamiltonian function H. It is∂𝐻
∂𝑙(𝑡) = 𝑈𝐹𝑑𝐹(𝑙(𝑡))
𝑑𝑙(𝑡) + 𝑈𝑍𝑑𝑍(𝑙(𝑡))
𝑑𝑙(𝑡) ‒ λ(𝑡) = 0, (A1)
where 𝑈𝐹 = 𝑑𝑈𝑑𝐹and 𝑈𝑍 = 𝑑𝑈
𝑑𝑍. To make sure that this problem maximizes the Hamiltonian, we
simply check the sign of the second derivative. The Hamiltonian H is maximized if ∂2𝐻
∂𝑙(𝑡)2 < 0
which is easily to check and the case in our model. Next, we analyse the time path of λ(𝑡). The
maximum principle tells us that the equation for λ yields𝑑λ(𝑡)
𝑑𝑡 =‒ ∂𝐻∂𝑠(𝑡) = 0. (A2)
This condition imply λ(𝑡) = 𝑐, i.e. is constant. To define the constant c, we use the transversality
conditionsλ(𝑡) ≥ 0 , 𝑠(𝑡) ≥ 0 , λ(𝑡)𝑠(𝑡) = 0. (A3)
It is immediately clear that λ(𝑡) = 0 because of equation (A2). With λ(𝑡) = 0, equation (A1)
reduces to equation (4) in the main text. Q.E.D.
Note: 𝑙(𝑡) ∗ = 𝑙 ∗ , i.e. the optimal degree or amount of national safeguards is constant over time in
our model. The amount of risky assets, as in reality, is given by 𝑠(𝑡) ≥ 0. In the end, equation (4)
in the main text balances cost and benefits of regulation and is similar to the well-known
condition in microeconomics: Marginal costs (MC) = Marginal Revenue (MR).
Appendix B
Proof of Theorem:
We postulate 𝑙(𝑡) > 0. Then is follows from complementary slackness condition that∂𝐻
∂𝑙(𝑡) = 𝑈𝐹𝑑𝐹(𝑙(𝑡))
𝑑𝑙(𝑡) + λ𝑍𝑏 ‒ λ𝑠 = 0. (B1)
The Journal of Business Leadership
85
Since, the second derivative of H is negative, we have a maximum. In addition, we maximize H
with respect to a(t):∂𝐻
∂𝑎(𝑡) =‒ 𝑐λ𝑍 ‒ λ𝑠. (B2)
Besides, a(t) is restricted to the closed control set [0,A]. Thus, to maximize H, the left-hand-side
boundary solution is a*(t)=0, if ∂𝐻
∂𝑎(𝑡) < 0, and the right-hand-side boundary a*(t)=A if ∂𝐻
∂𝑎(𝑡) > 0.
In general,
𝑐λ𝑍 + λ𝑠 ( >< ) 0 ⟹ 𝑎 ∗ (𝑡) = (0
𝐴). (B3)
From complementary slackness together with equation (B1), we see
λ𝑠 = 𝑈𝐹𝑑𝐹(𝑙(𝑡))
𝑑𝑙(𝑡) + 𝑏λ𝑧 . (B4)
Using equation (B4) in equation (B3), gets
𝑈𝐹𝑑𝐹(𝑙(𝑡))
𝑑𝑙(𝑡) ( >< ) ‒ (𝑏 + 𝑐)λ𝑍 ⟹ 𝑎 ∗ (𝑡) = (0
𝐴). (B5)
The optimal choice of a*(t) thus depends on λ𝑍. The optimal policy choice for international
regulation a(t) is a boundary solution.
Next, we show that a*(t) is never a interior solution in (0,A). Consider the equations of motion of
the following costate variables:
λ̇𝑍 =‒ ∂𝐻∂𝑍(𝑙(𝑡)) =‒ 𝑈𝑍 + λ𝑍𝑑 (B6)
λ̇𝑠 =‒ ∂𝐻∂𝑠(𝑙(𝑡)) = 0 ⟹λ𝑠 = 𝑐𝑜𝑛𝑠𝑡𝑎𝑛𝑡 (B7)
If a*(t) is an interior solution, then𝑐λ𝑍 + λ𝑆 = 0. (B8)
Since λ𝑆 is a constant, equation (B8) shows that λ𝑍 must also be a constant, which implies that λ̇𝑍 = 0 ⟹𝑑λ𝑍 = 𝑈𝑍 (B9)
But if λ𝑍 and d is constant then this requires 𝑈𝑍 to be constant, too. Since U(.) is monotonic in
Z(.), there can only be one value of Z(t) that would make 𝑈𝑍 take this particular and constant
value. Thus Z(t) must be constant too if a*(t) is an interior solution. But given that 𝑍(𝑇) = 𝑧0 > 0, ,
the transversality condition requires𝑍(𝑇)λ𝑍(𝑡) = 0. (B10)
With a positive Z(t), it is required that λ𝑍(𝑡) = 0. Since λ𝑍(𝑡) is constant by equation (B9), we get
The Journal of Business Leadership
86
λ𝑍(𝑡) = 0 𝑓𝑜𝑟 𝑎𝑙𝑙 𝑡ϵ[0,𝑇]. (B11)
However, λ𝑍(𝑡) = 0 would imply for an interior solution, by eq. (B4) with 𝑈𝐹𝑑𝐹(𝑙(𝑡))
𝑑𝑙(𝑡) = 0, which
contradicts the assumptions that 𝑈𝐹 and 𝑑𝐹(𝑙(𝑡))
𝑑𝑙(𝑡) are both positive. Consequently, an interior
solution of a*(t) must be ruled out. Q.E.D.
Appendix C
Proof of Proposition 2:
The boundary solution is linked to
𝑈𝐹𝑑𝐹(𝑙(𝑡))
𝑑𝑙(𝑡) = λ𝑠 ‒ 𝑏λ𝑍. (C1)
Intuitively, the positive effect of regulation on utility measured by 𝑈𝐹𝑑𝐹(𝑙(𝑡))
𝑑𝑙(𝑡) , equals to the
shadow prices of risky assets and cost of regulation. Using equation (C1) with condition (B5)
gets equation (9) of proposition 2 in the main text. Q.E.D.

The Journal of Business Leadership
87
A MODEL OF HIGH-TECH ENTREPRENEURIAL CAREERS: THE LIFE
AND CAREER OF STEVE JOBS
Amy E. Hurley-Hanson, Cristina M. Giannantonio, and Richard Sudek
Chapman University
INTRODUCTION
The financial and business success of high tech entrepreneurs Steve Jobs of Apple, Bill
Gates of Microsoft, and Mark Zuckerberg of Facebook have captured the interest of academics,
practitioners, and the general public. The products developed by their companies have changed
the way businesses operate, how people spend their work and leisure time, and the ways they
connect with each other. The companies these entrepreneurs have developed are some of the
country’s wealthiest companies, with Apple edging out Exxon for highest valued company for
much of 2012. While recent analytical doubts about the future of Apple have seen Apple drop
out of the number one spot of financial top companies, Apple’s long term viability is not in
question (Myuhi, 2013). These and other high profile computer and high tech companies (e.g.
Google) are viewed as highly desirable places to work by college graduates. Also capturing the
public’s interest is the unimaginable wealth these individuals have amassed, often at relatively
young ages, compared to most successful entrepreneurs. While embodying the American dream,
the success of these entrepreneurs has world wide appeal.
The meteoric rise, dramatic fall, and spectacular comeback associated with Steve Jobs’
career path is an evocative example of the risks and rewards associated with following an
entrepreneurial career. While research on entrepreneurs has primarily focused on their
characteristics, there is limited research on the career paths of entrepreneurs in either the careers
or the entrepreneurship literature. Traditional stage and linear models of careers do not appear to
fit the career paths that Jobs, Gates, Zuckerberg and other high tech entrepreneurs have followed.
Thus, the purpose of this paper is to propose a new model of entrepreneurial careers that better
reflects the realities of pursuing a career in the high tech computer industry. The career path of
The Journal of Business Leadership
88
Steve Jobs is used to illustrate the entrepreneurial activities that comprise the stages, phases, and
ages components of the proposed model.
STEVE JOBS
Steve Jobs' life story and career path offer management scholars a modern day case study
in which to explore career theories and models. The interest in Steve Jobs' personal life and
management style, along with the popularity of Apple's consumer electronic products, including
the iMac, iPod, iPhone, and iPad, offers academics an engaging and relatable business case
relevant to several disciplines. His successful return to Apple after a very public firing add to the
uniqueness of his story.
Steve Jobs’ life and career combine to create a compelling story on many levels. There is
the rags to riches story of an adopted child who achieves cult like adoration from the customers
who buy his products. There are spectacular failures along with undreamed of successes. There
are incredible self-disappointments including being ousted from a company he founded by a
CEO and a board he chose. There are imaginative designs after multiple revisions. There are
enemies created and friends alienated by a lack of social skills. There are huge risks and
ultimatums given to corporate giants. There is the brutal treatment of those he called friends.
There is a hero who battles cancer and a genius whose work is cut short at the age of fifty-six. At
the heart of the story, there is an entrepreneur.
Steve Jobs’ career exemplifies the unique path that high tech entrepreneurs may follow.
This paper differentiates the high tech entrepreneurial career path from other stage models of
careers. His early career path can be followed from Apple, to Next, to Pixar, and back to Apple.
There are some aspects of entrepreneurial career theories that may apply to his early career
decisions. However, it is after he is fired from Apple that his unique high tech career path
emerges and serves as an illustration for the proposed model. Research on the mid-career paths
of entrepreneurs may differ greatly from the early career paths of entrepreneurs just as it may for
all careers. Research on entrepreneurs’ long term career paths is lacking. In addition, research is
lacking on differentiating the career path of entrepreneurs from standard career theories.

The Journal of Business Leadership
89
Although the career trajectory of Steve Jobs is utilized to illustrate the new model that is
presented, Steve Jobs is not alone in exhibiting a unique high tech entrepreneurial career path.
Throughout the world there are examples of entrepreneurs who do not fit traditional academic
models. Some include Richard Branson, Bill Gates, George Lucas, Mark Zuckerberg and others.
Silicon Valley offers numerous examples of high tech entrepreneurs who have not followed
traditional entrepreneurial paths. It is short sighted to not examine the career paths of these
entrepreneurs. Their successes serve as inspiration for other would be entrepreneurs, their stories
offer business lessons for future generations of management practitioners, and their “unique”
career paths are likely to become the norm for those who choose to work in high tech companies.
Careers researchers must begin to reformulate their assumptions about the careers of high tech
entrepreneurs.
CAREERS RESEARCH
Developmental theories of career development assume that “career development is a
process that takes place over the life span.” (Super, Savickas, & Super, 1996, p. 28). Numerous
psychologists and sociologists have suggested that individuals progress through distinct career
stages, where each career stage is characterized by unique career concerns, psychological needs,
and developmental tasks. Most of these developmental theories of career development also
assign an expected age range to each stage in their career path model (Levinson, 1978; Hall,
1976). The key assumption underlying stage models of careers are that careers are linear, with
individuals progressing in a step by step fashion through each career stage. These models do not
explicitly recognize that individuals can cycle through the various stages several times in their
careers. Entrepreneurial careers which are often characterized by repeated failures and multiple
start-ups do not conform to traditional career stage models. Also problematic is the fact that
some high profile entrepreneurs are successfully running their own companies before the age of
thirty. It is doubtful that these young millionaires and billionaires consider themselves to be in
the early stages of their careers.
Donald Super in his model of careers (1980) emphasized the fact that careers develop
over time. That is, while occupational decisions might otherwise be considered in relative
isolation, Super's work suggested that such decisions must be considered with reference to the

The Journal of Business Leadership
90
past and the future. In reviewing Jobs’ career path, one can clearly trace the linkages between
his occupational decisions. For example, the software developed at NeXT is utilized in Apple’s
current operating systems.
Although most models of career development have been based on the careers of white
middle class males, some models have been developed for specific populations including women
(Fossen, 2012), entrepreneurs with and without dependents (DeMartino, 2006), the MBA student
(Nabi, Holden, & Walmsley, 2010), minorities (DeCaro, 2010), transnationals (Portes, 2002),
Cuban-Americans (Peterson, 2001) and for specific geographical regions such as Finland
(Brannback & Carsrud, 2008). Few models exist which address the unique aspects of
entrepreneurial careers. Plehn-Dujowich (2010) has identified a model for serial entrepreneurs;
these are entrepreneurs who repeatedly start new businesses across their careers, such as Richard
Branson (Wright, Robbie, & Ennew, 1997). There is no career model for One Hit Wonders,
entrepreneurs who develop one successful company across their life span such as Sam Walton or
Walt Disney although some have investigated entrepreneurs with one hit item fad businesses
(May, 2010).
ENTREPRENEURSHIP RESEARCH
The study of entrepreneurship is relatively young. Yet, in a short time researchers have
put forth and studied numerous theories of entrepreneurship. These theories seek to explain the
process of entrepreneurship and attempt to predict who will become entrepreneurs or what
conditions lead to entrepreneurship. Besides helping academics to understand the entrepreneurial
process, these theories have the goal of assisting people who are or want to become
entrepreneurs. However, there has been very little research on the career paths of entrepreneurs,
nor the stages they may go through as their careers unfold.
There is still the problem of the definition of entrepreneurship. It has been defined as
innovation (Schumpter, 1958), initiating, maintaining, and developing a profit-oriented business
(Cole, 1965), making significant decisions about changes which affect resources of a company
(Sawyer, 1958), risk-bearing (Mill, 1848), ultimate formal authority within an organization
(Weber, 1917), or making changes in strategy for an existing firm that alter the state or pattern of
resources deployment (Ginsberg, 1988). Today there are many definitions of entrepreneurship

The Journal of Business Leadership
91
accepted and each researcher is responsible for defining precisely what type of entrepreneur or
entrepreneurial activity they are studying. There is still much discussion about whether
entrepreneurship can take place in a corporate environment (Guth & Ginsberg, 1990) or whether
street peddlers should be included as entrepreneurs. An inclusive definition which permits a
broad exploration of entrepreneurship is “a process by which individuals - either on their own or
inside organizations - pursue opportunities without regard to the resources they currently
control” (Stevenson et al., 1989, p. 23).
In the nineteenth century an entrepreneur was any successful business man. Books were
written about business tycoons such as Astor and Vanderbilt. These descriptions assumed
entrepreneurs were owners. Early historians described the entrepreneur’s motivations as material
wealth, public recognition and esteem, and the welfare of society. His distinguishing
qualifications were hard work and good luck (Livesay, 1982). The study of entrepreneurship
entered the professional disciplines in the late 1920s. N.S.B. Gras and his colleagues at Harvard
attempted to relate the business executive to the management of the firm and the socioeconomic
environment in which the firms operated. These Harvard academics produced a stream of case
studies on business executives and firms (Livesay, 1982). Today, much of the study of
entrepreneurs is still based on case studies. This has led to numerous criticisms of the history of
entrepreneurial research. Historians may have been studying the careers of business tycoons
instead of the formation of new companies (Vesey, 1982).
There is still much work to be done in the field of entrepreneurship. No one theory has
been shown to explain the process completely. While research in the field is growing at an
amazing rate, there are still some basic problems to be worked out in the grounding of
entrepreneurial theory. There are two major streams of theory building in entrepreneurship;
psychological and sociological. Sociological theories look at how the environment affects
entrepreneurship. These studies began with McClelland’s work on the need for achievement
(1961). He felt that the high economic and social growth in some societies fostered
entrepreneurship. In his view, this growth was owed to a large segment of these societies being
high in need for achievement. Hagen’s (1960) theory states that entrepreneurs are lower status
groups trying to overcome their social inequality with economic venturing. He drew on historical
cases from different countries. Recent historical research has found evidence that it was not the
The Journal of Business Leadership
92
lower status groups in the country who were creating new businesses (Fleming, 1979; Kaser,
1978). Hagen’s theory is now dismissed because of these inconsistent findings. Perhaps his
theory should not be dismissed so easily. Sociological theories have tried to come up with one
theory of how environmental conditions affect all members of the population.
Psychological theories of entrepreneurs look at the distinguishing psychological
characteristics entrepreneurs possess. These characteristics have been correlated with
entrepreneurial performance in an attempt to predict who will become successful entrepreneurs.
These psychological theories take a broad view of psychology. The three factors most often
studied on entrepreneurs are the psychological influences on, the personal characteristics of, and
the effects of previous experience on the individual (Brockhaus, 1982).
While there is much research on the factors leading to an individual’s decision to become
an entrepreneur (Sing & DeNoble, 2003), there is less research on how they live out their
entrepreneurial careers. Some research has focused on entrepreneurs’ growth intentions (Cassar,
2007), but very little has examined the career stages of entrepreneurs as their careers evolve.
Other research has explored how different variables at different stages of a person’s life may
influence them to become entrepreneurs (Singh & Verma, 2001). However, there is not much
research on the influence of these variables on later career stages. Very few theories or models of
mid-career stages exist and even fewer address the mid careers of entrepreneurs.
Individuals may make the decision to become entrepreneurs at different stages of their
lives, including retirement (Singh & DeNoble, 2003), right after school (Shaver & Scott, 1991),
or after working for a while (Katz, 1994). The decision to become self-employed is affected by
different factors at various stages of an individual’s life course (Singh & Verma, 2001). Another
important factor to consider is the co-evolution of the industry the individual works in (Jones,
2001). For example, Steve Jobs’ career path cannot be examined without considering the
evolution of the personal and home computer industry.
This brief review of current themes in entrepreneurship research reveals the need for
theoretical and empirical work that examines the entrepreneurial careers of individuals working
in the computer and other high tech industries. The next section of the paper describes a

The Journal of Business Leadership
93
proposed model of entrepreneurial careers. Relevant examples are drawn from Steve Jobs’ career
at Apple, NeXT, Pixar, and his return to Apple.
A NEW MODEL OF ENTREPRENEURIAL CAREERS
The purpose of this paper is to propose a new model of entrepreneurial careers that
reflects the realities of pursuing a career in the high tech computer industry. The career path of
Steve Jobs is used to illustrate the entrepreneurial activities that comprise the stages, phases, and
ages components of the proposed model. It is not the purpose of this paper to explore the reasons
why Steve Jobs may have become an entrepreneur (Isaacson, 2011). As perhaps the world’s
most widely recognized CEO, Steve Jobs exemplifies entrepreneurs operating in the high tech-
high touch arena of consumer electronics. This paper proposes to develop a model of
entrepreneurial careers and illustrate the components of the model by examining Jobs’ career
path.
A model of hi-tech entrepreneurial career development is relevant to and necessary for
understanding today's fast paced technological environment. This model will serve to connect
career theories and entrepreneurial theories. The model draws on historical career theory by
utilizing developmental stages, however, these stages are conceptualized to reflect the stages that
entrepreneurs experience. The model includes the concept of career stages to incorporate the fact
that entrepreneurs may develop several products and companies across their careers. Finally,
recognizing that entrepreneurs can start companies at many points in their lives, age is included
as a component in the model.
As a high tech entrepreneur, Steve Jobs' career trajectory illustrates the components of
the model of entrepreneurial careers that is presented in this paper. Jobs’ early career success,
his ouster from the company he created, his work at Next and Pixar, and his ultimate return to
Apple, offer management scholars a contemporary version of the Horatio Alger success story.
Studies on his successes and failures are likely to continue for years after his death. Steve Jobs
was a very successful entrepreneur. His startups of Apple, Next, and Pixar created millions of
dollars for him and his stockholders. His return to Apple in the 1990s ushered in a string of
highly profitable consumer electronic products and dramatically increased Apple's market value.
The Journal of Business Leadership
94
There are three components in this new model of entrepreneurial careers. The components are
career stages, career phases, and career ages. The first component of the model is career stages.
Similar to other stage models of careers, entrepreneurial careers unfold across a series of stages.
The model is similar to developmental models of career stages. Very little research has linked
career theories to entrepreneurial careers (Katz, 1994). However, unlike traditional career models
which have linear progression, the proposed model recognizes that entrepreneurs, by their very
nature, startup different businesses which results in them cycling through the stages multiple
times. There are four stages in the proposed model. The first stage is reconnection. The second
stage is transition. The third stage is reflection, and the fourth stage is death.
A second component of this model of entrepreneurial careers is the element of career
phases. Since the primary focus of most entrepreneurs is on starting and building companies, the
model needed to reflect the idea that entrepreneurial careers can be divided into identifiable
career phases. Each career phases is usually associated with the specific company that the
entrepreneur is focused on in that part of their life span. Entrepreneurs may operate in more than
one phase at a time, but there is usually one primary company that is the focus of the
entrepreneur’s time, money, and effort in each phase.
The third component of this model is career ages. Many well-known career and
developmental stage models such as Super (1980) and Levinson (1978) link the stages of their
models to specific chronological ages. Some researchers have questioned whether specific ages
should be linked to career stages (Leonard, Mathews, & Bowes, 1987). Previous research on
entrepreneurship has illustrated that entrepreneurial careers can happen at many different ages
(Katz, 1994; Shaver & Scott, 1991; Singh & DeNoble, 2003). The next section of the paper
utilizes the career path of Steve Jobs to illustrate each component of the model.
APPLYING THE MODEL
Applying the model to Steve Jobs’ career path, the following career stages are illustrated.
The first stage of his unique career path is Reconnection. In 1985 Jobs was forced out of the firm
he created. He returned to Apple in 1997 when the company purchased NeXT, the computer firm
he started after his ouster from Apple. The Apple he returned to was a dying enterprise.
Fourteen years later, at the time of his death, it had become the most valuable company in the
The Journal of Business Leadership
95
United States. Jobs reconnected with his old firm and reminded the company what was
important about Apple. Jobs reconnected Apple to its true purpose, innovation, to transform
Apple’s organizational image. Jobs used Apple’s organizational identity to build the company
into one of the top firms in the country and he created a new purpose for the organization.
The next stage in the model is the Transformation stage. Key to Jobs’s success at Apple was his
transformation of Apple from a computer company to a mobile device company. Jobs
introduced the iPad in a January 2010 Keynote. During that Keynote, Jobs announced that
Apple was a mobile devices company
(http://www.circleid.com/posts/steve_jobs_apple_is_a_mobile_device_company/). This shift in
strategy and redefinition of the company’s mission was a dramatic transformation for a company
that had launched the personal and home computer industry.
Jobs transformed additional companies, as well as entire industries. He transformed
Pixar from a computer division of Lucasfilm into an award winning computer animation film
studio. He transformed the way that music was purchased, stored, and listened to through the
development of iTunes and the iPod. He transformed software development and distribution
with the creation of the App store, creating a cottage industry for thousands of app developers,
and launching another generation of high tech entrepreneurs.
As he grew older and was diagnosed with cancer Jobs began the Reflection stage of his
career. He began to speak to the media about his career and personal life. He chose to speak at
graduations and other venues where he hoped to have an impact on people’s lives and careers.
He agreed to have a biography written about him (Issacon, 2011). He opened up about career
failures as well as successes in the hope of imparting wisdom that would help people to learn
from his successes and his failures.
In the reflection stage Jobs appeared to consider his generativity needs (Erikson, 1963).
In his personal life he spent private time with his wife and children, as well as his friends and
colleagues. Jobs prepared Tim Cook for the day when he would not be able to run Apple
because of his health. He worked very closely with Apple’s board to prepare the company for
life at Apple after he was gone. Steve Jobs busied himself with making sure the company would
survive without him. He focused on choosing his successor and setting up the next products that

The Journal of Business Leadership
96
Apple would introduce to the world. The three stories he told at Stanford’s 2005 commencement
were reflections on his life and legacy and lessons learned along the way.
Companies with strong entrepreneurial founders have to consider the impact that the
eventual death of their company’s founder will have on the long term viability of their firm. The
fourth stage of the model is Death. Steve Jobs faced the fourth stage of the model by resigning
from his duties as CEO of Apple and preparing for his death. He died on October 6, 2011 at the
age of 56. His death sparked very unique public reactions throughout the world. Thousands of
people outside of his immediate circle followed his journey through this stage. In the days
following Jobs’ passing reflections on his legacy were noted by the worldwide media.
BusinessWeek devoted an entire issue to him, something they had never done in their publishing
history. Apple users around the world felt the need to note the passing of Steve Jobs and be
involved with this phase. Mac stores allowed customers and visitors to place Post-it notes around
the store sharing their feelings on the loss of Steve Jobs. People were able to use Apple
technology to create visual images to send around the world to mourn with other Apple
customers and fans of Steve Jobs.
The death phase is a rarely studied phase in career theories. However, Bell and Taylor
(2012) studied this phase of Steve Job’s career by doing a semiotic analysis of photographic
images and emails sent to Apple and other corporate websites after the death of Steve Jobs.
Visual data such as this may provide an important way for stories about the life of an
organization and its founder to be remembered. Visual data is an additional way for individual’s
to communicate messages about their leader’s death and the loss their employees’ may feel (Bell
& Taylor, 2012). Continuous visual images may also illustrate the importance of the dead in the
ongoing life of the organization and show how the organization’s members seek to maintain a
continuing bond with the dead (Bell & Taylor, 2011). Apple fans were in so much disbelief
about his dying that they actually thought he would make a surprise appearance and launch
Apple’s latest product at a shareholder meeting two days before he died. On the one year
anniversary of his death, visitors to the Apple website were presented with simply a picture of
Steve Jobs followed by a voice over video by Tim Cook. For several days it was not possible to
access Apple’s website without seeing this visual image of a company mourning the loss of their
founder and paying respect to him.
The Journal of Business Leadership
97
Another issue to consider in the death stage of entrepreneurial careers is the reaction of
the financial markets to the death of the founding entrepreneur. Because of his inextricable
relationship with Apple, questions were rampant about whether the death of its founder would
also result in the death of his company. Entrepreneurial careers are unique in that the impact of
losing the company’s founder may be keenly felt and result in questions about the long term
viability of their firm. There have been many product launches since the death of Steve Jobs.
Although most have been highly anticipated and have generated huge sales numbers, Apple has
dropped from its top spot as the world’s biggest financial corporation. Investors are wary of
Job’s successor and whether he will be able to maintain the leadership of Steve Jobs. Steve Job’s
followers believed he was changing their lives with each new project. Cook has not yet enjoyed
the cult like following that Jobs engendered. Competitors have cut greatly into Apple’s market
share and profits. Enormous law suits have bit into the cult like status of Apple by revealing
many details of the innovation of Apple products that Apple would rather not be made public.
These lawsuits are also causing Tim Cook to focus on many other issues than innovating new
products for Apple. For the first time Apple profits have fallen. Although in reality this may have
nothing to do with the death of Steve Job’s, many will attribute the financial falls to Job’s death.
This aspect of the death stage of entrepreneurs is likely to be studied for many years.
A second component of the proposed model is career phases. It was important to include
a variable that explicitly dealt with the reality that entrepreneurs may be involved with several
products, businesses, and/or industries across their career span. In examining Steve Jobs' career
path, four distinct phases may be identified. Phase one occurred with the founding of Apple
Computer. After building the first personal computer in Jobs' parents' garage, Jobs' focus was on
building the Apple 1 and Apple 2 computers, building Apple Computers, and taking the
company public. Other key events in phase one include the development of the Macintosh, the
hiring of John Sculley, and the eventual firing of Steve Jobs from Apple.
Phase two occurred at NeXT, the computer company that Jobs started after his ouster
from Apple. Using technology developed for the Lisa computer, Jobs and his team developed a
high end, costly computer aimed at the scientific and academic community. While the computer
was not a commercial success, its software found wide spread application. Steve Jobs ultimately
The Journal of Business Leadership
98
sold NeXT to Apple. The third phase in Jobs' career path phase occurred at Pixar. Jobs
transformed a computer division at Lucasfilms into an award winning computer animated film
studio. Pixar's first release was Toy Story which was both a commercial and critical success.
Several other successful films were produced by Pixar and Jobs eventually sold the studio to
Disney. During Jobs' Pixar phase he was able to fully integrate his love of artistry and
technology (Isaacson, 2011).
The fourth phase of Jobs' career occurred at Apple. This phase encompassed his return to
Apple in the mid-1990s until his death in 2011. During this phase Jobs transformed Apple from
a computer company to a mobile devices company. There were multiple highly successful
product launches including the iMac, the iPod, the iPhone, and the iPad. This phase also saw the
creation of iTunes, the App Store, and Apple retail stores.
In examining each of these phases, it can be seen that part of Jobs' genius was his ability to see
the strategic linkages between each phase of his career. Technology developed for one computer
became the platform for other high tech products. It is also evident that while each of these
phases of his career were distinct, there were strategic linkages between the businesses he
focused on in each phase.
The final component of the model that Jobs' career path illustrates is ages. Career ages
has interesting implications for both image norms (Giannantonio & Hurley-Hanson, 2006) and
age norms (Lawrence, 1983). Entrepreneurship may intersect with age and image norms as
people assess whether their occupation is age appropriate. Jobs was a millionaire in his twenties;
he was fired from the company he founded at 30; he passed away at the age of fifty six. In his
thirty year career he started and sold numerous companies. Consistent with the model presented
in this paper, Jobs' entrepreneurial activities occurred at several ages. This is consistent with
research evidence that suggests that entrepreneurial activity can occur at any age in the life span
CONCLUSIONS
The purpose of this paper was to present a new model of entrepreneurial careers and to
illustrate the components of the model using Steve Jobs' career path. Future research should
examine the careers paths of other high tech entrepreneurs to validate the stages, phases, and
ages components of the model. Steve Jobs' was a charismatic entrepreneur whose business
The Journal of Business Leadership
99
successes had worldwide interest. His career path was highly visible. Future research on the
career paths of other high tech entrepreneurs will determine if it was also highly unique. The
rate of change and innovation in the high tech industry demands an equally innovative approach
to the study of entrepreneurial careers.
REFERENCES
Bell, E. (2012) ‘Ways of Seeing Death: A Critical Semiotic Analysis of Organizational Memorialization’, Visual Studies. Forthcoming.
Bell, E. and Taylor, S. (2011) ‘Beyond Letting Go and Moving On: New Perspectives on Organizational Death, Loss and Grief’, Scandinavian Journal of Management, 27(1): 1-10.
Brannback & Carsrud, 2008 Do they see what we see? A Critical Nordic Tale about Perceptions of Entrepreneurial Opportunities, Goals and Growth. Journal of Enterprising Culture, Vol. 16, No.l (March 2008) 55-87
Brockhaus, Robert H., The Psychology of the Entrepreneur (1982). Encyclopedia of Entrepreneurship, Vol. , p. 39-57 1982. Available at SSRN: http://ssrn.com/abstract=1497760.
Cassar, G., 2007. Money, Money, Money? A Longitudinal Investigation of Entrepreneur Career Reasons, Growth Preferences and achieved growth. Entrepreneurship & Regional Development, 19, 89-107.
Cole, A. H. (1965) An approach to the study of entrepreneurship:A tribute to Edwin F. Gay. In H.G.J. Aitken (Ed.), Explorations in enterprise (pp. 30-44). Cambridge, MA: Harvard University Press.
DeCaro, F.P., DeCaro, N., Bowen-Thompson, F.O., 2010. An Examination of Leadership Styles of Minority Business Entrepreneurs: A Case Study of Public Contracts. Journal of Business & Economic Studies, 16:2, 72-78.
DeMartino, Richard; Barbato, Robert; Jacques, Paul H..Exploring the Career/Achievement and Personal Life Orientation Differences between Entrepreneurs and Nonentrepreneurs: The Impact of Sex and Dependents . Journal of Small Business Management, Jul2006, Vol. 44 Issue 3, p350-368, 19p,
Erikson, E.H. (1963). Childhood and society. New York: W.W. Norton & Company .Fleming, W.J. The cultural determinants of entrepreneurship and Economic Developent : A case study of Mendoza Province 1861-1914. Journal of Ecojnomic History XXXIX No 1. 1979;
Fossen, F.M., 2012. Gender Differences in Entrepreneurial Choice and Risk Aversion: A Decomposition Based on a Microeconometric Model. Applied Economics, 44:1795-1812.
The Journal of Business Leadership
100
(giannantonio & hurley-hanson, 2006) Applying Image Norms across Super's Career Development Stages, Giannantonio, Cristina M.; Hurley-Hanson, Amy E. Career Development Quarterly, Vol. 54 No 4
Ginsberg, A. 1988). Measuring and modeling change in strategy. Theoretical foundations and empirical directions. Strategic Management Journal, 9, 559-575.
Guth, W. and Ginsberg, A. (1990) Guest editors’ introduction: Corporate Entrepreneurship, Strategic Management Journal, 11, Special Issue)
Hagen, E. (1960). The Entrepreneurs as Rebel against Traditional Society. Human Organization 19(4): 185-187.
Hall, D. T. 1976. Careers in organizations. Pacific Palisades, CA: Goodyear. (http://www.circleid.com/posts/steve_jobs_apple_is_a_mobile_device_company/). Isaacson, W., 2011. Steve Jobs. New York: Simon & Schuster.
Katz, J., 1994. Modeling Entrepreneurial Career Progressions: Concepts and Considerations. Entrepreneurship Theory and Practice, 19:2, 23-36.
Kaser,M.C. 1978) “Russian Entrepreneurship” in Peter Mathias and M.M. Potsdan eds. The Cambridge ECONOMIC History of Europe. XXVII.
Lawrence, B. S. (1988). New wrinkles in the theory of age: Demography, norms, and performance ratings. Academy of management journal, 309-337.
Leonard, P. Y., Mathews, B. and Bowes, J., 1987. Mid-Life Women: Research and Implications. Conference Paper, ED 295 074.
Levinson, D., 1978. The Seasons of a Man’s Life. New York: Knopf.
Livesay, H.C. (1982), Entrepreneurial History, in Kent, C.A., Sexton, D.L., and Vesper, K.H. (eds), Encyclopedia of Entrepreneurship, Prentice-Hall, New Jersey, pp. 7-15.
Lovecraft, R., 2011.http://techcrunch.com/2011/12/12/steve-jobs-biography-is-amazons-best-selling-book-of-the-year/
MAY, JEFF After the One-Hit Wonder. Wall Street Journal - Eastern Edition; 6/13/2011, Vol. 257 Issue 136, pR1-R4, 2p, 2
McClelland, D.C. 1961. The Achieving society. Princeton N.J. D. van Nostrand Co.
Mill, J. S. (1848). Principles of political economy with some of their applications to social philosophy. London: John W. Parker.
Karen Myuhi Is Apple Seriously Doomed?<http://www.thetechnext.net/author/karen/> January 25, 2013 Opinion<http://www.thetechnext.net/category/opinion/>
The Journal of Business Leadership
101
Nabi, G., Holden, R., Walmsley, A., 2010. From Student to Entrepreneur: Towards a Model of Graduate Entrepreneurial Career-Making. Journal of Education and Work, 23 389-415.
Peterson, Mark F.; Meckler, Mark R Cuban-American Entrepreneurs: Chance, Complexity and Chaos... Organization Studies (Walter de Gruyter GmbH & Co. KG.), 2001, Vol. 22 Issue 1, p31, 27p
Plehn-Duiowich, J., 2010. A Theory of Serial Entrepreneurship. Small Business Economics, 34:4, 377-398.
Portes, A., Guarnizo, L.E., Haller. W., 2002. Transnational Entrepreneurs: An Alternative Form of Immigrant Economics Adaption. American Sociological Review, 67, 278-298.
Sawyer, J.E. 1958 Entrepreneurial studies. 1948-1958 Business Historical Review. 32, 434.
Schumpter, J. A. (1958). The Economics and Sociology of Capitalism.
Shaver, K. & Scott, L. (1991). Person, process, choice: The psychology of new venture creation. Entrepreneurship Theory and Practice, 16(2), 23–45.
Singh, G. & DeNoble, A. 2003. Early Retirees as the Next Generation of Entrepreneurs. Entrepreneurship Theory and Practice, 28, 207-226.
Singh, G. & Verma, A., 2001. Patterns of Employment and Working Time among Early Retirees of a Telecommunications Firm. In S. Houseman & A. Nakamura (eds.). Working Time in Comparative Perspective, Volume II: Studies of Working Time Over the Life Cycle and Nonstandard Work. Kalamazoo: Upjohn Institute for Employment Research.
Stevenson, H. H., M. J. Roberts and H. I. Grous- beck. New Business Ventures and the Entrepreneur, Irwin, Homewood, IL, 1989. Super, D.E., 1980. A Life Span, Life Space Approach to Career Development. Journal of Vocational Behavior, 13, 282-298.
Super, D. E. 1990. A life span, life-space approach to career development. In D. Brown & L. Brooks (Eds.), Career choice and development. San Francisco: Jossey-Bass
Super, D.E., Savickas, M.L., & Super, C.M. (1996) 'The life-span, life-space approach to careers', in Brown, D., Brooks, L, & Associates (Eds) ..., p. 28
The Theory of Social and Economic Organization (Weber, M. 1917),
Wright, M., Robbie, K., & Ennew, C., 1997. Serial Entrepreneurs. British Journal of Management, 8:3, 251-268.
The Journal of Business Leadership
102
The Financial Literacy of Maori Relative to Europeans in New Zealand
Steve Agnew
University of Canterbury
ABSTRACT
This paper uses data from the 2009 Financial Knowledge Survey conducted in New Zealand to ascertain if there is any difference in scores between the ethnic minority Maori (the indigenous people of New Zealand) and Europeans. The results show that high income respondents produce more correct responses than low income respondents. Once accounting for income, age, gender and highest qualification, Europeans are significantly more likely than Maori to give a correct response. When question types are categorised according to whether the response relied on a calculation, knowledge, or asked for a behaviour, Europeans are significantly more likely than Maori to produce more correct responses across all three types of questions, with the biggest difference in calculations, where Europeans are three times more likely to give a correct response than Maori. This raises the question is simply providing greater access to financial literacy programs for ethnic minorities the best strategy, or do cultural differences need to be considered.
Keywords: Financial literacy, Maori, Financial Education, Ethnic Minorities, New Zealand
Topic Area 8 Economics II (Applied and Empirical Research) or 14 International and Global Economics
INTRODUCTION
Braunstein and Welch (2002) describe a “complex, specialised financial services
marketplace that requires consumers to be actively engaged if they are to manage their finances
effectively” (p. 445). They describe how increased competition, technology and market
innovation have resulted in a sophisticated industry which has expanded access to credit for
younger populations, and increased employee responsibility for directing their own investments
in pension plans. At the same time, Braunstein and Welch (2002) describe how increased
diversity of the population can result in households that may face cultural barriers to establishing
a banking relationship. In their own analysis, Braunstein and Welch (2002) found that
respondents with higher financial literacy test scores, greater income, and a higher level of
education were more likely to rank above the median in terms of the number of financial
products they used or owned, and the number of financial behaviours they exhibited. They also
found that personal experience was most commonly cited as the most important source of
information about personal finances. Lusardi and Mitchell (2007) concur with Braunstein and
The Journal of Business Leadership
103
Welch’s (2002) description of a complex financial services marketplace, stating that “Workers
and retirees have increasingly been asked to take on an unprecedented degree of responsibility
for their retirement and other saving” (p. 36). Accordingly Lusardi and Mitchell (2007) describe
how “consumers now confront a bewildering array of financial decisions and a wide range of
financial products” (p. 36). From this they imply that economic know-how is becoming even
more important for households to acquire and manage.
For equitable outcomes, it is therefore important that certain sectors of society are not
disadvantaged in their understanding of the ‘economic know-how’ which Lusardi and Mitchell
(2007) refer to. Much of the literature on financial literacy focuses on the demographic factors
that influence financial literacy knowledge (represented by test scores) and financial behaviour
(represented by participation in financial markets for example).
Two of the findings of the analysis Lusardi & Mitchell (2007) conducted were that the
more educated are more likely to answer questions economic and political question correctly,
and that Blacks and Hispanics are less likely to answer correctly than Whites. Mention was also
made of the Colmar Brunton 2006 Financial Knowledge Survey, where “financial literacy was
strongly positively correlated with socio-economic status” (p. 39). Chen & Volpe (2002) state
that previous research by Volpe, Chen & Pavkicko (1996); Goldsmith & Goldsmith (1997a,b)
and Chen & Volpe (1998) found that women knew less about financial management than men.
Chen & Volpe (2002) found that amongst college students, males scored better than females on
survey responses on general personal finance knowledge, savings and borrowing, insurance and
investments. These results were obtained however without controlling for other variables such as
general education and income. Chen & Volpe (2002) go on to examine the relationships between
personal financial literacy, and a respondent’s gender, education, work experience, income and
other demographic factors. After running logistic regressions and ANOVA analysis, Chen &
Volpe (2002) found that “male participants are more likely to be more knowledgeable about
personal finance than female participants before and after controlling the effect of other
variables” (p. 298). They also find that people’s financial literacy is related to education, work
experience and age, but not to ethnicity or income. This may however be because college
students were used as respondents to their survey. If certain ethnic groups are underrepresented
at college, it may be that students of a certain ethnic minority attending college are not
The Journal of Business Leadership
104
representative of the ethnic minority population in general. The same argument could also be
applied on the basis of income.
Perry and Morris (2005) state that the “working belief in the fields of financial services
and social marketing is that there is a relationship between race and financial behaviour….While
this relationship between ethnicity and financial behaviour may exist, it is likely that these
differences result not simply from racial or ethnic variations but from social, economic, and
psychological factors” (p. 303). They then go on to quote Aizcorbe, Kennickell and Moore
(2003), who found that incomes for African Americans and Hispanics in the United States are
significantly lower than that for Whites. Perry and Morris (2005) conclude that their findings
imply financial management behaviour may vary by race and ethnic background, and that one
possible explanation for these results could be differences in beliefs.
Cole and Shastry (2007) found that greater cognitive ability and educational attainment
lead to significant increases in financial market participation. They also acknowledged that
correlations may not warrant casual interpretations, giving the example that those with low
education levels and low financial literacy are also likely to have low levels of income and
wealth. They go on to measure the casual effects of education, financial literacy and cognitive
ability on financial market participation, finding that education increases financial market
participation for whites and blacks. They also find that financial market participation increases
with net worth and cognitive ability. Cole and Shastry (2007) mention other research which
supports their findings, namely Bertuat and Starr-McCluer (2001) who demonstrated that
participation in financial markets increases with income and education; Lusardi and Mitchell
(2007) and Von Rooij, Lusardi and Alessie (2007) who state that financial market participation
increases with measured levels of financial literacy; and Hong, Kubic and Stein (2005) who
found that participation increased with social connections. Cole and Shastry (2007) concluded
that “Persistently lower participation rates among blacks than whites, even when one controls for
differences in in education, income and financial literacy, have led some to explore whether
culture, or other mediating factors depress participation”. Cole and Shastry (2007) did find that
financial participation among blacks responds to education in similar ways to whites, the
relationship is stronger for whites with the exception of retirement income, where more
schooling has a larger effect for blacks than for whites.

The Journal of Business Leadership
105
Lusardi and Mitchell (2006) found that financial illiteracy is widespread among older
Americans, and that women, ethnic minorities and those without a college degree were
particularly at risk of displaying low financial knowledge. They found that “demographic
differences remain statistically significant even when we perform a multivariate analysis of
pattern of responses and include controls for race, sex, marital status, educational attainment,
place of birth, Baby-boomer cohort, and age”. They go on to use the example of Blacks and
Hispanics, who are less likely to answer compounding interest and inflation questions correctly,
even accounting for educational attainment.
Lusardi and Mitchell (2011) describe findings consistent with previous research, that there is a
difference in financial knowledge between Blacks, Whites and Hispanics; that women are
generally less financially knowledgeable than men; and that financial literacy is highly and
positively correlated with schooling. However, specific to schooling, they found that financial
literacy is most acute for those with less than a high school degree.
Given the body of literature described above, age, gender, income, educational
qualification and ethnicity could be described as key determinants of financial literacy. The
purpose of this paper is to focus on income and ethnicity (Europeans and Maori, the indigenous
people of New Zealand) as determinants of financial literacy levels, using data collected by the
Colmar Brunton 2009 Financial Knowledge Survey. Specifically, the question this papers sets
out to answer is ‘is there a bias between European and Maori in financial literacy as measured by
the 2009 Financial Knowledge Survey, once the variables of age, gender, income and highest
educational qualification are held constant’? One contribution this paper will make to the general
body of literature is further examination of the effects of ethnicity on financial literacy, but using
an ethnic grouping that does not currently feature in the body of literature. If the results of this
paper mirror the results from the majority of the literature which suggests that Blacks and
Hispanics score lower than Whites on financial literacy test scores and financial market
participation, this raises the question do financial literacy tests themselves bias against ethnic
minorities by not recognising cultural differences which may impact on financial behaviour, and
‘correct’ financial knowledge.
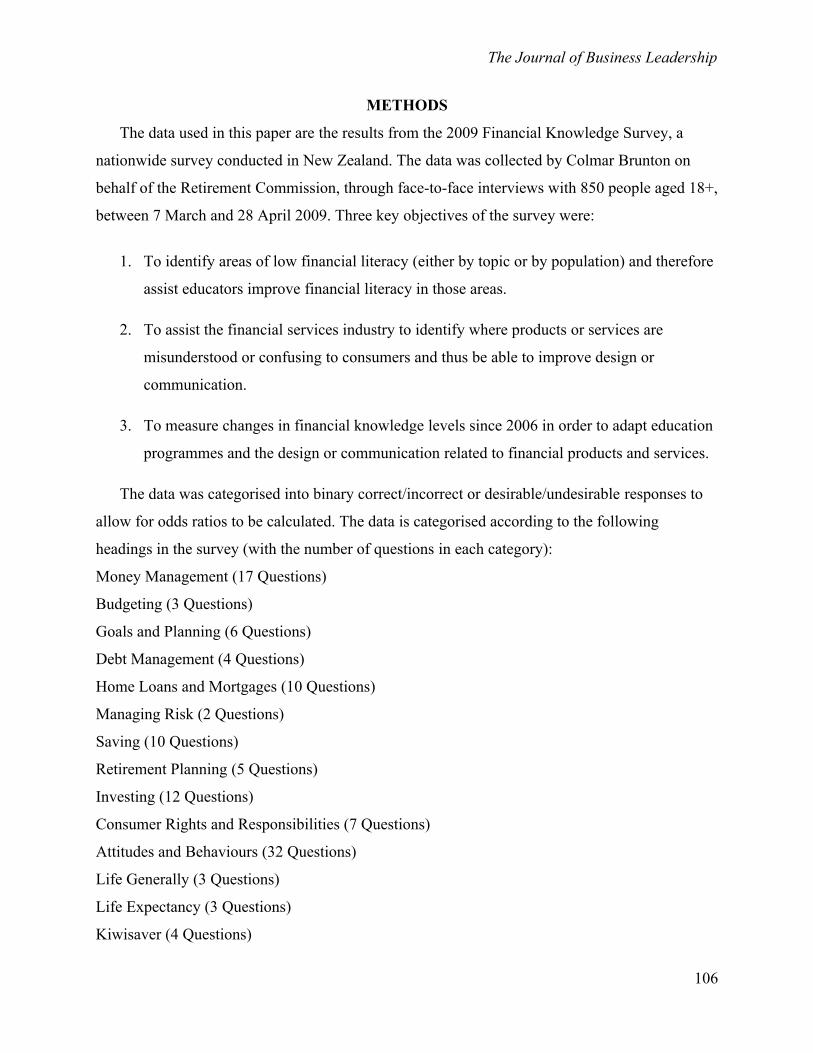
The Journal of Business Leadership
106
METHODS
The data used in this paper are the results from the 2009 Financial Knowledge Survey, a
nationwide survey conducted in New Zealand. The data was collected by Colmar Brunton on
behalf of the Retirement Commission, through face-to-face interviews with 850 people aged 18+,
between 7 March and 28 April 2009. Three key objectives of the survey were:
1. To identify areas of low financial literacy (either by topic or by population) and therefore
assist educators improve financial literacy in those areas.
2. To assist the financial services industry to identify where products or services are
misunderstood or confusing to consumers and thus be able to improve design or
communication.
3. To measure changes in financial knowledge levels since 2006 in order to adapt education
programmes and the design or communication related to financial products and services.
The data was categorised into binary correct/incorrect or desirable/undesirable responses to
allow for odds ratios to be calculated. The data is categorised according to the following
headings in the survey (with the number of questions in each category):
Money Management (17 Questions)
Budgeting (3 Questions)
Goals and Planning (6 Questions)
Debt Management (4 Questions)
Home Loans and Mortgages (10 Questions)
Managing Risk (2 Questions)
Saving (10 Questions)
Retirement Planning (5 Questions)
Investing (12 Questions)
Consumer Rights and Responsibilities (7 Questions)
Attitudes and Behaviours (32 Questions)
Life Generally (3 Questions)
Life Expectancy (3 Questions)
Kiwisaver (4 Questions)

The Journal of Business Leadership
107
Due to the level of interaction that exists between variables such as ethnicity, level of
education and income, the approach this paper makes is to use stratified random samples from
the survey responses to make two different samples as similar as possible on age, gender, level of
schooling and income, but different in terms of ethnicity, with one Maori sample and one
European sample. For level of schooling, respondents were categorised into two groups, those
who had a school qualification or lower as their highest qualification, and those that had a higher
than school level qualification. For income, the New Zealand Income Survey June Quarter
administered by Statistics New Zealand calculates the medium income from those on wages or
salaries to be $800. Survey respondents were categorised according to their self-declared
personal income level, using the weekly figure of $800 as a guideline. Those earning more than
$40,000 annually were classified as ‘high’ income earners, while those earning $40,000 or less
annually were classified as ‘low’ income earners. This is not an unreasonable categorisation
given that the medium weekly income from all sources (including beneficiaries) is $550,
however you may prefer to think of high as referring to above the median, and low as below the
median income level for workers. The 761 respondents that disclosed their personal income
were categorised into the high or low income groupings, with odds ratios calculated to establish
if there were any differences in levels of financial literacy between the two groups. The odds
ratios reported are the same as those calculated by a logit regression reporting odds ratios. Chi
square tests were performed on the odds ratios to establish if any statistically significant
differences in financial literacy levels existed between the two income groups, for any of the
categories listed above. A similar approach was used to test for significant difference in financial
literacy levels between high income Europeans and high income Maori ethnic samples, once age,
gender and level of schooling were accounted for.
RESULTS
Table one shows the odds ratios, chi square statistics and p values for participants in the
survey who identified their levels of personal income. The sample size is 761, with 490
respondents classified as high income (>$40,000) and 271 classified as low income ($40,000 or
less). For more information, please refer to Table 1.
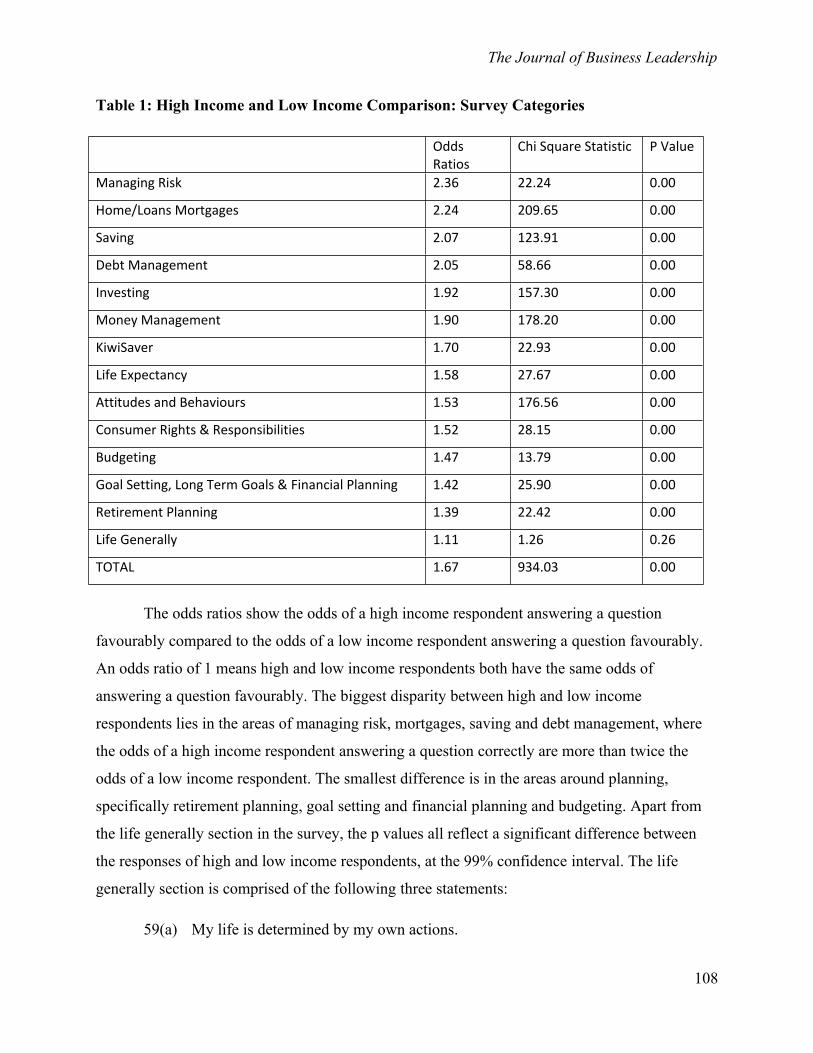
The Journal of Business Leadership
108
Table 1: High Income and Low Income Comparison: Survey Categories
Odds Ratios
Chi Square Statistic P Value
Managing Risk 2.36 22.24 0.00
Home/Loans Mortgages 2.24 209.65 0.00
Saving 2.07 123.91 0.00
Debt Management 2.05 58.66 0.00
Investing 1.92 157.30 0.00
Money Management 1.90 178.20 0.00
KiwiSaver 1.70 22.93 0.00
Life Expectancy 1.58 27.67 0.00
Attitudes and Behaviours 1.53 176.56 0.00
Consumer Rights & Responsibilities 1.52 28.15 0.00
Budgeting 1.47 13.79 0.00
Goal Setting, Long Term Goals & Financial Planning 1.42 25.90 0.00
Retirement Planning 1.39 22.42 0.00
Life Generally 1.11 1.26 0.26
TOTAL 1.67 934.03 0.00
The odds ratios show the odds of a high income respondent answering a question
favourably compared to the odds of a low income respondent answering a question favourably.
An odds ratio of 1 means high and low income respondents both have the same odds of
answering a question favourably. The biggest disparity between high and low income
respondents lies in the areas of managing risk, mortgages, saving and debt management, where
the odds of a high income respondent answering a question correctly are more than twice the
odds of a low income respondent. The smallest difference is in the areas around planning,
specifically retirement planning, goal setting and financial planning and budgeting. Apart from
the life generally section in the survey, the p values all reflect a significant difference between
the responses of high and low income respondents, at the 99% confidence interval. The life
generally section is comprised of the following three statements:
59(a) My life is determined by my own actions.
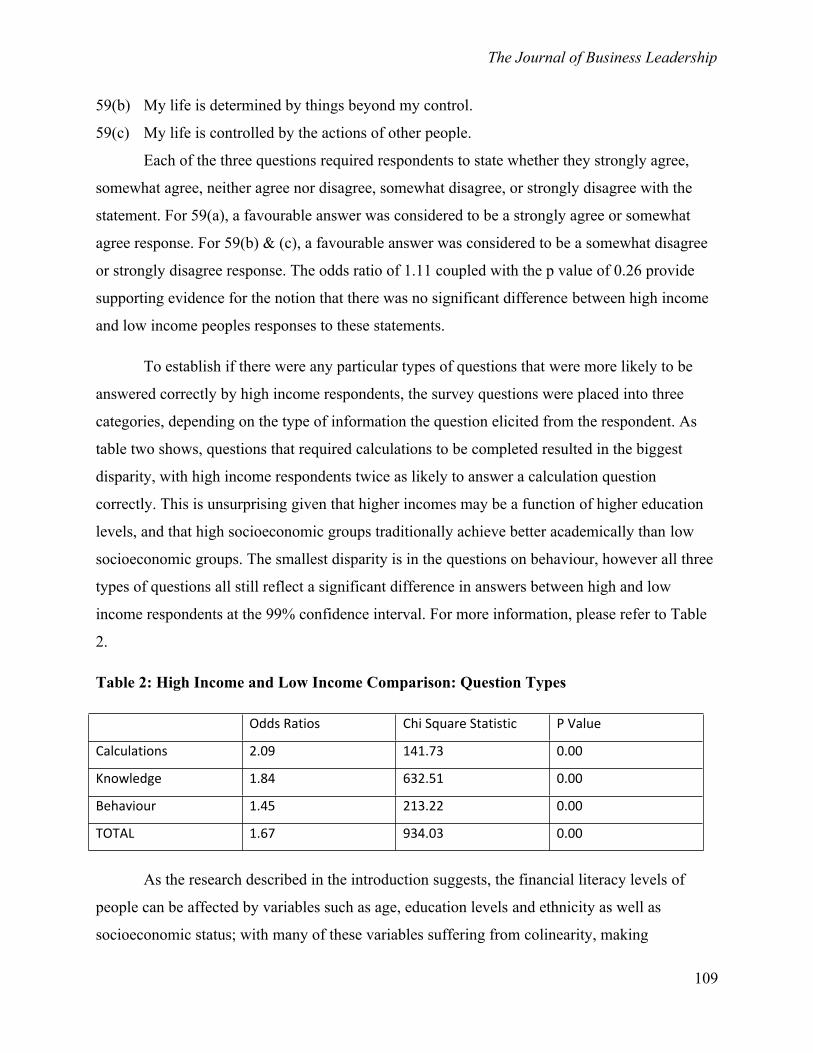
The Journal of Business Leadership
109
59(b) My life is determined by things beyond my control.
59(c) My life is controlled by the actions of other people.
Each of the three questions required respondents to state whether they strongly agree,
somewhat agree, neither agree nor disagree, somewhat disagree, or strongly disagree with the
statement. For 59(a), a favourable answer was considered to be a strongly agree or somewhat
agree response. For 59(b) & (c), a favourable answer was considered to be a somewhat disagree
or strongly disagree response. The odds ratio of 1.11 coupled with the p value of 0.26 provide
supporting evidence for the notion that there was no significant difference between high income
and low income peoples responses to these statements.
To establish if there were any particular types of questions that were more likely to be
answered correctly by high income respondents, the survey questions were placed into three
categories, depending on the type of information the question elicited from the respondent. As
table two shows, questions that required calculations to be completed resulted in the biggest
disparity, with high income respondents twice as likely to answer a calculation question
correctly. This is unsurprising given that higher incomes may be a function of higher education
levels, and that high socioeconomic groups traditionally achieve better academically than low
socioeconomic groups. The smallest disparity is in the questions on behaviour, however all three
types of questions all still reflect a significant difference in answers between high and low
income respondents at the 99% confidence interval. For more information, please refer to Table
2.
Table 2: High Income and Low Income Comparison: Question Types
Odds Ratios Chi Square Statistic P Value
Calculations 2.09 141.73 0.00
Knowledge 1.84 632.51 0.00
Behaviour 1.45 213.22 0.00
TOTAL 1.67 934.03 0.00
As the research described in the introduction suggests, the financial literacy levels of
people can be affected by variables such as age, education levels and ethnicity as well as
socioeconomic status; with many of these variables suffering from colinearity, making
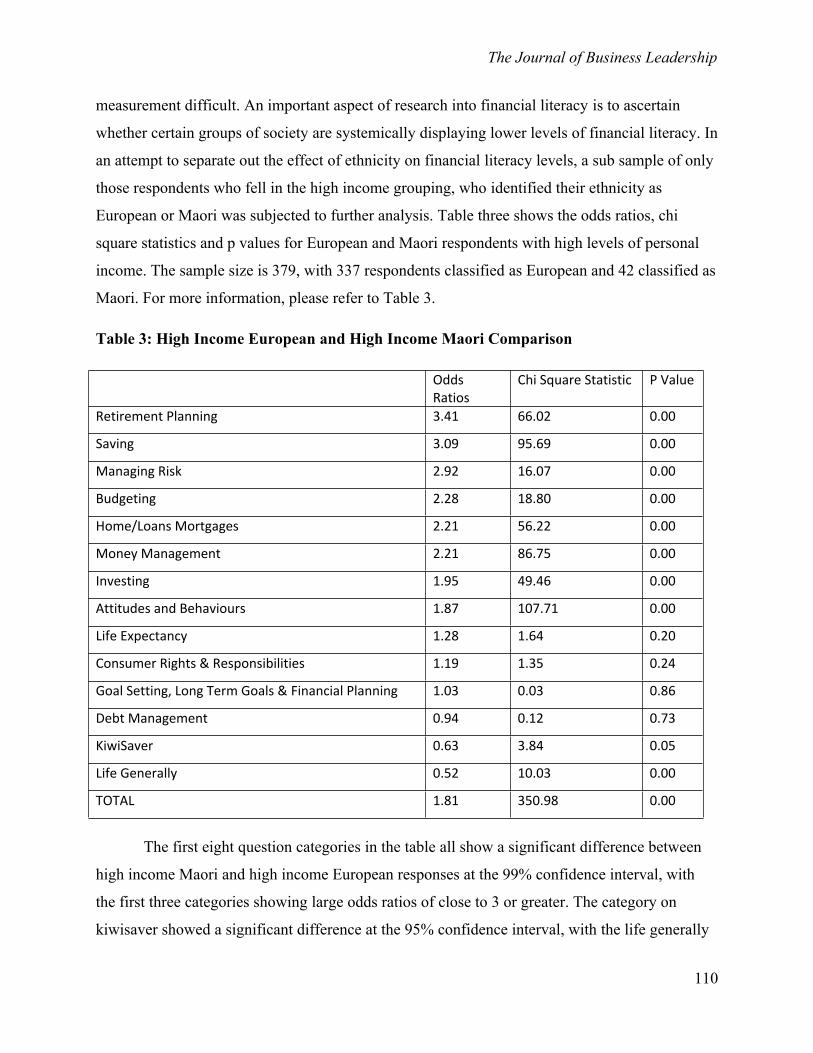
The Journal of Business Leadership
110
measurement difficult. An important aspect of research into financial literacy is to ascertain
whether certain groups of society are systemically displaying lower levels of financial literacy. In
an attempt to separate out the effect of ethnicity on financial literacy levels, a sub sample of only
those respondents who fell in the high income grouping, who identified their ethnicity as
European or Maori was subjected to further analysis. Table three shows the odds ratios, chi
square statistics and p values for European and Maori respondents with high levels of personal
income. The sample size is 379, with 337 respondents classified as European and 42 classified as
Maori. For more information, please refer to Table 3.
Table 3: High Income European and High Income Maori Comparison
Odds Ratios
Chi Square Statistic P Value
Retirement Planning 3.41 66.02 0.00
Saving 3.09 95.69 0.00
Managing Risk 2.92 16.07 0.00
Budgeting 2.28 18.80 0.00
Home/Loans Mortgages 2.21 56.22 0.00
Money Management 2.21 86.75 0.00
Investing 1.95 49.46 0.00
Attitudes and Behaviours 1.87 107.71 0.00
Life Expectancy 1.28 1.64 0.20
Consumer Rights & Responsibilities 1.19 1.35 0.24
Goal Setting, Long Term Goals & Financial Planning 1.03 0.03 0.86
Debt Management 0.94 0.12 0.73
KiwiSaver 0.63 3.84 0.05
Life Generally 0.52 10.03 0.00
TOTAL 1.81 350.98 0.00
The first eight question categories in the table all show a significant difference between
high income Maori and high income European responses at the 99% confidence interval, with
the first three categories showing large odds ratios of close to 3 or greater. The category on
kiwisaver showed a significant difference at the 95% confidence interval, with the life generally
The Journal of Business Leadership
111
category significant at the 99% confidence interval. Interestingly, these two categories have odds
ratios of less than one, which means that high income European respondents are less likely to
give a favourable response than high income Maori. Given that Europeans outperform Maori in
socioeconomic status and educational attainment, an intuitive argument for the positive attitude
to life by high income Maori may be because Maori are more likely to have risen from previous
generations of lower socioeconomic groupings, so have a greater sense of control over their own
lives and financial position. There is no significant difference between high income European
and Maori respondents for the sections on life expectancy, consumer rights, goal setting and
financial planning and debt management.
Despite the table showing significant differences in financial literacy levels between high
income Maori and Europeans for the majority of survey categories, we still need to be mindful
that other variables such as age and level of education may be disproportionately affecting
Maori, or that the Maori sample may have a gender bias which the European sample does not. It
may be for example, that high income Maori as a group still have lower levels of schooling than
high income Europeans, which is accounting for at least some of the lower levels of financial
literacy in high income Maori. An examination of the sub sample of high income Europeans and
Maori reveals that the European high income sample contains 73% of respondents aged 44 or
less, while the high income Maori sample contains only 36% of respondents aged 44 or less.
Further inspection reveals that while 34% of the high income European sample was aged 55 or
older, 0% of the high income Maori sample are aged 55 or older. To rectify this imbalance, all of
the high income European respondents aged 55 or older were removed from the sample, and a
random stratified sample was selected from the high income European group aged less than 55,
so that the high income European and Maori samples were similar in terms of age, gender and
level of education. As a result, the high income European sample contained 67% female
respondents, 54.7% of respondents who had a high school qualification or higher as their highest
qualification, and 73% of respondents aged 44 or lower. The corresponding percentages for the
high income Maori sample were 69% female respondents, 48% of respondents with a high
school qualification or higher as their highest qualification, and 71% of the sample aged 44 or
lower. On the dimensions of gender, age and levels of education, the high income Maori end
European samples are now essentially the same. The question asking the age of the respondent
required them to tick the appropriate box out of 12 choices (coded 1 to 12), with each box having
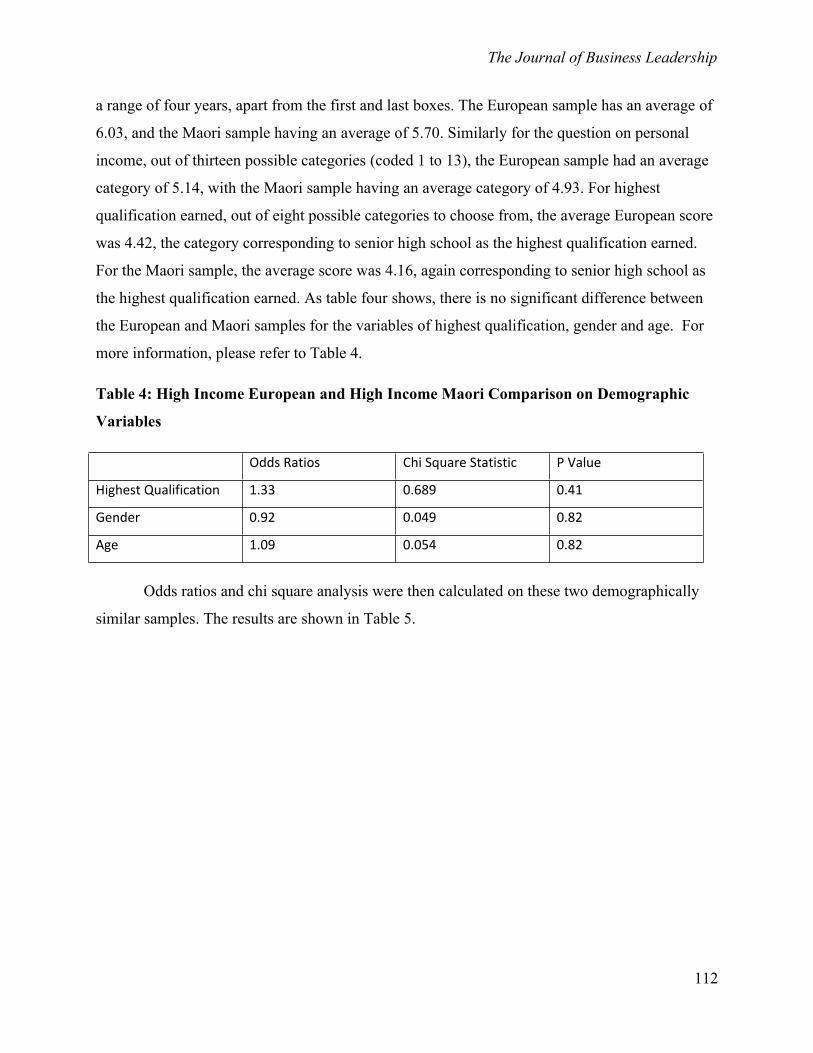
The Journal of Business Leadership
112
a range of four years, apart from the first and last boxes. The European sample has an average of
6.03, and the Maori sample having an average of 5.70. Similarly for the question on personal
income, out of thirteen possible categories (coded 1 to 13), the European sample had an average
category of 5.14, with the Maori sample having an average category of 4.93. For highest
qualification earned, out of eight possible categories to choose from, the average European score
was 4.42, the category corresponding to senior high school as the highest qualification earned.
For the Maori sample, the average score was 4.16, again corresponding to senior high school as
the highest qualification earned. As table four shows, there is no significant difference between
the European and Maori samples for the variables of highest qualification, gender and age. For
more information, please refer to Table 4.
Table 4: High Income European and High Income Maori Comparison on Demographic
Variables
Odds Ratios Chi Square Statistic P Value
Highest Qualification 1.33 0.689 0.41
Gender 0.92 0.049 0.82
Age 1.09 0.054 0.82
Odds ratios and chi square analysis were then calculated on these two demographically
similar samples. The results are shown in Table 5.

The Journal of Business Leadership
113
Table 5: High Income European and High Income Maori Comparison Accounting for Age,
Gender and Highest Qualification: Survey Categories
Odds Ratios
Chi Square Statistic P Value
Managing Risk 3.62 18.46 0.00
Saving 3.20 87.79 0.00
Budgeting 2.72 23.69 0.00
Money Management 2.51 101.40 0.00
Home/Loans Mortgages 2.35 57.90 0.00
Retirement Planning 2.27 25.47 0.00
Investing 2.16 57.45 0.00
Attitudes and Behaviours 1.80 83.13 0.00
Life Generally 0.52 8.93 0.00
Life Expectancy 1.52 4.00 0.05
Consumer Rights & Responsibilities 1.23 1.61 0.21
Goal Setting, Long Term Goals & Financial Planning 1.21 1.57 0.21
Debt Management 1.05 0.06 0.81
KiwiSaver 1.04 0.02 0.88
TOTAL 1.88 347.63 0.00
The first six question categories in the table all still have odds ratios greater than two,
although there has been some shuffling of the order within the eight compared to table three. In
terms of statistical significance, the life expectance category is now statistically significant at the
95% confidence interval, while the kiwisaver category is now no longer statistically significant.
Interestingly, for both tables three and four, there is a significant difference between the
European and Maori samples on their attitude to life generally, but it is in favour of the Maori
sample, with odds ratios of less than one indicating Maori are more likely to give favourable
responses than Europeans in terms of their attitude to life generally.
Table 6 uses the same data as for table five, but splits the data according to question type
as in table two above.
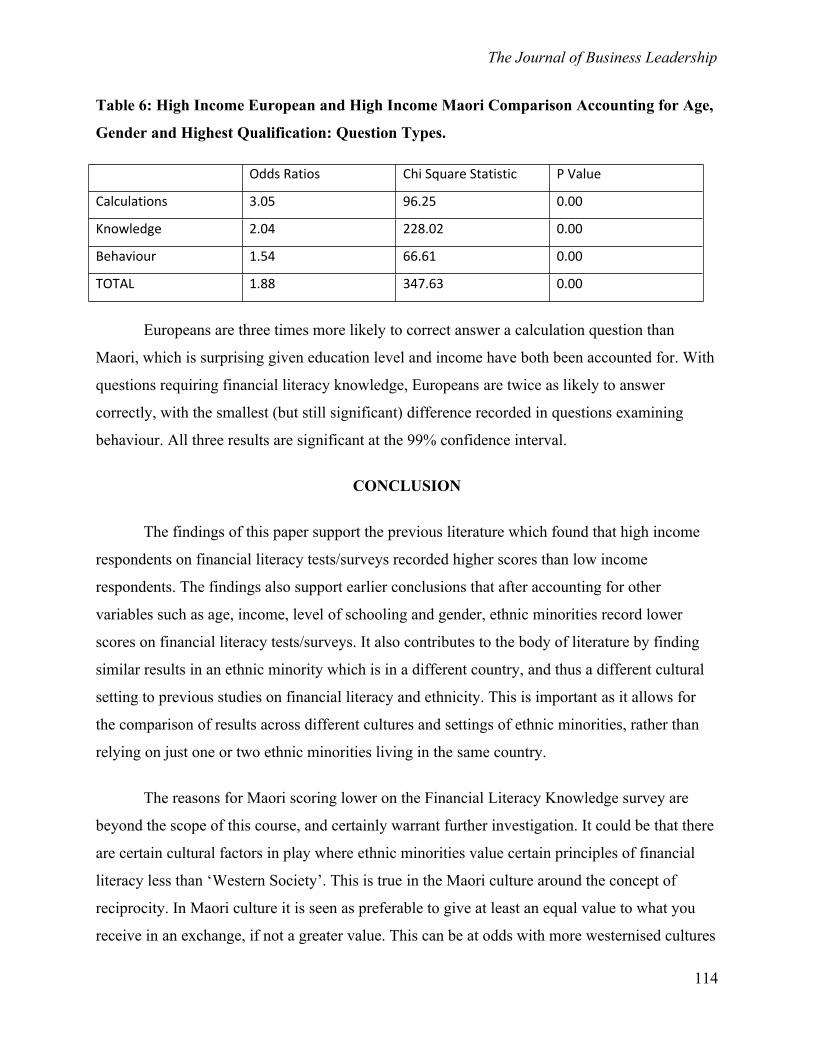
The Journal of Business Leadership
114
Table 6: High Income European and High Income Maori Comparison Accounting for Age,
Gender and Highest Qualification: Question Types.
Odds Ratios Chi Square Statistic P Value
Calculations 3.05 96.25 0.00
Knowledge 2.04 228.02 0.00
Behaviour 1.54 66.61 0.00
TOTAL 1.88 347.63 0.00
Europeans are three times more likely to correct answer a calculation question than
Maori, which is surprising given education level and income have both been accounted for. With
questions requiring financial literacy knowledge, Europeans are twice as likely to answer
correctly, with the smallest (but still significant) difference recorded in questions examining
behaviour. All three results are significant at the 99% confidence interval.
CONCLUSION
The findings of this paper support the previous literature which found that high income
respondents on financial literacy tests/surveys recorded higher scores than low income
respondents. The findings also support earlier conclusions that after accounting for other
variables such as age, income, level of schooling and gender, ethnic minorities record lower
scores on financial literacy tests/surveys. It also contributes to the body of literature by finding
similar results in an ethnic minority which is in a different country, and thus a different cultural
setting to previous studies on financial literacy and ethnicity. This is important as it allows for
the comparison of results across different cultures and settings of ethnic minorities, rather than
relying on just one or two ethnic minorities living in the same country.
The reasons for Maori scoring lower on the Financial Literacy Knowledge survey are
beyond the scope of this course, and certainly warrant further investigation. It could be that there
are certain cultural factors in play where ethnic minorities value certain principles of financial
literacy less than ‘Western Society’. This is true in the Maori culture around the concept of
reciprocity. In Maori culture it is seen as preferable to give at least an equal value to what you
receive in an exchange, if not a greater value. This can be at odds with more westernised cultures
The Journal of Business Leadership
115
where ‘getting a good deal’ may be emphasised. The extent that this cultural reason can be
applied across many different cultures around the world however is debateable. Another possible
reason for the difference in financial literacy levels of the different ethnic groupings is that in
each of their countries, there is some systemic failure in the ethnic minorities accessing financial
literacy information or education which is pertinent to them. One of the conclusions of Lusardi &
Mitchell (2007) for example was that “education programs will be most effective if they are
targeted to particular population subgroups” (p. 43). It may be that financial literacy information
and programs are designed for the ethnic majority by the ethnic majority, and are thus less
effective for, and seen as less relevant by ethnic minorities. The results of this paper do suggest
that it may not simply be a case of making financial literacy education more readily available for
ethnic minorities. There is however no intuitively obvious reason as to why Europeans are three
times more likely to answer a calculation question correctly than Maori. Further research into
comparisons between ethnic groupings for types of financial literacy questions, for example
calculations as opposed to knowledge recall is desirable, as would more qualitative research
examining the differences in belief systems pertaining to principles of financial literacy across
different cultures.
REFERENCES
Aizcorbe, A. M. , Kennickell, A. B. & Moore, K. B. (2003). Recent Changes in U.S. Family Finances: Evidence from the 1998 and 2001 Survey of Consumer Finances. Federal Reserve Bulletin, 89 (January), 1-32.
Bertaut, C & Starr-McCluer, M. (2001). Household Portfolios in the United States. Cambridge, Massachusetts: MIT Press.
Braunstein, S. & Welch, C. (2002). Financial Literacy: An overview of Practice, Research , and Policy. Federal Reserve Bulletin, November, 445-457.
Chen, H. & Volpe, R. (1998). An Analysis of Personal Financial Literacy Among College Students. Financial Services review, 7(2), 107-128.
Chen, H. & Volpe, R. (2002). Gender Differences in Personal Financial Literacy Among College Students. Financial Services Review, 11, 289-307.
The Journal of Business Leadership
116
Cole, S. & Shastry, G. (2007). It You Are So Smart, Why Aren’t You Rich? The Effects of Education, Financial Literacy and Cognitive Ability on Financial Market Participation. Working Paper, Harvard Business School.
Goldsmith, E. & Goldsmith, R. E. (1997a). Gender Differences in Perceived and Real Knowledge of Financial Investments. Psychological Report, 80, 236-238.
Goldsmith, E. & Goldsmith, R. E. (1997b). Sex Differences in Financial Knowledge: A Replication and Extension. Psychological Report, 81, 1169-1170.
Hong, H., Kubik, J. & Stein, J. (2005). Social Interaction and Stock-Market Participation. Journal of Finance, 49(1), 137-163.
Lusardi, A. & Mitchell, O. (2006). Financial Literacy and Planning: Implications for Retirement Wellbeing. Journal of Economics, (118), 815-842.
Lusardi, A. & Mitchell, O. (2007). Financial Literacy and Retirement Preparedness: Evidence and Implications for Financial Education Programs. Business Economics, January, 35-44.
Lusardi, A. & Mitchell, O. (2011). Financial Literacy and Planning: Implications for Retirement Wellbeing. Retrieved from http://www.nber.org/papers/w17078.
Perry, V & Morris, M. (2005). Who Is in Control? The Role of Self-Perception, Knowledge, and Income in Explaining Consumer Financial Behaviour. The Journal of Consumer Affairs, 39(2), 299-313.
Volpe, R. P., Chen, H. & Pavlicko, J. J. (1996). Investment Literacy Among College Students: A Survey. Financial Practice and Education, 6(2), 86-94.
Von Rooij, M., Lusardi, A. & Alessie, R. (2007). Financial Literacy and Stock Market Participation. Retrieved from http://www.mrrc.isr.umich.edu/publications/papers/pdf/wp162.pdf.
The Journal of Business Leadership
117
Altruism and the family business: A blessing or a curse?
George S. Vozikis, Edward Reighard and Robert Harper
Craig School of Business California State University, Fresno
"How selfish so every man may be supposed, there are evidently some principles in his nature, which interest him in the fortunes of others, and render their happiness necessary to him, though he derives nothing from it, except the pleasure of seeing it." Adam Smith, Theory of Moral Sentiments, 1759
ABSTRACTDespite the wide variety of papers and articles that have been written in the area of altruism in a Family Business, there are topics that have not been addressed by the current literature and may be considered in this paper as suggestions for future study and research. One such topic to consider may be the optimum level of altruism within family firms. While the literature addresses the negative and positive effects of altruism in family businesses such as in cohesion, participative decision making and conflict resolution, among others, it does not examine at which point altruism becomes a liability rather than an asset and how family firms can develop and maintain optimal altruistic levels. Examining how family firms can foster the right balance of altruism in order to minimize unfavourable outcomes and maximize its benefits can be considered a valuable contribution to the family business literature.
INTRODUCTION
In evolutionary biology, an organism is said to behave altruistically when its behaviour
benefits other organisms, at a cost to itself. The costs and benefits are usually measured in terms
of reproductive fitness. In nature, if the total contribution of the altruist to the fitness of others is
greater than the fitness lost by the altruist, altruism will increase the prospects of the group's
surviving in competition with other groups (Simon, 1993). According to this concept of Natural
Selection (Darwin, 1859) the process by which certain heritable traits become more common in a
population over successive generations, kin selection favors exhibiting behaviors that benefit
others who share our genes, especially closely related kin (McAndrew, 2002).
Unlike biological altruism however, which is more or less demonstrated as unconscious
behaviour, social altruism is a form of behaviour in which an individual places the needs or
benefit of another over the needs or benefit of the self, consciously. Quite similarly an
The Journal of Business Leadership
118
economist‘s perspective models altruism as a trait that positively links the welfare of an
individual to the welfare of others (Schulze et al., 2002b). More specifically, altruism is self-
reinforcing and motivated by self-interest because it allows the individual to simultaneously
satisfy altruistic (other-regarding) and egotistic (self-regarding) preferences (Schulze et al.,
2002a).
Altruism compels parents to care for their children, encourages family members to be
considerate of one another and makes family membership valuable in ways that both promote
and sustain the family bond (Simon, 1993; Eshel, et al., 1998). Furthermore, through altruism
parents transfer resources to their children not only because they love them but also because they
would otherwise harm their altruistic welfare (Becker, 1981).
Altruism is a notion rarely associated with the world of business because after all, the
game of business is played in a competitive arena where few might expect business people to be
altruistic (Kanungo & Conger, 1993). Yet, altruism in a family business is expected to play a
more important role altogether than in a “regular” business, because family members in a family
firm would engage in relatively more altruistic behaviors thereby suppressing their own self-
interests for the collective good of the family (Sharma, 2006). Family members of family firms
that are characterised as altruistic seem to also be more aligned with the success of the family
firm (Eddleston & Kellermans, 2007). In these firms family members are highly dedicated to the
business believing that they have a common family responsibility to see the business prosper
(Cabrera-Suarez et al., 2001).
But are family firms characterized by strong family altruism also directly associated to
specific business performance variables? Is altruism a good trait for the family business or is it
also related to adverse outcomes? Is there an optimum degree of altruism within a family
business?
The fascinating world of the theory of Natural Selection originating with Charles Darwin
who also advanced a synonym with the term “Survival of the Fittest” in his 1859 book “On the
origin of species by means of natural selection”, was further articulated into an Evolutionary
Theory with Richard Dawkins’ 1976 seminal book, “The Selfish Gene” where Dawkins (1976)
The Journal of Business Leadership
119
examined the impact (positive and negative) of selfish and altruistic behaviour on the evolution
of the species. It seems that it only makes sense to consider whether what is true for biological
organisms (Trivers, 1971) to be also true for economic organisms as well (Kanungo & Conger,
1993). Moreover, as Becker stated: “If I am correct that altruism dominates family behaviour,
perhaps to the same extent as selfishness dominates market transactions, then altruism is much
more important in economic life than is commonly understood.” (Becker, 1981).
The flourishing of humanity and the human mind implies that human psychology is
different from that of other species and one manifestation of that difference is the manifestation
of conscious extreme altruism, as opposed to subconscious in other species. In this sense, the fact
that people deliberately and willingly undertake the heroic sacrifice of laying down their lives in
order to preserve close relatives in the context of warfare for example, it makes evolutionary
sense, since an individual’s genes could still be passed through the surviving members of a close
knit family or a clan (The Economist, 2012). Therefore, since altruism strongly characterizes
family relationships (Stark, 1989) and the fact that family business is the most prevalent form of
business organization in the world (Schulze, et al., 2000), altruism as a “combination” of science
and business was deemed a worthwhile topic to investigate and furthermore examine whether
altruism as a commodity is a blessing or a curse in the family-owned business.
ALTRUISM IN FAMILY FIRMS
Altruism in family firms is a subject that has been studied extensively in the last couple
of decades. It is of relevance at this point to indicate that Family Business was recognised in
1986 by the Family Firm Institute (FFI) for their multidisciplinary nature with major content
areas included such as, behavioral sciences, financial, law and management sciences (Hoy &
Sharma, 2006). Thus, the literature review on altruism for this paper included sources from many
international journals of multiple disciplines. Most of this research is not experimental, but it is
rather based on the principles of the grounded theory (Martin et. al., 1986), an analytical
approach to which theories are allowed to emerge from existing concepts, notions, and
observations, as opposed to formulated hypotheses which are empirically tested against actual
data. Rather, non-empirical theoretical concepts are based (grounded) on observable experiences
and researchers add their own insight into why those experiences exist. Grounded theory is in

The Journal of Business Leadership
120
essence a reverse-engineered hypothesis, and this type of grounded theory is the prevalent type
of literature review sources on altruism across disciplines.
Family firms are theoretically distinct from non-family firms because the agency
relationships in family firms are characterized by parental altruism (Lubatkin et al., 2005), a trait
that positively links a parent’s welfare to that of their children (Stark, 1995). Parental altruism
fosters loyalty, commitment trust, communication, cooperation and reciprocity (Simon, 1993),
and it can promote a family bond, which, in turn, helps to align incentives and reduce
information asymmetries among a firm’s key decision makers, thereby reducing the cost of
governance (Lubatkin et al., 2005). It is quite obvious that altruism in the family and thereby
spilled over into the family firm is beneficial. Is however too much altruism harmful? Does an
extraordinary consciousness by all family members of the need for a continuous and obligatory
sacrifice for the rest of the family members no matter what, renders the family firm dysfunctional
and low performing at the long term detriment of family members? The sections that follow
presents both sides of this argument, through an extensive literature review of both positive and
negative features of altruism suggesting that altruism in family firms may be a “two-edged
sword” (Dyer, 2003).
Altruism as a blessing
Altruism makes each employed family member a family agent in the essence of the
agency theory of the firm, and a de facto owner of the firm, in the sense that each member acts in
the belief that they have a residual claim on the family’s estate (Stark & Falk, 1998). At the same
time, each member of an altruistic family is partly “insured” because all other members are
induced to bear some of the business burden (Becker, 1981). As per the agency theory, this
aligns the interests among family member/agents towards growth, opportunity and risk (Shulze
et al., 2002).
Similarly, according to the stewardship theory (Davis et al., 1997) when family members
consider themselves stewards of the family firm, they are motivated to fulfill organizational
goals and to maximise firm performance and at the same time indirectly, by acting in the
organization’s best interest, maximize their own utility. Moreover, altruism in family firms is
The Journal of Business Leadership
121
expected to reinforce the interdependence of family members and encourage them to place the
firm’s objectives ahead of their own (Zahra, 2003). Such altruistic families are characterized by
the possession of collectivist orientations that encourage family members to exercise self-
restraint and consider any potential negative effect of their actions on the family firm
(Kellermanns & Eddleston, 2004; Corbetta & Salvato, 2004). Additionally, a high degree of
altruism influences individual conduct in family firms and helps strengthen family bonds,
becoming thus an important inhibitor of dysfunctional relationship conflict in family firms, while
at the same time, altruism enhances the participative strategy process within a family firm and an
important source of competitive advantage (Eddleston & Kellermans, 2007). Similarly,
according to Zahra (2003), altruism encourages family members to work closely together in
defining the family firm’s mission, craft its strategy and develop effective ways of achieving its
objectives. Furthermore, the intimate knowledge about each other that families bring to the
family firm facilitates communication and some types of decision-making (Gersick et al., 1997).
In contrast, when altruism is low, family members may lack commitment and a psychological
ownership to the firm (Zahra, 2003).
As such, the existence or the absence of altruism may explain why in some family firms
members are able to successfully work together and run a business, while in others, family
members are loaded with animosity that can deteriorate firm performance (Eddleston &
Kellermans, 2007).
Altruism as a curse
Despite the aforementioned arguments that advocate the benefits of altruism, it has also
been observed that altruism does in fact have a dark side in that it can give both parents and
children incentives to take actions that can threaten the welfare of the family and the firm alike
(Schulze et al., 2003), especially when there is very little or no empathy whatsoever between
parents and offspring (Vozikis et al., 2012). Due to the fact that the altruistic bond between
parents and children is stronger than between unrelated individuals, this can lead to especially
high agency costs that are quite distinct, such as information asymmetries, and significantly
complicate firm governance, because they can cause parents to threaten their children with guilt
trips and inner moral hazards (Lubatkin et al., 2005; Schulze et al., 2002).
The Journal of Business Leadership
122
According to Buchanan’s theorem “The Samaritan’s Dilemma” (1975) since altruism
partly stems from a parent’s endogenous co-dependency with his/her children and the children’s
desire to enhance their own welfare, parents have the incentive to become too generous and spoil
their children putting their own interests second, and take actions that, however innocent the
parental intent may be, encourage the children to free-ride, shirk and/or remain dependent upon
their parents. The children often do not appear to appreciate these transfers, but instead view
them as entitlements thus giving them a powerful incentive to continue a manipulative behavior.
Likewise, similar dysfunctional parental attitudes and behaviors, such as stereotyping or
preferential treatment, can foster hostile sibling rivalries in childhood. This happens because
children develop feelings of competitiveness over parental love and attention and resentfulness,
if they do not get their way, further eroding altruistic behaviors within the family (Avloniti et al.,
2012). Thus, parents can provide their children consciously or subconsciously enticements to
take actions or make decisions that may ultimately harm their own welfare, and as a
consequence, the children become the masters of their parents. Buchanan (1975) theorized that
agency problems between parents and children arise as their respective levels of altruism become
asymmetric. In this respect, altruism becomes a curse because it can make even well-intended
parent-owners bad agents since it is their attempt to enhance family welfare that increases the
threats of moral hazard for their offspring. This situation makes the introduction of formal
governance practices, instead of mere informal governance by the family, absolutely necessary
(Schulze et al., 2002).
Altruism may also hamper the parent’s perception about their children which may hinder
their ability to monitor and discipline them (Buchanan, 1975) and/or employ them in positions
for which they are not best qualified (Schulze et al., 2003). Thus, nepotism, together with the fact
that parent-owners are less willing to offer certain promotional opportunities to non-family
agents who are much more qualified, because selection criteria are based on family status rather
than the agents’ qualifications. This leads to altruistic bias and puts the family firm at a
competitive disadvantage in the external labor market, while further introducing an adverse
selection in the internal labor market leading ultimately to the appointment of lower-quality
agents within the family firm (Lubatkin et al., 2005). In addition, due to control over the firm’s
resources, parent-owners can be unusually generous to their children and relatives, providing the
The Journal of Business Leadership
123
family both with secure employment and privileges that they would not and probably should not
otherwise receive (Gersick et al., 1997). Both adverse selection and increased costs in the form
of compensation packages can threaten the performance of family firms and their long-term
prosperity. Moreover, as similar compensation and reward mechanisms are not necessarily
offered to non-family agents, this may lead to lower commitment and increase in the likelihood
of opportunism on the part of the non-family agents by seeking employment elsewhere (Chua et
al., 2009).
CONCEPTUAL FRAMEWORK
As mentioned earlier, altruism is found to be more often and at higher levels within
family firms rather than larger and/or non-family firms, and this mere fact is believed to
influence a number of important business variables as cited in literature presented earlier. These
particular business related variables that are specifically idiosyncratic to family businesses and
are mostly affected by the existence or absence of the notion of altruism are described below.
Role of altruism in cohesion among family business members
Cohesion among family members of a family firm is considered a major factor for a
successful family business (Lansberg & Astrachan, 1994). Lack of cohesion within family agents
prompts them to operate under an individualistic paradigm and may result in detrimental
consequences both to the business and to the family. We propose that there is a strong correlation
between the existence or absence of altruism and the existence or absence of cohesion in family
businesses.
Role of altruism in participative decision making
Participative decision making is one of the key concepts in modern firms. If utilized
effectively it can be an important asset and motivating tool for a firm and may result in a unique
competitive advantage. We propose that the existence or absence of altruism in family businesses
is a determining factor for the existence of family firm’s participative decision making style or
lack thereof, something that has already been identified in the literature (Eddleston &
Kellermanns, 2006).

The Journal of Business Leadership
124
Role of altruism in conflict intensity
Conflict is endemic in everyday business environments. It can be defined as clash of
interests, as an actual or perceived opposition of needs and values, and when it reaches
considerably high levels can lead to serious problems for the business. We wish to ascertain that
the level of existing altruism in a family firm might be a key determining factor for the intensity
of prevailing conflict. Existing literature already suggests that such a correlation does exist
(Eddleston & Kellermanns, 2006).
Role of Altruism in the “Long – Term Perspective”
Any company that has successfully stood the test of time and survived has indeed much
to be admired. To be successful in the long-run, family business owners need to have a long–
term perspective. We propose that the degree of altruism within a family firm correlates with the
nature of strategic perspective within the firm, where a high degree of altruism most likely
spawns a long–term perspective and as such the viability of a family business for years to come,
while a low degree of altruism most likely results in a short and “now” strategic perspective for
the family firm.
RELATIONSHIPS AMONG CONCEPTS AND VARIABLES
Following the above identification of the concepts and variables we wish to focus upon
our major quest which is to relate and define the correlation between the existence and the level
of Altruism in a family firm as an independent variable and Cohesion, Participative Decision
Making, Conflict Intensity, and Long–Term Perspective as intervening variables, which in turn
will affect the family firm’s overall performance. Certainly, existing levels of altruism will have
an impact on other business variables too but the main focus of this paper is on Cohesion,
Participative Decision Making, Conflict Intensity, and Long–Term Perspective, for internal
validity purposes. We also need to mention at this juncture, that these intervening variables are
quite possibly expected to influence each other, a fact that needs to be incorporated in the
conceptual framework. The specific conceptual framework that will connect all variables and
concepts outlined above is depicted in a schematic way below in Exhibit 1.
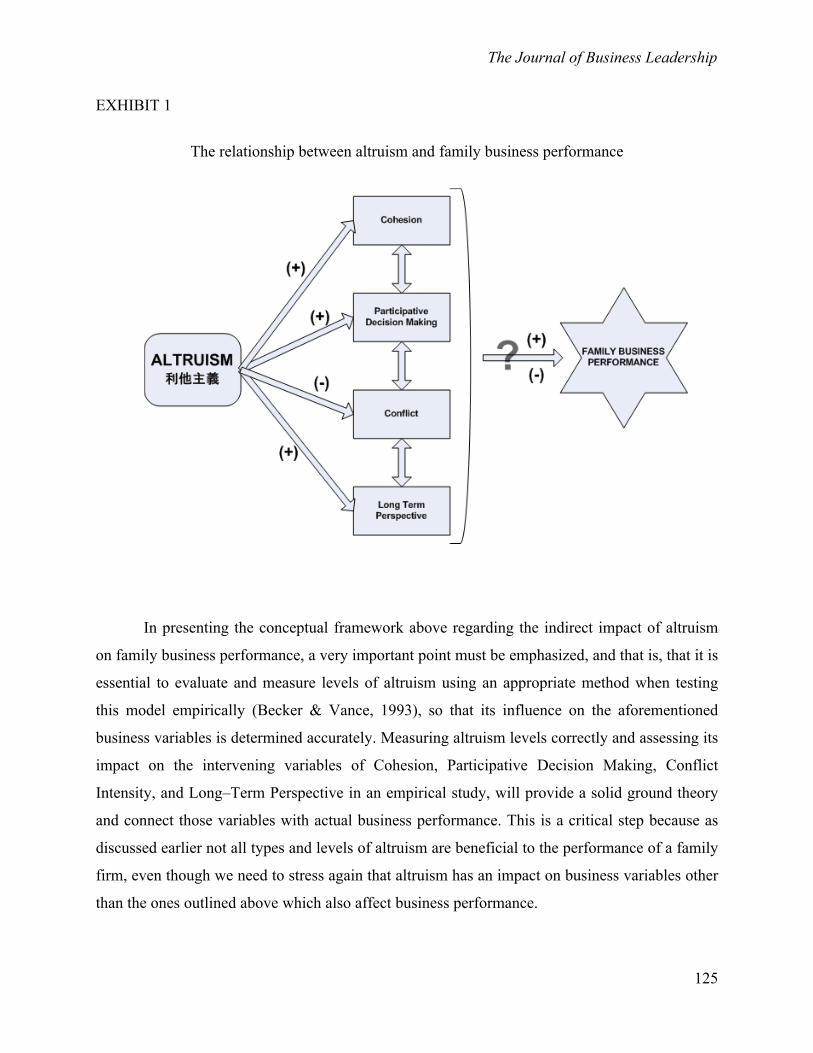
The Journal of Business Leadership
125
EXHIBIT 1
The relationship between altruism and family business performance
In presenting the conceptual framework above regarding the indirect impact of altruism
on family business performance, a very important point must be emphasized, and that is, that it is
essential to evaluate and measure levels of altruism using an appropriate method when testing
this model empirically (Becker & Vance, 1993), so that its influence on the aforementioned
business variables is determined accurately. Measuring altruism levels correctly and assessing its
impact on the intervening variables of Cohesion, Participative Decision Making, Conflict
Intensity, and Long–Term Perspective in an empirical study, will provide a solid ground theory
and connect those variables with actual business performance. This is a critical step because as
discussed earlier not all types and levels of altruism are beneficial to the performance of a family
firm, even though we need to stress again that altruism has an impact on business variables other
than the ones outlined above which also affect business performance.
The Journal of Business Leadership
126
RESEARCH PROPOSITIONS
Based on the previous discussion on the concept of altruism and the four intervening
variables of Cohesion, Participative Decision Making, Conflict Intensity, and Long–Term
Perspective it affects directly, as well as the proposed conceptual framework where it is shown
that altruism affects the family business performance indirectly, the following Research
Propositions are formulated:
Research Proposition 1: The existence and high levels of Altruism in a family firm
is more likely to be positively correlated to high levels of Cohesion among family members.
It is intuitively expected that increased levels of altruism will also increase cohesion
among family members. Alternatively, absence or decreased levels of altruism is expected to
decrease cohesion among family members in a family firm. Altruism guides a family’s primary
social function, which is in essence to ensure the care and nurturing of its members (Lansberg,
1983). Altruism encourages family members to be considerate of one another, and cultivates
loyalty and commitment to a firm’s leadership (Eshel et al., 1998; Simon, 1993; Ward, 1987),
thus fostering cohesion.
It is expected of course that the degree and level of altruism varies among families hence
families differ in their level of cohesion and strength of bonding among its members. High
degrees of altruism influence individual conduct in family firms and help strengthen family
bonds, and depending on the degree of the cohesion, a more individualistic or collectivistic
orientation will be favored within the family. Indeed, connected and cohesive families have a
more collectivistic orientation (Lansberg & Astrachan, 1994). In a collectivistic family,
interactions are characterized by reciprocity of altruism, which links each family member’s
welfare to that of other family members (Ling et al., 2002; Schulze et al., 2002)
In contrast, families that are not as cohesive tend to function under an individualistic
paradigm (Lansberg & Astrachan, 1994). In an individualistic family altruism is not necessarily
reciprocal. Therefore the likelihood that some family members will take advantage of another

The Journal of Business Leadership
127
family members’ altruism, especially the patriarch or matriarch owner’s altruism toward other
family members, increases (Schulze et al., 2002). In this scenario, self-interest takes precedent
over the overall interest of the firm and relationship conflict among family members can
escalate. Therefore, if altruism is not reciprocal, the utility functions of the individual family
members differ and the likelihood of opportunistic behavior (Ling et al., 2002) and subsequent
family cohesion decreases.
Research Proposition 2: The existence and high levels of Altruism in a family firm
is more likely to be positively correlated to high levels of Participative Decision Making among
family members.
The existence of high levels of altruism will most likely result in a higher degree of
participative decision making in a family business, while the absence or low levels of altruism
could hold back participative decision making. This is because altruism enhances family
involvement and willingness to participate in the family firm’s affairs (Zahra, 2003). A highly
altruistic family firm is likely to have an involvement oriented organizational culture (Corbetta &
Salvato, 2004) that can also be described as collectivistic (Kellermanns & Eddleston, 2004). This
collectivistic culture (Davis et al., 1997) should in turn lead to cooperation and collaboration in
the firm's decision-making processes (Zahra, 2003). In collectivistic cultures, “the belief is that
only through joint effort can the best solutions be identified and tested” (Zahra et al., 2004). That
is, the strong bonds of trust and a sense of loyalty and responsibility which are associated with
altruism (Kepner, 1991) should encourage participative decision making. Indeed, Zahra S.A.
(2003) argued that altruism encourages family members to work closely together to specifically
define the firm's mission, craft its strategy and develop effective ways to achieve its objectives.
Contrary to the above, lack or low levels of altruism can lead to the pursuit of individual
goals with little regard for collective utility (Gersick et al., 1997). When altruism is low, family
members may lack the commitment and psychological ownership to the firm (Zahra, 2003),
thereby preferring to withdraw and not show interest in the firm's decision-making process.
Indeed, research suggests that a lack of altruism may endanger the family’s bonds and hinder
decision-making and communication within the family firm (Gersick et al., 1997; Lubatkin et al.,
2005).
The Journal of Business Leadership
128
Research Proposition 3: The existence and high levels of Altruism in a family firm
is more likely to be negatively correlated to high levels of Conflict intensity among family
members.
The existence of high levels of altruism will most likely also result in a lower degree of
conflict intensity in a family business, while the absence or low levels of altruism could
definitely constitute grounds for levels of conflict to increase within the family and the family
firm. As mentioned earlier, the existence of any type of relationship conflict among family
members is strongly influenced by the existence or absence of altruism, and this is a key
characteristic that distinguishes family firms from non-family firms (Ling, 2001). Family firms
that are characterized as highly altruistic may have an advantage because family member
interests are more aligned with the overall success of the family firm. In such highly altruistic
family firms members are highly dedicated to the business and they believe that they have a
common family responsibility to see the business prosper (Cabrera-Suarez et al., 2001) and
ensure the continuation of the family’s and the family firm’s legacies. Altruism appears to
promote the family bond by fostering loyalty, interdependence and commitment to the family's
long term prosperity (Ward, 1987).
However, since the degree of altruism varies greatly among families, there are differences
in their level of cohesion and strength of bonding (Lansberg & Astrachan, 1994). In family firms
with a high level of altruism, communication and cooperation can be expected to be high (Daily
& Dollinger, 1992; Simon, 1993) and this reinforces family member interdependence and
encourages them to place the family firm's objectives ahead of their own (Zahra, 2003). This
sense of commitment to the family as well as to the firm may help family members get along and
cooperate and consequently try to avoid conflict at all costs.
Indeed, research has shown that a high degree of altruism influences individual conduct
in family firms and helps strengthen family bonds (Corbetta & Salvato C., 2004). As such,
altruism may reduce relationship conflict in family firms (Kellermanns & Eddleston, 2004).
Relationship conflict is a dysfunctional form of conflict that includes affective components like
annoyance, frustration, personal animosity, incompatibility and irritation of others (Jehn &
Mannix, 2001; Simons & Peterson, 2000). Moreover, relationship conflict is emotionally
The Journal of Business Leadership
129
charged and includes interpersonal clashes characterized by anger, resentment and worry
(Johnson & Ford, 2000). Research has also shown that cohesive top management teams
experience the least amount of relationship conflict (Ensley & Pearce, 2001) because cohesive
teams are more trusting, less suspicious and have cooperative group norms (Ensley et al., 2002).
In contrast, when altruism is absent or at low levels, self-interest takes precedent over the
interests of the firm and the likelihood of opportunistic behavior rises (Ling et al., 2002) making
relationship conflict and overall conflict intensity more likely. Such self-interested behavior is
clearly detrimental to the family-business system (Daily & Dollinger, 1992).
Research Proposition 4: The existence and high levels of Altruism in a family firm
is more likely to be positively correlated to high levels of a Long–Term Perspective among
family members.
The existence of high levels of altruism propagates a positive effect on long–term
perspective of family members in a family business while the absence or low levels of altruism
could definitely generate a “now” orientation among the family members and within the family
firm. According to Steier (2003) the rationalities driving the governance structures of family-
financed ventures are located on a continuum, with familial altruism potentially playing a major
role in promoting particular ways of organizing, wherein economic gain in the short run is not
always the primary motive. The structure of financial deals involving family members has a
priori long-term implications for survival and success of the family business venture as well as
the family’s well-being.
Furthermore, fast-growing, high-performing family firms encourage participation in
developing long-term goals and strategies and they tend to share them with both family and non-
family employees on a regular basis (Upton et al., 2001). By encouraging moderate levels of task
conflict with the common denominator of a long-term perspective, family firms garner the
commitment of firm members to the agreed upon strategies and they improve the quality of their
decision making. Indeed, through discussion and communication, the significance and relevance
of the issues at hand are increased simply by calling attention to their implications for the long
run (Salancik & Pfeffer, 1978).
The Journal of Business Leadership
130
As mentioned above, altruism is also positively related to a participative strategy process
in family firms (Eddleston & Kellermans, 2007). In altruistic family firms, members are highly
dedicated to the business and members believe that they have a common family responsibility to
see the business prosper (Cabrera-Suarez et al., 2001), by fostering loyalty, interdependence and
commitment to the family's long term prosperity (Ward, 1987). Working closely together to
define the firm's mission, formulate its strategy and develop effective ways to achieve its
strategic objectives as Zahra (2003) advocates, family members participate in the strategy-
making process a task that may be particularly important for family firms because in order for
family firms to remain successful, new strategies most likely should be generated for every
generation that joins the business (Post, 1993).
In contrast, lack or low levels of altruism can lead to the pursuit of individual goals with
little regard for the collective utility as Gersick et al. (1997) observed. When family firms do not
encourage a long run perspective their overall performance may suffer, and they may fail to
develop new strategies and transfer key knowledge, experience and core capabilities to the newer
generations, which could ultimately hurt their performance in the future (Cabrera-Suarez et al.,
2001).
CONCLUDING REMARKS
Altruism is a trait that positively links the welfare of an individual to the welfare of
others. It is self-reinforcing and motivated by self-interest because it allows the individual to
simultaneously satisfy altruistic (other-regarding) and egotistic (self-regarding) preferences
(Schulze et al. 2002a). Within a family this applies to the parent-child relationship and this is
manifested amply in a family business setting when the parents transfer resources to their
children both because they love them but also to prevent harming their altruistic welfare (Becker,
1981). This way, as parental altruism promotes family bonds but it also helps to align incentives
for the offspring to contribute to the success and survival of the family firm. An analysis of three
generations in an empirical study showed that in both the US and Britain the effect of high
income in one generation lasts for at least two more because the positive consequences of a
family’s history of altruistic behavior toward the children persists over time (The Economist,
2013) The existence or absence of altruism may thus explain why in some family firms
The Journal of Business Leadership
131
members are able to successfully work together and run a business, while in others family
members are filled with animosity and conflict intensity that deteriorates family business
performance (Eddleston & Kellermans, 2007).
There has been an abundance of studies on altruism and our extensive literature review
pointed to the fact that altruism is a “two-edged sword” (Dyer, 2003) which can generate both
positive and negative consequences and outcomes within a family-owned firm. Therefore,
altruism should not be blindly promoted or suppressed in a family business as long as it remains
at reasonable levels because altruism may have a positive impact on business performance. It is
of interest to note that altruism has been shown to facilitate the beginning phases of
entrepreneurship like the start-up and initial market entry phases, but it can become a liability
during the later phases of entrepreneurship stages of development (Schulze et al., 2002b).
Nevertheless, based on the literature we have ascertained that most likely, there is a positive
relationship between altruism and cohesion among family members within a family business;
between altruism and participative decision-making among the family members; and between
altruism and a long-term perspective for the future of the family firm. However, we also
ascertained that there is a negative relationship between altruism and conflict intensity among
family members. We presented these theoretical positions in a conceptual framework connecting
the relationships between altruism and the variables above and we developed research
propositions that could empirically test these relationships and develop grounded theory for solid
theoretical implications.
The conceptual framework presented here however, has also practical implications for
family businesses. First of all, owners and managers must realize the importance of existing and
increased levels of altruism in family firms. They must become accustomed to the idea that
altruism is not just a theoretical notion, but it strongly influences not only family variables in a
family firm, but also specific important business variables and ultimately business performance.
It is recommended that both family and non-family members in a family business recognize the
importance of altruism not only for the present but also for the future welfare of both the family
and the family firm. Furthermore, they would benefit from a solid understanding of the positive
relationship between altruism and family cohesion, participative decision making, and a long-
term perspective for the family firm, as well as, of the negative relationship between altruism and
The Journal of Business Leadership
132
conflict intensity within the family and the family firm. This could facilitate decision-making
capabilities and assist the family firm in avoiding pitfalls, as well as enhancing its ability to trace
and confront any emerging problems derived from family-specific characteristics and aspects
that may affect the family business earlier and faster. It may also prove important for many
family firms to get into the process of somehow appraising and rating existing levels of altruism
within the business by using methods similar to those proposed by Becker & Vance (1993).
Documenting and detailing the current status in terms of levels of altruism could potentially
assist owners and managers with the help of experts to identify areas where improvement is
likely, realistic, and practicable.
However, there are some limitations in our conceptual framework. First and foremost, the
most important limitation of this paper’s thesis is the fact that the conceptual framework and the
research propositions presented here were based on results of previous research studies that we
attempted to connect and expand in a grounded theory mode. In order to support the main thesis
of the conceptual framework empirical research would be required. The second important
limitation of the findings is the fact that we only focused on the relationship between altruism
and four specific business variables that were believed to be affected by altruism, namely,
Cohesion, Participative decision making, Conflict intensity and Long-term perspective and their
subsequent impact on family business performance. It is fundamental to note that many other
family and family firm variables may be deemed as impacted by altruism and themselves
impacting in turn business performance. Finally, it is quite possible that the four intervening
variables impacted by altruism are not independent of each other. The latter however, is beyond
the scope of this paper and we propose that it should be empirically investigated in future
research.
We believe that the topic of altruism in family businesses is a very promising one for
future research considerations. Researchers might consider revisiting the concept of altruism in a
family business setting to a greater extent, and examine its impact on behavioral and business
variables as it ultimately affects business performance as a final step. It would also be interesting
to investigate whether there are significant cultural differences among peoples and cultures as far
as the understanding and the impact of altruism on family and family business relationships are
concerned, and if these differences are a determining factor for family business performance
The Journal of Business Leadership
133
within that cultural setting. For example, researchers might consider examining levels of altruism
within family businesses in China and other emerging markets, especially since entrepreneurial
orientation through family business formats is exploding there and cultural ties in these societies
are very strong, but the level of professionalism in business dealings is still low.
Finally as discussed earlier, a very interesting topic for future research would be to
attempt to identify the optimum level of altruism in a family firm, taking into account the
maturity level of the firm, its stage of organizational cycle, its professionalization phase, its size,
its specific external business environment, and the sector within which it operates. Moreover,
whereas extensive research on altruism has been performed with respect to parent-owners and
their children, the consequences and impacts of altruism between family member-owners and
more distant relatives or key non-family business employees have yet to be investigated.
Addressing such an issue would help determine the true value of having family and/or non-
family members in the top management ranks of the family business. Finally, research that
directly relates altruism and business performance instead of indirectly has not been undertaken.
Since scales to measure the degree and the level of altruism already exist, such as the adapting
scale developed by Becker & Vance (1993), the measurement of the impact of the direct
relationship between altruism and business performance without going through any intervening
variables is possible and constitutes a quite promising topic of future research on altruism and its
impact on family businesses.
REFERENCES
Avloniti, A., Iatridou, A., Kaloupsis, I. & Vozikis, G.S. 2012. Sibling rivalry and intergenerational succession in family business: A theoretical perspective. Proceedings of the Western Division of the Decision Sciences Institute, ISSN 1098-2248: 287-292.
Becker, G.S. 1981. Altruism in the Family and Selfishness in the Market Place. Economica, 48 (189): 1-15.
Becker, T.E., & Vance, R.J. 1993. Construct validity of three types of organization citizenship behavior: An illustration of the direct product model with refinements. Journal of Management, 19 (3): 663-682.
Buchanan, J. M. 1975. The Samaritan’s dilemma. In E. S. Phelps (Ed.). Altruism, morality and economic theory: 71–85. New York: Russell Sage Foundation.
The Journal of Business Leadership
134
Cabrera-Suarez, K., Saa-Perez, P.D., & Almeida, D.G. 2001. The succession process from a resource- band knowledge-based view of the family firm. Family Business Review, 14(1): 37–47.
Chua, J. H., Chrisman, J.J. & Bergiel, E.B. 2009. An Agency Theoretic Analysis of the Professionalized Family Firm. Entrepreneurship Theory and Practice. 33, (2): 355-372.
Corbetta, G. & Salvato, C., 2004. Self-serving or self-actualizing? Models of man and agency costs in different types of family firms: a commentary on “Comparing the agency costs of family and non-family firms: conceptual issues and exploratory evidence”. Entrepreneurship Theory and Practice 28 (4), 355–362.
Daily, C.M. & Dollinger, M.J., 1992. An empirical examination of ownership structure in family and professionally managed firms. Family Business Review, 5(2), 117–136.
Darwin, C., 1859. On the Origin of Species by Means of Natural Selection, London: John Murray
Davis, J.H., Schoorman, F.D., Donaldson, L. 1997. Toward a stewardship theory of management. Academy of Management Review 22 (1), 20–47.
Dawkins, R. 1976. The Selfish Gene, Oxford: Oxford University Press
Dyer Jr., W.G. 2003. The family: The missing variable in organizational research. Entrepreneurship Theory and Practice, 27 (4): 401–416.
Eddleston, K.A., Kellermanns, F.W. 2007. Destructive and productive family relationships: A stewardship theory perspective. Journal of Business Venturing 22: 545–565
Ensley, M.D. & Pearce, C.L. 2001. Shared cognition in top management teams: Implications for new venture performance. Journal of Organizational Behavior, 22: 145–160.
Ensley, M.D., Pearson, A.W., & Amason, A.C. 2002. Understanding the dynamics of new venture top management teams: Cohesion, conflict and new venture performance. Journal of Business Venturing, 17: 365–386.
Eshel, I., Samuelson, L. & Shaked, A. 1998. Altruists, egoists, and hooligans in a local interaction model. American Economic Review, 88(1): 157–179.
Gersick, K.E., Davis, J.A., Hampton, M.M., Lansberg, I., 1997. Generation to generation: life cycles of the family business. Boston, MA: Harvard Business School Press.
Hoy, F. & Sharma, P. 2006. Navigating the family business education maze. Handbook of research on family business. Handbook of Research on Family Business, Northampton, MA: Edward Elgar Publishing.
The Journal of Business Leadership
135
Jehn, K.A. & Mannix, E.A. 2001. The dynamic nature of conflict: A longitudinal study of intragroup conflict and group performance. Academy of Management Journal, 44 (2): 238–251.
Johnson, C. & Ford, R. 2000. Emotional reactions to conflict: Do dependence and legitimacy matter?. Social Forces, 79 (1): 107–138.
Kanungo, R.N. & Conger, J.A. 1993. Promoting altruism as a corporate goal. The Academy of Management Executive, 7 (3): 37-48.
Kellermanns, F.W. & Eddleston, K. 2004. Feuding families: when conflict does a family firm good. Entrepreneurship Theory and Practice, 28 (3): 209–228.
Kepner, E. 1991. The family and the firm: A coevolutionary perspective. Family Business Review, 4: 445–461.
Lansberg, I.S. 1983. Managing human resources in family firms: The problem of institutional overlap. Organizational Dynamics, 12: 39–46.
Lansberg, I. & Astrachan, J.H. 1994. Influence of family relationships on succession planning and training: The importance of mediating factors. Family Business Review, 7 (1): 39–59.
Ling, Y. 2001. Work-Family Conflict in Contemporary China: Beyond an American-Based Model, International Journal of Cross Cultural Management 1 (3): 357-373.
Ling, Y., Lubatkin, M. & Schulze, B. 2002. Altruism, utility functions and agency problems at family firm. In: Galbraith, C.S. (Ed.), Strategies and organizations in transition: 171–188. Kidlington, UK: Elsevier Science Ltd.
Lubatkin, M.H., Schulze, W.S., Ling, Y., & Dino, R.N. 2005. The effects of parental altruism on the governance of family-managed firms. Journal of Organizational Behavior, 26: 313–330.
Lubatkin, M.H., Durand, R. & Ling Y. 2007. The missing lens in family firm governance theory: A self-other typology of parental altruism. Journal of Business Research, 60: 1022–1029.
Martin, P.Y. & Turner, B. A. 1986. Grounded Theory and Organizational Research. The Journal of Applied Behavioral Science, 22 (2): 141.
McAndrew, F.T. 2002. New evolutionary perspectives on altruism: Multilevel selection and costly signaling theories. Current Directions in Psychological Science, 11 (2): 79-82
Post, J.E., 1993. The greening of the Boston Park Plaza Hotel. Family Business Review, 6 (2): 131–148.

The Journal of Business Leadership
136
Salancik, G.R. & Pfeffer, J. 1978. Asocial information processing approach to job attitudes and task design. Administrative Science Quarterly, 23: 224–253.
Samir, O. 2008. Biological altruism, Stanford Encyclopaedia of Philosophy.
Schulze, W.S., Lubatkin, M.H., Ling, Y., & Dino, R.N. 2000. Altruism and Agency in Family Firms. Academy of Management Proceedings, OMT: I1.
Schulze, W.S., Lubatkin, M.H., Ling, Y., & Dino, R.N. 2002a. For love and money: Altruism and agency in private and family owned and managed firms. Working Paper, Case Western University.
Schulze, W.S., Lubatkin, M.H., & Dino, R.N. 2002b. Altruism, agency, and the competitiveness of family firms. Management and Decision Economics, 23 (4,5): 247–259.
Schulze, W.S., Lubatkin, M.H., & Dino, R.N. 2003. Toward a theory of agency and altruism in family firms. Journal of Business Venturing. 18: 473–490.
Sharma P., 2006. An overview of the field of business studies: current status and directions for the future. Handbook of Research on Family Business, Northampton, MA: Edward Elgar Publishing.
Simon, H. A. 1993. Altruism and economics. American Economic Review, 83: 156–161.
Simons, T.L. & Peterson, R.S. 2000. Task conflict and relationship conflict in top management teams: The pivotal role of intragroup trust. Journal of Applied Psychology, 85(1): 102–111.
Stark, O. 1989. Altruism and the quality of life. American Economic Review, 79 (2): 86-90.
Stark, O. 1995. Altruism and beyond: An economic analysis of transfers within families and groups. Cambridge, U.K.: Cambridge University Press.
Stark, O. & Falk I. 1998. Transfers, empathy formation, and reverse transfers. American Economic Review, 88 (2): 271-276.
Steier, L. 2003. Variants of agency contracts in family-financed ventures as a continuum of familial altruistic and market rationalities. Journal of Business Venturing, 18: 597–618.
The Economist. (2012, November 10). Time’s arrows. 405(8810), 84.The Economist. (2013, February 9). Nomencracy. 406(8822), 75.Trivers, R.L., 1971. The Evolution of Reciprocal Altruism. Quarterly Review of Biology, 46: 35-
57.
Upton, N., Teal, E.J., & Felan, J.T. 2001. Strategic and business planning practices of fast growth family firms. Journal of Small Business Management, 39(1): 60–72.

The Journal of Business Leadership
137
Vozikis, G.S., Weaver, K.M., Dickson, P.H. & Gibson, B. 2012. The role of empathy in a family firm: A theoretical framework. Journal of Organizational Psychology, 12 (2): (forthcoming)
Ward, J. L. 1987. Keeping the family business healthy: How to plan for continuous growth, profitability, and family leadership. San Francisco, CA: Jossey-Bass.
Zahra, S.A., 2003. International expansion of U.S. manufacturing family businesses: the effect of ownership and involvement. Journal of Business Venturing. 19: 495–512.
Zahra, S. A., Hayton, J. C. & Salvato, C. 2004. Entrepreneurship in family vs. non-family firms: a resource-based analysis of the effect of organizational culture. Entrepreneurship: Theory and Practice, 28 (4): 363-381.
