the johannesburg office market shows resilience persistent ... 2017 johannesburg... · 1 central...
TRANSCRIPT
1 CentralLondonOfficeMarketReport | Q3 2016
Johannesburg Office Market ReportTheJohannesburgofficemarketshowsresilienceinthemidstofweightypoliticaluncertaintyandthepersistentpooreconomicenvironment.
Q1 2017
2 JohannesburgOfficeMarketReport | Q1 2017
Overview
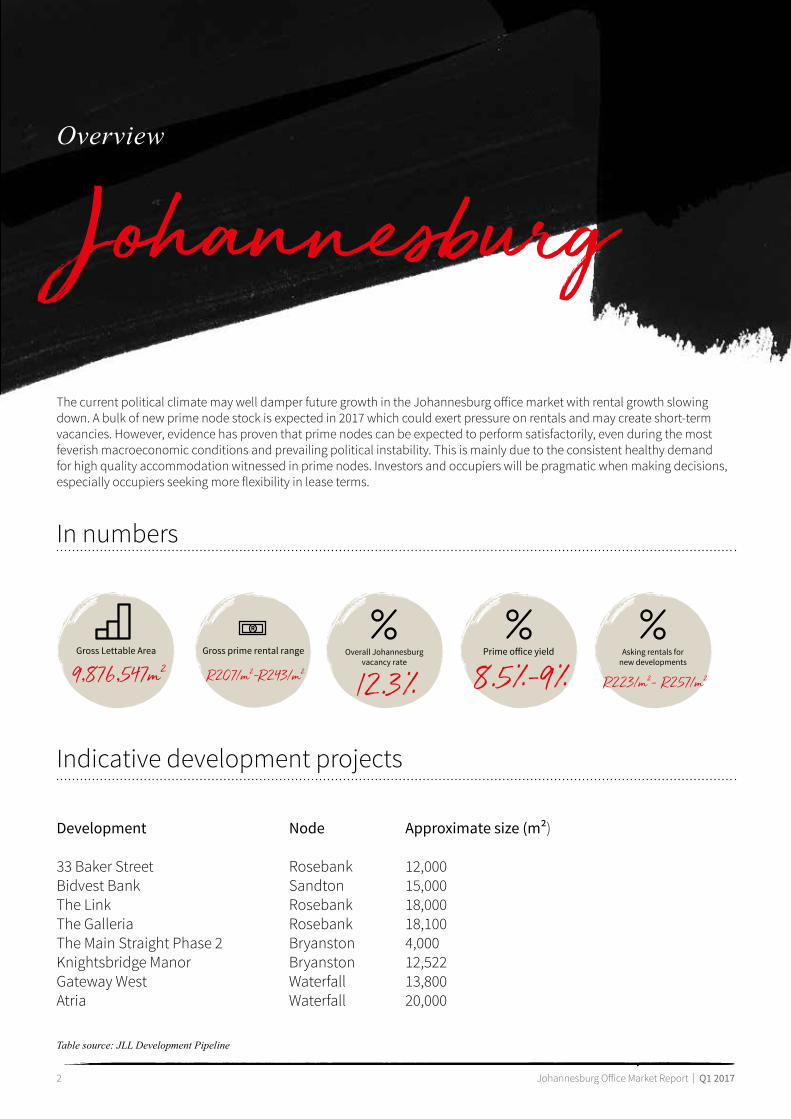
JohannesburgThecurrentpoliticalclimatemaywelldamperfuturegrowthintheJohannesburgofficemarketwithrentalgrowthslowingdown.Abulkofnewprimenodestockisexpectedin2017whichcouldexertpressureonrentalsandmaycreateshort-termvacancies.However,evidencehasproventhatprimenodescanbeexpectedtoperformsatisfactorily,evenduringthemostfeverishmacroeconomicconditionsandprevailingpoliticalinstability.Thisismainlyduetotheconsistenthealthydemandforhighqualityaccommodationwitnessedinprimenodes.Investorsandoccupierswillbepragmaticwhenmakingdecisions,especiallyoccupiersseekingmoreflexibilityinleaseterms.
Gross prime rental range
R207/m²-R243/m²Gross Lettable Area
9,876,547m²Overall Johannesburg
vacancy rate
12.3%Prime office yield
8.5%-9%Asking rentals for
new developments
R223/m²– R257/m²
Innumbers
Indicativedevelopmentprojects
Development
33BakerStreetBidvestBankTheLinkTheGalleriaTheMainStraightPhase2KnightsbridgeManorGatewayWestAtria
Node
RosebankSandtonRosebankRosebankBryanstonBryanstonWaterfallWaterfall
Approximate size (m²)
12,00015,00018,00018,1004,00012,52213,80020,000
Table source: JLL Development Pipeline

3 CentralLondonOfficeMarketReport | Q3 2016
Issue to watch :Theclimateisripeformoreflexibleleaseterms
andshowcasesthebenefitsoftheco-working
environment.
4 JohannesburgOfficeMarketReport | Q1 2017
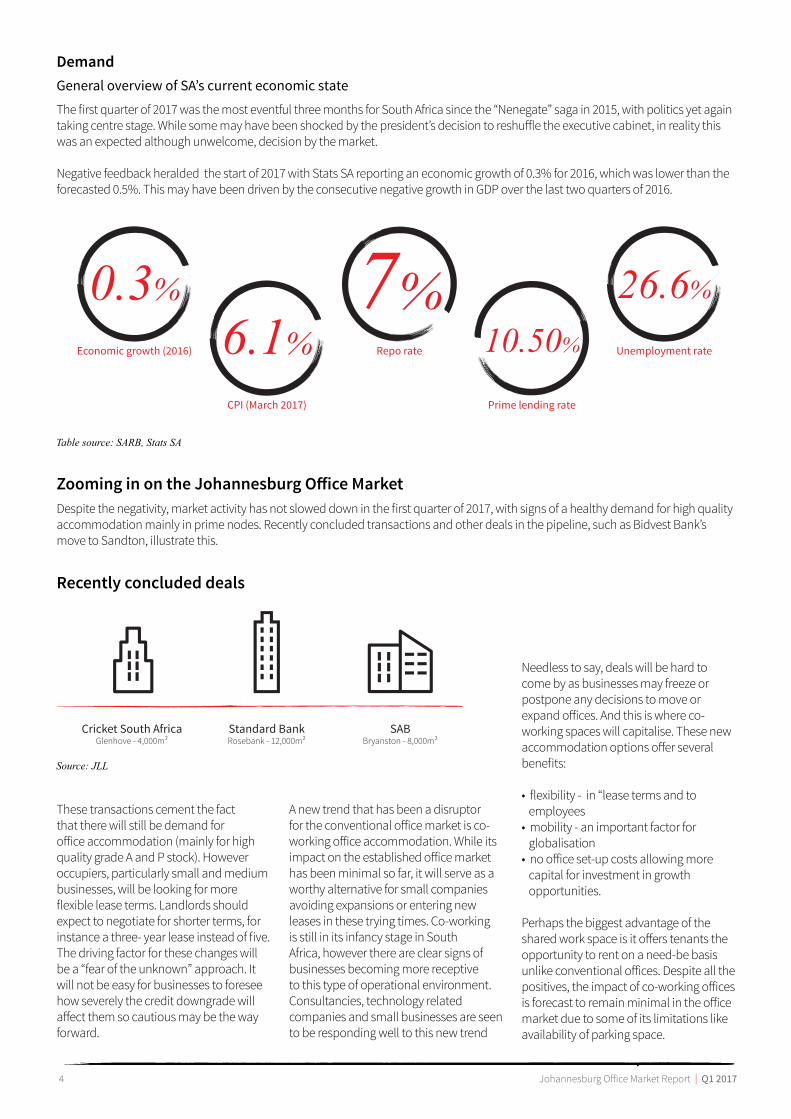
DemandGeneral overview of SA’s current economic state
Thefirstquarterof2017wasthemosteventfulthreemonthsforSouthAfricasincethe“Nenegate”sagain2015,withpoliticsyetagaintakingcentrestage.Whilesomemayhavebeenshockedbythepresident’sdecisiontoreshuffletheexecutivecabinet,inrealitythiswasanexpectedalthoughunwelcome,decisionbythemarket.
Negativefeedbackheraldedthestartof2017withStatsSAreportinganeconomicgrowthof0.3%for2016,whichwaslowerthantheforecasted0.5%.ThismayhavebeendrivenbytheconsecutivenegativegrowthinGDPoverthelasttwoquartersof2016.
Zooming in on the Johannesburg Office MarketDespitethenegativity,marketactivityhasnotsloweddowninthefirstquarterof2017,withsignsofahealthydemandforhighqualityaccommodationmainlyinprimenodes.Recentlyconcludedtransactionsandotherdealsinthepipeline,suchasBidvestBank’smovetoSandton,illustratethis.
Thesetransactionscementthefactthattherewillstillbedemandforofficeaccommodation(mainlyforhighqualitygradeAandPstock).Howeveroccupiers,particularlysmallandmediumbusinesses,willbelookingformoreflexibleleaseterms.Landlordsshouldexpecttonegotiateforshorterterms,forinstanceathree-yearleaseinsteadoffive.Thedrivingfactorforthesechangeswillbea“fearoftheunknown”approach.Itwillnotbeeasyforbusinessestoforeseehowseverelythecreditdowngradewillaffectthemsocautiousmaybethewayforward.
Recently concluded deals
Table source: SARB, Stats SA
Source: JLL
Economic growth (2016)
0.3%
Repo rate
7%
CPI (March 2017)
6.1% Unemployment rate
26.6%
Prime lending rate
10.50%
Cricket South AfricaGlenhove - 4,000m²
Standard BankRosebank - 12,000m²
SABBryanston - 8,000m²
Anewtrendthathasbeenadisruptorfortheconventionalofficemarketisco-workingofficeaccommodation.Whileitsimpactontheestablishedofficemarkethasbeenminimalsofar,itwillserveasaworthyalternativeforsmallcompaniesavoidingexpansionsorenteringnewleasesinthesetryingtimes.Co-workingisstillinitsinfancystageinSouthAfrica,howeverthereareclearsignsofbusinessesbecomingmorereceptivetothistypeofoperationalenvironment.Consultancies,technologyrelatedcompaniesandsmallbusinessesareseentoberespondingwelltothisnewtrend
Needlesstosay,dealswillbehardtocomebyasbusinessesmayfreezeorpostponeanydecisionstomoveorexpandoffices.Andthisiswhereco-workingspaceswillcapitalise.Thesenewaccommodationoptionsofferseveralbenefits:
•flexibility-in“leasetermsandtoemployees•mobility-animportantfactorforglobalisation•noofficeset-upcostsallowingmorecapitalforinvestmentingrowthopportunities.
Perhapsthebiggestadvantageofthesharedworkspaceisitofferstenantstheopportunitytorentonaneed-bebasisunlikeconventionaloffices.Despiteallthepositives,theimpactofco-workingofficesisforecasttoremainminimalintheofficemarketduetosomeofitslimitationslikeavailabilityofparkingspace.
5 JohannesburgOfficeMarketReport | Q1 2017
Supply
Despitecountry-widenegativesentiment,thereareafewprospectstolookforwardtointheJohannesburgofficemarketwithseveraldevelopmentsexpectedtobecompletedin2017(seetablebelow).Withthisinmind,supplycanbeexpectedtogrowbyatleast2.0%in2017andwillcontinuetogrowintheshorttomediumterm(12–36months).
Althoughthereisstillpotentialformoredevelopmentsinprimenodes,itislikelythatdeveloperswilltakeawait-and-seeapproach,refrainingfromspeculativedevelopmentsandwaitingonsufficientdemandfromoccupiersbeforeembarkingonanynewdevelopments.Investorconfidencehasalreadyshowndeclinesincetherecentcabinetreshuffle.Itwillcontinuetoadjustastheimpactofthenewleadershipandrecentlyacquiredjunkstatusunfoldsinthefollowingmonths.
Mostofthenewstockandstockcurrentlyunderconstructionisinprimenodes(i.e.Sandton,Rosebank,andWaterfall).Whilethegrowthiswell-received,aseriousconcernisthetrafficcongestioninSandtonandRosebankwiththesituationworseningasnewtenantsmoveintothenodes.Thenewstockwillfurtherheightentheconcernofover-supply,especiallyintheSandtonarea.
Development projects expected to be completed in 2017:
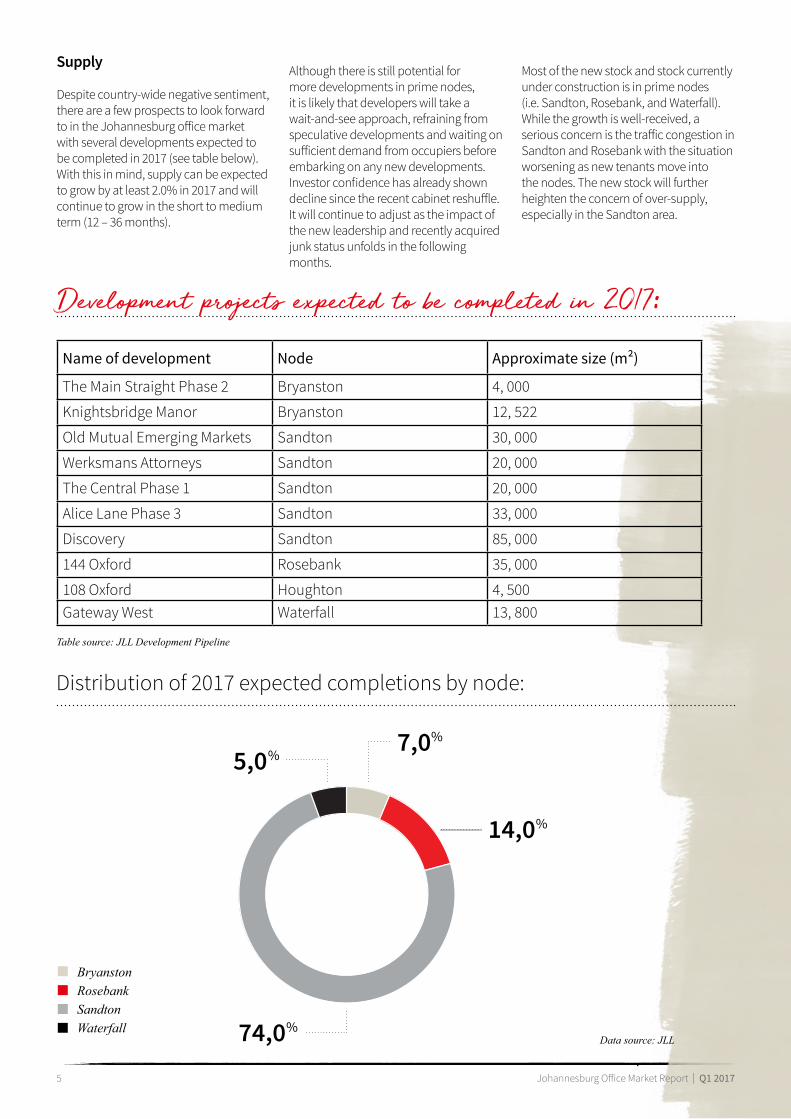
Distributionof2017expectedcompletionsbynode:
Name of development Node Approximate size (m²)
TheMainStraightPhase2 Bryanston 4,000
KnightsbridgeManor Bryanston 12,522
OldMutualEmergingMarkets Sandton 30,000
WerksmansAttorneys Sandton 20,000
TheCentralPhase1 Sandton 20,000
AliceLanePhase3 Sandton 33,000
Discovery Sandton 85,000
144Oxford Rosebank 35,000
108Oxford Houghton 4,500GatewayWest Waterfall 13,800
14,0%
74,0%
7,0%
5,0%
BryanstonRosebankSandtonWaterfall
Table source: JLL Development Pipeline
Data source: JLL
6 JohannesburgOfficeMarketReport | Q1 2017
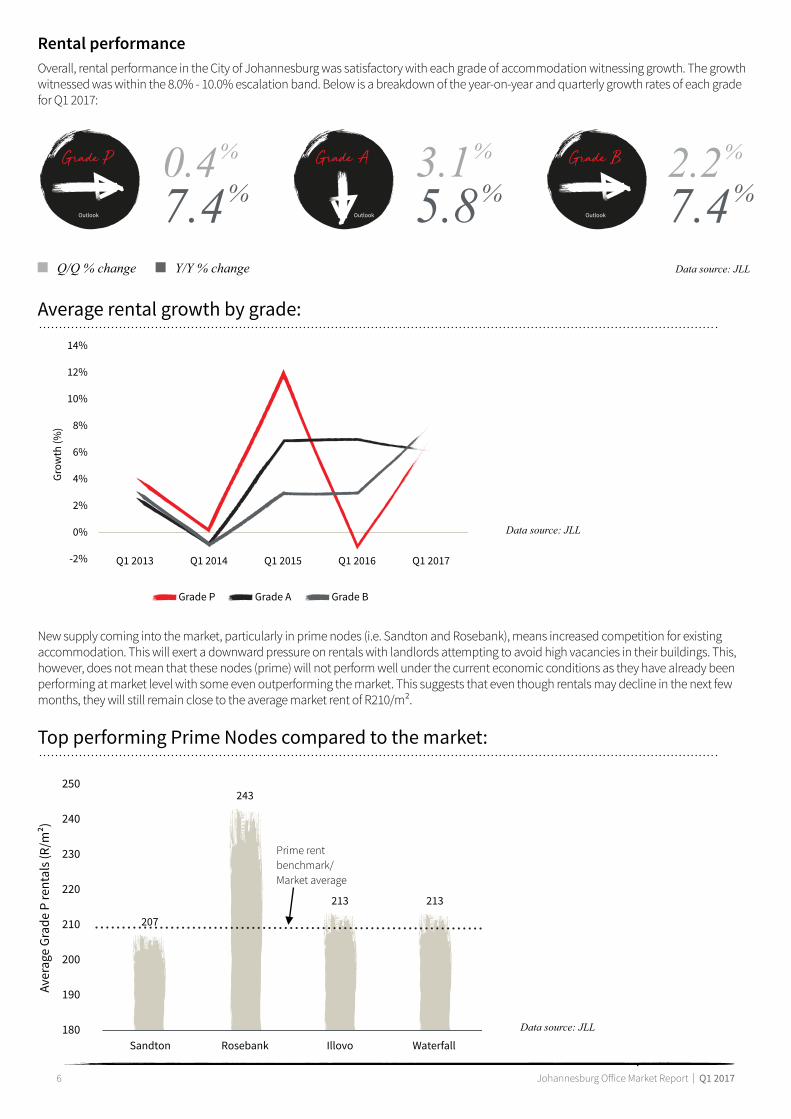
Newsupplycomingintothemarket,particularlyinprimenodes(i.e.SandtonandRosebank),meansincreasedcompetitionforexistingaccommodation.Thiswillexertadownwardpressureonrentalswithlandlordsattemptingtoavoidhighvacanciesintheirbuildings.This,however,doesnotmeanthatthesenodes(prime)willnotperformwellunderthecurrenteconomicconditionsastheyhavealreadybeenperformingatmarketlevelwithsomeevenoutperformingthemarket.Thissuggeststhateventhoughrentalsmaydeclineinthenextfewmonths,theywillstillremainclosetotheaveragemarketrentofR210/m².
Data source: JLL
Data source: JLL
Data source: JLL
Rental performanceOverall,rentalperformanceintheCityofJohannesburgwassatisfactorywitheachgradeofaccommodationwitnessinggrowth.Thegrowthwitnessedwaswithinthe8.0%-10.0%escalationband.Belowisabreakdownoftheyear-on-yearandquarterlygrowthratesofeachgradeforQ12017:
Grade P
Q1 2013 Q1 2014 Q1 2015 Q1 2016 Q1 2017-2%
0%
2%
4%Grow
th (%
)
6%
8%
10%
12%
14%
Grade A Grade B
250
240
230
220
210
Aver
age
Grad
e P
rent
als (
R/m
²)
200
190
180Sandton Rosebank Illovo
207
213
243
213
Prime rentbenchmark/Market average
Waterfall
Average rental growth by grade:
Top performing Prime Nodes compared to the market:
Grade P
Outlook
Grade A Grade B
OutlookOutlook
0.4%
7.4%3.1%
5.8%2.2%
7.4%
Q/Q % change Y/Y % change
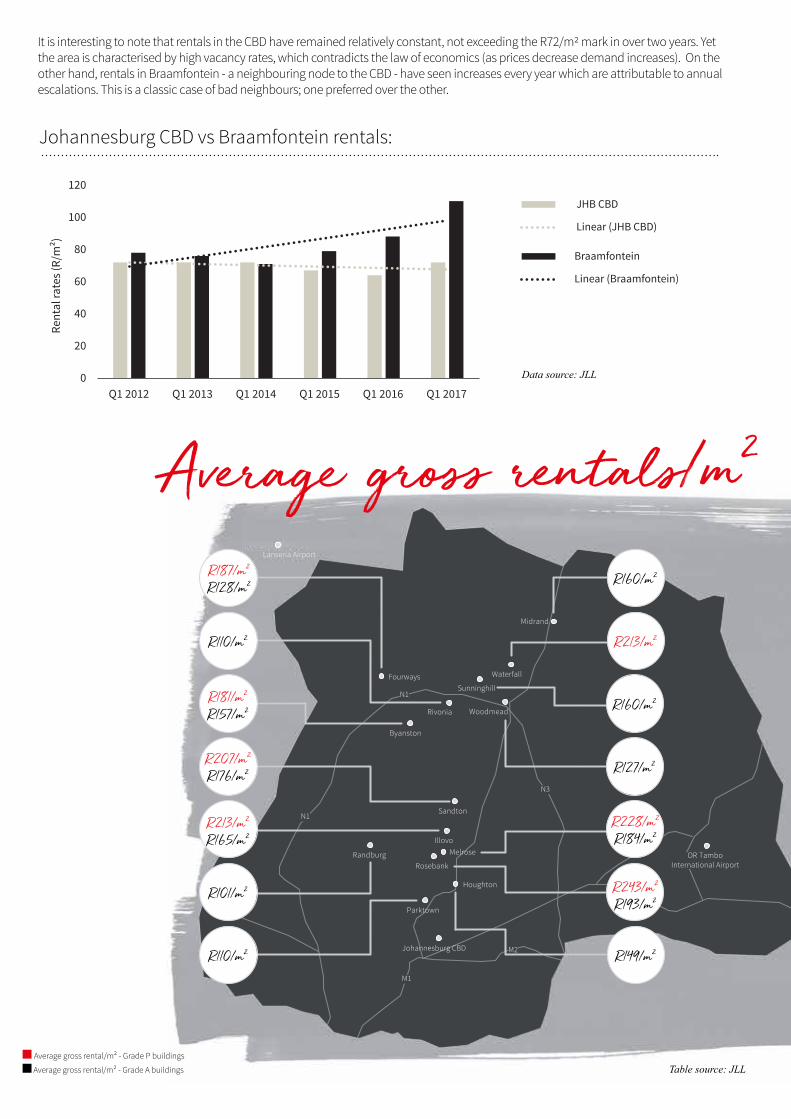
ItisinterestingtonotethatrentalsintheCBDhaveremainedrelativelyconstant,notexceedingtheR72/m2markinovertwoyears.Yettheareaischaracterisedbyhighvacancyrates,whichcontradictsthelawofeconomics(aspricesdecreasedemandincreases).Ontheotherhand,rentalsinBraamfontein-aneighbouringnodetotheCBD-haveseenincreaseseveryyearwhichareattributabletoannualescalations.Thisisaclassiccaseofbadneighbours;onepreferredovertheother.
Q1 20120
20
Rent
al ra
tes (
R/m
²)
JHB CBD
Linear (JHB CBD)
Braamfontein
Linear (Braamfontein)
40
60
80
100
120
Q1 2013 Q1 2014 Q1 2015 Q1 2016 Q1 2017
JohannesburgCBDvsBraamfonteinrentals:
Data source: JLL
Rosebank
Houghton
Fourways
Byanston
Rivonia
Sunninghill
Sandton
Waterfall
Illovo
M1
N3
N1
N1
M2
Randburg
Lanseria Airport
R213/m²
R207/m²R176/m²
R187/m²R128/m²
R110/m²
R110/m²
R160/m²
R149/m²
R101/m²
R160/m²R181/m²R157/m²
R127/m²
R213/m²R165/m²
R228/m²R184/m²
R243/m²R193/m²
Johannesburg CBD
Woodmead
Midrand
Melrose
Parktown
OR TamboInternational Airport
Average gross rentals/m²
Table source: JLL Averagegrossrental/m²-GradePbuildings
Averagegrossrental/m²-GradeAbuildings

8 JohannesburgOfficeMarketReport | Q1 2017
Q1 2013
10.6%
11.4%
12.7%
12.3% 12.3%
9.5%
10.0%
Vaca
ncy
rate
(%)
10.5%
11.0%
11.5%
12.0%
12.5%
13.0%
Q1 2014 Q1 2015 Q1 2016 Q1 2017
Q1 20130.0%
Vaca
ncy
rate
(%)
2.0%4.0%6.0%8.0%
10.0%12.0%14.0%16.0%18.0%20.0%
Q1 2014 Q1 2015 Q1 2016 Q1 2017
Prime nodes - Johannesburg
Decentralised Johannesburg
Johannesburg CBD + Braamfontein + Newtown
Vacancies
OverallJohannesburgvacancyrate:
Data: SAPOA
Data: SAPOA
Onayear-on-yearbasis,thevacancyrateremainedunchanged,whileonaquarterlybasisitincreasedfrom11.9%(Q42016)to12.3%inQ12017.TheCityofJohannesburgrecordedoneofthehighestvacancyratesamongthelargermetrosinSouthAfrica.AccordingtoSAPOA,thehighvacancyrateismainlydrivenbythehighvacancyratesintheinnercity.Whileprimenodescontinuetorecordthelowestvacancies,therehasbeenanincreaseinvacancyratesonaquarterlybasisgoingfrom7.2%to9.1%.Thisislikelyasaresultofnewstockinthemarketthathasnotbeenoccupiedyet.
Wecanexpecttoseeanincreaseinvacancyratesoverthenexttwotothreequartersasdevelopmentswithspeculativeportionswillbecomingtocompletion.Anotherdrivingfactorforvacancyincreaseswillbeupcomingofficeconsolidations(example:PWC,Discovery).Thegoodnewsisthattheseeffectswillnotbepermanentastherecontinuestobeverydynamicdemandforhighqualityofficeaccommodation.

9 JohannesburgOfficeMarketReport | Q1 2017
AfewmonthsagoitwouldhavebeensafetosaythattheJohannesburgofficemarketwillcontinuetoperformwellinthemediumtermdespiteweakeconomicconditions.Howeverrecenteventshavecreatedfurtherrestraintamongstdecisionmakersandwilldamageinvestorconfidenceinthecity.
A couple of things to expect in the short to medium term:
• Developmentactivitytoslowdownafterthecompletionofongoingdevelopments-fewernewprojectswillbeannounced.• Developerstoholdbackonspeculativedevelopmentsduetohigherriskofalackoftenants.• Potentialoccupiersnegotiatingfornewleaseswillseekflexibleandshorterleaseterms.• Vacancyratesexpectedtoincreasebeforeimprovinginfuture.
WhilemostdevelopmentsintheSandtonnodearetenant-drivenwithspeculativeportions,theremaybeanover-supplyofofficeaccommodationintheshortterm,thisislikelytocausedownwardpressureonrentalsinthearea.Needlesstosay,theramificationsofthecabinetreshuffleandthecreditdowngradearestilltobefeltinthefollowingmonths,possiblyyears,andmaybeworsethanexpected.TheSARBforecastGDPgrowthat1.2%for2017,butconsideringrecenteventsandfurtherpossiblecreditdowngradesbyotherratingagencies,SouthAfrica’sgrowthwilllikelyremainstagnantandbelow1%.Aseconomicgrowthandemploymentdatafeedstheperformanceoftheofficemarket,suppressedgrowthandhighunemploymentratesindicatestagnancyintheofficemarket.
Rental growthaccelerating
Rental growthslowing
Rentsbottomingout
Rents falling
Grade B
Grade A
The JLL Property Clock™
Grade P
Market outlook
10 CentralLondonOfficeMarketReport | Q3 2016
© 2017 Jones Lang LaSalle IP, Inc. All rights reserved. The information contained in this document is proprietary to JLL and shall be used solely for the purposes of evaluating this proposal. All such documentation and information remains the property of JLL and shall be kept confidential. Reproduction of any part of this document is authorised only to the extent necessary for its evaluation. It is not to be shown to any third party without the prior written authorisation of JLL. All information contained herein is from sources deemed reliable; however, no representation or warranty is made as to the accuracy thereof.
JLL South AfricaJohannesburg3rd Floor, The FirsCnr Biermann & Cradock AveRosebank, South Africa, 2196Phone: +27 11 507 2200
Tom MundyHead: Research, Sub-Saharan [email protected]
Omphile Ramokhoase Head: Research, South [email protected]
www.jll.co.zawww.jllpropertysearch.co.za
Contact us
With other regional offices in Dubai, Abu Dhabi, Riyadh, Jeddah, Al Khobar, Cairo, Casablanca, Lagos and Nairobi