the items provided through the internet pursuant to the ... · ... consolidation
TRANSCRIPT

The Bank assumes no responsibility for this translation or for direct, indirect or any other forms or damages arising from the translations. [TRANSLATION]
The items provided through the Internet pursuant to the laws and the Company’s Articles of Incorporation for the Notice of the Annual General Meeting of Shareholders for the 16th Term
1) Notes to the consolidated financial statements
2) Notes to the financial statements
(from April 1, 2015 to March 31, 2016)
Shinsei Bank, Limited
The above items are provided through the Bank’s website (http://www.shinseibank.com) pursuant to the laws and Article 13 of the Company’s Articles of Incorporation for the Notice of the Annual General Meeting of Shareholders for the 16th Term.

Notes to the consolidated financial statements
<Basis for Presentation of Consolidated Financial Statements and Significant Accounting
Policies>
The definitions of subsidiaries and affiliates are based on the 8th paragraph of Article 2 of the
Banking Act and Article 4-2 of the Banking Act Enforcement Order.
1. Basis for presentation of consolidated financial statements
(1) Scope of consolidation
(a) Consolidated subsidiaries: 160 companies
Major companies:
APLUS FINANCIAL Co., Ltd.
Showa Leasing Co., Ltd.
Shinki Co., Ltd.
Shinsei Financial Co., Ltd.
Shinsei Trust & Banking Co., Ltd.
Shinsei Securities Co., Ltd.
Shinsei Principal Investments Ltd.
In the current fiscal year, TOZAI BOEKI Co., Ltd was newly consolidated due to the
acquisition of shares, and SL MU CO., LTD. was newly consolidated due to its increased
materiality.
Shinsei Corporate Investment PE No.1 Limited Liability Partnership and 13 other
companies were excluded from the scope of consolidation due to liquidation, SIA Wind Second
Co., Ltd. was excluded from the scope of consolidation due to the loss of its controlling interest,
Shinsei Sales Finance Co., Ltd. and 1 other company were excluded from the scope of
consolidation due to mergers into APLUS Co.,Ltd., and Minakami Godo Kaisha and 3 other
companies were excluded from the scope of consolidation due to their decreased materiality.
(b) Unconsolidated subsidiaries: 90 companies
Major Company:
SL PACIFIC LIMITED
SL PACIFIC LIMITED and 65 other unconsolidated subsidiaries were operating
companies that undertake leasing business based on the Tokumei Kumiai system (silent
partnerships). Tokumei Kumiai’s assets, profits and losses virtually belong to each silent partner
but not to the operating companies, and Shinsei Bank, Limited (the “Bank”) and its
consolidated subsidiaries (collectively, the “Group”) do not have any material transactions with
- 1 -

these subsidiaries. Therefore, these subsidiaries were excluded from the scope of
consolidation pursuant to Article 63, Paragraph 1, Item 2 of the Ordinance on Company
Accounting.
Other unconsolidated subsidiaries were excluded from the scope of consolidation because
they are immaterial to the financial condition or results of operations, such as assets, ordinary
income, profit (the Group’s interest portion), retained earnings (the Group’s interest portion)
and accumulated other comprehensive income (the Group’s interest portion) of the Group.
(2) Application of the equity method
(a) Unconsolidated subsidiaries accounted for by the equity method: none
(b) Affiliates accounted for by the equity method: 20 companies
Major Companies:
Jih Sun Financial Holding Company, Limited
In the current fiscal year, Shinsei Creation Partners Investment Limited Partnership Ⅲ
and 3 other companies were newly included in the scope of application of the equity method
due to their formation.
SN Corporation was excluded from the scope of application of the equity method due to
liquidation and Comox Holdings Ltd. and 1 other company were excluded from the scope of
application of the equity method due to the sale of shares.
(c) Unconsolidated subsidiaries accounted for not applying the equity method: 90 companies
Major Company:
SL PACIFIC LIMITED
SL PACIFIC LIMITED and 65 other unconsolidated subsidiaries were operating
companies that undertake leasing business based on the Tokumei Kumiai system (silent
partnership). Tokumei Kumiai’s assets, profits and losses virtually belong to each silent partner
but not to the operating companies, and the Group does not have any material transactions with
these subsidiaries. Therefore, these subsidiaries were excluded from the scope of application of
the equity method pursuant to Article 69, Paragraph 1, Item 2 of the Ordinance on Company
Accounting.
Other unconsolidated subsidiaries were excluded from the scope of application of the
equity method because they are immaterial to the financial condition or results of operations,
such as profit (the Group’s interest portion), retained earnings (the Group’s interest portion) and
accumulated other comprehensive income (the Group’s interest portion) of the Group.
- 2 -

(d) Affiliates accounted for not applying the equity method: 1 company
Company:
TGM CO., LTD.
TGM CO., LTD. was excluded from the scope of application of the equity method
because it is immaterial to the financial condition or results of operations, such as profit (the
Group’s interest portion), retained earnings (the Group’s interest portion) and accumulated
other comprehensive income (the Group’s interest portion) of the Group.
(3) Fiscal year of consolidated subsidiaries
(a) Balance sheets dates of consolidated subsidiaries were as follows:
March 31: 121 companies
September 30: 3 companies
November 30: 1 company
December 31: 33 companies
February 29: 2 companies
(b) Except for 6 subsidiaries which are consolidated using their provisional financial statements
as of March 31, those consolidated subsidiaries whose fiscal years end at dates other than
March 31 are consolidated using their fiscal year end financial statements with appropriate
adjustments made for significant transactions that occurred during the period from the ending
dates of their fiscal years to March 31.
- 3 -

All yen amounts are rounded down to millions of yen.
2. Accounting policies
(1) Recognition and measurement of trading assets/liabilities and trading income/losses
Trading account positions entered into to generate gains arising from short-term changes in
interest rates, currency exchange rates or market prices of financial instruments and other
market-related indices, or from price differences among markets, are included in “Trading
assets” and “Trading liabilities” on a trade-date basis. The income and losses resulting from
trading activities are included in “Trading income” and “Trading losses.”
Trading securities and monetary claims purchased for trading purposes are stated at market
value at the consolidated balance sheet date and derivative financial instruments related to
trading positions are stated at fair value based on estimated amounts that would be settled in cash
if such position was terminated at the consolidated balance sheet date.
Trading income and trading losses include interest received and paid during the fiscal year
and unrealized gains and losses resulting from the change in the value of securities and monetary
claims purchased, and derivatives between the beginning and the end of the fiscal year.
In estimating fair values of derivative financial instruments included in trading accounts,
liquidity risks and credit risks are reflected.
(2) Measurement of securities
(a) Securities for trading purposes (except for those included in trading accounts) are carried at
fair value (cost of securities sold is determined by the moving-average method). Securities
being held to maturity are carried at amortized cost (using the straight-line method)
determined by the moving-average method. Investments in unconsolidated subsidiaries and
affiliates that are not accounted for by the equity method are carried at cost determined by
the moving-average method. Available-for-sale securities are carried at fair value at the
consolidated balance sheet date (cost of securities sold is determined by the moving-average
method) in principle, with the exception of those whose fair value cannot be reliably
determined, which are carried at cost determined by the moving-average method. Investments
in partnerships and others are carried at the amount of the Group’s share of net asset value
based on their most recent financial statements.
Unrealized gain (loss) on available-for-sale securities is directly recorded in a separate
component of equity, after deducting the amount charged to profit or loss by applying fair
value hedge accounting.
(b) The values of securities included in monetary assets held in trust are determined by the same
methods as stated in (a) above.
(3) Measurement of derivatives
Derivatives (except for those included in trading accounts) are carried at fair value.
(4) Measurement of other monetary claims purchased
Other monetary claims purchased held for trading purposes (except for those included in
trading accounts) are carried at fair value.
- 4 -

(5) Depreciation
(a) Premises and equipment (excluding leased assets as lessee)
Depreciation of the Group’s buildings and the Bank’s computer equipment (including
ATMs) other than personal computers is computed principally using the straight-line method, and
depreciation of other equipment is computed principally using the declining-balance method.
Principal estimated useful lives are as follows:
Buildings: 3 – 50 years
Others: 2 – 20 years
In addition, depreciation of tangible leased assets as lessor for the operating lease
transactions is computed using the straight-line method over the leasing period assuming that
residual values are the disposal price estimable at the end of the estimated lease period.
(b) Intangible assets (excluding leased assets as lessee)
The amortization method and the amortization period of identified intangible assets
recognized by applying the purchase method to the acquisitions of Showa Leasing Co., Ltd.,
Shinsei Financial Co., Ltd., and their consolidated subsidiaries are as follows:
(i) Showa Leasing Co., Ltd.
Amortization method Amortization period
Customer relationship Sum-of-the-years digits 20 years
Sublease contracts
Straight-line Subject to the remaining contract years
(ii) Shinsei Financial Co., Ltd.
Amortization method Amortization period
Trade names and trademarks Straight-line 10 years
Customer relationship Sum-of-the-years digits 10 years
In addition, goodwill and negative goodwill, which were recorded prior to March 31, 2010,
are amortized on a consistent basis primarily over 20 years. The total amount is written off in the
fiscal year during which they occurred when the amount is not material.
Intangible assets other than the identified intangible assets mentioned above are amortized
using the straight-line method. Capitalized software for internal use is amortized using the
straight-line method based on the Group’s estimated useful lives (primarily 5 years).
(c) Leased assets (as lessee)
Depreciation of leased assets under finance lease transactions that deem to transfer
ownership of the leased property to the lessee, which are included in “Other intangible assets,” is
computed using the same method which is applied to owned properties.
Depreciation of leased assets (both tangible and intangible) under finance lease transactions
that are not deemed to transfer ownership of the leased property to the lessee, which are included
- 5 -

in “Other premises and equipment” and “Other intangible assets,” is computed using the
straight-line method over the leasing period. Residual values of leased assets are the guaranteed
value determined in the lease contracts or zero for assets without such guaranteed value.
(6) Deferred charges
Deferred charges are accounted for as follows:
(a) Deferred issuance expenses for corporate bonds
Deferred issuance expenses for corporate bonds, which are included in other assets, are
amortized using the straight-line method over the term of the corporate bonds.
Corporate bonds are stated at amortized costs using the straight-line method.
(b) Deferred issuance expenses for debentures
Deferred issuance expenses for debentures are amortized using the straight-line method over
the term of the debentures.
(7) Reserve for credit losses
The reserve for credit losses of the Bank and the consolidated domestic trust and banking
subsidiary has been established as described below based on the Bank’s internal rules for
establishing the reserve.
For claims to obligors who are legally bankrupt due to bankruptcy, special liquidation
proceedings or similar legal proceedings (“legally bankrupt obligors”) or to obligors who are
effectively in similar conditions (“virtually bankrupt obligors”), a specific reserve is provided
based on the amount of claims, after the charge-off stated below, net of amounts expected to be
collected through the disposal of collateral or execution of guarantees.
For claims to obligors who are not yet bankrupt but are in financial difficulties and are very
likely to go bankrupt in the future (“possibly bankrupt obligors”), except for claims to obligors
with larger claims than a predetermined amount, a specific reserve is provided for the amount
considered to be necessary based on an overall solvency assessment performed for the amount of
claims net of amounts expected to be collected through the disposal of collateral or execution of
guarantees.
With regard to claims to possibly bankrupt obligors, restructured loans and certain claims
for which the reserve has been provided based on the discounted cash flow method (as mentioned
below) in previous fiscal years, provided that obligors’ cash flows for debt service are reasonably
estimable and the balance of claims to such obligors is at or larger than a predetermined amount,
the reserve for credit losses is determined as the difference between (i) relevant estimated cash
flows discounted by the original contractual interest rate and (ii) the book value of the claim
(discounted cash flow method). In case where it is difficult to reasonably estimate future cash
flows, the reserve is provided based on expected loss amount for the remaining term of
respective claims.
For other claims, a general reserve is provided based on historical loan loss experience.
For specific foreign claims, there is a reserve for loans to restructuring countries which has
been provided based on losses estimated by considering the political and economic conditions in
those countries.
- 6 -

All claims are assessed by business divisions based on the predetermined internal rules for
self-assessment of asset quality. The Credit Assessment Division, which is independent from
business divisions, conducts verifications of these assessments, and additional reserves may be
provided based on the verification results.
The consolidated subsidiaries other than the domestic trust and banking subsidiary calculate
the general reserve for general claims based on the actual historical loss ratio, and the specific
reserve for claims to possibly bankrupt obligors, virtually bankrupt obligors and legally bankrupt
obligors based on estimated losses, considering the recoverable value.
For collateralized or guaranteed claims of the Bank and certain consolidated subsidiaries to
legally bankrupt obligors or virtually bankrupt obligors, the amount of claims exceeding the
estimated value of collateral or guarantees, which is deemed uncollectible, has been charged off
and totaled ¥123,460 million.
(8) Accrued employees’ bonuses
Accrued employees’ bonuses are provided in the amount of the estimated bonuses that are
attributable to the current fiscal year.
(9) Accrued directors’ bonuses
Accrued directors’ bonuses are provided in the amount of the estimated bonuses that are
attributable to the current fiscal year.
(10) Reserve for reimbursement of debentures
The reserve for reimbursement of debentures is provided for estimated losses on future
reimbursement requests of debentures derecognized from liabilities.
(Additional information)
Even though the debentures derecognized from liabilities had been recorded as a loss when
reimbursement requests were made, from current fiscal year reserve for reimbursement of
debentures is recorded due to the availability of a reasonable estimate as a result of the
development and analysis of past reimbursement requests. As a result, ordinary profit and income
before income taxes both decreased by ¥2,903 million.
(11) Reserve for losses on interest repayments
The reserve for losses on interest repayments of consolidated subsidiaries is provided for
estimated losses on reimbursements of excess interest payments in the amount of the estimated
future reimbursement requests based on past experience.
(12) Accounting for employees’ retirement benefits
The difference between retirement benefit obligations and plan assets is recognized as
liability for retirement benefits or asset for retirement benefits. The retirement benefit obligation
is estimated using the benefit formula basis for attributing the expected benefits to the current
fiscal year. The past service cost and the actuarial gain (loss) are amortized as follows:
Past service cost: Amortized using the straight-line method over the average remaining service period (5.00-14.74 years) from the fiscal year of occurrence.
- 7 -

Actuarial gain (loss): Amortized using the straight-line method over the average remaining service period (5.00-14.74 years) primarily from the fiscal year of occurrence.
Certain consolidated subsidiaries recognize voluntary retirement payments at the
consolidated balance sheet date as retirement benefit obligations under the nonactuarial
method.
(13) Revenue and expense recognition
(a) Revenue recognition for installment sales finance business
Revenue from installment sales finance business is recognized primarily using installment
bases as follows:
(Contracts based on add-ons)
Installment credit Sum-of-the-months digits method
Guarantees (lump-sum receipt of guarantee fee
when contracted)
Sum-of-the-months digits method
Guarantees (installment of guarantee fee) Straight-line method
(Contracts based on credit balances)
Installment credit Credit-balance method
Guarantees (installment of guarantee fee) Credit-balance method
(Notes)
1. In “Sum-of-the-months digits method,” the commission amount regarded as revenue at
the time of each installment payment is calculated by dividing the total commission
amount by the sum of the months of installment payments.
2. In “Credit-balance method,” the commission amount regarded as revenue at the time
of each installment payment is calculated by multiplying the respective outstanding
principal by a contracted commission ratio. (b) Revenue and expense recognition for leasing business
For the finance lease transactions that do not deem to transfer ownership of the leased
property to the lessee, lease income is recognized based on lease payments for each of the
leasing period, and lease cost is calculated by deducting the interest allocated for each period
from the lease income.
With regard to finance lease transactions entered into prior to April 1, 2008, that do not
deem to transfer ownership of the leased property to the lessee, leased investment assets are
recognized at the amount of book values of those leased property as of March 31, 2008, in
accordance with the transitional treatment in the “Accounting Standard for Lease Transactions”
(Accounting Standards Board of Japan (“ASBJ”) Statement No. 13) that was effective from April
1, 2008. As a result, income before income taxes for the current fiscal year has increased by ¥125
million, as compared to what would have been reported if the revised accounting standard was
applied retroactively to all finance lease transactions as lessor.
(c) Revenue recognition for interest on consumer lending business
Consolidated subsidiaries specialized in consumer lending business accrued interest income
- 8 -

at the balance sheet date at the lower of the amount determined using a rate permissible under the
Interest Rate Restriction Act of Japan or the amount determined using rates on contracts with
customers.
(14) Translation of foreign currency-denominated assets and liabilities
Foreign currency-denominated assets and liabilities of the Bank are translated into Japanese
yen at exchange rates as of the consolidated balance sheet date, except for investments in
unconsolidated subsidiaries and affiliates that are translated at the relevant historical exchange
rates.
Foreign currency-denominated assets and liabilities of consolidated subsidiaries are
translated at exchange rates of their respective balance sheet dates.
(15) Hedge accounting
(a) Hedge of interest rate risks
The Bank applies the deferral hedge accounting for derivative transactions that meet the
hedge accounting criteria for mitigating interest risks of its financial assets and liabilities.
The Bank adopted portfolio hedging to determine the effectiveness of hedging instruments
in accordance with Industry Audit Committee Report No. 24 issued, in February 13 2002, by the
Japanese Institute of Certified Public Accountants (the "JICPA"). Under portfolio hedging to
mitigate the change in fair value, a portfolio of hedged items with common maturities such as
deposits or loans is designated and matched with a group of hedging instruments such as interest
rate swaps, which offset the effect of fair value fluctuations of the hedged items by identified
maturities. The effectiveness of the portfolio hedging is assessed by each group.
As for portfolio hedging activities to fix cash flows, the effectiveness is assessed based on
the correlation between the base interest rate index of the hedged cash flow and that of the
hedging instruments.
The interest rate swaps of certain consolidated subsidiaries which qualify for hedge
accounting and meet specific matching criteria are not measured at fair value, but the net
payments or receipts under the swap agreements are recognized and included in interest expenses
or income.
(b) Hedge of foreign exchange fluctuation risks
The Bank applies either deferral hedge accountings or fair value hedge accounting for
derivative transactions for the purpose of hedging foreign exchange fluctuation risks of its
financial assets and liabilities denominated in a foreign currency.
Under deferral hedge accounting, which is in accordance with Industry Audit Committee
Report No. 25 issued by JICPA, in July 29 2002, hedged items are identified by grouping the
foreign currency-denominated financial assets and liabilities by currency and designating
derivative transactions such as currency swap transactions, fund swap transactions and forward
exchange contracts as hedging instruments. Hedge effectiveness is reviewed by comparing the
total foreign currency position of the hedged items and hedging instruments by currency.
The Bank also applies deferral hedge accounting and fair value hedge accounting to
translation gains (losses) from foreign currency assets of net investments in foreign
- 9 -

unconsolidated subsidiaries, affiliates and securities available for sale (other than bonds
denominated in foreign currencies) when such foreign currency exposures recorded as assets are
hedged with offsetting foreign currency liabilities and the liabilities equal or exceed the
acquisition cost of such foreign currency assets.
(c) Intercompany and intracompany derivative transactions
Gains (losses) on intercompany and intracompany derivative hedging transactions between
the trading book and the banking book are not eliminated as offsetting transactions with third
parties are appropriately entered into in conformity with the nonarbitrary and strict hedging
policy in accordance with Industry Audit Committee Reports No. 24 and No. 25 of the JICPA. As
a result, in the banking book, realized gains (losses) on such intercompany and intracompany
transactions are reported in current earnings and valuation gains (losses) that meet the hedge
accounting criteria are deferred.
(16) Consumption tax
The national consumption tax and the local consumption tax of the Bank and its
consolidated domestic subsidiaries are excluded from transaction amounts.
(17) Consolidated corporate tax system
The consolidated corporate tax system is adopted by the Bank and certain consolidated
domestic subsidiaries.
(Additional information)
The reserve for directors’ retirement benefits was provided for the payment of directors’
retirement benefits based on the amount that would be required if all directors retired at the
balance sheet date as of March 31, 2015. However the Bank and certain consolidated subsidiaries
decided to abolish the Retirement Allowance Plan for Officers at each Annual General Meeting of
Shareholders which was held in June, 2015 and resolved to pay retirement allowances to the
Directors and Audit & Supervisory Board Members at the Meeting. As a result, the reserve for
directors’ retirement benefits was reversed and the unpaid balance of ¥131 million is included in
“Other liabilities.”
Change in accounting policy
(Application of “Accounting Standards for Business Combinations,” etc.)
As of current fiscal year, “Accounting Standard for Business Combinations,” (ASBJ
Statement No.21, issued September 13, 2013), “Accounting Standard for Consolidated Financial
Statements” (ASBJ Statement No.22, issued September 13, 2013), “Accounting Standard for
Business Divestitures” (ASBJ Statement No.7, issued September 13, 2013), etc., have been
applied, and in addition to the amount by which the Bank’s ownership interest in a subsidiary is
changed will now be accounted for as capital surplus as long as the Bank retains control over its
subsidiary, acquisition-related costs will now be accounted for as expenses in the year in which
the costs are incurred. Additionally, regarding business combinations which are undertaken after
current fiscal year, the effects of adjustments to provisional amounts recorded in a business
- 10 -

combination on profit or loss will now be recognized as if the accounting for the business
combination had been completed at the acquisition date. Furthermore, the Group has altered the
presentation of profit, etc. and the presentation of “minority interest” is changed to
“noncontrolling interest.”
Regarding the application of Accounting Standards for Business Combinations, the Group is
following the transitional provisions defined in Accounting Standard for Business Combinations
Section 58-2(4), Accounting Standard for Consolidated Financial Statements Section 44-5(4) and
Accounting Standard for Business Divestitures Section 57-4(4), and as of current fiscal year, the
changes have been applied and will continue to be applied going forward.
The effect of this application on profit for the fiscal year ended March 31, 2016 and capital
surplus as of March 31, 2016 was immaterial.
Unapplied Accounting Standard
The “Implementation Guidance on Recoverability of Deferred Tax Assets” (ASBJ Guidance No.26,
March 28, 2016)
(1) Outline
The Implementation Guidance basically continues to apply the framework used in the JICPA
Guidance No.66 where recoverability of deferred tax assets is assessed based on entities’ categories,
but certain accounting treatments were changed.
(2) Effective dates
The Group expects to apply the revised guidance at the beginning of the fiscal year beginning on
April 1, 2016.
(3) The impact of this application
It is under evaluation of the impact of this application.
- 11 -

Notes
(Consolidated Balance Sheet)
1. Investments in unconsolidated subsidiaries and affiliates were as follows.
(Millions of yen)
Carrying amount Equity securities ¥47,115 Other 2,978
2. For securities held in connection with securities borrowing transactions with or without cash
collateral, securities purchased under resale agreements and securities accepted as collateral for
derivative transactions, where the Group has the right to sell or pledge such securities without
restrictions, ¥1,717 million of those securities was further pledged, and ¥8,520 million of those
securities was held by the Group at the consolidated balance sheet date.
3. Loans and bills discounted included loans to bankrupt obligors and nonaccrual delinquent loans,
totaling ¥4,310 million and ¥62,352 million, respectively.
Loans to bankrupt obligors are loans, after write-off, to legally bankrupt obligors as defined
in Article 96, Paragraph 1, Items 3 and 4 of the Order for Enforcement of the Corporation Tax
Act (Cabinet Order No. 97 of 1965) and on which accrued interest income is not recognized as
there is a substantial doubt about the ultimate collectability of either principal or interest because
they are past due for a considerable period of time or for other reasons.
Nonaccrual delinquent loans are loans on which accrued interest income is not recognized,
excluding loans to bankrupt obligors and loans for which interest payments are deferred in order
to facilitate the rehabilitation of obligors or to assist in the financial recovery of obligors.
Installment receivables in “Other assets” included claims to bankrupt obligors and
nonaccrual delinquent claims, totaling ¥117 million and ¥9,937 million, respectively, at the
consolidated balance sheet date.
4. Loans past due for three months or more of ¥1,699 million were included in loans and bills
discounted.
Loans past due for three months or more are loans other than loans to bankrupt obligors and
nonaccrual delinquent loans for which the principal and/or interest payments are past due for
three months or more.
Installment receivables in “Other assets” included claims past due for three months or more
totaling ¥554 million at the consolidated balance sheet date.
5. Restructured loans of ¥26,978 million were included in loans and bills discounted.
Restructured loans are loans other than loans to bankrupt obligors, nonaccrual delinquent
loans or loans past due for three months or more, on which concessions such as reduction of the
stated interest rate, a deferral of interest payment, an extension of the maturity date, debt
forgiveness, or other agreements which give advantages to obligors in financial difficulties have
been granted to obligors to facilitate their rehabilitation.
Restructured installment receivables of ¥319 million were included in “Other assets.”
6. The total amount of loans to bankrupt obligors, nonaccrual delinquent loans, loans past due for
- 12 -

three months or more, and restructured loans was ¥95,340 million.
The total installment receivables in “Other assets” of claims to bankrupt obligors,
nonaccrual delinquent claims, claims past due for three months or more, and restructured claims
were ¥10,929 million.
The amounts of claims mentioned in Notes 3 through 6 above represent the amounts before
deduction of the reserve for credit losses.
7. Bills discounted, such as bank acceptances bought, commercial bills discounted, documentary
bills and foreign exchange contracts bought, are accounted for as financing transactions in
accordance with Industry Audit Committee Report No. 24 issued February 13, 2002 by the JICPA,
although the Group has the right to sell or pledge them without restrictions. The face value of
such bills discounted held was ¥5,766 million.
8. The total principal amount of loans accounted for as a sale through loan participations was
¥8,384 million as of March 31, 2016. This “off-balance sheet” treatment is in accordance with
Report No. 3 issued by the Framework Committee of the JICPA on November 28 2014. And the
total principal amount of such loans in which the Bank participated was ¥6,756 million as of
March 31, 2016.
9. Assets pledged as collateral were as follows: Cash and due from banks ¥ 1,158 million Trading assets 7,360 Monetary assets held in trust 3,706 Securities 488,083 Loans and bills discounted 113,979 Lease receivables and leased investment assets 42,024 Other assets 70,058 Tangible leased assets as lessor 4,523
Liabilities collateralized were as follows: Deposits ¥ 1,159 million Payables under repurchase agreements 23,779 Payables under securities lending transactions 116,409 Borrowed money 376,918 Corporate bonds 8,521 Other liabilities 10 Acceptances and guarantees 970
In addition, ¥62,559 million of securities was pledged as collateral for transactions,
including exchange settlements, swap transactions and replacement of margin for futures
transactions.
Also, ¥4,280 million of margin deposits for futures transactions outstanding, ¥12,975
million of security deposits, ¥38,961 million of cash collateral paid for financial instruments and
¥141 million of guarantee deposits under resale agreements and repurchase agreements were
included in “Other assets.”
10. Nonrecourse debts in consolidated special purpose companies were as follows:
- 13 -

Borrowed money ¥ 74,593 million Corporate bonds 8,521
Assets corresponding to nonrecourse debts were as follows: Cash and due from banks ¥ 1,038 million Securities 98,860 Loans and bills discounted 18,904 Other assets 7,604
Assets corresponding to nonrecourse debts included certain amount of “Assets pledged as
collateral” in Notes 9.
11. The Bank and certain of its consolidated subsidiaries establish credit lines for overdrafts and
issue commitments to extend credit to meet the financing needs of their customers.
The unfunded amount of these commitments was ¥3,569,428 million, out of which the
amount with original agreement terms of less than one year or which were cancelable was
¥3,352,221 million.
Since a large majority of these commitments expire without being drawn upon, the
unfunded amounts do not necessarily represent future cash requirements. Many such agreements
include conditions granting the Bank and consolidated subsidiaries the right to reject the
drawdown or to reduce the amount on the basis of changes in the financial circumstances of the
borrower or other reasonable grounds.
In addition, the Bank obtains collateral when necessary to reduce credit risk related to these
commitments.
12. Installment receivables of ¥516,336 million were included in “Other assets.”
13. Accumulated depreciation on “Premises and equipment” was ¥54,654 million.
14. Deferred gains on “Premises and equipment” deducted for tax purposes were ¥30 million.
15. “Tangible leased assets as lessor” and “Intangible leased assets as lessor” are leased assets for the
operating leases transactions as lessor.
16. Software in progress of ¥12,464 million were included in “Software.”
(Change in presentation)
Software in progress (¥5,085 million at the end of the previous fiscal year) which has been
included in “Software”, is separately presented in the notes due to the materiality of its balance.
17. Goodwill and Negative goodwill are set off and presented as “Goodwill” in intangible assets by
the net amount. The gross amounts were as follows:
Goodwill ¥22,286 million
Negative goodwill 4,171
Net ¥18,114 million
18. Subordinated debt of ¥51,000 million was included in “Borrowed money.”
19. Subordinated bonds of ¥31,400 million were included in “Corporate bonds.”
20. Total obligations to the Directors and Audit & Supervisory Board Members of the Bank stand at
¥73 million.
- 14 -

(Consolidated Statement of Income)
1. “Other business income” included leasing revenue of ¥89,520 million.
2. “Other” presented in “Other ordinary income” included income on monetary assets held in
trust of ¥6,608 million, gain on sale of equity securities and others of ¥5,957 million, equity
in net income of affiliates of ¥2,126 million and gain on sale of loans of ¥1,100 million.
3. “Other business expenses” included leasing cost of ¥80,558 million.
4. “Other general and administrative expenses” included personnel expenses of ¥57,824 million.
5. “Other” presented in “Other ordinary expenses” included loss on sale of equity securities and
others of ¥3,606 million, provision for reimbursement of debentures of ¥2,903 million, provision
on reserve for losses on interest repayments of ¥2,700 million and losses on write-off of loans of
¥1,302 million.
6. “Other extraordinary gains” included gain on reversal of stock acquisition rights of ¥ 698 million.
7. “Impairment losses” included the impairment losses in the Bank by the following asset groups.
Location Usage Asset type Amount (Millions of yen)
Tokyo, Aichi, etc. Branch and ATMs Buildings, Other premises and equipment ¥278
Tokyo, Osaka, etc. IT-related property Other premises and equipment, Software 201
Total ¥480 The Group determines the asset group based on the management segmentation.
As a result of consideration of the business environment, the Bank made a decision to close
down some of the branches and ATMs for Individual Group and to cease use and development of
some software assets, and segregated them as idle assets. Impairment losses for these assets were
recognized assuming their recoverable amount to be zero.
In the above impairment loss amount, ¥271 million was for “Buildings,” ¥75 million was
for “Other premises and equipment” and ¥133 million was for “Software.”
- 15 -

(Consolidated Statement of Changes in Equity)
1. Type and number of issued shares and treasury stock were as follows;
(Unit: thousand shares) Number of
shares as of April 1, 2015
Number of shares
increased
Number of shares
decreased
Number of shares as of March 31,
2016
Note
Issued shares
Common stock 2,750,346 - - 2,750,346
Total 2,750,346 - - 2,750,346
Treasury stock
Common stock 96,428 1 - 96,429 (Note)
Total 96,428 1 - 96,429
Note: The increase of treasury stock is associated with the acquisition of fractional shares.
2. Information on stock acquisition rights
All of stock acquisition rights are the Bank’s stock option.
3. Information on dividends
a) Dividend paid in the current fiscal year
Resolution Type of shares
Total amount of dividend
Dividend per share Record date Effective
date
The board of directors’ meeting on May 12, 2015
Common stock ¥2,653 million ¥1.00 March 31,
2015 May 28,
2015
b) Dividend to be paid in the next fiscal year attributable to the current fiscal year
Resolution Type of shares
Total amount of dividend
Source of dividend
Dividend per share Record date Effective
date
The board of directors’
meeting on May 11, 2016
(planned)
Common stock
¥2,653 million
Retained earnings ¥1.00 March 31,
2016 June 2, 2016
- 16 -

(Financial instruments)
1. Status of financial instruments
(1) Group policy for financial instruments
The Group conducts total financial service, primarily basic banking business and other financial
services such as securities business, trust business, consumer finance business, and commercial
finance business.
For conducting these businesses, the Bank obtains retail customer deposits as a long-term and
stable source of funding. In addition, the Bank diversifies sources of funding by securitization of
loans or other assets. Subsidiaries and affiliates also use borrowings from other financial institutions
as a source of funding.
(2) Nature and extent of risks arising from financial instruments
(a) Financial assets
The financial assets held by the Group are exposed to the following risks:
[Loans and bills discounted]
Loans and bills discounted, which are primarily provided to domestic institutional and individual
customers, are exposed to customer’s credit risk and risk of fluctuation in interest rates.
As of March 31, 2016, loans to the financial and insurance industry were approximately 12%
of the total loans and bills discounted, and those to the real estate industry were approximately 13%,
approximately 40% of which are nonrecourse loans for real estate.
[Securities]
Securities primarily consist of bonds and stocks and other investments such as foreign securities and
investment in partnerships. They are exposed to the risk of fluctuation in interest rates, foreign
exchange rates, and prices in the bond/stock markets and in addition, credit risk arising from
downgrading of issuer’s credit rating, default, etc.
[Other monetary claims purchased, Monetary assets held in trust]
Other monetary claims purchased and Monetary assets held in trust consist of investments in various
assets such as housing loans, nonperforming loans, and receivables in credit trading and securitization
businesses, with a purpose of collection, sale, or securitization. There is a possibility that the Group’s
profits and losses and financial conditions will be badly affected if earnings from these assets are less
than expected. These investments are exposed to risk of fluctuation in market size and price of these
assets.
[Lease receivables and leased investment assets, Installment receivables]
Lease receivables, leased investment assets, and installment receivables held by consolidated
subsidiaries are exposed to customer’s credit risk and risk of fluctuation in interest rates.
(b) Financial liabilities
Financial liabilities of the Group are mainly deposits. In addition to risk of fluctuation in interest rates,
the Group has funding liquidity risk that sufficient funding would become difficult or more expensive
in case of deterioration in Group’s financial position.
- 17 -

By utilizing time deposits as an important Asset Liability Management (ALM) measure, the Bank is
striving to diversify funding maturities and to disperse refunding dates. Without solely relying on
interbank funding, the Bank is aiming to cover its funding needs through core retail deposits and
corporate deposits as well as capital.
(c) Derivative transactions
The Group enters into the following derivative transactions to provide products for customer needs, to
maximize the profit of the Bank’s own trading account and for asset and liability management,
hedging transactions and other purposes.
(i) Interest rate related Interest rate swap, Future contract, Interest rate option, and Interest rate
swaption
(ii) Currency related Currency swap, Forward foreign exchange contract, and Currency
option
(iii) Equity related Equity index future, Equity index option, Equity option, and other
(iv) Bond related Bond futures, and Bond future option
(v) Credit derivative Credit default option, and other
Among the risks associated with derivative transactions, market risk, credit risk and liquidity risk are
to be specially noted for risk management.
(i) Market Risk Risk that losses are incurred associated with changes in the value of
financial instruments from fluctuation in market price, as well as
volatilities inherent in derivative instruments
(ii) Credit Risk Risk that losses are incurred associated with the counterparty defaulting
on contractual terms
(iii) Liquidity Risk Risk that additional costs are incurred associated with closing out the
position of the financial instrument held
To appropriately reflect the risk mitigation effect of derivative transactions to the consolidated
financial statements, the Group adopts hedge accounting where risks in assets and liabilities of the
Group are hedged by interest rate swap, currency swap, etc.
In hedge accounting, effectiveness of hedging is assessed based on the conditions determined in
the accounting standards such as “Accounting Standard of Financial Instruments.”
(3) Risk management for financial instruments
(a) Credit risk management
The Group’s model for credit risk management focuses on securing adequate return on risk, avoiding
excessive concentration in particular sectors or to particular customer groups, and managing the credit
portfolio with an analysis of potential losses under a worst-case scenario.
Concrete policies and guidelines related to credit risk management of corporate business are clarified
- 18 -

in the Group’s detailed procedures, and credit risk management processes are roughly classified into
credit risk management for individual transactions and portfolio-based credit risk management.
As for credit risk management for individual transactions, approval authority level is determined in
accordance with transaction amount, aggregate credit exposure to obligor’s group companies, credit
rating, and so on. The Group has an approval system in which the decisions are made jointly by the
delegation holders of the business promotion division and the risk management divisions, and the
final authority and decision rests with the risk management division.
On portfolio-based credit risk management, to diversify risks in terms of industries, ratings and
customer groups, the Portfolio and Risk Management Division monitors the segment-specific risk
diversification status and also rating fluctuations related to customers within the portfolios. The
division uses this information to provide comprehensive reports to the Risk Policy Committee on a
quarterly basis.
Credit risks in credit transactions are quantified based on the probability of default by obligor rating,
loss given default, and unexpected loss ratio. In order to decrease credit risk of obligors, the Group
secures collateral and guarantees for the protection of its claims, the values of which are checked
more than once a year. Quasi credit risks involved in market transactions, such as derivative
transactions, are controlled based on fair value and estimations of future value fluctuations and are
reflected valuation of derivatives transactions.
As for credit risk management of the consumer finance business, risk management divisions of each
subsidiary monitor leading indicators for quality of screening, quality of portfolio and performance of
collection of claims monthly to recognize and tackle the aggravation of credit cost promptly. In case
of any aggravation, the Group takes action to tackle it.
To take the risk strategy above, Individual Banking Risk Management Division in the Bank holds
monthly performance review, analyzes and monitors these leading indicators and advises the persons
in charge of risk management of each subsidiary on their policies and strategies. The division does not
merely avoid losses but also produces a balanced strategy with appropriate risk and return attributes
and reports this business performance to the Risk Policy Committee quarterly.
(b) Market risk management
Market risks which are associated with changes in the value of financial assets and liabilities,
including off-balance-sheet transactions, from fluctuations in interest rates, foreign exchange rates,
stock prices and other market-related indices, have an effect on our financial performance.
The Group manages market risk by segregating the overall balance sheet, including off-balance-sheet
transactions, into a trading business and a banking business. At the Market Business Management
- 19 -

Committee, the senior review and decision-making for the management of the trading business are
performed. At the ALM Committee, the senior review and decision-making for the management
mainly related to asset/liability management of the banking business are performed.
To control total market risk amounts properly, the trading business include the banking account
transactions in “Securities” and “Derivative instruments,” which are desirable to manage the total risk
amount in combination with the trading business in light of the purpose and format of the transaction,
in addition to in the trading account transactions.
The actual risk limits for asset/liability management of the trading business, such as the value-at-risk
(VaR) method, are approved by the Executive Committee based on “Trading Business Risk
Management Policy and Procedure.” The Market Business Management Committee meets monthly to
review reports from the Market Risk Management Division and front office.
The interest rate risk of the net asset and/or liability in the banking business, which has interest rate
sensitivity, is managed by the ALM Committee based on “Asset Liability Management Policy for
Banking Account.”
The Market Risk Management Division is responsible for appropriate monitoring and reporting of
market risk in both the Group’s trading business and banking business. In addition to reporting risk
information to management, administrative divisions and front office units, the Market Risk
Management Division carries out regular risk analyses and makes recommendations. Market risk
involved in the trading business is managed by the Markets Sub-Group, and market risk of the balance
sheet involved in the banking business is managed by the Treasury Sub-Group.
Market risk is managed by quantifying on a daily basis and making risk adjustment in response to
market conditions.
Quantitative information on market risk is as follows:
(i) Amount of market risk associated with trading business
The Group uses VaR for quantitative analysis on market risk associated with trading business. For
calculating VaR, the historical simulation method (in principle, holding period of 10 days, confidence
interval of 99%, and observation period of 250 business days) has been adopted.
The VaR in the Group's trading business as of March 31, 2016 was ¥1,492 million in the
aggregate.
The Group conducts back testing to compare VaR calculated using the model with actual loss
amounts. According to the results of back testing conducted, it is believed that the measurement
model the Group uses is adequate enough to accurately capture market risk. It should be noted that
VaR measures and calculates the amount of market risk at certain probability levels statistically based
- 20 -

on historical market fluctuation, and therefore there may be cases where risk cannot be captured in
such situations when market conditions are changing dramatically beyond what was experienced
historically.
(ii) Amount of market risk associated with banking business
The Group's main financial instruments which are affected by interest rate risk, one of the major risk
variables, includes “Call loans and bills bought,” “Receivables under resale agreements,”
“Receivables under securities borrowing transactions,” “Other monetary claims purchased,”
“Monetary assets held in trust,” bonds other than trading business in “Securities,” “Loans and bills
discounted,” “Lease receivables and leased investment assets,” “Installment receivables,” “Deposits,”
“Negotiable certificates of deposit,” “Debentures,” “Call money and bills sold,” “Payables under
repurchase agreements,” “Payables under securities lending transactions,” “Borrowed money,”
“Short-term corporate bonds,” “Corporate bonds” and interest rate swaps other than trading business
in “Derivative instruments.” As for these financial assets and liabilities, the Group uses the amount of
impact on fair values, which is calculated using a rationally expected fluctuation range of interest
rates for one year from the fiscal year end for quantitative analysis to manage fluctuation risk of
interest rates. The amount of such impact on fair values is calculated by categorizing the balance of
these financial assets and liabilities according to the term of interest payments and using a certain
fluctuation range of interest rates. Assuming all risk variables except for interest rate are constant, the
Group estimated that the fair value as of March 31, 2016 would decrease by ¥5,096 million in case of
an increase of the index interest rates by 10 basis points (0.10%), and would increase by ¥5,170
million in case of a decrease by 10 basis points (0.10%). Such amount of impact on fair value is
calculated based on the assumption that all risk variables except for interest rate are constant, and
correlation between interest rate and other risk variables is not taken into consideration. There is a
possibility that interest rate changes beyond the rationally expected fluctuation range may cause an
impact greater than the calculated amount.
(c) Liquidity risk management
The ALM Committee, which is the senior review and decision-making body for the management of
funding liquidity risk, manages funding liquidity risk by establishing funding gap limits and minimum
liquidity reserve levels. In accordance with the “Cash Liquidity Risk Management Policy,” the Bank
has a structure to conduct two or more liquidity measurements and to secure available reserves over
the net cumulative outflow forecasted in an emergency situation.
To manage the market liquidity risk for marketable instruments, the Group has trading limits and
monitors the amounts of marketable instruments in view of the attributes of marketable instruments.
Moreover, liquidity reserves for trading account are calculated monthly and are reflected valuation of
derivatives transactions.
(4) Supplement to the fair value information for financial instruments
Fair value of financial instruments includes the value calculated rationally in cases where no market
- 21 -

price is available, besides the value based on market price. Certain assumptions have been adopted
for the calculation, so that the value calculated may not be the same when assumptions that differ
from the Group’s calculation are adopted.
2. Fair value information for financial instruments
The following are the carrying amounts on the consolidated balance sheet, fair values and the
differences between them for respective financial instruments as of March 31, 2016. Securities for
which fair values cannot be reliably determined, such as equity securities without readily available
market prices are not included in the following table (refer (Note 2)). Items that are immaterial are not
included in the following table.
(Millions of yen)
Carrying amount Fair value
Unrealized gain (loss)
(1) Cash and due from banks ¥1,129,213 ¥1,129,213 ¥-
(2) Receivables under securities borrowing transactions
4,243
4,243
-
(3) Other monetary claims purchased Trading purposes Other (*1)
17,076 63,221
17,076 65,071
-
1,849
(4) Trading assets Securities held for trading purposes
23,262
23,262
-
(5) Monetary assets held in trust (*1) 255,255 263,084 7,828
(6) Securities Trading securities Securities being held to maturity Securities available for sale Equity securities of affiliates
7
559,567 574,738
46,581
7
568,664 574,738
29,941
-
9,097 -
(16,639)
(7) Loans and bills discounted (*2) Reserve for credit losses
4,562,923 (53,999)
Net 4,508,924 4,661,271 152,347
(8) Lease receivables and leased investment assets (*1)
208,327 207,154 (1,172)
(9) Other assets Installment receivables Deferred gains on installment receivables Reserve for credit losses
516,336 (15,338) (11,331)
Net 489,666 511,333 21,667
Total assets ¥7,880,086 ¥8,055,064 ¥174,977
(1) Deposits ¥5,499,992 ¥5,503,833 ¥ (3,840)
(2) Negotiable certificates of deposit 301,001 301,005 (4)
(3) Debentures 16,740 16,748 (8)
(4) Call money and bills sold 40,000 40,000 -
- 22 -

(5) Payables under repurchase agreements 23,779 23,779 -
(6) Payables under securities lending transactions
118,139 118,139 -
(7) Trading liabilities Trading securities sold for short sales
2,511
2,511
-
(8) Borrowed money 801,742 803,766 (2,024)
(9) Short-term corporate bonds 129,400 129,400 -
(10) Corporate bonds 95,121 96,780 (1,658)
Total liabilities ¥7,028,429 ¥7,035,965 ¥ (7,536)
Derivative instruments (*3) Hedge accounting is not applied Hedge accounting is applied
¥ 33,841
(625)
¥ 33,841
(625)
¥- -
Total ¥ 33,216 ¥ 33,216 \-
(Millions of yen) Contract amount Fair value Other
Guarantee contracts (*4)
¥280,620
¥ 4,722 (*1) Carrying amount of Other monetary claims purchased, Monetary assets held in trust, and Lease
receivables and leased investment assets are presented as the amount net of reserve for credit losses
because they are immaterial.
(*2) For consumer loans held by consolidated subsidiaries included in Loans and bills discounted,
reserve for losses on interest repayments of ¥133,695 million was recognized for estimated losses on
reimbursements of excess interest payments, which included the reserve for losses on interest
repayments that has a possibility of being appropriated for loan principal in the future.
(*3) Derivative instruments include derivative transactions both in trading assets and liabilities, and in
other assets and liabilities. Derivative instruments are presented as net of assets and liabilities and
presented with ( ) when a liability stands on net basis.
(*4) Contract amount for guarantee contracts presents the amount of “Acceptances and guarantees” on
the consolidated balance sheet. Unearned guarantee fees of ¥21,898 million were recognized as “Other
liabilities.”
(Note 1) Valuation methodologies for financial instruments
Assets
(1) Cash and due from banks
The fair values are measured at carrying amounts because the fair values of due from banks
with no maturity approximate carrying amounts. Likewise, for due from banks with maturity, the fair
values are measured at carrying amounts because most of them are with short maturity of six months
or less, therefore the fair values approximate carrying amounts.
(2) Receivables under securities borrowing transactions
The fair values are measured at carrying amounts because most of them are with short
maturity of three months or less, therefore the fair values approximate carrying amounts.
(3) Other monetary claims purchased
- 23 -

The fair values are measured at quoted prices from third parties or determined using the
discounted cash flow method.
(4) Trading assets
The fair values of securities held for trading purposes are measured at market prices or quoted
prices from third parties.
(5) Monetary assets held in trust
The fair values are determined using discounted cash flow method based on the characteristics
of the components of the entrusted assets.
Notes on monetary assets held in trust by holding purposes are included in notes for
“Monetary assets held in trust.”
(6) Securities
The fair values of marketable equity securities are measured at closing prices on exchanges.
The fair values of bonds and mutual funds are measured at market prices or quoted prices from third
parties or determined using the discounted cash flow method.
Notes on securities by holding purposes are included in notes for “Securities.”
(7) Loans and bills discounted
The fair values of loans and bills discounted with fixed interest rate are determined by
discounting contractual cash flows, and the fair values of loans and bills discounted with floating
interest rate are determined by discounting expected cash flows based on the forward rates, using the
risk-free rate adjusted to account for credit risk (after consideration of collateral) with CDS spreads
etc. corresponding to internal credit rating of each borrower. The fair values of housing loans are
determined by discounting expected cash flows at the rates that consists of the risk free rate and
spreads that would be applied for the new housing loans with the same terms at the consolidated
balance sheet date. The fair values of consumer loans are determined by discounting expected cash
flows that reflect expected loss at the rates that consist of the risk-free rate and certain costs, by a
group of similar product types and customer segments.
For loans to obligors “legally bankrupt,” “virtually bankrupt” and “possibly bankrupt,” a
reserve is provided based on the discounted cash flow method, or based on amounts expected to be
collected through the disposal of collateral or execution of guarantees, so that the carrying amount net
of the reserve is a reasonable estimate of the fair values of those loans.
(8) Lease receivables and leased investment assets
The fair values are primarily determined by discounting contractual cash flows at the rates
that consist of the risk-free rate, credit risk and certain costs, by a group of major product categories.
(9) Installment receivables
The fair values are primarily determined by discounting expected cash flows that reflect the
probability of prepayment at the rates that consist of the risk-free rate, credit risk and certain costs, by
a group of major product categories.
- 24 -

Liabilities
(1) Deposits and (2) Negotiable certificates of deposit
The fair values of demand deposits, such as current deposits and ordinary deposits are
recognized as the payment amount at the consolidated balance sheet date. The fair values of the
deposits with maturity of six months or less approximate carrying amounts because of their short-term
maturity.
The fair values of time deposits are determined by discounting expected cash flows at the
rates that consists of the risk free rate and spreads that would be applied for new contracts with the
same terms at the consolidated balance sheet date.
(3) Debentures and (10) Corporate bonds
The fair values of marketable debentures and corporate bonds are measured at market prices.
The fair values of nonmarketable corporate debentures and corporate bonds under the Medium Term
Note program are determined by discounting expected cash flows at the actual average funding rates
of corporate time deposits etc. funded within the past three months of the consolidated balance sheet
date. The fair values of retail debentures are determined by discounting contractual cash flows at the
latest actual funding rate.
The fair values of step-up callable subordinated bonds are determined by discounting
expected cash flows, which reflect the probability of early redemption at the rates that consist of the
risk-free rate and the CDS spread of the Bank.
(4) Call money and bills sold, (5) Payables under repurchase agreements and (6) Payables under
securities lending transactions
The fair values approximate carrying amounts for call money and bills sold, payables under
repurchase agreements, and payables under securities lending transactions with short maturities of
three months or less.
(7) Trading liabilities
The fair values are measured at market prices.
(8) Borrowed money
The fair values of borrowed money with fixed interest rates are primarily determined by
discounting contractual cash flows (for borrowed money hedged by interest rate swaps which meets
specific matching criteria, the contractual cash flows include the cash flows of the interest rate swaps),
and the fair values of borrowed money with floating interest rates are determined by discounting
expected cash flows on forward rates, at the funding rates that reflect the credit risk of the borrower.
The fair values of step-up callable subordinated borrowings are determined by discounting
expected cash flows that reflect the probability of early redemption at the rates that consist of the
risk-free rate and the CDS spread of the Bank.
(9) Short-term corporate bonds
The fair values approximate carrying amounts because most of them are with short maturities
of six months or less.
- 25 -

Derivative instruments
The fair values are primarily measured at closing prices on exchanges or determined using the
discounted cash flow method or option-pricing models.
Other
Guarantee contracts
The fair values are determined by discounting the amount of difference between the original
contractual cash flows and the expected cash flows that would be applied for the new contract with the
same terms at the risk-free rate.
(Note 2)
Financial instruments whose fair values cannot be reliably determined were as follows, and these are
not included in the above (6) Securities.
(Millions of yen)
Category Carrying amount Equity securities without readily available market price (*1)(*2) ¥8,206 Investment in partnerships and others (*1)(*2) 38,758
Total ¥46,964
(*1) Equity securities without readily available market price are out of the scope of fair values
disclosure because their fair values cannot be reliably determined. Investments in partnerships and
others, the assets of which comprise equity securities without readily available market price, are out
of the scope of fair value disclosure because fair values of those investments cannot be reliably
determined.
(*2) For the fiscal year ended March 31, 2016, impairment losses on equity securities without readily
available market price of ¥167 million, and on investment in partnerships and others of ¥235 million
were recognized.
- 26 -

(Note 3) Redemption schedule of monetary claims and securities with contractual maturities
(Millions of yen)
Less than
1 year
More than 1 year
Less than 3 years
More than 3 years
Less than 5 years
More than 5 years
Due from banks Receivables under securities
borrowing transactions Other monetary claims purchased Other than trading purposes Securities
Held-to-maturity Japanese national government bonds Other
Available-for-sale Japanese national government bonds Japanese local government bonds Japanese corporate bonds Other
Loans and bills discounted Lease receivables and leased
investment assets Installment receivables
¥1,124,110 4,243
25,315
52,357 40,000 12,357 33,982
-
500 13,753 19,728
837,655 65,986
173,772
¥- -
16,627
130,438 130,000
438 93,476
- -
24,292 69,184
864,449 86,889
173,815
¥- -
-
245,201 240,000
5,201 93,873
30,013 -
28,111 35,748
840,038 38,468
60,940
¥- -
22,743
121,516 115,000
6,516 312,331
172,060 -
6,752 133,519
1,957,177 18,441
77,950
Total ¥2,317,424 ¥1,365,697 ¥1,278,523 ¥2,510,161 (Note) The financial instruments whose cash flow cannot be reliably estimated such as loans and
bills discounted to obligors of “legally bankrupt,” “virtually bankrupt” and “possibly bankrupt,” and
the financial instruments with no contractual maturity are not included in the table above.
- 27 -

(Note 4) Redemption schedule of corporate bonds, borrowed money and other interest-bearing debts
(Millions of yen)
Less than
1 year
More than 1 year
Less than 3 years
More than 3 years
Less than 5 years
More than 5 years
Deposits (*) Negotiable certificates of deposit Debentures Call money and bills sold Payables under repurchase agreements Payables under securities lending
transactions Borrowed money Short-term corporate bonds Corporate bonds
¥4,541,026
301,001 9,709
40,000 23,779
118,139
383,249 129,400
10,368
¥779,900 -
7,030 - - -
241,213
-
32,486
¥138,202 - - - - -
83,257
-
20,666
¥40,863 - - - - -
94,022
-
31,600
Total ¥5,556,673 ¥1,060,630 ¥242,126 ¥166,486 (*) The cash flow of demand deposits is included in “Less than 1 year.”
(Securities)
In addition to “Securities” on the consolidated balance sheet, the figures in the following tables
include trading securities and other securities related to trading transactions recorded in “Trading
assets,” and beneficiary interests included in “Other monetary claims purchased” that are accounted
for in the same way as securities.
1. Trading securities (as of March 31, 2016)
(Millions of yen) Unrealized gain (loss)
Trading securities ¥ (1,414)
Other monetary claims purchased for trading purposes (6,267)
- 28 -

2. Securities being held to maturity (as of March 31, 2016)
(Millions of yen) Type Carrying amount Fair value Unrealized
gain (loss)
Fair value exceeds carrying amount
Japanese national government bonds ¥535,841 ¥544,229 ¥8,387
Other 23,725 24,434 709
Subtotal 559,567 568,664 9,097
Fair value does not exceed carrying amount
Japanese national government bonds - - -
Other - - -
Subtotal - - -
Total ¥559,567 ¥568,664 ¥9,097
3. Securities available for sale (as of March 31, 2016)
(Millions of yen) Type Carrying amount
(Fair value) Amortized/
Acquisition cost Unrealized gain (loss)
Carrying amount exceeds amortized/acquisition cost
Equity securities ¥20,060 ¥11,091 ¥8,969
Domestic bonds: 231,257 226,768 4,489
Japanese national government bonds 194,330 191,375 2,955
Japanese local government bonds 505 500 5
Japanese corporate bonds 36,421 34,892 1,528
Other 159,075 156,041 3,033
Subtotal 410,394 393,901 16,492
Carrying amount does not exceed amortized/acquisition cost
Equity securities 2,017 2,237 (220)
Domestic bonds: 52,656 53,061 (404)
Japanese national government bonds 19,911 20,036 (124)
Japanese local government bonds - - -
Japanese corporate bonds 32,745 33,025 (280)
Other 126,585 127,469 (883)
Subtotal 181,259 182,767 (1,508)
Total ¥591,653 ¥576,669 ¥14,984
Note: “Unrealized gain (loss) on available-for-sale securities” on the consolidated balance sheet
- 29 -

consists of the following:
(Millions of yen)
Unrealized gain (loss) before deferred tax on:
Available-for-sale securities ¥ 14,984
The Bank’s interests in available-for-sale securities held by partnerships recorded as securities whose fair value cannot be reliably determined and other adjustments
2,297
Securities being held to maturity, reclassified from available-for sale in the past, under extremely illiquid market conditions (789)
Other monetary assets held in trust (1,016)
Less: Deferred tax liabilities 3,614
Unrealized gain (loss) on available-for-sale securities before interest adjustments 11,861
Less: Noncontrolling interests 76
The Bank’s interests in unrealized gain (loss) on available-for-sale securities held by affiliates to which the equity method is applied 125
Unrealized gain (loss) on available-for-sale securities ¥ 11,911
4. Available-for-sale securities sold during the current fiscal year (from April 1, 2015 to March 31,
2016)
(Millions of yen)
Proceeds from sales Gains on sales Losses on sales
Equity securities ¥5,338 ¥4,541 ¥-
Domestic bonds: 3,514,821 4,590 348
Japanese national government bonds 3,445,868 4,464 294
Japanese local government bonds 26,535 2 45
Japanese corporate bonds 42,418 123 9
Other 610,596 3,770 4,448
Total ¥4,130,756 ¥12,902 ¥4,797
5. Securities for which impairment losses are recognized
Individual securities (except for those whose fair value cannot be reliably determined), other
than trading securities, are written down when a decline in fair value is significant as compared
to the cost of such securities since the decline in fair value is deemed to be other than temporary.
The amount written down is accounted for as an impairment loss.
Impairment loss on such securities for the fiscal year ended March 31, 2016 was ¥439
- 30 -

million, which consisted of ¥439 million for equity securities.
To determine whether an other-than-temporary impairment has occurred, the Bank applies
the following rule, by the obligor classification of the security issuer based on the Bank’s
self-assessment guidelines:
Securities issued by “legally bankrupt,” “virtually bankrupt,” and “possibly bankrupt” obligors
The fair value of securities is less than the amortized/acquisition cost
Securities issued by “need caution” obligors
The fair value of securities declines by 30% or more compared to the amortized/acquisition cost
Securities issued by “normal” obligors The fair value of securities declines by 50% or more compared to the amortized/acquisition cost
“Legally bankrupt” obligors are those who have already gone bankrupt from a legal and/or
formal perspective.
“Virtually bankrupt” obligors are those who have not yet gone legally or formally bankrupt
but who are substantially bankrupt because they are in serious financial difficulties and are not
deemed to be capable of restructuring.
“Possibly bankrupt” obligors are those who are not yet bankrupt but are in financial
difficulties and are very likely to go bankrupt in the future.
“Need caution” obligors are those who require close attention because there are problems
with their borrowings.
“Normal” obligors are those whose business conditions are favorable and who are deemed
not to have any particular problems in terms of their financial position.
- 31 -
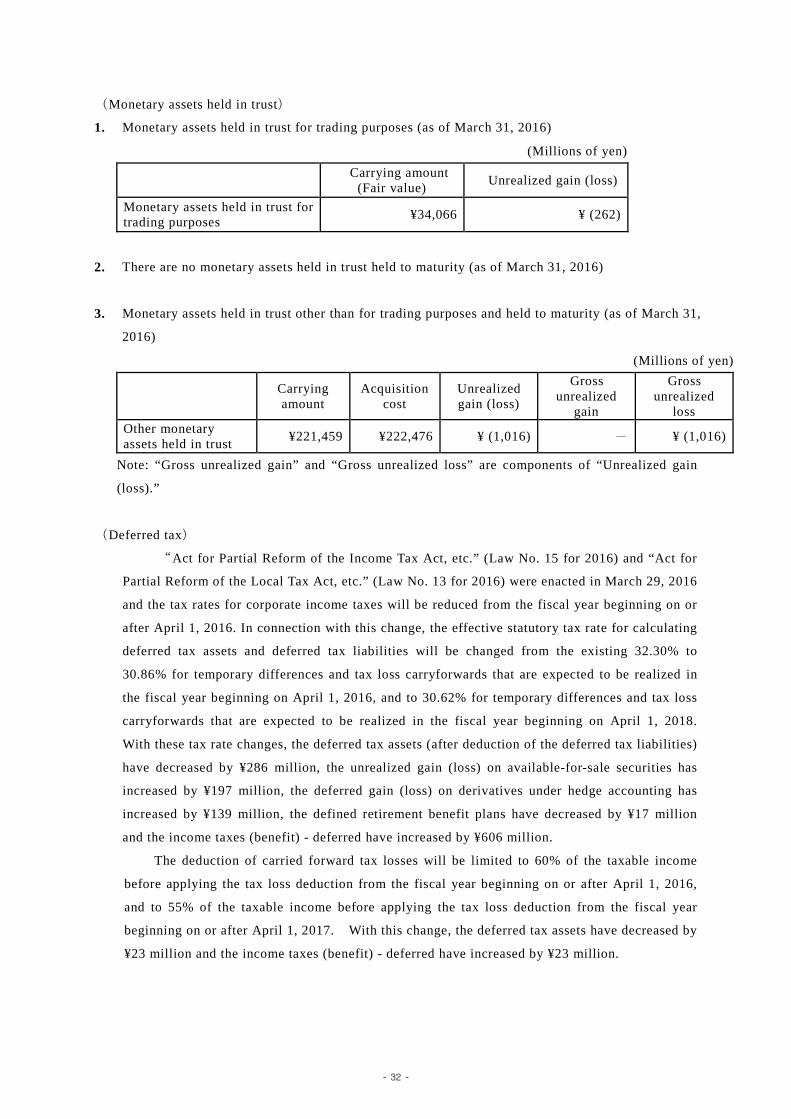
(Monetary assets held in trust)
1. Monetary assets held in trust for trading purposes (as of March 31, 2016)
(Millions of yen) Carrying amount
(Fair value) Unrealized gain (loss)
Monetary assets held in trust for trading purposes ¥34,066 ¥ (262)
2. There are no monetary assets held in trust held to maturity (as of March 31, 2016)
3. Monetary assets held in trust other than for trading purposes and held to maturity (as of March 31,
2016)
(Millions of yen)
Carrying amount
Acquisition cost
Unrealized gain (loss)
Gross unrealized
gain
Gross unrealized
loss Other monetary assets held in trust ¥221,459 ¥222,476 ¥ (1,016) - ¥ (1,016)
Note: “Gross unrealized gain” and “Gross unrealized loss” are components of “Unrealized gain
(loss).”
(Deferred tax)
“Act for Partial Reform of the Income Tax Act, etc.” (Law No. 15 for 2016) and “Act for
Partial Reform of the Local Tax Act, etc.” (Law No. 13 for 2016) were enacted in March 29, 2016
and the tax rates for corporate income taxes will be reduced from the fiscal year beginning on or
after April 1, 2016. In connection with this change, the effective statutory tax rate for calculating
deferred tax assets and deferred tax liabilities will be changed from the existing 32.30% to
30.86% for temporary differences and tax loss carryforwards that are expected to be realized in
the fiscal year beginning on April 1, 2016, and to 30.62% for temporary differences and tax loss
carryforwards that are expected to be realized in the fiscal year beginning on April 1, 2018.
With these tax rate changes, the deferred tax assets (after deduction of the deferred tax liabilities)
have decreased by ¥286 million, the unrealized gain (loss) on available-for-sale securities has
increased by ¥197 million, the deferred gain (loss) on derivatives under hedge accounting has
increased by ¥139 million, the defined retirement benefit plans have decreased by ¥17 million
and the income taxes (benefit) - deferred have increased by ¥606 million.
The deduction of carried forward tax losses will be limited to 60% of the taxable income
before applying the tax loss deduction from the fiscal year beginning on or after April 1, 2016,
and to 55% of the taxable income before applying the tax loss deduction from the fiscal year
beginning on or after April 1, 2017. With this change, the deferred tax assets have decreased by
¥23 million and the income taxes (benefit) - deferred have increased by ¥23 million.
- 32 -

(Per share information)
Common shareholders’ equity per share was ¥294.41.
Profit attributable to owners of parent per common share was ¥22.96.
Diluted profit attributable to owners of parent per common share was ¥22.96.
(Stock option)
1. Gains on unexercised and forfeited stock acquisition rights during the current fiscal year
¥ 698 million
2. Outline, number and movement of stock options
(1) Outline of stock options
The 5th stock acquisition rights The 6th stock acquisition rights
Number of grantees
Directors: 15 Statutory executive officers: 10
Employees: 437
Statutory executive officers: 5 Employees: 35
Number of stock options granted (Note 1)
Common stock: 2,609,000 shares
Common stock: 2,313,000 shares
Common stock: 1,439,000 shares
Common stock: 1,417,000 shares
Grant date June 27, 2005 June 27, 2005
Condition for vesting (Note: 2) (Note: 2)
Required service period
From June 27, 2005 to July 1, 2007
From June 27, 2005 to July 1, 2008
From June 27, 2005 to July 1, 2007
From June 27, 2005 to July 1, 2008
Exercise period
From July 1, 2007 to June 23, 2015
From July 1, 2008 to June 23, 2015
From July 1, 2007 to June 23, 2015
From July 1, 2008 to June 23, 2015
The 7th stock acquisition rights The 8th stock acquisition rights
Number of grantees
Statutory executive officers: 8 Employees: 127
Statutory executive officers: 1 Employees: 34
Number of stock options granted (Note 1)
Common stock: 678,000 shares
Common stock: 609,000 shares
Common stock: 287,000 shares
Common stock: 274,000 shares
Grant date June 27, 2005 June 27, 2005
Condition for vesting (Note: 2) (Note: 2)
Required service period
From June 27, 2005 to July 1, 2008
From June 27, 2005 to July 1, 2010
From June 27, 2005 to July 1, 2008
From June 27, 2005 to July 1, 2010
Exercise period
From July 1, 2008 to June 23, 2015
From July 1, 2010 to June 23, 2015
From July 1, 2008 to June 23, 2015
From July 1, 2010 to June 23, 2015
- 33 -

The 9th stock acquisition rights The 10th stock acquisition rights
Number of grantees Employees: 2 Employees: 2
Number of stock options granted (Note 1)
Common stock: 79,000 shares
Common stock: 78,000 shares
Common stock: 27,000 shares
Common stock: 26,000 shares
Grant date September 28, 2005 September 28, 2005
Condition for vesting (Note: 2) (Note: 2)
Required service period
From September 28, 2005 to July 1, 2007
From September 28, 2005 to July 1, 2008
From September 28, 2005 to July 1, 2008
From September 28, 2005 to July 1, 2010
Exercise period
From July 1, 2007 to June 23, 2015
From July 1, 2008 to June 23, 2015
From July 1, 2008 to June 23, 2015
From July 1, 2010 to June 23, 2015
The 13th stock acquisition rights The 14th stock acquisition rights
Number of grantees
Directors: 15 Statutory executive officers: 14
Employees: 559
Statutory executive officers: 3 Employees: 28
Number of stock options granted (Note 1)
Common stock: 2,854,000 shares
Common stock: 2,488,000 shares
Common stock: 1,522,000 shares
Common stock: 1,505,000 shares
Grant date May 25, 2006 May 25, 2006
Condition for vesting (Note: 2) (Note: 2)
Required service period
From May 25, 2006 to June 1, 2008
From May 25, 2006 to June 1, 2009
From May 25, 2006 to June 1, 2008
From May 25, 2006 to June 1, 2009
Exercise period
From June 1, 2008 to June 23, 2015
From June 1, 2009 to June 23, 2015
From June 1, 2008 to June 23, 2015
From June 1, 2009 to June 23, 2015
The 15th stock acquisition rights The 16th stock acquisition rights
Number of grantees
Statutory executive officers: 12 Employees: 159 Employees: 19
Number of stock options granted (Note 1)
Common stock: 749,000 shares
Common stock: 690,000 shares
Common stock: 170,000 shares
Common stock: 161,000 shares
Grant date May 25, 2006 May 25, 2006
Condition for vesting (Note: 2) (Note: 2)
Required service period
From May 25, 2006 to June 1, 2009
From May 25, 2006 to June 1, 2011
From May 25, 2006 to June 1, 2009
From May 25, 2006 to June 1, 2011
Exercise period
From June 1, 2009 to June 23, 2015
From June 1, 2011 to June 23, 2015
From June 1, 2009 to June 23, 2015
From June 1, 2011 to June 23, 2015
- 34 -

The 17th stock acquisition rights The 18th stock acquisition rights
Number of grantees
Directors: 12 Statutory executive officers: 13
Employees: 110
Statutory executive officers: 3 Employees: 23
Number of stock options granted (Note 1)
Common stock: 1,691,000 shares
Common stock: 1,615,000 shares
Common stock: 747,000 shares
Common stock: 733,000 shares
Grant date May 25, 2007 May 25, 2007
Condition for vesting (Note: 2) (Note: 2)
Required service period
From May 25, 2007 to June 1, 2009
From May 25, 2007 to June 1, 2011
From May 25, 2007 to June 1, 2009
From May 25, 2007 to June 1, 2011
Exercise period
From June 1, 2009 to May 8, 2017
From June 1, 2011 to May 8, 2017
From June 1, 2009 to May 8, 2017
From June 1, 2011 to May 8, 2017
The 19th stock acquisition rights The 20th stock acquisition rights
Number of grantees
Directors and employees in subsidiaries: 32
Directors: 12 Statutory executive officers: 8
Employees: 104 Number of stock options granted (Note 1)
Common stock: 86,000 shares
Common stock: 54,000 shares
Common stock: 1,445,000 shares
Common stock: 1,385,000 shares
Grant date July 2, 2007 May 30, 2008
Condition for vesting (Note: 2) (Note: 2)
Required service period
From July 2, 2007 to July 1, 2009
From July 2, 2007 to July 1, 2011
From May 30, 2008 to June 1, 2010
From May 30, 2008 to June 1, 2012
Exercise period
From July 1, 2009 to June 19, 2017
From July 1, 2011 to June 19, 2017
From June 1, 2010 to May 13, 2018
From June 1, 2012 to May 13, 2018
The 21st stock acquisition rights The 22nd stock acquisition rights
Number of grantees
Statutory executive officers: 1 Employees: 29
Directors and employees in subsidiaries: 43
Number of stock options granted (Note 1)
Common stock: 1,049,000 shares
Common stock: 1,032,000 shares
Common stock: 121,000 shares
Common stock: 82,000 shares
Grant date May 30, 2008 July 10, 2008
Condition for vesting (Note: 2) (Note: 2)
Required service period
From May 30, 2008 to June 1, 2010
From May 30, 2008 to June 1, 2012
From July 10, 2008 to July 1, 2010
From July 10, 2008 to July 1, 2012
Exercise period
From June 1, 2010 to May 13, 2018
From June 1, 2012 to May 13, 2018
From July 1, 2010 to June 24, 2018
From July 1, 2012 to June 24, 2018
- 35 -
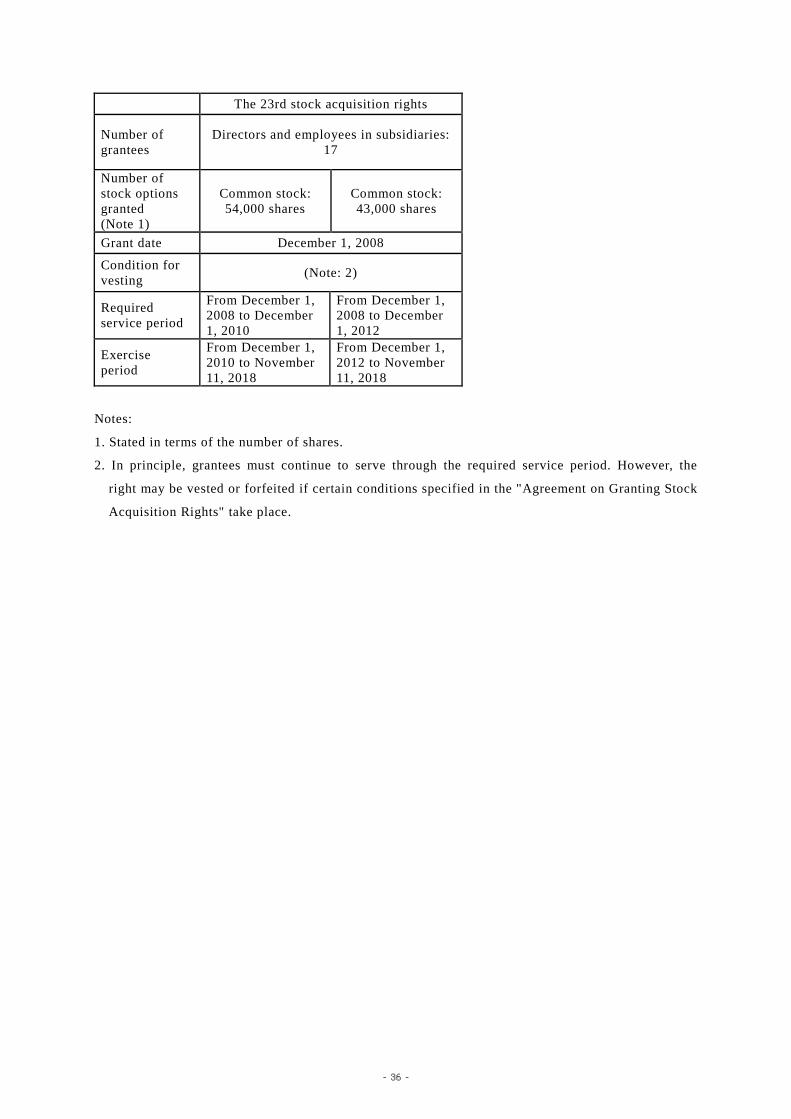
The 23rd stock acquisition rights
Number of grantees
Directors and employees in subsidiaries: 17
Number of stock options granted (Note 1)
Common stock: 54,000 shares
Common stock: 43,000 shares
Grant date December 1, 2008
Condition for vesting (Note: 2)
Required service period
From December 1, 2008 to December 1, 2010
From December 1, 2008 to December 1, 2012
Exercise period
From December 1, 2010 to November 11, 2018
From December 1, 2012 to November 11, 2018
Notes:
1. Stated in terms of the number of shares.
2. In principle, grantees must continue to serve through the required service period. However, the
right may be vested or forfeited if certain conditions specified in the "Agreement on Granting Stock
Acquisition Rights" take place.
- 36 -

(2) Number of stock options and movement therein
Stock options that existed during the current fiscal year are covered. Number of stock options is
stated in terms of the number of shares.
(a) Number of stock options 5th 6th Nonvested (share)
Outstanding at the beginning of the year - -
Granted during the year - - Forfeited during the year - - Vested during the year - - Outstanding at the end of the year - -
Vested (Share)
Outstanding at the beginning of the year 2,031,000 1,496,000
Vested during the year - - Exercised during the year - - Forfeited during the year 2,031,000 1,496,000 Exercisable at the end of the year - -
7th 8th 9th 10th Nonvested (share)
Outstanding at the beginning of the year - - - -
Granted during the year - - - - Forfeited during the year - - - - Vested during the year - - - - Outstanding at the end of the year - - - -
Vested (Share)
Outstanding at the beginning of the year 434,000 170,000 108,000 36,000
Vested during the year - - - - Exercised during the year - - - - Forfeited during the year 434,000 170,000 108,000 36,000 Exercisable at the end of the year - - - -
- 37 -

13th 14th 15th 16th Nonvested (share)
Outstanding at the beginning of the year - - - -
Granted during the year - - - - Forfeited during the year - - - - Vested during the year - - - - Outstanding at the end of the year - - - -
Vested (Share)
Outstanding at the beginning of the year 1,948,000 1,717,000 428,000 19,000
Vested during the year - - - - Exercised during the year - - - - Forfeited during the year 1,948,000 1,717,000 428,000 19,000 Exercisable at the end of the year - - - -
17th 18th 19th 20th Nonvested (share)
Outstanding at the beginning of the year - - - -
Granted during the year - - - - Forfeited during the year - - - - Vested during the year - - - - Outstanding at the end of the year - - - -
Vested (Share)
Outstanding at the beginning of the year 1,224,000 805,000 140,000 1,139,000
Vested during the year - - - - Exercised during the year - - - - Forfeited during the year - 6,000 - - Exercisable at the end of the year 1,224,000 799,000 140,000 1,139,000
- 38 -

21st 22nd 23rd Nonvested (share)
Outstanding at the beginning of the year - - -
Granted during the year - - - Forfeited during the year - - - Vested during the year - - - Outstanding at the end of the year - - -
Vested (Share)
Outstanding at the beginning of the year 42,000 188,000 54,000
Vested during the year - - - Exercised during the year - - - Forfeited during the year - 10,000 - Exercisable at the end of the year 42,000 178,000 54,000
(b) Price information
5th 6th Exercise price (yen) 601 601 Weighted-average stock price at the date of exercise (yen) - -
7th 8th 9th 10th Exercise price (yen) 601 601 697 697 Weighted-average stock price at the date of exercise (yen) - - - -
13th 14th
Exercise period From June 1, 2008 to June 23, 2015
From June 1, 2009 to June 23, 2015
From June 1, 2008 to June 23, 2015
From June 1, 2009 to June 23, 2015
Exercise price (yen) 825 825 Weighted-average stock price at the date of exercise (yen) - -
Fair value at grant date (yen) 163 173 163 173
15th 16th
Exercise period From June 1, 2009 to June 23, 2015
From June 1, 2011 to June 23, 2015
From June 1, 2009 to June 23, 2015
From June 1, 2011 to June 23, 2015
Exercise price (yen) 825 825 Weighted-average stock price at the date of exercise (yen) - -
Fair value at grant date (yen) 173 192 173 192
- 39 -

17th 18th
Exercise period From June 1, 2009 to May 8, 2017
From June 1, 2011 to May 8, 2017
From June 1, 2009 to May 8, 2017
From June 1, 2011 to May 8, 2017
Exercise price (yen) 555 555 Weighted-average stock price at the date of exercise (yen) - -
Fair value at grant date (yen) 131 143 131 143
19th 20th
Exercise period From July 1, 2009 to June 19, 2017
From July 1, 2011 to June 19, 2017
From June 1, 2010 to May 13, 2018
From June 1, 2012 to May 13, 2018
Exercise price (yen) 527 416 Weighted-average stock price at the date of exercise (yen) - -
Fair value at grant date (yen) 121 132 158 169
21st 22nd
Exercise period From June 1, 2010 to May 13, 2018
From June 1, 2012 to May 13, 2018
From July 1, 2010 to June 24, 2018
From July 1, 2012 to June 24, 2018
Exercise price (yen) 416 407 Weighted-average stock price at the date of exercise (yen) - -
Fair value at grant date (yen) 158 169 127 137
23rd
Exercise period
From December 1, 2010 to November 11, 2018
From December 1, 2012 to November 11, 2018
Exercise price (yen) 221 Weighted-average stock price at the date of exercise (yen) -
Fair value at grant date (yen) 53 57
Note: With regard to stock options from 5th to 10th, the Bank does not describe “Fair value at grant
date” because they were granted prior to the enforcement of the Companies Act.
3. Measurement of the fair value of stock options
There was no stock option granted or whose fair value was changed due to the modification to
the terms and conditions during the fiscal year.
4. Method of determining the vested number of stock options
Incorporated only the actual forfeited options, as the reasonable estimate of future forfeiture is
not determinable.
- 40 -

Notes to the nonconsolidated financial statements
All yen amounts are rounded down to millions of yen.
Significant accounting policies
1. Recognition and measurement of trading assets / liabilities and trading income / losses
Trading account positions entered into to generate gains arising from short-term changes in
interest rates, currency exchange rates or market prices of securities and other market-related
indices, or from price differences among markets, are included in “Trading assets” and “Trading
liabilities” on a trade date basis. The income and losses resulting from trading activities are
included in “Trading income” and “Trading losses.”
Trading securities and monetary claims purchased for trading purposes are stated at market
value at the balance sheet date and derivative financial instruments related to trading positions
are stated at fair value based on estimated amounts that would be settled in cash if such position
were terminated at the balance sheet date.
Trading income and trading losses include interest received and paid during the fiscal year
and unrealized gains and losses resulting from the change in the value of securities and monetary
claims purchased, and derivatives between the beginning and the end of the fiscal year.
In estimating fair values of derivative financial instruments included in trading accounts,
liquidity risks and credit risks are reflected.
2. Measurement of securities
(a) Securities for trading purposes (except for those included in trading accounts) are carried at
fair value (cost of securities sold is determined by the moving-average method). Securities being
held to maturity are carried at amortized cost (using the straight-line method) determined by the
moving-average method. Investments in subsidiaries and affiliates are carried at cost determined
by the moving-average method. Available-for-sale securities are carried at fair value at the
balance sheet date (cost of securities sold is determined by the moving-average method) in
principle, with the exception of those whose fair value cannot be reliably determined, which are
carried at cost determined by the moving-average method. Investments in partnerships and others
are carried at the amount of the Bank’s share of net asset value based on their most recent
financial statements.
Unrealized gain (loss) on available-for-sale securities is directly recorded in a separate
component of equity, after deducting the amount charged to profit or loss by applying fair value
hedge accounting.
(b) The values of securities included in monetary assets held in trust are determined by the same
methods as stated in (a) above.
3. Measurement of derivatives
Derivatives (except for those included in trading accounts) are carried at fair value.
- 41 -

4. Measurement of other monetary claims purchased
Other monetary claims purchased held for trading purposes (except for those included in
trading accounts) are carried at fair value.
5. Depreciation
(a) Premises and equipment
Depreciation of buildings and computers equipment (including ATMs) other than personal
computers is computed using the straight-line method, and depreciation of other equipment is
computed using the declining-balance method. Principal estimated useful lives are as follows:
Buildings: 8 – 50 years
Others: 2 – 20 years
(b) Intangible assets (excluding leased assets)
Amortization of intangible assets is computed using the straight-line method. The
amortization period of respective intangible assets is as follows:
Capitalized software for internal use 5 years (the estimated useful lives)
Goodwill 3-10 years
Other intangible assets (trade name and trade mark) 7 years
(c) Leased assets
Depreciation of leased assets under finance lease transactions that were deemed to transfer
ownership of the leased property to the lessee, which are included in “Intangible assets,” is
computed using the same method which is applied to the own properties.
6. Deferred charges
Deferred charges are accounted for as follows:
(a) Deferred issuance expenses for corporate bonds
Deferred issuance expenses for corporate bonds, which are included in other assets, are
amortized using the straight-line method over the term of the corporate bonds.
Corporate bonds are stated at amortized costs calculated by the straight-line method.
(b) Deferred issuance expenses for debentures
Deferred issuance expenses for debentures are amortized using the straight-line method over
the term of the debentures.
7. Reserves and allowances
(a) Reserve for credit losses
The reserve for credit losses has been established as described below based on the
predetermined internal rules for establishing the reserve.
For claims to obligors who are legally bankrupt due to bankruptcy, special liquidation
proceedings or similar legal proceedings (“legally bankrupt obligors”) or to obligors who are
effectively in similar conditions (“virtually bankrupt obligors”), a specific reserve is provided
based on the amount of claims, after the charge-off stated below, net of amounts expected to be
- 42 -

collected through the disposal of collateral or execution of guarantees.
For claims to obligors who are not yet bankrupt but are in financial difficulties and are very
likely to go bankrupt in the future (“possibly bankrupt obligors”), except claims to obligors with
larger claims than a predetermined amount, a specific reserve is provided for the amount
considered to be necessary based on an overall solvency assessment performed for the amount of
claims net of amounts expected to be collected through the disposal of collateral or execution of
guarantees.
With regard to claims to possibly bankrupt obligors, restructured loans and certain claims for
which the reserve has been provided based on the discounted cash flow method (as mentioned
below) in previous fiscal years, provided that obligors’ cash flows for debt service are reasonably
estimable and the balance of claims to such obligors are at or larger than a predetermined amount,
the reserve for credit losses is determined as the difference between (i) relevant estimated cash
flows discounted by the original contractual interest rate and (ii) the book value of the claim
(discounted cash flow method). In cases where it is difficult to reasonably estimate future cash
flows, the reserve is provided based on expected loss amount for the remaining term of respective
claims.
For other claims, a general reserve is provided based on historical loan loss experience.
For specific foreign claims, there is a reserve for loans to restructuring countries which has
been provided based on losses estimated by considering the political and economic conditions in
those countries.
All claims are assessed by business divisions based on the predetermined internal rules for
the self-assessment of asset quality. The Credit Assessment Division, which is independent from
business divisions, conducts verifications of these assessments, and additional reserves may be
provided based on the verification results.
For collateralized or guaranteed claims to legally bankrupt obligors or virtually bankrupt
obligors, the amount of claims exceeding the estimated value of collateral or guarantees, which is
deemed uncollectible, has been charged off and totaled ¥ 34,047 million.
(b) Accrued employees’ bonuses
Accrued employees’ bonuses are provided in the amount of the estimated bonuses that are
attributable to the current fiscal year.
(c) Reserve for employees’ retirement benefits
The reserve for employees’ retirement benefits is provided for the payment of employees’
retirement benefits based on the estimated amounts of the projected benefit obligation and the
estimated value of pension plan assets as of the balance sheet date. The projected benefit
obligation is estimated using the benefit formula basis for attributing the expected benefits to the
current fiscal year.
The unrecognized past service cost and the unrecognized actuarial gain (loss) are treated in
the following manner:
- 43 -

Unrecognized past service cost:
Amortized using the straight-line method over the
average remaining service period (14.74 years) from the
fiscal year of occurrence.
Unrecognized actuarial gain
(loss):
Amortized using the straight-line method over the
average remaining service period (7.48-14.74 years)
from the fiscal year of occurrence.
(d) Reserve for reimbursement of debentures
The reserve for reimbursement of debentures is provided for estimated losses on future
reimbursement requests of debentures derecognized from liabilities.
(Additional information)
Even though the debentures derecognized from Liabilities had been recorded as a loss when
reimbursement requests were made, from this fiscal year the reserve for reimbursement of
debentures is recorded due to the availability of a reasonable estimate as a result of the
development and analysis of past reimbursement requests.
As a result, Ordinary profit and Income before income taxes both decreased by ¥2,903
million.
8. Translation of foreign currency-denominated assets and liabilities
Foreign currency-denominated assets and liabilities are translated into Japanese yen at the
exchange rates as of the balance sheet date, except for investments in subsidiaries and affiliates
which are translated at the relevant historical exchange rates.
9. Hedge accounting
(a) Hedge of interest rate risks
The Bank applies the deferral hedge accounting for derivative transactions that meet the
hedge accounting criteria for mitigating interest risks of its financial assets and liabilities.
The Bank adopted portfolio hedging to determine the effectiveness of hedging instruments in
accordance with Industry Audit Committee Report No. 24 issued, in February 13 2002, by the
Japanese Institute of Certified Public Accountants (the “JICPA”). Under portfolio hedging to
mitigate the change in fair value, a portfolio of hedged items with common maturities such as
deposits or loans is designated and matched with a group of hedging instruments such as interest
rate swaps, which offset the effect of fair value fluctuations of the hedged items by identified
maturities. The effectiveness of the portfolio hedging is assessed by each group.
As for portfolio hedging activities to fix cash flows, the effectiveness is assessed based on
the correlation between the base interest rates index of the hedged cash flow and that of the
hedging instruments.
(b) Hedge of foreign exchange fluctuation risks
The Bank applies either deferral hedge accounting or fair value hedge accounting for
- 44 -

derivative transactions for the purpose of hedging foreign exchange fluctuation risks of the
Bank’s financial assets and liabilities denominated in a foreign currency.
Under deferral hedge accounting, which is in accordance with “Accounting and Auditing
Treatment of Accounting Standards for Financial Instruments in the Banking Industry” (Industry
Audit Committee Report No. 25 of the JICPA, July 29 2002), hedged items are identified by
grouping the foreign currency-denominated financial assets and liabilities by currency and
designating derivative transactions such as currency swap transactions, fund swap transactions
and forward exchange contracts as hedging instruments. Hedge effectiveness is reviewed by
comparing the total foreign currency position of the hedged items and hedging instruments by
currency.
The Bank also applies deferral hedge accounting and fair value hedge accounting to
translation gains or losses from foreign currency-denominated investments in foreign subsidiaries
and affiliates and available-for-sale securities (other than bonds denominated in foreign
currencies) when such foreign currency exposures recorded as assets are hedged with offsetting
foreign currency liabilities and the liabilities equal or exceed the acquisition cost of such foreign
currency assets.
(c) Intracompany derivative transactions
Gains (losses) on intracompany derivative hedging transactions between the trading book
and the banking book are not eliminated since offsetting transactions with third parties are
appropriately entered into in conformity with the nonarbitrary and strict hedging policy in
accordance with Industry Audit Committee Reports No. 24 and No. 25 of the JICPA. As a result,
in the banking book, realized gains (losses) on such intracompany transactions are reported in
current earnings and valuation gains (losses) which meet the hedge accounting criteria are
deferred.
10. Reserve for employees’ retirement benefits
The method of recognition of the unrecognized actuarial gain (loss) and the unrecognized
past service cost are different from the method in the consolidated financial statements.
11. Consumption tax
The national consumption tax and the local consumption tax are excluded from transaction
amounts.
12. Consolidated corporate tax system
The consolidated corporate tax system is adopted by the Bank.
(Additional information)
The reserve for directors’ retirement benefits was provided for the payment of directors’
retirement benefits based on the amount that would be required if all directors retired at the
balance sheet date as of March 31, 2015. However the Bank decided to abolish the Retirement
- 45 -

Allowance Plan for Officers at the 15th Annual General Meeting of Shareholders which was held
on June 17, 2015 and resolved to pay retirement allowances to the Directors and Audit &
Supervisory Board Members at the Meeting. As a result, the reserve for directors’ retirement
benefits was reversed and the unpaid balance of ¥73 million is included in “Other” presented in
“Other liabilities”.
Notes
(Balance Sheet)
1. Investments in subsidiaries and affiliates were as follows.
(Millions of yen)
Carrying amount
Equity securities ¥417,834
Other 3,107
2. For securities held in connection with securities borrowing transactions with or without cash
collateral, securities purchased under resale agreements and securities accepted as collateral for
derivative transactions, where the Bank has the right to sell or pledge such securities without
restrictions ¥8,520 million of those securities was held by the Bank at the balance sheet date.
3. Loans to bankrupt obligors and nonaccrual delinquent loans of ¥1,339 million and
¥30,703 million, respectively, were included in loans and bills discounted.
Loans to bankrupt obligors are loans, after write-off, to legally bankrupt obligors as defined
in Article 96, Paragraph 1, Items 3 and 4 of the Order for Enforcement of the Corporation Tax Act
(Cabinet Order No. 97 of 1965) and on which accrued interest income is not recognized as there is
substantial doubt about the ultimate collectability of either principal or interest because they are
past due for a considerable period of time or for other reasons.
Nonaccrual delinquent loans are loans on which accrued interest income is not recognized,
excluding loans to bankrupt obligors and loans for which interest payments are deferred in order
to facilitate the rehabilitation of obligors or to assist in the financial recovery of obligors.
4. Loans past due for three months or more of ¥1,446 million were included in loans and bills
discounted.
Loans past due for three months or more are loans other than loans to bankrupt obligors and
nonaccrual delinquent loans, for which the principal and/or interest payments are past due for
three months or more.
5. Restructured loans of ¥1,191 million were included in loans and bills discounted.
Restructured loans are loans other than loans to bankrupt obligors, nonaccrual delinquent
loans or loans past due for three months or more, on which concessions such as reduction of the
stated interest rate, a deferral of interest payment, an extension of the maturity date, debt
- 46 -

forgiveness, or other agreements which give advantages to obligors in financial difficulties have
been granted to obligors to facilitate their rehabilitation.
6. The total amount of loans to bankrupt obligors, nonaccrual delinquent loans, loans past due for
three months or more, and restructured loans was ¥34,681 million.
The amounts of loans mentioned in Notes 3 through 6 above represent the gross receivable
amounts prior to reduction of the reserve for credit losses.
7. Bills discounted, such as bank acceptances bought, commercial bills discounted, documentary
bills and foreign exchange contracts bought, are accounted for as financing transactions in
accordance with Industry Audit Committee Report No. 24 of the JICPA, although the Bank has
the right to sell or pledge them without restrictions. The face amount of such bills discounted held
as of March 31, 2016 was ¥368 million.
8. The total principal amount of loans accounted for as a sale through loan participations was ¥8,384
million as of March 31, 2016. This “off-balance sheet” treatment is in accordance with Report No.
3 issued by the Framework Committee of the JICPA on November 28, 2014. The total principal
amount of such loans in which the Bank participated was ¥6,756 million as of March 31, 2016.
9. Assets pledged as collateral were as follows:
Cash and due from banks ¥ 10 million
Monetary assets held in trust 14
Securities 465,525
Loans and bills discounted 95,075
Other presented in other assets 15,153
Liabilities collateralized were as follows:
Deposits ¥ 1,159 million
Payables under repurchase agreements 23,779
Payables under securities lending transactions 116,409
Borrowed money 287,627
Other presented in other liabilities 10
Acceptances and guarantees 970
In addition, ¥62,559 million of securities were pledged as collateral for transactions,
including exchange settlements, swap transactions and replacement of margin for futures
transactions.
Also, ¥9,603 million of security deposits and ¥141 million of guarantee deposits under resale
agreements and repurchase agreements were included in “Other” presented in “Other assets.”
- 47 -

10. The Bank establishes credit lines for overdrafts and issues commitments to extend credit to meet
the financing needs of its customers. The unfunded amount of these commitments was ¥3,038,086
million, out of which the amount with original agreement terms of less than one year or which was
cancelable was ¥2,820,083 million.
As a large majority of these commitments expire without being drawn upon, the unfunded
amounts do not necessarily represent future cash requirements. Many of such agreements include
conditions granting the Bank the right to reject the drawdown or to reduce the amount on the basis
of changes in the financial circumstances of the borrower or other reasonable grounds.
In addition, the Bank obtains collateral when necessary to reduce credit risk related to these
commitments.
11. Accumulated depreciation on premises and equipment was ¥17,441 million.
12. Deferred gains on premises and equipment deducted for tax purposes were ¥30 million.
13. Software in progress of ¥6,618 million were included in Software.
(Change in presentation)
Software in progress(¥2,075 million at the end of the previous fiscal year) which has been
included in “Software”, is separately presented in the notes due to the materiality of its balance.
14. Subordinated debt of ¥51,000 million was included in borrowed money.
15. Subordinated bonds of ¥41,419 million were included in corporate bonds.
16. Total obligations to the Directors and Audit & Supervisory Board Members stand at ¥73 million.
17. Total monetary claims to subsidiaries and affiliates stand at ¥269,640 million.
18. Total monetary liabilities against subsidiaries and affiliates stand at ¥253,052 million.
19. According to the Article 18 of the Banking Act, there is a limitation on dividends from surplus.
When dividends from surplus are paid out, notwithstanding the provision of Article 445, Item 4
of the Corporation Act (Amounts of Capital and Amount of Reserves), the amount multiplied by
1/5 of surplus to be decreased by such dividends from surplus is accrued as additional paid-in
capital or legal reserve.
The amount of legal reserve to be accrued in connection with such dividends from surplus in
the current fiscal year was ¥530 million.
- 48 -

20. Projected benefit obligations, etc., at the end of the current fiscal year were as follows:
Projected benefit obligation
Fair value of plan assets
¥
(62,818)
62,806
million
Unfunded retirement benefit obligations
Unrecognized net actuarial losses
Unrecognized past service cost
(12)
1,492
(406)
Net amount recognized on the balance sheet
Prepaid pension cost
1,073
1,073
(Statement of Income)
1. Earnings from transactions with subsidiaries and affiliates
Total interest income: ¥15,029 million
Total fees and commissions income: ¥4,879 million
Total earnings from other businesses and other ordinary transactions: ¥508 million
Total earnings from other transactions: ¥ 186 million
Expenses from transactions with subsidiaries and affiliates
Total interest expenses: ¥1,046 million
Total fees and commissions expenses: ¥14,549 million
Total expenses from other businesses and other ordinary transactions: ¥509 million
Total expenses from other transactions: ¥2,404 million
2. “Other extraordinary gains” is gains on unexercised and forfeited stock acquisition rights of ¥698
million.
3. “Impairment losses” are impairment losses as for the following asset groups.
Location Usage Asset type Amount (Millions of yen)
Tokyo, Aichi, etc. Branch and ATMs Buildings, Other premises
and equipment ¥278
Tokyo, Osaka, etc. IT-related property Other premises and
equipment, Software 201
Total ¥480
The Bank determines the asset group based on the management segmentation.
As a result of consideration of the business environment, the Bank made a decision to close
down some of the branches and ATMs for Individual Group and to cease use and development of
some software assets, and segregated them as idle assets. Impairment losses for these assets were
recognized assuming their recoverable amount to be zero.
In the above impairment loss amount, ¥271 million was for “Buildings,” ¥75 million was for
“Other premises and equipment” and ¥133 million was for “Software.”
- 49 -

4. “Other extraordinary losses” is impairment loss on investments in subsidiaries and affiliates
of ¥6,701 million and Loss on sales of shares of subsidiaries and affiliates of ¥135 million.
5. Significant related-party transactions to be disclosed were as follows:
(1) Parent company and major corporate share holders
Not applicable.
(2) Subsidiaries and affiliates
(Millions of yen)
Cat
egor
y
Name of corporation or organization
Ratio of voting rights held by
the Bank
Relation -ship Details of transaction Transaction
amount B/S account Balance at fiscal year
end
Subs
idia
ries
APLUS Co., Ltd.
Indirect holding 100%
Lending Purchase of beneficial interests (Note 1)
¥130,000 - ¥-
Zen-Nichi Shinpan Co., Ltd.
Indirect holding 100%
Lending
Overdraft loan transaction (Note 2)
86,566 Loans and
bills discounted
82,500
Receipt of loan interests (Note 2)
484 Accrued income
1
Shinsei Financial Co., Ltd.
Direct holding
100% Lending
Guarantee to Bank’s loan assets (Note 3)
206,379 - -
Payment of guarantee fees (Note 3)
12,908 Accrued
expenses 1,609
Subrogation receipt(Note 3)
17,935 - -
Note: 1. The Bank purchased beneficial interests backed by the monetary claims in APLUS Co., Ltd. The
transaction price was determined at a reasonable level according to the market conditions. 2. The lending is for the purpose of business operation. Also, the interest rate is determined at a
reasonable level considering the market conditions. Transaction amount of overdraft loan is the average balance during this current fiscal year.
3. Shinsei Financial Co., Ltd. guarantees the unsecured loans to individuals. The guarantee fees were determined at a reasonable level according to the market conditions.
(3) Fellow subsidiaries
Not applicable.
- 50 -

(4) Directors and major individual shareholders
(Millions of yen) C
ateg
ory
Name of corporation or organization
Ratio of voting rights held by the
counterparty
Relation- ship
Details of transaction
Transaction amount B/S account
Balance at fiscal year end
Cor
pora
tions
and
org
aniz
atio
ns in
whi
ch a
maj
ority
of
the
votin
g ri
ghts
is o
wne
d by
dir
ecto
rs o
r th
eir
fam
ily
mem
bers
(in
clud
ing
thei
r su
bsid
iari
es)
J.C.Flowers II L.P. (Note 1)
- Concurrent post
Investment (Note 2) 198 - -
Dividend 1,837 - -
J.C.Flowers III L.P. (Note 1)
- Concurrent post
Investment (Note 3) 1,134 - -
Dividend 1,697 - -
Note: 1. The fund is operated by J.C. Flowers & Co. LLC for which J. Christopher Flowers, director of the Bank, serves as the
managing director and chief executive officer. 2. The committed investment amounts are U.S.$ 200 million based on the limited partnership agreement. 3. The committed investment amounts are U.S.$ 34,975 thousand based on the limited partnership agreement.
(Statement of Changes in Equity)
Type and number of treasury stock were as follows:
(Unit: thousand shares)
Number of shares as of
April 1, 2015
Number of shares
increased
Number of shares
decreased
Number of shares as of
March 31, 2016
Note
Treasury stock:
Common stock 96,428 1 - 96,429 (Note)
Total 96,428 1 - 96,429
Note: The increase of shares is associated with the acquisition of fractional share.
(Securities)
In addition to “Securities” on the balance sheet, the figures in the following tables include beneficiary
interests included in “Other monetary claims purchased” that are accounted for in the same way as
securities.
- 51 -
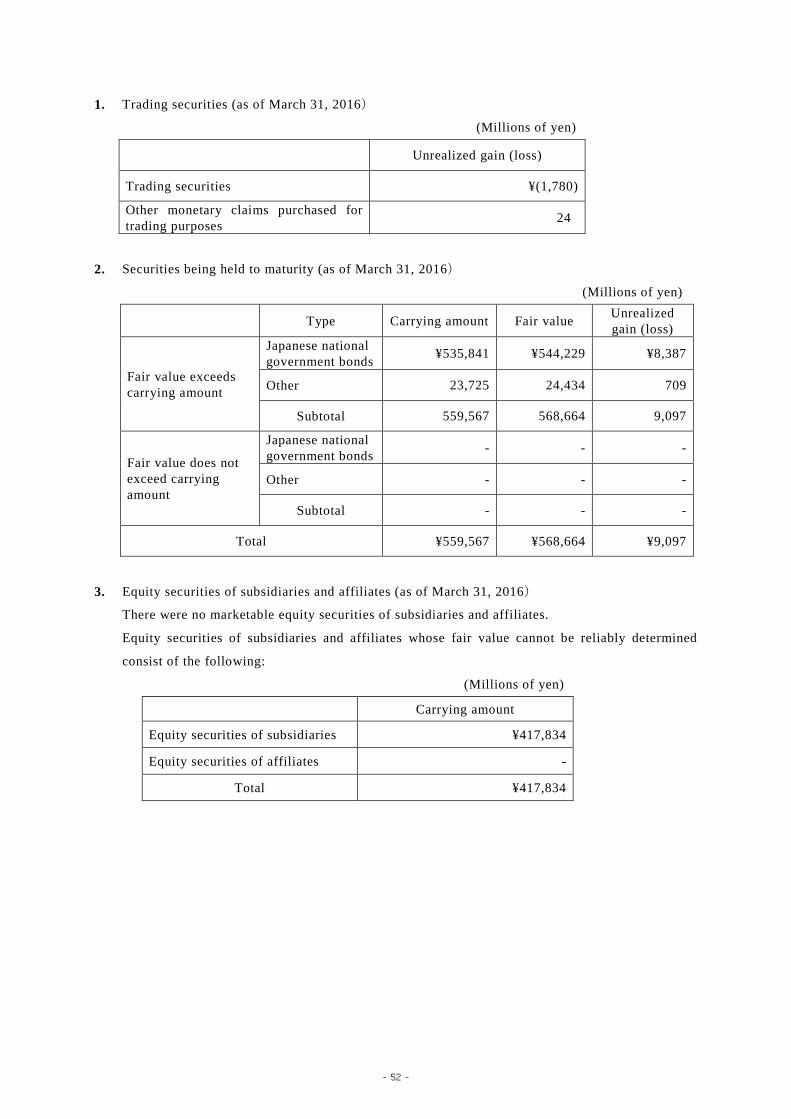
1. Trading securities (as of March 31, 2016)
(Millions of yen)
Unrealized gain (loss)
Trading securities ¥(1,780)
Other monetary claims purchased for trading purposes 24
2. Securities being held to maturity (as of March 31, 2016)
(Millions of yen)
Type Carrying amount Fair value Unrealized gain (loss)
Fair value exceeds carrying amount
Japanese national government bonds ¥535,841 ¥544,229 ¥8,387
Other 23,725 24,434 709
Subtotal 559,567 568,664 9,097
Fair value does not exceed carrying amount
Japanese national government bonds - - -
Other - - -
Subtotal - - -
Total ¥559,567 ¥568,664 ¥9,097
3. Equity securities of subsidiaries and affiliates (as of March 31, 2016)
There were no marketable equity securities of subsidiaries and affiliates.
Equity securities of subsidiaries and affiliates whose fair value cannot be reliably determined
consist of the following:
(Millions of yen)
Carrying amount
Equity securities of subsidiaries ¥417,834
Equity securities of affiliates -
Total ¥417,834
- 52 -

4. Securities available for sale (as of March 31, 2016)
(Millions of yen)
Type Carrying amount (Fair value)
Amortized/ Acquisition cost
Unrealized gain (loss)
Carrying amount exceeds amortized/acquisition cost
Equity securities ¥13,972 ¥8,219 ¥5,753
Domestic bonds: 228,530 224,100 4,430
Japanese national government bonds 192,257 189,332 2,924
Japanese local government bonds 505 500 5
Japanese corporate bonds 35,768 34,268 1,500
Other 158,038 154,117 3,920
Subtotal 400,542 386,437 14,104
Carrying amount does not exceed amortized/acquisition cost
Equity securities 1,203 1,335 (131)
Domestic bonds: 52,656 53,061 (404)
Japanese national government bonds 19,911 20,036 (124)
Japanese local government bonds - - -
Japanese corporate bonds 32,745 33,025 (280)
Other 126,440 127,323 (883)
Subtotal 180,301 181,720 (1,419)
Total ¥580,843 ¥568,158 ¥12,685
(Note 1) Available-for-sale securities whose fair value cannot be reliably determined
(Millions of yen)
Carrying amount
Equity securities ¥1,965
Other 60,505
Total ¥62,471
These are not included in the table shown above, since the fair value cannot be reliably
determined.
- 53 -

(Note 2) “Unrealized gain (loss) on available-for-sale securities” on the balance sheet consists of
the following:
(Millions of yen)
Unrealized gain (loss) before deferred tax on:
Available-for-sale securities ¥12,685 Interests in available-for-sale securities held by partnerships recorded as securities whose fair value cannot be reliably determined 2,685
Securities being held to maturity, reclassified from available-for-sale in the past, under extremely illiquid market conditions (789)
Other monetary assets held in trust (1,016)
Less: Deferred tax liabilities 2,787
Unrealized gain (loss) on available-for-sale securities ¥10,777
5. Available-for-sale securities sold during the current fiscal year (from April 1, 2015 to March 31,
2016)
(Millions of yen)
Proceeds from sales Gains on sales Losses on sales
Equity securities ¥499 ¥266 ¥ -
Domestic bonds: 3,514,821 4,590 348
Japanese national government bonds 3,445,868 4,464 294
Japanese local government bonds 26,535 2 45
Japanese corporate bonds 42,418 123 9
Other 609,051 3,380 4,448
Total ¥4,124,373 ¥8,237 ¥4,797
6. Securities for which impairment losses are recognized
Individual securities (except for those whose fair value cannot be reliably determined), other
than trading securities, are written down when a decline in fair value is significant as compared to
the cost of such securities since the decline in fair value is deemed to be other than temporary.
The amount written down is accounted for as an impairment loss.
Impairment loss on such securities for the fiscal year ended March 31, 2016 was ¥283
million, which consisted of ¥283 million for equity securities.
To determine whether an other-than-temporary impairment has occurred, the Bank applies
the following rule, by the obligor classification of the security issuer based on the Bank’s
self-assessment guidelines:
- 54 -

Securities issued by “legally bankrupt,” “virtually bankrupt,” and “possibly bankrupt” obligors
The fair value of securities is less than the amortized/acquisition cost
Securities issued by “need caution” obligors
The fair value of securities declines by 30% or more compared to the amortized/acquisition cost
Securities issued by “normal” obligors The fair value of securities declines by 50% or more compared to the amortized/acquisition cost
“Legally bankrupt” obligors are those who have already gone bankrupt from a legal and/or
formal perspective.
“Virtually bankrupt” obligors are those who have not yet gone legally or formally bankrupt
but who are substantially bankrupt because they are in serious financial difficulties and are not
deemed to be capable of restructuring.
“Possibly bankrupt” obligors are those who are not yet bankrupt but are in financial
difficulties and are very likely to go bankrupt in the future.
“Need caution” obligors are those who require close attention because there are problems
with their borrowings.
“Normal” obligors are those whose business conditions are favorable and who are deemed
not to have any particular problems in terms of their financial position.
(Monetary assets held in trust)
1. Monetary assets held in trust for trading purposes (as of March 31, 2016)
(Millions of yen)
Carrying amount (Fair value) Unrealized gain (loss)
Monetary assets held in trust for trading purposes ¥57,009 ¥(8,586)
2. There were no monetary assets held in trust held to maturity (as of March 31, 2016)
3. Monetary assets held in trust other than for trading purposes and held to maturity (as of
March 31, 2016)
(Millions of yen)
Carrying amount
Acquisition cost
Unrealized gain (loss)
Gross unrealized
gain
Gross unrealized
loss Other monetary assets held in trust
¥94,637 ¥95,654 ¥(1,016) - ¥(1,016)
Note: “Gross unrealized gain” and “Gross unrealized loss” are components of “Unrealized gain (loss)”.
- 55 -

(Deferred tax)
1. Breakdowns of deferred tax assets and deferred tax liabilities by reason of their occurrence were
as follows.
(Millions of yen)
Deferred tax assets
Tax loss carryforwards ¥73,461
Securities 25,499
Reserve for credit losses 19,098
Monetary assets held in trust 9,165
Deferred loss on derivatives under hedge accounting 7,696
Unearned dividends on monetary assets held in trust 3,889
Other 11,144
Subtotal ¥149,954
Valuation allowance ¥(145,809)
Total deferred tax assets ¥4,145
Deferred tax liabilities
Deferred gain on derivatives under hedge accounting 3,040
Unrealized gain (loss) on available-for-sale securities 2,787
Asset retirement costs included in premises and equipment 864
Other 326
Total deferred tax liabilities ¥7,019
Net deferred tax liabilities ¥2,873
2. “Act for Partial Reform of the Income Tax Act, etc.” (Law No. 15 for 2016) and “Act for Partial
Reform of the Local Tax Act, etc.” (Law No. 13 for 2016) were enacted in March 29, 2016 and the
tax rates for corporate income taxes will be reduced from the fiscal year beginning on or after
April 1, 2016. In connection with this change, the effective statutory tax rate for calculating
deferred tax assets and deferred tax liabilities will be changed from the existing 32.30% to
30.86% for temporary differences and tax loss carryforwards that are expected to be realized in
the fiscal year beginning on April 1, 2016, and to 30.62% for temporary differences and tax loss
carryforwards that are expected to be realized in the fiscal year beginning on April 1, 2018.
With these tax rate changes, the deferred tax liabilities have decreased by ¥149 million, the
unrealized gain (loss) on available-for-sale securities has increased by ¥152 million, the deferred
gain (loss) on derivatives under hedge accounting has increased by ¥162 million and the income
taxes (benefit) - deferred have increased by ¥166 million.
The deduction of carried forward tax losses will be limited to 60% of the taxable income before
applying the tax loss deduction from the fiscal year beginning on or after April 1, 2016, and to
55% of the taxable income before applying the tax loss deduction from the fiscal year beginning
on or after April 1, 2017. With this change, the deferred tax assets have decreased by ¥20
million and the income taxes (benefit) - deferred have increased by ¥20 million.
- 56 -

(Per share information)
Common shareholders’ equity per share was ¥292.37.
Net income per common share was ¥15.66.
Diluted net income per common share was ¥15.66.
- 57 -