the interviewer performance profile (ipp): a paradata
TRANSCRIPT

The Interviewer Performance Profile (IPP): A Paradata-Driven Tool for Monitoring and Managing InterviewerPerformance
Heidi M. Guyer, RTI International, Research Triangle Park, NC, USABrady T. West, Survey Research Center, University of Michigan, Ann Arbor, MI, USAWen Chang, Survey Research Center, University of Michigan, Ann Arbor, MI, USA
How to cite this article : How to cite this article : Guyer, H.M., West B.T. & Chang W. The Interviewer Performance Profile (IPP):A Paradata-Driven Tool for Monitoring and Managing Interviewer Performance. Survey Methods: Insightsfrom the Field. Retrieved from https://surveyinsights.org/?p=15306
DOI : DOI : 10.13094/SMIF-2021-00005
Copyright : Copyright : © the authors 2021. This work is licensed under a Creative Commons Attribution 4.0International License (CC BY 4.0)
Abstract : Abstract : Monitoring interviewer performance during data collection is essential for ensuring optimalperformance at the interviewer level, thereby leading to improved data collection parameters in areassuch as effort and efficiency. Paradata are widely utilized to enhance typical measures of performance,such as response rates, and provide a more nuanced view of interviewer performance characteristics. Wedescribe a paradata tool developed to monitor interviewer performance in real time: the InterviewerPerformance Profile (IPP). Daily data updates allow for ongoing monitoring to detect areas of performanceconcern as well as areas of improvement over time. Additionally, the flexible nature of the IPP facilitatesadaptation by other projects. An overview of the tool is provided in addition to several examples ofimplementation and usage in a national field project.
Introduction
The use of paradata to monitor data collection outcomes has become a norm in survey research. Paradatahave been used to monitor interviewer performance during interviewer training as well as during datacollection. Paradata are also frequently used in static reports and production monitoring dashboards toquickly determine whether data collection parameters are on track or in need of intervention (Groves andHeeringa, 2006). There are many benefits and goals of these types of dashboards, including improvingefficiency, identifying areas of concern and improvement, identifying poor performers, minimizing non-response error, reducing or controlling costs, and achieving the study outcomes. Paradata monitoringtools can be utilized by field managers as well as research staff and clients, providing the sameinformation to all team members to ensure productive discussions, prompt decision-making, andimprovement of data collection outcomes. The use of paradata dashboards is considered a best practiceby many survey methodologists (Mohadjer and Edwards, 2018).
The focus of this report is on paradata-driven tools for monitoring and improving interviewer performance.Such tools have evolved over the past several decades and have been utilized to assess various types ofperformance. Groves and McGonagle (2001) utilized interviewer training data to develop a tool to predictfuture cooperation rates of individual interviewers. Durand (2005, 2008) developed the “Net Contributionto Performance Index (NCPI)”, in which interviewers received a score that took the difficulty of the task

being measured into consideration. Laflamme and St-Jean (2011) further developed the NCPI by including“objective interviewer performance indicator that takes into account the complexity of the survey dataprocess.” This progression demonstrated the need to account for project and task difficulty whenmeasuring interviewer performance. West and Groves (2013) continued this line of work and developed anovel measure of interviewer performance taking into account the difficulty of the assigned sample orachieving the outcome itself to compute an interviewer-specific Propensity-Adjusted InterviewerPerformance (PAIP) Score. PAIP scores can be used to evaluate their difficulty-adjusted effectiveness interms of various key parameters, including contact rates, response rates, and eligibility rates.
The progression of tools for monitoring interviewer performance has been accompanied by an increase inthe number of variables being measured. Early on, Sudman (1967) found that simpler reportingapproaches worked best. Field supervisors are the first in line to assess interviewer performance and tendto be the most accurate people when evaluating interviewers’ quality over time. The EPIC-German studyevaluated interviewer performance using in-depth qualitative and quantitative measurements of qualitycontrol from direct observations which were then coded into performance scores (Kroke, Bergmann,Lotze, Jerckel, Klipstein-Grobusch, and Boeing, 1999). Guyer and Wagner (Guyer 2004; Wagner andGuyer, 2005) found that statistical processing reports with highlighting to indicate poor performers versusgood performers were useful visual tools for managers. Work conducted by Olson and Bilgen (2011)suggests that many typical indicators of good interviewer performance, such as faster interview pace,may lead to higher levels of acquiescence from respondents than the pace typically exhibited in a lessexperienced interviewer, or one that has longer-running interviews.
In this paper, we describe a robust and dynamic tool for monitoring interviewer performance over timethat builds on these prior efforts and provide specific examples of its use on a national field study.
Methods
The National Survey of Family Growth’s Interviewer Performance Profile(IPP)
The IPP was developed for a national survey of reproductive health, the National Survey of Family Growth(NSFG). The NSFG is a cross-sectional population-based survey on factors affecting pregnancy andchildbearing including contraception, sexual activity, marriage, divorce and cohabitation, as well asservices relating to pregnancy, infertility and reproductive health in the United States. A nationalprobability sample frame is used to select approximately 5,200 addresses on a quarterly basis. Sampledhouseholds are screened and an age-eligible (15-49 years old) household member is selected and invitedto complete an interview. All interviews are conducted in-person by female interviewers. Given thecontinuous nature of the data collection (2006-2010, 2011-2019), data exists to compare currentperformance to previous quarters, years and cycles of data collection. Approximately 45 interviewers areemployed on the study each year. Annual trainings take place for newly hired interviewers whereasexisting interviewers simply continue from one year to the next if their geographic area is in the study insequential years. Each year, approximately 40-45% of the interviewers are new to the project and to thesurvey organization. The IPP allows the project team to monitor interviewer performance on a daily basisamong both new and experienced interviewers and identify specific areas where additional training orguidance may be necessary in order to improve performance. Additionally, post-training changes inperformance can be tracked in the IPP.
A birds-eye view of the IPP is provided in Figure 1. The four main areas of performance are indicated, with

one column for each parameter evaluated and one row per interviewer. This visual display allows for botha quick visual evaluation of interviewers that are performing well or performing poorly for any givenindicator (e.g., main interview response rates, conditional on completed screening interviews) as well asto evaluate interviewers that are performing well in numerous areas versus those that are struggling innumerous areas. In addition to quickly evaluating interviewer or parameter performance, an overallindication of the key areas where additional reinforcement may be needed are easily identified. The IPP isa dynamic Excel file with data displayed to assess performance in four main areas: key performanceindicators, Propensity-Adjusted Interviewer Performance (PAIP) scores, data quality indicators and dataset balance.
Key Content Areas of the IPP
Four areas of performance are assessed in the IPP:
Key Performance IndicatorsKey Performance Indicators (KPIs)(KPIs) evaluate the criteria necessary for the success of theproject and provide a means of evaluating individual interviewers as well as the overall project.
KPIs included in the IPP to evaluate interviewer effort are: total hours worked to date, hoursworked by work type (travel, administrative), hours per completed interview (HPI), interview
yield, response rates and eligibility rates. These indicators represent the cumulative performancein the current quarter, as they are calculated based on the cumulative measures from the start
date of current quarter to the day before the report was populated. However, the time referencecould be adapted to fit the study’s objectives (e.g., a full year of data collection).
Propensity-Adjusted Interviewer PerformancePropensity-Adjusted Interviewer Performance (PAIP)(PAIP) ScoresScores evaluate the effectiveness ofthe interviewer by incorporating model-based expectations of the difficulty of the tasks (Westand Groves, 2013). PAIP scores are generated for each interviewer and displayed for interview
completion, eligibility and contact.Data Quality IndicatorsData Quality Indicators evaluate the quality of the data collected by the interviewer. CAPI was
employed by NSFG using Blaise data collection software. Audit trail data captured each keystroke made by the interviewer during each interview, and the time spent between fields. Thesedata was stored and used to create indicators to monitor data quality. Raw indicators include theaverage time spent on survey questions, the frequency of using help screens, recording remarks,
checking errors, backing up during the interview, and the frequency of “don’t know” and“refuse” responses. Principle component analysis (PCA) was used to identify common
correlations of these measures and reduce the dimensionality of the data, and three factors wereidentified as data quality indicators: questions being read too quickly, a high proportion of error
checks, and a high proportion of refused or don’t know responses (Gu et al., 2013).Data Set Balance IndicatorsData Set Balance Indicators provide proxy indicators of non-response bias by examiningdifferences between respondents and non-respondents in terms of key study characteristics.
The data within each performance area is displayed in a heat map format, with gradient coloring (shadesof bright green to bright red) to identify positive versus negative performance at a quick glance (Figure1). Yellow-shaded cells indicate the median value among all interviewers for that specific indicator,whereas green shading indicates positive performance and red shading indicates poor performance. If alarger value of an indicator means better performance (e.g. response rates), then the cell that holdsmaximum value is highlighted in green and the cells that hold a minimum value are highlighted in red. Allother cells are colored proportionally. For indicators in which a smaller value indicates betterperformance, green and red are coded in reverse while still providing an indicator of poor performanceversus good performance. A more extensive review and discussion of each of these components isdescribed in the supplemental materials and in recent conference proceedings (West, Guyer, Chang
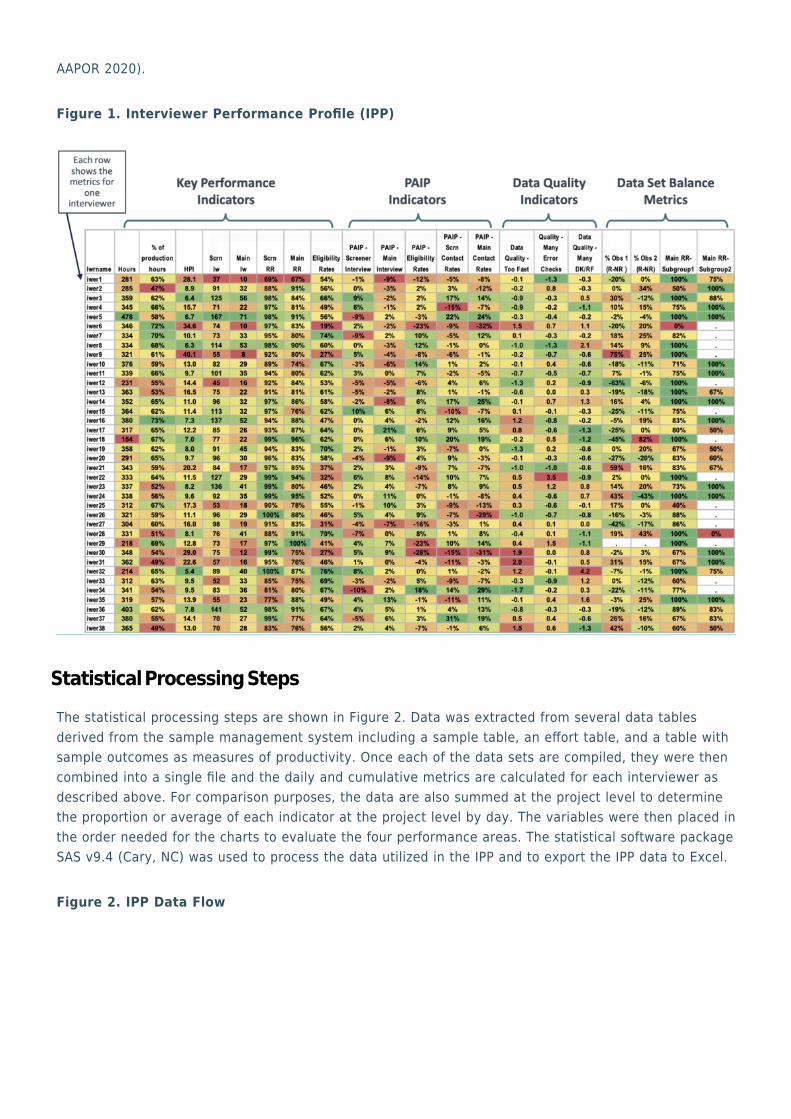
AAPOR 2020).
Figure 1. Interviewer Performance Profile (IPP)Figure 1. Interviewer Performance Profile (IPP)
Statistical Processing Steps
The statistical processing steps are shown in Figure 2. Data was extracted from several data tablesderived from the sample management system including a sample table, an effort table, and a table withsample outcomes as measures of productivity. Once each of the data sets are compiled, they were thencombined into a single file and the daily and cumulative metrics are calculated for each interviewer asdescribed above. For comparison purposes, the data are also summed at the project level to determinethe proportion or average of each indicator at the project level by day. The variables were then placed inthe order needed for the charts to evaluate the four performance areas. The statistical software packageSAS v9.4 (Cary, NC) was used to process the data utilized in the IPP and to export the IPP data to Excel.
Figure 2. IPP Data FlowFigure 2. IPP Data Flow

IPP Case Studies
The IPP can be used to evaluate performance at a single point in time as well as to track improvements inperformance after interventions occur. Interventions may include covering topics on team calls or inemails to the full study team if performance issues seem widespread, such as low response rates withspecific subgroups of cases, high hours per complete for the quarter, or increased resistance rates. Wenow provide examples of performance indicators that led to concerns, the interventions that occurred,and the performance following the intervention as compared to the initial performance indicatorsobserved.
Table 1 displays results for six interviewers, A-F, at three different points in time as indicated in thesecond column “Week” (week of the quarter). The total hours worked through that week are displayed aswell as the number of completed screener and main interviews, the cumulative hours per interview (HPI)at that point in time, the eligibility rate, the screener response rate (Screen RR) and the main interviewresponse rate (Main RR). Areas of concern for each interviewer are highlighted in red, whereas areas ofpositive performance are highlighted in green. It should be noted that the data displayed in the table arefictitious in order to preserve interviewer anonymity. The case studies illustrate similar scenarios thathave occurred while using the IPP yet merely serve as examples of the various ways in which the IPP canbe used.
Table 1. Case Study ExamplesTable 1. Case Study Examples

HPI: Hours per Interview; RR: Response rate
Interviewer AThis was a new interviewer who started on the NSFG for the first time in this quarter. By the third week ofthe quarter, the interviewer had worked 93 hours. NSFG interviewers are required to work 30 hours perweek, so the level of effort, in terms of hours charged, was appropriate. The number of completedscreening interviews was 25. At a 34% eligibility rate, nine eligible main respondents would have beenidentified. However, main interviews had only been completed with two of the nine, thus her HPI wasextremely high (46.5 compared to project average of 10.6). A performance discussion with thisinterviewer took place at the end of week 3. No improvement was observed two weeks later in week 5.This interviewer appeared to be focusing on screening rather than conducting main interviews. A secondperformance discussion took place in week 5. By week 10, some improvement was observed: sixadditional main interviews had been completed, thus lowering her HPI, and she continued to focus oninterviewing. This interviewer showed some improvement with additional coaching in the first quarter andwas retained on the project. Her supervisor continued to monitor her performance.
Interviewer BThis was also a new interviewer who started on the NSFG this quarter. By week three, the interviewer hadonly worked four hours and had not conducted any field work. A performance discussion took place withthis interviewer during week 3. By week 5, she had started working, although still not at the levelrequired. However, her effort and productivity was on track and her HPI was quite good. Despite theseoutcomes, a performance discussion was held with the interviewer in week 5 as she was not yet workingthe required number of hours. This interviewer’s performance had improved significantly in all areas byweek 10. In fact, she showed strong potential in completing main interviews and maintaining a low HPI.With some additional coaching in the first quarter, this new interviewer is now well on her way to asuccessful new career.
Interviewer CThis was a new interviewer who started on the NSFG this quarter as well. A performance discussion washeld in week 3 as she was not meeting the requirement of working thirty hours per week and herproduction outcomes were low for this point in time. By week 5, her productivity had declined further. She

was not working the required number of hours and was thus unable to achieve an acceptable level ofproductivity. A second performance discussion took place in week 5. This interviewer resigned in week 7.
Interviewer DThis was also a new interviewer who had performance discussions with her supervisor in weeks 3 and 5due to low performance and working an insufficient number of hours. Her performance did not improveover the ten week period despite receiving additional coaching and performance improvementnotifications. This interviewer was terminated from the project in week 10. Although she did completesome work, she would be a risk to the project were she to continue and would incur increased projectcosts related to monitoring and coaching without showing the improvements (no/low return oninvestment).
Interviewer EThis experienced interviewer was a high-performing interviewer who had worked on the project for morethan five years prior to the current year of data collection. She had consistently high performance incompleting the screener and main interviews, maintained her hourly commitment, and consistently had alower than average HPI. This interviewer did not require additional coaching or performance discussions,nor did she introduce increased cost to the project. Instead, she was able to provide guidance to new, lessexperienced interviewers and her efficiency led to decreased project costs.
Interviewer FThis experienced interviewer had inconsistent performance in the first five weeks of the quarter as shedid not have any sample in her area. Instead, she travelled to other areas to conduct interviews insituations where the local interviewer was on leave or was unable to work their full sample load, as wellas to unstaffed areas (e.g., due to interviewer attrition) and always completed her assigned sample whiletraveling. However, only interviewers with historically good performance indicators are eligible to work as“travelers”. The primary goal of the traveler is to be as efficient as possible in the weeks that they aretraveling. This interviewer maintained high levels of productivity and a low HPI and maintained her statusas a high performer by the end of the quarter.
Conclusion/Discussion
As these examples show, the IPP is a useful tool for both the interviewer as well as the project team. TheIPP is a management tool, enabling the evaluation of numerous performance metrics across multipleinterviewers simultaneously. It allows managers to identify areas of concern, intervene, and monitoroutcomes, contributing to the overall success of the project. The IPP allows interviewers who arestruggling to receive additional coaching and to improve their performance, thus providing employmentstability. Additionally, the IPP highlights interviewers with exceptional performance and allows thoseinterviewers to be recognized and to contribute to the coaching of new interviewers to ensure their long-term success as well.
The dynamic nature of the IPP has allowed for the integration of new measures over time. While there isan initial investment at the start of a project in defining the elements to monitor and the paradata neededto develop the IPP, this investment can lead to cost reductions in key areas of production over the courseof the study. For example, identifying and intervening with interviewers with low response rates or highHPIs can lead to reduced costs and improved production parameters, if detected early enough and if theinterventions are successful. The IPP can aid in early detection and tracking of intervention outcomes.Additionally, once the tool is developed, it can be further refined and adapted for other studies as well. As

in previous reports, the use of heat maps allows for the identification of positive versus negativeperformance at a quick glance. The reviewer can then dig deeper to determine the cause of the poorperformance and develop an action plan. We have found the dynamic IPP to be incredibly useful inmonitoring interviewer performance, identifying areas for improvement, and tracking changes over time.
The IPP is a useful tool for studies that are smaller or more narrow in size and scope—such as the numberof interviewers, cases, or parameters measured– as well as those that are larger in size or scope. Aminimum number of cases is not required in order for the tool to be useful. Instead, the key is providingthe sample sizes for which the indicators are based to allow the managers to make decisions as towhether to put weight on the values of the indicators. The indicators are meant to be reviewed togetherwith other indicators on the report. Instead of voiding the indicators due to a small number of cases, wesuggest reporting the denominators of the rates that tend to have a smaller sample size on the report andallowing managers to use the information accordingly. The indicators are color-coded based on thestandard deviation of the mean of all interviewers to help identify the outliers of each indicator. Thus, theIPP helps to provide a quick glance at all perspectives of each interviewer compared to other interviewers.This approach can be used for larger studies as well where the performance of all interviewers can beassessed in comparison to the full team, or subgroups of interviewers or cases can be assessedseparately. For example, the performance of a regional teams of interviewers could be compared to theother interviewers within the team to determine those who are excelling in that specific geographic regionand those who may need additional training or guidance. Additionally, subsets of cases could beevaluated, such as by sample release or other indicators of key sample characteristics such as cohort,age, or sample source.
Our work as survey researchers must continue to adapt to both changes in technology and provide newviews of the available data to ensure efficient data collection and successful outcomes. The utility ofparadata to measure and monitor these trends, and the visual display of data, will continue to expandover time. The IPP is an easy tool for both methodologists and managers to use to increase productivityand efficiency while also decreasing costs, measurement error and non-response error.
Appendix
Supplemental material