the intersection of organizational inequalities
TRANSCRIPT

The Intersection of Organizational Inequalities
Olivier Godechot Sciences Po, OSC - CNRS, MaxPo
Mirna Safi Sciences Po, OSC - LIEPPP
Matthew SoenerUniversity of Illinois, Urbana-Champaign
How Gender, Migrant Status, and Class Inequality Relate to Each Other in French workplaces
n° 2021-1
May 2021
OSC Papers
2 OSC Papers n° 2021-1
Introduction
Social stratification scholars have long centered their analy-ses around social class, gender and race/ethnicity. Yet, too often, these forms of inequality are addressed separately. Intersectional approaches have called attention to the way inequalities overlap and interact (Browne and Misra 2003; Cho, Crenshaw, and McCall 2013; McCall 2001). In most quantitative studies, intersectionality is implemented through the introduction of interaction terms between different individual variables such as gender, race, migration status and occupation. The interaction-terms approach nonethe-less tends to overlook the workplace heterogeneity in the making of inequality (Baron and Bielby 1980; Tomaskov-ic-Devey and Avent-Holt 2019). As Acker (2006) famously argued, organizations are unique “inequality regimes”. The flourishing relational inequality literature builds on Acker’s influential insight to document how firms vary substantial-ly in the way they produce categorical inequalities such as migrant status/ethnic/racial/gender wage gaps (Stainback, Ratliff, and Roscigno 2011; Stainback, Tomaskovic-Devey, and Skaggs 2010; Tomaskovic-Devey, Hällsten, and Avent-Holt 2015; Williams and O’Reilly III 1998).
While relational inequality research made it clear that work-places may be more or less equal across different dimen-sions, it did not systematically investigate the relations be-tween these organizational-level inequalities. More precisely, this literature provides little insights on whether we should expect inequalities along various dimensions to reinforce each other or whether there are tradeoffs between them. This ar-ticle aims at bridging this gap by investigating how different types of inequalities relate to one another in workplace organizations.
Our approach stands not only to clarify a central sociolog-ical concept (inequality regimes) but also to open space for its empirical investigation. We do so using French administra-tion data from 1996 to 2016. This data allows us to scru-tinize the correlations between three dimensions of wage inequality measured at the workplace level: class, gender and nativity. We also study how each of these categorical in-equality relates to a fourth measure of within-workplace in-
equality we call intra-categorical. Intra-categorical inequality refers to inequality within the three-level cross-categoriza-tion class×gender×nativity. From a methodological point of view, we show how exploring patterns of correlation be-tween different inequality measures within organizations is challenging because of the numerous biases related to the overlapping of categories. Moreover, we discuss and imple-ment solutions to circumvent these problems.
Finally, and beyond the multidimensional description of within-workplace inequality, this research also seeks to doc-ument how different mechanisms involved in the (re)pro-duction of inequality combine in shaping local inequality regimes. Indeed, the four measures of wage gap we use per-tain to different dimensions of inequality (Brubaker 2015; Tilly 1998). Three of them are categorical (class, gender and nativity). We also use a gradient-type measure of inequality within categorical distinctions, or in other words an indi-cator of inequality beyond categorical distinctions, that we call intra-categorical inequality. Moreover, beyond the cat-egorical/continuous distinction, these four indicators also vary in the degree to which they are embedded in specific labor market mechanisms. Gender and nativity are largely exogenous to the workplace. They are mostly (re)produced in spheres and interactions outside the labor market (e.g. in families, neighborhoods, state legislation and administra-tive processes, etc.). Conversely, class-based inequality (that we measure through wage gap across broad occupational distinctions) and intra-categorical inequality (that we mea-sure within class×gender×nativity cross-categorization) are largely endogenous to the labor market. Employees are channeled into occupational positions through a complex process of division of labor based, at least partly, on hu-man capital and other productivity-related characteristics (Treiman 2013). This organizational hierarchy translates into a wage hierarchy (Hedström 1991), yet in variable ways across workplaces depending on market mechanisms and human resources procedures and policies. Similarly, work-places may produce disparate levels of inequality within cross-categorical distinctions depending on “local inequali-ty cultures” (i.e preferences and beliefs in regard the pros or cons of an unequal wage distribution) (Milgrom and Rob-
3The Intersection of Organizational Inequalities
erts 1988) or on firm-specific returns of individuals char-acteristics others than class, gender or nativity (soft skills, creativity, organization, autonomy, charisma, etc.). Estimat-ing the correlations between our four measures of wage inequalities at the workplace level consequently enables us to delineate the articulation, within organizations, of (large-ly) exogenous inequalities (gender and nativity), with (large-ly) endogenous inequalities (class and intra-categorical in-equality). Moreover, documenting the existence of reinforced inequality regimes or inequality trade-off regimes within organi-zations helps us progress in understanding the role of cate-gorical inequality in shaping unequal outcomes in goal-ori-ented contexts such as workplaces. A positive correlation between categorical inequalities suggests similar underlying processes at play in their importing to the workplace: sa-lient categorical distinctions are readily available to produce inequality within organizations. Conversely, the absence of correlation, or possibly a negative one, suggests the exis-tence of specific mechanisms in the workplace-making of categorical inequality.
After a brief review of the relevant literature, our empiri-cal analysis proceeds in three steps. First, we examine wage gaps by different “intersecting” social positions using inter-actions effects at the individual level. Second, we shift the lens to the organizational level by analyzing correlations be-tween inequalities within workplaces. This section includes a discussion on related methodological issues. Third, we ask how industry, urban environment, and various workplace characteristics affect these patterns. We find evidence for both reinforcing and inequality trade-off regimes. More specifically, gender and nativity wage gaps are negatively correlated pointing to a trade-off between these categori-cal inequalities. At the same time, the gender gap is higher in more intra-categorically unequal workplaces, the nativity gap is higher in more intra-categorically equal workplaces. In the conclusion, we discuss mechanisms underlying our findings and their implications for future research.
Bridging Multidimensional Forms of In-equality within Organizations
The class/gender/race trio serves as a basis for thinking about inequality in most contemporary societies. Intersec-tional scholars have called for studying these forms of in-equality together (Cho et al. 2013; McCall 2001, 2005). This perspective is geared towards understanding the construct-ed (and contested) nature of these categories. It also more broadly calls attention to the overlapping nature of inequal-ity types and the need to simultaneously consider their im-pact on subjective micro-experiences. Despite epistemolog-ical differences, quantitative scholars have contributed to this research agenda. For example, Mandel and Semyonov (2016), and Restifo and Mykyta (2019) decomposed their samples by racial and gendered pairings or interacted these together to estimate wages or wage gaps. Cotter, Hermsen and Vanneman (1999) compared the likelihood that black, Hispanic, and Asian women would approach the different earnings thresholds of white male earnings – their baseline estimate. Studying the overlap of inequalities with interac-tions in a regression, Greenman and Xie (2008) invalidate the “double jeopardy” hypothesis for minority females. In contrast, they show that the racial/ethnic wage penalty is smaller for women than men.
Research in this vein illuminates how categories combine in shaping individual outcomes, but an equally important element in this discussion is where inequality is generated. Research increasingly recognizes organizations as the main locus for inequality. Following classic insights from Acker (2006) and Baron and Bielby (1980), relational inequality scholars argue that workplaces are sites where individu-al skills, agency, and boundary-making processes interfere with organizational dynamics like discrimination, wage-set-ting, promotions, demotions, control over profits and man-agerial power. They have observed, for example, a high degree of organizational heterogeneity by categorical dis-tinctions like race, migration status, gender, and class in a number of different countries (Avent-Holt and Tomaskov-ic-Devey 2012; Melzer et al. 2018; Tomaskovic-Devey et al. 2020). Most of this work has investigated the distribution
4 OSC Papers n° 2021-1
of wage inequality across workplaces or focused on partic-ular types of categorical distinctions such as nativity, race, gender, etc. This research has not yet considered how these different types of inequality relate to each other within the workplace. Addressing this question is important not only because less attention has been paid to how different forms of in-equality connect but also because this allows us to see the mechanisms of inequality in a new light. Empirical research drawing on relational inequality theory has been agnostic to whether inequalities cluster together. More fundamen-tally, both the organizational and intersectional approaches to inequality are not clear about whether we should expect workplaces to be consistently equal (or unequal) on differ-ent dimensions of inequality. This research gap is our point of departure in this article.
Two Types of Inequality RegimesWhen studying correlations between different dimensions of inequality within workplaces one may differentiate be-tween two ideal-typical situations. First, a reinforced inequality regime in which two forms of inequality are positively related to each other. Second, a trade-off inequality regime in which two forms of inequality are negatively associated with each other.
Beginning with a reinforced inequality regime, studies show that organizations range from being relatively authoritari-an to relatively egalitarian (Roscigno, Hodson, and Lopez 2009). These environments may condition different pat-terns of inequality. On the more unequal side, for exam-ple, Castilla (2008) found similar mechanisms for sex-based discrimination as for race-based discrimination. High in-equality environments tend to go hand in hand with mul-tiple forms of disadvantage by race, nativity and gender. For example, nativity gaps were higher in Swedish firms with higher levels of inequality (Tomaskovic-Devey, Häll-sten, et al. 2015). The motherhood penalty was larger in these workplaces as well. From a more egalitarian perspec-tive, Kalev (2009) found that when job segregation became more porous through team-based organization, minorities
and women were both able to advance in the firm. To-maskovic-Devey and Avent-Holt summarize this reinforc-ing dynamic, noting that “when social distinctions of class and citizenship reinforce each other, they exaggerate cate-gorical distinctions, which in turn legitimates exploitation” (2019, p. 121). The reinforcing inequality regime may also be interpreted in a cultural vein: high overall inequality in workplaces fosters the legitimation and acceptance of dif-ferent forms of inequality within them.
Conversely, inequality types can move in opposite directions pointing to an “inequality trade off ” regime. Classic strat-ification theory, for example, argues that labor markets are often “split” by categorical attributes such as citizenship, ethnoracial status and gender (Bonacich 1972; Doeringer and Piore 1971). This dynamic creates antagonistic work relations, which tends to shift the distribution of resources in favor of the most powerful categories and at the detri-ment of the most vulnerable ones. Some research indeed documents how groups can mobilize within the workplace to preserve advantages for themselves at the expense of other groups (DiTomaso 2013). For instance, U.S conser-vative trade unions (e.g. the American Federation of Labor) created lower class-based inequality through collective bar-gaining while preserving high levels of racial inequality by excluding non-white workers (Arnesen 1998).
Inequality in FranceOur study focuses on France. In France, wage inequalities by class, gender, and nativity are well established in em-pirical research. French labor markets are marked by low union density and increasing labor market flexibility (Am-able 2017). Unlike many other countries, wage inequality is relatively stable (Charnoz, Coudin, and Gaini 2011). This is important because France is comparatively less extreme by wage inequality and our results may be more conservative. France also has a pronounced gender wage gap though one that is slowly declining (Chamkhi and Toutlemonde 2015; Meurs and Pora 2019). In addition to occupational segrega-tion, sorting into firms is a key explanation to the French gender gap (Coudin, Maillard, and Tô 2018). Finally, France
5The Intersection of Organizational Inequalities
has a long history of immigration. The migrant labor force is quite diverse in terms of origin as well as skill (Beauche-min, Hamel, and Simon 2015; Ichou and Goujon 2017). Moreover, there is substantial discrimination for many mi-nority groups – particularly those with North and Sub-Sa-haran African origin (Quillian et al. 2019; Safi and Simon 2013).
These forms of inequalities in France share connections with each other. The migrant wage gap, for example, is like-ly connected to the class gap insofar as the migrant labor force is quite bifurcated by skill. Moreover, many lower skilled migrants are increasingly reliant on short-term con-tracts and other “outsider” employment schemes that put wage and employment pressure on natives. There are also many complex interactions between migration and gender in the French labor market (Safi 2020). For example, female migrants lower the overall female wage share for those in the same skill set (Edo and Toubal 2017). More broadly, the political histories of each type of inequality are highly distinct and could lead to different labor market outcomes. Most importantly, gender equality policies are widely recog-nized by employers and quite institutionalized. By contrast, similar policies for migrants or even public discussion on migrant workplace rights are relatively scarce and silenced by durable institutional colorblindness (Simon 2008).
Data
We use administrative data from the Déclarations Annuelles des Données Sociales (DADS) 1 – a database administered by France’s national statistics agency (INSEE). DADS covers all private sector establishments as well as local civil ser-vices and public hospitals. 2Any establishment employing workers is legally mandated to file it each year. DADS con-tains an exhaustive series with detailed wage and occupa-tion information for all private sector workers in all French regions from 1994 to 2016. We use the log of gross hourly
1. Access to the DADS data was obtained through the CASD de-dicated to researchers authorized by the French Comité du Secret Statistique. 2. State civil servants are included only after 2009. For reasons of time consistency, we did not use them for this analysis.
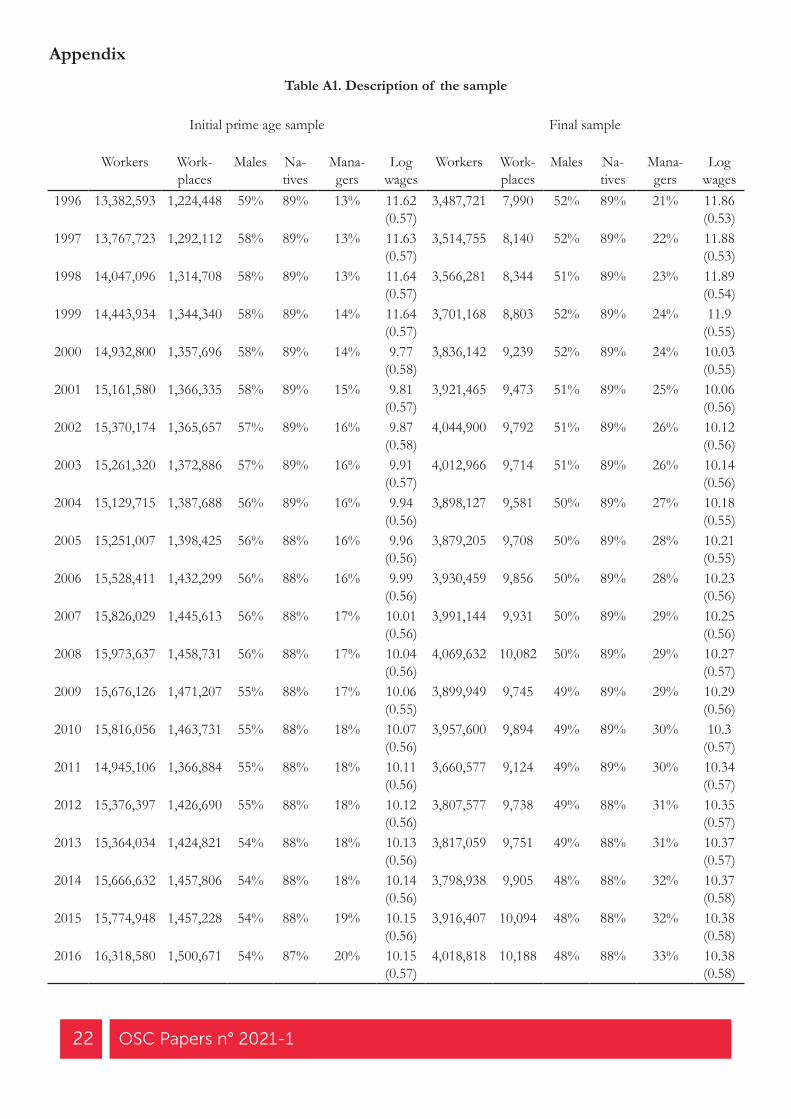
wages in the analyses below. Because the yearly number of hours worked is less reliable for years 1994 and 1995, we begin our analysis in 1996. Our sample includes all prime age (25-55) French employees in the private sector and semi-public sector (i.e. hospital and local civil services) who earn at least half a yearly minimum wage. We thus con-sider between 13.4 million (in 1996) and 16.3 million (in 2016) employees (Table A1). Finally, because we wish to compute wage gaps at the establishment-level across dif-ferent categorical positions, it is important for our sample to be consistent across our estimates. We therefore limit the analyses to those establishments with more than 50 em-ployees and those with at least two members of every social category relevant to this study. That is, establishments with at least two female managers/professionals (and workers), two male managers/professionals (and workers), two mi-grant managers/professionals (and workers), two non-mi-grant managers/professionals (and workers), two female migrants (and non-migrants), and two male migrants (and non-migrants). In the Appendix, we compare the sample before and after making these changes (Table A1). Despite the sample sizes dropping significantly to accommodate multiple wage gaps, our sample remains representative of the overall French labor market.
We use the DADS data to measure our three categorical in-equalities. For class distinction, we follow classic approach-es which make distinctions by workplace authority and ownership (Wright 1997) as well as social prestige conferred through education and related forms of closure (Weeden 2002; Weeden and Grusky 2012). We therefore use aggregat-ed occupational groups to distinguish between those with workplace authority (managers) and social prestige (profes-sionals) and everyone else (workers). Therefore, while occu-pational categories are embedded in the class positions, the class positions remain empirically and theoretically distinct from an approach in terms of occupational classification (Zhou and Wodtke 2019). The upper-class position we use corresponds to the standard French class designation known as the cadres – an institutionalized category of both managers and professionals (senior managers, commercial executives, administrators, and professional positions such
6 OSC Papers n° 2021-1
as scientists, lawyers, journalists) (Boltanski 1982).3 As for gender, we use a binary variable declared in DADS. Finally, we capture the nativity dimension by identifying migrant workers based on the foreign-born criterion4 (i.e. born outside of France).5 Unfortunately, information about mi-grants’ country of origin is not consistently available in the data.6 Nonetheless, we do have information after 2005 whether respondents are EU or non-EU citizens. In the ap-pendix, we use this information to recompute our main re-
3. Additionally, condensing social classes makes sense given our data structure because most workplaces contain only a few occu-pations. More detailed classifications (“micro-classes”) would be hard to implement in most workplaces whereas nearly all work-places are accounted for with the “big class” approach. 4. Information on place of birth is incomplete between 2002 and 2004. In 2011, the information was entirely missing. Similar-ly, place of birth (in France/abroad) is collected with numerous errors between 2005 and 2008. However, each DADS year-file y contains information both on the current year t and the preceding year t-1. Therefore, we take advantage of this structure to build a pseudo-panel dataset merged on common information (establi-shment ID, gender, number of hours, duration of the job, dates of start and end of the job, municipality of work and residence, wage and age) between year t of year-file y-1 and year t-1 of year-file y. We can successfully perform a single match with 98% of employees. The pseudo-panel allows us to complete information on place of birth enabling us to make the best use of these va-riables in our analyses. 5. French official statistical services add a nationality of birth in-formation in most surveys in order to exclude French emigrant’s children born abroad and French citizens repatriated from for-mer French colonies (mainly but not always from Algeria) from the immigrant population stock. These categories of population nonetheless represent a limited share of the foreign born popu-lation (about 13%) (Beauchemin et al. 2015, p.20). DADS data do not include nationality of birth information which prevent us from distinguishing between “international migrants” and these complex categories of “French national migrants” (Beauchemin and Safi 2020).6. Historically, Europe has been the main source of migration to France. Nonetheless, the geographical origins of immigrants have been diversifying during the last decades. The share of im-migrants from Europe has consequently been decreasing (from 66% in 1975 to 36% in 2014). This decrease is mainly due to the drop in the number of immigrants from Spain, Portugal and Italy. Since 1999, the origins of European immigrants have also been diversifying, with a growing proportion of immigrants born in Eastern Europe. In 2014, 44% of immigrants were born in the African continent. People born in North Africa represent 30% of all immigrants, a stable proportion since the 1980s. Immigra-tion from sub-Saharan Africa is more recent and mainly concerns countries formerly under French administration. Finally, 15% of immigrants come from Asia. Migration from Asian countries other than Cambodia, Laos and VietNam has increased in recent years (Insee 2018).
sults as a robustness check (Figure A1). In addition to these three categorical inequalities, we also measure intra-categorical inequality using class×gender×nativity cross-category wage inequality within workplaces.
Methods
We adopt a three-step approach to investigate our research questions. First, we describe the intersection of class, gen-der and nativity inequalities at the individual level. Second, we approach inequality regimes at the organizational level studying the relation between our different within-work-place measures of inequality (categorical and intra-categor-ical). Third, we analyze the organizational determinants of the inequality regimes that we document in the second step.
Step 1: Intersection of categorical inequalities at the individual level
In the first step, we estimate the effect of our three cate-gories of inequality – class, gender and nativity – as well as their interactions at the individual level using a standard wage model with workplace fixed effects (j ) (equation 1). We capture gender, nativity and class advantages with male, native, and manager-professional dummies respectively. We control for age (as well as its squared term), number of hours worked (simple and squared), part-time status, and number of days worked (simple and squared). Unfortunate-ly, due to its administrative nature, the data does not include information on the level of education for workers. Howev-er, we control for detailed occupation (2-digit codes), which is important in its own right but also captures substantial differences in education. We also introduce interaction terms between occupation and age, and age squared.
(1)
Using this equation, we first aim at estimating individual-lev-el categorical inequality through class, gender and nativity main effects within workplaces. While this is straightfor-ward for the gender (bg ) and nativity gaps ( bn ), we cannot estimate the class main effect directly since, as shown in
7The Intersection of Organizational Inequalities
equation (1), we control for 2-digit occupational codes and these occupational codes are nested in our class measure of inequality. We therefore estimate a manager main effect within a post-estimation step by computing a weighted dif-ference between all the occupational estimates that com-prise a manager/professional effect and those comprising a worker effect (equation 2):
Manager effect:
where , , and are respectively the estimated parameters and the weight of occupation k within the “managers and professionals” or within the “workers” categories and stands for the average age in the full sample.
Step 2: Intersection of categorical and intra-cat-egorical inequalities at the workplace level
In this second step, we focus on the associations between different types of inequality. We first compute correlations at the workplace level between the three residual wage gaps as explained by class, gender and nativity. To do this, we use equation 1’s residual log wage wij as our dependent variable and perform one regression per establishment j with class, gender and nativity dummies as three independent variables (equation 3).
for each j (3) Each fixed effect bcj , bgj , bnj describes the positive/nega-tive deviation of the workplace j’s gender, nativity and class gaps to the mean gaps calculated in equation 1. Building on equation 3’s estimates, we now compute the following correlations (weighted by the number of workers per es-tablishment): (4)
Additionally, we are also interested in the correlation be-tween each of these categorical wage gaps and the intra-cat-egorical workplace inequality. We measure the latter in each workplace with the standard deviation of errors (generally called root mean square error RMSEj – with
and eij estimated in equation 3) and calculate its correlation
with each categorical wage gap.
Our method of correlating workplace regression parame-ters seeks to circumvent the fact that gender, nativity and class wage gaps overlap with each other. When workplaces are large (i.e. more than one thousand workers), the cor-relations estimated with equation 4 are the correct ones. In smaller workplaces, bcj , bgj , and bnj are likely to be estimated with error; biasing the variance, covariance, and correlation of these parameters – a problem similar to the “inciden-tal parameter” or the “limited mobility bias” (Gaure 2014). This issue is discussed at length in Appendix A2.
We detail two solutions to correctly estimate the covariance. The first (hereafter called “vcov”) consists in subtracting the mean of the corresponding element in the variance-cova-riance matrix of the parameters (ckl ) in each workplace j’s regression from the covariance of equation 3’s estimates (equation 5). (5)
In the second solution (hereafter called “halves”), we ran-domly assign employees of each workplace to two sub-samples: “half 1” or “half 2”. We then estimate separate regressions on the two randomized halves and calculate cross-halves covariance: (6)
As demonstrated in appendix A2, these two solutions en-able us to estimate covariance correcting for measurement errors and they yield nearly identical results on the present dataset and on simulated data.
While these solutions correct for potential biases in co-variance, we also need to correct for the variance (i.e. the denominator) in order to compute robust coefficients of
with and
8 OSC Papers n° 2021-1
correlation. Indeed, on small units, measurement errors may positively bias the variance leading to underestimating the absolute value of the correlation coefficients. As shown in the appendixes, both methods vcov and halves efficiently compute variances that eliminate these biases. (7)
(8)
Finally, we compute correlations between each of the cat-egorical inequality estimates and the intra-categorical in-equality by the RMSE. In a similar vein, we use the “halves” method (equation 6)7 to correct for eventual bias in the vari-ance, covariance, and ultimately in the correlations:
(9)
Step 3: Determinants of within workplace in-equalities
In a third step, we explore the determinants of workplace inequalities. As we have four different outcomes measured simultaneously within workplaces, we implement a gener-alized structural equation model with class, gender and na-tivity fixed effects (estimated in equation 3) and the root mean square of errors (RMSE) as dependent variables8. The model is based on seemingly unrelated regressions al-lowing for autocorrelations between the error terms of the four equations.
(10)
These models control for the composition of the work-force: the share of males, managers, migrants, younger workers, older workers, and the size of the establishment. We also introduce the fixed effects j estimated in equation 1 for each establishment as an indicator of the average wage
7. There’s no indicator in a regression of RMSE error measure-ment. Hence, we cannot use the vcov method.8. For these regressions, each establishment is weighted by the number of workers.
in the establishment net of compositional effects. We final-ly control for the larger environments in which these work-places are nested like industry and urban characteristics.
The advantage of this strategy is that we can estimate the covariances between the residuals of the four equations (εg , εn , εc , and εRMSE) and monitor the extent to which they decline with the introduction of our set of independent variables. To address the kind of covariance measurement error discussed above, we apply the halves approach for paired outcomes (see equation 11):9
(11)
Results
The intersection of categorical inequalities at the individual level
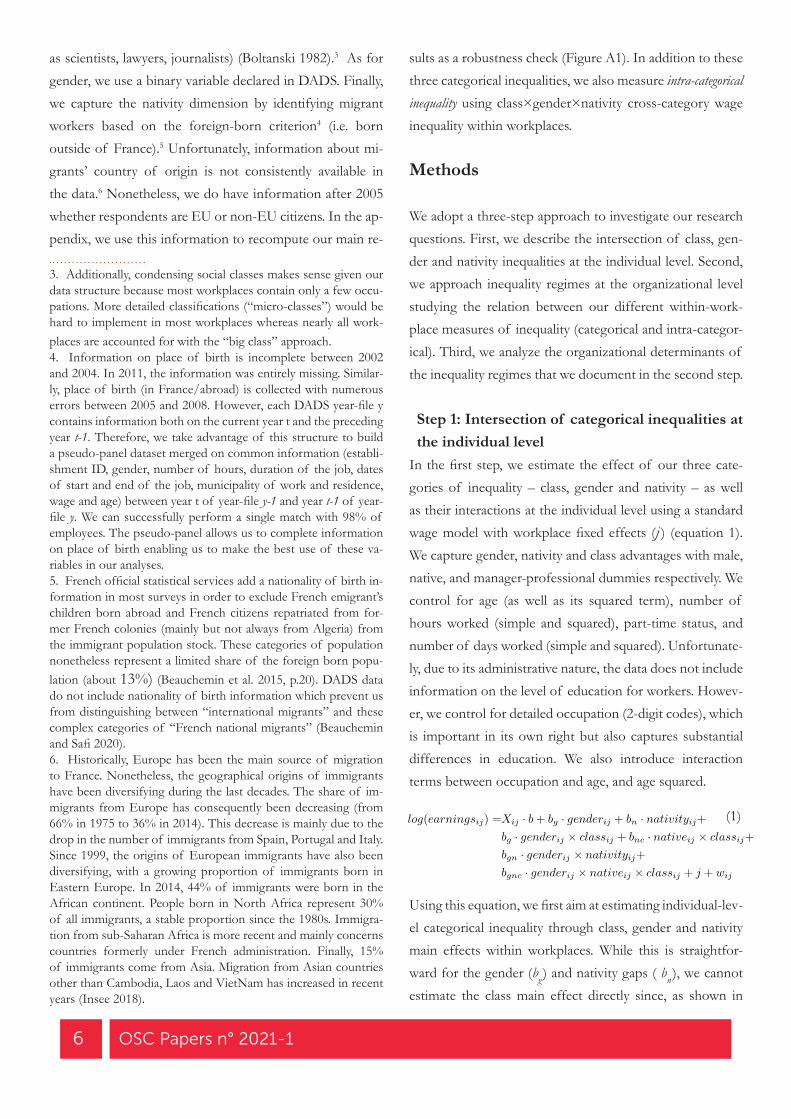
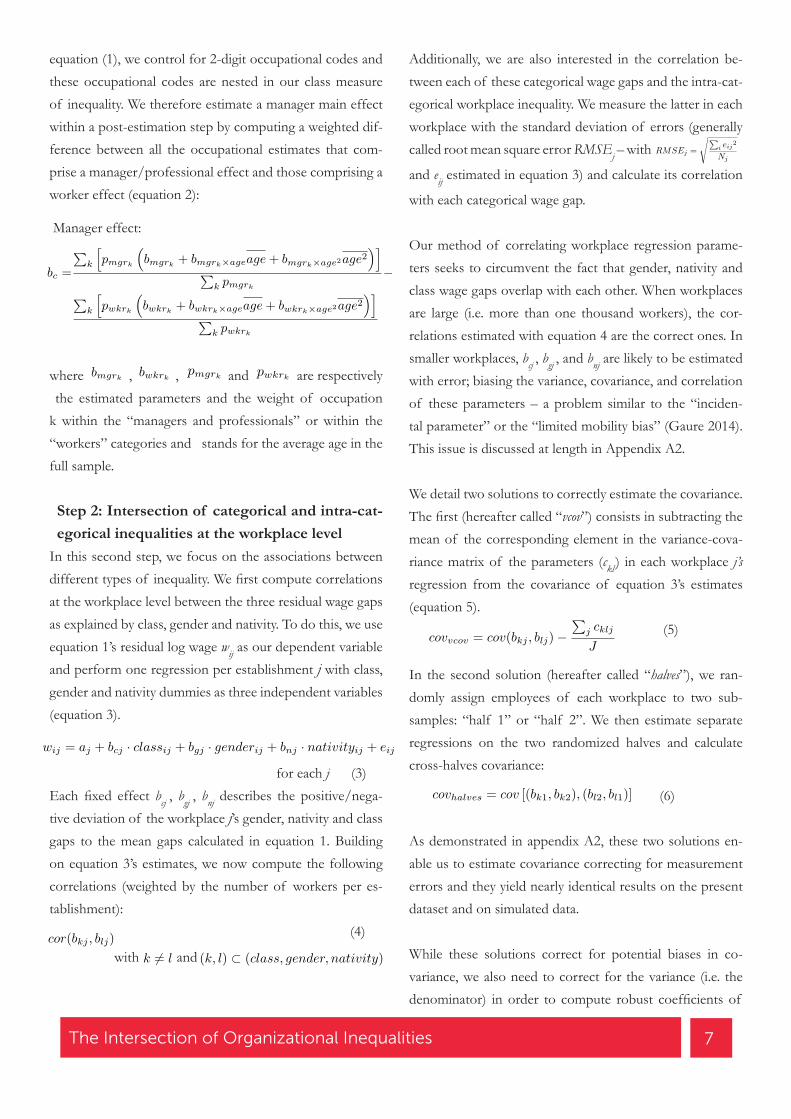
We start by briefly discussing intersectional inequality based on the individual-level results from equations 1 and 2. Sim-ilar to prior research, these analyses use interaction terms. Figure 1 displays the full interaction of gender, nativity and class effects. It also compares the wages of different groups relative to the most disadvantaged group – female migrant workers – our reference category. Figure 2 plots the main and marginal interactions effects from Equation 1.
9. bg12 is a vector combining bg1 calculated on half 1 and bg2 on half 2.
with
9The Intersection of Organizational Inequalities
Figure 1. Wages effects for full set of interactions for each social position
Figure 1 shows that the largest wage gap is by class. For example, managers earn on average 75% more than work-ers during the period – an effect that decreased over time, however. This is followed by gender (with males earning 8.7% more than females) and nativity (with natives earnings 2.6% more than migrants)10. There is evidently a cumulative disadvantage effect in line with prior research (Greenman and Xie 2008; Woodhams, Lupton, and Cowling 2015).
Female migrant workers are worse off than female migrant managers (a 73% gap), male migrant workers (a 7% gap) and female native workers (a 4% gap). Both Figures 1 and 2 show that the gender gap is twice as strong among man-agers (+14%) than among workers (+7%). Conversely the nativity gap exists only among workers (+3.8%) and is null among managers (-0.3% on average).
10. From the first step equation, we can post-estimate the overall gender gap (and similarly overall nativity and class gaps) as the average of the gender gaps measured among respectively migrant workers, native workers, migrant managers and native managers (weighted by the size of these respective four groups).
Figure 2. Impact of gender, class and nativity and their interactions on log wages
Note: Gender, class and nativity main effects and their inte-ractions on log earnings are calculated according to equation 1 using a yearly log wage dependent variable controlling for age, number of hours worked, and 2-digit occupation categories and introducing a workplace fixed effect. The 95% confidence intervals are based on cluster-robust standard errors, cluste-red at the regional level (i.e. French départements). Because we control for detailed occupation, class main effects cannot be estimated directly and is post estimated and therefore we could not compute a confidence intervals. Nevertheless, given the size of the effect, we have no doubt that it is highly significant.
YearsPa
ram
eter
Est
imat
es (l
og w
ages
)
�� � � �
�
�� �
� ��
� �� �
� ��
�
�
1996
1997
1998
1999
2000
2001
2002
2003
2004
2005
2006
2007
2008
2009
2010
2011
2012
2013
2014
2015
2016
−0.04
−0.02
0.00
0.02
0.04
0.06
0.08
0.10 0.48
0.50
0.52
0.54
0.56
0.58
0.60
Manager/Professional (right scale)MaleNative
�
Male�Manager/Pro.Native�Manager/Pro.Male�NativeMale�Native�Manager/Pro.
Years
Wag
e ga
ps (c
ompa
red
to th
e fe
mal
e m
igra
nt w
orke
r gro
up)
� �� �
� �� � � � � � �
� �
� �
�� �
�
� � � � � � � � � � � � � � � � � � � � �
0 %
10 %
20 %
30 %
40 %
50 %
60 %
70 %
80 %
90 %
100 %
1996
1997
1998
1999
2000
2001
2002
2003
2004
2005
2006
2007
2008
2009
2010
2011
2012
2013
2014
2015
2016
� �
Male Native ManagerMale Migrant ManagerFemale Native ManagerFemale Migrant Manager
Male Native WorkerMale Migrant WorkerFemale Native WorkerFemale Migrant Worker
10 OSC Papers n° 2021-1
The Intersection of Inequalities at the Estab-lishment-Level
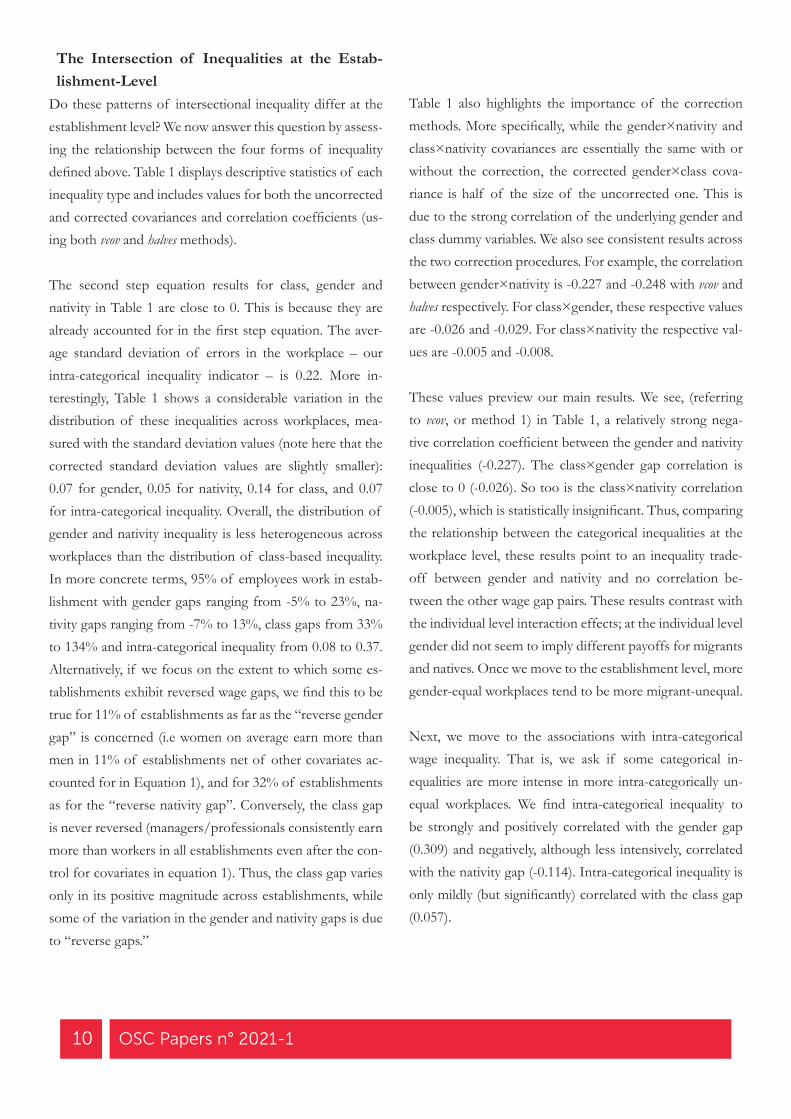
Do these patterns of intersectional inequality differ at the establishment level? We now answer this question by assess-ing the relationship between the four forms of inequality defined above. Table 1 displays descriptive statistics of each inequality type and includes values for both the uncorrected and corrected covariances and correlation coefficients (us-ing both vcov and halves methods).
The second step equation results for class, gender and nativity in Table 1 are close to 0. This is because they are already accounted for in the first step equation. The aver-age standard deviation of errors in the workplace – our intra-categorical inequality indicator – is 0.22. More in-terestingly, Table 1 shows a considerable variation in the distribution of these inequalities across workplaces, mea-sured with the standard deviation values (note here that the corrected standard deviation values are slightly smaller): 0.07 for gender, 0.05 for nativity, 0.14 for class, and 0.07 for intra-categorical inequality. Overall, the distribution of gender and nativity inequality is less heterogeneous across workplaces than the distribution of class-based inequality. In more concrete terms, 95% of employees work in estab-lishment with gender gaps ranging from -5% to 23%, na-tivity gaps ranging from -7% to 13%, class gaps from 33% to 134% and intra-categorical inequality from 0.08 to 0.37. Alternatively, if we focus on the extent to which some es-tablishments exhibit reversed wage gaps, we find this to be true for 11% of establishments as far as the “reverse gender gap” is concerned (i.e women on average earn more than men in 11% of establishments net of other covariates ac-counted for in Equation 1), and for 32% of establishments as for the “reverse nativity gap”. Conversely, the class gap is never reversed (managers/professionals consistently earn more than workers in all establishments even after the con-trol for covariates in equation 1). Thus, the class gap varies only in its positive magnitude across establishments, while some of the variation in the gender and nativity gaps is due to “reverse gaps.”
Table 1 also highlights the importance of the correction methods. More specifically, while the gender×nativity and class×nativity covariances are essentially the same with or without the correction, the corrected gender×class cova-riance is half of the size of the uncorrected one. This is due to the strong correlation of the underlying gender and class dummy variables. We also see consistent results across the two correction procedures. For example, the correlation between gender×nativity is -0.227 and -0.248 with vcov and halves respectively. For class×gender, these respective values are -0.026 and -0.029. For class×nativity the respective val-ues are -0.005 and -0.008.
These values preview our main results. We see, (referring to vcov, or method 1) in Table 1, a relatively strong nega-tive correlation coefficient between the gender and nativity inequalities (-0.227). The class×gender gap correlation is close to 0 (-0.026). So too is the class×nativity correlation (-0.005), which is statistically insignificant. Thus, comparing the relationship between the categorical inequalities at the workplace level, these results point to an inequality trade-off between gender and nativity and no correlation be-tween the other wage gap pairs. These results contrast with the individual level interaction effects; at the individual level gender did not seem to imply different payoffs for migrants and natives. Once we move to the establishment level, more gender-equal workplaces tend to be more migrant-unequal.
Next, we move to the associations with intra-categorical wage inequality. That is, we ask if some categorical in-equalities are more intense in more intra-categorically un-equal workplaces. We find intra-categorical inequality to be strongly and positively correlated with the gender gap (0.309) and negatively, although less intensively, correlated with the nativity gap (-0.114). Intra-categorical inequality is only mildly (but significantly) correlated with the class gap (0.057).
11The Intersection of Organizational Inequalities
Our inquiry into whether workplaces inequality regimes are reinforcing or compensating shows evidence for both pat-terns. There are inequality trade-offs within establishments between the gender and nativity gaps. Moreover, we find lower native wage gaps in more egalitarian workplaces over-all. We observe patterns of reinforcing inequality between the gender gap and the establishment intra-categorical wage inequality. The gender gap is higher in more intra-cat-egorically unequal workplace environments. Stated slight-
ly differently, we draw two conclusions. First, workplaces are marked by relatively more native or gender equality but not both. One comes at the expense of the other. Second, the level of gender or migrant egalitarianism depends on whether a workplace has high or low wage inequality that is not based on the three categorical distinctions we study in this article.
Table 1. Full period uncorrected and corrected covariance and correlation of inequality measures
Gender Nativity Class Intra-categorical inequality
First step gaps (log wage)(percentage)Second step estimatesMeanStd Dev.Std Dev. Corrected “vcov”Std Dev. Corrected “halves”
0.0838.7%
-0.0050.0720.0650.065
0.0262.6%
-0.0040.0650.0490.044
0.56175%
0.0090.1450.1410.139
/
0.2240.075
/0.073
Uncorrected CovarianceGenderNativityClassIntra-categorical inequality
-0.00071-0.000410.00150
-0.00071
0.00001-0.00038
-0.000410.00001
0.00060
0.00150-0.000380.00060
Corrected covariance GenderNativityClassIntra-categorical inequality
Method 1 vcov -0.00072-0.00023
/
-0.00070Method 2 halves
-0.00003/
-0.00026-0.00005
/
0.00146-0.000370.00057
Uncorrected Correlation coefficientGender
Nativity
Class
Intra-categorical inequality
-0.152[-0.156 ; -0.148]
-0.039[-0.044 ; -0.035]
0.281[0.277 ; 0.285]
-0.152[-0.156 ; -0.148]
0.001[-0.003 ; 0.006]
-0.078[-0.082 ; -0.073]
-0.039[-0.044 ; -0.035]
0.001[-0.003 ; 0.006]
0.056[0.051 ; 0.06]
0.281[0.277 ; 0.285]
-0.078[-0.082 ; -0.073]
0.056[0.051 ; 0.06]
Corrected correlation coefficient Gender
Nativity
Class
Intra-categorical inequality
Method 2 halves Method 1 vcov
-0.227[-0.239 ; -0.216]
-0.026[-0.035 ; -0.016]
/
-0.248[-0.262 ; -0.236]
-0.005
[-0.015 ; 0.006]/
-0.029[-0.038 ; -0.019]
-0.008[-0.019 ; 0.004]
/
0.309[0.299 ; 0.32]
-0.114[-0.129 ; -0.098]
0.057[0.046 ; 0.067]
Note: All measures are based on log wages except line 2, which represents gaps in proportion to the wage of the disadvantage group. 95% confidence intervals in square brackets were calculated with bootstrapping (4000 samples).
12 OSC Papers n° 2021-1
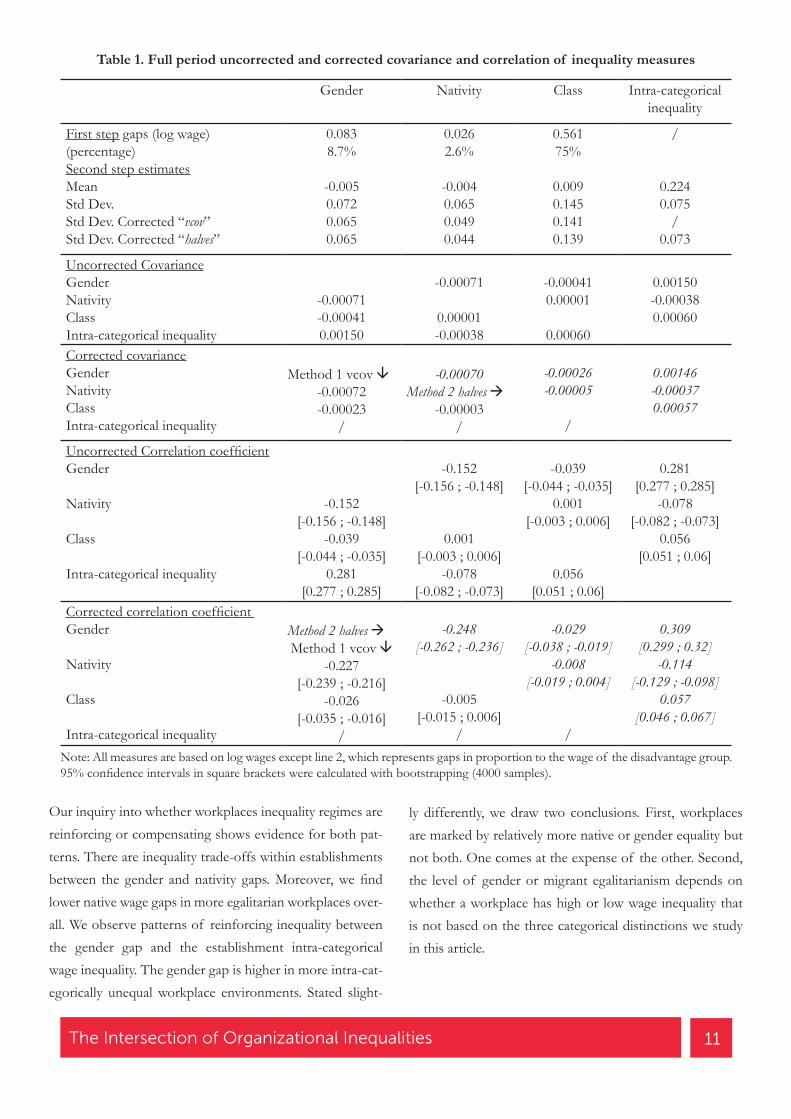
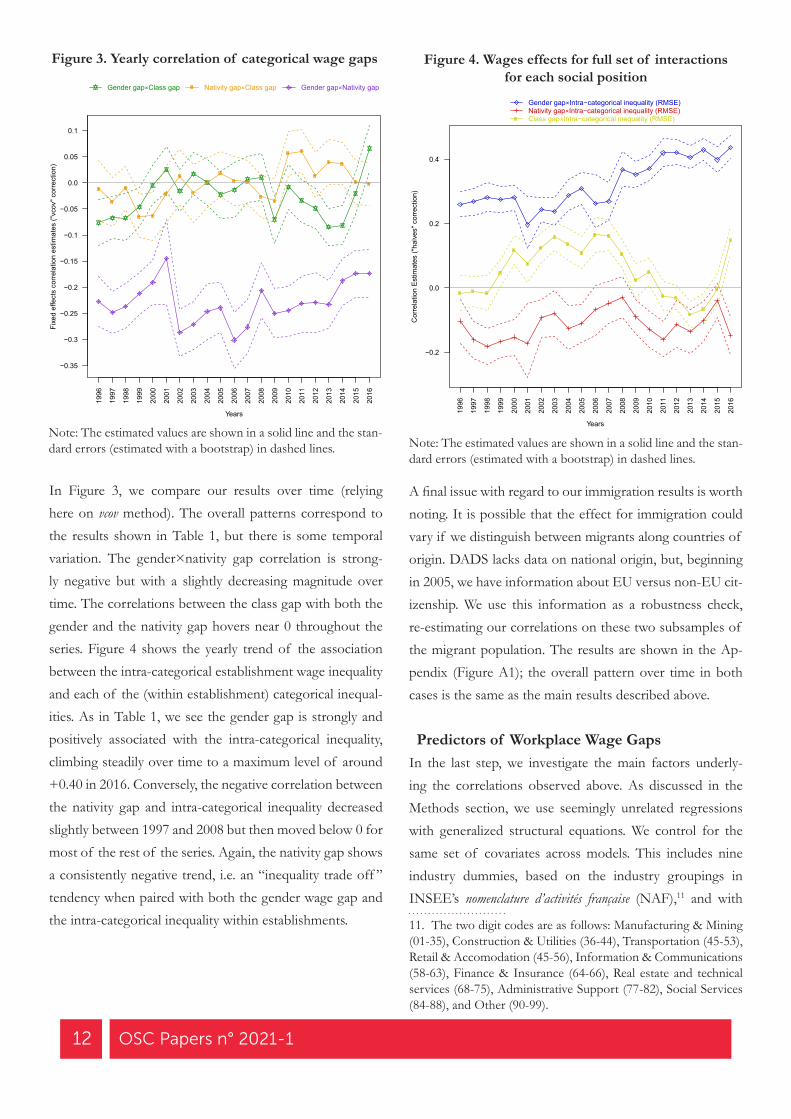
In Figure 3, we compare our results over time (relying here on vcov method). The overall patterns correspond to the results shown in Table 1, but there is some temporal variation. The gender×nativity gap correlation is strong-ly negative but with a slightly decreasing magnitude over time. The correlations between the class gap with both the gender and the nativity gap hovers near 0 throughout the series. Figure 4 shows the yearly trend of the association between the intra-categorical establishment wage inequality and each of the (within establishment) categorical inequal-ities. As in Table 1, we see the gender gap is strongly and positively associated with the intra-categorical inequality, climbing steadily over time to a maximum level of around +0.40 in 2016. Conversely, the negative correlation between the nativity gap and intra-categorical inequality decreased slightly between 1997 and 2008 but then moved below 0 for most of the rest of the series. Again, the nativity gap shows a consistently negative trend, i.e. an “inequality trade off ” tendency when paired with both the gender wage gap and the intra-categorical inequality within establishments.
Figure 4. Wages effects for full set of interactions for each social position
A final issue with regard to our immigration results is worth noting. It is possible that the effect for immigration could vary if we distinguish between migrants along countries of origin. DADS lacks data on national origin, but, beginning in 2005, we have information about EU versus non-EU cit-izenship. We use this information as a robustness check, re-estimating our correlations on these two subsamples of the migrant population. The results are shown in the Ap-pendix (Figure A1); the overall pattern over time in both cases is the same as the main results described above.
Predictors of Workplace Wage GapsIn the last step, we investigate the main factors underly-ing the correlations observed above. As discussed in the Methods section, we use seemingly unrelated regressions with generalized structural equations. We control for the same set of covariates across models. This includes nine industry dummies, based on the industry groupings in INSEE’s nomenclature d’activités française (NAF),11 and with
11. The two digit codes are as follows: Manufacturing & Mining (01-35), Construction & Utilities (36-44), Transportation (45-53), Retail & Accomodation (45-56), Information & Communications (58-63), Finance & Insurance (64-66), Real estate and technical services (68-75), Administrative Support (77-82), Social Services (84-88), and Other (90-99).
Figure 3. Yearly correlation of categorical wage gaps
Note: The estimated values are shown in a solid line and the stan-dard errors (estimated with a bootstrap) in dashed lines. Note: The estimated values are shown in a solid line and the stan-
dard errors (estimated with a bootstrap) in dashed lines.
2000
2005
2010
2015
−0.3
−0.2
−0.1
0.0
0.1
Years
Fixe
d ef
fect
s co
rrela
tion
estim
ates
("vc
ov" c
orre
ctio
n)
1996
1997
1998
1999
2001
2002
2003
2004
2006
2007
2008
2009
2011
2012
2013
2014
2016
−0.35
−0.25
−0.15
−0.05
0.05
Gender gap�Class gap Nativity gap�Class gap Gender gap�Nativity gap
2000
2005
2010
2015
−0.2
0.0
0.2
0.4
YearsC
orre
latio
n Es
timat
es ("
halv
es" c
orre
ctio
n)
1996
1997
1998
1999
2001
2002
2003
2004
2006
2007
2008
2009
2011
2012
2013
2014
2016
Gender gap�Intra−categorical inequality (RMSE)Nativity gap�Intra−categorical inequality (RMSE)Class gap�Intra−categorical inequality (RMSE)
13The Intersection of Organizational Inequalities
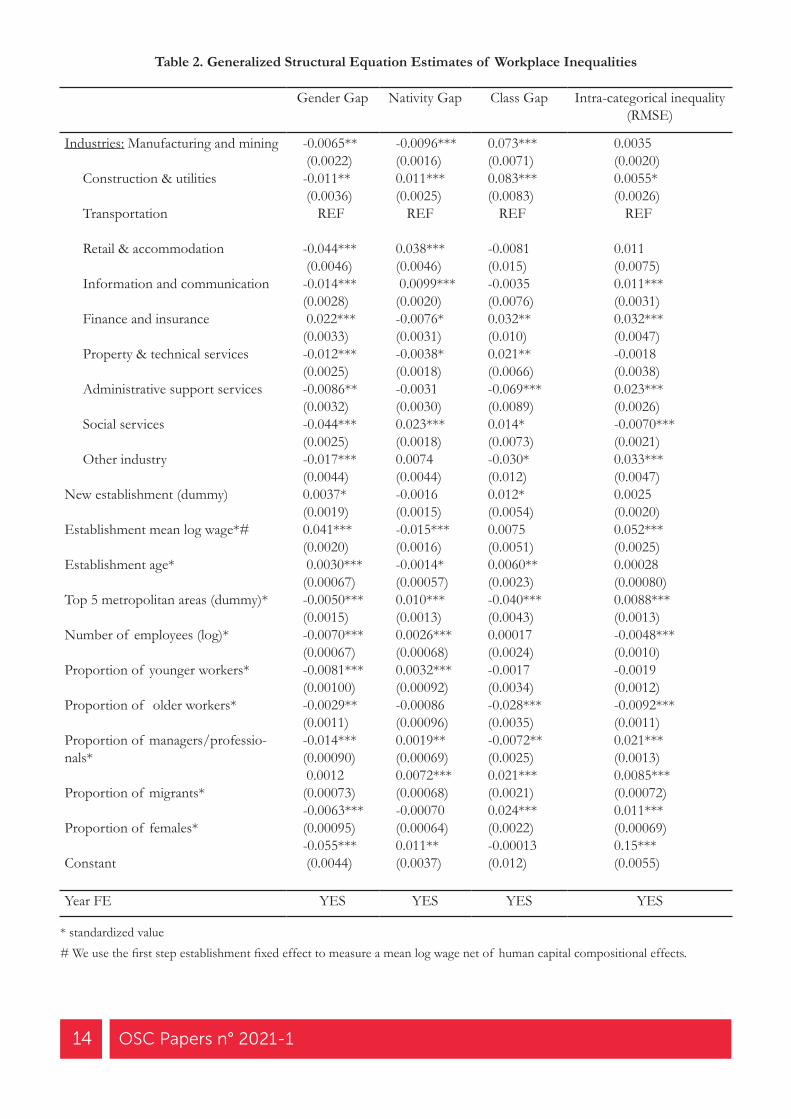
transportation as the reference category. To account for urbanization, we also include a dummy for whether the es-tablishment is in the top 5 largest departments in France.12 Additionally, we control for several organizational- level features. We measure establishment age with two vari-ables: 1) a dummy coding the existence of the establish-ment at the beginning of the panel in 1996, 2) the number of years an establishment is present in the panel. We also control for the log number of employees in an establish-ment, the mean log wage of the establishment, and the pro-portion of migrants, women, and managers.13 Proportions of “younger” workers (25-34) and “older” workers (45-55) are also included as covariates. Finally, we include year fixed effects, but do not report these results for the sake of con-cision. All of the linear variables are standardized. Our ap-proach is descriptive and does not measure causal effects. Indeed, we use these analyses to account for the contexts in which the patterns we’ve measured in the former section are the most salient: the negative correlation between gen-der and nativity, the negative correlation between intra-cat-egorical inequality and nativity, and the positive correlation between gender and intra-categorical inequality.
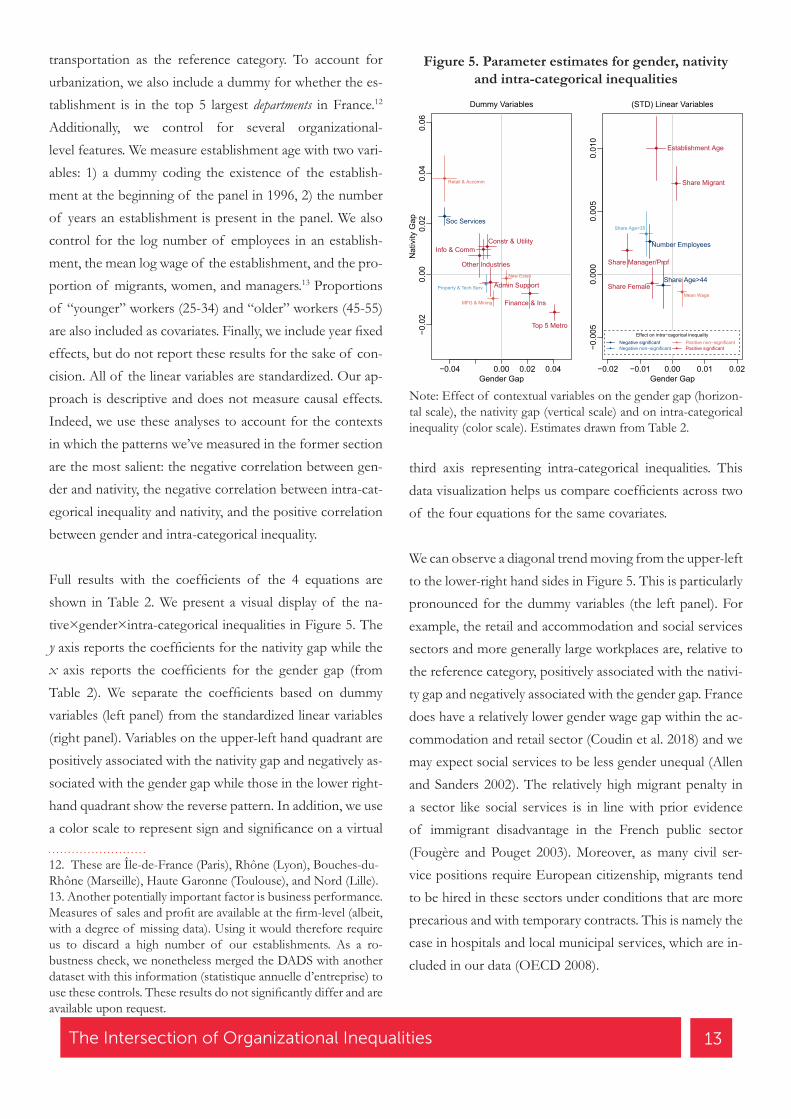
Full results with the coefficients of the 4 equations are shown in Table 2. We present a visual display of the na-tive×gender×intra-categorical inequalities in Figure 5. The y axis reports the coefficients for the nativity gap while the x axis reports the coefficients for the gender gap (from Table 2). We separate the coefficients based on dummy variables (left panel) from the standardized linear variables (right panel). Variables on the upper-left hand quadrant are positively associated with the nativity gap and negatively as-sociated with the gender gap while those in the lower right-hand quadrant show the reverse pattern. In addition, we use a color scale to represent sign and significance on a virtual
12. These are Île-de-France (Paris), Rhône (Lyon), Bouches-du-Rhône (Marseille), Haute Garonne (Toulouse), and Nord (Lille).13. Another potentially important factor is business performance. Measures of sales and profit are available at the firm-level (albeit, with a degree of missing data). Using it would therefore require us to discard a high number of our establishments. As a ro-bustness check, we nonetheless merged the DADS with another dataset with this information (statistique annuelle d’entreprise) to use these controls. These results do not significantly differ and are available upon request.
Figure 5. Parameter estimates for gender, nativity and intra-categorical inequalities
−0.04 0.00 0.02 0.04
−0.0
20.
000.
020.
040.
06
Dummy Variables
Gender Gap
Nat
ivity
Gap
MFG & Mining
Constr & Utility
Retail & Accomm
Info & Comm
Finance & Ins
Property & Tech Serv Admin Support
Soc Services
Other IndustriesNew Estab
Top 5 Metro
−0.02 −0.01 0.00 0.01 0.02
−0.0
050.
000
0.00
50.
010
(STD) Linear Variables
Gender Gap
Mean Wage
Establishment Age
Number Employees
Share Age<35
Share Age>44
Share Manager/Prof
Share Migrant
Share Female
Effect on intra−cagorical inequalityNegative significantNegative non−significant
Positive non−significantPositive significant
Note: Effect of contextual variables on the gender gap (horizon-tal scale), the nativity gap (vertical scale) and on intra-categorical inequality (color scale). Estimates drawn from Table 2.
third axis representing intra-categorical inequalities. This data visualization helps us compare coefficients across two of the four equations for the same covariates.
We can observe a diagonal trend moving from the upper-left to the lower-right hand sides in Figure 5. This is particularly pronounced for the dummy variables (the left panel). For example, the retail and accommodation and social services sectors and more generally large workplaces are, relative to the reference category, positively associated with the nativi-ty gap and negatively associated with the gender gap. France does have a relatively lower gender wage gap within the ac-commodation and retail sector (Coudin et al. 2018) and we may expect social services to be less gender unequal (Allen and Sanders 2002). The relatively high migrant penalty in a sector like social services is in line with prior evidence of immigrant disadvantage in the French public sector (Fougère and Pouget 2003). Moreover, as many civil ser-vice positions require European citizenship, migrants tend to be hired in these sectors under conditions that are more precarious and with temporary contracts. This is namely the case in hospitals and local municipal services, which are in-cluded in our data (OECD 2008).
14 OSC Papers n° 2021-1
Table 2. Generalized Structural Equation Estimates of Workplace Inequalities
Gender Gap Nativity Gap Class Gap Intra-categorical inequality (RMSE)
Industries: Manufacturing and mining Construction & utilities Transportation
Retail & accommodation Information and communication Finance and insurance Property & technical services Administrative support services Social services Other industry New establishment (dummy) Establishment mean log wage*#
Establishment age* Top 5 metropolitan areas (dummy)* Number of employees (log)* Proportion of younger workers* Proportion of older workers* Proportion of managers/professio-nals* Proportion of migrants* Proportion of females* Constant
-0.0065** (0.0022)-0.011** (0.0036) REF
-0.044*** (0.0046)-0.014***(0.0028) 0.022***(0.0033)-0.012***(0.0025)-0.0086**(0.0032)-0.044***(0.0025)-0.017***(0.0044)0.0037*(0.0019)0.041***(0.0020) 0.0030*** (0.00067)-0.0050***(0.0015)-0.0070***(0.00067)-0.0081***(0.00100)-0.0029**(0.0011)-0.014***(0.00090) 0.0012(0.00073)-0.0063***(0.00095)-0.055*** (0.0044)
-0.0096***(0.0016)0.011***(0.0025) REF
0.038***(0.0046) 0.0099***(0.0020)-0.0076*(0.0031)-0.0038*(0.0018)-0.0031(0.0030)0.023***(0.0018)0.0074(0.0044)-0.0016(0.0015)-0.015***(0.0016)-0.0014*(0.00057)0.010***(0.0013)0.0026***(0.00068)0.0032***(0.00092)-0.00086(0.00096)0.0019**(0.00069)0.0072***(0.00068)-0.00070(0.00064)0.011**(0.0037)
0.073***(0.0071)0.083***(0.0083) REF
-0.0081(0.015)-0.0035(0.0076)0.032**(0.010)0.021**(0.0066)-0.069***(0.0089)0.014*(0.0073)-0.030*(0.012)0.012*(0.0054)0.0075(0.0051)0.0060**(0.0023)-0.040***(0.0043)0.00017(0.0024)-0.0017(0.0034)-0.028***(0.0035)-0.0072**(0.0025)0.021***(0.0021)0.024***(0.0022)-0.00013(0.012)
0.0035(0.0020)0.0055*(0.0026) REF
0.011(0.0075)0.011***(0.0031)0.032***(0.0047)-0.0018(0.0038)0.023***(0.0026)-0.0070***(0.0021)0.033***(0.0047)0.0025(0.0020)0.052***(0.0025)0.00028(0.00080)0.0088***(0.0013)-0.0048***(0.0010)-0.0019(0.0012)-0.0092***(0.0011)0.021***(0.0013)0.0085***(0.00072)0.011***(0.00069)0.15***(0.0055)
Year FE YES YES YES YES
* standardized value# We use the first step establishment fixed effect to measure a mean log wage net of human capital compositional effects.
15The Intersection of Organizational Inequalities
Additionally, there are important effects for the finance/insurance industry and urbanization. Both variables are positively associated with intra-categorical inequality. The financial/insurance sector and the most urban contexts concentrate material resources and lead to more unequal distribution (Galbraith 2012). These sectors are positively associated with gender gaps as well. The financial sector is known to be highly masculine and gender biased (Roth 2006) including in France (Godechot 2017). Urbanization is also associated with the gender gap and this might be interpreted both as a result of the concentration in these areas of more male dominated decision functions and headquarters and of disparate preferences for commut-ing across males and females as recent research shows (Le Barbanchon, Rathelot, and Roulet 2020; Wyly 1998). That these two establishment’s characteristics are both strong-ly and positively associated with the intra-categorical in-equality and the gender gap therefore helps account for the fact that these two gaps are positively associated with each
other. Interestingly, we see opposite trends for the nativity wage gap by these factors. Migrant’s wage penalty tend to be smaller in urban areas and within the financial/insurance sector; this also pertains to the dualization of migrant labor between low-skilled workers and high-skilled workers that circulate mainly in global cities and intensively within the financial sector across developed countries (Sassen 2001).
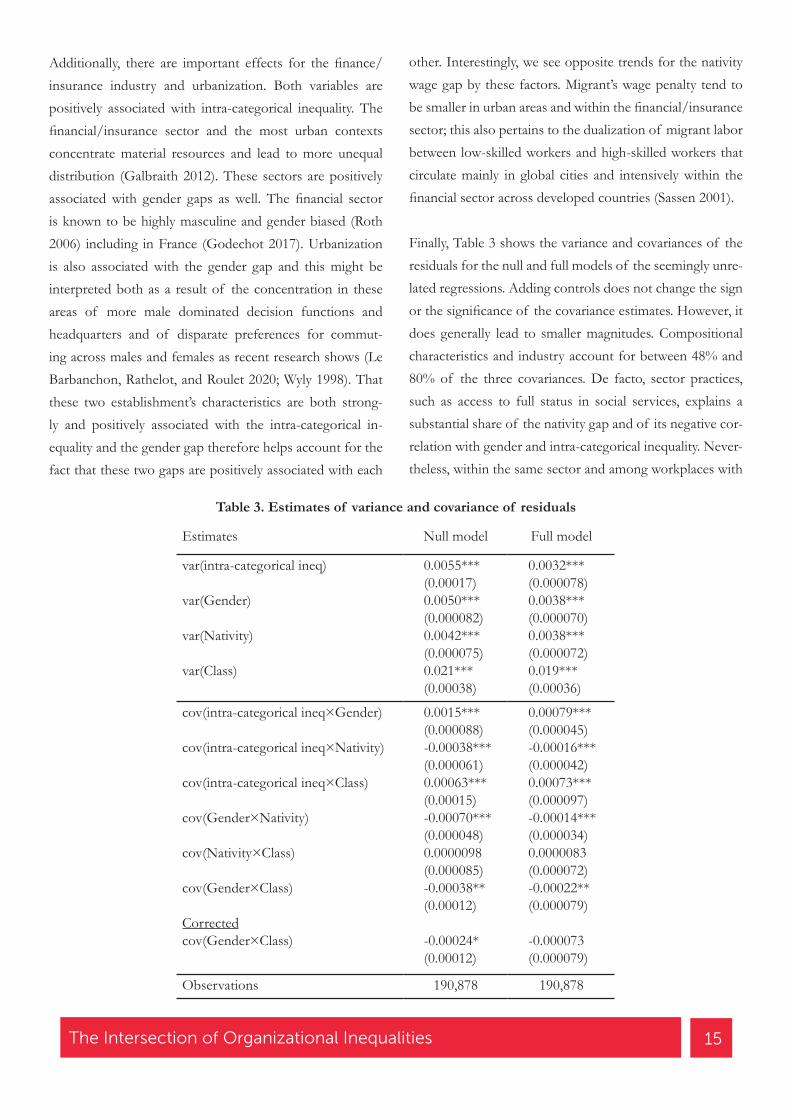
Finally, Table 3 shows the variance and covariances of the residuals for the null and full models of the seemingly unre-lated regressions. Adding controls does not change the sign or the significance of the covariance estimates. However, it does generally lead to smaller magnitudes. Compositional characteristics and industry account for between 48% and 80% of the three covariances. De facto, sector practices, such as access to full status in social services, explains a substantial share of the nativity gap and of its negative cor-relation with gender and intra-categorical inequality. Never-theless, within the same sector and among workplaces with
Table 3. Estimates of variance and covariance of residuals
Estimates Null model Full model
var(intra-categorical ineq)
var(Gender) var(Nativity) var(Class)
0.0055***(0.00017)0.0050***(0.000082)0.0042***(0.000075)0.021***(0.00038)
0.0032***(0.000078)0.0038***(0.000070)0.0038***(0.000072)0.019***(0.00036)
cov(intra-categorical ineq×Gender) cov(intra-categorical ineq×Nativity) cov(intra-categorical ineq×Class) cov(Gender×Nativity) cov(Nativity×Class) cov(Gender×Class) Correctedcov(Gender×Class)
0.0015***(0.000088)-0.00038***(0.000061)0.00063***(0.00015)-0.00070***(0.000048)0.0000098(0.000085)-0.00038**(0.00012) -0.00024*(0.00012)
0.00079***(0.000045)-0.00016***(0.000042)0.00073***(0.000097)-0.00014***(0.000034)0.0000083(0.000072)-0.00022**(0.000079) -0.000073(0.000079)
Observations 190,878 190,878
16 OSC Papers n° 2021-1
the same compositional characteristics, the nativity gap re-mains negatively correlated with other forms of inequality and gender inequality reinforces intra-categorical inequality.
Discussion and Conclusion
In this article, we combine recent interests in intersectional and organizational mechanisms to ask how different types of inequalities relate to each other within French work-places. Specifically, we build off Acker’s idea of “inequality regimes” to explore whether they take the form of a rein-forcing inequality regime or an inequality tradeoff regime. We do so with innovative methodological techniques to net out measurement biases that would ordinarily arise from correlating different forms of wage gaps. This is a key con-tribution of this article.
We find that the gender gap is positively correlated with intra-categorical inequality. Conversely, the nativity gap is negatively correlated with both intra-categorical inequality and the gender gap. Interestingly, the class categorical gap is not significantly associated with other forms of inequality. We also find that several contextual factors, notably indus-tries, contribute to approximately half of the correlation between intra-categorical and gender or nativity inequalities (for the gender-native combination, it is as high as 80%). Additionally, we find that the correlation pattern is only at-tenuated but does not disappear when controlling for in-dustry and compositional variables.
These findings suggest that organizations articulate dif-ferently exogenous salient categorical distinctions such as gender or nativity with endogenous production-relat-ed inequalities. Highly unequal workplaces reinforce their intra-categorical inequality with a large gender gap. Less unequal workplaces trade off this internal equity with the reactivation of migrant-native gap. In addition, workplaces trade off between the exogenous categorical distinctions they produce. Specifically, workplaces with low gender gaps tend to have high migrant gap and vice versa. Our findings advance the literature on these differential processes of in-
equality and their articulation (Brubaker 2015; Mandel and Semyonov 2016; Restifo and Mykyta 2019; Ridgeway 2011).
These results are among the first to describe correlation be-tween different dimensions of inequality within workplac-es. They call for supplementary research to confirm these patterns and trends and to explore their underlying mecha-nisms. Here, we suggest some possible explanations of our findings.
We begin with the finding concerning the positive associa-tion between gender and intra-categorical inequality (i.e. a reinforcing regime). First, inequality and competition en-hance masculine agentic roles and discourage female work-ers (Eagly and Karau 2002; Niederle and Vesterlund 2007). Persistent gender roles explain why women are channeled (or self-select themselves) into jobs, functions, hierarchical positions that are less exposed to competition within their workplace. Such positions tend to be less driven by mar-ket-related incentives (e.g. bonuses). Consequently, levels of remuneration tend to be lower. The finance industry is one of the most striking illustrations of the coexistence of high gender gap and high wage inequality (Godechot 2017; Roth 2006). Moreover, in a context of a persistent “glass ceiling” at the top, one would find both a high gender gap and over-all wage inequality (Baxter and Wright 2000).
By contrast, the trade-off regime that we document be-tween the nativity gap and intra-categorical inequality could be a byproduct of industrial relations and the “dualization” of the labor market. French trade unions had historically tried to include migrants, especially in the 1930 and in the post-WW2 period (Noiriel 1988). However, with the up-heaval of a strong version of French colorblindness in the 1980’s, even unions on the left side of the political spec-trums embraced French universalism and failed to address the specific problems faced by migrant workers (Bataille 1997, 2018; Bruno 2011). In some sectors like public trans-portations and civil services, unions are furthermore eager to defend insider worker status. In such dualistic contexts, migrant worker’s legal vulnerability translates into lower
17The Intersection of Organizational Inequalities
wages. This may explain why larger workplaces and social service sectors, where strong unions are involved in defend-ing insider workers status, combine narrower pay dispersion with larger nativity gaps.
Finally, the negative correlation between the gender and nativity gaps is the most novel result and the most chal-lenging to interpret. Because previous literature generally considers gender and ethnoracial discriminations to share many underlying mechanisms, one could expect gaps along those dimensions to be correlated positively. However, the gender and ethnoracial equality struggles have been increas-ingly opposed in French society. In the recent public debate, female and migrant rights tend to be depicted in antagonis-tic ways leading to possible tensions between gender and ethnoracial equality policies. How this opposition translates in the labor market, however, is less understood. Policy dif-ferences in tackling discrimination may provide some clues to explaining this tradeoff. Gender discrimination in pay and promotion is well recognized in France. Policies have been implemented since the early 1980s including com-pulsory gender equality negotiation since 2001 and female quotas on boards of large firms in 2011. By contrast, the recognition of ethnoracial discrimination and correspond-ing social policy remains much weaker in the “colorblind” French context, despite undisputable empirical evidence of its existence. This may explain, for example, qualitative evi-dence showing how gender and ethnoracial inequalities are dealt with differently by diversity managers (Bereni 2009; Doytcheva 2010; Doytcheva and Alaoui Hachimi 2010; Safi 2017). These kinds of dynamics could therefore translate into a wage-equality trade-off within the workplace. This result moreover suggests that categorical inequalities are not only imported to the workplace as salient readily avail-able differences; the ways in which they intersect in societies may also shape specific forms of organizational inequality tradeoff between them. To what extent is this negative cor-relation between gender and migrant status France-specif-ic? Future research investigating these patterns in different countries will be valuable to consolidate this finding and broaden these first elements of interpretation.
Despite these contributions, this study contains several important limitations that warrant discussion. One issue is our measure of nativity. Our variable captures those born outside of France. While this is a widely used measure of immigrant status, we cannot account for important la-bor-market factors such as age at arrival, fluency in French, abroad accreditation, occupational training, and other as-pects that affect immigrant socioeconomic attainment in host countries (Melzer et al. 2018; Tomaskovic-Devey et al. 2015). Perhaps most importantly, it does not capture the racialized dimensions of French immigration from North and Sub-Saharan Africa. While important, our broad-based migration measure likely makes our results more conserva-tive. A second limitation concerns our analyses of the de-terminants of workplace inequality regimes. Although this exercise helps us delve further into the correlation of the gaps, it is neither an exhaustive nor a causal study of these determinants.
Going forward, we invite researchers to consider specifying inequality regimes and, especially, to study the effects in-equality regimes have on the workplace. Different regimes can lead to different organizational environments and in-terpersonal relations. Future research should consider how overall levels of inequality and the multiple forms in which they relate affect outcomes like this or others (e.g. work-place safety, anti-discrimination policies, collective bargain-ing capacity). If inequalities move together, for example, it compounds these effects within that space. If there are inequality trade-offs, this can alter the balance of power and claims making strategies available to actors. Addressing these questions can account for the multifaceted character of inequality and its various socio-economic consequences.
18 OSC Papers n° 2021-1
References
ACKER, JOAN, 2006, “Inequality Regimes Gender, Class, and Race in Organizations”, Gender and Society, 20(4):441–64. doi: 10.2307/27640904
ALLEN, JIM and SANDERS, KARIN, 2002, “Gender Gap in Earnings at the Industry Level”, Eu-ropean Journal of Women’s Studies, 9(2):163–80. doi: 10.1177/2F1350682002009002808
AMABLE, BRUNO, 2017, Structural Crisis and Institu-tional Change in Modern Capitalism: French Cap-italism in Transition, New York: Oxford Univer-sity Press.
INSEE, 2020, « Immigrés et Descendants d’immigrés », France, Portrait Social, Paris, Insee. En ligne
ARNESEN, ERIC, 1998, “Up from Exclusion: Black and White Workers, Race, and the State of Labor His-tory”, Reviews in American History, 26(1):146–74. Jstor link
AVENT-HOLT, DUSTIN and TOMASKOVIC-DEVEY, DONALD, 2012, “Relational Inequality: Gender Earnings Inequality in U.S. and Japanese Manu-facturing Plants in the Early 1980s”, Social Forces, 91(1):157–80. doi: 10.1093/sf/sos068
BARON, JAMES N. and BIELBY,WILLIAM T., 1980, “Bringing the Firms Back in: Stratification, Seg-mentation, and the Organization of Work”, Amer-ican Sociological Review, 45(5):737–65. Jstor link
BATAILLE, PHILIPPE, 1997, Le Racisme Au Travail, Par-is: La Découverte.
BATAILLE, PHILIPPE, 2018, “The French Trade Union Movement and the Struggle Against Racism in the Workplace”, In: WETS, JOHAN (ed.), Cul-tural diversity in trade unions: a challenge to class identity?, Routledge, p. 227-238.
BAXTER, JANEEN and OLIN WRIGHT, ERIK, 2000, “The Glass Ceiling Hypothesis: A Compara-tive Study of the United States, Sweden, and Australia”, Gender & Society, 14(2):275–94. doi: 10.1177/2F089124300014002004
BEAUCHEMIN, CRIS, HAMEL, CHRISTELLE et SI-MON, PATRICK (eds), 2016, Trajectoires et Origines. Enquête sur la Diversité des populations en France, Paris: Ined. En ligne
BEAUCHEMIN, CRIS and SAFI MIRNA, 2020, “Mi-grants’ Connections within and beyond Borders: Insights from the Comparison of Three Catego-ries of Migrants in France”, Ethnic and Racial Studies, 43(2):1–20. doi: 10.1080/01419870.2019.1572906
BERENI, LAURE, 2009, “ ‘Faire de la diversité une rich-esse pour l’Entreprise.’ La transformation d’une contrainte juridique en catégorie managériale”, Raisons Politiques, 35(3):87–105.
doi: 10.3917/rai.035.0087BOLTANSKI, LUC, 1982, Les Cadres: La Formation d’un
Groupe Social, Paris: Éditions de minuit.BONACICH, EDNA, 1972, “A Theory of Ethnic Antag-
onism: The Split Labor Market”, American Socio-logical Review, 37(5):547–59. doi: 10.2307/2093450
BROWNE, IRENE, and Joya Misra, 2003, “The Inter-section of Gender and Race in the Labor Mar-ket”, Annual Review of Sociology, 29:487–513. doi: 10.1146/annurev.soc.29.010202.100016
BRUBAKER, ROGERS, 2015, Grounds for Difference, Cambridge, MA: Harvard University Press.
BRUNO, ANNE-SOPHIE, 2011, “Solidarité avec les tra-vailleurs immigrés ?”, Plein droit, 90(3):36–40. doi: 10.3917/pld.090.0036
CASTILLA, EMILIO J., 2008, “Gender, Race, and Meritoc-racy in Organizational Careers”, American Journal of Sociology, 113(6):1479–1526. doi: 10.1086/588738
CHAMKHI, AMINE et TOUTLEMONDE, FABIEN, 2015, « Ségrégation professionnelle et écarts de salaires femmes-hommes », Dares Analyses, n° 82. En ligne
19The Intersection of Organizational Inequalities
CHARNOZ, PAULINE, COUDIN, ELISE and GAINI, MATHILDE, 2011, Changes in the French Wage Distribution 1976-2004: Inequalities within and between Education and Experience Groups, Working paper n° 2011-23, Center for Research in Economics and Statistics.
CHO, SUMI, WILLIAMS CRENSHAW, KIMBERLÉ and MCCALL, LESLIE, 2013, “Toward a Field of In-tersectionality Studies: Theory, Applications, and Praxis”, Signs: Journal of Women in Culture and Soci-ety, 38(4):785–810. doi: 10.1086/669608
COTTER, DAVID A., HERMSEN JOAN M. and VANNEMAN, REEVE, 1999, “Systems of Gen-der, Race, and Class Inequality: Multilevel Analy-ses”, Social Forces, 78(2):433–60.
doi: 10.2307/3005563COUDIN, ELISE, MAILLARD SOPHIE and TÔ, MAX-
IME, 2018, “Family, Firms and the Gender Wage Gap in France”, Institut national de la statistique et des études économiques: Série des documents de travail de la DSDS, n° F1805. En ligne
DITOMASO, NANCY, 2013, The American Non-Dilem-ma: Racial Inequality without Racism, Russell Sage Foundation.
DOERINGER, P. and PIORE, M. J., 1971, Internal Labor Markets and Manpower Analysis, Lexington: D. C. Heath and Company.
DOYTCHEVA, MILENA, 2010, “Usages Français de la Notion de Diversité : Permanence et Actualité d’un Débat”, Sociologie, 1(4):423–438.
doi: 10.3917/socio.004.0423DOYTCHEVA, MILENA, and ALAOUI HACHIMI,
MYRIAM, 2010, « Promouvoir la diversité en en-treprise : genèse et ambiguïtés d’une initiative pa-tronale », Asylon(s) (8). Preprint (Hal)
EAGLY, ALICE H. and KARAU, STEVEN J., 2002, “Role Congruity Theory of Prejudice toward Female Leaders”, Psychological Review, 109(3):573. En ligne
EDO, ANTHONY and TOUBAL, FARID, 2017, “Immi-gration and the Gender Wage Gap”, European Eco-nomic Review, 92:196–214.
doi 10.1016/j.euroecorev.2016.12.005
FOUGÈRE, DENIS et POUGET, JULIEN, 2003, “Les déterminants économiques de l’entrée dans la fonction publique”, Économie et Statistique, 369(1):15–48. En ligne
GALBRAITH, JAMES K., 2012, Inequality and Instability: A Study of the World Economy Just Before the Great Crisis, New York, N.Y: OUP USA.
GAURE, SIMEN, 2014, “Correlation Bias Correction in Two-way Fixed-effects Linear Regression”, Stat, 3(1):379–90. doi: 10.1002/sta4.68
GODECHOT, OLIVIER, 2017, Wages, Bonuses and Ap-propriation of Profit in the Financial Industry: The Working Rich, Abingdon, United Kingdom: Routledge.
GREENMAN, EMILY and XIE, YU, 2008, “Double Jeopardy? The Interaction of Gender and Race on Earnings in the United States”, Social Forces, 86(3):1217–1244. doi: 10.1353/sof.0.0008
HEDSTRÖM, PETER, 1991, “Organizational Differentia-tion and Earnings Dispersion”, American Journal of Sociology, 97(1):96–113. Jstor link
ICHOU, MATHIEU et GOUJON, ANNE, 2017, « Le niveau d’instruction des immigrés : varié et sou-vent plus élevé que dans les pays d’origine », Popu-lation et sociétés, (2):1–3. En ligne
KALEV, ALEXANDRA, 2009, “Cracking the Glass Cag-es? Restructuring and Ascriptive Inequality at Work”, American Journal of Sociology, 114(6):1591–1643. doi: 10.1086/597175.
LE BARBANCHON, THOMAS, RATHELOT, RO-LAND and ROULET, ALEXANDRA, “Gender Differences in Job Search: Trading off Commute against Wage”, The Quarterly Journal of Economics, 136(1):381-426. doi: 10.1093/qje/qjaa033
MANDEL, HADAS and SEMYONOV, MOSHE, 2016, “Going Back in Time? Gender Differences in Trends and Sources of the Racial Pay Gap, 1970 to 2010”, American Sociological Review, 81(5):1039–68. doi: 10.1177/2F0003122416662958
MCCALL, LESLIE, 2001, Complex Inequality: Gender, Class and Race in the New Economy, New York: Routledge.
20 OSC Papers n° 2021-1
MCCALL, LESLIE, 2005, “The Complexity of Intersec-tionality”, Signs: Journal of Women in Culture and So-ciety, 30(3):1771–1800. doi: 10.1086/426800
MELZER, SILVIA MAJA, TOMASKOVIC-DEVEY, DONALD, SCHUNCK, REINHARD and JAC-OBEBBINGHAUS, PETER, 2018, “A Relational Inequality Approach to First- and Second-Gener-ation Immigrant Earnings in German Workplac-es”, Social Forces, 97(1):91–128.
doi: 10.1093/sf/soy021MEURS, DOMINIQUE and PORA, PIERRE, 2019,
“Gender Equality on the Labour Market in France: A Slow Convergence Hampered by Moth-erhood”, Économie et Statistique, 510(1):109–30. doi: 10.24187/ecostat.2019.510t.1990
MILGROM, PAUL and ROBERTS, JOHN, 1988, “An Economic Approach to Influence Activities in Organizations”, American Journal of Sociology, 94:S154–79. Jstor link
NIEDERLE, MURIEL and VESTERLUND, LISE, 2007, “Do Women Shy Away from Competition? Do Men Compete Too Much?”, The Quarterly Journal of Economics, 122(3):1067–1101.
doi: 10.1162/qjec.122.3.1067NOIRIEL, GÉRARD, 1988, Le Creuset Français, Histoire
de l’immigration (19ème, 20ème Siècle), Paris: Seuil.
OECD, 2008, Jobs for Immigrants (Vol. 2): Labour Market Integration in Belgium, France, the Netherlands and Portugal, Paris: OECD Press.
QUILLIAN, LINCOLN, HEATH, ANTHONY, PAG-ER,DEVAH, MIDTBØEN, ARNFINN H., FLEISCHMANN, FENELLA and HEXEL, OLE, 2019, “Do Some Countries Discriminate More than Others? Evidence from 97 Field Ex-periments of Racial Discrimination in Hiring”, Sociological Science, 6:467–96. doi: 10.15195/v6.a18
RESTIFO, SALVATORE J. AND MYKYTA, LARYSSA, 2019, “At a Crossroads: Economic Hierarchy and Hardship at the Intersection of Race, Sex, and Nativity”, Social Currents, 6(6):507–33.
doi: 10.1177/2F2329496519861990
RIDGEWAY, CECILIA L., 2011, Framed by Gender: How Gender Inequality Persists in the Modern World, New York: Oxford University Press.
ROSCIGNO, VINCENT J., HODSON, RANDY and LO-PEZ, STEVEN H., 2009, “Workplace Incivilities: The Role of Interest Conflicts, Social Closure and Organizational Chaos”, Work, Employment and So-ciety, 23(4):747–73.
doi: 10.1177/2F0950017009344875ROTH, LOUISE MARIE, 2006, Selling Women Short:
Gender and Money on Wall Street, Princeton Uni-versity Press.
SAFI, MIRNA, 2017, “Promoting Diversity in French Workplaces: Targeting and Signaling Ethnora-cial Origin in a Colorblind Context”, Socius, 3:2378023117728834.
doi: 10.1177/2378023117728834SAFI, MIRNA, 2020, Migration and Inequality, Cambridge,
UK: Polity. SAFI, MIRNA and SIMON PATRICK, 2013, “Les dis-
criminations ethniques et raciales dans l’enquête Trajectoires et Origines : représentations, expéri-ences subjectives et situations vécues”, Économie et Statistique, n° 464-465-466:245–75. En ligne
SASSEN, SASKIA, 2001, The Global City – New York, London, Tokyo, Princeton, N.J: Princeton Univer-sity Press.
SIMON, PATRICK, 2008, “The Choice of Ignorance: The Debate on Ethnic and Racial Statistics in France”, French Politics, Culture & Society, 26(1):7–31.
doi: 10.1007/978-3-319-20095-8_4STAINBACK, KEVIN, RATLIFF, THOMAS N. and RO-
SCIGNO, VINCENT J., 2011, “The Context of Workplace Sex Discrimination: Sex Composition, Workplace Culture and Relative Power”, Social Forces, 89(4):1165–88. Jstor link
STAINBACK, KEVIN, TOMASKOVIC-DEVEY, DON-ALD and SKAGGS, SHERYL, 2010, “Organiza-tional Approaches to Inequality: Inertia, Relative Power, and Environments”, Annual Review of So-ciology, 36:225–47.
doi: 10.1146/annurev-soc-070308-120014
21The Intersection of Organizational Inequalities
TILLY, CHARLES, 1998, Durable Inequality, Berkeley: University of California Press.
TOMASKOVIC-DEVEY, DONALD and AVENT-HOLT, DUSTIN, 2019, Relational Inequalities: An Organizational Approach, Oxford University Press.
TOMASKOVIC-DEVEY, DONALD, HÄLLSTEN, MARTIN and AVENT-HOLT, DUSTIN, 2015, “Where Do Immigrants Fare Worse? Modeling Workplace Wage Gap Variation with Longitudinal Employer-Employee Data”, American Journal of Sociology, 120(4):1095–1143. doi: 10.1086/679191
TOMASKOVIC-DEVEY, DONALD, RAINEY AN-THONY, AVENT-HOLT, DUSTIN, BANDELJ, NINA, BOZA, ISTVÁN, CORT, DAVID, GO-DECHOT, OLIVIER, HAJDU, GERGELY, HÄLLSTEN, MARTIN and HENRIKSEN, LASSE FOLKE, 2020, “Rising Between-Work-place Inequalities in High-Income Countries”, Proceedings of the National Academy of Sciences, 117(17):9277–83. doi: 10.1073/pnas.1918249117
TOMASKOVIC-DEVEY, DONALD, LLSTEN, MAR-TIN and AVENT-HOLT, DUSTIN, 2015, “Where Do Immigrants Fare Worse? Modeling Workplace Wage Gap Variation with Longitudinal Employer-Employee Data”, American Journal of Sociology, 120(4):1095–1143. doi: 10.1086/679191
TREIMAN, DONALD J., 2013, Occupational Prestige in Comparative Perspective, Elsevier.
WEEDEN, KIM A., 2002, “Why Do Some Occupations Pay More than Others? Social Closure and Earnings Inequality in the United States”, American Journal of Sociology, 108(1):55–101. doi: 10.1086/344121
WEEDEN, KIM A. and GRUSKY, DAVID B., 2012, “The Three Worlds of Inequality”, American Journal of Sociology, 117(6):1723–85. doi: 10.1086/665035
WILLIAMS, KATHERINE Y. and O’REILLY, III, CHARLES A., 1998, “Demography and Diver-sity in Organizations: A Review of 40 Years Re-search”, Research in Organizational Behavior, 20:77–140. Online
WOODHAMS, CAROL, LUPTON, BEN and COWL-ING, MARC, 2015, “The Snowballing Penalty Effect: Multiple Disadvantage and Pay”, British Journal of Management, 26(1):63–77.
doi: 10.1111/1467-8551.12032WRIGHT, ERIK OLIN, 1997, Class Counts. Comparative
Studies in Class Analysis, Cambridge UK: Cam-bridge University Press.
WYLY, ELVIN K., 1998, “Containment and Mismatch: Gender Differences in Commuting in Metropol-itan Labor Markets”, Urban Geography, 19(5):395–430. doi: 10.2747/0272-3638.19.5.395
ZHOU, XIANG and WODTKE, GEOFFREY T., 2019, “Income Stratification among Occupational Class-es in the United States”, Social Forces, 97(3):945–72. doi: 10.1093/sf/soy074
22 OSC Papers n° 2021-1
Appendix
Initial prime age sample Final sample
Workers Work-places
Males Na-tives
Mana-gers
Log wages
Workers Work-places
Males Na-tives
Mana-gers
Log wages
1996 13,382,593 1,224,448 59% 89% 13% 11.62 (0.57)
3,487,721 7,990 52% 89% 21% 11.86 (0.53)
1997 13,767,723 1,292,112 58% 89% 13% 11.63 (0.57)
3,514,755 8,140 52% 89% 22% 11.88 (0.53)
1998 14,047,096 1,314,708 58% 89% 13% 11.64 (0.57)
3,566,281 8,344 51% 89% 23% 11.89 (0.54)
1999 14,443,934 1,344,340 58% 89% 14% 11.64 (0.57)
3,701,168 8,803 52% 89% 24% 11.9 (0.55)
2000 14,932,800 1,357,696 58% 89% 14% 9.77 (0.58)
3,836,142 9,239 52% 89% 24% 10.03 (0.55)
2001 15,161,580 1,366,335 58% 89% 15% 9.81 (0.57)
3,921,465 9,473 51% 89% 25% 10.06 (0.56)
2002 15,370,174 1,365,657 57% 89% 16% 9.87 (0.58)
4,044,900 9,792 51% 89% 26% 10.12 (0.56)
2003 15,261,320 1,372,886 57% 89% 16% 9.91 (0.57)
4,012,966 9,714 51% 89% 26% 10.14 (0.56)
2004 15,129,715 1,387,688 56% 89% 16% 9.94 (0.56)
3,898,127 9,581 50% 89% 27% 10.18 (0.55)
2005 15,251,007 1,398,425 56% 88% 16% 9.96 (0.56)
3,879,205 9,708 50% 89% 28% 10.21 (0.55)
2006 15,528,411 1,432,299 56% 88% 16% 9.99 (0.56)
3,930,459 9,856 50% 89% 28% 10.23 (0.56)
2007 15,826,029 1,445,613 56% 88% 17% 10.01 (0.56)
3,991,144 9,931 50% 89% 29% 10.25 (0.56)
2008 15,973,637 1,458,731 56% 88% 17% 10.04 (0.56)
4,069,632 10,082 50% 89% 29% 10.27 (0.57)
2009 15,676,126 1,471,207 55% 88% 17% 10.06 (0.55)
3,899,949 9,745 49% 89% 29% 10.29 (0.56)
2010 15,816,056 1,463,731 55% 88% 18% 10.07 (0.56)
3,957,600 9,894 49% 89% 30% 10.3 (0.57)
2011 14,945,106 1,366,884 55% 88% 18% 10.11 (0.56)
3,660,577 9,124 49% 89% 30% 10.34 (0.57)
2012 15,376,397 1,426,690 55% 88% 18% 10.12 (0.56)
3,807,577 9,738 49% 88% 31% 10.35 (0.57)
2013 15,364,034 1,424,821 54% 88% 18% 10.13 (0.56)
3,817,059 9,751 49% 88% 31% 10.37 (0.57)
2014 15,666,632 1,457,806 54% 88% 18% 10.14 (0.56)
3,798,938 9,905 48% 88% 32% 10.37 (0.58)
2015 15,774,948 1,457,228 54% 88% 19% 10.15 (0.56)
3,916,407 10,094 48% 88% 32% 10.38 (0.58)
2016 16,318,580 1,500,671 54% 87% 20% 10.15 (0.57)
4,018,818 10,188 48% 88% 33% 10.38 (0.58)
Table A1. Description of the sample

23The Intersection of Organizational Inequalities
Appendix A2. Biases in the covariance of the parameters of J regressions
In a first step we estimate a workplace fixed effect regression on yearly log-earnings (1)
In a second step, we estimate J regressions in each workplaces j on the residual log earnings wij coming from equation (1)
with wij : residual log wage ; genderij : male dummy; nativeij : native dummy; classij : upper class dummy; eij : error; i : individual i ; j : workplace j .
Covariance bias
We then estimate: with k≠l and (k,l) ⊂ (gender, nativity, class)
As wij is a residual wage already conditional on k and l, we can simplify and consider that the average wage gaps are null (bk≃0 and b1≃0)
On finite samples bkj and blj are biased estimators of the true class and gender gaps: βkj and βlj.We can thus rewrite:
Let us examine the expectation of the element Sj for workplace j of this covariance: E[Sj ]=E[(bkj -βkj )(blj -βlj )+(blj -βlj )βkj+(bkj-βkj )βlj ] =E[(bkj -βkj )(blj -βlj )]+E[(blj -βlj )βkj ]+E[(bkj -βkj )βlj ]
In the classical OLS regression, the vector of errors in parameter estimations follows the following law: with σj
2 the variance of the residual ej . σj
2(Xj’Xj)−1 is the variance-covariance matrix of parameters estimated in the wage regression for workplace j.
As βkj is a constant,
and similarly
for each j
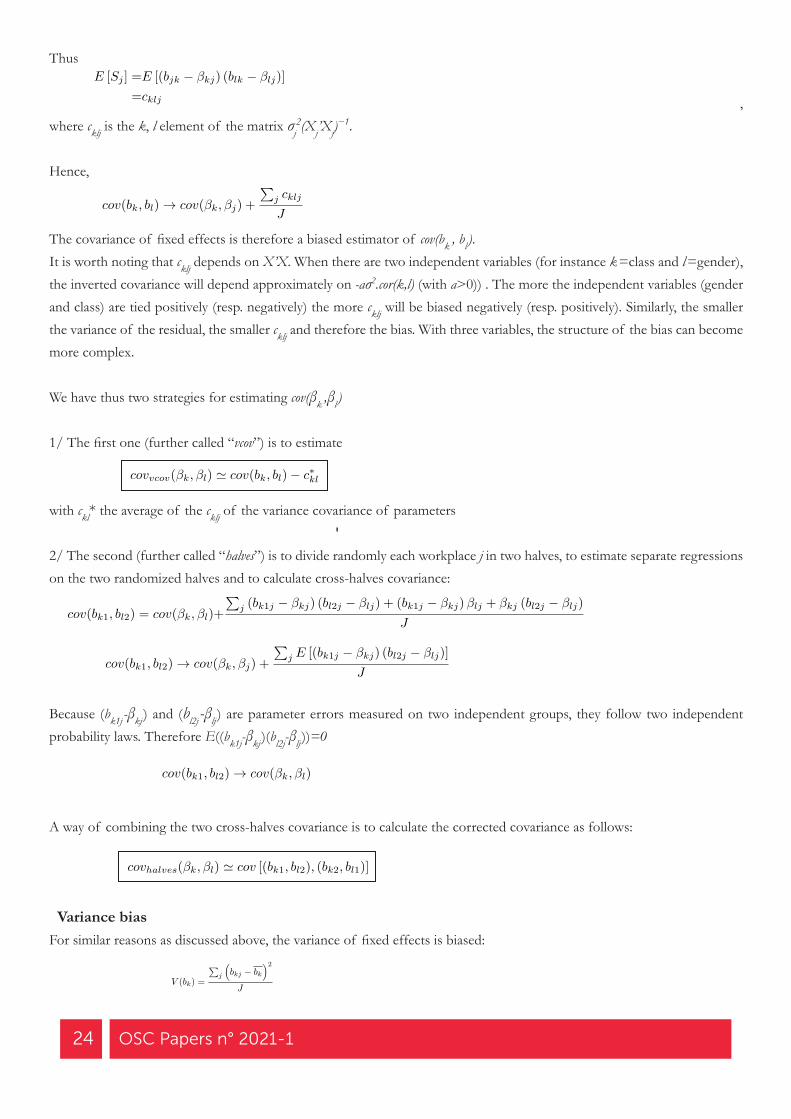
24 OSC Papers n° 2021-1
Thus , where cklj is the k, l element of the matrix σj
2(Xj’Xj)−1.
Hence,
The covariance of fixed effects is therefore a biased estimator of cov(bk , bl ). It is worth noting that cklj depends on X’X. When there are two independent variables (for instance k =class and l =gender), the inverted covariance will depend approximately on -aσ2.cor(k,l) (with a>0)) . The more the independent variables (gender and class) are tied positively (resp. negatively) the more cklj will be biased negatively (resp. positively). Similarly, the smaller the variance of the residual, the smaller cklj and therefore the bias. With three variables, the structure of the bias can become more complex.
We have thus two strategies for estimating cov(βk ,βl )
1/ The first one (further called “vcov”) is to estimate
with ckl* the average of the cklj of the variance covariance of parameters
2/ The second (further called “halves”) is to divide randomly each workplace j in two halves, to estimate separate regressions on the two randomized halves and to calculate cross-halves covariance:
Because (bk1j -βkj ) and (bl2j -βlj ) are parameter errors measured on two independent groups, they follow two independent probability laws. Therefore E((bk1j-βkj )(bl2j-βlj ))=0
A way of combining the two cross-halves covariance is to calculate the corrected covariance as follows:
Variance bias For similar reasons as discussed above, the variance of fixed effects is biased:
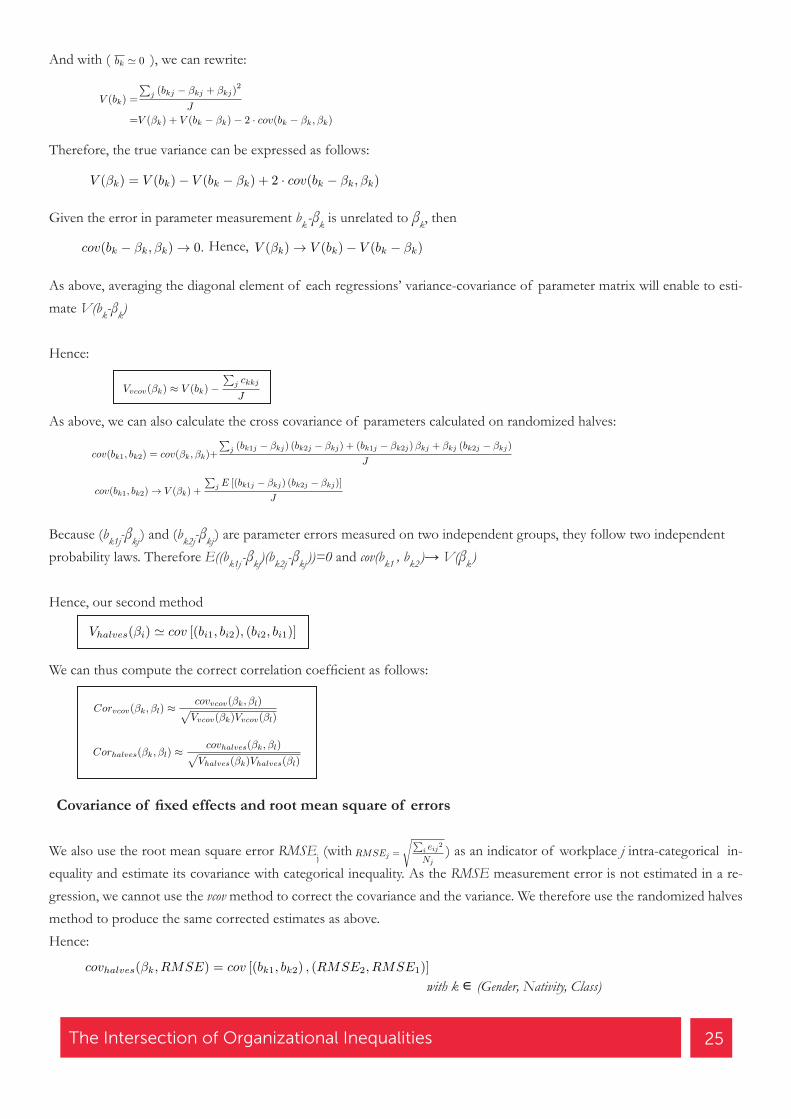
25The Intersection of Organizational Inequalities
And with ( ), we can rewrite:
Therefore, the true variance can be expressed as follows:
Given the error in parameter measurement bk -βk is unrelated to βk, then
As above, averaging the diagonal element of each regressions’ variance-covariance of parameter matrix will enable to esti-mate V(bk-βk)
Hence:
As above, we can also calculate the cross covariance of parameters calculated on randomized halves:
Because (bk1j-βkj ) and (bk2j-βkj ) are parameter errors measured on two independent groups, they follow two independent probability laws. Therefore E((bk1j -βkj)(bk2j -βkj ))=0 and cov(bk1 , bk2 )→ V(βk )
Hence, our second method
We can thus compute the correct correlation coefficient as follows:
Covariance of fixed effects and root mean square of errors
We also use the root mean square error RMSEj (with hhhhhhhhhhhh) as an indicator of workplace j intra-categorical in-equality and estimate its covariance with categorical inequality. As the RMSE measurement error is not estimated in a re-gression, we cannot use the vcov method to correct the covariance and the variance. We therefore use the randomized halves method to produce the same corrected estimates as above.Hence: with k ∊ (Gender, Nativity, Class)
Hence,
26 OSC Papers n° 2021-1
Simulation
To further explore the bias and the quality of our corrections, we rely on simulations. In our baseline simulation, we simu-late 20 random datasets consisting of 100,000 workers in 2,000 workplaces (50 workers per workplace on average) where each workplace j has its own kj (for instance: gender) and lj (for instance: class) fixed effects. We set the covariance and the correlation between βk and βl to -0.4 and the underlying correlation of k and l to 0.1. Our average true correlation between βk and RMSE is 0.56. In the following columns, we differ from the baseline simulation by one parameter. In column 2, we double the sample size. In column 3, we double the average number of workers per unit. In column 4 and 5, we change the correlation between βk and βl to a stronger absolute value (-0.7) and a null one. In column 6 and 7, we change the correlation of k and l to a weaker one (0.05) and a null one. In column 8, we decrease the correlation between RMSE and βk.
Simulations show the following results:
• The variance and the covariance of fixed effects are substantially biased.• The bias in the variance and the covariance of fixed effects is weaker when the unit size is large (column 3). • The bias in the covariance decreases when the absolute value of the correlation between k and l decreases (column 6).
When uncorrelated, the bias is close to 0 (column 7).• The two methods of correction enable us to correctly estimate the variance, the covariance and the correlation coeffi-
cient. They yield very similar results. • The vcov correction method is relatively more powerful than the randomized halves one (as shown by the smaller stan-
dard deviations) which justifies using the former when available.• The bigger the sample, the better the corrected variances, correlations and covariances (column 2)• The variance of RMSE and its covariance with βk does not seem substantially biased. Their correlation coefficient howe-
ver is biased mainly due to the bias in the variance of fixed effects.
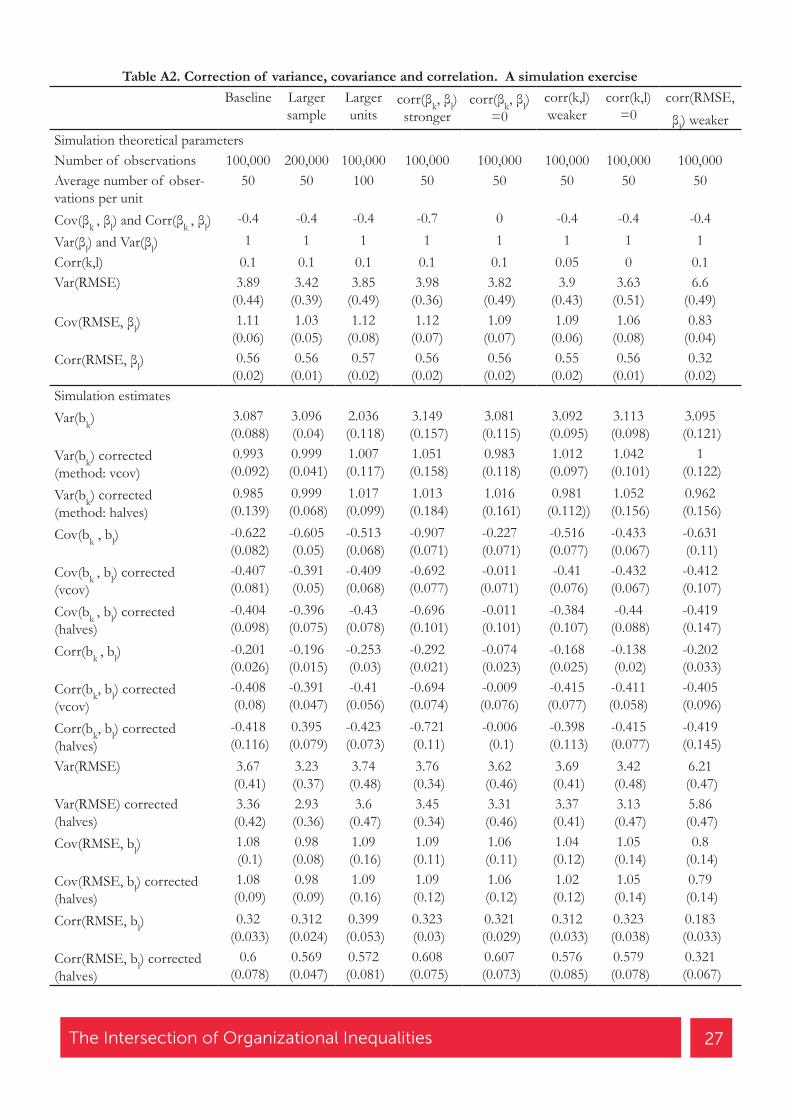
27The Intersection of Organizational Inequalities
Table A2. Correction of variance, covariance and correlation. A simulation exerciseBaseline Larger
sampleLarger units
corr(βk, βl) stronger
corr(βk, βl) =0
corr(k,l) weaker
corr(k,l) =0
corr(RMSE, βl) weaker
Simulation theoretical parametersNumber of observations 100,000 200,000 100,000 100,000 100,000 100,000 100,000 100,000Average number of obser-vations per unit
50 50 100 50 50 50 50 50
Cov(βk , βl) and Corr(βk , βl) -0.4 -0.4 -0.4 -0.7 0 -0.4 -0.4 -0.4
Var(βl) and Var(βl) 1 1 1 1 1 1 1 1Corr(k,l) 0.1 0.1 0.1 0.1 0.1 0.05 0 0.1Var(RMSE) 3.89
(0.44)3.42
(0.39)3.85
(0.49)3.98
(0.36)3.82
(0.49)3.9
(0.43)3.63
(0.51)6.6
(0.49)Cov(RMSE, βl) 1.11
(0.06)1.03
(0.05)1.12
(0.08)1.12
(0.07)1.09
(0.07)1.09
(0.06)1.06
(0.08)0.83
(0.04)Corr(RMSE, βl) 0.56
(0.02)0.56
(0.01)0.57
(0.02)0.56
(0.02)0.56
(0.02)0.55
(0.02)0.56
(0.01)0.32
(0.02)Simulation estimatesVar(bk) 3.087
(0.088)3.096 (0.04)
2.036 (0.118)
3.149 (0.157)
3.081 (0.115)
3.092 (0.095)
3.113 (0.098)
3.095 (0.121)
Var(bk) corrected (method: vcov)
0.993 (0.092)
0.999 (0.041)
1.007 (0.117)
1.051 (0.158)
0.983 (0.118)
1.012 (0.097)
1.042 (0.101)
1 (0.122)
Var(bk) corrected (method: halves)
0.985 (0.139)
0.999 (0.068)
1.017 (0.099)
1.013 (0.184)
1.016 (0.161)
0.981 (0.112))
1.052 (0.156)
0.962 (0.156)
Cov(bk , bl) -0.622 (0.082)
-0.605 (0.05)
-0.513 (0.068)
-0.907 (0.071)
-0.227 (0.071)
-0.516 (0.077)
-0.433 (0.067)
-0.631 (0.11)
Cov(bk , bl) corrected (vcov)
-0.407 (0.081)
-0.391 (0.05)
-0.409 (0.068)
-0.692 (0.077)
-0.011 (0.071)
-0.41 (0.076)
-0.432 (0.067)
-0.412 (0.107)
Cov(bk , bl) corrected (halves)
-0.404 (0.098)
-0.396 (0.075)
-0.43 (0.078)
-0.696 (0.101)
-0.011 (0.101)
-0.384 (0.107)
-0.44 (0.088)
-0.419 (0.147)
Corr(bk , bl) -0.201 (0.026)
-0.196 (0.015)
-0.253 (0.03)
-0.292 (0.021)
-0.074 (0.023)
-0.168 (0.025)
-0.138 (0.02)
-0.202 (0.033)
Corr(bk, bl) corrected (vcov)
-0.408 (0.08)
-0.391 (0.047)
-0.41 (0.056)
-0.694 (0.074)
-0.009 (0.076)
-0.415 (0.077)
-0.411 (0.058)
-0.405 (0.096)
Corr(bk, bl) corrected (halves)
-0.418 (0.116)
0.395 (0.079)
-0.423 (0.073)
-0.721 (0.11)
-0.006 (0.1)
-0.398 (0.113)
-0.415 (0.077)
-0.419 (0.145)
Var(RMSE) 3.67 (0.41)
3.23 (0.37)
3.74 (0.48)
3.76 (0.34)
3.62 (0.46)
3.69 (0.41)
3.42 (0.48)
6.21 (0.47)
Var(RMSE) corrected (halves)
3.36 (0.42)
2.93 (0.36)
3.6 (0.47)
3.45 (0.34)
3.31 (0.46)
3.37 (0.41)
3.13 (0.47)
5.86 (0.47)
Cov(RMSE, bl) 1.08 (0.1)
0.98 (0.08)
1.09 (0.16)
1.09 (0.11)
1.06 (0.11)
1.04 (0.12)
1.05 (0.14)
0.8 (0.14)
Cov(RMSE, bl) corrected (halves)
1.08 (0.09)
0.98 (0.09)
1.09 (0.16)
1.09 (0.12)
1.06 (0.12)
1.02 (0.12)
1.05 (0.14)
0.79 (0.14)
Corr(RMSE, bl) 0.32 (0.033)
0.312 (0.024)
0.399 (0.053)
0.323 (0.03)
0.321 (0.029)
0.312 (0.033)
0.323 (0.038)
0.183 (0.033)
Corr(RMSE, bl) corrected (halves)
0.6 (0.078)
0.569 (0.047)
0.572 (0.081)
0.608 (0.075)
0.607 (0.073)
0.576 (0.085)
0.579 (0.078)
0.321 (0.067)
Observatoire Sociologique du Changement 27 rue Saint-Guillaume 75337 Paris cedex 07 01 45 49 54 50
http://www.sciencespo.fr/osc/fr/
Responsable de la publication : Mirna Safi
Responsable éditoriale :Agnès van Zanten
OSC 2021
Keywords Social unequality, intersectionality, worplaces, France, class, gender, migration
Version électronique, en ligne / On-line version http://www.sciencespo.fr/osc/fr/content/osc-papers Également disponible sur SPIRE, l’archive ouverte de Sciences Po. https://spire.sciencespo.fr/web/
Pour citer cet articleOlivier Godechot, Mirna Safi, Matthew Soener, ‘‘The Intersection of Organizational Inequalities: How Gender, Migrant Status, and Class Inequality Relate to Each Other in French workplaces’’, OSC Papers, n° 2021-1, May 2021.DOI: 10.5281/zenodo.4740556
Edition de ce numéro / Editorial board Bernard Corminboeuf (Communication Officer, Sciences Po-CNRS)
[email protected] Savina (Data Analyst, Statistics, Sciences Po-CNRS) [email protected]
Cover image: Aliona hradovskaya, via Shutterstock
Abstract
In this article, we combine intersectional and organization theoretical insights and ask how different types of inequality are related within French workplaces. Our motivation is to clarify the meaning of workplaces as “inequality regimes” by asking if workplaces reinforce multiple inequalities or if there are tradeoffs between them. Using French administrative data and novel techniques, we scrutinize correlations between class, gender and nativity wage gaps at the workplace level. We also study how each of these gaps relate to a fourth measure of wage inequality we call intra-categorical inequality (i.e within the three-level cross-categorization class×gender×nativity). We discuss two sets of findings. First gender and nativity wage gaps are negatively correlated within workplaces. Second, while the gender gap is higher in more unequal workplaces, the nativity gap is higher in more equal workplaces. Finally, we also ask how industry, urban environment, and various workplace characteristics affect these patterns. Our fin-dings suggest that workplaces are not just sites of producing multidimensional inequality, but sites which specialize in inequality types.