the internationalization process of firms: from … seminar_mz... · the internationalization...
TRANSCRIPT

The Internationalization Process of Firms:from Exports to FDI∗
Paola ConconiUniversite Libre de Bruxelles (ECARES) and CEPR
Andre SapirUniversite Libre de Bruxelles (ECARES) and CEPR
Maurizio ZanardiLancaster University Management School
This version: July 2014
Abstract
We examine firms’ choice between serving a foreign market through exports orforeign direct investment (FDI). We begin by unveiling a new empirical regularity,using a unique dataset of firms’ export and FDI choices in individual destinationmarkets: almost all firms serve a foreign market via exports before establishingaffiliates in that market. To rationalize these patterns, we develop a simple modelof internationalization choices under uncertainty, in which firms may test a foreignmarket via exports before engaging in FDI. Consistent with the model’s predic-tions, we find that most firms start serving a foreign market through exports; inthe first few years following export entry, many firms drop out of the foreign mar-ket, others survive and expand as exporters, some establish foreign affiliates. Weshow that the probability of FDI entry increases with a firm’s export experiencein that market; this effect decreases over time and increases with foreign marketuncertainty. Our analysis suggests that exports and FDI, although substitutesfrom a static perspective, may be complements over time, since the knowledgeacquired through export experimentation can lead firms to start investing abroad.
JEL classifications: D21, F10, F13.
Keywords: Exports, FDI, Uncertainty, Experimentation.
∗We are grateful to Holger Breinlich, Juan Carluccio, Emmanuel Dhyne, Jonathan Eaton, Pe-ter Egger, Stefania Garetto, Garth Frazer, Catherine Fuss, John Haltiwanger, Beata Javorcik, JimMarkusen, Marc Melitz, Harald Fadinger, Manuel Garcia-Santana, Eduardo Morales, Lindsay Olden-ski, Emanuel Ornelas, Michael Ryan, Francesca Sanna-Randaccio, Steve Redding, Veronica Rappoport,Ruben Segura-Cayuela, Steve Yeaple, Shang-Jin Wei and numerous seminar and conference participantsfor their valuable suggestions and comments. We also wish to thank Philippe De Coninck, ChristophePiette, and especially Marc Mollet for their help and support with data processing, and Elena Matteviand Li Chen for excellent research assistance. Funding from the National Bank of Belgium and the FNRSis gratefully acknowledged. Address for correspondence: Paola Conconi, ECARES, Universite Libre deBruxelles, CP 114, Avenue F. D. Roosevelt 50, 1050 Brussels, Belgium. E-mail: [email protected].

1 Introduction
In recent decades, more and more companies have started to operate outside their do-
mestic markets, selling their goods to foreign customers through exports or foreign direct
investment (FDI). When deciding whether and how to serve foreign markets, firms face
considerable uncertainty: they are often unaware of local regulation and legal require-
ments; they may also be uncertain about the size of foreign demand and the adequacy of
their products to local tastes. In this paper, we examine how foreign market uncertainty
affects firms’ export and FDI choices.1
A vast literature in international business based on case studies has long emphasized
that uncertainty about the “characteristics of the specific national market – its busi-
ness climate, cultural patterns, structure of the market system, and, most importantly
characteristics of the individual customer” can lead firms to follow a gradual interna-
tionalization process, serving a foreign market via exports before deciding whether to
invest there (Johanson and Vahlne, 1977).
The first contribution of this paper is to unveil a new empirical regularity, which
confirms the findings of case studies in the international business literature. Using a
unique dataset covering all companies registered in Belgium, we find that a firm’s FDI
entry in a foreign market is almost always preceded by exports: 86.32% of the firms that
start investing in a new market have already been serving it via exports. The reverse is
not true: 99.99% of firms that start exporting to a foreign market do so without having
previously invested there. These findings are consistent with the idea that firms follow
a gradual internationalization process: they start serving a foreign market via exports
to acquire information about local demand and supply conditions; if they discover that
they can earn large enough profits, they then engage in FDI to save on future trade
costs.
Standard static models of firms’ internationalization choices cannot explain why FDI
entry is almost always preceded by export entry. In these models, a firm will either serve
a foreign market through export or FDI, a choice that is driven by a tradeoff between
proximity and concentration (e.g. Markusen, 1984; Brainard, 1997; Helpman et al.,
1We focus on horizontal FDI, the establishment of foreign production facilities with the purpose ofserving the local market. In their review of the empirical literature on FDI, Markusen and Maskus(2003) and Blonigen (2005) conclude that most FDI is horizontal in nature. Indeed, foreign affiliatesworldwide sell most of their products locally. For example, over the period 2005-2010, less than 19percent of affiliate sales were sold outside of the country of production (UNCTAD, 2011). Our analysiscan also be applied to investments in distribution to penetrate export markets. We abstract instead fromvertical FDI, which involves the fragmentation of the production process across different countries and,unlike horizontal and distribution-oriented FDI, is not meant to serve customers in the host country.
1

2004): a firm serving a market with exports bears trade costs, but saves the cost of
establishing a foreign subsidiary; on the other hand, a firm serving a market with FDI
bears the cost of setting up the subsidiary, but saves on trade costs.
To explain switches from one mode to the other, we describe a simple dynamic model
of export and FDI choices, which formalizes the idea of a gradual internationalization
process. In the spirit of Jovanovic (1982), firms are uncertain about their ability to earn
profits in a foreign market and can only discover it by operating there. In this setting, a
firm may initially serve a market via exports, before establishing foreign affiliates. The
intuition for this result is simple: in the face of uncertainty, exporting is more efficient
way to test a foreign market. Internationalization involves trials and errors: a firm will
first test a foreign market via exports; after an initial trial period, it will stop exporting
to that market, if it discovers that it cannot make enough profits to cover the trade
costs; for intermediate levels of realized profitability, it will continue serving the foreign
market via exports; for higher levels of profitability, it may find it worthwhile to pay the
fixed cost of setting up a foreign subsidiary to reduce its variable costs.
To assess the validity of the model’s predictions, we focus on all Belgian firms that
started exporting to new markets during the 1998-2008 period. In our benchmark anal-
ysis, we consider only destinations outside the European Single Market (ESM), which
comprises the members of the European Union (EU) plus Iceland, Liechtenstein, Nor-
way and Switzerland. There are two reasons for this choice. First, data for exports to
countries outside the ESM come from customs declarations and cover virtually all trans-
actions. We can thus precisely identify all Belgian new exporters. This is not the case
for intra-ESM trade. Second, our theoretical model best applies to destinations outside
the ESM. Within the Single Market, trade barriers have long been removed and trans-
port costs are very low, so Belgian firms are less likely to face a proximity-concentration
tradeoff and uncertain market conditions.2
In our theoretical model, new exporters will exit a foreign market, if they discover
that their profitability there is too low to justify the trade costs. In line with this pre-
diction, we find that over 50% of new exporters drop out of foreign markets in the first
year after entry, after which the survival probability increases steadily (the exit rate
is around 15% after five years). Our model also suggests that, when firms are uncer-
tain about their profitability in foreign markets, they should start by exporting small
amounts; conditional on surviving as exporters, their exports should expand. Consis-
tent with this prediction, we find that new exporters start by exporting small amounts
2In robustness checks, we verify that our results continue to hold if we include in our sample desti-nations within the European Single Market.
2

and that exports of surviving new exporters increase significantly in the following years.
These findings are in line with recent studies on export dynamics (e.g. Eaton et al., 2008;
Iacovone and Javorcik (2010); Albornoz et al., 2012) and suggest that firms engage in a
process of trials and errors in foreign markets.
The main novelty of our empirical analysis is to show that export experimentation
can lead firms to start investing in foreign markets: new exporters may become new
FDIers. The panel structure of our data allows us to trace export and FDI entries of
each Belgian firm in foreign markets. Using proportional hazard models, we examine the
probability that new exporters start investing in foreign markets.3 We find that a firm’s
export experience in a market has a positive but decaying effect on its probability of FDI
entry in that market: a firm is more likely to start investing in a foreign market in the
first few years following export entry, after which export experience has no impact on the
probability of FDI entry. We also show that the impact of export experience depends on
the extent of foreign market uncertainty: in destinations where market conditions are
more uncertain, export experience has a bigger impact on firms’ decision to establish
foreign affiliates. These results are consistent with the hypothesis that, when faced with
foreign market uncertainty, firms experiment via exports before deciding whether to
engage in FDI.
Our results show that firms’ export and FDI decisions must be understood as part
of a broader dynamic strategy to serve foreign markets in the face of uncertainty. They
suggest that, even when exports and FDI represent alternative ways of serving a foreign
market – and are thus substitutes from a static perspective – they may be complements
over time – since the knowledge acquired through export experience can eventually lead
firms to invest abroad.
In line with the literature on the proximity-concentration tradeoff, our theoretical
model focuses on a firm that must decide whether to serve a foreign market via exports
(the mode characterized by lower fixed cost) or horizontal FDI (characterized by lower
variable costs). However, it can be shown that the same logic applies to an exporting
firm that must decide how to distribute its goods in a foreign market (see Appendix A-1).
In this case, the choice is between using a local distributor (the mode that involves lower
fixed cost) and setting up its own distribution network (involving lower variable costs).
As in our benchmark model, uncertainty can lead to a gradual internationalization
process, in which a firm’s FDI entry is preceded by its export entry: during an initial
3Proportional hazard models are widely used class of duration models, which allow to study the timeit takes for an event to occur, avoiding (left and right) censoring problems. In empirical studies of realoption theories, these models are used to verify whether uncertainty delays investment decisions.
3

trial period, the firm distributes its exports via a local agent; if it discovers that it can
earn large profits in the foreign market, it then establishes its own distribution network.
Our analysis has implications for the effects of trade and FDI liberalization. Gov-
ernments often try to attract FDI to bring much-needed capital, new technologies, mar-
keting techniques, and management skills, while also making efforts to reduce trade
barriers. Contrary to the standard literature on the proximity-concentration tradeoff,
our paper suggests that these two policy objectives are not necessarily at odds with
each other: trade liberalization may actually foster FDI, by lowering the costs of export
experimentation. The converse is also true: FDI liberalization may lead to export entry,
by increasing the option value of export experimentation.
The remainder of the paper is organized as follows. Section 2 reviews the related
literature. Section 3 presents some stylized facts about the sequencing of firms’ export
and FDI entry in individual foreign markets. Section 4 outlines a simple model of firms’
internationalization choices under uncertainty. Section 5 examines the exit rates and the
evolution of exports of new exporters. In Section 6, we use proportional hazard models
to study FDI entry of new exporters. Section 7 concludes.
2 Related literature
Our paper builds on the vast literature on the proximity-concentration tradeoff, which
examines firms’ decision on whether to serve a foreign market, and whether to do so
through export or horizontal FDI. The key prediction of traditional models in this liter-
ature is that firms will invest abroad when the gains from avoiding trade costs outweigh
the costs of maintaining capacity in multiple markets (e.g. Markusen, 1984; Horstmann
and Markusen, 1992; Brainard, 1997; Markusen and Venables, 2000). Our paper shows
that, when firms are uncertain about their profitability in foreign markets, they may
start by testing these markets via exports – the mode characterized by lower fixed costs
– before switching to FDI.4
Helpman et al. (2004) introduce firm heterogeneity a la Melitz (2003) into a simple
model of the proximity-concentration tradeoff and show that the higher fixed cost of
FDI gives rise to selection effects: the most productive firms engage in FDI, less pro-
ductive ones export, and the least productive serve only their home market. Using data
on exports and FDI sales of US firms in 38 countries and 52 industries, they provide
4Horstmann and Markusen (1996) develop a theoretical model of multinationals’ decisions whenforeign market conditions are uncertain. Rather than on the choice between exports and FDI, theiranalysis focuses on the choice between serving a foreign market via FDI or through a contractualarrangement with a local agent who has superior information about the market characteristics.
4
cross-sectional evidence supporting this prediction. Helpman et al. (2004) emphasize
the importance of productivity differences in explaining static export and FDI choices of
different firms within sectors. Our paper focuses instead on the dynamic choices of in-
dividual firms, highlighting the importance of market uncertainty and experimentation.
Ramondo et al. (2014) introduce uncertainty (country-specific productivity shocks) in a
static model of the proximity-concentration tradeoff with heterogeneous firms. They do
not examine firms’ dynamics and experimentation, focusing instead on the relationship
between cross-country differences in output fluctuations and cross-country patterns of
exports and affiliate sales.5
Most closely related to ours is the paper by Rob and Vettas (2003), which examines
the impact of foreign market uncertainty on the dynamics of firms’ internationalization
choices. They describe an infinite horizon model, in which a multinational firm can serve
a foreign market via exports, horizontal FDI, or a combination of the two. The firm
faces demand uncertainty: in each period, foreign demand either continues to grow or
stops growing forever. Our simple two-period model allows us to capture in a stylized
way both demand and supply uncertainty. More importantly, while the analysis of Rob
and Vettas (2003) is only theoretical in nature, we empirically examine the dynamics of
firms’ export and FDI choices in individual foreign markets.
The idea that uncertainty affects investment decisions is central to real options theory,
which suggests that, if investments are irreversible and market conditions are uncertain,
firms may prefer to “wait and see”, minimizing current investments but securing an
option to invest at a later time (e.g. McDonald and Siegel, 1986; Dixit and Pindyck,1994,
Guiso and Parigi, 1999). Our paper shows that, when faced with the choice on how to
serve foreign markets, firms may first test a foreign market via exports before establishing
foreign affiliates.
The difficulty for firms to acquire information about foreign markets has long been
emphasized by the international business literature. Starting from Johanson and Vahlne
(1977), many studies have argued that market-specific knowledge can only be gained
by operating in individual foreign markets because it is often tacit in nature, highly
dependent on individuals, and thus difficult to transfer to other individuals or other
contexts. To acquire such knowledge, firms first serve foreign markets via exports and
may eventually establish foreign production subsidiaries.6 Our paper develops a simple
5Oldenski (2012) focuses instead on interaction effects between task content and country character-istics in firms’ decision between exports and horizontal FDI.
6This literature also suggests that firms may first engage in joint ventures with local firms, whichprovide the right (but not the obligation) for future investment (e.g. Chi, 2000) and can help to obtainknowledge about local market conditions (Chi and McGuire, 1996). Once uncertainties have been
5

dynamic model to formalize these ideas and provides systematic evidence for firms’
gradual involvement in foreign markets.7
Finally, our paper is related to the recent but increasingly vast literature on firms’
export dynamics, which has established important stylized facts about new exporters:
they begin by exporting small amounts and are likely to drop out of foreign markets
shortly after entry; conditional on surviving, their exports grow rapidly and account for
a substantial proportion of export growth.8 Theoretical models seeking to account for
firms’ export dynamics emphasize learning about foreign markets and trade relation-
ships.9 Most related to our analysis is the paper by Albornoz et al. (2012). In their
theoretical model, individual export profitability, while initially uncertain, is positively
correlated over time and across destinations. This can lead to a process of “sequen-
tial exporting”. We focus instead on internationalization choices in individual foreign
markets, showing that uncertainty can lead firms to switch from exports to FDI.
3 The sequencing of export and FDI entries
In this section we document a novel empirical regularity concerning firms’ export and
FDI choices. We show that the overwhelming majority of firms serve a foreign market
via exports before establishing affiliates in that market. Thus export entry almost always
precedes FDI entry. The opposite is not true: essentially all firms that start exporting
to a new market do not already have foreign affiliates in that market.
reduced, firms involved in joint ventures may choose to purchase more equity in the venture, sell theirequity share, or dissolve the venture (e.g. Kumar, 2005).
7The international business literature has relied on case studies or surveys to examine firms’ inter-nationalization choices. For example, the seminal contribution by Johanson and Vahlne (1977) is basedon case studies of few Swedish firms, while the more recent paper by Brouthers et al. (2008) relies ona survey of Dutch and Greek firms.
8See, for example, Eaton et al. (2008) for Columbian firms, Aeberhardt et al. (2009) for Frenchfirms, Lawless (2009) for Irish firms, Iacovone and Javorcik (2010) for Mexican firms, and Albornoz etal. (2012) for Argentinian firms.
9One of the earlier papers on trade dynamics and incomplete information is Rauch and Watson(2003). They describe a model with costly search in which a buyer from a developed country is uncertainabout whether exporters from developing countries are able to fill a large scale order. In this setting,trade relations start small because importers test exporters by placing small orders that reveal theirtype. Eaton et al. (2010) develop a model where producers learn about the appeal of their productsby devoting resources to finding consumers and observing the experiences of competitors. Freund andPierola (2010) focus on the incentives of firms to develop new export products in the face of uncertaintyabout export costs. Their analysis of the frequency of entry and exit from foreign markets for Peruvianfirms in the non-traditional agricultural sector in Peru shows a process of “trials and errors”.
6

3.1 Data on exports and FDI
We exploit a unique dataset from the National Bank of Belgium (NBB), which allows us
to study the dynamics of firms’ exports and FDI decisions in individual foreign markets.
Data on export and FDI cover the whole population of companies registered in Belgium
and can be linked to firm-level accounts through the value added tax number, a unique
code identifying each firm.10 We restrict our attention to manufacturing firms (i.e. four-
digit codes belonging to sectors between 15 and 37 of NACE revision 1) and impose a
threshold in terms of employment (i.e. at least 5 employees).
Data on exports since 1993 come from the NBB Foreign Trade dataset, which allows
us to identify the countries to which a firm is exporting in a given year. Trade data on in-
dividual transactions concerning exports or imports are collected separately at company
level for intra-EU (Intrastat) and extra-EU (Extrastat) trade. For each transaction, this
data gives the product code, the type of transaction, and the destination or origin of
the goods, the value, the net mass and units. In our benchmark analysis, we focus on
destinations outside the European Single Market (ESM).11 The main reason is that the
Extrastat dataset is based on customs declarations and covers virtually all trade trans-
actions (all flows are recorded, as long as their value is at least 1,000 euro or their weight
is at least one ton). For destinations outside the ESM, we can thus identify all Belgian
firms that start exporting to a new country. By contrast, for destinations within the
ESM, we cannot identify all Belgian new exporters, since the Intrastat dataset covers
only firms whose annual trade flows (receipts or shipments) exceed a considerable thresh-
old.12 Even if a firm is included in the dataset, we risk only observing its exports once
it has successfully completed the initial phase of experimentation in a foreign market.
Data on FDI come from the NBB annual Survey on Foreign Direct Investment. The
survey, conducted since 1997, provides information on all firms that invest in foreign
countries. FDI is defined as international investments through which a resident entity in
one economy acquires an interest in a resident entity of another economy. The Survey
on Foreign Direct Investment includes all companies holding at least 10 percent of the
10In general, firms can serve foreign buyers through three channels: they can export their productsto foreign customers, serve them through foreign subsidiaries, or license foreign firms to produce theirproducts. Given the very limited role played by the third channel (i.e. less than 0.4 percent of Belgianfirms engage in foreign markets via licensing), we focus on the first two channels.
11The European Single Market comprises the 27 EU Member States plus Iceland, Liechtenstein andNorway through the European Economic Area. Switzerland is also considered part of it because it hasa series of bilateral treaties with the EU.
12The reporting threshold has been increased twice during our sample period (from 104,115 euros to250,000 euros in 1998, and to 1 million euros in 2006). In robustness checks, we show that our resultscontinue to hold when we consider all destination countries.
7

social capital of foreign firms. All firms are required to report their FDI stocks and flows
in individual foreign countries.
To identify firms that start investing in a foreign country, we define the variable FDI
entryf,i,t, which is equal to 1 if firm f has positive FDI stocks in country i in year t, but
had no FDI stock in that country in the previous year. Since the FDI data starts in
2007, we can define FDI entries as of 2008.
Identifying export entries is less straightforward, since firms often ship their goods
at intervals. Some studies define new exporters as firms that export to a market in
year t, but not in t − 1 (e.g. Besedes and Prusa, 2006; Eaton et al., 2008). Given the
lumpiness of exports, if we applied this definition, we would classify as new entrants
many firms that have already been exporting to a given market (50% of export entries
would be re-entries). To avoid this problem, we use a more stringent definition of new
exporters: the variable Export entryf,i,t is equal to 1 if firm f exports to foreign market
i in year t, after at least 5 years of no exporting to that market.13 This definition allows
us to identify firms with no export experience in a foreign country — at least not in the
previous five years — drastically reducing the number of re-entries (only 3.4% of export
entries in our sample).
Table 1 provides statistics on all Belgian manufacturing firms that started exporting
to or investing in destinations outside the European Single Market during our sample
period. Note that export entries are much more frequent than FDI entries (30,002 com-
pared to 380). This finding is in line with previous studies of firms’ internationalization
choices (e.g. Head and Ries, 2003; Helpman et al., 2004), which show that only a few
highly productive firms engage in FDI.
Thanks to the panel structure of our data, we can examine the dynamics of firms’
export and FDI choices in individual foreign markets. Table 1 shows that 99.99% of
the firms that started exporting to a foreign market, did so without having previously
invested there. By contrast, 86.32% of the firms that started investing in a foreign
market had already been exporting to that destination.14
13This is the most stringent definition we can apply without incurring left-censoring problems: sincefirm-level export data are available from 1993, for all export entries in the 1998-2008 period, we canobserve exports in the previous five years. See Berthou and Vicard (2013) for a similar definition ofnew exporters.
14This is a lower bound, since it is based on firms’ exports in the five years before FDI entry. Similarpatterns have been documented for French firms by Gazaniol (2012), who finds that in 95% of the casesexports precede FDI.
8

Table 1: Export and FDI entries
Year Export entries with Export entries with Total FDI entries with FDI entries with Total
no previous FDI previous FDI export entries no previous exports previous exports FDI entries
1998 2,925 0 2,925 0 20 20
1999 2,760 1 2,761 3 28 31
2000 2,892 0 2,892 5 52 57
2001 2,773 0 2,773 8 50 58
2002 2,575 0 2,575 3 24 27
2003 2,469 1 2,470 1 24 25
2004 2,971 1 2,972 4 27 31
2005 2,511 0 2,511 16 24 40
2006 2,530 1 2,531 5 33 38
2007 2,745 0 2,745 6 19 25
2008 2,847 0 2,847 1 27 28
Total 29,998 (99,99%) 4 (0.01%) 30,002 (100%) 52 (13.68%) 328 (86.32%) 380 (100%)
Notes: The table includes all export and FDI entries by Belgian manufacturing firms in destinations outside the European Single Market during 1998-2008.
9

The statistics in Table 1 indicate that virtually all Belgian firms were “new exporters”
before becoming “new FDIers”. This result is in line with the idea that firms experiment
in foreign markets via exports before deciding whether or not it is worth investing there.
4 Export and FDI choices under uncertainty
In this section, we present a simple model of firms’ internationalization choices, which
provides an explanation for the dynamic patterns that emerge in Table 1. As discussed
in the introduction, the international business literature has put forward the idea that
firms follow a gradual internationalization process: the need to acquire knowledge about
local demand and supply conditions leads them to serve a foreign market via exports
before engaging in FDI.
We develop a simple dynamic model of firms’ export and FDI choices to formalize
this idea. There are two main ingredients of our model. First, in line with the proximity-
concentration tradeoff literature (e.g. Markusen, 1984; Horstmann and Markusen, 1992;
Brainard, 1997; Markusen and Venables, 2000), we focus on a setting wherefirms choose
to serve a foreign market either via exports or horizontal FDI and assume a cost asym-
metry these two modes: exporting involves a lower fixed cost, while FDI involves lower
variable costs. As discussed in Appendix A-1, the logic of our theoretical model ap-
plies to a setting where exporting firms chooses whether or not to invest in a foreign
distribution network.
Second, firms are uncertain about their profitability in foreign markets. To capture
the process of experimentation, we follow Albornoz et al. (2012), who describe a simple
two-period game in which firms are initially uncertain about demand and supply con-
ditions in a foreign market and can only learn whether they can profitably serve it by
actually operating there.
4.1 Setup
We abstract from firm heterogeneity, which has been extensively studied in the literature
(e.g. Head and Ries, 2003; Helpman et al., 2004), focusing on the dynamics of the
internationalization choices of individual firms. We consider a representative risk-neutral
firm producing good k in its domestic market, which must decide whether to serve a
foreign market i, and whether to do so via exports or foreign affiliate sales.
Variable costs comprise two components: a known unit cost of production, which is
normalized to zero, and an unknown unit cost of distributing the good in the foreign
10

market, cik. If the firm serves the foreign market via exports, it bears a unit trade cost
τik (reflecting both transport costs and barriers to trade) and incurs a one-time fixed
cost equal to FEik (e.g. capturing the costs of learning about customs procedures). If
instead the firm engages in FDI, setting up a foreign production subsidiary, it avoids
paying the trade costs, but incurs a one-time fixed cost F Iik > FE
ik . Both fixed costs
are assumed to be irreversible.15 The firm faces a linear demand in the foreign market:
qik(pik) = aik − pik, where qik and pik denote the output sold in the foreign market and
the corresponding price, and aik is an unknown parameter.
Following Albornoz et al. (2012), uncertainty in foreign profitability is captured by
the random variable
µik ≡ aik − cik, (1)
with continuous cumulative distribution function G(.) on the support [µik, µik], mean
Eµik, and variance σ2. The value µik is realized with the highest possible demand
intercept and the lowest possible distributions cost; the value µik
is realized under the
opposite extreme scenario. As discussed below, before serving the foreign market, the
firm knows the distribution G(.). However, it can only discover its own profitability in
the foreign market if it operates there, either through exports or FDI.
To simplify notation, in what follows we drop country and sector subscripts, with
the understanding that country variables refer to foreign market i and sectoral variables
refer to industry k.
For a proximity-concentration tradeoff to arise, the fixed cost of FDI must be larger
than the fixed cost of exporting. Thus, we assume the following: F I ≥ 12(2√FE + τ)2.
This restriction ensures that the cost of setting up a subsidiary is sufficiently large that
FDI does not always dominate exports as a mode of serving the foreign market. We
further assume that 2√FE) + τ ≥ 0. This restriction guarantees that export entry is
profitable for some values of realized profitability.
4.2 Timing and entry strategies
Without loss of generality, we assume that the firm does not discount the future. The
timing of decisions is as follows:
t = 1: the firm chooses between exporting to the foreign market, setting up a
15The fixed cost of setting up a foreign subsidiary in a given market is also assumed to be independentof whether or not a firm has already exported to that market. The implications of relaxing thisassumption are discussed in Section 4.3.
11

foreign subsidiary, or not entering the market at all. If the firm decides to enter
via exports (FDI), it pays the per-destination fixed cost FE (F I) and chooses how
much to sell in that period. At the end of this period, if the firm has sold a positive
amount, it infers µ from its profit.
t = 2: if the firm has not entered the foreign market at t = 1, it decides whether
or not to do so. If the firm has entered at t = 1, it decides whether to exit the
foreign market, serve it under the same mode, or switch mode.
The setup is similar to Jovanovic (1982)’s model of firm dynamics, in which individuals
are uncertain about their entrepreneurial ability and can only discover it through the
process of starting a new firm. In our model, firms can only find out their profitability
in a foreign market by actually serving it, via exports or foreign affiliate sales. Firms
choose between three possible entry strategies:
a) Entry via exports at t = 1: in the first period, the firm pays the fixed cost FE,
exports to the foreign market and discovers its profitability; in the second period,
it decides whether to continue serving the foreign market through exports, switch
to FDI, or exit;
b) Entry via FDI at t = 1: in the first period, the firm pays the fixed cost F I and
serves the foreign market through its foreign subsidiary; in the second period, the
firm decides whether to continue serving the foreign market through FDI, switch
to exports, or exit;
c) No entry in the foreign market at t = 1.
In what follows, we solve for the firm’s optimal decisions by backward induction.
4.3 Period t = 2
a) Entry via exports at t = 1
Consider first the case in which the firm has started serving the foreign markets via
exports in the first period, discovering its profitability µ. In the second period, it must
decide whether to continue exporting, open a foreign subsidiary, or exit the foreign
market. If it continues to export, its second-period profits are given by πEE(τ, qEE) ≡(µ− τ − qEE)qEE. The firm chooses qEE so as to maximize profits, which yields second-
period export sales equal to qEE(τ) = Kµ>τµ−τ
2, where K. is an indicator variable,
12

here denoting whether µ > τ . Second-period export profits can then be re-written as
πEE(τ) = Kµ>τ
(µ− τ2
)2
. (2)
Alternatively, if the firm discovers that it is very profitable in serving the foreign
market, it may decide that it is worthwhile to pay the fixed cost of setting up a foreign
subsidiary to avoid paying the variable trade costs of exporting. In this case, second-
period profit are given by πEI(F I) ≡ (µ− qEI)qEI −F I . Profit maximization yields the
optimal quantity decision qEI = µ2. The profits obtained from establishing a production
facility at t = 2 are thus equal to
πEI(F I) =(µ2
4− F I
), (3)
which are positive if realized profitability is above µI ≡ 2√F I .
Figure 1: Strategies of the firm at t = 2, following export entry at t = 1
τ µEI
πEE
πEI
µ I
Exit Continue to serve the market via exports Switch to FDI
µ
πEI, πEI
0
Comparing (3) with (2), we can derive the threshold of realized profitability above
which the firm will switch from exports to FDI:
µEI ≡ 2F I
τ+τ
2. (4)
Figure 1 illustrates second-period export and FDI profits for a firm that has entered
13

the foreign market via exports in the first period. Depending on its realized profitability,
the firm decides whether to continue serving the foreign market, and whether to do so
via exports or FDI: if µ is below the unit trade cost τ , exports and FDI profits are both
negative, so the firm exits the foreign market; if τ < µ < (=)µEI , export profits are
positive and higher than (or equal to) FDI profits, so the firm continues to serve the
foreign market via exports; finally, if µ > µEI , realized profitability is high enough that
FDI profits are higher than export profits, so the firm is willing to pay the fixed cost of
setting up a foreign subsidiary to avoid trade costs. We can thus state the following:
Result 1 After entering the foreign market via exports and discovering its profitability,
the firm exits if µ < τ , continues to export if τ < µ ≤ µEI , and switches to FDI if
µ > µEI .
b) Entry via FDI at t = 1
Consider next the case in which the firm establishes a production facility in the foreign
market at t = 1, paying the one-time fixed cost F I . In this case, second-period FDI
profits are equal to πII = (µ − qII)qII . Substituting optimal foreign affiliate sales,
qII = µ2, yields
πII =µ2
4, (5)
which are positive as long as µ > 0.
The profits associated with switching from FDI to exports in the second-period can
be written as
πIE(τ, FE) =(µ− τ
2
)2
− FE. (6)
Profits from export entry are positive if realized profitability exceeds the following thresh-
old:
µE ≡ 2√FE) + τ. (7)
A firm entering the foreign market via FDI in the first period will never switch to
exports in the second period: if realized profitability µ is negative, exports and FDI
profits are both negative, so the firm will exit the market. If instead µ ≥ 0, the firm will
continue serving the foreign market through foreign affiliate sales, which is always more
profitable than switching to exports. The intuition for this result is simple: once the
14

firm has paid the sunk cost F I , starting to serve the foreign market via exports would
imply paying an additional fixed cost FE, as well as the trade cost τ for each unit sold
in the foreign market.
c) No entry at t = 1
Finally, if the firm has not entered in the first period, it has not discovered its profitability
in the foreign market. In the second period, it does not enter and earns zero profits.
4.4 Period t = 1
Having derived second-period profits, we can now move to the analysis of first-period
entry strategies. In what follows, we evaluate the profits associated with different entry
strategies from an ex ante perspective, i.e. when the firm is still uncertain about its
profitability in the foreign market.
a) Entry via exports at t = 1
Entering the foreign market via exports in the first period yields expected second-period
profits equal to
V E(τ, F I) =
∫ µEI
τ
(µ− τ2
)2
dG(µ) +
∫ µ
µEI
(µ2
4− F I
)dG(µ). (8)
Equation (8) captures the option value of serving the foreign market in the second
period, once the firm has discovered its profitability: the first term is the option value
of continuing to export, while the second is the option value of switching to FDI.
Overall expected profits from entering the foreign market via exports can thus be
written as
ωE(τ, FE, F I , qE) ≡∫ µ
µ
(µ− τ − qE)qEdG(µ)− FE +KqE>0VE. (9)
The first two terms of (9) represent expected first-period profits from export entry. The
last term captures expected second-period profits, as defined in equation (8). Recall from
equation (7) that µE defines the threshold of profitability for which the firm expects zero
first-period profits from entering via exports.
Optimal first-period exports depend on expected profitability in the foreign market.
When Eµ > µE (Eµ = µE), expected first-period export profits are positive (zero) and
15
the firm will set export volumes equal to qE = Eµ−τ2
. In scenarios in which τ < Eµ < µE,
expected profits in the first period are negative, but the firm will still export a positive
amount qE = Eµ−τ2
, as long as overall expected profits from export entry are positive.
Finally, consider scenarios in which Eµ < τ . Again, expected first-period profits will
be negative, but the firm may still be willing to test the foreign market, exporting an
arbitrarily small amount ε > 0, as long as (Eµ − τ − ε)ε − FE + V E > 0. Expected
profits from entering the foreign market at t = 1 via exports can thus be rewritten as
ΩE(τ, F I , FE) ≡∫ µ
τ
(µ− τ2
)2
dG(µ)− FE
+KqE>0
∫ µEI
τ
(µ− τ2
)2
dG(µ) +
∫ µ
µEI
(µ2
4− F I
)dG(µ)
.
(10)
We denote with µE the threshold of expected profitability above which ΩE > 0.
b) Entry via FDI at t = 1
From an ex-ante perspective, overall profits from FDI entry can be written as
ωI(F I , qI) ≡∫ µ
µ
(µ− qI)qIdG(µ)− F I +KqI>0
∫ µ
0
(µ− qI)qIdG(µ). (11)
The first two terms of (11) represent expected first-period profits FDI export entry. The
last term captures expected second-period profits, which are positive as long as µ > 0.
Substituting optimal subsidiary sales, qI = µ2, we can rewrite the firm’s expected
profits from entering the foreign market via FDI as follows:
ΩI(F I) ≡ 1
4
∫ µ
µ
µ2dG(µ)− F I +KqI>01
4
∫ µ
0
µ2dG(µ) (12)
We denote with µI the critical threshold of expected profitability above which ΩI > 0.
c) No entry at t = 1
The firm does not enter the foreign market, earning zero profits.
Entry decisions
From the analysis above, we can derive the firm’s entry strategy. There are three possible
cases to consider, depending on expected profitability in the foreign market before entry.
16

First, if Eµ < µE, expected profits from both export and FDI entry are negative, so the
firm will decide not to serve the foreign market. Second, if µE < Eµ < µI , expected
profits from export entry are positive and exceed expected profits from FDI entry, so
the firm will start serving the foreign market via exports. Finally, if Eµ > µI , expected
profits from FDI entry are larger than expected profits from export entry, so the firms
will start serving the foreign market by setting up a subsidiary. We can thus state the
following:
Result 2 The first-period entry decision depends on expected profitability in the foreign
market: if Eµ < µE, the firms does not enter; if Eµ > µI , it enters directly via FDI; in
the intermediate case in which µE ≤ Eµ < µI , the firm enters via exports, switching to
FDI in the second period if realized profitability exceeds µEI .
It easy to show that, when experimentation matters (i.e. when the firm would not enter
the foreign market in the absence of uncertainty), the firm will enter via exports rather
than FDI. To verify this, consider the limit case in which Eµ = µE as defined in equation
(7), in which the firm expects to make zero first-period profits from export entry. In
this case, overall expected profits from export entry are equal to
ΩE =
∫ µEI
τ
(µ− τ2
)2
dG(µ) +
∫ µ
µEI
(µ2
4− F I
)dG(µ) > 0, (13)
while expected profits from FDI entry are given by16
ΩI =1
2(2√FE + τ)2 − F I ≤ 0. (14)
In this scenario, uncertainty leads to a gradual internationalization process: the firm
enters the foreign market via exports, even if it expects to make zero profits in the first
period; in the second period, if its realized profitability is high enough, it starts investing
in the foreign market.
As an illustration, in Figure 2 we have drawn the probability density function of a
beta-type distribution of the random variable µ, with mean equal to µE.17 As discussed
above, the case in which Eµ = µE is one in which the firm enters the foreign market via
exports, even if it expects to make zero profits in the first period.18 The shaded area
16The fact that expected profits from FDI entry cannot be positive when Eµ = µE follows from therestriction on the fixed cost of FDI.
17The beta distribution is often used to model the behavior of random variables limited to intervalsof finite length. It is parametrized by two positive shape parameters, denoted α and β. The probabilitydensity function in Figure 2 corresponds to a beta distribution with α = β = 6, with support [µ, µ].
18By definition, µE is above the minimum level of expected profitability that guarantees that the firmwill engage in export experimentation (the threshold µE identified by equation 10, such that ΩE = 0).
17

Figure 2: Probability of a switch from exports to FDI at t = 2
𝐸𝜇 = 𝜇! 𝜇 𝜇 𝜏 𝜇!"
Exit Continue to export Switch to FDI
captures the probability that the firm starts investing in the second period, which is equal
to 1 − G(µEI). The area below τ captures instead the probability that a firm entering
the foreign market in the first period exits in the following period, if it discovers that its
profitability is below the unit trade costs. Finally, with probability G(µEI)−G(τ), the
firm will continue to export.
Note that, if the firms survives as an exporter, the volume of its exports increases.
This is because, when the firm enters the foreign market in the first period, it expects
a profitability of µE. In the second period, if the firm continues to export in the second
period, it must be because its realized profitability is above τ ; conditional on surviving,
the relevant distribution of µ is thus a truncation of the original one, implying that the
firm expands its exports.
An increase in ex-ante uncertainty increases the likelihood of export trials and errors.
To illustrate this, in Figure 3 we have drawn a mean-preserving spread of the distribution
in Figure 2: an increase in σ2, the variance of µ, increases the probability that a firm
entering the foreign market via exports at t = 1 will stop exporting to that market at
t = 2 (the area below τ gets larger). Higher ex-ante uncertainty also makes it more
likely that, following export entry, the firm discovers that FDI entry is profitable (the
area above µEI gets larger).
We have assumed that the fixed cost of establishing a production facility in a foreign
market is independent of whether the firm has previously exported to that market.
This is the case if FE includes costs that are specific to exporting (e.g. learning about
customs procedures) and F I captures only FDI costs (e.g. building a foreign production
For values of expected profitability µE ≤ Eµ < µE , the firm will expect to make negative profits fromtesting the foreign market via exports in the first period.
18

Figure 3: Increase in foreign market uncertainty
𝐸𝜇 = 𝜇! 𝜇 𝜇 𝜏 𝜇!"
Exit Continue to export Switch to FDI
𝐸𝜇 = 𝜇! 𝜇 𝜇 𝜏 𝜇!"
Exit Continue to export Switch to FDI
plant). However, serving a foreign market may involve fixed costs that are common to
both exports and FDI (e.g. designing a marketing strategy for the foreign market). In
this case, the fixed costs of exports and FDI could be rewritten as FE = K + fE and
F I = K + f I , respectively, with f I > fE. Our results would continue to hold under this
alternative formulation of the fixed costs, but the switch from exports to FDI will be
more likely.19
An important feature of our model is that exports and horizontal FDI are substitutes
from a static perspective – since they represent alternative ways to serve a foreign market
– but may be complements over time – since the market-specific knowledge acquired
through exports experience can lead firms to set up foreign production plants.
Our analysis has important implications concerning the effects of trade liberaliza-
tion. Governments often try to achieve two broad objectives: attract FDI to bring
much-needed capital, new technologies, marketing techniques, and management skills;
and liberalize their economies (unilaterally, or in the context of regional/multilateral
trade negotiations). In static models of the proximity-concentration tradeoff, these two
objectives are always in conflict with each other: reducing import barriers makes export-
ing a more attractive option, reducing the incentives for FDI. By contrast, our analysis
suggests that, when firms are uncertain about foreign market conditions, a reduction in
trade costs may foster FDI, by lowering the cost of export experimentation. To verify
this, consider a scenario in which trade costs are initially such that τ > Eµ − 2√FE,
implying that first-period expected profits from entering the foreign market via exports
are negative. Also assume that the expected first-period export loss exceeds the option
19Under this alternative formulation, the profitability threshold above which a firm will switch from
exports to FDI is µEI′ = 2fI
τ + τ2 < µEI and the probability of a switch is thus 1−G(µEI′) > 1−G(µEI).
19
value of serving the foreign market in the second period, so the firm will choose not to
serve the foreign market. Now consider a reduction in the trade costs to τ = Eµ−2√FE.
The firm now expects to make zero export profits at t = 1, but is willing to enter the
foreign market to secure the possibility of positive profits at t = 2. With probability
1 − G(µEI), export experimentation will then lead the firm to start investing in the
foreign market.20
The implications of FDI liberalization also differ from those of standard internation-
alization models. Consider a situation in which a government allows foreign firms to
invest in its country, removing a pre-existing ban on FDI. In our model, this may lead
some firms to start exporting. The intuition for this result is that the possibility of
setting up foreign affiliates increases the option value of export entry.21 By contrast, in
standard internationalization models, FDI liberalization cannot trigger export entry.
5 Exit and evolution of exports of new exporters
The statistics presented in Section 3 show that essentially all firms start serving foreign
markets via exports, possibly engaging in FDI later on. The model described above
provides a theoretical rationale for this stylized fact: when firms are uncertain about their
ability to earn profits in a new market, exporting is a more efficient way to experiment
than FDI, since it involves lower fixed cost.
We now focus on all Belgian firms that started exporting to new destinations during
our sample period. In this section, we look at the evolution of their exit rates and export
values in the years following export entry. In the following section, we examine instead
the probability that new exporters start investing in the foreign market.
According to our model, after an initial trial period, new exporters will exit a foreign
market, if they discover that their profitability in that market is too low to justify the
trade costs.
Figure 4 reports exit rates of Belgian new exporters. We focus on the 16,394 export
entries that occurred during the 1998-2003 period, so that we can observe at least five
years of exports following entry since our sample period ends in 2008. In line with the
20However, if trade costs are small enough that export experimentation is already profitable (τ ≤Eµ− 2
√FE), further trade liberalization will clearly have a negative effect on FDI. The effect of trade
costs on the ratio exports/FDI activities should thus be non-linear.
21When FDI is banned, the option value of export entry is equal to∫ µτ
(µ−τ2
)2dG(µ). Following FDI
liberalization, an exporting firm can establish a production plant if it discovers that its profitability
exceeds the threshold µEI , so the option value increases to∫ µEI
τ
(µ−τ2
)2dG(µ)+
∫ µµEI
(µ2
4 −FI)dG(µ).
20
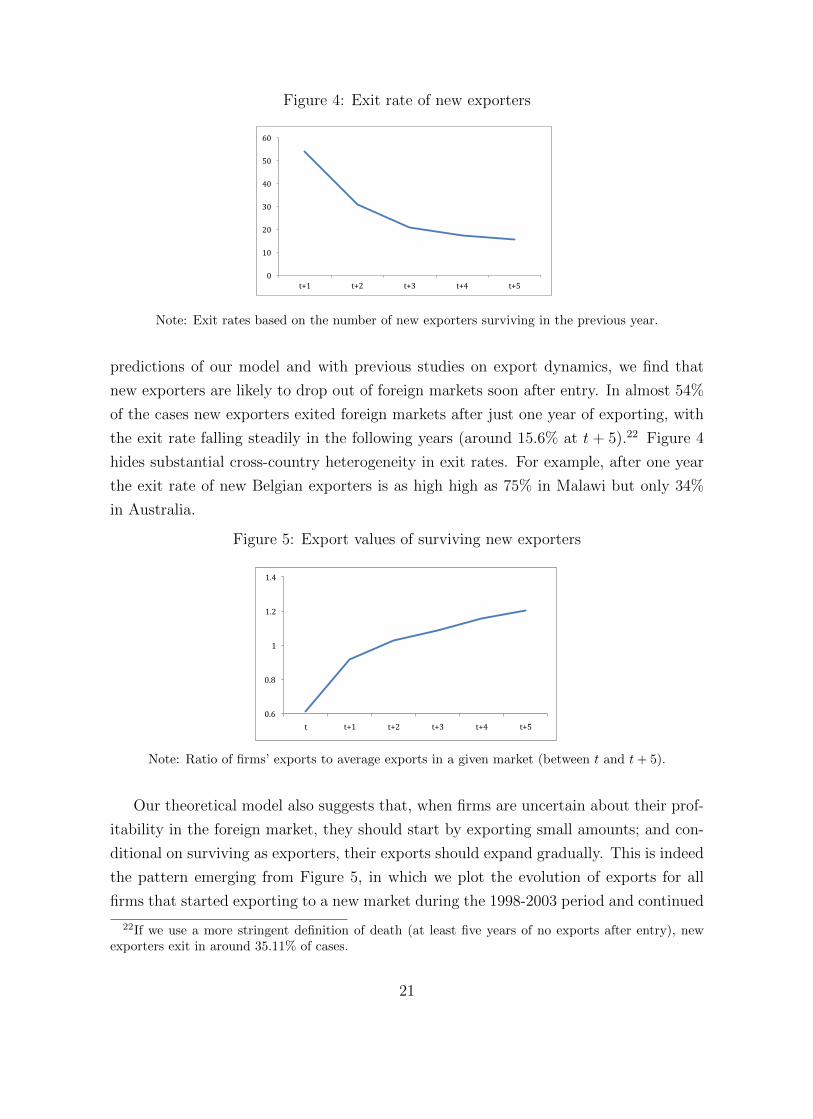
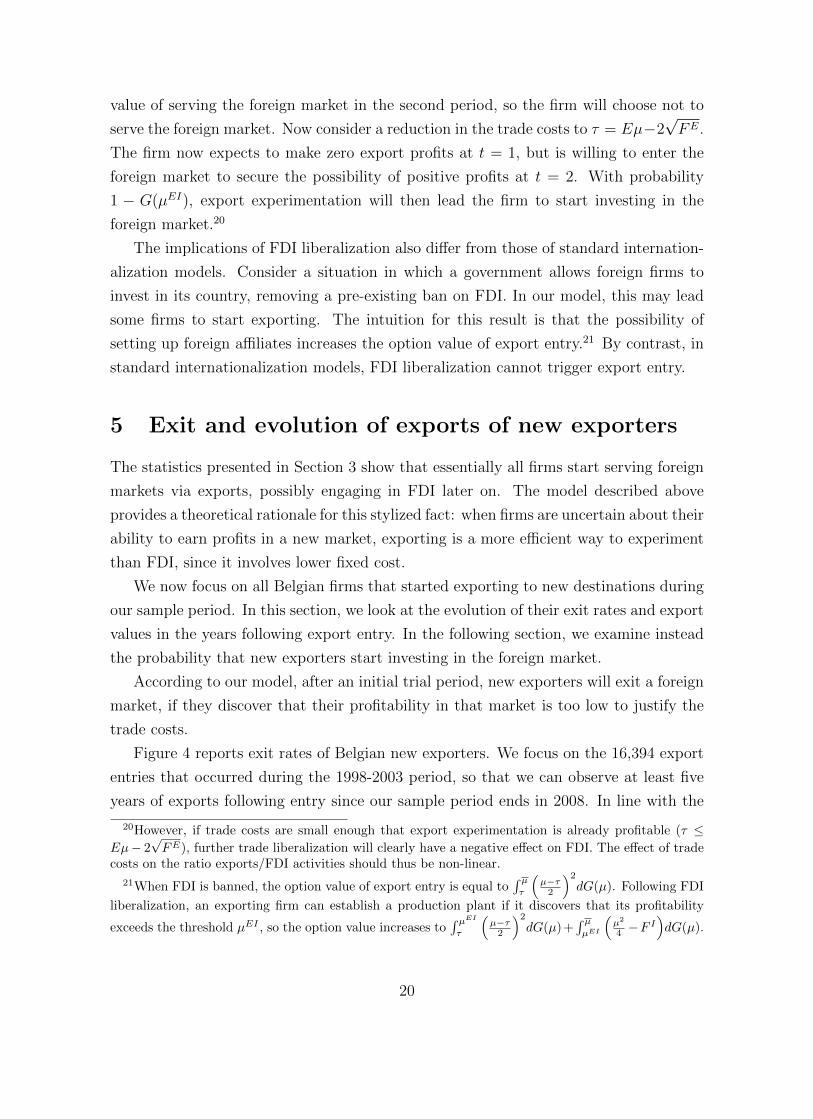
Figure 4: Exit rate of new exporters
!
!
!
!
!
"!
#"!
$"!
%"!
&"!
'"!
("!
)*#! )*$! )*%! )*&! )*'!
Note: Exit rates based on the number of new exporters surviving in the previous year.
predictions of our model and with previous studies on export dynamics, we find that
new exporters are likely to drop out of foreign markets soon after entry. In almost 54%
of the cases new exporters exited foreign markets after just one year of exporting, with
the exit rate falling steadily in the following years (around 15.6% at t + 5).22 Figure 4
hides substantial cross-country heterogeneity in exit rates. For example, after one year
the exit rate of new Belgian exporters is as high high as 75% in Malawi but only 34%
in Australia.
Figure 5: Export values of surviving new exporters
!
"#$!
"#%!
&!
&#'!
&#(!
)! )*&! )*'! )*+! )*(! )*,!
Note: Ratio of firms’ exports to average exports in a given market (between t and t+ 5).
Our theoretical model also suggests that, when firms are uncertain about their prof-
itability in the foreign market, they should start by exporting small amounts; and con-
ditional on surviving as exporters, their exports should expand gradually. This is indeed
the pattern emerging from Figure 5, in which we plot the evolution of exports for all
firms that started exporting to a new market during the 1998-2003 period and continued
22If we use a more stringent definition of death (at least five years of no exports after entry), newexporters exit in around 35.11% of cases.
21

to export to that market in the following five years.23
While our model provides an explanation for the dynamic patterns of firms’ export
and FDI entries documented in Table 1, in principle these patterns could be explained
by alternative mechanisms. For example, switches from exports to FDI could occur in
a model a la Helpman et al. (2004), if a firm’s productivity increases over time and
eventually reaches the threshold above which FDI becomes more profitable than export.
However, alternative mechanisms unrelated to foreign market uncertainty cannot also
explain the high exit rates of new exporters and the evolution of exports of surviving
new exporters documented in Figures 4 and 5. These patterns suggest that firms engage
in a process of trial and error: in the face of uncertainty, they experiment in foreign
markets via exports, to find out whether they can make profits abroad; after an initial
trial period, they often exit the market; conditional on surviving, they expand their
exports. The analysis carried out in the next section shows that export experimentation
may also lead new exporters to start investing in foreign markets.
6 FDI entry of new exporters
6.1 Descriptive statistics
As discussed in Section 3, the statistics on export and FDI entries show that Belgian
firms almost never establish affiliates in a foreign market without having first tested it
via exports: in almost 90% of the cases, FDI entry is preceded by export entry. This
finding is in line with the idea that firms follow a gradual internationalization process:
in the face of uncertainty, they start by serving a foreign market via exports, to acquire
information about local demand and supply conditions; if they discover that they can
earn large enough profits in that market, they establish a foreign subsidiary to reduce
variable costs.
In the simple two-period model described in Section 4, firms discover their prof-
itability in a foreign market as soon as they start operating there. In this setting, export
experimentation lasts only one period. In reality, firms may experiment with exports
for several periods, before deciding whether or not to engage in FDI.
23For each year between t (the year of export entry) and t+ 5, we have computed the ratio of a firm’sexport to a given market over its total exports to that market between t and t+ 5. Figure 5 plots theevolution of the average of this ratio for all new exporters. The same pattern emerges if we disregardthe year of export entry, when trade volumes are affected by the month of entry in the export market(see Berthou and Vicard (2013) for a discussion).
22

Table 2: FDI entries by export experience
Years of experience FDI entries Percentage Cumulative1 4 6.45 6.452 21 33.87 40.323 12 19.35 59.684 10 16.13 75.815 3 4.84 80.656 1 1.61 82.267 1 1.61 83.878 5 8.06 91.949 3 4.84 96.7710 2 3.23 100.00
Notes: The table includes all FDI entries by Belgian manufacturing firmsin countries outside the European Single Market over the 1998-2008 period.A firm is coded as having 1 year of experience in the year in which it startsexporting to a foreign market. Experience increases with each additionalyear in which the firm has positive exports to the foreign market.
The summary statistics in Table 2 show that most FDI entries by Belgian firms (al-
most 34%) occur early, with the investing firm having just two years of export experience
in the foreign market. These statistics suggest that export experience has a positive but
decaying effect: most FDI entries of new exporters occur when the firm has a four years
of export experience and become quite rare afterwards.
The fact that most new exporters that start investing in a foreign market do so with
little export experience may be surprising. One should keep in mind, however, that
export experience is defined as the number of years in which the firms has had positive
exports since entry. Given that exports are often lumpy, the delay between export and
FDI entry is effectively longer than what suggested by Table 2. In our empirical analysis,
we will show that new exporters are more likely to postpone FDI entry in foreign markets
in which they face more uncertain conditions (see Section 6.4).
It is also interesting to look at the evolution of firms’ exports following FDI entry.
The benchmark model presented in Section 4 focuses on horizontal FDI, i.e. foreign
production facilities to serve the destination market. As discussed in Appendix A-
1, the logic of our model can be extended to distribution FDI, i.e. investments in
foreign distribution centers and sales offices. The main difference is that, when foreign
investments are horizontal, exports should fall after FDI entry, while the opposite should
occur for distribution investments. Looking at the evolution of exports for firms that
started investing abroad suggests that Belgian firms engage in both types of FDI: in many
instances, exports fall drastically after FDI entry, suggesting that the firm established a
foreign production facility; in other cases, exports increase dramatically after FDI entry,
suggesting that the firm established distribution centers or sales offices in the foreign
23

country rather than production facilities.
6.2 Empirical methodology
To examine the role of export experience on FDI entry decisions, we use survival analysis
to estimate the hazard rate hf,i(t), i.e. the probability that new exporter f starts
investing in country i at time t:24
hf,i(t) = h0(t) exp(βXf,i,t), (15)
where h0(t) is the baseline hazard rate, Xf,i,t is the matrix of covariates and β is the
vector of coefficients to be estimated. In our benchmark regressions, we estimate the
coefficients using the partial likelihood method suggested by Cox (1975). This is a semi-
parametric method that allows us to remain agnostic about the functional form of the
baseline hazard rate h0(t).
Survival analysis does not suffer from right censoring problems since it explicitly takes
into account the fact that FDI entry may not occur for some firms in some countries by
the end of the sample period: starting from the year in which a firm starts exporting to
a foreign market (export entry), we can thus track each firm over time, until it opens
a subsidiary in that country (FDI entry), or until the end of the sample period if no
FDI occurs. Using this methodology, we can examine the determinants of FDI entry
decisions of all Belgian firms that started exporting to foreign markets during the sample
period.25
6.3 Explanatory variables
In what follows, we describe the variables used in the empirical analysis. The definition
of all the main variables can also be found in Table 3.
24Survival analysis (or duration analysis) allows to estimate the time it takes for an event to materi-alize. In empirical studies of real option theories, proportional hazard models are used to verify whetheruncertainty delays investment decisions (e.g. Hurn and Wright, 1994; Favero et al., 1994; Kogut andChang, 1996). Duration models are also widely used in labor economics, to study the time it takes forunemployed workers to find a job. In our case, the event of interest is the FDI entry of a new exporter.
25If we employed alternative methodologies to estimate the probability of FDI entry, we would needto restrict the analysis to new exporters for which we can observe k periods following export entry, toavoid problems of right censoring. For example, we could focus on the export entries that have occurredduring the 1998-2003 period and use a linear probability model to estimate the likelihood of FDI entrywithin k = 5 periods. This methodology would drastically reduce the number of observations and wouldimpose a restriction on the time it takes for a new exporter to start investing in the foreign market.
24

Table 3: Definition of main variables
Export entryf,i,t Dummy equal to 1 if firm f starts exporting to country i in year t (after at least 5 years of no exporting)
FDI entryf,i,t Dummy equal to 1 if firm f starts investing in country i in year t
Export experiencef,i,t Number of years of positive exports of firm f to country i since entry (equal to 1 in the year of export entry)
Export experience12f,i,t Dummy equal to 1 if firm f in country i has 1 or 2 years of export experience in country i
Export experience34f,i,t Dummy equal to 1 if firm f in country i has 3 or 4 years of export experience in country i
Export experience56f,i,t Dummy equal to 1 if firm f in country i has 5 or 6 years of export experience in country i
Export experience7+f,i,t Dummy equal to 1 if firm f in country i has 7 or more years of export experience in country i
Uncertainty1i Standard deviation of Rule of Lawi,t during 1998-2008 period
Uncertainty2i Average exit rate of all Belgian firms that started exporting to country i during 1998-2008 period
GDPi,t Gross Domestic Product of country i in year t (in constant 2000 US$ in billions)
Rule of Lawi,t Rule of law index of country i in year t
Distancei Distance between Bruxelles and the capital of country i (in thousands of kilometers)
Common languagei Dummy equal to 1 if country i shares an official language with Belgium
Productivityf,t Value added of firm f (in thousands) divided by its employment (in thousands)
Employmentf,t Employment of firm f in year t (in thousands)
Foreign participationf,t Dummy equal to 1 if firm f receives inward FDI in year t
FDI in regionf,t−1,r Number of countries in continent r in which firm f had foreign affiliates at t− 1
Exports to regionf,t−1,c Number of countries in continent r to which firm f exported at t− 1
Notes: See Sections 3.1 and 6.3 for detailed information on the construction of the variables.
25
Firm-level variables
Our theoretical model studies export and FDI choices of a representative firm that is
uncertain about its profitability in foreign markets and can only discover it by operating
there. The model is very stylized, since all uncertainty is revealed upon entry. In this
simple setting, export experimentation lasts only one period, at the end of which the
firm decides whether or not to engage in FDI.
In reality, firms may need to export to foreign markets during several periods to
find out whether it is worthwhile to invest there. To measure the experience acquired
by a firm exporting to a foreign market, we define the variable Export experiencef,i,t,
which measures the number of years of positive exports by firm f to country i since
its export entry.26 To verify whether export experience has a decaying effect on FDI
entry decisions, as suggested by Table 2, we also construct dummy variables capturing
different “bins” of export experience: Export experience12f,i,t is equal to 1 if firm f has
1 or 2 years of export experience in country i; analogous definitions apply to Export
experience34f,i,t, Export experience56f,i,t, and Export experience7+f,i,t.27
To allow for possible learning spillovers across markets emphasized in previous studies
of firms’ export dynamics (e.g. Albornoz et al., 2012; Morales et al., 2011), we define
the variables Exports to regionf,t−1,r and FDI in regionf,t−1,r, which measure respectively
the number of countries in continent c to which firm f is exporting to and where it has
foreign affiliates at t− 1.28
The Central Balance Sheet Office of the NBB collects the annual accounts of all com-
panies registered in Belgium. They provide measures for firms’ value added, turnover,
employment, and capital stock. Using these data, we control for various firm charac-
teristics that can affect export and FDI choices. The variable Employmentf,t is the
number of full-time equivalent employees and is used as a proxy for firm size. The vari-
able Productivityf,t measures the firm’s value added per employee. The dummy variable
Foreign participationf,t takes the value 1 if the Belgian firm is foreign-owned29
26Notice that our definition of export experience does not coincide with the number of years sinceexport entry, since it excludes years in which a firm does not export to a foreign market. See Section3.1 for a precise definition of export entry.
27We use two-year bins of export experience because, in the case of single-year bins, some dummieswould be equal to 1 for very few observations.
28To capture the possibility of within-industry learning spillovers, emphasized in other studies (e.g.Hausmann and Rodrik, 2003; Segura-Cayuela and Vilarrubia, 2008), we have also constructed thevariables Exports by other firmsi,t−1,k and FDI by other firmsi,t−1,k measuring the number of Belgianfirms in sector k (at the 2-digit NACE) exporting or having foreign affiliates in country i at t−1. Thesecontrols were never significant when included in our regressions.
29Information about foreign ownership comes from the Survey on Foreign Direct Investment. Foreignownership is defined as direct or indirect foreign participation of at least 10 percent of a firm’s capital.
26

In some specifications, we include firm fixed effects, which allow us to control for
time-invariant firm characteristics that might affect internationalization choices.
Country-level variables
Our theoretical model studies export and FDI choices when firms are uncertain about
their profitability in foreign markets. In our empirical analysis, we construct two vari-
ables to capture the degree of foreign market uncertainty.
The variable Uncertainty1i captures the unpredictability of a country’s business en-
vironment. It is constructed as the standard deviation of the World Bank’s index Rule of
Lawi,t (see Kaufmann et al., 2009). This is a weighted average of a number of variables
capturing perceptions of the extent to which agents have confidence in and abide by
the rules of society (e.g. quality of contract enforcement, property rights, perception of
incidences of crime, effectiveness of the judiciary).
Our second measure of uncertainty, Uncertainty2i, measures the average exit rate of
Belgian new exporters in country i.30 Our theoretical model suggests that this variable
can be used to proxy the extent of foreign market uncertainty: the more uncertain are
demand and supply conditions in a foreign market (i.e. the larger is the variance of
the profitability variable µ), the more likely are Belgian firms to engage in a process
of trial and error, starting to export at t, but dropping out of the market at t + 1
(see Figure 3).31 The average exit rate of new exporters is positively correlated with
the uncertainty measure constructed using the World Bank’s Rule of Law indicator
(the correlation between Uncertainty1i and Uncertainty2i is 0.40). It is also highly
correlated with commonly used country risk ratings. For example, if we consider the
ratings published in the International Country Risk Guide (ICRG) by the PSR Group,
we find that the correlation between the variable Uncertainty2i and the ICRG composite
risk rating is -0.68, where higher values of the composite risk identify less risky countries.
30Since Uncertainty2i is constructed based on information on all Belgian firms that start exporting tocountry i during the period 1998-2007 (148 firms per country, on average), it can be taken as exogenousfrom the point of view of individual new exporters.
31The average exit rate of new exporters captures the likelihood that firms engage in a process of trialand error. In principle, this can be affected not only by the degree of foreign market uncertainty (σ inour model), but also by the extent of the fixed costs of exporting (FE in our model): when these costsare lower, exporting firms should be more likely to enter and exit. When comparing the average exit rateof Belgian new exporters across different countries, we find that it is significantly higher for destinationsoutside the European Single Market (0.52 on average) than for destinations within the Single Market(0.32 on average), with the lowest rates for Luxembourg (0.15), France (0.19), and the Netherlands(0.23), countries with which Belgium has both a common language and a common border. If cross-country differences were driven by differences in the fixed costs of exporting rather than by differencesin the degree of uncertainty faced by new exporters, we would expect the variable Uncertainty2i to besignificantly higher for destinations within the Single Market.
27

Following the literature on the determinants of FDI, we include the variable GDPi,t
to proxy for the size of destination markets.32 We also include two bilateral dummy
variables (from CEPII) that are commonly used in the literature to capture relations
between countries: Common languagei, which is equal to 1 if the foreign market i shares
an official language with Belgium; and Distancei, which measures the distance between
the capital of Belgium and the capital of country i.33
In some specifications, we include country fixed effects to account for the role of
time-invariant characteristics of destination markets.
6.4 Empirical results
6.4.1 The impact of export experience on FDI entry
The results of our benchmark regressions are reported in Table 4, where we examine the
determinants of FDI entry decisions of new exporters. The key variables of interest are
those capturing a firm’s export experience in foreign markets (with the dummy variable
representing seven or more years of experience being the omitted category).
In columns (1)-(2), we examine FDI entry decisions of all Belgian new exporters.
Notice that, in these specifications, the number of observations is very large, since all
firms that started exporting to at least one new destination outside the ESM during our
sample period are included in the analysis.34 The number of observations is drastically
reduced in columns (3)-(6), where we include firm fixed effects to account for the role of
time-invariant firm characteristics that may affect internationalization choices. In these
specifications, all observations for which there is no variation in the dependent variable
within the fixed effects are dropped; only firms that started exporting to more than
one foreign market and started investing in at least one of them are retained. These
specifications are closest to the spirit of our theoretical model, in which we examine the
dynamics of export and FDI choices of a representative firm, abstracting from the role of
32We cannot include population and GDP per capita, since they are collinear with GDP.33As an additional measure of trade barriers, we have constructed the variable Tariffi,t,k, which
measures the average tariff applied by country i on imports from Belgium in sector k (over the previousthree years). The procedure to construct this variable is rather cumbersome, since it requires matchingdifferent sector classifications (HS-NACE-ISIC). Due to the limited availability of tariff data, includingthis variable drastically reduces the number of observations in our analysis. For this reason, we onlyreport specifications without tariffs. If included, these are never significant and do not affect thequalitative results of our analysis.
34In these regressions, the total number of FDI entries is 62 (see bottom of Table 4), which is a subsetof the 328 FDI entries that were preceded by exports (see Table 1). This is because we only include FDIentries of new exporters, i.e. firms that started exporting to new markets during our sample period, forwhich we can measure the experience acquired since their export entry.
28

firm heterogeneity. These specifications also alleviate concerns about possible selection
effects, since the impact of export experience on FDI entry decisions is identified by
exploiting within-firm variation across different destinations. In columns (5)-(6) we add
country fixed effects to account for the role of time-invariant characteristics of destination
markets. This further reduces the sample size, since all countries where no new exporter
started investing are dropped.
Table 4: FDI entry of new exporters, the decaying effect of export experience
(1) (2) (3) (4) (5) (6)Experience12f,i,t 1.125*** 0.876*** 1.197*** 0.959*** 1.142*** 1.029***
(0.324) (0.327) (0.363) (0.363) (0.358) (0.367)Experience34f,i,t 1.303*** 0.767* 1.042** 0.693 0.596 0.530
(0.385) (0.415) (0.484) (0.485) (0.478) (0.458)Experience56f,i,t 0.557 -0.222 0.063 -0.538 -0.669 -0.810
(0.654) (0.684) (0.842) (0.838) (0.838) (0.837)log Productivityf,t 0.230 -0.662 -0.671
(0.200) (0.487) (0.534)log Employmentf,t 0.506*** 1.444 1.266
(0.090) (0.953) (0.967)Foreign participationf,t 0.696** 3.362*** 3.508***
(0.312) (0.889) (0.944)FDI in regionf,t−1,r 0.223*** -0.141 -0.394**
(0.044) (0.095) (0.195)Exports to regionf,t−1,r 0.014 0.033 0.027
(0.014) (0.023) (0.030)log GDPi,t 0.363*** 0.367*** -1.414
(0.089) (0.094) (2.160)Rule of lawi,t 0.263 0.386** 2.748
(0.182) (0.181) (1.722)log Distancei -0.095 -0.360
(0.257) (0.233)Common languagei -0.297 -0.474
(0.496) (0.477)Firm fixed effects No No Yes Yes Yes YesCountry fixed effects No No No No Yes YesObservations 176,040 155,791 5,411 4,969 2,929 2,842Export entries 29,998 27,586 961 898 502 495FDI entries 62 62 62 62 62 62Log likelihood -602.8 -550.9 -376.4 -340.8 -322.0 -302.5
Notes: The dependent variable is hf,i(t), the probability that new exporter f starts investingin country i at time t. The table reports the estimated coefficients of Cox regression models,with robust standard errors in parenthesis. * denotes significance at the 10% level, ** 5% level,and *** 1% level. The sample includes all FDI entries by new exporters in countries outsidethe EU Single Market during the 1998-2008 period.
Notice that the coefficient of Export experience12f,i,t is always positive and statis-
tically significant at 1%. The effect is sizable. If we compute the hazard ratio for the
variable Export experience12f,i,t, we find that new exporters are between 140 and 213
29

percent more likely to start investing in a foreign market in the first two years of ex-
porting than those with seven or more years of experience. The coefficients for the other
dummies of export experience are also positive, but smaller in values and in most cases
not statistically different from zero. The results suggest that export experience has a
positive but decaying effect on the probability of FDI entry.35
These results are consistent with the idea that firms initially test a foreign market
via exports; if they discover that they can earn sufficient profits in that market, they
set up foreign affiliates to reduce variable costs. The fact that most FDI entries occur
in the first few years after export entry suggests that, once a firm starts exporting to a
new market, it quickly discovers whether or not it is worthwhile to invest there.
As for the other firm controls, the estimated coefficient of Foreign participationf,t
is positive and significant, showing that Belgian firms that are foreign owned are more
likely to start investing abroad. The role of the variable FDI in regionf,t−1,r depends
on the specification and the underlying identification strategy. Its coefficient is positive
and significant in column (2), where we compare across firms, but becomes negative
in the other two columns (and significant in the last one) where we compare a given
firm across destinations. In this case, the likelihood that a firm will engage in FDI in a
particular destination market decreases if the firm already has affiliates in neighboring
markets. Productivity is never significant, while employment has a positive effect only
in the second column, when comparing across firms.
With respect to country variables, in column (4) we find a positive and significant
coefficient for both GDPi,t and Rule of Lawi,t, suggesting that new exporters are more
willing to engage in FDI in countries that are larger and have sounder institutions. The
coefficients lose significance in column (6), indicating that there is limited within-country
variation in these variables during our sample period.
6.4.2 The role of foreign market uncertainty
In Table 5, we examine whether the impact of export experience on FDI entry decisions
depends on the extent of foreign market uncertainty. For this purpose, we interact the
variable log Export experiencef,i,t with our two measures of foreign market uncertainty.36
35In all specifications with the additional controls, the estimates for the first bin of export experienceare statistically different from those of the third bin. We have also tried including single-year bins andthe results are qualitatively the same. Since some of these dummy variables are equal to 1 for very fewobservations, we prefer to report results for bins grouping two years of export experience.
36We use log Export experiencef,i,t since it is a good proxy of the nonlinear effect of Exportexperiencef,i,t and it simplifies the analysis when interacting with the uncertainty measures.
30

Table 5: FDI entry of new exporters, the role of uncertainty
(1) (2) (3) (4) (5) (6) (7) (8)log Experiencef,i,t × Uncertainty1i 6.180** 4.446** 5.744* 4.138
(2.746) (2.073) (3.240) (2.519)Uncertainty1i -9.526** -3.413 -10.033** -4.074
(4.355) (3.492) (4.481) (3.550)log Experiencef,i,t × Uncertainty2i 6.344*** 6.357*** 4.562* 7.266**
(2.120) (2.318) (2.568) (2.965)Uncertainty2i -12.638*** -9.443** -11.916*** -9.025**
(3.123) (3.686) (3.530) (4.365)log Experiencef,i,t 0.508 0.330 1.000** 0.999** -1.752* -2.109* -0.526 -1.894
(0.343) (0.305) (0.479) (0.464) (0.983) (1.089) (1.260) (1.460)log Productivityf,t 0.207 -0.706 0.224 -0.745
(0.202) (0.595) (0.205) (0.588)log Employmentf,t 0.502*** 1.217 0.505*** 1.319
(0.090) (1.071) (0.089) (1.067)Foreign participationf,t 0.534* 3.011*** 0.524 3.150***
(0.324) (0.910) (0.321) (0.888)FDI in regionf,t−1,r 0.236*** -0.226** 0.231*** -0.236**
(0.044) (0.101) (0.043) (0.095)Exports to regionf,t−1,r -0.004 0.038 -0.003 0.038
(0.015) (0.024) (0.014) (0.023)log GDPi,t 0.357*** 0.367*** 0.319*** 0.357***
(0.089) (0.089) (0.092) (0.090)Rule of lawi,t 0.262 0.373** 0.205 0.343*
(0.188) (0.178) (0.180) (0.181)log Distancei -0.148 -0.311 -0.114 -0.299
(0.262) (0.255) (0.245) (0.247)Common languagei -0.390 -0.611 -0.318 -0.602
(0.494) (0.514) (0.509) (0.543)Firm fixed effects No No Yes Yes No No Yes YesObservations 174,412 155,791 5,342 4,969 176,040 155,791 5,411 4,969Export entries 29,998 27,586 920 898 29,998 27,586 961 898FDI entries 62 62 62 62 62 62 62 62Log likelihood -589.3 -546.4 -360.1 -331.6 -587.7 -547.2 -358.3 -331.3
Notes: The dependent variable is hf,i(t), the probability that new exporter f starts investing in country i at time t. The table reportsthe estimated coefficients of Cox regression models, with robust standard errors in parenthesis. * denotes significance at the 10% level,** 5% level, and *** 1% level. The sample includes all FDI entries by new exporters in countries outside the EU Single Market duringthe 1998-2008 period.
31
In the first four columns, we use the variable Uncertainty1i, which captures the
predictability of a country’s business environment. In the last four columns, we use
instead the variable Uncertainty2i, which captures the extent to which Belgian firms
engage in a trial-and-error process in foreign market i. Column (1) reports the results of a
specification in which we include only the interaction term between Export experiencef,i,t
and Uncertainty1i, and each of the two variables separately. In column (2), we include
additional firm and country controls. In columns (3) and (4), we add firm fixed effects to
the specifications of columns (1)-(2).37 In columns (5)-(8), we repeat the same strategy
using the alternative uncertainty measure.
The results of Table 5 suggest that export experience has a larger impact on firms’
decision to start investing abroad in markets where they face more uncertainty. The
estimated coefficient for the interaction term between log Export experiencef,i,t and our
uncertainty measures is positive and significant in all but one specification (where the
p-value is 10.1%).
6.5 Robustness checks
The results in Table 4 show that the experience acquired by new exporters in foreign
market has a positive but decaying effect on the probability that they start investing in
that market. This finding is consistent with our simple learning model. Table 5 shows
that export experience has a larger impact on the probability of FDI entry in more
uncertain foreign markets.
In the remainder of this section, we discuss a series of robustness checks, which show
that the results in Tables 4 and 5 are unaffected when using alternative econometric
methodologies and different samples of firms and countries. For each robustness check,
we report specifications that exploit variations both across and within firms. The results
can be found in Appendix tables A-1 to A-3.
As discussed in Section 3.1, we use a stringent definition of export entry (at least
five consecutive years of no exporting before entry), which minimizes the problem of
firms entering several times in the same foreign market. Nevertheless, some firms in
our sample re-enter the same foreign market once. Following previous studies on export
dynamics (e.g. Besedes and Prusa, 2006), we verify that our conclusions are robust
to focusing on first entry spells only, i.e. excluding all observations corresponding to
re-entries. The results of this exercise are reported in Table A-1 and show no qualitative
difference with respect to Tables 4 and 5.
37Country dummies cannot be included since our uncertainty measures vary at the country level.
32

Our theoretical model can be applied to international choices involving both horizon-
tal and export-supporting FDI (i.e. investments to build foreign production facilities or
distribution networks), where the goal is to serve foreign consumers in foreign markets.
The model does not apply to vertical FDI, which is driven by the desire to reduce pro-
duction costs rather than by market access motives. The NBB Survey on Foreign Direct
Investment does not contain information about the geographical destination of foreign
affiliate sales, which could be used to directly distinguish between different types of FDI.
However, the data contains information on intra-firm trade between foreign affiliates and
their Belgian parent. In Table A-2, we use information on intra-firm trade between the
foreign affiliate and the Belgian parent firm to remove from our sample FDI entries that
are potentially vertical in nature.38 Although doing so reduces the number of observa-
tions, the results confirm that a firm’s export experience has a positive but decaying
effect on the probability that new exporters establish foreign affiliates. The positive and
significant coefficient of the interaction term between log Export experiencef,i,t and the
two uncertainty measures confirms that the effect of experience is larger in destination
markets characterized by more uncertainty.
In our benchmark regressions, we restricted the analysis to destinations outside the
European Single Market. As discussed in Section 3.1, data on firm-level exports to these
countries come from customs declarations and cover virtually all transactions. We can
thus clearly identify all Belgian new exporters. In the case of destinations within the
ESM, on the other hand, firm-level export data are only available for firms that exceed
a significant export threshold, implying that we might not observe some firms that start
exporting to a new market (or that we might only observe them after the initial phase
of export experimentation, when their exports pass the reporting threshold). In Table
A-3, we nevertheless reproduce our main specifications on the much larger sample that
includes all destinations. The results confirm that export experience has a positive but
decaying effect on the probability of FDI entry and that the effect is larger in more
uncertain destinations.39
We also carried out a series of additional robustness checks, which are omitted from
the paper due to space considerations, but are briefly discussed and are fully available
upon request.
38We compute the share of exports (out of total affiliate sales) that a foreign subsidiary ships backto the Belgian parent company in the years following FDI entry. We classify FDI entries as vertical ifexports to the Belgian parent company exceed one third of the affiliate’s sales.
39There may be the concern that many FDI entries within the European Single Market, especiallyin the Central and Eastern European countries that have become members during our sample period,might be vertical in nature. For this reason, we re-estimated these regressions excluding vertical FDIentries using information on intra-firm trade and the result were qualitatively unchanged.
33

First, we reproduced our main results using a parametric Weibull proportional hazard
rate model to estimate the probability of FDI entry of new exporters. The Weibull model
imposes a specific functional form for the baseline hazard, h0(t) = ptp−1 exp(β0), where
p > 0 is an ancillary parameter to be estimated and β0 is a constant. The baseline
hazard rate is constant if p is equal to 1 while it is increasing (decreasing) for p above
(below) 1. The results of Tables 4 and 5 are unaffected when we use this alternative
econometric methodology.40
Second, we performed robustness checks involving the variable Uncertainty1i. Recall
that it is based on the percentage of firms that start exporting to country i at year t, but
stop exporting at t+ 1. As argued above, our model suggests that the exit rate of new
exporters at t + 1 should be correlated with the degree of ex-ante uncertainty faced by
firms in a foreign market. In some cases, however, the fact that a firm does not export
at t + 1 may simply be driven by lumpiness in trade transactions. To deal with this
issue, we used an alternative measure of the average exit rate of new exporters, based on
their export values at t+ 2. Notice that this reduces the number of observations used to
construct our uncertainty measure, since we cannot anymore include Belgian firms that
started exporting to a foreign market in 2007. These regressions confirm that export
experience has a larger impact on FDI entry in the first few years following export entry
and in countries in which exporting firms are more likely to engage in trials and errors.
All our results also continue to hold when we restrict the analysis to destinations in
which there are at least 100 new exporters.41
Third, our results are robust to the inclusion of additional firm-level controls. In
particular, we constructed the variables Exports by other firmsi,t−1,k and FDI by other
firmsi,t−1,k measuring the number of Belgian firms in sector k (at the 2-digit NACE)
exporting or having foreign affiliates in country i at t−1. These are meant to capture the
possibility of within-industry learning spillovers, emphasized in previous studies of firms’
export dynamics (e.g. Hausmann and Rodrik, 2003; Segura-Cayuela and Vilarrubia,
2008). The estimated coefficients for these additional controls were never significant.
Finally, our results continue to hold if we include additional country-level variables to
40In Weibull regressions, an incorrectly specified baseline rate would lead to inconsistent estimates.If the baseline hazard rate is not mis-specified, the estimates obtained should not systematically differfrom those obtained with the semi-parametric Cox model. The estimated ancillary parameters that weobtain are larger than one and statistically significant, implying an ever increasing baseline hazard rate.Since this restrictive assumption is not verified in our data (most FDI entries occur in the first few yearsfollowing export entry), we present the results of the non-parametric Cox model as our benchmark.
41As mentioned before, the measure Uncertainty1i is constructed using information on the exportpatterns of all Belgian new exporters to country i during our sample period. On average, there are 148new exporters per country. For some countries, however, the number of new exporters is much smaller,raising possible endogeneity concerns.
34

account for other determinants of FDI entry decisions. For example, we used information
from the ICSID database to construct a dummy variable BITi,t, which is equal to 1 if
country i has a bilateral investment treaty with Belgium at time t. Investment treaties
may stimulate FDI entry through different channels: they can decrease the cost of
setting up foreign affiliates;42 they may also decrease the degree of uncertainty faced
by foreign investors, e.g. through the establishment of dispute settlement provisions.43
When included in the analysis, the variable BITi,t is positive and significant, suggesting
that the probability that Belgian new exporters start investing in a country increases if
that country has a bilateral investment treaty with Belgium.44
7 Conclusion
Before they start operating in new foreign markets, firms typically possess imperfect
information about local supply and demand conditions: they are uncertain about local
regulations and legal requirements for selling their goods in a particular market, about
the size of foreign demand and about the adequacy of their products to local tastes. A
vast literature in international business studies argues that the need to acquire market-
specific knowledge leads firms to follow a gradual internationalization process, testing a
foreign market first via exports before deciding whether to invest there.
This paper started by presenting a novel fact about firms’ internationalization choices.
Using a unique dataset covering all companies registered in Belgium, which allows us to
study the dynamics of firms’ export and FDI choices in individual destination markets,
we show that FDI entry is almost always preceded by export entry: in almost 90% of
the cases, firms serve a foreign market via exports before they start investing there. The
opposite is not true: 99.99% of firms start exporting to a foreign market without having
previously invested there.
This fact cannot be explained by standard theoretical models of firms internation-
alization choices. To provide a rationale for the dynamic patterns of export and FDI
entries, we used a simple model that formalizes the idea of a gradual internationalization
42In our model, a reduction in F I lowers µEI ≡ 2F I
τ + τ2 , the threshold of realized profitability above
which a firm switches from exports to FDI.43These provisions are “one of the key elements in diminishing the country risk, and thus encourage
investors of one contracting party to invest in the territory of the other” (UNCTAD, 2006).44We do not include the variable BITi,t in our main regressions because of endogeneity concerns: the
implementation of investment treaties may not be random, but driven by characteristics of a foreigncountry that make it a more appealing destination for Belgian firms to invest. Egger and Merlo (2012)show that BITs have a positive effect on FDI by German multinationals, using a propensity score-matching procedure to take into account possible selection effects.
35

process. Firms are uncertain about their ability to earn profits in new foreign markets,
which they can only discover once they start serving it through exports or FDI. In this
setting, a firm will initially serve new foreign markets by exporting, which allows to
experiment at a lower fixed cost than FDI. After the initial trial period, the firm will
exit the foreign market, if it discovers that it cannot make enough profits to cover the
trade costs; for intermediate levels of realized profitability, the firm will continue serving
the market via exports; for higher levels of profitability, it will find it worthwhile to
establish foreign affiliates to reduce its variable costs.
In line with the predictions of our model, we found that new Belgian exporters are
likely to rapidly drop out of foreign markets after entry: in almost 54% of the cases,
firms stop exporting after one year; the exit rate falls steadily over time (it is 15.6%
after five years). We also find that new exporters start by exporting small amounts.
Conditional on surviving, their exports grow rapidly in the years following export entry.
The statistics on exit rates and the evolution of exports of new exporters confirm the
findings of recent studies on export dynamics and suggest that firms engage in a process
of trial and error in foreign markets.
Using proportional hazard models, we showed that export experimentation can lead
firms to start investing in the foreign market: new exporters may become new FDIers.
A firm’s export experience in a foreign market has a positive effect on the probability
that it starts investing in that market. This effect decays over time: firms are more
likely to start investing in a foreign market in the first few years following export entry,
after which export experience has no impact on their probability of FDI entry. Finally,
export experience has a bigger impact on investment decisions in destinations in which
market conditions are more uncertain.
Our paper calls for more work to understand how uncertainty affects export and FDI
decisions. In our analysis, we have used two variables to capture the degree of foreign
market uncertainty (constructed using World Bank’s indicators of business conditions
and the exit rates of new exporters in a given country). It would be interesting to explore
alternative measures. For example, recent studies use rich newspaper data to construct
measures of policy-related economic uncertainty (e.g. Baker et al., 2013). Unfortunately,
these are only available for a handful of countries.
Finally, our analysis shows that firms’ export and FDI decisions must be understood
as part of a broader dynamic strategy to serve foreign markets in the face of uncer-
tainty. It suggests that, although exports and horizontal FDI are substitutes from a
static perspective – since they represent alternative ways of serving a foreign market
– they may be complements over time – since the knowledge acquired through export
36

experience can lead firms to invest abroad. In contrast to the predictions of standard
internationalization choice models that abstract from uncertainty and experimentation,
our results imply that trade liberalization may actually foster FDI – by decreasing the
cost of experimenting in foreign markets – and that FDI liberalization may stimulate
exports – by increasing the option value of export entry.
References
Affendy, A.M., L. S. Yee, and S. Madono (2010). “Commodity-industry Classification
Proxy: A Correspondence Table between SITC Revision 2 and ISIC Revision 3,”
Journal of International Economic Studies 24, 185-202.
Albornoz, F., H. Calvo-Pardo, G. Corcos, and E. Ornelas (2012). “Sequential Export-
ing,” Journal of International Economics 88, 17-31.
Arkolakis, C. (2010). “Market Penetration Costs and the New Consumers Margin in
International Trade,” Journal of Political Economy 118, 1151-1199.
Baker, S. R., N. Bloom, and S. J. Davis (2013). “Measuring Economic Policy Uncer-
tainty,” Chicago Booth Research Paper No. 13-02.
Berthou, A., and V. Vicard (2013). “Firms’ Export Dynamics: Experience vs. Size,”
Banque de France, Working Paper 445.
Besedes, T., and T. J. Prusa (2006). “Product Differentiation and Duration of U.S.
Import Trade,” Journal of International Economics 70, 339-358.
Blonigen, B. A. (2005). “A Review of the Empirical Literature on FDI Determinants,”
Atlantic Economic Journal 33, 383-403.
Brainard, L. S. (1997). “An Empirical Assessment of the Proximity-Concentration
Trade-off Between Multinational Sales and Trade,” American Economic Review
87, 520-544.
Brouthers, K. D., L. E. Brouthers, and S. Werner (2008). “Real Options, International
Entry Mode Choice and Performance,” Journal of Management Studies 45, 936-
960.
Chi, T. (2000). “Option to Acquire or Divest a Joint Venture,” Strategic Management
Journal 21, 665-687.
37

Chi, T., and D. J. McGuire (1996). “Collaborative Ventures and Value of Learning:
Integrating the Transaction Cost and Strategic Option Perspectives on the Choice
of Market Entry Modes,” Journal of International Business Studies 27, 285-307.
Cox, D. R. (1975). “Partial likelihood,” Biometrika 62, 269-726.
Dixit, A. K., and R. S. Pindyck (1994). Investment and Uncertainty. Princeton, NJ:
Princeton University Press.
Eaton, J., M. Eslava, C. J. Krizan, M. Kugler, and J. Tybout (2010). “A Search and
Learning Model of Export Dynamics,” mimeo.
Eaton, J., M. Eslava, M. Kugler, and J. Tybout (2008). “The Margins of Entry into Ex-
port Markets: Evidence from Colombia,” in Helpman, H., Marin, D., and Verdier,
T. (eds.), The Organization of Firms in a Global Economy. Cambridge, MA:
Harvard University Press.
Egger, P., and V. Merlo (2012). “BITs Bite: An Anatomy of the Impact of Bilateral
Investment Treaties on Multinational Firms,” Scandinavian Journal of Economics
5, 776-795.
Favero, C., H. Pesaran, and S. Sharma (1994). “A Duration Model of Irreversible Oil
Investment: Theory and Empirical Evidence,” Journal of Applied Econometrics 9,
95-112.
Freund, C. L., and M. D. Pierola (2010). “Export Entrepreneurs: Evidence from Peru,”
World Bank Policy Research Working Paper 5407.
Gazaniol, A. (2012). “The Location Choices of Multinational Firms: the Role of Inter-
nationalization Experience and Group Affiliation,” World Economy, forthcoming.
Guiso, L., and G. Parigi (1999). “Investment and Demand Uncertainty,” Quarterly
Journal of Economics 114, 185-227.
Hausmann, R., and D. Rodrik (2003). “Economic Development as Self-discovery,”
Journal of Development Economics 72, 603-633.
Head, K., and J. Ries (2003). “Heterogeneity and the FDI versus Export Decision of
Japanese Manufacturer,” Journal of the Japanese and International Economies
17, 448-467.
Helpman, E., Melitz, M. J., and S. R. Yeaple (2004). “Export versus FDI with Hetero-
geneous Firms,” American Economic Review 94, 300-316.
38

Horstmann, I., and J. R. Markusen (1992). “Endogenous Market Structures in Inter-
national Trade,” Journal of International Economics 32, 109-129.
Horstmann, I., and J. R. Markusen (1996). “Exploring New Markets: Direct Investment,
Contractual Relations and the Multinational Enterprise,” International Economic
Review 37, 1-19.
Hurn, A., and Wright, R. (1994). “Geology or Economics? Testing Models of Irreversible
Investment Using North Sea Oil Data,” Economic Journal 104, 363-371.
Johanson, J., and Vahlne, J.-E. (1977). “The Internationalization Process of the Firm: A
Model of Knowledge Development and Increasing Foreign Market Commitments,”
Journal of International Business Studies 8, 23-32.
Iacovone, L., and B. S. Javorcik (2010). “Multi-Product Exporters: Product Churning,
Uncertainty and Export Discoveries,” Economic Journal 120, 481-499.
Jovanovic, B. (1982). “Selection and the Evolution of Industry,” Econometrica 50,
649-670.
Kaufmann, D., A. Kraay, and M. Mastruzzi (2009). “Governance Matters VIII: Ag-
gregate and Individual Governance Indicators, 1996-2008,” World Bank Policy
Research Working Paper 4978.
Kogut, B., and S. J. Chang (1991). “Technological Capabilities and Japanese Foreign
Direct Investment in the United States,” Review of Economics and Statistics 73,
401-413.
Krautheim, S. (2013). “Export-Supporting FDI,” Canadian Journal of Economics 46,
1571-1605.
Kumar, M. V. S. (2005). “The Value from Acquiring and Divesting a Joint Venture: a
Real Options Approach,” Strategic Management Journal 26, 321-331.
Lawless, M. (2009). “Firm Export Dynamics and the Geography of Trade,” Journal of
International Economics 77, 245-254.
Markusen, J. R. (1984). “Multinationals, Multi-plant Economies, and the Gains from
Trade,” Journal of International Economics 16, 205-226.
Markusen, J.R., and K. E. Maskus (2003). “General-Equilibrium Approaches to the
Multinational Firm: a Review of Theory and Evidence,” in J. Harrigan and K.
Choi (eds.), Handbook of International Trade. London, Basil Blackwell.
39

Markusen, J. R., and A. J. Venables (2000). “The Theory of Endowment, Intra-industry
and Multinational Trade,” Journal of International Economics 52, 209-234.
McDonald, R., and D. Siegel (1986). “The Value of Waiting to Invest,” Quarterly
Journal of Economics 101, 707-727.
Melitz, M. J. (2003). “The Impact of Trade on Intra-Industry Reallocations and Ag-
gregate Industry Productivity,” Econometrica 71, 1695-1725.
Morales, E., G. Sheu, and A. Zahler (2011). “Gravity and Extended Gravity: Estimating
a Structural Model of Export Entry,” mimeo.
Oldenski, L. (2012). “Export Versus FDI and the Communication of Complex Informa-
tion,” Journal of International Economics 87, 312-322.
Ramondo, N., V. Rappoport, and K. J. Ruhl (2014). “The Proximity-Concentration
Tradeoff under Uncertainty,” Review of Economic Studies 80, 1582-1621.
Rauch, J. E. (1999). “Networks Versus Markets in International Trade,” Journal of
International Economics 48, 7-35.
Rauch, J. E., and J. Watson (2003). “Starting Small in an Unfamiliar Environment,”
International Journal of Industrial Organization 21, 1021-1042.
Rob, R., and N. Vettas (2003). “Foreign Direct Investment and Exports with Growing
Demand,” Review of Economic Studies, 70, 629-648.
Ruhl, K., and J. Willis (2008). “New Exporter Dynamics,” mimeo.
Segura-Cayuela, R., and J. Vilarrubia (2008). “Uncertainty and Entry into Export
Markets,” mimeo.
UNCTAD (2006). Bilateral Investment Treaties: 1965-2006.
UNCTAD (2011). World Investment Report 2011.
40

Appendix
A-1 Distribution-oriented FDI
Building on the literature on the proximity-concentration tradeoff, the model described
in Section 4 examines a firm’s choice between two alternative ways of serving a foreign
market: exporting (the mode characterized by lower fixed cost) or horizontal FDI (char-
acterized by lower variable costs). Our analysis formalizes of the international business
literature that firms follow a gradual internationalization process: in the face of uncer-
tainty, they start by serving a foreign market via exports, to acquire information about
local demand and supply conditions; if they discover that they can earn large enough
profits, they setup foreign production facilities to save on trade costs.
In what follows, we show that the logic of our theoretical model can be extended to
an exporting firm choosing how to distribute its goods in a foreign market.45 In this
case, the choice is between using a local agent (the mode involving lower fixed costs)
and setting up its own distribution network (involving lower variable costs).
Consider a representative domestic firm that must decide whether to export to a
foreign market and how to distribute its exports to consumers in that market. As in
the model described in Sections 4.1-4.4, the firm is uncertain about its ability to earn
profits in the foreign market, and can only discover it by operating there. We normalize
unit production costs to zero and denote unit trade costs with τ . The firm can choose
to distribute its export using a local agent, in which case its unit distribution costs are
equal to c. If instead it invests in its own distribution centers and sales offices, the unit
distribution costs are reduced to c−φ. Independently of the distribution mode, the firm
incurs a sunk cost FE to start exporting (e.g. cost of learning customs procedures). To
establish its own distribution network, it incurs an additional sunk cost F I .
Uncertainty about profitability in the foreign market is captured by the random
variable µ, defined in equation (1). If can be shown that, in scenarios in which experi-
mentation matters (i.e. when the firm would not enter the foreign market in the absence
of uncertainty), the optimal strategy of the firm is to test the foreign market in the
first period, using a local agent to distribute its exports; in second period, the firm will
45In the international business literature, gradualism also applies to distribution decisions: firmsinitially begin distributing their products in foreign markets through deals with intermediaries; if theyare successful, they then establish their own distribution centers and sales offices (Johanson, and Vahlne,1977). The importance of “export-supporting FDI”, i.e. foreign investments in distribution to penetrateexport markets, has been emphasized by recent studies (e.g. Arkolakis, 2010; Krautheim, 2013).
41

exit the foreign market, if its realized profitability is below the unit trade costs τ ; for
intermediate levels of profitability, it will continue using a local agent to distribute its
exports; if profitability exceeds the threshold µEI′= 2F I
φ− φ
2+ τ , the exporting firm will
find it profitable to invest in a distribution network, paying the fixed cost F I to reduce
its variable costs.46
As in our benchmark model, uncertainty can thus lead to a gradual internationaliza-
tion process, whereby a firm’s export entry precedes its FDI entry: during an initial trial
period, the firm uses a local agent to distribute its exports in the foreign market; if it
discovers that it can earn large enough profits in that market, it invests in distribution-
oriented FDI. The main difference with the model described in Section 4 is that, when
the investment is to establish a distribution network (rather than a production facility),
exports increase (rather than fall) following FDI entry. This is because, when the firm
enters the foreign market in the first period, its expected profitability is Eµ. In the
second period, if the firm continues to export and invests in a distribution network, it
must be because its realized profitability is above µEI′; the distribution of µ is thus a
truncation of the original one, so export volumes expand. Notice also that, in the case
of distribution-oriented FDI, higher trade barriers decrease (rather than increase) the
likelihood that a firm starts investing in the foreign market in the second period.47
46After the firm has payed the entry export costs FE and discovered its profitability µ, its profits areequal to ΠE = (µ−qE−τ)qE if it continues using a local distributor, and to ΠI = (µ+φ−qI−τ)qI−F Iif it establishes its own distribution network. The threshold µEI
′is such that ΠE = ΠI .
47To see this, notice that µEI′
is increasing in τ , while µEI in equation (4) is decreasing in τ .
42

A-2 Robustness checksTable A-1: FDI entry of new exporters (only first entry spells)
(1) (2) (3) (4) (5) (6) (7) (8)Experience12f,i,t 0.886*** 0.991*** 0.872*** 1.132***
(0.325) (0.362) (0.332) (0.384)Experience34f,i,t 0.735* 0.710 0.714* 0.576
(0.413) (0.484) (0.424) (0.462)Experience56f,i,t -0.270 -0.538 -0.290 -0.794
(0.683) (0.836) (0.689) (0.836)log Experiencef,i,t × Uncertainty1i 4.436** 4.312*
(2.073) (2.539)Uncertainty1i -3.416 -4.360
(3.504) (3.608)log Experiencef,i,t × Uncertainty2i 6.212*** 7.779**
(2.290) (3.060)Uncertainty2i -9.217** -9.673**
(3.635) (4.365)log Experiencef,i,t 0.292 0.980** -2.082* -2.128
(0.304) (0.461) (1.077) (1.492)log Productivityf,t 0.226 -0.667 0.256 -0.793 0.206 -0.695 0.222 -0.732
(0.198) (0.490) (0.196) (0.590) (0.201) (0.600) (0.203) (0.595)log Employmentf,t 0.505*** 1.414 0.548*** 1.234 0.503*** 1.175 0.505*** 1.278
(0.090) (0.954) (0.091) (0.983) (0.090) (1.067) (0.089) (1.058)Foreign participationf,t 0.690** 3.327*** 0.607* 3.467*** 0.530 2.998*** 0.520 3.140***
(0.312) (0.872) (0.318) (0.931) (0.323) (0.903) (0.320) (0.875)FDI in regionf,t−1,r 0.225*** -0.144 0.195*** -0.403** 0.238*** -0.235** 0.232*** -0.255**
(0.046) (0.093) (0.057) (0.198) (0.045) (0.101) (0.044) (0.102)Exports to regionf,t−1,r 0.014 0.032 0.009 0.025 -0.005 0.037 -0.003 0.036
(0.014) (0.023) (0.018) (0.031) (0.015) (0.024) (0.014) (0.023)log GDPi,t 0.363*** 0.368*** -1.268 -1.334 0.357*** 0.367*** 0.320*** 0.358***
(0.088) (0.094) (2.038) (2.172) (0.088) (0.089) (0.092) (0.090)Rule of lawi,t 0.252 0.382** 1.820 2.581 0.254 0.370** 0.198 0.338*
(0.182) (0.181) (1.411) (1.724) (0.189) (0.178) (0.180) (0.181)log Distancei -0.099 -0.361 -0.150 -0.317 -0.116 -0.311
(0.257) (0.234) (0.262) (0.257) (0.245) (0.250)Common languagei -0.292 -0.487 -0.387 -0.627 -0.318 -0.630
(0.496) (0.479) (0.494) (0.515) (0.509) (0.547)Firm fixed effects No Yes No Yes No Yes No YesCountry fixed effects No No Yes Yes No No No NoObservations 148,323 4,918 134,622 2,810 148,323 4,918 148,323 4,918Export entries 26,055 876 23,721 482 23,721 876 26,055 876FDI entries 62 62 62 62 62 62 62 62Log likelihood -548.1 -340.1 -519.2 -301.2 -544.3 -331.2 -545.1 -330.7
Notes: The dependent variable is hf,i(t), the probability that new exporter f starts investing in country i at time t. Robuststandard errors in parenthesis. * denotes significance at the 10% level, ** 5% level, and *** 1% level. The sample includes allFDI entries by new exporters in countries outside the EU Single Market during the 1998-2008 period but excludes all observationscorresponding to export re-entries.
43

Table A-2: FDI entry of new exporters (excluding vertical FDI)
(1) (2) (3) (4) (5) (6) (7) (8)Experience12f,i,t 0.983*** 1.040** 0.976*** 1.206***
(0.358) (0.408) (0.365) (0.429)Experience34f,i,t 0.778* 0.703 0.753 0.623
(0.452) (0.537) (0.459) (0.517)Experience56f,i,t -0.016 -0.452 -0.055 -0.656
(0.698) (0.863) (0.704) (0.851)log Experiencef,i,t × Uncertainty1i 4.973** 5.033**
(1.980) (2.549)Uncertainty1i -2.547 -3.766
(3.533) (3.741)log Experiencef,i,t × Uncertainty2i 6.381** 6.292**
(2.505) (3.050)Uncertainty2i -8.935** -8.912*
(4.060) (4.616)log Experiencef,i,t 0.124 0.715 -2.241* -1.607
(0.304) (0.465) (1.171) (1.505)log Productivityf,t 0.300 -0.795 0.320 -0.718 0.273 -0.720 0.303 -0.761
(0.221) (0.534) (0.218) (0.556) (0.223) (0.693) (0.225) (0.670)log Employmentf,t 0.539*** 0.805 0.578*** 0.472 0.537*** 0.753 0.540*** 0.775
(0.100) (1.176) (0.103) (1.128) (0.099) (1.300) (0.099) (1.273)Foreign participationf,t 0.718** 3.267*** 0.635* 3.433*** 0.597* 2.879*** 0.582* 3.062***
(0.337) (0.892) (0.340) (1.041) (0.359) (0.933) (0.354) (0.900)FDI in regionf,t−1,r 0.282*** -0.098 0.284*** -0.314* 0.298*** -0.162* 0.285*** -0.174**
(0.039) (0.096) (0.052) (0.189) (0.040) (0.097) (0.038) (0.087)Exports to regionf,t−1,r 0.006 0.024 0.010 0.005 -0.010 0.033 -0.009 0.031
(0.016) (0.024) (0.020) (0.031) (0.017) (0.025) (0.016) (0.023)log GDPi,t 0.430*** 0.445*** -0.864 -1.552 0.456*** 0.475*** 0.396*** 0.424***
(0.096) (0.106) (2.007) (2.102) (0.094) (0.101) (0.099) (0.102)Rule of lawi,t 0.219 0.276 1.957 3.333 0.253 0.290 0.174 0.241
(0.202) (0.196) (1.551) (2.032) (0.208) (0.191) (0.201) (0.194)log Distancei 0.203 -0.211 0.166 -0.117 0.125 -0.156
(0.312) (0.282) (0.332) (0.308) (0.298) (0.286)Common languagei -0.406 -0.787 -0.445 -0.900 -0.413 -0.884
(0.647) (0.579) (0.651) (0.633) (0.658) (0.635)Firm fixed effects No Yes No Yes No Yes No YesCountry fixed effects No No Yes Yes No No No NoObservations 155,704 4,424 139,969 2,179 155,704 4,424 155,704 15,157Export entries 27,576 810 24,863 383 27,576 810 27,576 2,593FDI entries 52 53 52 53 52 53 52 53Log likelihood -452.6 -280.5 -423.8 -242.5 -448.5 -273.7 -451.5 -274.8
Notes: The dependent variable is hf,i(t), the probability that new exporter f starts investing in country i at time t. The tablereports the estimated coefficients of Cox regression models, with robust standard errors in parenthesis. * denotes significance atthe 10% level, ** 5% level, and *** 1% level. The sample includes all FDI entries by new exporters in countries outside the EUSingle Market during the 1998-2008 period, excluding vertical FDI entries of new exporters.
44

Table A-3: FDI entry of new exporters (all destinations)
(1) (2) (3) (4) (5) (6) (7) (8)Experience12f,i,t 1.162*** 1.132*** 1.168*** 1.147***
(0.202) (0.229) (0.202) (0.228)Experience34f,i,t 0.965*** 0.980*** 0.915*** 0.892***
(0.241) (0.277) (0.240) (0.263)Experience56f,i,t 0.413 0.644* 0.333 0.491
(0.316) (0.353) (0.316) (0.336)log Experiencef,i,t × Uncertainty1i 5.503*** 3.802*
(1.838) (1.966)Uncertainty1i -8.023** -6.059*
(3.400) (3.198)log Experiencef,i,t × Uncertainty2i 3.471*** 2.361**
(0.754) (0.930)Uncertainty2i -7.385*** -6.763***
(1.291) (1.539)log Experiencef,i,t 0.070 0.910*** -0.722*** 0.307
(0.182) (0.273) (0.265) (0.377)log Productivityf,t 0.307** -0.247 0.325** -0.234 0.309** -0.310 0.325** -0.315
(0.128) (0.309) (0.129) (0.313) (0.127) (0.300) (0.128) (0.301)log Employmentf,t 0.563*** 0.789** 0.583*** 0.780** 0.553*** 0.887** 0.561*** 0.949**
(0.050) (0.373) (0.051) (0.358) (0.049) (0.373) (0.049) (0.371)Foreign participationf,t 0.154 0.542* 0.068 0.433 0.078 0.345 0.042 0.330
(0.181) (0.308) (0.187) (0.311) (0.186) (0.306) (0.188) (0.307)FDI in regionf,t−1,r 0.156*** -0.193*** 0.143*** -0.314*** 0.154*** -0.219*** 0.150*** -0.230***
(0.024) (0.042) (0.026) (0.060) (0.023) (0.044) (0.024) (0.043)Exports to regionf,t−1,r 0.046*** 0.065*** 0.047*** 0.060*** 0.037*** 0.064*** 0.036*** 0.059***
(0.009) (0.014) (0.009) (0.016) (0.009) (0.014) (0.009) (0.013)log GDPi,t 0.458*** 0.375*** -1.124 -1.774 0.431*** 0.344*** 0.448*** 0.358***
(0.049) (0.053) (1.294) (1.401) (0.050) (0.052) (0.050) (0.053)Rule of lawi,t 0.161 0.272*** 1.379 1.470 0.087 0.164 0.007 0.044
(0.103) (0.101) (0.924) (1.010) (0.133) (0.131) (0.110) (0.112)log Distancei -0.236*** -0.186** -0.244*** -0.165* -0.089 -0.033
(0.078) (0.087) (0.077) (0.085) (0.088) (0.090)Common languagei 0.764*** 0.683*** 0.651*** 0.482*** 0.522*** 0.287
(0.161) (0.157) (0.166) (0.165) (0.179) (0.179)Firm fixed effects No Yes No Yes No Yes No YesCountry fixed effects No No Yes Yes No No No NoObservations 327,884 19,101 239,636 12,938 327,884 19,101 327,884 19,101Export entries 55,317 3,024 39,901 1,968 55,317 3,024 55,317 3,024FDI entries 198 198 198 198 198 198 198 198Log likelihood -1,844.5 -1,330.9 -1,787.4 -1,263.6 -1,845.4 -1,314.6 -1,852.8 -1,320.5
Notes: The dependent variable is hf,i(t), the probability that new exporter f starts investing in country i at time t. The table reportsthe estimated coefficients of Cox regression models, with robust standard errors in parenthesis. * denotes significance at the 10% level,** 5% level, and *** 1% level. The sample includes all FDI entries by new exporters in all destination countries during the 1998-2008period.
45