the internationalization of malaysian engineering consulting
TRANSCRIPT

Southern Cross UniversityePublications@SCU
Theses
2012
The internationalization of Malaysian engineeringconsulting services firmsWai Wah WongSouthern Cross University
ePublications@SCU is an electronic repository administered by Southern Cross University Library. Its goal is to capture and preserve the intellectualoutput of Southern Cross University authors and researchers, and to increase visibility and impact through open access to researchers around theworld. For further information please contact [email protected].
Publication detailsWong, WW 2012, 'The internationalization of Malaysian engineering consulting services firms', DBA thesis, Southern CrossUniversity, Lismore, NSW.Copyright WW Wong 2012

THE INTERNATIONALIZATION OF
MALAYSIAN ENGINEERING
CONSULTING SERVICES FIRMS
WONG WAI WAH
BE (HONS.) (MU), MBA (UEL)
A RESEARCH THESIS SUBMITTED IN PARTIAL FULFILLMENT
OF THE REQUIREMENT FOR THE DEGREE OF
DOCTOR OF BUSINESS ADMINISTRATION
SOUTHERN CROSS UNIVERSITY
AUSTRALIA
APRIL 2012

i
DECLARATION
I certify that the work presented in this thesis is, to the best of my knowledge and belief,
original, except as acknowledged in the text, and that the material has not been submitted,
either in whole or in part, for a degree at this or any other university.
I acknowledge that I have read and understood the University’s rules, requirements,
procedures and policy relating to my higher degree research award and to my thesis. I
certify that I have complied with the rules, requirements, procedures and policy of the
University.
………………………………….
Wong Wai Wah
April 2012

ii
ACKNOWLEDGEMENTS
I wish to express my gratitude and thanks all those individuals and organizations who have
helped me and contributed to the completion of this thesis. First and foremost, I want to
thank City University College of Science and Technology for conducting this DBA
programme for which I had the opportunity to participate. I am also indebted to my
company, Sepakat Setia Perunding Sdn Bhd, for providing me the necessary office
facilities, support and assistance in my study and the preparation of this thesis.
A special thank goes to my thesis supervisor, Professor Dr. A Selvanathan for his
invaluable insights, suggestions, encouragement, guidance and time spent in reading and
correcting my manuscript. Also thanks to Dr Tan Lin Lah for encouraging me to
commence this DBA research programme. I also want to thank Ms Chew Chuw Keok
who helped me to source reference books from University Malaya and University Putra
Malaysia as well as journals from the internet database. I must also thank Ms Jeslyn Lam
Kai Yin who untiringly typed the manuscript and organized my study materials. I also like
to extend my appreciation to Mr Mohd Adhafi bin Abdul Hamid who helped me to collect
and return the library books, to all those who responded and replied my survey
questionnaires and those who voluntarily took part in the experience survey and focus
group meeting.
Last but not least, I must thank my wife and children for their support, patience and
understanding as I did not spend enough time with them during the course of my study and
thesis preparation.

iii
ABSTRACT
This exploratory research focused on the internationalization of the Malaysian ECS firms
for increasing the service export and the Research Problem: ‘What are the important
critical factors for the successful internationalization of Malaysian ECS firms?’. It
examined the challenges that the Malaysian ECS industry faces in its efforts to export its
services to international markets.
The research reviewed the key pertinent theories relating to internationalization, the global
engineering consulting industry and the Malaysian ECS industry. It also examined the
Government’s policies towards the Malaysian ECS industry and its export. The review
revealed gaps in the existing body of knowledge and these permitted the crafting of three
research propositions for testing by this research through a mixed methodology involving
both qualitative and quantitative approach with the former being dominant. The primary
data was collected from a focus group meeting and a structured questionnaire survey.
The research findings underlined the need for clear and coordinated Government policies,
and the regulatory framework by the policy makers for the development of the ECS
industry to compete effectively in the world markets. This includes appropriate
amendments to the REA and to change the composition of the Board of Engineers,
Malaysia (BEM) to include more ECS practitioners.
The findings of the study also confirmed the need for a coherent policy to support the
export initiatives of the Malaysian ECS industry. This includes the setting up of a
dedicated one stop agency for the promotion of export programmes and implementation of
effective strategies and focused planning.
The research made recommendations to the Malaysian ECS industry 1) to emphasize on
human capital development in management, financial, marketing and soft skills, 2) to
actively formulate and implement internationalization strategies, 3) to commit resources
for international market expansion, 4) to establish local presence to explore business

iv
opportunities and develop network relationships with local actors and, 5) to enlarge firm
size by mergers and acquisitions (M&As).
In line with the research objectives, the research findings extended the body of knowledge
on the research topic and contributed to theory building. Finally, the study offered
recommendations for further research by undertaking a more comprehensive and detailed
descriptive study on the Modified Internationalization Framework for Malaysian ECS
firms developed by this research.
Keywords:
Internationalization, globalization, liberalization, Malaysian ECS industry, Consulting
Engineers, government policies, mixed methodology, literature review, focus group,
questionnaire survey, Board of Engineers Malaysia, Registration of Engineers Act,
internationalization theories, strategies, Modified Internationalization Framework.

v
LIST OF ABBREVIATIONS
ABET Accreditation Board for Engineering and Technology
ACEM Association of Consulting Engineers Malaysia
AFAS ASEAN Framework Agreement on Services
AFTA ASEAN Free Trade Area
ANOVA Analysis of Variance
APEC Asia Pacific Economic Cooperation
ASEAN Association of South East Asian Nations
BAM Board of Architects Malaysia
BEM Board of Engineers Malaysia
BLS Bureau of Labour Statistics
BQSM Board of Quantity Surveyors Malaysia
CEs Consulting Engineers
CPD Continuous Professional Development
CIDB Construction Industry Development Board
DBA Doctor of Business Administration
EAC Engineering Accreditation Council
ECS Engineering Consulting Services
EIJS European Institute of Japanese Studies
ENR Engineering News – Record
ETP Economic Transformation Plan
EU European Union
EXIM Bank Export-Import Bank of Malaysia Berhad
FDI Foreign Direct Investment
FIDIC International Federation of Consulting Engineers
FTAs Free Trade Agreements
GATS General Agreement on Trade in Services
GATT General Agreement on Tariffs and Trade
GBATA Global Business and Technology Association
GDP Gross Domestic Product
vi
GNI Gross National Income
GOHK Government of Hong Kong
GOM Government of Malaysia
GOS Government of Singapore
GOT Government of Thailand
HICSS Hawaii International Conference on System Sciences
IEM Institution of Engineers, Malaysia
IMF International Monetary Fund
IMP3 Third Industrial Master Plan
IT Information Technology
M&As Mergers and Acquisitions
MATRADE Malaysia External Trade Development Corporation
MBAM Master Builders Association Malaysia
MFN Most Favoured Nation
MITI Ministry of International Trade and Industry
MNCs Multinational Corporations
MRA Mutual Recognition Agreement
MSTI Main Science and Technology Indicators
10MP 10th Malaysia Plan
NAFTA North American Free Trade Agreement
NAPSEC National Professional Services Export Council
NEAC National Economic Advisory Council
NIEs Newly Industrialized Economies
OECD Organization for Economic Co-operation and Development
PAE Professional Assessment Examination
PAM Pertubuhan Akitek Malaysia
PEMANDU Performance Management and Delivery Unit
PEs Professional Engineers
PRC People’s Republic of China
PSDC Professional Services Development Corporation
PSPs Professional Service Providers
RBV Resource-based View
REA Registration of Engineers Act 1967

vii
R&D Research and Development
RM Ringgit Malaysia
SMECM SME Corporation Malaysia
SMEs Small and Medium Enterprises
SPSS Statistical Package for the Social Sciences
S&T Science and Technology
TRIMS Trade-Related Investment Measures
TRIPS Trade-Related Intellectual Property Rights
UISE UNESCO Institute for Statistics in EdStats
UK United Kingdom
UNCTAD United Nations Conference for Trade and Development
UNDP United Nations Development Programme
UNESCO United Nations Educational, Scientific and Cultural Organization
US United States
USA United States of America
USD United States Dollar
USPTO United States Patent and Trademark Office
USTR United States Trade Representative
WTO World Trade Organization

viii
TABLE OF CONTENTS
Title Page
Declaration i
Acknowledgements ii
Abstract iii
List of Abbreviations v
Table of Contents viii
List of Tables xvi
List of Figures xix
CHAPTER ONE - INTRODUCTION
1.1 Introduction 1
1.2 Background to the Research 3
1.3 Justification for the Research and Contributions 4
1.4 The Research Problem 5
1.4.1 The Research Questions 6
1.4.2 The Research Propositions 6
1.4.3 The Research Objectives 7
1.5 Unit of Analysis 7
1.6 Research Methodology 8
1.6.1 Data Collection 8
1.6.1.1 The Literature Review 9
1.6.1.2 The Focus Group 10
1.6.1.3 The Questionnaire Survey 10
1.6.1.4 Data Analysis 11
1.6.1.5 Research Quality 11
1.7 Ethical Issues 12
1.8 Definition of Key Terms 12
1.9 Limitations 12
1.10 Structure of the Thesis 13
1.11 Conclusion 15

ix
CHAPTER TWO – LITERATURE REVIEW
2.1 Introduction 16
2.1.1 Purposes of this Review 16
2.1.2 Concept Map and Structure of Chapter Two 16
2.2 The Malaysian Context 20
2.2.1 The Malaysia’s Economic Structure 20
2.2.2 The Malaysia’s Economic Development 20
2.2.3 Brief History of Malaysian Engineering Consulting Practices 22
2.2.4 Conclusion 23
2.3 The Global Engineering Consulting Industry 23
2.3.1 Defining the Engineering Consulting Industry 23
2.3.2 The Engineering Consultancy Services 25
2.3.2.1 The Engineering Consulting Firms 28
2.3.2.2 The Engineering Consulting Market 29
2.3.2.3 The Engineering Consulting Market Size 31
2.3.2.4 The Global ECS Players 31
2.3.3 The Engineering Consulting Market Trends 32
2.3.3.1 Internationalization of Services 32
2.3.3.2 Offshore Outsourcing 33
2.3.3.3 Mergers and Acquisitions 33
2.3.4 Public Policy Support for Export 34
2.3.5 Conclusion 37
2.4 Internationalization and Globalization 37
2.4.1 The Meaning of Internationalization 37
2.4.2 The Forces of Globalization 39
2.4.2.1 Lowering of the Barriers to Trade and Investment 40
2.4.2.2 The Globalization of Services : The General Agreement on Trade in Services
43
2.4.3 Selected Internationalization Theories and Models 46
2.4.3.1 Stage Models of Internationalization 47
2.4.3.2 Network Perspective to Internationalization 52
2.4.3.3 Internationalization Framework for Service Firms 55

x
2.4.4 Conclusion 57
2.5 The Malaysian Engineering Consulting Industry 57
2.5.1 Registration of Engineers in Malaysia 57
2.5.2 Registration of Engineering Consulting Firms in Malaysia 61
2.5.2.1 Implication of the Registration of Engineers Act 1967
61
2.5.2.2 Comparative Legislations in Selected Regional Countries
62
2.5.3 Other Major Malaysian Engineering Organizations 64
2.5.3.1 The Institution of Engineers, Malaysia 64
2.5.3.2 The Association of Consulting Engineers Malaysia 64
2.5.4 The Malaysian Engineering Consulting Market 65
2.5.4.1 The Major Malaysian ECS Players 65
2.5.4.2 Malaysian ECS Export Performance 67
2.5.5 Challenges Faced By Internationalizing Malaysian ECS Firms
67
2.5.5.1 Global Competition 69
2.5.5.2 Global Mindset 71
2.5.5.3 Financial Capital 73
2.5.5.4 Human Capital 74
2.5.5.5 Innovation 77
2.5.6 Conclusion 78
2.6 The Malaysian Government Policies on Services Exports 79
2.6.1 The Malaysian Government’s Support for Services Exports 79
2.6.2 The Malaysian Government’s Service Support Delivery Framework
81
2.6.2.1 The Malaysian External Trade Development Corporation
82
2.6.2.2 Professional Services Development Corporation 82
2.6.2.3 National Professional Services Export Council 84
2.6.2.4 The SME Corporation Malaysia 85
2.6.2.5 The Export-Import Bank of Malaysia 86
2.6.3 The Effectiveness of the Malaysian Government’s Export Programmes
86

xi
2.6.4 Conclusion 87
2.7 The Competitive Positioning of the Malaysian ECS Industry 87
2.7.1 Threat of New Entrants 88
2.7.2 The Threat of Substitutes 89
2.7.3 The Bargaining Power of Buyers 89
2.7.4 Bargaining Power of Suppliers 90
2.7.5 Rivalry among Competitors 90
2.7.6 Conclusion 91
2.8 Secondary Data Analysis 91
2.8.1 Identification of the Research Gaps 91
2.8.2 Research Questions Development 92
2.8.3 The Research Objectives 95
2.8.4 The Research Propositions 95
2.9 Conclusion 96
CHAPTER THREE – RESEARCH METHODOLOGY
3.1 Introduction 98
3.1.1 Structure of Chapter Three 98
3.2 Research Approach 100
3.2.1 Justification to a Mixed Methodology 105
3.2.2 The Preferred Type of Mixed Methodology 107
3.2.3 Conclusion 109
3.3 The Research Design 110
3.3.1 Exploratory Research 111
3.3.2 Descriptive Research 111
3.3.3 Explanatory Research 112
3.3.4 The Preferred Research Design 112
3.3.5 Unit of Analysis 113
3.3.6 Conclusion 114
3.4 Data Collection Instruments 114
3.4.1 Secondary Data Collection 114
3.4.2 The Experience Survey 115
3.4.2.1 Selection of the Experience Survey Participants 116
xii
3.4.3 Use of Case Studies as a Data Collection Technique 116
3.4.3.1 Criteria of Case Selection 117
3.4.3.2 The Selected Cases 118
3.4.3.3 Salient Features of the Selected Cases 118
3.4.3.4 Collection of Data from the Case Firms 120
3.4.4 The Focus Group 120
3.4.4.1 Selection and Composition of the Focus Group 122
3.4.4.2 Planning the Focus Group Meeting 123
3.4.4.3 Conduct of the Focus Group 123
3.4.5 The Sample Survey 125
3.4.5.1 Questionnaire Surveys 125
3.4.5.2 Sampling 127
3.4.5.3 The Target Population and the Sample Size 129
3.4.5.4 Recruitment of the Survey Participants 130
3.4.5.5 Designing the Questionnaire 131
3.4.5.6 Attitude Rating Scales 134
3.4.5.7 Pretesting the Questionnaire 135
3.4.5.8 The Finalized Questionnaire 136
3.4.5.9 Administration of the Questionnaire 139
3.4.5.10 The Survey Responses 140
3.4.6 Conclusion 140
3.5 Research Quality 140
3.5.1 Reliability 140
3.5.2 Validity 141
3.5.2.1 External Validity 141
3.5.2.2 Internal Validity 142
3.5.2.3 Construct Validity 142
3.5.3 Triangulation 143
3.6 Data Analysis Procedures 144
3.6.1 Qualitative Data Analysis 144
3.6.1.1 Data Reduction 144
3.6.1.2 Data Display 145
3.6.1.3 Conclusion Drawing and Verification 145

xiii
3.6.2 Quantitative Data Analysis 146
3.7 Research Ethics 147
3.8 Conclusion 148
CHAPTER FOUR – DATA ANALYSIS
4.1 Introduction 150
4.1.1 Structure of Chapter Four 151
4.2 Data Analysis for Research Proposition 1 153
4.2.1 Analysis of the Focus Group Meeting 153
4.2.2 Analysis of Questionnaire Survey Responses 155
4.2.2.1 Statement 1 155
4.2.2.2 Statement 2 157
4.2.2.3 Statement 3 159
4.2.2.4 Statement 4 161
4.2.2.5 Analysis of the Combined Survey Responses to Proposition 1
163
4.2.3 Testing of Research Proposition 1 167
4.3 Data Analysis for Research Proposition 2 168
4.3.1 Analysis of the Focus Group Meeting 168
4.3.2 Analysis of Questionnaire Survey Responses 170
4.3.2.1 Statement 5 170
4.3.2.2 Statement 6 172
4.3.2.3 Statement 7 175
4.3.2.4 Statement 8 177
4.3.2.5 Analysis of the Combined Survey Responses to Proposition 2
179
4.3.3 Testing of Research Proposition 2 183
4.4 Data Analysis for Research Proposition 3 184
4.4.1 Analysis of the Focus Group Meeting 185
4.4.2 Analysis of Questionnaire Survey Responses 186
4.4.2.1 Statement 9 186
4.4.2.2 Statement 10 188
4.4.2.3 Statement 11 190

xiv
4.4.2.4 Statement 12 192
4.4.2.5 Analysis of the Combined Survey Responses to Proposition 3
195
4.4.3 Testing of Research Proposition 3 199
4.5 Analysis of Unplanned Data 199
4.6 Conclusion 200
CHAPTER FIVE – CONCLUSION
5.1 Introduction 201
5.2 Conclusions about Each Research Proposition 204
5.2.1 Research Proposition 1 204
5.2.2 Research Proposition 2 207
5.2.3 Research Proposition 3 209
5.3 Conclusions about the Research Problem 211
5.3.1 Summary 214
5.4 Implications for Theory 214
5.5 Implications for Policy and Practice 216
5.5.1 Implications for Policy 217
5.5.1.1 The Registration of Engineers Act 1967 218
5.5.1.2 A Dedicated ECS Support Agency 219
5.5.1.3 Additional Financial Support Measures 220
5.5.2 Implications for the Malaysian Engineering Consulting Services Industry
221
5.5.2.1 Venturing Abroad for Corporate Sustainability 221
5.5.2.2 Human Capital Development 222
5.5.2.3 Internationalization Strategy 223
5.5.2.4 Network Relationships 223
5.5.2.5 Mergers and Acquisitions 224
5.5.3 Summary 225
5.6 Research Limitations 225
5.7 Further Research 225
5.8 Conclusion 226

xv
BIBLIOGRAPHY 227
APPENDIX
APPENDIX A : Discussion Guide - Focus Group 261
APPENDIX B : Information Sheet - Focus Group 263
APPENDIX C : Consent Form - Focus Group 266
APPENDIX D : Information Sheet - Questionnaire 268
APPENDIX E : The Survey Questionnaire 271
APPENDIX F : Human Research Ethics Committee (HREC) Notification 275
APPENDIX G : Questionnaire Survey Responses (Raw Data) 278
APPENDIX H : Minutes of Focus Group Meeting 283

xvi
LIST OF TABLES
Chapter 2
Table 2.1 : Structure of Production, 2006 - 2010 20
Table 2.2 : The Characteristics of Professional Service Firms 25
Table 2.3 : Comparison between Engineering and Construction Services 27
Table 2.4 : Major Popular Types of Engineering Consulting Services 28
Table 2.5 : The Top 10 Global Engineering Design Firms in 2010 32
Table 2.6 : Company Needs and Export Promotion Programmes 36
Table 2.7 : Some Definitions of Internationalization 38
Table 2.8 : Forms of Economic Integration 42
Table 2.9 : Abridge Content of GATS 43
Table 2.10 : Modes of International Service Supply 45
Table 2.11 : Selected Innovation-Related Internationalization Models 51
Table 2.12 : Major Differences in Statutory Requirements 63
Table 2.13 : Gross Federal Government Development Expenditure (RM Billion)
66
Table 2.14 : Ten Major ECS Firms in Malaysia 66
Table 2.15 : Foreign Presence of Malaysian ECS Firms 68
Table 2.16 : Expenditure on Education (% of GDP) 75
Table 2.17 : Indicators of Technical Human Capital 76
Table 2.18 : Patents Granted by the USPTO 78
Table 2.19 : MATRADE Export Assistance Programmes 83
Table 2.20 : NAPSEC’s Terms of Reference 84
Table 2.21 : Identification of Research Gaps 93
Chapter 3
Table 3.1 : Principal Research Paradigms and Associated Views 103
Table 3.2 : Characteristics of Quantitative and Qualitative Paradigms 105
Table 3.3 : The Greene and Caracelli Designs for Mixed Methods Research
108
Table 3.4 : The Creswell & Plano Clark Mixed Method Design Types 108
Table 3.5 : Basic Research Designs 110

xvii
Table 3.6 : Emphasis of Case Study Research 117
Table 3.7 : Advantages of Case Studies 117
Table 3.8 : Salient Features of the Case Firms 119
Table 3.9 : Strengths and Weaknesses of Focus Groups 121
Table 3.10 : Discussion Guide and Topic Agenda for the Focus Group 124
Table 3.11 : Non-Probability Sampling Techniques 128
Table 3.12 : Three Attitude Rating Scales 134
Chapter 4
Table 4.1 : Cross Tabulation of Survey Responses – Statement 1 156
Table 4.2 : Case Summary – Statement 1 157
Table 4.3 : Multiple Comparisons between Groups for Statement 1 157
Table 4.4 : Cross Tabulation of Survey Responses – Statement 2 158
Table 4.5 : Case Summary – Statement 2 159
Table 4.6 : Multiple Comparisons between Groups for Statement 2 159
Table 4.7 : Cross Tabulation of Survey Responses – Statement 3 160
Table 4.8 : Case Summary – Statement 3 161
Table 4.9 : Multiple Comparisons between Groups for Statement 3 161
Table 4.10 : Cross Tabulation of Survey Responses – Statement 4 162
Table 4.11 : Case Summary – Statement 4 163
Table 4.12 : Multiple Comparisons between Groups for Statement 4 163
Table 4.13 : Cross Tabulation of Combined Survey Responses for Proposition 1
164
Table 4.14 : Case Summary for Proposition 1 165
Table 4.15 : Pearson Correlations between P1, Statements 1, 2, 3 and 4 166
Table 4.16 : Multiple Comparisons between Groups for Proposition 1 167
Table 4.17 : Cross Tabulation of Survey Responses – Statement 5 171
Table 4.18 : Case Summary – Statement 5 172
Table 4.19 : Multiple Comparisons between Groups for Statement 5 172
Table 4.20 : Cross Tabulation of Survey Responses – Statement 6 173
Table 4.21 : Case Summary – Statement 6 174
Table 4.22 : Multiple Comparisons between Groups for Statement 6 174
Table 4.23 : Cross Tabulation of Survey Responses – Statement 7 175

xviii
Table 4.24 : Case Summary – Statement 7 176
Table 4.25 : Multiple Comparisons between Groups for Statement 7 177
Table 4.26 : Cross Tabulation of Survey Responses – Statement 8 178
Table 4.27 : Case Summary – Statement 8 179
Table 4.28 : Multiple Comparisons between Groups for Statement 8 179
Table 4.29 : Cross Tabulation of Combined Survey Responses for Proposition 2
180
Table 4.30 : Case Summary for Proposition 2 181
Table 4.31 : Pearson Correlations between P2, Statements 5, 6, 7 and 8 182
Table 4.32 : Multiple Comparisons between Groups for Proposition 2 183
Table 4.33 : Cross Tabulation of Survey Responses – Statement 9 186
Table 4.34 : Case Summary – Statement 9 187
Table 4.35 : Multiple Comparisons between Groups for Statement 9 188
Table 4.36 : Cross Tabulation of Survey Responses – Statement 10 189
Table 4.37 : Case Summary – Statement 10 190
Table 4.38 : Multiple Comparisons between Groups for Statement 10 190
Table 4.39 : Cross Tabulation of Survey Responses – Statement 11 191
Table 4.40 : Case Summary - Statement 11 192
Table 4.41 : Multiple Comparisons between Groups for Statement 11 192
Table 4.42 : Cross Tabulation of Survey Responses – Statement 12 193
Table 4.43 : Case Summary – Statement 12 194
Table 4.44 : Multiple Comparisons between Groups for Statement 12 194
Table 4.45 : Cross Tabulation of Combined Survey Responses for Proposition 3
195
Table 4.46 : Case Summary for Proposition 3 197
Table 4.47 : Pearson Correlations between P3, Statements 9, 10, 11 and 12 198
Table 4.48 : Multiple Comparisons between Groups for Proposition 3 198
Chapter 5
Table 5.1 : Response Pattern to Research Proposition 1 205
Table 5.2 : Response Pattern to Research Proposition 2 207
Table 5.3 : Response Pattern to Research Proposition 3 210
Table 5.4 : Investigation of Research Issues 213

xix
LIST OF FIGURES
Chapter 1
Figure 1.1 : The Structure of Chapter One 2
Figure 1.2 : The Research Master Plan 9
Figure 1.3 : Thesis Chapter Structure 14
Chapter 2
Figure 2.1 : The Concept Map of Chapter Two 17
Figure 2.2 : The Structure of Chapter Two 19
Figure 2.3 : Malaysia’s Economic Transformation 21
Figure 2.4 : Market Sector 30
Figure 2.5 : Contributions of Design Markets 30
Figure 2.6 : The Basic Mechanism of Internationalization 48
Figure 2.7 : The Establishment Chain of International Involvement 49
Figure 2.8 : Basic Structure of the Network Model 53
Figure 2.9 : Internationalization Framework for Service Firms 56
Figure 2.10 : The Value Chain of Malaysian Engineer’s Development 59
Figure 2.11 : Regional Breakdown of Malaysian ECS Firms and Their Foreign Markets
68
Figure 2.12 : Challenges Faced By Internationalizing Malaysian ECS Firms
69
Figure 2.13 : Porter’s Three Generic Strategies 70
Figure 2.14 : Sources of Superior Performance in Exporting 71
Figure 2.15 : The Two Dimensions of Global Mindset 72
Figure 2.16 : Conceptual Model of Human Capital Investment, Human Capital Effectiveness and Firm Performances
75
Figure 2.17 : The Innovation Value Chain 78
Figure 2.18 : The Projected Services Sector Growth and Share to GDP for 10MP
80
Figure 2.19 : High Potential Business Services Sub-Segments 81
Figure 2.20 : Porter’s Five Competitive Forces 88

xx
Chapter 3
Figure 3.1 : Structure of Chapter Three 99
Figure 3.2 : Approaches to Theory-Development Research 101
Figure 3.3 : The Research Process 101
Figure 3.4 : Influences on Business Research 102
Figure 3.5 : The Three Major Research Paradigms, Including Subtypes of Mixed Methods Research
106
Figure 3.6 : Morgan Priority-Sequence Model of Mixed Method 109
Figure 3.7 : The Preferred Research Design 113
Figure 3.8 : Data Collection Plan 115
Figure 3.9 : Composition of the Survey Sample 131
Figure 3.10 : Questionnaire Design Process 132
Figure 3.11 : Likert Scale and Score Assigned for the Survey 135
Figure 3.12 : Qualitative Data Analysis 145
Figure 3.13 : Quantitative Data – Preparation Process 146
Chapter 4
Figure 4.1 : Structure of Chapter Four 152
Figure 4.2 : Combined and Re-coded Reponses to Statement 1 156
Figure 4.3 : Combined and Re-coded Reponses to Statement 2 158
Figure 4.4 : Combined and Re-coded Reponses to Statement 3 160
Figure 4.5 : Combined and Re-coded Reponses to Statement 4 162
Figure 4.6 : Combined and Re-coded Reponses to Proposition 1 164
Figure 4.7 : Combined and Re-coded Reponses to Proposition 1 by Groups
165
Figure 4.8 : Group Mean Ratings to Proposition 1 166
Figure 4.9 : Combined and Re-coded Responses to Statement 5 171
Figure 4.10 : Combined and Re-coded Responses to Statement 6 173
Figure 4.11 : Combined and Re-coded Responses to Statement 7 176
Figure 4.12 : Combined and Re-coded Responses to Statement 8 178
Figure 4.13 : Combined and Re-coded Responses to Proposition 2 180
Figure 4.14 : Combined and Re-coded Reponses to Proposition 2 by Groups
181

xxi
Figure 4.15 : Group Mean Ratings to Proposition 2 182
Figure 4.16 : Combined and Re-coded Responses to Statement 9 187
Figure 4.17 : Combined and Re-coded Responses to Statement 10 189
Figure 4.18 : Combined and Re-coded Responses to Statement 11 191
Figure 4.19 : Combined and Re-coded Responses to Statement 12 193
Figure 4.20 : Combined and Re-coded Responses to Proposition 3 195
Figure 4.21 : Combined and Re-coded Reponses to Proposition 3 by Groups
196
Figure 4.22 : Group Mean Ratings to Proposition 3 197
Chapter 5
Figure 5.1 : Structure of Chapter Five 203
Figure 5.2 : Modified Internationalization Framework for Malaysian ECS Firms
217

1
CHAPTER ONE – INTRODUCTION
1.1 Introduction
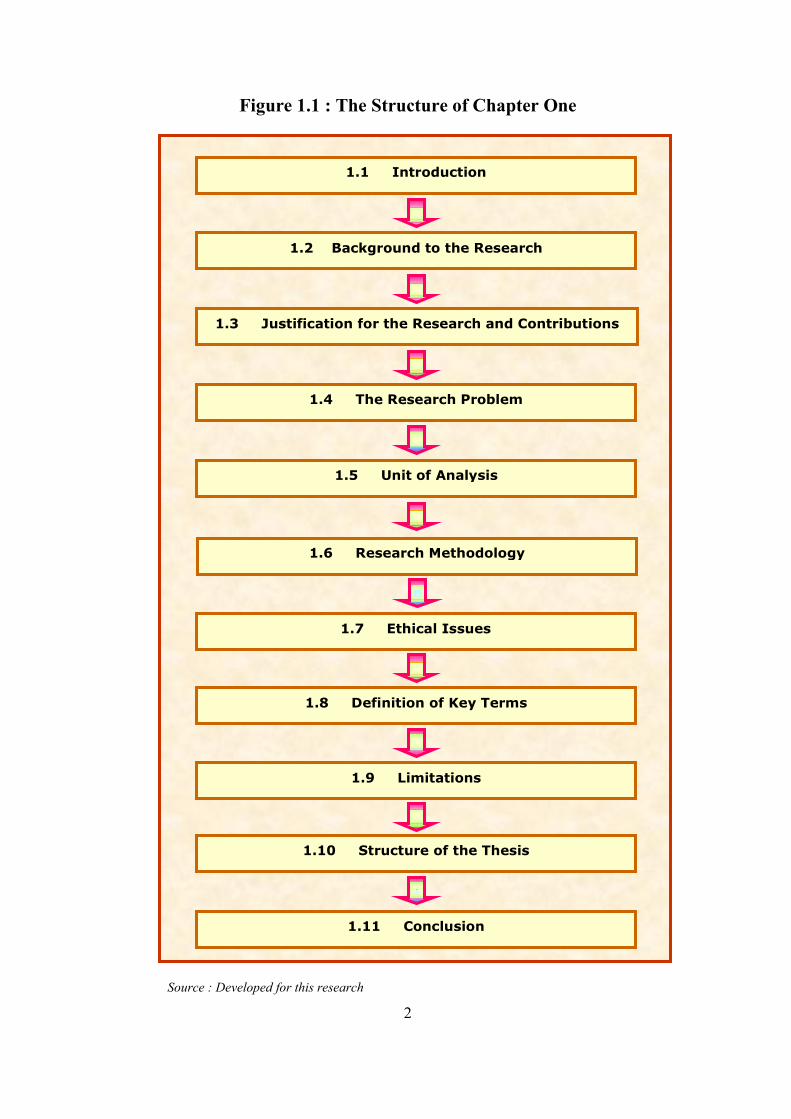
This Chapter provides an overview of the thesis titled ‘The Internationalization of
Malaysian Engineering Consulting Services Firms’. Guided by Perry (2002), the Chapter
has 11 Sections as shown in Figure 1.1.
This Section introduces the Chapter and presents the chapter structure.
Section 1.2 presents the background to the research based on the preliminary literature
review. It reflects the significant role played by the Malaysian engineering consulting
services (ECS) firms in Malaysia’s economic development.
Section 1.3 discusses the challenges that Malaysian ECS firms face in an increasingly
globalized and liberalized world. It highlights the pertinent research issues and justifies
the need for the research.
Section 1.4 states the research problem, the research questions, the research propositions
and the research objectives.
Section 1.5 presents the unit of analysis for the research.
Section 1.6 provides an overview of the research design and research methodology. It
also outlines the collection of secondary and primary data and their analysis.
Section 1.7 addresses the ethical issues related to the conduct of the research.
Section 1.8 defines the key terms used in the research.
2
Figure 1.1 : The Structure of Chapter One
Source : Developed for this research
1.1 Introduction
1.2 Background to the Research
1.3 Justification for the Research and Contributions
1.4 The Research Problem
1.5 Unit of Analysis
1.6 Research Methodology
1.7 Ethical Issues
1.8 Definition of Key Terms
1.9 Limitations
1.10 Structure of the Thesis
1.11 Conclusion

3
Section 1.9 outlines the limitations of the research.
Section 1.10 depicts the structure of the thesis and briefly discusses each of the five
chapters.
Section 1.11 presents the conclusion of this Chapter.
1.2 Background to the Research
Malaysia gained independence in 1957. Since then the Malaysian ECS industry has
played an increasingly important role in the economic development of the country. In the
sixties and seventies, the Malaysian engineers benefited from technology transfers from
foreign ECS firms through partnership. This enabled them to advance their skills and
expertise to meet world-class standards and to undertake a variety of mega projects
(Accenture 2010; Chelvanayagam 1994; IEM 2001; Judin 2001; Moggie 2000). Some
notable projects were the North-South Highway, Penang Bridge, Petronas Twin Towers,
Kuala Lumpur International Airport and Light Rail Transit Systems (Hamdan 1999).
The Malaysian ECS industry is highly regulated and protected under the Registration of
Engineers Act 1967 (REA). Only qualified Malaysian professional engineers (PEs) are
permitted to submit building plans to regulatory authorities (Chiam 2009b). Foreign ECS
firms can only operate and undertake projects in Malaysia under joint-venture
arrangements with local ECS firms (USTR 2010).
The Malaysian ECS industry’s primary revenue source is the Government’s spending on
infrastructure development. This accounted for 40% to 60% of the industry income
(Accenture 2010). However, the total revenue declined in 2009 due to a sharp drop in
domestic private investment and foreign direct investment (FDI) caused by the worldwide
financial crisis of 2008 / 2009 (GOM 2009). The market size of the Malaysian ECS
industry was estimated to range from 1.59 to 2.39 billion Ringgit Malaysia (RM) in 2009
(Accenture 2010).

4
The larger Malaysian ECS firms have average total staff strength of about 500. These
include Sepakat Setia Perunding Sdn Bhd, Minconsult Sdn Bhd, HSS Integrated Sdn Bhd
and SMHB Sdn Bhd. These multidisciplinary firms offer civil, mechanical and electrical
engineering services. Notwithstanding, the Malaysian ECS industry largely comprises
small firms.
The available literature on the export performance of Malaysian ECS firms indicates that
the actual exports of Malaysia ECS firms are very small (Looi 2003). This could be due
to Malaysian ECS firms preferring the comfort zone of the domestic market rather than to
venture into the highly competitive and unfamiliar international markets (Wong 2000;
IEM 2001). However, due to the small domestic market, Malaysian ECS firms are
increasingly participating in global projects particularly in the Association of South East
Asian Nations (ASEAN) region, other Asian countries and the Middle East (Wong 2000).
1.3 Justification for the Research and Contributions
The global market place for trade and services is being rapidly liberalized with the
implementation of the General Agreement on Trade in Services (GATS) under the World
Trade Organization (WTO) (OECD 2002). This has generated intense competition in the
ECS industry worldwide which is impacting on the Malaysian ECS firms venturing
abroad (Wong 2000). The Malaysian Government targets to achieve full liberalization of
the ECS sector by the end of 2012 (Chuah 2009, 2010; Mohamed 2010).
The Malaysian Third Industrial Master Plan (IMP3) 2006 – 2020 targets the service sector
as the main growth engine of the economy. The professional services are one of the eight
services sub-sectors identified for further development. This includes the enhancement of
the competitiveness of the services sectors through the progressive liberalization and
promotion of export of services (GOM 2006a).
The services sector is projected to grow at 7.2% annually until 2015, with its contribution
to gross domestic product (GDP) increasing to 61.1%. This hinges on the Government
enhancing the capabilities of the domestic services providers to prepare them for the
competitive challenges emerging from trade liberalization (GOM 2010b).

5
As the ECS is the sector with the highest potential for economic impact (GOM 2010c),
the Government is supporting it with market intelligence, networks and government-to-
government agreements (GOM 2010b). However, the findings of prior research on the
effectiveness of Government export support programmes and initiative are contradictory
and inconclusive (Ahmed et al. 2002; Mahajar 2005; Mahajar & Junus 2006).
The findings of a study conducted by Hamdan (1999) were considered significant for this
research as they focused on the competitiveness of Malaysian engineering consulting
services and its future trends. However, these have since been overtaken by the
subsequent dynamic changes in the international market for consulting services, following
the implementation of the World Trade Organization and regional free trade agreements.
This research was therefore justified on the grounds that the findings would:
i) Extend the scholarship on issues relating to the Malaysian ECS industry,
ii) Offer recommendations for improving the export policies, incentives and
programmes of the Malaysian Government for encouraging Malaysian ECS firms
to internationalize their operations.
iii) Offer recommendations for improving the internationalization strategies of the
Malaysian ECS firms.
1.4 The Research Problem
‘The research process begins with problem discovery and identifying the problem is the
first step toward its solution’ (Zikmund 2000, p. 56). Problem definition or problem
statement is ‘a clear, precise and succinct statement of the question or issue that is to be
investigated with the goal of finding an answer or solution’ (Sekaran 2003, p. 70).
Accordingly, the research problem is stated as:
“What are the Important Critical Factors for the Successful
Internationalization of Malaysian ECS Firms?”

6
1.4.1 The Research Questions
Research questions are the translations of the research problem into specific enquiries
(Zikmund et al. 2010). They are ‘refined statements of the specific components of the
problem’ (Malhotra 2010, p. 84). A well stated research question guides the researcher to
stay on track and indicates what data to be collected to answer the questions.
Accordingly, three research questions were developed in Chapter Two on the basis of the
gaps identified in the existing body of knowledge and these are:
Research Question 1
What is the competitive global positioning of the Malaysian ECS firms in the context of
market liberalization?
Research Question 2
How adequate and effective are the existing Malaysian Government support programmes
for the internationalization of Malaysian ECS firms?
Research Question 3
What are the appropriate corporate strategies for the Malaysian ECS firms to successfully
enter new international markets?
1.4.2 The Research Propositions
Propositions are statements of relationships among concepts (Zikmund et al. 2010;
Maxfield & Babbie 2007; Berg 2009). A proposition is a testable statement (Denzin
1978). Guided by these authorities, the three research questions were translated to three
Research Propositions for empirical testing. These are:
Research Proposition 1
The Malaysian ECS firms are well positioned for global competitive advantage in the
liberalizing global markets.
Research Proposition 2

7
The Malaysian Government has effective targeted support policies and programmes to
assist Malaysian ECS firms with their internationalization effort.
Research Proposition 3
The exporting Malaysian ECS firms have appropriate strategies for successfully entering
new international markets.
1.4.3 The Research Objectives
The research objectives explain the purpose of the research and define what the research
tries to achieve (Zikmund et al. 2010). Based on the research questions and Research
Propositions, this research has three objectives.
Research Objective 1
To determine the competitive positioning of the Malaysian ECS firms in the context of
the forces of market liberalization.
Research Objective 2
To examine the adequacy and effectiveness of the existing Malaysian Government’s
support programmes for the internationalization of the Malaysian ECS firms.
Research Objective 3
To recommend the appropriate corporate strategies for adoption by the Malaysian ECS
firms to successfully enter new international markets.
1.5 Unit of Analysis
The unit of analysis for the research indicates ‘who should provide the data and at what
level of aggregation’ (Zikmund et al. 2010, p. 119). In view of the time, costs and
resource limitations, the unit of analysis of this study comprised the Malaysian ECS firms,
located mainly in Kuala Lumpur and the Klang Valley areas.

8
1.6 Research Methodology
‘Empirical research in social science proceeds in a variety of settings and contexts. The
choice of a design setting for any research project is generally a vital concern of the
researcher’ (Miller 1991, p. 21). Within the constraints of time and other resources,
‘there will usually be only one major methodology which suits the research problem and
associated research gaps’ (Perry 2002, p. 28).
The researcher examined the qualitative and quantitative paradigms and adopted the
mixed methodology (Cameron & Molina–Azorin 2010; Gill & Johnson 2010; Johnson,
Onwuegbuzie & Turner 2007; Johnson & Turner 2003; Morgan 1998). This is a
combination of qualitative/inductive and quantitative/deductive approaches that build on
the strengths and minimize the weaknesses of both (Denzin 1978; Steckler et al. 1992).
This research used both approaches in a complementary manner to build upon each
other’s findings (Greene & Caracelli 1997; Morgan 1998).
The data collection process involved two stages (Creswell & Plano Clark 2007; Morgan
1998) with the first being principally qualitative and exploratory in nature for theory
generation. The second was quantitative and descriptive to generalize the findings (Perry
1995). Notwithstanding, the research was largely qualitative and exploratory in nature.
The research was guided by a master plan as shown in Figure 1.2. The master plan
depicts the dimensions of the research, the selected data collection instruments, the
sources of data and the analysis procedures.
1.6.1 Data Collection
The collection of the secondary data through a comprehensive literature review is detailed
in Chapter Two. The primary data collection techniques for this research are discussed in
Chapter Three. These were a Focus Group meeting for the collection of qualitative data
and a Questionnaire Survey to obtain pertinent quantifiable data for the descriptive
research.

9
Figure 1.2 : The Research Master Plan
Source : Developed for this research
1.6.1.1 The Literature Review
The research as detailed in Chapter Two commenced with a detailed review of the
existing scholarship and the literature on the Malaysian context and public policies as
well as the background and focal theories (Phillips & Pugh 2005). The background
theories are the Malaysian contextual setting, globalization and internationalization
theories and trends in the global engineering consulting industry. The focal theories of
the research are the Malaysian government’s policies and the Malaysian civil, mechanical
and electrical engineering consulting industries. The aim, as suggested by Perry (2002),
was to build a theoretical foundation to serve as a basis for the research.
Literature Review
Stage One Qualitative
(Exploratory)
Stage Two Quantitative (Descriptive)
Secondary Data
Collection
Experience Survey
Focus Group
Questionnaire
Survey
Qualitative
Data Analysis
Quantitative Data
Analysis
Findings

10
The review identified the key research issues and the gaps in the body of knowledge.
This permitted the development of the research questions and the research propositions
for the testing by the research.
1.6.1.2 The Focus Group
A focus group is a group interview that capitalizes on group dynamics and interactions in
the communication between research participants in order to generate data (Kitzinger
1995). It is particularly useful for exploring people’s knowledge and experiences
(Kitzinger 1995) and in obtaining the participants’ views, impressions and opinions on
research issues (Sekaran 2003). For this reason and as discussed in Sub-Section 3.4.4, a
focus group was selected as a data collection technique to supplement the literature
review for the exploratory stage of this research.
1.6.1.3 The Questionnaire Survey
The questionnaire survey is a technique for collecting data in which a respondent is
required to answer the same set of questions in a predetermined way (De Vaus 2002).
Accordingly, this research used a structured questionnaire to ensure ‘comparability of the
data, increase speed and accuracy of recording, and facilitate data processing’ (Malhotra
2010, p. 335). It was based on five-point Likert attitude rating scale. The questionnaires
were self-administered by the respondents (Zikmund et al. 2010). The questionnaires
were pre-tested by an ‘experience survey’ comprising five knowledgeable persons.
The target population comprised the Malaysian consulting engineers (CEs), the regulatory
authorities and the contractors who utilized the ECS in their overseas projects. 180
persons were identified, based on judgemental and quota sampling, from the target
population to participate in the questionnaire survey. The recruitment process is detailed
in Sub-Section 3.4.5.4.
11
1.6.1.4 Data Analysis
The secondary data, collected through a comprehensive literature review, was analyzed to
identify gaps in the existing body of knowledge on the pertinent issues of the research
topic. The identified research gaps permitted the reaffirmation of the relevance of the
research problem, the development of the research questions and the crafting of the three
research propositions for testing by this research.
The qualitative data collected through a focus group meeting were condensed into
analytical categories on the basis of themes or concepts. The reduced data were displayed
in the form of matrices, graphs, charts and networks to facilitate the interpretation of data
and making of conclusions (Miles & Huberman 1994).
The quantitative data, collected through the questionnaire survey was analyzed through
the use of the Statistical Package for the Social Sciences (SPSS) Version 19 statistical
software. Guided by Manning and Munro (2007), the analysis techniques produced the
following outputs:
• Cross tabulations;
• Combined and re-coded responses;
• Case summaries;
• Group mean responses;
• ANOVA multiple comparisons;
• Pearson Product Moment Correlations; and
• Principal components analysis.
1.6.1.5 Research Quality
Research findings must be trustworthy and laden with scientific rigour (Bryman & Bell
2007; Neuman 2006). These relate to issues of reliability, validity and triangulation as
discussed in details in Section 3.5.

12
1.7 Ethical Issues
‘Research has an ethical-moral dimension’ (Neuman 2006, p. 129). Research ethics
ensure that research activities do not cause harm to participants or have any adverse
consequences (Cooper & Schindler 2006; Ticehurst & Veal 1999; Zikmund et al. 2010).
Diener and Crandall (1978) considered research ethics to comprise four main areas: 1)
right to privacy, 2) informed consent, 3) deception and 4) harm to participants.
This research was conducted in compliance with the National Statement on Ethical
Conduct in Human Research (2007) and was approved by the Human Research Ethics
Committee of Southern Cross University (Approval Number ECN-10-223). Details of
ethical issues considered in the research are explained in Section 3.7.
1.8 Definition of Key Terms
This Section provides the definitions of some of the key terms used in this research.
More detailed description of other important terms appears in various Chapters of the
thesis.
• Internationalization is ‘the process by which firms both increase their awareness
of the direct and indirect influence of international transactions on their future,
and establish and conduct transactions with other countries’ (Beamish 1990, p.
77).
• Globalization is ‘the flow of technology, economy, knowledge, people, values,
ideas …… across borders. Globalization affects each country in a different way
due to a nation’s individual history, traditions, culture and priorities’ (Knight
1997, p. 6).
1.9 Limitations

13
The focus group meeting and the questionnaire survey participants were located mainly in
Kuala Lumpur and Klang Valley region. This was a limitation as the findings might not
be transferable and generalized for the whole of Malaysia.
The researcher relied on judgemental and quota sampling for the selection of the
participants in the questionnaire survey. While this was necessary, given the small
number of the ECS firms and knowledgeable participants, the researcher acknowledges
that the selection process could have created an element of ‘survey bias’.
Another limitation is that the research was largely exploratory and qualitative in nature.
Even though it was complemented with quantifiable data through a questionnaire survey,
the findings, being mainly inductive, might not be appropriate for generalization.
1.10 Structure of the Thesis
This thesis adopted a unified structure (Easterby-Smith, Thorpe & Lowe 2002) with five
chapters (Perry 2002) as shown in Figure 1.3.
Chapter One sets the scene for the research. It describes the research background, the
justification of the research, its contributions, the research problem, the research questions
and the research propositions. The unit of analysis, research methodology, ethical issues,
definitions of key terms, limitations of the study and thesis chapter structure are briefly
outlined.
Chapter Two reviews the relevant literature on the background and focal theories
(Phillips & Pugh 2005) with the primary aim to build a theoretical foundation for the
research. These are the scholarship on Malaysian economy, globalization and
internationalization and global engineering consulting industry. It then presents the
Malaysian Government’s policies and the support extended to the Malaysian ECS
industry. The research issues and gaps on the existing body of knowledge were identified,
followed by the development of research questions and the crafting of three research
propositions for testing by the research.

14
Figure 1.3 : Thesis Chapter Structure
Source : Developed for this research
Chapter Three discusses the methodology for the research. It examines the various
research paradigms, and justifies the use of the mixed method methodology. It also
justifies the two stages design approach. The first and dominant stage is qualitative and
exploratory with the second complementary stage being quantitative and descriptive. The
data collection instruments are then discussed; namely an experience survey, a focus
group and questionnaire survey. The data analysis processes and the ethical issues
pertinent to the research are also presented.
Chapter Four analyzes the collected primary data from the focus group meeting and the
questionnaire survey. These relate to the three research propositions and the 12 statements
that were in the questionnaire. The chapter also presents the unplanned data that emerged
from the focus group meeting.
Chapter One Introduction
Chapter Two Literature Review
Chapter Three Research
Methodology
Chapter Four Data Analysis
Chapter Five Conclusion

15
Chapter Five presents the conclusions based on the research findings in respect of each
research proposition and the research problem. This includes a comparative analysis of
the research findings with those of the literature reviewed in Chapter Two and then
presents the implications of the research for theory development, policy formulation and
practice. It then offers recommendations for the successful internationalization of the
Malaysian ECS firms, and proposes new theory development. Suggestions are also
offered for future research.
1.11 Conclusion
This Chapter laid the foundation for the research. It introduced the research topic, the
research problem, the research questions and the research propositions. It justified the
need for the research and identified its contributions to scholarships, policy and practice.
It then selected the research paradigms, the research approach, the research design and the
data collection instruments. The Chapter also introduced the measures to improve
research quality and address ethical concerns. The next Chapter presents the literature
review for identifying the key research issues and the gaps in the existing body of
knowledge.

16
CHAPTER TWO – LITERATURE REVIEW
2.1 Introduction
The earlier Chapter discussed the justification for a study on the research problem “What
are the important critical factors for the successful internationalization of Malaysian ECS
firms?”. The research process commenced with a literature review of the accumulated
prior knowledge on the research topic.
2.1.1 Purposes of this Review
The literature review helps the investigator to familiarize the extant knowledge on the
research topic and to assist the investigator to conceptualize the research with precision
and clarity (Neuman 2006). ‘The literature review is not an end in itself, but is a means to
the end of identifying the worthy research issues’ (Perry 2002, p. 19). Guided by Marshall
and Rossman (1999), Baker (2000), Sekaran (2003), Perry (2002) and Neuman (2006),
the review aims to achieve the following objectives:
i) To demonstrate the significance of the research problem;
ii) To identify the key research issues and the emerging themes that influences the
problem situation;
iii) To link the proposed study to prior research;
iv) To develop a theoretical framework for the study;
vi) To identify gaps in the existing body of knowledge for developing the research
questions and crafting the research propositions for testing by the research.
2.1.2 Concept Map and Structure of Chapter Two
The review was facilitated by a concept map shown in Figure 2.1, which depicts the
linkages between the key research issues and the background and focal theories (Phillips
& Pugh 2005). The background theories are the Malaysian contextual setting,

17
globalization, internationalization theories and models, and trends in the global
engineering consulting industry. The focal theories of the research are the Malaysian
Government’s policies and the Malaysian civil, mechanical and electrical engineering
consulting industries.
Figure 2.1 : The Concept Map of Chapter Two
Source : Developed for this research
Background Theories
Focal Theories
Global Engineering
Consulting Industry Market Characteristics,
Market Players, Competition and Industry Trends
Introduction
Malaysian Engineering Consulting Industry
Practices, Market and Players
Malaysian Context Economy, History of
ECS Practices
Internationalization and Globalization
Theories and Models
Global Competitive Positioning Malaysian Engineering Consulting Industry
Secondary Data Analysis
Theoretical Gaps Research Questions
Research Propositions
Conclusion
Malaysian Government Policies
Export Incentives, MATRADE, SME Corporation

18
On the basis of the concept map, the structure of Chapter Two consists of nine sections as
shown in Figure 2.2.
Section 2.1 introduces the literature review and the concept map.
Section 2.2 discusses the Malaysian economy and a brief history of Malaysian ECS
practices to provide the contextual setting for the review.
Section 2.3 reviews the global engineering consulting industry. It examines the market
characteristics, the market players, the competition in the international arena and the
industry trends.
Section 2.4 examines the forces of globalization and selected internationalization theories
and models.
The structure of the Malaysian engineering consulting industry, its practices, market and
players are discussed in Section 2.5.
Section 2.6 discusses the Malaysian government policies and legislations on engineering
consultancy services and the support provided for the exports of services.
Section 2.7 analyses the competitive positioning of the Malaysian engineering consulting
industry using Porter’s Five Forces Framework.
Section 2.8 analyses the findings of the literature review in respect of the research
problem. It then identifies the research gaps which are the basis for developing the
research questions and crafting the research propositions for testing by this research.
Section 2.9 concludes the Chapter.

19
Figure 2.2 : The Structure of Chapter Two
Source : Developed for this Research
2.1 Introduction Purpose, Concept Map, Chapter Structure
2.2 The Malaysian Context Economic Development and History of ECS Practices
2.3 The Global Engineering Consulting Industry Market Characteristics, Market Players, Competition and
Industry Trends
2.4 Internationalization and Globalization Theories and Models
2.6 The Malaysian Government Policies on Services Exports Institutional Structure, Statutory Requirements, Adequacy
2.5 The Malaysian Engineering Consulting Industry Practices, Markets and Players
2.8 Secondary Data Analysis Theoretical Gaps, Research Questions, Research Propositions
2.7 The Competitive Positioning of the Malaysian ECS Industry Malaysian Engineering Consulting Industry
2.9 Conclusion

20
2.2 The Malaysian Context
The primary purpose of this Section is to place the research in its contextual setting (Perry
2002). This is considered necessary as the country’s multi-ethnicity, the national
economic development and history of Malaysian ECS practices impact on the research
topic.
2.2.1 The Malaysia’s Economic Structure
Malaysia is a Federation of thirteen states and three Federal Territories. Eleven states are
in the Malay Peninsula or West Malaysia and the other two states in East Malaysia. As a
multi-ethnic, multi-religious and multicultural country, it had a population of 28.25
million people in 2010 (GOM 2010a).
The structure of production of the Malaysian economy, as measured by the share of GDP,
is shown in Table 2.1. The services sector was the largest contributor to GDP at 58.0%,
followed by manufacturing (26.7%), agriculture (7.5%), mining (7.5%) and construction
(3.3%). The services sector also was a driver of GDP growth in the last 5 years (GOM
2010a).
Table 2.1 : Structure of Production, 2006 – 2010
Sector
Share of GDP (%) Contribution to GDP Growth (%)
2006 2007 2008 2009p 2010f 2006 2007 2008 2009p 2010f
Agriculture 7.9 7.5 7.5 7.7 7.5 5.2 1.3 4.3 0.4 3.8
Mining 8.8 8.5 7.9 7.7 7.5 -1.0 2.0 -2.4 -3.8 3.2
Manufacturing 30.9 29.9 28.9 26.6 26.7 6.7 2.8 1.3 -9.4 6.2
Construction 3.1 3.1 3.1 3.3 3.3 -0.3 7.3 4.2 5.8 5.0
Services 52.0 53.8 55.2 57.6 58.0 7.4 10.2 7.4 2.6 6.6
Source : Adapted from GOM (2010a) p : preliminiary
f : forecast
2.2.2 The Malaysia’s Economic Development
21
The Malaysian Government is central to the social and economic development of the
country by playing the role of the initiator, facilitator and implementer of development
projects. Responsible for institutional and basic infrastructure development, public
policies are aimed at providing a stable and conclusive macroeconomic environment to
support private sector involvement in the economy. The Malaysian Government
emphasizes on providing basic education, health, amenities and utilities and attaches
importance to addressing the issues of poverty and economic wealth distribution
(Yogeesvaran 2004).
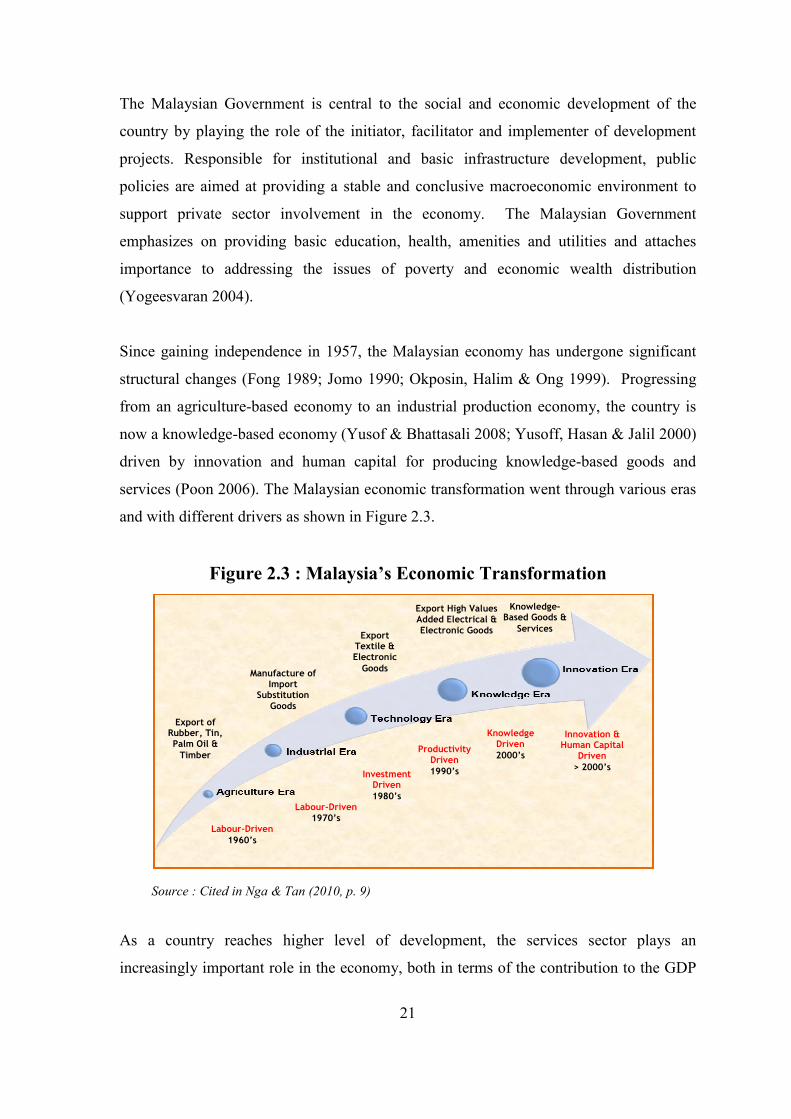
Since gaining independence in 1957, the Malaysian economy has undergone significant
structural changes (Fong 1989; Jomo 1990; Okposin, Halim & Ong 1999). Progressing
from an agriculture-based economy to an industrial production economy, the country is
now a knowledge-based economy (Yusof & Bhattasali 2008; Yusoff, Hasan & Jalil 2000)
driven by innovation and human capital for producing knowledge-based goods and
services (Poon 2006). The Malaysian economic transformation went through various eras
and with different drivers as shown in Figure 2.3.
Figure 2.3 : Malaysia’s Economic Transformation
Source : Cited in Nga & Tan (2010, p. 9)
As a country reaches higher level of development, the services sector plays an
increasingly important role in the economy, both in terms of the contribution to the GDP
Labour-Driven
1960’s
Export of Rubber, Tin, Palm Oil &
Timber
Manufacture of Import
Substitution Goods
Export Textile & Electronic
Goods
Export High Values Added Electrical & Electronic Goods
Knowledge-Based Goods &
Services
Labour-Driven 1970’s
Investment Driven
1980’s
Knowledge Driven
2000’s
Innovation & Human Capital
Driven
> 2000’s
Productivity Driven
1990’s

22
and the share of employment (Mahbob 1992; GOM 2006b). The services sector is
essential to the national development strategy to re-structure the economy based on
domestic sources of growth (Kanapathy 2003).
The Third Industrial Master Plan (IMP3) 2006–2020, emphasizes the services sector as
the main growth engine of the economy (GOM 2006a). The business and professional
services are one of the eight services sub-sectors identified in IMP3 for further
development. This includes a more proactive approach in the promotion and export of
services (GOM 2006a; Kanapathy 2003).
The 10th Malaysia Plan (2011-2015) currently in force also emphasizes on expanding the
export of services in line with the Economic Transformation Plan (ETP). Introduced by
the Government in 2010, the ETP incorporates fundamental strategic and economic
reform initiatives (GOM 2010b). As discussed in Sub-Section 2.6.1, business service is
one of the twelve targeted sectors in the ETP for shifting Malaysia to a high income
economy.
2.2.3 Brief History of Malaysian Engineering Consulting Practices
Prior to Malaysia gaining independence in 1957, there were very few Malaysian
engineers (Judin 2001) and British expatriate engineers were employed in the public
sector to undertake public projects in the civil, mechanical and electrical disciplines. For
private projects and investments, the ECS were mainly undertaken by British engineering
consulting firms (Hamdan 1999). After independence, the local Malaysian engineers
gradually replaced the British expatriates. The successive implementation of the Five
Year Malaysian Development Plans since 1957 created an elite pool of engineers both in
the public and private sectors. The First and Second Industrial Master Plans, covering the
period from 1986 to 2005 boosted engineering education as both Plans propelled
Malaysia into the industrial age (Hamdan 1999).
Malaysian consultants were initially employed for physical infrastructure projects
encompassing roads, bridges, drainage, irrigation, power generation, marine facilities and
housing projects. The demand for electrical and mechanical engineers rose rapidly with

23
the building boom in the 1980s which led to the rapid development of high rise buildings,
offices, hotels, condominiums, apartments, industrial plants and complexes. Malaysian
engineers were also increasingly involved in the oil and gas, petrochemicals, electrical
and electronic sectors.
However, there was a shortage of engineers with the necessary expertise and experience
to undertake large and complex infrastructure projects. This supply gap led to the award
of contracts to foreign consultants under joint venture arrangements with local firms.
Over time the Malaysian engineers benefited from technology transfer and were able to
advance their skills and expertise to world-class standards and able to undertake a variety
of mega projects (Accenture 2010; Chelvanayagam 1994; IEM 2001; Judin 2001; Moggie
2000). Some notable projects were the North-South Highway, Penang Bridge, Petronas
Twin Towers, Kuala Lumpur International Airport, gas transmission and stations,
hydroelectric dams and light rail transit systems (Hamdan 1999).
2.2.4 Conclusion
This Section reviewed the background theory in Malaysian context. It covered
Malaysia’s economic structure, development and history of Malaysian engineering
consulting practices. The next section reviews the background theory on the global
engineering consulting industry.
2.3 The Global Engineering Consulting Industry
The discussion on this background theory starts by defining the global ECS as the term is
subject to different interpretations. The Section then examines the engineering consulting
market, the principal players and the impact of globalization and internationalization on
the global industry.
2.3.1 Defining the Engineering Consulting Industry

24
An attempt to define the ECS has to start with a definition of the term engineering. For
this purpose the Accreditation Board for Engineering and Technology (ABET) defined
engineering as ‘the profession in which knowledge of the mathematical and natural
sciences gained by study, experience, and practice is applied with judgement to develop
ways to utilize, economically, the materials and forces of nature for the benefit of
mankind’ (ABET 1999).
The scholarship on the global ECS industry reveals several definitions. A pertinent one is
that of ING (2008, p. 30) which defined the ECS as ‘intellectual services aimed at
optimizing investment projects in industry, construction and infrastructure at all stages of
a project from the initial phase to its final operation’. These services are provided by
private engineering consultancy firms, contractors and public institutions. The services
include advice, design, monitoring, supervision management and administration of
building, construction and infrastructure projects. However, this definition is considered
to be inappropriate for this research as it is too wide and includes building contractors as
well as public institutions.
The International Federation of Consulting Engineers (FIDIC) confined the meaning of
engineering consulting firms to ‘independent, for-profit, organizations supplying
technology-based intellectual services on a fee-for-service basis’. However, this
definition does not make any reference to consulting engineers and therefore is also not
considered appropriate for this research (FIDIC 2002, p. 47).
Instead of defining the ECS, the articles of association of the Association of Consulting
Engineers Malaysia (ACEM) defined the consulting engineer (CE) as
‘a person possessing the necessary qualifications to practice in one or more of the
various branches of engineering who devotes himself to advising the public on
engineering matters or to designing and supervising the construction of engineering
works and for such purposes occupies and employs either solely or in conjunction with
another consulting engineer, his own office and staff or, in the case of a partner or
consultant of a firm of consulting engineers uses the office and staff of the said firm, and
is not directly or indirectly concerned or interested in commercial or manufacturing
25
interests such as would tend to influence his exercise of independent professional
judgement in the matters upon which he advises’ (ACEM 2011, p. 34).
Viewed in this context, a CE is an independent professional engineer who performs
engineering services for clients on a fee basis. As it was appropriate and pertinent, the
researcher adopted the ACEM definition as the working definition for this research.
2.3.2 The Engineering Consultancy Services
On the basis of the adopted definition discussed in the proceeding section, engineering is
a knowledge-based service and consultancy is a business and profession. Hence,
engineering consultancy is a business based on the provision of knowledge-based
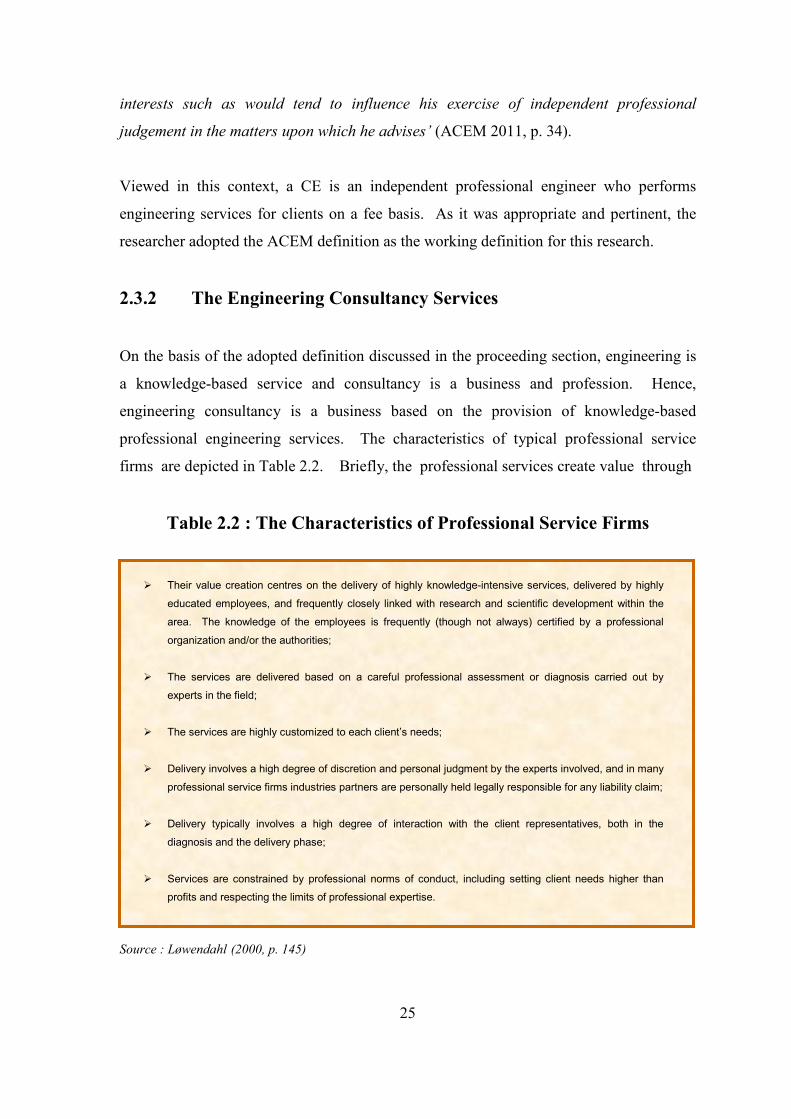
professional engineering services. The characteristics of typical professional service
firms are depicted in Table 2.2. Briefly, the professional services create value through
Table 2.2 : The Characteristics of Professional Service Firms
� Their value creation centres on the delivery of highly knowledge-intensive services, delivered by highly
educated employees, and frequently closely linked with research and scientific development within the
area. The knowledge of the employees is frequently (though not always) certified by a professional
organization and/or the authorities;
� The services are delivered based on a careful professional assessment or diagnosis carried out by
experts in the field;
� The services are highly customized to each client’s needs;
� Delivery involves a high degree of discretion and personal judgment by the experts involved, and in many
professional service firms industries partners are personally held legally responsible for any liability claim;
� Delivery typically involves a high degree of interaction with the client representatives, both in the
diagnosis and the delivery phase;
� Services are constrained by professional norms of conduct, including setting client needs higher than
profits and respecting the limits of professional expertise.
Source : Løwendahl (2000, p. 145)

26
the use of specialized knowledge and delivered by personnel with recognized
qualification, being accredited and licensed with professional organizations and/or
authorities. The services are highly customized to each client’s requirements and
delivered with a high degree of discretion and judgement of the professionals who assume
responsibility and liability for the service rendered. The service delivery involves a high
degree of interaction with the client and is guided by the professional code of ethics or
conducts (Løwendahl 2000; 2005). As a business, ECS firms have to meet the customer
needs and wants. An enabling business environment is one that will continually improve
the performance of the business by virtue of the business being a factor of production.
The engineering consultancy has to meet the above criteria in order to remain relevant,
viable, and to survive and grow (Hamdan 1999).
Engineering covers a wide field of different areas of specialities. The profession is
categorized into disciplines representing designated areas of interest, though not all
authorities define the disciplines in the same manner. These disciplines include civil,
mechanical, electrical and electronic, chemical, sanitary, industrial, petroleum, mining,
aeronautical and marine engineering (Highbeam Business 2010). According to the
Bureau of Labour Statistics (BLS), civil engineers form the largest engineering discipline,
followed by mechanical engineers, industrial engineers, electrical engineers and
electronic engineers (BLS 2010).
The engineering services, a sub-sector under business services which is one of the 12
services sectors in the WTO’s GATS classification, are often confused with the
construction services in the construction and related engineering services sector. These
two types of services are different but highly related and often complementary.
Datamonitor (2009, cited in Accenture 2010, p. 82) provides a clear comparison in Table
2.3 between engineering and construction services according to the types of services,
contents of service, service characteristics, period of service rendered and service value.
The engineering services are diverse and comprise the pre-investment stage of feasibility
study, data collection, investigations and reports. The implementation stage covers the
design of construction projects, product designs for manufacturing, procurement,
construction and project execution, operation and maintenance. The services also include
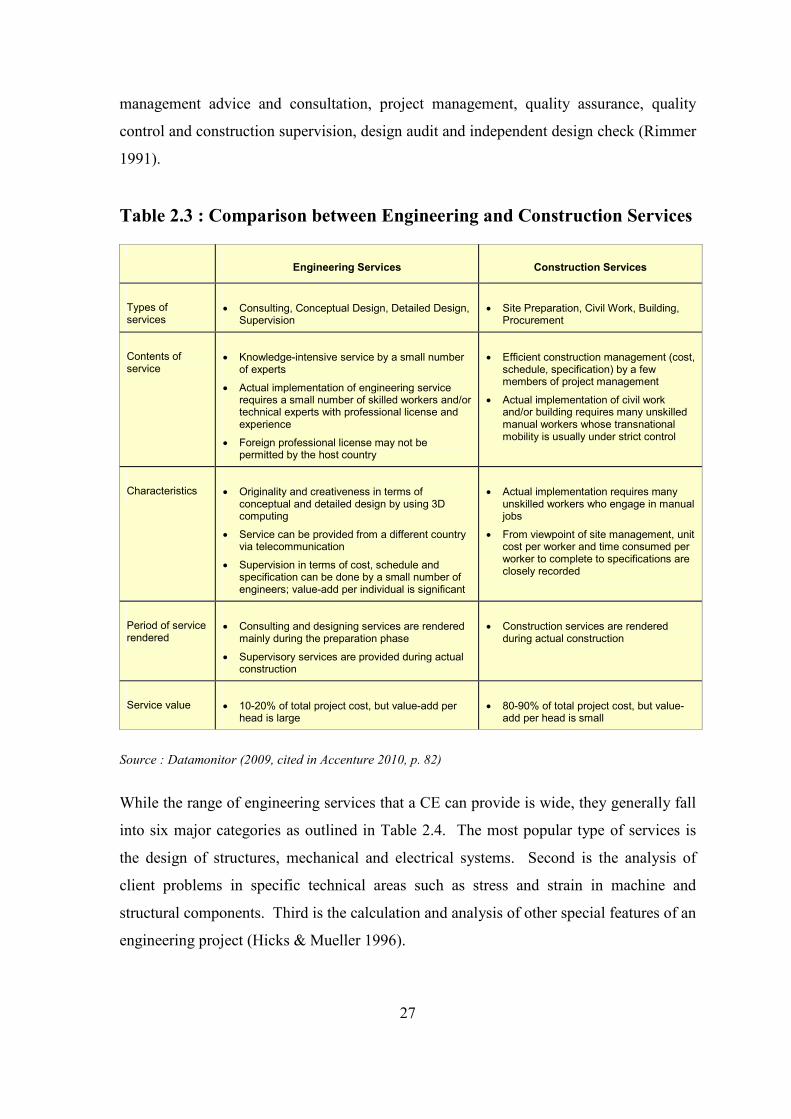
27
management advice and consultation, project management, quality assurance, quality
control and construction supervision, design audit and independent design check (Rimmer
1991).
Table 2.3 : Comparison between Engineering and Construction Services
Engineering Services
Construction Services
Types of services
• Consulting, Conceptual Design, Detailed Design, Supervision
• Site Preparation, Civil Work, Building, Procurement
Contents of service
• Knowledge-intensive service by a small number of experts
• Actual implementation of engineering service requires a small number of skilled workers and/or technical experts with professional license and experience
• Foreign professional license may not be permitted by the host country
• Efficient construction management (cost, schedule, specification) by a few members of project management
• Actual implementation of civil work and/or building requires many unskilled manual workers whose transnational mobility is usually under strict control
Characteristics
• Originality and creativeness in terms of conceptual and detailed design by using 3D computing
• Service can be provided from a different country via telecommunication
• Supervision in terms of cost, schedule and specification can be done by a small number of engineers; value-add per individual is significant
• Actual implementation requires many unskilled workers who engage in manual jobs
• From viewpoint of site management, unit cost per worker and time consumed per worker to complete to specifications are closely recorded
Period of service rendered
• Consulting and designing services are rendered mainly during the preparation phase
• Supervisory services are provided during actual construction
• Construction services are rendered during actual construction
Service value
• 10-20% of total project cost, but value-add per head is large
• 80-90% of total project cost, but value-add per head is small
Source : Datamonitor (2009, cited in Accenture 2010, p. 82)
While the range of engineering services that a CE can provide is wide, they generally fall
into six major categories as outlined in Table 2.4. The most popular type of services is
the design of structures, mechanical and electrical systems. Second is the analysis of
client problems in specific technical areas such as stress and strain in machine and
structural components. Third is the calculation and analysis of other special features of an
engineering project (Hicks & Mueller 1996).

28
Table 2.4 : Major Popular Types of Engineering Consulting Services
Popularity Ranking
Major Types of Engineering Consulting Services
1
Designing mechanical, electrical, and energy systems, transportation facilities, communications systems, and utilities.
2
Analyzing client problems in specific technical areas, such as structural stress and strain, materials defects, equipment lubrication, transport scheduling, and control of energy and power processes.
3
Calculating special structural or design features like piping flexibility, bridge and tower strength, foundation materials, and components for communications products and equipment.
4
Providing computer services for professional firms, such as routine design calculations, specification preparation, payroll, project completion, and cost evaluation.
5
Developing manufacturing designs and analyses; preparing assessments of the environmental impact of specific building projects.
6
Offering miscellaneous specialties in any one of many highly technical disciplines, such as magneto-hydrodynamics, nuclear waste disposal, unique uses for electronic chips, all kinds of pollution control, etc.
Source : Hicks & Mueller (1996, p. 1-16)
2.3.2.1 The Engineering Consulting Firms
In general, there are broadly two categories of ECS firms. The first group comprises
specialists that provide a single service to their clients or that provide several services to a
specific sector. Usually small and medium sized firms with developed specific market
niches, they often seek strategic alliances for competing both locally and globally. The
second group comprises generalists that provide multidisciplinary services to clients.
Usually large, they are growing in size through mergers, acquisitions and expansion, both
geographically and in terms of capability (FIDIC 2004).
The ECS firms that are limited to only consulting and engineering services may be
independent and owned privately by individual, or by a group of people. They may also
be owned by the State or public organizations such as higher learning institutions,
industrial research institutes, industrial design organizations and technical information
centres. There are also in-house engineering organizations or departments in private
enterprises, contractors, manufacturers or suppliers that offer services to clients and are
not independent (Hamdan 1999; Looi 2003).

29
In most countries and irrespective of their size, the ECS firms usually form national
associations. They share common objectives to promote the engineering consulting
profession through consultation and cooperation, for the member firm’s business interests
(FIDIC 2002). These associations often recognized by Governments and multinational
agencies, are generally affiliated to the International Federation of Consulting Engineers
(FIDIC) which aims to be fully representative of the global engineering consultancy
industry.
2.3.2.2 The Engineering Consulting Market
The ECS, as a specialized field of activities, emerged at a later stage of industrial
development in response to the need for innovative solutions and improved designs for
construction projects and industrial plants. The markets for the ECS are therefore
primarily related to the manufacturing industries and construction. The major
determinant of the demand for ECS is construction spending and investment, which in
turn is influenced by economic development and government investment in infrastructure
(Baark 1999). The client base of ECS firms is predominantly made up of national and
local governments, contractors, investors and industrial organizations (UNCTAD 2002;
CBI 2009a, 2009b).
The market of engineering consulting services is volatile and tends to fluctuate with
cycles of growth and stagnation in manufacturing in major markets and public spending
on infrastructure such as transportation or environmental facilities (Baark 1999). The
market is characterized by a competitive environment with low entry barriers and a strong
impact of political decision making. Demand for the services is price driven even though
the industry is intellectual and technology based (ING 2008). The main threats to the
industry are price competition and low fees. Other important threats include economic
downtown, corruption and unfair competition from government agencies (FIDIC 2004).
The composition of global market for engineering design is dominated by petroleum
sector, which constituted 33.4% in 2010. This was followed by transportation at 17.1%
and building, 16.2% (ENR 2010) as depicted in Figure 2.4.

30
23.7%
20.9%
18.2%
11.9%
10.7%
7.8%
6.0%
0.8%
0 5 10 15 20 25
Carribean Island
Latin America
Africa
Canada
US
Middle East
Asia / Australia
Europe
International Regions
Percent of Total
17.1%
33.4%
16.2%
8.5%
7.3%
5.3%
4.0%
3.4%
0.8%
0.4%
3.6%
0 5 10 15 20 25 30 35 40
Other
Telecommunication
Manufacturing
Sewer / Waste
Hazardous Waste
Water
Industrial
Power
Building
Transportation
Petroleum
Type of Work
Percent of Total
Figure 2.4 : Market Sector
Source : Adapted from ENR (2010)
For the international regions where design revenue was earned in 2010, according to ENR
(2010), the largest design market among the top 200 international design firms was
Europe, which contributed 23.7% of the total as shown in Figure 2.5. Asia/Australia
region was second, contributing 20.9%. This was followed by Middle East at 18.2%.
The United States (US) market was fourth at 11.9%.
Figure 2.5 : Contributions of Design Markets
Source : Adapted from ENR (2010)

31
2.3.2.3 The Engineering Consulting Market Size
The size and scope of the world market for engineering consulting services is difficult to
estimate due to the lack of up-to-date empirical research. Furthermore, the estimates from
various sources vary significantly due to different definitions and different basis of
estimations (CBI 2009a). In some cases, the engineering consulting industries are lumped
together with other design industries and other business services (Solum & Hubak 2004,
CBI 2009a).
FIDIC (2002) estimated that the size of the world market for construction and building
service was USD 146 billion in 1999. ENR (2010) reported that the revenue in 2009 of
the top 200 design firms was USD 111.81 billion. This comprised architectural design,
engineering design and design services provided for physical construction, installation,
assembly, completion and finishing.
2.3.2.4 The Global ECS Players
Most of the engineering consulting firms are small (FIDIC 2002; ING 2008; Kreitl &
Oberndorfer 2004). Firms with less than ten employees form the largest category (FIDIC
1998). In 2001, about 60% to 70% of ECS firms worldwide were SMEs with less than 50
employees and with a turnover of less than USD 10.0 million per firm. These SMEs
account for about 10% to 20% of the industry’s total turnover (FIDIC 2002).
Against this background, there are also few large global design firms with large annual
revenues. They are mainly located in Europe and the US (Baark 1999). ENR (2010) gave
a list of top 150 global design firms based on total firm design revenue in 2009. Table 2.5
summarizes a list of top 10 firms providing only engineering design services. It can be
seen that out of the 10 firms, 4 firms are from United Kingdom (UK), 3 from Netherlands,
1 each from United States of America (USA) and Canada.

32
Table 2.5 : The Top 10 Global Engineering Design Firms in 2010
Rank
Firm Name
Country
2008 Total Revenue USD Million
1 AMEC PLC UK 2,928.8
2 Fugro Netherlands 2,851.0
3 Arcadis Netherlands 2,484.0
4 Tetra Tech Inc. USA 2,135.0
5 Mott MacDonald UK 1,641.2
6 Arup UK 1,377.5
7 Hatch Canada 1,215.9
8 WSP UK 1,132.6
9 Grontmij Netherlands 1,086.0
10 Ramboll Group Denmark 1,029.9
Source : Extracted from ENR (2010)
2.3.3 The Engineering Consulting Market Trends
There are a number of major global trends that affect the engineering consulting industry
(CBI 2009a, 2009b; UNCTAD 2000; 2002; ING 2008). These are discussed below:
2.3.3.1 Internationalization of Services
The world is now borderless due to technological advancement (Javalgi & White 2002;
Ohmae 1990). National economies are increasingly integrated into one global economy
due to the forces of globalization (Daly 2001; Douglas & Craig 1992; IMF 2000). The
General Agreement on Tariffs and Trade (GATT) and GATS are promoting free trade,
lowering and removing barriers, increasing the accessibility of goods and services, and
the movement of people across the borders.
In response, many ECS firms are becoming more and more internationalized by
expanding their operations to foreign countries. This has been achieved mainly via two
different strategies: client following or market seeking (Erramilli & Rao 1990). In the
case of the former, ECS firms follow their domestic clients that have projects abroad and
then expand their international activities on the basis of these client relationships. In the
case of the latter, they tend to adopt market seeking strategies and expand their businesses
in markets by setting up new offices and acquiring or partnering foreign firms to serve

33
foreign clients (Ojanen, Salmi & Torkkeli 2008). The motivations are mainly survival,
growth, profitability and diversification (Albaum & Peterson 1984; Barrett & Wilkinson
1986; Diamantopoulos, Schlegelmilch & Allpress 1990; Johnston & Czinkota 1982;
Kaynak & Erol 1989; Leonidou 1995; Leonidou et al. 2007; Ramaseshan & Soutar 1996).
Similarly, foreign firms are also entering the local domestic market and are competing
with local firms (Leonidou et al. 2007; Sullivan & Bauerschmidt 1998).
2.3.3.2 Offshore Outsourcing
Information technology (IT) facilitates the transmission and delivery of core ECS over
long distances within a short time. It enhances the tradability of services such as
engineering reports, basic and detailed design across national borders and enables the out-
sourcing of these components of engineering works to low-cost office sites or overseas
low-cost suppliers (Baark 1999).
Increasingly engineering consulting firms are resorting to offshore outsourcing to the
emerging countries (Rothstein 1998). The primary drivers for outsourcing are costs and
shortage of engineering professionals in the home market since outsourcing enables
companies to transform a fixed cost into a variable cost (Andy 2004). This enables ECS
firms to meet fluctuations in labour demand and respond to market changes. The firms
can also focus on their core business activities and outsource the others and achieve
efficiency through centralized operations (Ojanen, Salmi & Torkkeli 2008). By offering
both better quality and lower cost service (Løwendahl 2000; Windrum, Reinstaller & Bull
2009), the firm can become more competitive in the increasingly globalized market (CBI
2009a).
2.3.3.3 Mergers and Acquisitions
Mergers and acquisitions (M&As) are a general global trend associated with a worldwide
corporate restructuring across industries (Duksaitė & Tamošiūnienė 2009). Driven by
globalization, increased outsourcing and the internationalization of services is leading to
consolidation in the ECS industry (Ojanen, Salmi & Torkkeli 2008) which still comprises
several small and medium size firms (Kreitl & Oberndorfer 2004). Firms are therefore

34
growing in size through organic growth, M&As and cross-border M&As (Ojanen, Salmi
& Torkkeli 2008).
M&As in the ECS industry are driven by the instant access to service/client markets,
penetration of new geographic markets and increasing the firm’s market share (Kreitl &
Oberndorfer 2004). Firms also aim to achieve economies of scale by merging the
resources of both companies, or creating economies of scope by acquiring a company that
permits service/market diversification. Overall, value creation is generally the underlying
reason; through either cost cutting or through increased scope (Ghauri & Buckley 2003).
Other motives include quick gain of new expertise, innovation capability (Ojanen, Salmi
& Torkkeli 2008) and knowledge acquisition (Ghauri & Buckley 2003).
Despite the advantages, M&As carry substantial risks (Ojanen, Salmi & Torkkeli 2008)
and are beset by numerous problems (Newburry & Zeira 1997). In the 1990s, almost 50%
of domestic acquisitions and 70% of cross-border acquisitions failed to achieve intended
results (Capron 1999). Differences in organizational cultures and values, poor planning of
the integration process, lack of compelling strategic rationale, unrealistic expectations of
possible synergies, exit of highly mobile valued employees and the lack of understanding
of foreign business practices and legislation are contributing factors for the failure of
M&As (Aguilera & Dencker 2004; Ojanen, Salmi & Torkkeli 2008; Kreitl & Oberndorfer
2004).
2.3.4 Public Policy Support for Export
Export development is high on the agendas of both public and private sector policy
makers as there are numerous economic benefits to be gained (Albaum & Duerr 2008;
Czinkota & Ronkainen 2006; Hollensen 2004; Katsikeas, Leonidou & Morgan 2000;
Leonidou & Katsikeas 1996). From a macroeconomic perspective, service exports enable
countries to increase their foreign exchange reserves, reduce trade deficits, provide
employment, increase productivity and enhance societal prosperity (Czinkota, Ronkainen
& Moffett 2005; Czinkota 1994; Leonidou et al. 2007; Piercy, Kaleka & Katsikeas 1998).
From the microeconomic view, exporting enables firms to survive and grow, develop
competitive advantages and capability, improve financial performance, increase capacity

35
utilization and raise technological standards (Kumcu, Harcar & Kumcu 1995; Leonidou et
al. 2007; Piercy, Kaleka & Katsikeas 1998; Samiee & Walters 1990; Terpstra & Sarathy
2000).
Indigenous firms, particularly the small and medium sized companies, face barriers and
difficulties for exporting and required governmental export assistance and promotion
programmes (Cavusgil & Michael 1990; Hashim & Hassan 2008; Marandu 1995;
Seringhaus & Rosson 1990). Generally, export assistance and promotion refers to all
public policy measures that seek to enhance exporting activity at the company, industry or
national level (Root 1971).
Export assistance programmes include financial assistance by way of tax incentives,
export financing and insurance, export grants, multilateral and bilateral trade aid,
technical assistance by way of technology innovation support, research and development
support and marketing assistance which includes the provision of standardized and
customized market information, guidance on exporting and export marketing, marketing
research on specific foreign markets, trade missions, market visits and trade fairs
(Seringhaus 1986). These export programmes usually emphasize on motivational,
informational and operational needs of the firms (Czinkota 1982; Cavusgil 1984b;
Seringhaus 1987).
The findings of earlier studies on the effectiveness of the government export promotion
programmes indicate that they could lead to successful export (Bilkey 1978; Bilkey &
Tesar 1977; Cavusgil 1983). However, some studies found that the government export
assistance programmes were also generally viewed unfavourably (Albaum 1983), rated
low by firms (Crick & Chaudhry 1997) and had limited effects on export growth
(Leonidou et al. 2007; Seringhaus & Rosson 1990). One finding was that most small and
non-interested firms were unaware of the government promotion programmes and
services on offer due to lack of communication (Ahmed et al. 2002; Crick & Chaudhry
1997; Kedia & Chhokar 1986; Moini 1998). Gencturk and Kotabe (2001) found that the
usage of export assistance programmes increased the profitability of experienced
exporters rather than new exporters. Moini (1998) argued that firms that progress beyond
the initial export development stage have less need for export assistance programmes.

36
As shown in Table 2.6 by Seringhaus and Rosson (1991), firms can be categorized into
four categories as non-exporter, new exporter, expanding exporter and continuing
exporter. The nature of the required export assistance varies for firms in the different
categories.
Table 2.6 : Company Needs and Export Promotion Programmes
Type of export involvement
Key questions
Company need
Export promotion focus and typical initiatives
Motivational
Informational
Operational / Resource
Non-exporter
Should we even consider exporting?
To be made aware of opportunities
Advertising Local seminars Export weeks/ months
-
-
New exporter
Should we initiate exporting? Which market should we investigate?
To determine feasibility of exporting
Seminars Export bulletin/ newsletter
Market reviews Supplier/Buyer newsletter Custom market research
Trade missions Financing, insurance
Expanding exporter
Which new market should we enter and how?
To select the most promising market and the best market entry method
-
Market visits Export seminars/ meetings Export newsletter
Trade fairs Trade missions Financing, insurance
Continuing exporter
How can we achieve better performance?
To improve and fine tune existing operations
-
Export seminars/ meetings Export newsletter
Trade fairs Foreign buyer visit Sales offices Financing, insurance
Source : Seringhaus & Rosson (1991, p.7)
Export programmes focusing mainly on financial incentives are ‘not having their desired
impact’ (Welch & Wiedersheim-Paul 1979, p. 166) and ‘have a limited effect on
enhancing firms’ exporting capabilities’ (Ahmed et al. 2002, p. 841). Financial incentives
‘will also not be sufficient to provide export stimulation and, particularly for new
exporters and non-exporters’ (Barrett & Wilkinson 1985, p. 55). Karafakioglu (1986) and
Christensen, da Rocha & Gertner (1987) argued that financial incentives did not cause
sustained exporting because the firms might only be interested in using financial
incentives to compensate for managerial inefficiency, high cost production and non-
competitive products. Such firms also may cease to export once the incentives are
reduced or withdrawn (Christensen, da Rocha & Gertner 1987).
Some authorities also suggest that technical support programmes are more desirable and
more effective for enabling firms to develop competitive advantage, improve managerial

37
and productive systems, increase information handling capacity, gain export expertise and
foster foreign networking and contacts (Seringhaus & Rosson 1990; Kumcu, Harcar &
Kumcu 1995). All are important for sustained and continuing exporting (Welch &
Wiedersheim-Paul 1979; Christensen, da Rocha & Gertner 1987).
2.3.5 Conclusion
This Section presented the global engineering consulting industry. It defined the
engineering consulting industry and then described the engineering consulting services,
the consulting firms, the engineering consulting market and the market trends. It ended
with a review of the public policy support for ECS export. The next section reviews the
background theory of internationalization and globalization.
2.4 Internationalization and Globalization
This Section starts by defining the meaning of internationalization. It then proceeds to
discuss the forces of globalization and the impact of GATS on the globalization of
services. The Section also examined the internationalization theories and models that are
considered relevant for the research.
2.4.1 The Meaning of Internationalization
There is no single universally accepted definition for internationalization (Coviello &
McAuley 1999; Welch & Luostarinen 1993). Internationalization has been
conceptualized differently by various authorities and researchers and used in a variety of
ways (Knight 2004, 2005; Turnbull 1987). Different definitions of internationalization
give rise to different understandings due to different perspectives, contexts, emphasizes,
approaches and viewpoints (Fok 2007; Knight & de Wit 1995). However, from the
international business perspective, internationalization is widely used to describe the
outward movement of a firm’s business activities from its domestic market place to
international markets (Andersen 1993; Buckley & Casson 1998; Javagil, Griffith & White
2003; Johanson & Wiedersheim-Paul 1975; O’Farrell, Wood & Zheng 1998; Turnbull

38
1987). There are several definitions of the term for internationalization and the pertinent
ones are shown in Table 2.7.
Table 2.7 : Some Definitions of Internationalization
Authority and Source
Definition
Focus
Ruzzier, Hisrich and Antoncic (2006, p.477)
A synonym for the geographical expansion of economic activities over a national country’s borders.
Process, firm’s operations.
Welch and Luostarinen (1993, p. 156)
The process of increasing involvement in international operations.
Process, firm’s operations.
Calof and Beamish (1995, p. 116)
The process of adapting firms’ operations (strategy, structure, resource, etc.) to international environment.
Process, firm’s operations.
Johanson and Mattsson (1988, p. 306)
A cumulative process, in which relationships are continually established, maintained, developed, broken and dissolved in order to achieve the objectives of the firm.
Networks, relationships.
Johanson and Vahlne (1990, p. 20)
The process of developing networks of business relationships in other countries through extension, penetration, and integration.
Networks, relationship.
Beamish (1990, p. 77)
The process by which firms both increase their awareness of the direct and indirect influence of international transactions on their future, and establish and conduct transactions with other countries.
Process, firm’s operations, networks, relationship.
Source : Beamish (1990, p. 77); Calof & Beamish (1995, p. 116); Johanson & Mattsson (1988, p. 306);
Johanson & Vahlne (1990, p. 20); Ruzzier, Hisrich & Antoncic (2006, p. 477); Welch & Luostarinen (1993, p. 156).
Ruzzier, Hisrich and Antoncic (2006, p. 477) defined internationalization as a ‘synonym
for the geographical expansion of economic activities over a national country’s borders’.
This definition implies that internationalization is related to the outward involvement of
the firm in the international markets. Calof and Beamish (1995, p. 116) provided a wider
definition for internationalization as ‘the process of adapting firms’ operations (strategy,
structure, resource, etc.) to international environment’. They viewed internationalization
as a form of de-investment or de-internationalization when a firm reduces or withdraws
its international activities (Oesterle 1997). These internationalization definitions
generally lie in the domain which concerns the process of the firm’s business operations.

39
Internationalization can also be defined from a network perspective in line with Johanson
and Mattsson (1988, p. 306) that internationalization is a ‘cumulative process, in which
relationships are continually established, maintained, developed, broken and dissolved in
order to achieve the objectives of the firm’. Johanson and Vahlne (1990, p. 20) extended
this further and treate internationalization as the ‘process of developing networks of
business relationships in other countries through extension, penetration, and integration’.
The internationalization process is also a multidimensional phenomenon as it goes beyond
a firm’s operations to business network development by the firm (Johanson & Vahlne
2003). Viewed in this context, the definition of internationalization by Beamish (1990, p.
77) as
‘….. the process by which firms both increase their awareness of the direct and indirect
influence of international transactions on their future, and establish and conduct
transactions with other countries’.
is considered appropriate for this research as it covers four aspects of internationalization.
First, it integrates organization learning with foreign investment, thus recognizing the
behavioural and economic components of internationalization. Secondly,
internationalization is a dynamic and evolutionary process. Third, it recognizes the
outward and inward movement of internationalization activities. Finally, international
transactions help to develop networks relationship which influences the future growth of
the firm and its business prospect (Coviello & McAuley 1999).
2.4.2 The Forces of Globalization
The term globalization embodies many different concepts and is defined in many
different ways (Kefalas 1998). It can be interpreted and given different meanings by
different people according to the different dimensions, contexts and perspectives (Yang
2003; Fok 2007; Robinson 2007). Globalization has been described by International
Monetary Fund (IMF 2000 p. 2) as the ‘increasing integration of economies around the
world, particularly through trade, financial flow, movement of people and knowledge
across international borders’.
40
There are two main forces underlying the trend toward greater globalization. The first is
the lowering or the removal of the barriers to trade and investment that promote the free
flow of goods, services and capital (Javalgi & White 2002; Porter 1979). The second is
technological innovation that propels rapid developments in communication, information
and transportation technologies (Hill 2009; Iskanius & Lamminsalo 2005; Javalgi &
Martin 2007; Javalgi & White 2002; Wild, Wild & Han 2006). ‘Technology makes
globalization feasible, while liberalization which eliminates cross-border controls makes
globalization happen’ (Kefalas 1998, p. 553).
2.4.2.1 Lowering of the Barriers to Trade and Investment
The General Agreement on Tariffs and Trade (GATT) was created in 1947 with the
objectives of:
• raising standards of living;
• ensuring full employment;
• a large and steadily growing volume of real income and effective demand;
• developing the full use of the resources of the world ; and
• expanding the production and exchange of goods.
It promotes free trade by reducing both tariffs and non-tariff barriers. Average tariffs
dropped from 40 percent to five percent and the outcome was a 20 fold increase in world
merchandise trade between 1947 and 1988. However, GATT did not have the powers to
enforce world trade rules and this led to the Uruguay Round of Negotiations in 1986
following pressures from both developed and developing countries. This led to the
establishment of the World Trade Organization (WTO) in 1995 (Wild, Wild & Han 2006).
(i) The World Trade Organization
The WTO is the only global international organization dealing with the rules of trade
between nations. The three major goals of WTO are: (1) ‘to promote trade flows by
encouraging nations to adopt non-discriminatory, predictable trade policies; (2) to reduce

41
remaining trade barriers through multilateral negotiations; and (3) to establish impartial
procedures for resolving trade disputes between members’ (Mahoney et al. 2001, p. 292).
The WTO oversees about 60 diverse agreements which have the status of international
legal texts and the more important Agreements are the GATT, the GATS, the Agreement
on Trade-Related Intellectual Property Rights (TRIPS) and the Agreement on Trade-
Related Investment Measures (TRIMS) (WTO 2008).
The lengthy and complex agreements cover a wide range of activities, including
agriculture, textiles, banking, telecommunications, intellectual properties, government
purchases and much more (WTO 2008). Essentially, the agreements are contracts
between member countries that commit them to maintain fair and open trade policies and
to guarantee their trade rights. Negotiated, signed and ratified by the majority of world’s
trading nations, they provide the legal ground-rules for international commerce. The
common aim is to help producers and consumers of goods and services, exporters and
importers to conduct their business, while allowing governments to meet their social
objectives (Mahoney et al. 2001).
The WTO is also a governing body for settling international trade disputes and has the
responsibility to monitor the trade policies of member countries for compliance (Hill
2009). The WTO’s procedure of settling disputes is based on clearly-defined rules with
fixed timeline for completion (WTO 2008). Countries that are in breach of trade policies
could suffer financial penalties and even trade sanctions. To penalize the offending
member countries, the WTO dispute settlement system was made the backbone of the
global trading system (Hill 2009; Wild, Wild & Han 2006).
(ii) Regional Trade Agreements and Economic Integration
Small groups of countries in geographical regions have also entered into regional trade
pacts with the goal of cooperating with one another by reducing or eliminating trade
barriers (Javalgi & Martin 2007). These served to boost regional trade and cross-border
investment. Some countries are placing greater importance on these regional agreements
because of the difficulties to reach worldwide trade agreement. Examples of such

42
agreements are the North American Free Trade Agreement (NAFTA) formed by Canada,
United States and Mexico. The Asia Pacific Economic Cooperation (APEC) makes up of
21 countries around the Pacific Rim and the ASEAN Free Trade Area (AFTA) formed by
the countries in South East Asia (Wild, Wild & Han 2006). However, all these regional
agreements share the common characteristics of being WTO-Plus or GATS-Plus
agreements with the aim of increasing the depths and the coverage of the commitments
compared to GATS or the WTO.
There are five different forms of economic and political integration for regional trading
blocs as shown in Table 2.8 (Griffin & Pustay 1999; Mahoney et al. 2001). These are: (1)
free trade area, (2) customs union, (3) common market, (4) economic union, and (5)
political union. A free trade area is the lowest level of national integration, whilst the
political union is the highest level. Each level of integration has the features of those
levels that precede it (Wild, Wild & Han 2006). While the aims and scope of each
regional trading bloc may be different, they could result in differential treatment between
firms from member countries as compared to non-member countries.
Table 2.8 : Forms of Economic Integration
Degree of Economic Integration
Form of Economic Integration
Main Characteristics
Example
High
Low
Political Union
By encompassing both political and economic integration, the union effectively transforms itself into one country.
USA
Economic Union
Common Market policy
+
Members more fully integrate their economies by coordinating their economic policies.
EU
Common Market
Customs
Union policy
+
Members also eliminate barriers that restrict movement of factors of production among themselves.
Customs Union
Free trade area policy
+
Members also adopt common trade policies toward nonmember countries.
MERCOSUR,
Andean Community
Free Trade Area
Members remove tariffs and other barriers to international trade among themselves; however, each member may establish its own trade policies with nonmember countries.
NAFTA, AFTA
Source : Adapted from Griffin & Pustay (1999, p. 256); Mahoney et al. (2001, p. 299)

43
2.4.2.2 The Globalization of Services : The General Agreement on
Trade in Services
The service sector is subject to significant developments in the international economic
system triggered by the GATS which came into effect in 1997. The GATS has 29
Articles and eight Annexes and constitutes Annex 1B of the WTO Agreement (Hopkins
2005). The abridged content of the GATS is shown in Table 2.9. GATS covers all
internationally-traded services except services provided in the exercise of government
authority and all services related to air transport. However, individual countries have the
power to determine the degree of market access.
Table 2.9 : Abridge Content of GATS
The Text
Part I Scope and Definitions (Article I)
Part II General Obligations and Disciplines (Articles II to XV)
Part III Specific Commitments (Articles XVI to XVIII)
Part IV Progressive Liberalization (Articles XIX to XXI)
Part V Institutional Provisions (Articles XXII to XXVI)
Part VI Final Provisions (Articles XXVII to XXIX)
ANNEXES ON
I Article II Exemptions
II Movement of Natural Persons Supplying Services Under the Agreement
III Air Transport Services
IV Financial Services
V Financial Services (Second Annex)
VI Negotiations on Maritime Transport Service
VII Telecommunications
VIII Negotiations on Basic Telecommunications
Source : WTO (2007)
The GATS broadly comprises three main sections. The first is a framework of principles
and rules outlining the general obligations governing trade in services. This framework is
still under negotiation in respects of certain issues such as emergency safeguards,
subsidies, government procurement and domestic regulation. The second section consists
of the national schedules which list a country’s specific commitments on access to their
domestic market by foreign service providers and the list of exemptions from most

44
favoured nation (MFN) treatment submitted by member governments. The third section
contains the annexes on specific service sectors comprising air transport, financial
services, maritime transport and telecommunications as well as the movement of natural
persons (Knight 2002; Sauve 2002).
The GATS is liberalizing trade and services and creating a more open global market by
eliminating or reducing non-tariffs and related protectionist barriers. Significantly, GATS
only deals with services which have been subjected to non-tariff barriers. Viewed in this
context, the relevant provisions in GATS are aimed at liberalizing the regulations that
control the mode of entry into the service sectors and other regulatory requirements.
For international services supply, only a small fraction of service products, like software
packages and engineering drawings can be stored and shipped like traditional
merchandise goods. In most other cases, this mode of supply cannot be done due to the
inseparability of production and consumption in time and space (Bateson & Hoffman
1999; Lovelock & Wirtz 2007; Palmer 1994). This implies that for international
transaction to take place, either the consumer or the producer must go abroad. The
producer can set up a foreign production unit (Sampson & Snape 1985; Kox & Lejour
2004) or send the employees abroad temporarily.
The GATS adopting Bhagawati’s (1984) and Sampson and Snape’s (1985) classification
of trade in services on the basis of location of the service providers, identifies four modes
of international service supply as shown in Table 2.10. These are 1) cross-border supply,
2) consumption abroad, 3) commercial presence, and 4) presence of natural person (Chan
1996; Knight 2002, 2003; Kox & Lejour 2004; Qian 2003; Sauve 2002; WTO 2001).
Commercial presence through subsidiaries forms the major share in world service trade at
57%, whereas the presence of natural person is the least at 1% (Kox & Lejour 2004).
Several governments regulate domestic service markets and create impediments and
barriers to the presence, operation and movement of foreign service providers. Members
are at liberty to liberalize progressively including the mode of supply, the extent of
liberalization and the time span of implementation. The types of regulation-based trade
barriers in relation to the four modes of supply are shown in Table 2.10. Some supply
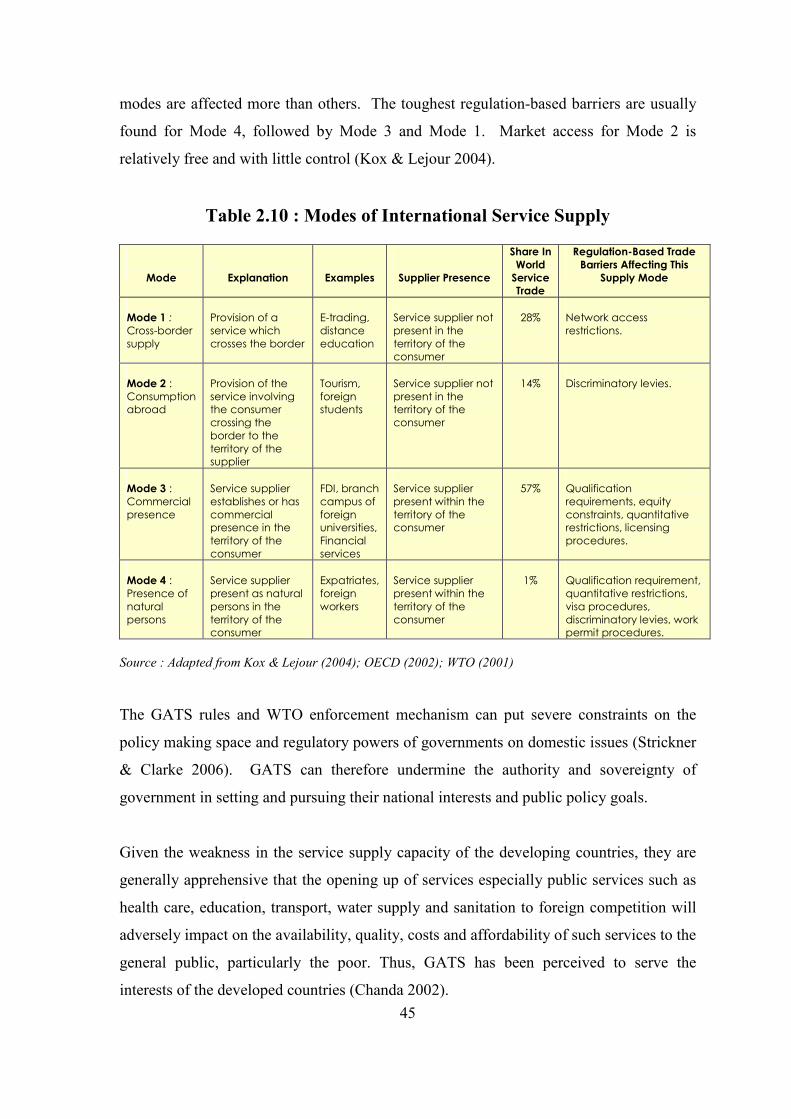
45
modes are affected more than others. The toughest regulation-based barriers are usually
found for Mode 4, followed by Mode 3 and Mode 1. Market access for Mode 2 is
relatively free and with little control (Kox & Lejour 2004).
Table 2.10 : Modes of International Service Supply
Mode
Explanation
Examples
Supplier Presence
Share In
World
Service
Trade
Regulation-Based Trade
Barriers Affecting This
Supply Mode
Mode 1 :
Cross-border
supply
Provision of a
service which
crosses the border
E-trading,
distance
education
Service supplier not
present in the
territory of the
consumer
28%
Network access
restrictions.
Mode 2 :
Consumption
abroad
Provision of the
service involving
the consumer
crossing the
border to the
territory of the
supplier
Tourism,
foreign
students
Service supplier not
present in the
territory of the
consumer
14%
Discriminatory levies.
Mode 3 :
Commercial
presence
Service supplier
establishes or has
commercial
presence in the
territory of the
consumer
FDI, branch
campus of
foreign
universities,
Financial
services
Service supplier
present within the
territory of the
consumer
57%
Qualification
requirements, equity
constraints, quantitative
restrictions, licensing
procedures.
Mode 4 :
Presence of
natural
persons
Service supplier
present as natural
persons in the
territory of the
consumer
Expatriates,
foreign
workers
Service supplier
present within the
territory of the
consumer
1%
Qualification requirement,
quantitative restrictions,
visa procedures,
discriminatory levies, work
permit procedures.
Source : Adapted from Kox & Lejour (2004); OECD (2002); WTO (2001)
The GATS rules and WTO enforcement mechanism can put severe constraints on the
policy making space and regulatory powers of governments on domestic issues (Strickner
& Clarke 2006). GATS can therefore undermine the authority and sovereignty of
government in setting and pursuing their national interests and public policy goals.
Given the weakness in the service supply capacity of the developing countries, they are
generally apprehensive that the opening up of services especially public services such as
health care, education, transport, water supply and sanitation to foreign competition will
adversely impact on the availability, quality, costs and affordability of such services to the
general public, particularly the poor. Thus, GATS has been perceived to serve the
interests of the developed countries (Chanda 2002).

46
2.4.3 Selected Internationalization Theories and Models
There are several theories that emerged in 1970s and 1980s which explain the
internationalization process of firms and they originate largely from the industrial
organization and mainstream economics (Axinn & Matthyssens 2001; Coase 1937;
Williamson 1971, 1976). However, they generally relate to the international
manufacturing operations of multinational corporations (MNCs) and not on services
(Axinn & Matthyssens 2001; Buckley, Pass & Prescott 1992; Coviello & Martin 1999;
Erramilli & Rao 1993; Grönroos 1999; Sharma & Johanson 1987).
Services are fundamentally different from goods in terms of intangibility, perishability,
inseparability of production and consumption and heterogeneity (Buckley, Pass &
Prescott 1992; Contractor, Kundu & Hsu 2003; Javalgi & Martin 2007; Javalgi & White
2002; Lovelock & Yip 1996; Majluf & Zarrilli 2007; Winsted & Patterson 1998). Goods
are physical and tangible objects while services are generally performances or
experiences (Patterson & Cicic 1995). Zeithaml and Bitner (1996, p. 5) contended that
‘service are deeds, processes and performances’. Services cannot be touched, seen, stored
or transported (Grönroos 1990; Javalgi & Martin 2007).
Rapid technological advances, including the advent of the internet, have triggered parallel
increases in the trade in services and are creating a separation between production and
consumption in certain service sectors. This is borne out by franchised programmes in the
higher education sector whereby foreign universities can offer their full degree
programmes through franchise arrangements with local partners. The foreign provider
usually assesses the ability of the local partner to meet minimum quality standards and
provides guidelines and/or supports/monitors student admission criteria and assessment.
The course belongs to the foreign provider which charges for the use of syllabi, course
materials, examinations and technical support to staff (Knight 2005).
The internationalization theories developed from manufacturing of goods may not
necessarily be applicable to service firms (Blomstermo, Sharma & Sallis 2006; Coviello
& Martin 1999; Coviello & Munro 1997; Erramilli 1990; Erramilli & Rao 1990, 1993;

47
Løwendahl 2000; Majluf & Zarrilli 2007; Sharma & Johanson 1987), since ‘for
international services, theory lags behind practice by a considerable degree’ (Clark,
Rajaratnam & Smith 1996, p. 9).
Some authorities (Boddewyn, Halbrich & Perry 1986; Katrishen & Scordis 1998;
O’Farrell, Wood & Zheng 1998) suggested that researchers may adapt existing theories
applicable to manufacturing firms for explaining the service industries. Agarwal and
Ramaswami (1992) found that the factors influencing the choice of entry mode are the
same for the service providers and manufacturing firms. Javalgi, Griffith and White
(2003, p. 195) asserted that ‘manufacturing based research may provide a fruitful
foundation from which to begin research into the service sector’. Guided by these
authorities, this study will rely on the current pertinent theories and models which are
examined in the subsequent sections.
2.4.3.1 Stage Models of Internationalization
The internationalization process is a time-dependent, gradual development that occurs in
distinct phases for a firm to increase its involvement in foreign markets (Melin 1992).
There are primarily two, stage or sometimes called establishment chain, models of
internationalization. The first developed in the Nordic countries, is the Uppsala
Internationalization Model (U-Model). The other, developed in USA, is often referred to
as the Innovation-Related Internationalization Models (I-Models) (Axinn & Matthyssens
2001).
(i) Uppsala Internationalization Model (U-Model)
The U-Model was initiated by Johanson and Wiedersheim-Paul (1975) and further
expanded and refined by Johanson and Vahlne (1977, 1990). The U-Model, evolving and
dynamic, drew upon the ‘behavioral theory of the firm (Aharoni 1966; Cyert & March
1963) and Penrose’s (1959) theory of the growth of the firm’ (Johanson & Vahlne 1990, p.
11). The basic mechanism of internationalization comprises the state aspects and the
change aspects as illustrated diagrammatically in Figure 2.6.

48
Figure 2.6 : The Basic Mechanism of Internationalization
STATE ASPECTS CHANGE ASPECTS
Source : Johanson & Vahlne (1977, p. 26)
The state aspects are the market commitment (commitment of firm resources to the
foreign markets) and the market knowledge (knowledge about foreign markets and
operations). The change aspects are the commitment decisions (decisions to commit
resources to foreign markets) and the current business activities. The state aspects impact
on the change aspects and vice-versa, hence creating causal cycles.
The model emphasizes on organizational learning and focuses on experience (Vida &
Fairhurst 1998). Increased learning and experiential knowledge reduce uncertainty and
risk associated with foreign market commitment (Buckley & Ghauri 1993). The central
thesis of this model is the ‘gradual acquisition, integration, and use of knowledge about
foreign markets and operations and on the incrementally increasing commitments to
foreign markets’ (Johanson & Vahlne 1977, p. 23). The internationalization process is
thus viewed as ‘an interplay between an international learning process and an
international resource commitment process’ (Sharma & Johanson 1987, p. 21).
According to the U-Model, the penetration of each individual foreign market takes place
in small steps due to uncertainties, and firms will respond to opportunities and challenges
in the foreign markets where they currently operate. The internationalization process of
the firms follows the establishment chain which has four different distinct stages of
entering an international market. Each stage represents a higher level of international
involvement. Starting with ‘no regular export but with interest in a new foreign market’,
a firm will then start exporting via agents. In the third stage, it will establish a foreign
Market Knowledge
Market Commitment
Commitment Decisions
Current Activities

49
sales subsidiary and finally build production facilities in the country (Johanson &
Wiederheim – Paul 1975). The establishment chain is diagrammatically shown in Figure
2.7.
Figure 2.7 : The Establishment Chain of International Involvement
Source : Developed for this research
Johanson and Vahlne (1977, p. 28) argued that ‘market-specific knowledge can be gained
mainly through experience in the market’ and the main source of experience comes from
current business activities. Thus, because of the lack of knowledge about foreign markets,
firms initially start internationalization by going to those markets which are similar to
their domestic markets which they can easily understand, often in neighbouring countries
(Johanson & Wiedersheim - Paul 1975). As experience and knowledge about the new
markets accumulate, the firms will enter them with greater psychic distance.
The U-Model makes three exceptions to the small incremental market commitments.
First, firms with large resources can skip the steps and make larger strikes. Second, under
stable and homogeneous market conditions, there are other ways to gain market
knowledge rather than through experience and learning by doing. Third, it is possible to
Stage 3
Expansion
Stage 4
Maturity
International Involvement
Stage 1 Start-up
Stage 2
Growth
• No regular export. Interest in a new foreign market
• Start exporting via agents
• Establish foreign sales subsidiary
• Build foreign production facilities
International Involvement
Time

50
generalize the experience from a specific market to other markets of similar conditions
(Johanson and Vahlne 1990).
(ii) Innovation – Related Internationalization Models (I-Models)
The term ‘innovation-related’ is derived from Rogers’ (1962) diffusion of innovation
theory (Bell 1995; Crick & Chaudhry 1997; Ruzzier, Hisrich & Antoncic 2006). The I-
Models treat each stage of internationalization as an innovation for the firm (Andersen
1993; Gankema, Snuif & Zwart 2000; Morgan & Katsikeas 1997) as the development of a
particular stage impacts the succeeding stage in an ordered unitary progression (Van de
Ven 1992). These stages, reflecting changes in the attitudinal and behavioural
commitment of managers (Bilkey & Tesar 1977; Cavusgil 1984a; Coviello & Martin
1999; Czinkota 1982; Reid 1981) result from manager’s perceptions and beliefs which
interact and are influenced by foreign market involvement (Coviello & McAuley 1999).
The I-Models mainly focus on export development process (Clark, Pugh & Mallory 1997;
Leonidou & Katsikeas 1996; Ruzzier, Hisrich & Antoncic 2006) and the features of some
of the most commonly cited models are summarized in Table 2.11.
A common feature of all the models is a number of fixed, incremental and sequential
stages varying from three to six stages (Clark, Pugh & Mallory 1997; Ruzzier, Hisrick &
Antocic 2006). In general, three broad categories of stages can be identified: the pre-
export stage, the initial export stage, and the advanced export stage (Clark, Pugh &
Mallory 1997; Leonidou & Katsikeas 1996; Ruzzier, Hisrich & Antoncic 2006). Despite
the differences in the number, nature, content and terminology of the stages, the models
share many common features (Andersen 1993; Morgan & Katsikeas 1997). ‘The
differences between the models seem to be semantic differences rather than real
differences about the nature of the internationalization process’ (Andersen 1993, p. 212).

51
Table 2.11 : Selected Innovation-Related Internationalization Models
Bilkey and Tesar
(1977)
Cavusgil (1980)
Czinkota (1982)
Reid (1981)
Stage 1
Management is not interested in exporting Stage 2
Management is willing to fill unsolicited orders, but makes no effort to explore the feasibility of active exporting Stage 3
Management actively explores the feasibility of active exporting Stage 4
The firm exports on an experimental basis to some psychologically close country Stage 5
The firm is an experienced exporter Stage 6
Management explores the feasibility of exporting to other more psychologically distant countries
Stage 1
Domestic marketing : The firm sells only to the home market Stage 2
Pre-export stage : The firm searches for information and evaluates the feasibility of undertaking exporting Stage 3
Experimental involvement : The firm starts exporting on a limited basis to some psychologically close country Stage 4
Active involvement : Exporting to more new countries – direct exporting – increase in sales volume Stage 5
Committed involvement : Management constantly makes choices in allocating limited resources between domestic and foreign markets
Stage 1
The completely uninterested firm Stage 2
The partially interested firm Stage 3
The exploring firm Stage 4
The experimental firm Stage 5
The experienced small exporter Stage 6
The experienced large exporter
Stage 1
Export awareness : Problem of opportunity recognition, arousal of need Stage 2
Export intention : Motivation, attitude, beliefs, and expectancy about export Stage 3
Export trial : Personal experience from limited exporting Stage 4
Export evaluation : Results from engaging in exporting Stage 5
Export acceptance: Adoption of exporting/rejection of exporting.
Source : Andersen (1993, p. 213)
(iii) Critical Views on the Stage Models
The stage models have been subject to widespread research and empirical investigation.
There is empirical evidence that firm internationalization occurs in gradual and
incremental stages (Chetty & Hamilton 1996; Dalli 1994; Fina & Rugman 1996; Welch &
Luostarinen 1988). Similar support was also reported in Canada (Denis & Depelteau
1985), China (Young, Huang & McDermott 1996), Germany (Dichtl et al. 1983), Hawaii
(Hook & Czinkota 1988), Japan (Johansson & Nonaka 1983), Norway (Juul & Walters
1987), South Africa (Calof & Viviers 1995) and Turkey (Karafakioglu 1986).

52
Despite this impressive evidence and support, the stage models have been criticized. The
stage models stipulate that firms will start at one stage and go to the next stage in
sequence without considering whether other options of strategic choices are made
(Andersson 2000; Johanson & Vahlne 1990; Melin 1992; Reid 1983; Turnbull 1987).
Turnbull and Valla (1986) showed that firms do not follow a regular fixed path as they
enter foreign markets. Some firms have exported since inception without going through
the sequential stages (Andersson & Wictor 2003; Knight & Cavusgil 1996; Madsen &
Servais 1997; McAuley 1999; Westhead et al. 2001).
The contrasting views offered by the cited authorities illustrate that the stage models have
strengths and weaknesses in terms of explaining the internationalization process.
Pertinent to this research, is the view expressed by the authorities that the explanatory
power of the stage models are more appropriate and applicable to the manufacturing
industry rather than the service industry (Buckley, Pass & Prescott 1992; Chadee &
Mattsson 1998; Engwall & Wallenstal 1988; Johanson & Vahlne 1990; Sharma &
Johanson 1987).
2.4.3.2 Network Perspective to Internationalization
(i) Network Model
The network model postulates that a firm is embedded in a complex and evolving web of
interdependent social, business and industrial relationships (Bridgewater 1999; Johanson
& Mattsson 1988). Johanson & Mattsson (1987, p. 34) described the industrial systems
as ‘networks of relationships among firms’. The markets are structured as networks with
the focal firm connected to the actors and the networks are affected by the interplay
between actors and actors’ interaction (Axelsson & Easton 1992; Johanson & Vahlne
1992; Blankenburg-Holm 1995).
A business network is defined as ‘a set of two or more connected business relationships,
in which each exchange relation is between business firms that are conceptualized as
collective actors (Blankenburg-Holm, Eriksson & Johanson 1996, p. 1036). Connected
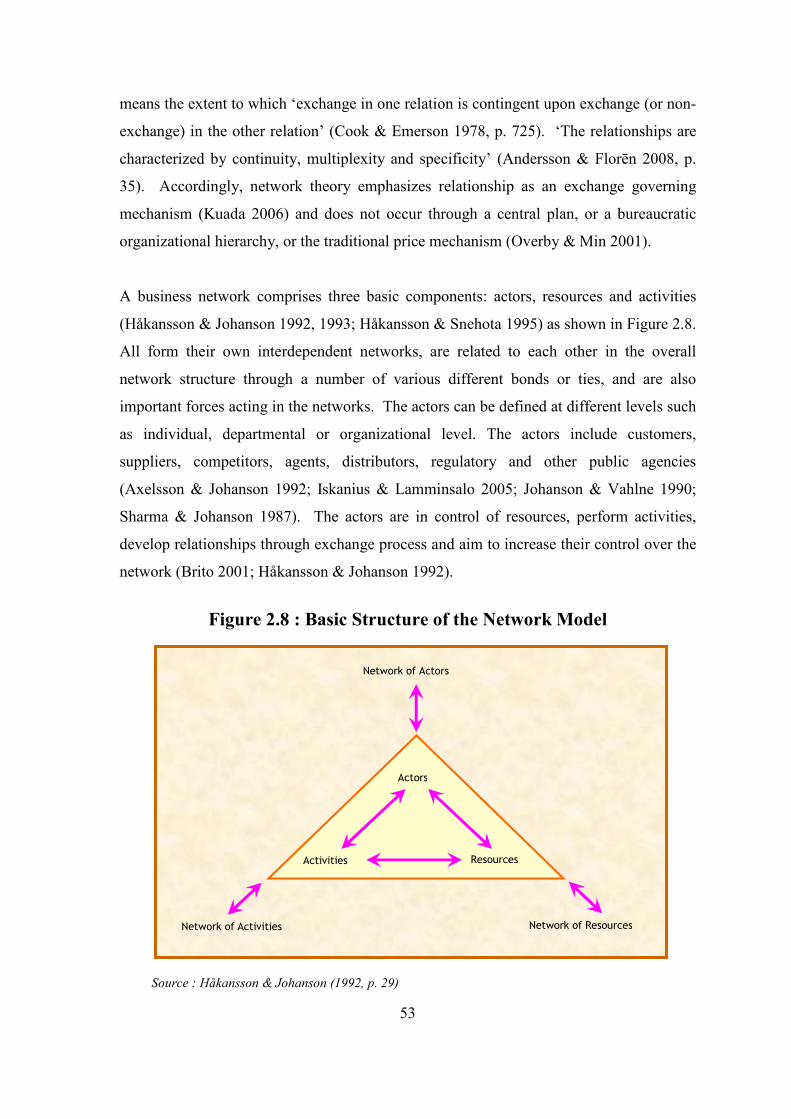
53
means the extent to which ‘exchange in one relation is contingent upon exchange (or non-
exchange) in the other relation’ (Cook & Emerson 1978, p. 725). ‘The relationships are
characterized by continuity, multiplexity and specificity’ (Andersson & Florēn 2008, p.
35). Accordingly, network theory emphasizes relationship as an exchange governing
mechanism (Kuada 2006) and does not occur through a central plan, or a bureaucratic
organizational hierarchy, or the traditional price mechanism (Overby & Min 2001).
A business network comprises three basic components: actors, resources and activities
(Håkansson & Johanson 1992, 1993; Håkansson & Snehota 1995) as shown in Figure 2.8.
All form their own interdependent networks, are related to each other in the overall
network structure through a number of various different bonds or ties, and are also
important forces acting in the networks. The actors can be defined at different levels such
as individual, departmental or organizational level. The actors include customers,
suppliers, competitors, agents, distributors, regulatory and other public agencies
(Axelsson & Johanson 1992; Iskanius & Lamminsalo 2005; Johanson & Vahlne 1990;
Sharma & Johanson 1987). The actors are in control of resources, perform activities,
develop relationships through exchange process and aim to increase their control over the
network (Brito 2001; Håkansson & Johanson 1992).
Figure 2.8 : Basic Structure of the Network Model
Source : Håkansson & Johanson (1992, p. 29)
Actors
Activities Resources
Network of Actors
Network of Activities Network of Resources

54
An activity takes place when one or several actors combine, develop, exchange or create
resources by using other resources. Activities do not occur alone in isolation. A change
in one activity will affect other activities in the network. Coordination is essential because
of various dependency relationships between the activities (Håkansson & Johanson 1992;
Iskanius & Lamminsalo 2005).
The resources of a firm are heterogeneous and include physical resources, financial
capital, technology, human capital, market and knowledge. An actor can exercise control
over the resources directly by formal ownership, or indirectly through network
relationships with other actors (Håkansson & Johanson 1992). The power of influence
within the network comes from control over key resources (Ford et al. 2003) and the skill
of influencing the decisions of other network actors (Thorelli 1986; Brito 2001).
The network approach emphasizes cooperation, complementarity and coordination
(Easton 1992). Network development requires investments (Johanson & Mattsson 1985,
1987; Håkansson 1982; Turnbull & Wilson 1989; Turnbull, Ford & Cunningham 1996).
It takes time, efforts and resources to establish, develop and build relationships (Easton
1992; Johanson & Mattsson 1987, 1988). Relationships built on strong bonds are based
on trust and mutuality whereas weak relationships are informal without bonds (Bjorkman
& Kock 1995).
Firms form relationship through their activities in networks and gain access to resources
and markets. The network model assumes that the resources required by a firm are
controlled by other firms and can only be obtained through the network positions
(Johanson & Mattsson 1988). By using their positions in the business network, firms can
improve their access to the necessary market information, knowledge and expertise; learn
from experiences, access to new opportunities and pool resources by drawing the
complimentary strength of other actors in the networks (Chetty & Blankenburg-Holm
2000; Etemad & Wright 1999).
(ii) Network Approach to Internationalization

55
For competing successfully in a global economy, firms can take advantage of every
emerging opportunity by establishing business network which is characterized ‘by
relationships of collaboration or interdependence among firms. Any one firm neither
dominates the interaction among participants nor is it a simple economic exchange
motivated by calculations of price and quantity. Networks functions best when their
organization and activities are flexible’ (Cobb, 1997, p. 2).
The internationalization network model implies that a firm’s success in entering new
international markets depends on its network relationships within the current market, both
domestic and international, rather than on the chosen market, its cultural characteristics
and firm-specific advantages (Coviello & McAuley 1999; Johanson & Mattsson 1988). A
firm’s current business networks can form a bridge to enter foreign markets (Sharma &
Johanson 1987). The choice of foreign market and entry mode, a consequence of
business opportunities, is often a result of network relationships rather than basing on
choices and comparisons of various markets (Coviello & Munro 1997; Sharma &
Johanson 1987).
The network theory was found most appropriate for this research as technical consultancy
firms operate in an environment of network relationships which provide firms the
opportunity and motivation to internationalize (Sharma and Johanson 1987). The
professional services firms depend much on strong interpersonal relationships and
contacts to gain competitive advantage in foreign markets (Winsted & Patterson 1998).
Furthermore interfirm and interpersonal relationships play an important role in foreign
market selection (Andersen & Buvik 2002), market servicing (Welch & Welch 1996),
international market development (Coviello & Munro 1995), strategic choices and
performance (Peng & Luo 2000) and the degree of internationalization (Brush, Edelman
& Manolova 2002).
2.4.3.3 Internationalization Framework for Service Firms
The Internationalization process is a complex phenomenon. There are a number of
internationalization frameworks developed by various authorities based on different
perspectives (Aaby & Slater 1989; Asgari, Ahmad & Gurrib 2010; Baird, Lyles & Orris

56
1994; Chelliah et al. 2010; Cicic, Patterson & Shoham 1999; Javalgi & Martin 2007;
Kuada 2006; Lommelen & Matthyssens 2005; Styles & Ambler 1994). Most of these
focused on manufacturing sector and comparatively few on services (Kennedy 2005;
Lommelen & Matthyssens 2005; Samiee 1999). Only a few were pertinent to firms in the
services sector and a pertinent framework is that developed by Asgari, Ahmad and Gurrib
(2010) as depicted in Figure 2.9.
Figure 2.9 : Internationalization Framework for Service Firms
Source : Asgari, Ahmad and Gurrib (2010, p. 71)
Asgari, Ahmad and Gurrib (2010) acknowledged that business firms do not have a fixed
pattern of internationalization due to different environmental settings in which the firms
operate. The internationalization of the firms is influenced by both internal and external
factors (Choo & Mazzarol 2001; Ekeledo & Sivakumar 1998, 2004; Koch 2001; Quer,
Claver & Andreu 2007). The internal factors include firm specific resources, strategic
considerations, owner advantage factors, foreign business experience and networking
Strategic Considerations
• Motives for expansion
• Business strategy
Competitive Advantages
• Firm-specific resources
• Network relationships
Industry Characteristics
• Industry potential
• Industry uncertainty
Target Market Factors
• Market potential
• Country risk
Internationalization of Service Firms
• Decision to expand
• Choice of target market
• Timing of market entry
• Choice of entry mode
Expansion Outcomes
• Business performance
• Country image

57
capability (Ahmad & Kitchen 2008; Ekeledo & Sivakumar 1998, 2004; Koch 2001).
External factors, such as country factors, industry factors, target market potential and risk,
are usually beyond the control of the firms (Ekeledo & Sivakumar 1998, 2004; Koch
2001). This framework also investigates the impact of internationalization on firm
performance and country image.
2.4.4 Conclusion
This Section reviewed the scholarship on internationalization and globalization that relate
to service industry. It identified the pertinent theories including the U-model, I-model,
the network perspective and the internationalization frameworks. The next section
discusses the Malaysian engineering consulting industry.
2.5 The Malaysian Engineering Consulting Industry
This Section discusses the first focal theory on the evolution of the Malaysian engineering
consultancy industry following the enactment of the Registration of Engineers Act 1967
(REA). Starting with an examination of the legal framework for the registration of
engineers, it then presents the Malaysian engineering consultancy market and the major
players. The discussion includes the engineering profession’s responses to global and
regional changes. This was largely generated by technological developments and
Malaysia’s participation in the WTO and the ASEAN Free Trade Area.
2.5.1 Registration of Engineers in Malaysia
As discussed in Sub-Section 2.2.3, the country was largely dependent on British
expatriate engineers for projects in the civil, mechanical and electrical disciplines (Judin
2001). Most of the large public and private sector projects were also undertaken by
British engineering consultancy firms. During the 60s, the University of Malaya increased
its enrolments for engineering students. Several Malaysians also undertook engineering
programmes in the United Kingdom and Australia. These developments increased the
pool of Malaysian engineers who gradually replaced the British expatriates. During the

58
2nd Malaysia Plan (1965 – 1970), the Government introduced measures which were
aimed at increasing the use of Malaysian engineers and consultants at all levels of
developmental projects (Hamdan 1999). Malaysian engineers also called on the
Government to enact appropriate legislation that would protect the industry through a
registration process as well as regulate the conduct and practice of registered engineers.
The outcome was the Registration of Engineers Act 1967 (REA) which led to the
establishment of the Board of Engineers Malaysia (BEM) in 1972. All qualified
engineering graduates are legally required to register with the BEM before they
commence professional practices either as Graduate Engineers or as Professional
Engineers (PEs). The candidate must possess a basic engineering degree accredited under
the purview of the Engineering Accreditation Council (EAC) (Chiam 2009a).
Registration with the BEM is therefore a pre-requisite for registered Professional
Engineers (PEs) and engineering consulting practices to undertake and submit
engineering feasibility studies, plans, drawings, schemes, proposals, designs and reports
(Chiam 2009b). In line with the BEM’s main objective of protecting the public through
safe and ethical engineering practices, it has the authority to cancel the registration of
engineers or practices which are in breach of BEM regulations (GOM 1967).
The value chain of Malaysian engineers’ development is depicted in Figure 2.10. It starts
with a talent pool of students pursuing engineering education and obtaining engineering
degrees from recognized Malaysian or foreign universities or institutions of higher
learning. The Malaysian engineering graduates have to undergo at least three years of
training to meet the BEM requirements. The graduates who pass the Professional
Assessment Examination (PAE) can seek registration as PEs with the BEM.
The establishment of the ASEAN Free Trade Area in 1993 resulted in the partial removal
of barriers in the trade in services. A significant development was the Mutual Recognition
Agreement (MRA). Signed in 2005, the MRA permitted registered engineers in ASEAN
member countries to practise in other ASEAN countries. This regional market
liberalization made it necessary for the BEM to also permit registered engineers from
other ASEAN countries to practise in Malaysia.

59
Figure 2.10 : The Value Chain of Malaysian Engineer’s Development
Education
• Engineering degrees from either
• 38 Malaysian Universities, OR
• Pass Phase I to III of Engineering Council Examination of UK
Mutual Recognition Agreement (MRA)
• Qualified Engineers from ASEAN region signed in 2005
Related Industries
• Engineers play crucial role in infrastructure ‘Design & Build’ Projects
� Engineers can determine selection of other service providers to execute project
Source : Adapted from Accenture (2010, p. 88)
Due to the rapid changes in technology and the world economic environment, the PEs are
also required to continuously update their capabilities through the Continuing
Professional Education scheme. This requires them to accumulate 150 hours of training
every three years with a minimum of 50 hours per year. The training process is also
aimed at improving the service delivery which is interlinked with project delivery. This
continuing professional training enables the professionals to continuously learn and apply
new approaches to solve new engineering problems and challenges.
Knowledge Capital / Assets
• Green Building Index
• Various programs on
� Quality Assurance
� Health & Safety
� Material Quality
Accreditation
• Registered Graduate Engineer
• Satisfied the training requirements
• Passed the Professional Assessment Examination (PAE)
• Residing for at least 6 months prior to application
Continuing Professional Education
• 150 hours every 3 years
• Minimum of 50 hours per year
� Graduate members have
degree and are undergoing training to gain full membership
Accreditation
Natural person flow Services flow
Contractors/ Builders
Architects
Project Managers
Related Industries
Exports Imports
Accreditation Professional Engineers; Graduate
Engineers �
Surveyors
Talent Pool
Professional
Training
Education
Delivery
Knowledge
Capital / Assets

60
The protectionist orientation of the BEM is also reflected by the stipulation that only
Malaysian citizens or permanent residents are eligible for registration as Professional or
Graduate Engineers. Foreign engineers are also not permitted to operate independently of
Malaysian partners or serve as directors or shareholders of an ECS firm (USTR 2010).
However, foreign engineers can be licensed by the BEM as Temporary Engineers only for
specific projects. Furthermore, they must be sponsored by Malaysian ECS firms that are
carrying out the projects. Malaysian firms applying for licenses for foreign engineers are
required to show proof to the BEM that they were unable to find Malaysian engineers
with the necessary experience for the specific technical position. The licenses issued to
Temporary Engineers are for a renewable period of one calendar year.
All foreign applicants have to be (i) registered as a professional engineer in their home
country, (ii) have a minimum of ten years working experience, and (iii) have a physical
presence in Malaysia of at least 180 days in one calendar year (GOM 1967).
BEM registration is classified according to engineering disciplines of which the five main
disciplines are civil, mechanical, electrical and electronics, chemical and mining. There
are 45 subsidiary disciplines, mainly to cater for the specialized branches of engineering
offered by universities (Chiam 2009b).
There were a total of 69,714 engineers registered with BEM as at 30 September 2011.
They comprised 10,654 Professional Engineers, 58,994 Graduate Engineers and
66 Temporary Engineers. PEs formed 16% of the total engineers registered with the
BEM, with the remaining being mainly Graduate Engineers (BEM 2011).
As discussed, the Registration of Engineers Act was enacted in 1967 with the aims of (i)
regulating the professional conduct and practice of registered engineers, (ii) safeguarding
public interests and (iii) protecting the then infant ECS industry from foreign competition.
However, significant changes have taken place in the national, regional and global arenas
over the past five decades. Malaysia has made rapid progress in developing a large pool
of engineers with the skills and expertise to undertake a variety of mega projects
(Accenture 2010) and the ECS is now better positioned to withstand foreign competition.
61
Despite this, the REA still retains a protectionist’s orientation due to the absence of a
critical review to enhance its relevance in an era of trade and service liberalization.
2.5.2 Registration of Engineering Consulting Firms in Malaysia
All engineering consulting firms have to be registered with the BEM as engineering
consultancy practices regardless of whether they operate as sole proprietorships,
partnerships or body corporates. In the case of sole proprietorship, the sole proprietor is a
PE. In the case of partnership, all the partners have to be PEs and in the case of body
corporate, its board of directors must comprise PEs, Professional Architects and/or
registered Quantity Surveyors. While any other persons can hold a maximum share of
30% of the overall equity of the body corporate, the balance must be owned by the PEs,
Professional Architects and registered Quantity Surveyors with the PEs holding not less
than 10% (GOM 1967).
Foreign ECS firms are also permitted to establish a commercial presence on the condition
that all directors and shareholders are Malaysians. While these foreign ECS firms are also
allowed to collaborate with Malaysian firms, they are not permitted to submit engineering
plans for domestic authority approval (USTR 2010).
There were a total of 1,917 engineering consulting practices registered with the BEM as
of 30 September 2011. This comprised 838 sole proprietorships, 178 partnerships and 901
body corporates. The majority of practices were sole proprietorships (43.7%) and body
corporates (47.0%). Partnerships formed less than 10% of the total practices (BEM 2011).
2.5.2.1 Implication of the Registration of Engineers Act 1967
The REA continues to meet its aim of protecting the domestic infant ECS industry from
foreign competition since foreign ECS consultants and firms are prohibited to register
with the BEM except under certain conditions. However, the situation has now changed.
The Malaysian ECS industry has grown and matured over the years. Continued
protection is likely to result in the industry becoming over dependent on the domestic
market which being small has limited opportunities for growth and expansion. The
62
removal of the protection provided by the REA would make it necessary for the
Malaysian ECS industry to become more competitive and therefore be better positioned
to move into overseas markets.
The REA also limits the public ownership of the ECS firms to not more than 30%.
Furthermore, the management of the firms is restricted to Professional Engineers,
Professional Architects and / or registered Quantity Surveyors. This limitation constrains
the firms from being able to recruit top business experts to join its management team.
This also discourages investors to invest in the ECS firms as they would not be able to
provide business inputs and participate in management decisions. Consequently, the ECS
firms have difficulty to source for public funding and financing from financial institutions
for growth and expansion. Viewed in this context, the REA can now be considered to be a
burden to the ECS industry as it acts against the smaller and financially weaker ECS firms
gaining access to additional capital and becoming stronger and more competitive in order
to successfully enter foreign markets.
2.5.2.2 Comparative Legislations in Selected Regional Countries
This Section examines the statutory requirements relating to the registration of
professional engineers and consulting engineering practice in Malaysia, Singapore,
Thailand and Hong Kong. Table 2.12 sets out the differences in the requirements for
membership, engineering/consulting practice, ownership/equity structure and
management.
Significantly, membership of the BEM in Malaysia and Council of Engineers in Thailand
is limited to the citizens of the respective countries (GOM 1967; GOT 1999). The rules
are more relaxed in Singapore and Hong Kong with membership being also open to
ordinary residents (GOS 1991; GOHK 1997a). In Malaysia, Singapore and Thailand the
engineering consultancy practices are regulated by the professional boards or council. In
Hong Kong, only individual professionals are regulated.

63
Table 2.12 : Major Differences in Statutory Requirements
Requirement
Malaysia
Singapore
Thailand
Hong Kong
Citizenship
Malaysian
Open
Thai
Ordinary Resident
Engineering Consulting Practice
� Sole proprietorship � Partnership � Body Corporate
� Partnership � Multi-Discipline and
Corporate Practice
� Individual � Company
� Individual
Ownership / Equity Structure
For Body Corporate:
• Related Professionals
- min 70%
• Professional Engineers - min 10%
• Public - max. 30%
OPEN
(Not stated)
(Not regulated)
Management
• Sole proprietor and partners of Partnership must be
Professional Engineers
• Board of Directors of body corporate must be Professional Engineers, Professional Architects, and/or registered Quantity Surveyors
• The managing partner or company director must be a Professional Engineer with practising certificate.
• At least half of the total partners in a partnership or directors in a company are licensed.
• The managing partner or managing director of a company must be licensed.
(Not regulated)
Source : GOM (1967); GOHK (1997a); GOS (1991); GOT (1999)
Singapore, Thailand and Hong Kong do not regulate the shareholding of the ECS practice.
In Malaysia however, equity ownership of ECS firms by the public is limited to a
maximum of 30%. Furthermore, the sole proprietor and partners of partnership in
Malaysia must be Professional Engineers, whereas for the body corporate, the board of
directors must be Professional Engineers, Professional Architects and / or registered
Quantity Surveyors. In Singapore, the managing partner or managing director must be
Professional Engineer with practising certificate (GOM 1967; GOHK 1997a; GOS 1991;
GOT 1999).
In Thailand, at least half of the total partners in a partnership or directors in a company
are licensed. In addition, the managing partner or managing director of a company must
be licensed (GOT 1999). In Hong Kong, the consulting engineer must be registered with

64
the Building Authority as well in order to be appointed as the Authorized Person for the
engineering work (GOHK 1997b).
2.5.3 Other Major Malaysian Engineering Organizations
In addition to the BEM, Malaysian engineers may also be affiliated to two other major
engineering bodies. These are namely, the Institution of Engineers, Malaysia (IEM) and
the Association of Consulting Engineers Malaysia (ACEM).
2.5.3.1 The Institution of Engineers, Malaysia
The IEM, registered under the Malaysian Societies Act 1966, is a private professional
body that promotes and advances the science and profession of engineering in all its
disciplines. It also facilitates the exchange of information and ideas related to engineering
(Chiam 2009c). With a total membership of over 21,000 in 2010, the IEM has 17
divisions of engineering with civil engineering being the major division. The IEM
membership is voluntary and is accepted by the BEM as a qualification for registration as
a PE. The IEM plays an important role in the BEM as five of the 17 council members of
the BEM are nominated by the IEM (Chiam 2009b).
2.5.3.2 The Association of Consulting Engineers Malaysia
The ACEM was founded in 1963 with the objective of
‘promoting the advancement of the profession of consulting engineering by associating
together for consultation and cooperation those engineers whose work is of a purely
consultative nature, and of providing facilities for Governments, Public Bodies,
Associations representing industry and trade, and others to confer with CE as a body and
to ascertain their collective views’ (ACEM 2011, p. 34).
The ACEM deals with matters relating to the status, professional conduct and
emoluments of CEs. While membership is voluntary, it is limited to engineers practicing

65
in Malaysia as a CE either individually or as a partner or consultant of a firm of CE in
Malaysia or as a director or shareholder of an engineering consulting company in
Malaysia (ACEM 2011).
As of 8th February 2011, the ACEM had a total individual membership of 698 PEs,
representing 142 engineering consultancy practices of which 117 were body corporates
(ACEM 2011). The majority of the ACEM members comprised the bigger practices of
body corporates.
Although the ACEM was established before the enactment of the Registration of
Engineers Act 1967 (REA) and the establishment of the Institution of Engineers,
Malaysia, it is noteworthy that there is no specific provision in the REA for ACEM
representation in the BEM Council. Members of the ACEM are fundamentally business
entities. This again points to the need for amendments to be made to the REA to enable
ACEM members to perform as successful and expanding business entities.
2.5.4 The Malaysian Engineering Consulting Market
The Malaysian Government’s spending on infrastructure development is a major revenue
source for Malaysian ECS and construction industries as it accounted for 40% to 60% of
the total value of the projects in both in 2009 (Accenture 2010). The gross Federal
Government development expenditure, domestic private investment and FDI are shown in
Table 2.13. In 2009, the Malaysian gross development expenditure amounted to
RM53.563 billion or an increase of 25% from previous year. However, domestic private
investment and FDI declined due to the worldwide financial crisis of 2008/2009.
The revenues of the domestic ECS industry were estimated to be worth between RM1.59
billion to RM2.39 billion against the total construction project size of RM78.6 billion
(Accenture 2010).
2.5.4.1 The Major Malaysian ECS Players

66
a
Table 2.13 : Gross Federal Government Development Expenditure
(RM billion)
Year
2005
2006
2007
2008
2009
2010
Gross Development Expenditure (RM billion)
30.534
35.807
40.564
42.847
53.563
51.220
Domestic Private Investment (RM billion)
27.688
22.150
21.915
28.274
12.573
-
Foreign Direct Investment (RM billion)
17.883
20.228
33.426
48.099
12.160
-
Source : GOM (2009)
a) Revised estimate
c) January – June 2009
b) Budget allocation d) January – August 2009
The total number of staff and the number of engineers employed are indicators of the size
of the ECS firms (Kreitl, Urschitz & Oberndorfer 2002). Based on these criteria, the ten
major Malaysian ECS firms and the disciplines in which they are involved are shown in
Table 2.14. The big Malaysian ECS firms have generally average total staff strength of
about 500. They are multidisciplinary offering civil, mechanical and electrical services
and are service exporters.
Table 2.14 : Ten Major ECS Firms in Malaysia
Ranking
Name of Firm
Total no. of
Staff
Total no. of Engineers
Disciplines
Service Export
1
Sepakat Setia Perunding Sdn Bhd
515
246
C, M, E
Yes
2
Minconsult Sdn Bhd
450
225
C, M, E
Yes
3
HSS Integrated Sdn Bhd
370
150
C, M, E
Yes
4
SMHB Sdn Bhd
300
NA
C, M, E
Yes
5
SKM Consulting Services (M) Sdn Bhd
230
108
C
Yes
6
G& P Professionals Sdn Bhd
221
140
C, M, E
Yes
7
KTA Tenaga Sdn Bhd
212
83
C, M, E
Yes
8
Zaidun – Leeng Sdn Bhd
199
76
C, M, E
Yes
9
KTA (Sarawak) Sdn Bhd
190
84
C, M, E
Yes
10
Arup Jururunding Sdn Bhd
181
86
C, M, E
Yes
Source : ACEM (2011)
a) Include specialists other than engineers
b) C : Civil, M : Mechanical, E : Electrical
a
c
d
b

67
2.5.4.2 Malaysian ECS Export Performance
There is limited recent literature on the export performance of Malaysian ECS firms.
However, the findings of a survey conducted in 2002 by the BEM in collaboration with
the ACEM and the Professional Services Development Corporation (PSDC), Looi (2003)
revealed that:
• About 12% of the surveyed ECS firms earned foreign income;
• Export earnings accounted for a 5.5% share of the total revenue of the exporting
firms;
• Total export earnings amounted to 1.5% of the total industry earnings.
Viewed in this context, the actual exports of Malaysian ECS firms are small. Further
more, only a handful of ECS firms benefited from exports. Looi (2003, p. 16) concluded
that for the Malaysian ECS firms ‘the spirit is willing but the flesh is weak’. The lack of
service export could be also due to Malaysian ECS firms being complacent and ignorant
of the gains emerging from exports. Preferring the comfort zone of the domestic market,
they were hesitant to venture into a highly competitive and unfamiliar international
market (Wong 2000; IEM 2001).
Notwithstanding, the Malaysian ECS firms are participating in global projects particularly
in the ASEAN region, other Asian countries and the Middle East as shown in Figure 2.11.
Vietnam, Indonesia, India, Saudi Arabia and Pakistan were the five most active markets
for Malaysian ECS firms in 2008 as shown in Table 2.15.
2.5.5 Challenges Faced By Internationalizing Malaysian ECS Firms
Firms face various barriers, obstacles and challenges in their effort to market and export
their products or services in the international markets (Bilkey 1978; Bilkey & Tesar 1977;
Eshghi 1992; Grönroos 1999; Rabino 1980; Welch & Luostarinen 1993). Accordingly,

68
Table 2.15 : Foreign Presence of Malaysian ECS Firms
Ranking
Country
No. of Firms
No. of Projects
1
Vietnam
9
14
2
Indonesia
9
11
3
India
5
11
4
Saudi Arabia
5
7
5
Pakistan
4
8
6
Philippines
4
5
7
Dubai
3
12
8
China
3
7
9
Syria
3
5
10
Abu Dhabi
3
3
11
Qatar
3
3
12
Singapore
3
3
Source : PSDC (2008)
Malaysian internationalizing ECS firms are facing key challenges as shown in Figure 2.12.
Figure 2.11 : Regional Breakdown of Malaysian ECS Firms and Their Foreign Markets
21
10
31 2
15
2
44
32
31 2
41
2
0
5
10
15
20
25
30
35
40
45
50
ASE
AN
Oth
er Asian
Count r
ies
Af ric
a
Aust
ralasia / Ocea
nia
Euro
pe
Mid
dle
Eas
t
N&S Am
erica
Regions
Number
Number of Companies
Number of Projects
Source : PSDC (2008, p. 9)

69
Figure 2.12 : Challenges Faced By Internationalizing Malaysian ECS Firms
Source : Developed for this Research
These are global competition, global mindset, financial capital, human capital and
innovation. They are subsequently discussed.
2.5.5.1 Global Competition
The GATS, bilateral, multilateral and regional free trade agreements (FTAs) create a
more liberalized and open trading environment leading to an increasingly integrated
world market for services. The entry of new players and rivals threaten Malaysian
ECS providers operating in both the domestic and international markets. Rivalry and
competition among the industry players will be intensified and may lead to
hypercompetition, which is described by Grant (2005, p. 105-6) as ‘industry
environments characterized by intense and rapid competitive moves where competitors
Internationalization of Malaysian
ECS Firms
Global Competition
Financial Capital
Human Capital
Global Mindset
Innovation

70
must move quickly advantages and erode the advantages of their rivals’. This speeds up
the dynamic strategic interactions among competitors.
This definition implies that competition is dynamic and transitory. Competitive
advantage is the foundation of a firm’s performance in competitive market (Porter 1985).
To compete successfully in an industry, Porter (1980) contended that a firm must exploit
its strength by pursuing one of three generic strategies: 1) differentiation, 2) cost
leadership or 3) focus as illustrated in Figure 2.13. Porter’s generic strategies are
founded on pricing advantages and product uniqueness. Porter (1985) also identified five
sources of competitive advantage: 1) marketing, 2) research and development, 3)
organization advantages, 4) firm functional area advantages and 5) network relationship
advantages. Competitive advantage in international markets can be derived from the
firm’s products, markets, technology orientation, and resources (Cavusgil & Nevin 1981).
Figure 2.13 : Porter’s Three Generic Strategies
Strategic Advantage
Perceived Uniqueness by the Customer
Low Cost Position
Strategic Target
Industry wide
Differentiation
Overall
Cost Leadership
Particular Segment Only
FOCUS
Source : Porter (1980, p. 39)
Superior export performance is driven by competitive advantages which are linked to
competitive resources and competitive skills in exporting as shown in Figure 2.14 (Piercy,
Kaleka & Katsikeas 1998). As such, the Malaysian ECS providers have to continuously
create new competitive advantages deriving from competitive resources and skills to
neutralize their rivals’ competitive advantages.

71
Figure 2.14 : Sources of Superior Performance in Exporting
Source : Piercy, Kaleka & Katsikeas (1998, p. 381)
2.5.5.2 Global Mindset
Organizations and individuals need to develop global mindsets in facing the challenge of
globalization (den Dekker, Jansen & Vinkenburg 2005). According to Rhinesmith (1993,
p. 24), a global mindset is
‘a way of being rather than a set of skills. It is an orientation of the world that allows one
to see certain things that others do not. A global mindset means the ability to scan the
world from a broad perspective, always looking for unexpected trends and opportunities
that may constitute a threat or an opportunity to achieve personal, professional or
organizational objectives.’
‘An individual global mindset is a way one perceives the world and the globalization of
markets, people and companies’ (den Dekker, Jansen & Vinkenburg 2005, p. 2). Global
mindset has been found to link to values, attitudes, foreign works experience and
education of the managers (Bilkey & Tesar 1977; Joynt & Welch 1985; Wiederheim-Paul,
Olson & Welch 1978). Managers with a global mindset understand the interdependence
of their firms with the global economy (Javalgi & Martin 2007; Kedia & Mukherji 1999;
Kefalas 1998), are aware of the diversity across cultures and markets and able to response
with speed and accuracy in the fast changing globalized world (Gupta & Govindarajan
2002).
Kefalas (1998) developed the taxonomy of global mindset using the two dimensions of
thinking or conceptualizing and acting or contextualizing as depicted in Figure 2.15. He
concluded that the mindset combining global thinkers and local actors is the most
appropriate for organizations’ global expansion.
Competitive
Advantage
Superior Export
Performance
Resources
Skills

72
Malaysian ECS providers that are in the process of becoming globally competitive by
internationalizing their operations have to formulate strategies for successfully entering
into foreign markets (Thompson, Strickland & Gamble 2007). They also have to comply
with the regulatory requirements in the targeted new markets. These regulations could
relate to the securing of business licenses, the registration of professional engineers,
equity capital and partnerships with domestic engineering firms. Viewed in this context
(Kefalas 1998), taxonomy of global mindset in particular the global dimension of ‘think
globally, act globally’ is very pertinent as it clearly requires the senior management of
exporting ECS firms to have a full understanding of the regulatory environment in the
targeted new market as well as to have a global orientation in order to successfully meet
the regulatory requirements.
Figure 2.15 : The Two Dimensions of Global Mindset
Think : Conceptualization
Act : Contextualization
Locally
Globally
Locally
Think Locally Act Locally
Think Globally
Act Locally
Globally
Think Locally Act Globally
Think Globally Act Globally
Source : Adapted from Kefalas (1998, p. 558)
Inappropriate mindset, apart from other external factors, was identified by Peng (2007) to
be a major factor that resulted in the low percentage of export of the total output of
Malaysian small and medium organizations. When asked about exporting their services,
Peng (2007, p. S10) reported that the typical responses were:
• ‘We’re just a small business.
• We’re too small to go international.

73
• We can’t even cope with local markets, how can we penetrate international markets?
• Let me be successful in Malaysia first. Only then I think about going abroad.’
The cited responses show that Malaysian firms lack global mindsets and are basically
domestic orientated. The global mindset is an important determinant for international
export involvement particularly at the pre-export stage (Cavusgil & Nevin 1981; Lim,
Sharkey & Kim 1993). The decision makers with broad global mindset have a higher
probability of being exposed to and perceiving export stimuli (Wiedersheim-Paul, Olson
& Welch 1978).
2.5.5.3 Financial Capital
The typical Malaysian ECS firm is relatively small (Ling, Abidin & Heng 2000). Lack of
capital to finance export activities is a major challenge preventing non-exporters from
exporting (Edmunds & Khoury 1986; Patterson 2004; Saleh & Ndubisi 2006). Most of
the firms rely on their own savings or internally generated funds, borrowings from friends
or relatives or informal lenders to finance their business operations (Aris 2006; Chin 2010;
Tambunan 2009). Although exporting increases revenues and greater profits, these
benefits only come much later since capital is immediately needed to finance the required
increases in business activities. Furthermore, the exporter may face serious non-payment
problems as the firms are dependent on cash flow for survival (Coulthard 2008).
The Census of Establishment and Enterprises, conducted by the Malaysian Department of
Statistics Malaysia in 2005, indicated that the exporting service firms need financing for a
range of activities in support of their internationalization. These include:
• Investment in new and strategic technology such as computer systems, softwares,
information and communication technologies.
• Improving and upgrading existing services and work processes.
• Quality certification, management system improvements and skill upgrading.
• International market development.
• New business start-ups.

74
Service exporters face problems in securing finance from financial institutions which are
usually very conservative in their lending policies toward service firms (Saleh & Ndubisi
2006). Lenders insist on borrowers providing traditional collateral such as fixed assets as
security. Usually service firms have little collateral to pledge other than the assignment
of the proceeds of the service (Aris 2006; Chan & Coulthard 2005; Chin 2010). This
situation arises because the most valuable asset of a service firm is the knowledge asset
and the human resources which are not shown in the balance sheets (Coulthard 2008).
For service firms with limited asset bases, they generally lack the financial track record
and have insufficient documents to support loan application (Aris 2006).
The Malaysian Government has a range of financial support programmes to help the
service exporters as discussed in Sub-Section 2.6.2. However, as noted in Sub-Section
2.6.3, these loans have been suspended. Firms therefore have to obtain loans from the
banking sector and tend to pay higher interest rates (Saleh & Ndubisi 2006).
2.5.5.4 Human Capital
The resource-based view (RBV) theory postulates that human resource is a strategic asset
in the firm (Wright & McMahan 1992) especially for a knowledge-based ECS firm.
Knowledge is the most critical competitive asset that a firm possesses (Grant 1996) and is
the driving force for sustainable long term growth (NEAC 2010). A firm’s knowledge
mainly resides in its human capital. People possess knowledge which has its own value
and that makes individuals unique and valuable to society and to organization (Syed-
Ikhsan & Rowland 2004). An organization can build sustainable competitive advantage
based on valuable, rare, imperfectly imitable and non-substitutable internal resources
(Barney 1986, 1991, 1995; Barney, Wright & Ketchen 2001) or by using human resource
strategies (Lado & Wilson 1994; Pfeffer 1994; Wright & McMahan 1992).
Human capital constitutes the knowledge stock of the employees of an organization
(Bontis, Crossan & Hulland 2002). Education and training are the most important
investments in human capital (Becker 1993) as they increase the capabilities of a person
in performing activities of economic value (Marimuthu, Arokiasamy & Ismail 2009). A

75
conceptual model linking human capital investment, human capital effectiveness and firm
performances is depicted in Figure 2.16.
Figure 2.16 : Conceptual Model of Human Capital Investment, Human Capital Effectiveness and Firm Performances
Source : Marimuthu, Arokiasamy & Ismail (2009, p. 270)
Malaysian ECS firms require professional management structures that are well suited to
research global markets, understand the competitive landscape and be competent to meet
the regulatory requirements of countries in which they intend to start foreign operations
(Norton 2007). Malaysian ECS firms can meet this external challenge by hiring
knowledge based professional staffs that are able to understand, interpret and effectively
address the complex external regulatory environment (David 2005).
Malaysia’s commitment toward human capital development, as indicated by its
expenditure in public education expressed in percentage of GDP and shown in Table 2.16,
Table 2.16 : Expenditure on Education (% of GDP) Country
1980
1990
2000
2005
2007
China
2.5
2.3
•
•
•
Japan
5.8
4.6
3.7
3.5
3.4
South Korea
3.5
3.3
•
4.1
4.2
Singapore
2.7
3.0
•
•
•
US
6.5
5.0
•
5.4
5.5
Malaysia
5.7
5.1
6.0
7.5
4.5
Source : UNDP (2010)
• Not available
Human Capital Investment
• Training
• Education
• Knowledge
• Skills
Firm Performance
• Financial performance
• Non-financial performance
Human Capital Effectiveness

76
is in par with newly industrialized economies (NIEs) and the developed countries such as
Japan and USA (Mani 2004).
However, compared to the NIEs and as shown in Table 2.17, Malaysia has a
comparatively scarce and less qualified human capital in science, engineering and
technology (Mani 2000; Rasiah 2010). It trailed far behind the NIEs as shown by the
indicators in technical enrolment as percentages of all secondary students, science
and technology (S&T) graduates as percentage of all graduates, engineering
enrolment as percentage of population, and research scientists and engineers per 10,000
labour force. Furthermore, Malaysia is experiencing a steady decline in the output of
science and engineering graduates as a percentage of total graduates of first and post-
graduate degrees (NEAC 2010).
Table 2.17 : Indicators of Technical Human Capital
Table 2.17a : Technical enrolment as percentage
of all secondary students
Table 2.17b : S&T graduates as percentage of
all graduates
1988-1991
2000
2009
1990
2000
Republic of Korea
18.6
18.6
12.1
Republic of Korea
42
44
Singapore
n.a.
5.6
11.6
Singapore
53
63
Taiwan Province of China
n.a.
n.a.
n.a.
Taiwan Province of China
48
56
Malaysia
2.2
2.2
6.6
Malaysia
32
39
Source : Lai & Yap (2004, p. 58 ); MSTI (2012); UISE (2011) n.a. : not available
There are also poor linkages between industry and the higher education institutions and
this is resulting in the supplied learning and training not meeting industry needs. (Lall
Table 2.17c : Engineering enrolment as
percentage of population
Table 2.17d : Research scientists and engineer
per 10,000 labour force
1990
2000
1990
2000
2009
Republic of Korea
0.46
0.68
Republic of Korea
53
45
100
Singapore
0.45
0.65
Singapore
30
85
101
Taiwan Province of China
0.51
0.70
Taiwan Province of China
31
80
109
Malaysia
0.02
0.16
Malaysia
2
10
21

77
1999; NEAC 2010) The situation is also compounded by Malaysia’s high labour
mobility and brain drain. The country’s highly skilled and qualified engineers are
continuously searching for better career prospects, higher job remuneration and improved
working conditions in other professions or in foreign countries. A large number of
overseas graduates are also reluctant to return home after completing their studies abroad
(Chiam 2009a; Edge 2011; Knight 1999; Lai & Yap 2004; PEMANDU 2010; Sjöholm
2002; Wong 2011; World Bank 2011).
2.5.5.5 Innovation
Innovation is one of the key success factors in today’s new knowledge economy
(Mustapha & Abdullah 2004). The business world keeps evolving in this era of
globalization and competition, constant and continuous innovation is the only strategy for
survival, success and excellence of organizations (Peters 1997). While innovation brings
opportunities in today’s competitive environment, it also creates uncertainties and risks if
resisted (Ahmed 1998). Innovation results in higher quality job, successful businesses,
better and cheaper products and services, more efficient processes and greater
productivity. Firms that do not continually innovate products, services or processes will
be at a distinct disadvantage, losing customers and market share to competitors (Mowry
2007). Innovation is therefore vital for the success of Malaysian ECS firms in the
international arena.
Majaro (1988) referred innovation as a process where ideas were generated and
implemented as business products or services. Creativity is thus seen as the front end of
the innovation value chain which comprises creation, research, development and
commercialization under the supply push and demand pull factors (Endut 2007) as
depicted in Figure 2.17.
Malaysia is lagging behind and lacking in innovation. This is evident by a review of
patents granted by the United States Patent and Trademark Office (USPTO). In 2009,
Malaysia had 181 patents granted by USPTO. This was much lower compared to patents

78
Figure 2.17 : The Innovation Value Chain
Source : Adapted from Endut (2007)
granted by the same agency to Taiwan (7,781), Singapore (493), South Korea (9,566),
Japan (38,066) and China (2,270) as shown in Table 2.18.
Table 2.18 : Patents Granted by the USPTO
Country
2002
2003
2004
2005
2006
2007
2008
2009
China
390
424
597
565
970
1,235
1,874
2,270
Japan
36,339
37,248
37,032
31,834
39,411
35,941
36,679
38,066
South Korea
4,009
4,132
4,671
4,591
6,509
7,264
8,730
9,566
Singapore
421
460
485
377
469
451
450
493
Taiwan
6,730
6,676
7,207
5,993
7,920
7,491
7,779
7,781
Malaysia
62
63
93
98
131
173
168
181
Source : USPTO (2009)
2.5.6 Conclusion
This Section discussed the Malaysian engineering consulting practice, the processes
associated with the registration of engineers and consulting practices in Malaysia, the
Supply Push Demand Pull
The Innovation
Value Chain
Creation – Research – Development - Commercialization
• Supply of skilled workers
• Supply of creative employees
• Supply of ideas
• Demand from market
• Demand from population
• Demand from industry
79
Malaysian engineering institution and organizations. It described the Malaysian
engineering consulting market, the major Malaysian ECS players and their export
performance. The Section ended with the challenges faced by internationalizing
Malaysian firms. The next section discusses the focal theory of the Malaysian
Government policies on service exports.
2.6 The Malaysian Government Policies on Services Exports
This Section discusses the Malaysian Government’s support for services export and the
service support delivery framework. These are largely through the Malaysia External
Trade Development Corporation (MATRADE) and National Professional Services Export
Council (NAPSEC). The section ends with an assessment of the effectiveness of the
Malaysian Government’s export programmes.
2.6.1 The Malaysian Government’s Support for Services Exports
Malaysia is dependant on export earning to sustain its growth and development.
Services exports constitute the smallest percentage of the total output within the service
sector, compared with the primary and secondary sectors. Furthermore, the service
account in the balance of trade from 1991 to 2000 had been consistently in the deficits.
Although, the percentage of output of services exported increased from 8.5 percent in
1991 to 14.4 percent in 2000, it was smaller than the share of imported service inputs
which increased from 18.8 percent in 1991 to 35.8 percent in 2000. Significantly,
engineering services and construction which did not export in 1991, registered 4.3 percent
in 2000 (GOM 2006a).
Accordingly, the IMP3 covering the period 2006-2020, focuses on the continuing
development and growth of the services sector. The goal is for services export to increase
from 12.4 percent in 2005 to 19.5 percent of the total export by 2020 (GOM 2006a).
Measures are therefore being taken to enhance the country’s position as a major exporter
of services in order to meet the targeted average GDP growth of 6.3 percent during the
IMP3 period.

80
Average annual growth rate in %
for 2011-15 period
Share to GDP in % in 2015
Manufacturing
Construction
MiningAgriculture
Services61.1
5.96.6
26.3
2.9
6.0
7.2
5.7
3.7
3.3
1.1
GDP
Services
Manufacturing
Construction
Agriculture
Mining
Intensifying exports of services is one of the eleven strategic thrusts of the Government’s
policies to increase export earnings in the highly competitive and challenging
international trade arena. The measures underway to enhance the exports of services
include:
a) using the two services funds, the Export Services Fund and the SMEs Export
Services Fund as vehicles to increase the capacity and the export capabilities of
the services sector;
b) enhancing market access through multilateral, regional and bilateral agreements;
and
c) encouraging SMEs in professional services to venture into export markets with
support from MATRADE.
The 10MP for the period 2011-2015 also highlights the importance of the services sector.
As shown in Figure 2.18, the services sector is expected to grow at 7.2% annually until
2015, with its contribution to GDP increasing to 61.1%. To achieve this, the Government
Figure 2.18 : The Projected Services Sector Growth and Share to GDP for 10MP
Source : GOM (2010b, p. 75)
is increasing its support to domestic services providers to prepare them for the challenges
emerging from the increased competitive pressures arising from trade liberalization. With
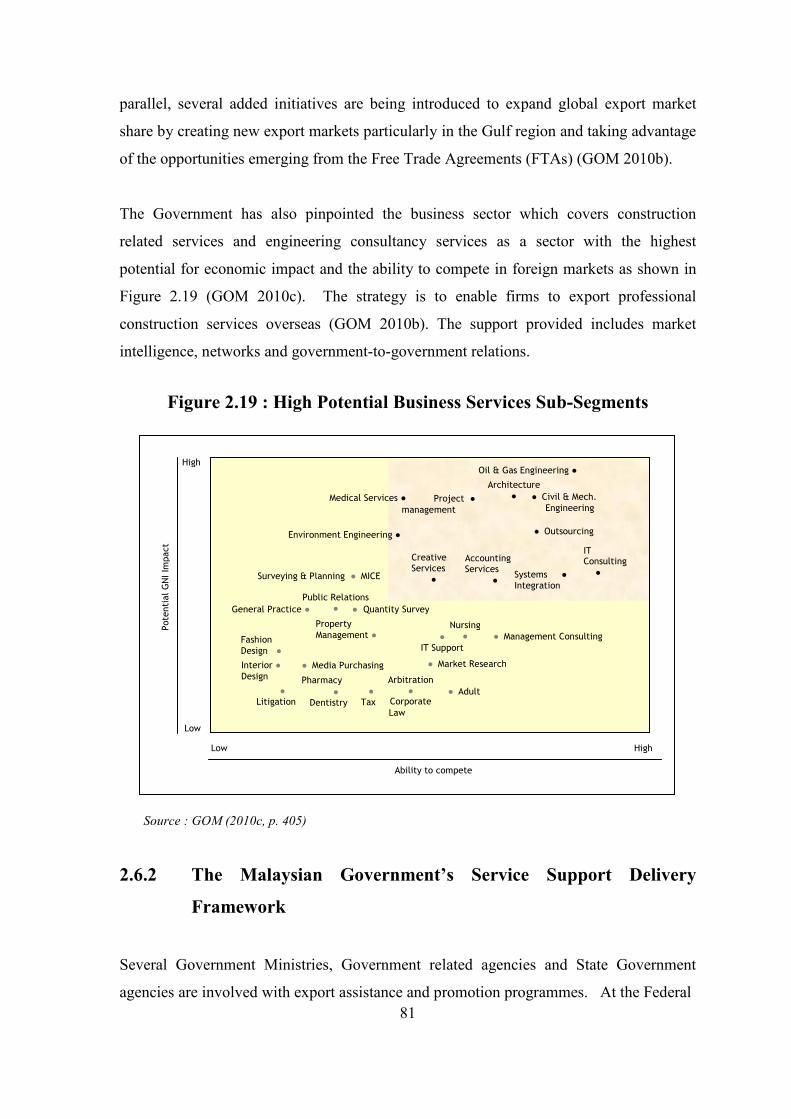
81
parallel, several added initiatives are being introduced to expand global export market
share by creating new export markets particularly in the Gulf region and taking advantage
of the opportunities emerging from the Free Trade Agreements (FTAs) (GOM 2010b).
The Government has also pinpointed the business sector which covers construction
related services and engineering consultancy services as a sector with the highest
potential for economic impact and the ability to compete in foreign markets as shown in
Figure 2.19 (GOM 2010c). The strategy is to enable firms to export professional
construction services overseas (GOM 2010b). The support provided includes market
intelligence, networks and government-to-government relations.
Figure 2.19 : High Potential Business Services Sub-Segments
Source : GOM (2010c, p. 405)
2.6.2 The Malaysian Government’s Service Support Delivery
Framework
Several Government Ministries, Government related agencies and State Government
agencies are involved with export assistance and promotion programmes. At the Federal
Architecture
● ● Civil & Mech. Engineering
Project ● management
Environment Engineering ●
Creative Services
●
Accounting Services
● Systems ● Integration
IT Consulting
● Surveying & Planning ● MICE
Public Relations
●
● Quantity Survey General Practice ●
Property
Management ● Fashion
Design ●
Interior ● Design
● Litigation
● Dentistry
● Media Purchasing
Pharmacy
● Tax
Arbitration
● Corporate
Law
● Adult
● Market Research
● IT Support
Nursing
● ● Management Consulting
Low
Low
High
Ability to compete
Potential GNI Impact
Oil & Gas Engineering ●
Medical Services ●
High
● Outsourcing

82
Government policy level, the Ministry of International Trade and Industry (MITI) has the
responsibility for the formulation and implementation of all international trade and
investment policies. At the implementation level the agencies are the MATRADE and
NAPSEC. The roles of each of them are discussed briefly below.
2.6.2.1 The Malaysia External Trade Development Corporation
MATRADE established in 1993, is the Malaysian national export promotion agency
which assists Malaysian exporting companies in international markets. With five local
branches in Malaysia and a network of 40 overseas offices, MATRADE’s principal
functions are (www.matrade.gov.my, viewed 18 September 2010):
• Channel overseas trade enquiries to Malaysian businesses and assist Malaysian
exporters doing business overseas.
• Co-ordinate and facilitate business networking with foreign buyers through the
participation of Malaysian exporters in international trade fairs, trade exhibitions
and investment missions abroad.
• Organise promotional activities for Malaysian products and services in the countries
where MATRADE overseas offices are located.
MATRADE also assists Malaysian firms, particularly the small and medium sized
companies to undertake activities and develop export markets through three main
assistance programmes: 1) Market Development Grant, 2) Brand Promotion Grant and
3) Services Export Fund as shown in Table 2.19. These grants are to partly compensate
the cost incurred in undertaking the export promotion activities. However, these grants
are only accessible to SMEs or service firms with an annual sales turnover of less than
RM5 million and with less than 50 full-time employees.
2.6.2.2 Professional Services Development Corporation

83
Table 2.19 : MATRADE Export Assistance Programmes
Assistance Programme
Objective
Market Development Grant
To undertake activities for the developments of exports.
Brand Promotion Grant
To develop and promote an international brand.
Services Export Fund
Grant 1
To participate in tenders to undertake studies.
Grant 2
To participate in tenders for projects or to prepare negotiated project proposals.
Grant 3
To carry out pre-feasibility and feasibility study.
Grant 4
To undertake services promotion activities.
Source : MATRADE website (www.matrade.gov.my)
PSDC was established in 2002 as a private limited company. While it was wholly owned
by Malaysia’s Ministry of Finance Incorporated, it was under the purview of the Ministry
of Works. Its main objective was to make Malaysia a leading exporter of professional
services and its principal activities were:
• Dissemination of information on overseas opportunities to Malaysian Professional
Service providers (PSPs).
• Development and maintenance of database of Malaysian PSPs for the reference of
overseas customers.
• Capacity and capability building of Malaysian PSPs through training.
• Overseas promotion of achievements and capabilities of Malaysian PSPs.
• Be the voice of Malaysian Professionals by raising issues pertinent to the
professional services sectors.
Over the period 2002 to 2010, the PSDC had set up an information hub as a repository of
information on and for Malaysian professional service providers towards exporting their
services. This included statistics related to professional services, market intelligence and

84
market entry strategies, database of professional consultants and a number of publications
(PSDC 2010).
The PSDC however lacked funding for its operations and was ineffective in its unfocused
activities covering all regulated professional services under various ministries and
agencies (Accenture 2010). PSDC ceased operations on 15 April 2011 and its functions
and duties were assigned to the Construction Industry Development Board (CIDB).
2.6.2.3 National Professional Services Export Council
NAPSEC formed in 2001 is the Advisory Council to MATRADE on matters related to
the export of professional services and its terms of reference are depicted in Table 2.20.
NAPSEC’s members comprise representatives from professional councils, institutions,
professional trade associations as well as Government Ministries and agencies pertaining
to professional services. The professional members include town planners, architects,
engineers, contractors, surveyors, accountants, lawyers and healthcare. With the
participation of its members, NAPSEC provides a forum for obtaining the views and
inputs of the private sector in the formulation of the strategies and programmes for the
export of professional services (www.matrade.gov.my, viewed 18 September 2010).
Table 2.20 : NAPSEC’s Terms of Reference
� Formulate and review national strategies and promotional programmes for the export of professional
services.
� Recommend and facilitate funding for the export of professional services.
� Increase participation of Malaysian professionals in overseas projects funded by international lending
agencies.
� Gather and disseminate information related to market opportunities.
� Review and recommend incentives for the export of professional services.
� Compile database/directories of export ready professional services.
� Develop database on market access issues and regulations affecting export of professional services.
� Monitor global developments and its implications on Malaysia’s professional service export.
Source : MATRADE website (www.matrade.gov.my)

85
2.6.2.4 The SME Corporation Malaysia
The SME Corporation Malaysia (SMECM) formulates overall policies and strategies for
SMEs, coordinate programmes across all ministries and government agencies. It is the
central point of reference for information and advisory services for all SMEs in Malaysia.
It also provides business support such as capacity building and enhanced access to
financial assistance offered by various ministries and government agencies. However,
this agency mainly focuses on small industrial enterprises and manufacturing related
services (www.smecorp.gov.my, viewed 16 February 2012). Furthermore, SME activities
fall into three broad categories (Asokkumar 2006):
• ‘Stimulatory’ which focuses on supporting entrepreneurship. The programmes for
this include entrepreneurial education, identification of potential entrepreneurs and
motivating entrepreneurs.
• ‘Promotional’ support for entrepreneurs to establish and operate their enterprises
efficiently.
• ‘Enhancement’ activities which are aimed at moving SMEs up the value chain,
producing high quality and high value added products for international markets.
The SMECM development programme for 2011 highlights five key programmes
(SMECM 2011). These are:
• Access to financing
• Entrepreneur development
• Marketing and promotion
• Advisory services
• Infrastructure
Advisory services however, only cover the (i) SME business advisers’ network, (ii)
entrepreneur support services programme and (iii) contractor advisory services.
Accordingly, the SMECM’s involvement with the ECS industry is marginal and very
limited. The functions of the SMECM are therefore not specifically supportive of the ECS.

86
2.6.2.5 The Export-Import Bank of Malaysia
The Export-Import Bank of Malaysia Berhad (Exim Bank) provides working
capital/guarantee/assets financing of foreign services contracts to Malaysian owned or
controlled companies. The margin of financing is up to a maximum of 70% of the
contract value and security is required (www.exim.com.my, viewed 16 February 2012).
Despite the availability of this financing facility, the ECS firms still face problems as
discussed in Sub-Section 2.5.5.3 to secure the finance after procuring the project. The
Exim Bank export programmes were therefore perceived as being not very helpful to the
SMEs (Mahajar 2005; Mahajar & Yunus 2006).
2.6.3 The Effectiveness of the Malaysian Government’s Export
Programmes
The literature revealed that the Malaysian Government and its agencies have a range of
supportive programmes and incentives to assist firms to export their products and services.
However, the findings of prior research on the effectiveness of Government export
support programmes and incentives were contradictory and not conclusive (Ahmed et al.
2002; Mahajar 2005; Mahajar & Junus 2006). There was also a low level of awareness
among Malaysian small-and medium-sized firms of the export programmes and
incentives available to assist them and as such the firms did not fully benefit from them
(Ling 1992; Tan 2008). Earlier studies in other countries revealed broadly similar
findings (Austrade 1994; Coulthard 2005; Crick 1997; De Noble, Castaldi & Moliver
1989; Edmunds & Khoury 1986; Kedia and Chhokar 1986; Moini 1998).
It appears that some Malaysian firms perceived the export assistance programmes as not
being helpful (Mahajar 2005; Mahajar & Yunus 2006). However, studies implied that the
Malaysian Government export assistance programmes did encourage and promote smaller
firms to export. Some of the benefits include increased export sales, new market
penetration, increased productivity, increased profitability, increased market growth,

87
improved international networking and more foreign customers (Mahajar 2005; Mahajar
& Yunus 2006).
As discussed in Sub-Section 2.6.2, several Government Ministries and agencies are
responsible for the delivery of services export promotion and assistance programmes.
This raises the issue of the duplication of efforts and coverage as well as overlapping
responsibilities among the agencies. There is therefore a need to streamline the delivery
systems of the various Government programmes for making them more focused and
effective (Selvanathan 1999; Asokkumar 2006; Saleh & Ndubisi 2006).
Inadequate funding can render the export assistance programmes ineffective. Some of the
Services Export Fund Grants 1, 2 and 3 had been suspended since September 2009.
Another Fund had been fully utilized due to overwhelming responses from professional
services providers. Since then the funds have been kept in abeyance pending new
allocations.
2.6.4 Conclusion
This Section reviewed the Malaysian Government’s policies on services exports and the
delivery frameworks through MATRADE, PSDC/CIDB, NAPSEC, SMECM and EXIM
Bank. It assessed the effectiveness of the Malaysian Government’s export programmes.
The next section examines the global competitive advantage of the Malaysian ECS
industry.
2.7 The Competitive Positioning of the Malaysian ECS Industry
This Section assesses the competitiveness of Malaysian ECS providers embarking on
internationalization. It determines the competition scenario of Malaysian ECS providers
by using Porter’s ‘five forces framework’ (Porter 1979) and the analysis takes account of
the strengths, weaknesses, opportunities and threats to the ECS industry.
According to Porter (1979), there are five forces influencing competition in an industry :
1) the entry of new competitors, 2) the threat of substitutes, 3) the bargaining power of

88
buyers, 4) the bargaining power of suppliers and 5) the rivalry among the existing
competitors. A diagrammatic representation of the five forces framework is shown in
Figure 2.20. ‘The strength of each of the five competitive forces is a function of industry
structure or the underlying economic and technical characteristics of an industry’ (Porter
1985, p. 5).
Figure 2.20 : Porter’s Five Competitive Forces
Source : Porter (1985, p. 5)
2.7.1 Threat of New Entrants
An industry’s profitability is influenced by existing competitors as well as the potential
new entrants. While new entrants bring new capacity and resources, they reduce the
market share of existing players. The seriousness of the threat of the new entrants
depends on the entry barriers which may appear in different forms including physical,
financial or legal in nature (Porter 1979).
In Malaysia, the ECS industry is well protected from foreign competition as discussed in
Sub-Sections 2.5.1 and 2.5.2. The entry of big foreign ECS firms is currently not a major
Potential
Entrants
Industry Competitors
Rivalry Among
Existing Firms
Suppliers
Buyers
Substitutes
Threat of Substitute
Products or Services
Threat of
New Entrants
Bargaining Power of
Suppliers
Bargaining Power of
Buyers

89
threat, as the existing regulations require them to enter into joint ventures with the local
Malaysian firms to undertake projects in Malaysia. Furthermore, their services are
relatively costly compared to those offered by the Malaysian firms. Accordingly,
Malaysian ECS firms have a comparative advantage in the domestic market and protected
from foreign competition.
However, the situation could change with the Malaysian Government’s commitments to
GATS and ASEAN Framework Agreement on Services (AFAS) which call for the
progressive liberalization of the services sector. The lowering or removal of trade
barriers and protectionist measures will expose Malaysian ECS firms to major
competitive pressures. First, they have to contend with the entry of low cost service
providers from developing countries. Second they have to face the challenges of
competing with large multinational firms from the developed nations with superior
technical know-how and high quality services. Malaysian firms therefore have to build
and retain their competitive advantage to cope with the competition.
2.7.2 The Threat of Substitutes
Substitutes for ECS are hard to come by as professional services are usually legislated
and regulated. While the engineering services may be undertaken by different
organizations, they have to be performed by registered licensed engineers. Contractors or
developers may establish engineering departments or divisions in the organization mainly
to serve the needs of the in-house projects in lieu of engaging external ECS firms.
However, they do not form a serious threat to the ECS industry.
2.7.3 The Bargaining Power of Buyers
Buyers are in an enviable position of being able to press down prices, demand for more
services or higher quality and play one supplier against the other. Their ultimate aim is to
pay the lowest price and extract the maximum benefits. These have a direct impact on the
industry profitability. The buyers are powerful if 1) they are concentrated, 2) the
purchase size is large, 3) the competition in the industry is intense, and 4) the services are
standard or undifferentiated (Keegan & Green 2005; Porter 1979).

90
The buyers of ECS are mainly the public sector and the private investors or developers.
The buyers are few and highly concentrated and are often repeated buyers. They thus
possess large bargaining power over the ECS firms who have little bargaining leverage
and are generally unable to secure good concessions. The ECS firms are therefore ‘price
takers’ and ‘not price makers’ (Selvanathan 1999, p. 70).
2.7.4 Bargaining Power of Suppliers
Supplier power is the opposite of buyer power. The suppliers can exert bargaining power
by raising prices or reducing service quality. Powerful suppliers can extract profitability
from the industry if the industry is unable to recover the cost increases in its own prices.
The suppliers are powerful if : 1) they are more concentrated than the industry, 2) they
are relatively few in number, 3) the suppliers’ services are important inputs to the buyers,
4) suppliers’ services are unique, highly differentiated and carry switching costs and 5)
the industry is not a major customer of the suppliers (Keegan & Green 2005; Porter 1979).
In the Malaysian ECS industry, the suppliers only play a supportive role as most of the
services required are generated within the organizations by in-house professionals. In the
case of multidisciplinary assignments, specialist still can be readily outsourced by the
industry from other organizations on a collaborative basis. Hence the bargaining power
of suppliers for ECS industry in Malaysia is low.
2.7.5 Rivalry among Competitors
Rivalry among competitors in an industry refers to the actions taken by firms to improve
their positions for gaining advantage over the other. There are numerous competitors and
rivalry takes the form of price competition, service positioning and differentiation. Price
competition drives down prices, reduces industry profitability and creates instability in
the industry. Intense rivalry is due to a number of factors. The industry has become
mature with slow or even declining growth and market share can only be gained at the
expense of rivals. Firms are under pressure to keep production at full capacity to cover
91
fixed cost and reduce costs as a low price is the criterion for selection by customers
(Keegan & Green 2005; Porter 1979).
Malaysian ECS firms have to contend with the forces of globalization and the challenges
and opportunities come with it. These forces will intensify the competition in the
domestic market with the gradual lowering or the removal of tariff and non-tariff barriers
and the entry of foreign competitors. Malaysian ECS firms also face the prospect of
being challenged by the low cost rivals from Indonesia, India and People’s Republic of
China (PRC) and Philippines. Since they are also likely to lose ground to rivals with
advanced technology and know-how, this requires them to upgrade their technology and
skill levels. They also have to seize foreign market opportunities by exporting through
branding, price advantage and customer loyalty (Tan, 2008).
2.7.6 Conclusion
This Section evaluated the competitive advantage of the Malaysian ECS industry in the
global market using Porter’s five competitive forces. This included the threat of new
entrants, the threat of substitutes, the bargaining power of buyers, the bargaining power of
suppliers and rivalry among competitors. The next section reviews the secondary data
analysis and the conceptual framework for the research.
2.8 Secondary Data Analysis
This Section analyzes the secondary data derived from the literature review. As stated in
Sub-Section 2.1.1, the literature review had several purposes, in particular to identify the
gaps in the existing body of knowledge for developing the research questions and crafting
the research propositions for testing on this research.
2.8.1 Identification of the Research Gaps
The literature review revealed adequate information on the parent disciplines of
internationalization, globalization, the Malaysian economy and the global engineering

92
consulting industry. There was also much literature on the immediate discipline of
Malaysian Government’s support policies for services export. However, as depicted in
Table 2.21, there were gaps in the existing body of knowledge in respect of three key
research issues as follows :-
• The export positioning of Malaysian ECS firms.
• The coverage, effectiveness and delivery systems of the Malaysian Government’s
export policies and programmes.
• The appropriate strategies for the successful internationalization of Malaysian
ECS firms.
These gaps in the literature show that there is a limited body of knowledge on these issues
despite their importance to the Malaysian ECS industry. These therefore reaffirm the
relevance of the Research Problem as stated in Section 1.4 – ‘What are the Important
Critical Factors for the Successful Internationalization of Malaysian ECS Firms?’.
2.8.2 Research Questions Development
‘Empirical research is driven by research questions’ (Punch 2005, p. 34). Research
questions ‘define an investigation, set boundaries, provide direction, and act as a frame of
reference for assessing the research work’ (O’Leary 2005, p. 33). To address this
research problem and based on the research gaps identified from the research issues, three
research questions are developed in this Section.
Research Question 1
There is limited literature on the internationalization of services as compared to those for
the manufactured goods. The available literature on ECS largely relates to the situation in
the industrialized Western countries such as Sweden, New Zealand and USA (Coviello &
Martin 1999; Sharma 1988; Sharma & Johanson 1987; Warf 1996). As there is a dearth
of earlier research on competitive positioning of the Malaysian ECS industry players in

93
Table 2.21 : Identification of Research Gaps
Research Issues
Prior Literature
Research Gaps
The Malaysian Economic Development Policies
Adequate
Globalization of Services
Adequate
Internationalization Theories
Adequate
The Global ECS Industry
Adequate
The Malaysian ECS Industry
Adequate
Competitive positioning of Malaysian ECS industry under GATS
• National legislations
Inadequate
Known
• No
• Entry of international ECS firms
Known
• Impact on Malaysian ECS market.
• Competences, expertise and strengths to compete in world market
Unknown
• Yes
• Industry preparedness
Unknown
• To take advantage of emerging new market opportunities.
The Malaysian Government’s support policies and programmes for exports services
Adequate
Adequacy of Malaysian Government support policies and programmes for ECS exports.
• Effective Policy frameworks
Inadequate
Unknown
• Yes
• International promotion
Known
• Effectiveness
• Support schemes
Known
• Effectiveness
• Collaboration with Malaysian ECS industry
Known
• Effectiveness
The appropriate strategies for enhancing the global outreach of the Malaysian ECS industry
• Strategy adoption
Inadequate
Unknown
• Active formulation and implementation of internationalization strategies.
• Competent staff
Unknown
• Staff with international and entrepreneurial orientation.
• Human capital development and knowledge management
Known
• No
• Appropriate mechanisms for pooling specific competencies for joint international bidding
Unknown
• Yes
Source : Developed for this Research

94
the context in global market liberalization, the research question emerging from this gap
is:
What is the competitive global positioning of the Malaysian ECS firms in the context
of market liberalization?
Research Question 2
The discussions in Section 2.6 revealed that the Malaysian Government has a wide range
of promotional and assistance programmes as well as different delivery systems to
support Malaysian ECS firms with their export efforts. The assistance includes access to
export services funds, market development grant and capacity building programmes to
enhance export capabilities, brand development and establishing linkages with foreign
partners. The support activities include market intelligence, trade missions, trade fairs,
exhibitions, business matching, market development, brand promotion, seminars,
workshops and trainings.
However, there are few studies on the effectiveness of the Government’s policies and
their implementation. Hence, the second research question is:
How adequate and effective are the existing Malaysian Government support
programmes for the internationalization of Malaysian ECS firms?
Research Question 3
The literature review revealed that the global ECS industry is now nominated by firms
from the developed countries. Although some Malaysian ECS firms are already
participating in global projects, they face several challenges as discussed in Sub-Section
2.5.5. The key issues which have to be addressed are whether the current
internationalization strategy of the exporting firms is appropriate to stay abreast of the
global competition. Accordingly, the third research question is:

95
What are the appropriate corporate strategies for the Malaysian ECS firms to
successfully enter new international markets?
2.8.3 The Research Objectives
The research objectives explain the purpose of the research and define what the research
tries to achieve (Zikmund et al. 2010). These objectivities have to be precise and ‘lead to
observable outcome’ (Saunders, Lewis & Thornhill 2003, p. 30) and have ‘achievable
goals’ (Emory & Cooper 1991, p. 121). Guided by these authorities, and based on the
gaps in the literature review as reflected by the research questions, this research has three
main objectives.
Research Objective 1
To determine the competitive positioning of the Malaysian ECS firms in the context of
the forces of market liberalization.
Research Objective 2
To examine the adequacy and effectiveness of the existing Malaysian Government’s
support programmes for the internationalization of the Malaysian ECS firms.
Research Objective 3
To recommend the appropriate corporate strategies for adoption by the Malaysian ECS
firms to successfully enter new international markets.
2.8.4 The Research Propositions
As stated in Section 1.6 and detailed in Sub-Section 3.2.2, this research relies on a mixed
methodology in line with Creswell and Plano Clark (2007), Greene and Caracelli (1997)
and Morgan (1998). Although the research is largely qualitative in nature, the researcher
considered it necessary to collect and analyze some quantifiable data in order to

96
generalize the findings. Accordingly, this research adopted a two stage approach
(Creswell & Plano Clark 2007; Morgan 1998) and the second stage being quantitative,
requiring the collection of quantitative data by testing through research propositions.
‘Many theories contain propositions. A proposition is a theoretical statement that
specifies the relationship between two or more concepts’ (Neuman 2006, p. 58). A
proposition is a testable statement (Denzin 1978). A concept is ‘the unit for theory
development’ (Zikmund et al. 2010, p. 40) and they must be clearly defined and be
apparent between the cause and the causal (Denzin 1978). ‘A researcher will try to learn
the truthfulness of a proposition by evaluating whether it conforms to empirical evidence
or data’ (Neuman 2006, p. 58). Guided by these authorities, the three research
propositions based on the identified research questions for empirical testing by this
research are:
Research Proposition 1
The Malaysian ECS firms are well positioned for global competitive advantage in the
liberalizing global markets.
Research Proposition 2
The Malaysia Government has effective targeted support policies and programmes to
assist Malaysian ECS firms with their internationalization effort.
Research Proposition 3
The exporting Malaysian ECS firms have appropriate strategies for successfully entering
new international markets.
2.9 Conclusion
The Chapter reviewed the literature pertinent to the research topic, namely the global
engineering consulting industry, relevant theories, the Malaysian Government’s support

97
policies and the Malaysian ECS industry. The review revealed significant research gaps
which led to the development of three research questions, the setting of the research
objectives and the crafting of the research propositions for testing by this research. The
next chapter, Chapter Three, describes the methodology used for the collection and
analyses of the primary data for this research.

98
CHAPTER THREE – RESEARCH METHODOLOGY
3.1 Introduction
Chapter Two reviewed the literature on the research issues pertaining to the study. It then
developed the research questions and the Research Propositions which are restated below:
• The Malaysian ECS firms are well positioned for global competitive advantage in
the liberalizing global markets.
• The Malaysian Government has effective targeted support policies and
programmes to assist Malaysian ECS firms with their internationalization effort.
• The exporting Malaysian ECS firms have appropriate strategies for successfully
entering new international markets.
Guided by Denzin (1978), Miles and Huberman (1994), Miller (1991), Neuman (2006),
O’leary (2005), Parkhe (1993), Perry (1995), Sekaran (2003), Tashakkori and Teddlie
(1998), Yin (2009) and Zikmund et al. (2010), this Chapter describes the methodology for
the research. It includes the research approach, research design, the data collection
instruments, research quality and the ethical issues.
3.1.1 Structure of Chapter Three
This Chapter has eight sections as depicted in Figure 3.1.
Section 3.1 presents the chapter structure.
Section 3.2 examines the research approach. The various research paradigms are
examined prior to the selection of the preferred research mixed methodology.
Section 3.3 discusses the various research designs and the selection of the preferred
design for this research.

99
Figure 3.1 : Structure of Chapter Three
Source : Developed for this Research
Section 3.1 : Introduction
• Chapter Structure
Section 3.2 : Research Approach
• Research Paradigms
• Preferred Research Methodology
Section 3.3 : Research Design
• Preferred Research Design
• Unit of Analysis
Section 3.4 : Data Collection Instruments
• Secondary Data
• Experience Survey
• Case Studies
• Focus Group
• Sample Survey
Section 3.5 : Research Quality
Section 3.6 : Data Analysis Procedures
• Qualitative Data Analysis
• Quantitative Data Analysis
Section 3.7 : Research Ethics
Section 3.8 : Conclusion

100
Section 3.4 outlines the data collection instruments. These are the literature review for
secondary data, the experience survey, case studies, the focus group and a sample survey.
Section 3.5 spells out the measures taken to enhance research quality including reliability,
validity and triangulation.
Section 3.6 describes the data analysis procedures for both qualitative and quantitative
data.
Section 3.7 discusses the ethical considerations for the study.
Section 3.8 presents the conclusions of this Chapter.
3.2 Research Approach
This section consists of two parts. The first is the preferred research paradigm which
incorporates the inductive and deductive approaches. The second elaborates on the
research design.
Social research is ‘a collection of methods and methodologies that researchers apply
systematically to produce scientifically based knowledge about the social world’
(Neuman 2006 p. 2). The approaches to theory development research was developed by
Parkhe (1993) based on three primary interrelated dimensions (inductive/deductive,
subjective - idiographic – qualitative-insider/objective – nomothetic – quantitative -
outsider and theory generation/theory testing. These are depicted in Figure 3.2.

101
Figure 3.2 : Approaches to Theory-Development Research
Source : Parkhe (1993, p. 235)
The research process involves several levels. It starts from research philosophy or
paradigm and is followed by the research approach, the research strategy, time horizons
of the research and finally the data collection methods and analysis (Saunders, Lewis &
Thornhill 2003). These are shown graphically in Figure 3.3.
Figure 3.3 : The Research Process
`
Source : Adapted from Saunders, Lewis & Thornhill (2003, p. 83)
Positivism
Critical
theory
Constructivism
Deductive
Inductive
Experiment
Survey
Case
study
Grounded
theory
Ethnography
Action
research
Cross
sectional
Longitudinal
Sampling Secondary data Observation Interviews
Questionnaires
Research
philosophy
Research
approaches
Research
strategies
Time
horizons
Data collection methods
Realism
1 2
3 4
Objective
Nomothetic
Quantitative
Outsider
Deductive Theory Generation
Inductive
Subjective
Idiographic
Qualitative
Insider
Theory Testing

102
Research covers a wide range of phenomena and is guided by research philosophy or
paradigms. ‘Paradigms are the lens through which we choose to view the social world’
(McMurray 2008, p. 23). Kuhn (1970, p. 175) defined paradigm as ‘the entire
constellation of beliefs, values, techniques, and so on shared by the members of a given
community’. Paradigm issues are crucial as a researcher must be clear about the
paradigm that is best suited to inform and guide one’s research approach (Guba &
Lincoln 1994).
The paradigm consists of a basic set of assumptions about the nature of the social world
and reality, the relationship between the research participant and the researcher and the
process of the research which is a methodological issue (McMurray 2008; Ponterotto
2005). Taken together they frame the nature of the research in theory testing or theory
building, the role of the researcher and researcher’s values and ethics in the scientific
inquiry (HICSS 2003). These are depicted in Figure 3.4.
Figure 3.4 : Influences on Business Research
Source : Adapted from Bryman & Bell (2007, p.30)
Ontology
Theory Axiology
Business Research Epistemology Methodology

103
Ontology is the fundamental assumption or belief that is made about the nature of reality
or being, specifying what and how it exists (Guba & Lincoln 1994; Jankowicz 2000;
Parkhe 1993). Epistemology means the treatment of the subject of knowledge (Croasdell
et al. 2003) and to the ‘process of knowing and the relationship between the researcher
and that which is to be known’ (Guba & Lincoln 1994, p. 108). Methodology determines
how the researcher goes about investigating what is to be known (Guba & Lincoln 1994;
Zikmund et al. 2010). Axiology concerns the role and place of values in the research
process (Creswell 2007, Ponterotto 2005). It is about ‘values of being, what is
intrinsically worthwhile and the valuing of knowledge’ (Heron & Reason 1997, p. 286)
There are a number of paradigms to guide research. There is no universal paradigm and
‘philosophers of science and methodologists have been engaged in a long- standing
epistemological debate about how best to conduct research’ (Patton 1990, p. 37). There
are four main paradigms, namely positivism, constructivism, critical theory and realism
(Guba & Lincoln 1994; Healy & Perry 2000; Perry, Reige & Brown 1999), and their
salient features are shown in Table 3.1.
Table 3.1 : Principal Research Paradigms and Associated Views
Paradigm
Positivism
Constructivism
Critical Theory
Realism
Also known as
Quantitative Paradigm.
The combination is also known as the qualitative or the interpretive paradigm.
Ontology
Reality is real and apprehensible.
Multiple realities constructed from the interaction and beliefs of people.
Apprehensible multiple realities incorporating historically situated structures.
Reality is real but only imperfectly and probabilistically apprehensible.
Epistemology
Researcher and the object investigated are independent. Findings are objective and value free.
Researcher is an involved participant. Findings are subjective and value laden.
Researcher is a transformative intellectual. Findings are value mediated.
Researcher and object investigated are interactively related. Findings are subjective and value-aware.
Common methodologies and process
Quantitative methods.
Qualitative methods.
Qualitative methods.
Principally qualitative methods.
Source : Adapted from Guba & Lincoln (1994); Healy & Perry (2000); Lincoln & Guba (1985); Perry,
Alizadeh & Riege (1997); Perry, Riege & Brown (1999).

104
These four paradigms can be broadly classified into two major frameworks: the
quantitative paradigm and the qualitative paradigm. The main features of these
paradigms are depicted in Table 3.2 and further described below.
• The quantitative paradigm provides objective and value free findings using highly
structured methodology that facilitates replication (Gill & Johnson 2010).
Focusing on measuring, confirming or validating causal relationships between
variables, it is suitable for theory testing (Leedy & Ormrod 2005). It requires the
collection of large amounts of hard and quantifiable data to meet the evaluation
criteria of validity and reliability for statistical analysis (Easterby-Smith, Thorpe
& Lowe 2002; Neuman 2006). The findings are deductive and generalizable.
However, it is rather deterministic and ineffective in understanding processes and
human actions as it treats people mechanistically and ignores internal motivations
(Greene 2007; Molina-Azorin 2007; Neuman 2006). Thus the quantitative
approach develops theory without the benefit of informed and non-observable
data (Van Maanen 1982; Yin 2003).
• The qualitative paradigm is well suited to investigate change processes,
understand peoples’ meaning, explore new emerging issues and realities, and
contribute to theory generation (Creswell 2003; Leedy & Ormrod 2005; Perry &
Coote 1994). The investigation is subjective, value laden, inductive and looked
from within. Data are rich in words, images and pictures from a small number of
people or organizations (Ticehurst & Veal 1999). However, data collection
requires much time and resources, and the analysis as well as interpretation of
data could be difficult. The findings are usually context specific, judgement based
and not generalizable (Creswell 2003; Lincoln & Guba 2000). Furthermore, many
policy-makers, academics, administrators and programme commissioners give
low credibility to studies based on pure qualitative approach (Johnson &
Onwuegbuzie 2004). They are also reluctant to make decisions based on small
sample research that relies on the subjectivity and interpretation of the researcher
(Easterby-Smith, Thorpe & Lowe 2002).

105
Table 3.2 : Characteristics of Quantitative and Qualitative Paradigms
Quantitative
Qualitative
Objective
Theory testing
Theory generating
Ontology
Naïve realism
Relativist
Epistemology
Dualist and objectivist
Transactional and subjectivist
Methodology
Experiments / surveys
Case studies / convergent interview
Axiology
Value free
Value laden
Logic
Hypothetico -deductive
Inductive
Purpose
Generalizability
Contextualization
Procedures
Standard and replicable
Specific and particular
Concepts
Constructs, variables
Themes, patterns, categories, taxonomies
Data
Numerical
Words, images
Sample size
Large
Small and limited
Data analysis
Statistical
Interpretive
Sources : Adapted from Lincoln & Guba (1994); McMurray (2008); Neuman (2006); Perry, Riege & Brown (1999)
3.2.1 Justification to a Mixed Methodology
The quantitative and qualitative paradigms are at each end of the quantitative – qualitative
continuum of research (Casebeer & Verhoef 1997). A research can make use of both
approaches as well as the mixed paradigm emerges as depicted in Figure 3.5. Mixed
methods can have similar weighting of qualitative and quantitative approaches in one
research or, one approach is dominant with the other supporting (Johnson &
Onwuegbuzie 2004; Johnson, Onwuegbuzie & Turner 2007). Silverman (1998, p. 6-7)
asserted that
‘it is inaccurate to assume that quantitative and qualitative research are polar
opposites ...... there are no principled grounds to be either quantitative or qualitative in
approach. It all depends on what you are trying to do’.

106
Figure 3.5 : The Three Major Research Paradigms, Including Subtypes of Mixed Methods Research
Source : Adapted from Johnson, Onwuegbuzie & Turner (2007, p. 124)
The research problem under investigation should dictate the methods of investigation
(Trow 1957) rather than being dictated by a particular paradigm (Cavaye 1996). Hussey
and Hussey (1997, p. 72) suggested that ‘it is not unusual in business research to use a
mixture of approaches as it permits a broader and complementary perspective on the
research’. ‘Methods should be mixed in a way that has complementary strengths and non-
overlapping weaknesses’ (Johnson & Turner 2003, p. 299). Furthermore, the weakness
of the qualitative paradigm is the strength of the quantitative paradigm and vice versa
(Bonoma 1985; Eisenhardt 1989; Gill & Johnson 2010; Morgan 1998). Thus, ‘the flaws
of one method are often the strengths of another; and by combining methods, observers
can achieve the best of each while overcoming their unique deficiencies’ (Denzin 1978, p.
302).
This reinforces the justification for integrating both approaches to provide a more
complete picture of the research issues being addressed (Miles & Huberman 1984, 1994;
Steckler et al. 1992; Strauss 1990; Yin 2003), and with superior outcomes compared to
monomethod studies (Johnson & Onwuegbuzie 2004). It also enables the use of
triangulation to achieve cross-validation and to overcome the potential bias of a single
method approach (Collis & Hussey 2003; Denzin 1978; Shah & Corley 2006).
Mixed Methods
Broadly Speaking
“Pure”
Mixed
Qualitative
Mixed Pure
Qualitative
Quantitative
Mixed
Pure
Quantitative
Qualitative
Dominant Equal Status Quantitative
Dominant

107
Johnson, Onwuegbuzie and Turner (2007, p. 123) defined mixed methods research as ‘the
type of research in which a researcher or team of researchers combine elements of
qualitative and quantitative research approaches for the broad purposes of breadth and
depth of understanding and corroboration’ in one single project.
Quantitative and qualitative methods can be complimentary (Hanson et al. 2005; Jick
1979). Both can ‘uncover some unique variance which otherwise may have been
neglected by a single method’ (Jick 1979, p. 603). To overcome the philosophical
difficulties of combining the dichotomous and incommensurable qualitative and
quantitative paradigms in the mixed approach (Sale, Lohfeld & Brazil 2002), pragmatism
is the primary philosophy to support mixed methods research (Johnson & Onwuegbuzie
2004; Johnson, Onwuegbuzie & Turner 2007; Maxcy 2003; Morgan 2007; Patton 2002;
Tashakkori & Teddlie 1998, 2003; Teddlie & Tashakkori 2003; Yardley & Bishop 2008).
Taking full account of the objectives and the advantages of the study, the researcher
adopted a mixed method paradigm. Accordingly, both the qualitative and quantitative
approaches were used in a complementary manner to cross validate, triangulate and
enhance the findings of this research. However, this research was largely qualitative in
nature as there was limited prior research.
3.2.2 The Preferred Type of Mixed Methodology
There are several mixed method typologies (Creswell & Plano Clark 2007; Greene &
Caracelli 1997; Morgan 1998; Tashakkori & Teddlie 2003). A typology or classification
scheme is a systematic classification of types that have common characteristics or traits
and being ‘created by cross-classifying or combining two or more simple concepts to
form a set of interrelated sub-types’ (Neuman 2006, p. 55). Typologies are ‘useful aids in
identifying themes and developing concepts and theory’ (Taylor & Bogdan 1998, p. 144).
Greene and Caracelli (1997) developed a typology of mixed methods design comprising
of three component designs (triangulation, complementary and expansion) and four
integrated designs (iterative, embedded/nested, holistic and transformative), based on
function or purpose as depicted in Table 3.3.

108
Table 3.3 : The Greene and Caracelli Designs for Mixed Methods Research
Component Designs
Integrated Designs
Triangulation Different methods are used to assess the same phenomenon toward convergence and increased validity.
Iterative Dynamic and ongoing interplay over time between the different methodologies associated with different paradigms. Spiral type design.
Complementary One dominant method type is enhanced or clarified by results from another method type.
Embedded / nested One methodology located within another, interlocking inquiry characteristics in a framework of creative tension.
Expansion Inquiry paradigms frame different methods that are used for distinct inquiry components. The results being presented side-by-side.
Holistic Highlight the necessary interdependence of different methodologies for understanding complex phenomena fully.
Transformative Give primacy to the value-based and action-orientated dimensions of different inquiry traditions. Mix the value commitments of different traditions for better representation of multiple interests.
Source : Greene & Caracelli (1997, p. 23)
Creswell and Plano Clark (2007) developed a four type typology with the four mixed
methods research design types (triangulation, embedded, explanatory and exploratory)
classified under the categories of timing, mix and weighting as depicted in Table 3.4.
Table 3.4 : The Creswell & Plano Clark Mixed Method Design Types
Design Type
Timing
Mix
Weighting/Notation
Triangulation
Concurrent : quantitative and qualitative at the same time
Merge the data during interpretation or analysis
QUAN + QUAL
Embedded
Concurrent and sequential
Embed one type of data within a larger design using the other type of data
QUAN (qual) Or QUAL (quan)
Explanatory
Sequential : Quantitative followed by qualitative
Connect the data between the two phases
QUAN qual
Exploratory
Sequential : Qualitative followed by quantitative
Connect the data between the two phases
QUAL quan
Source : Adapted from Creswell & Plano Clark (2007, p. 85)
Morgan (1998) developed the Priority-Sequence Model based on the priority and
sequence decisions. This led to four basic research designs as depicted in Figure 3.6
using Morse’s (1991) notation, depending on (1) whether the principal method is

109
qualitative or quantitative and (2) whether the complementary method is a preliminary or
follow-up stage to the principal method.
Figure 3.6 : Morgan Priority-Sequence Model of Mixed Method
Priority Decision
Principal Methods : Quantitative
Principal Methods : Qualitative
Qualitative Preliminary
Quantitative Preliminary
Complementary Method : Preliminary
Qual QUANT
quant QUAL
Sequence Decision
Qualitative Follow-up
Quantitative Follow-up
Complementary Method : Follow-Up
QUANT qual
QUAL quant
Source : Adapted from Morgan (1998, p. 368)
The research was mainly aimed at generating ideas rather than evaluating ideas, and to
gain an in-depth understanding of the competitive positioning of the Malaysian ECS
industry in a globalizing world. For this purpose, it was considered necessary to collect
real, rich and deep data through interviewing those associated and familiar with the
research topic. It was considered necessary to collect objective quantifiable data for
analysis through statistical techniques in order to enhance the validity and reliability of
the findings (Deshpande 1983).
Following detailed consideration of the different types of mixed methodology, and guided
by the objectives of this study, the researcher found the complimentary approach as
proposed by Greene and Caracelli (1997) as well as Morgan (1998) as being best suited
for the research. Data collection involved two phases with the first being principally
qualitative and the second being quantitative (Creswell & Plano Clark 2007; Morgan
1998).
3.2.3 Conclusion

110
This Section discussed the various research paradigms and justified the use of a mixed
methodology of a complementary nature. The next section presents the research design.
3.3 The Research Design
A research design is a framework or plan specifying the methods and procedures for
collecting and analyzing the data (Zikmund et al. 2010). It gives focus to the research,
guides the researcher in answering the research questions and controls the potential
sources of error in the research (Davis 2000; Kerlinger & Lee 2000). The research design
also determines the information needed, states the sampling method, and the data analysis
procedures (Davis 2000; Malhotra 2010). Several different alternative designs are
available for solving problems (Emory & Cooper 1991; Zikmund et al. 2010).
There are three basic types of research designs: exploratory, descriptive and explanatory
to guide data collection and analysis (Emory & Cooper 1991; Neuman 2006). The
objectives, characteristics, data collection methods and status of research problems for
each design are depicted in Table 3.5.
Table 3.5 : Basic Research Designs
Exploratory
Descriptive
Explanatory
Objective
Discover ideas and
insights
Describe market
characteristics or functions.
Determine cause and effect
relationships.
Characteristics
Flexible Versatile Often the front end of total
research design.
Marked by the prior
formulation of specific hypotheses.
Preplanned and structured design.
Manipulation of one or more
independent variables. Control of other mediating
variables.
Methods
Expert surveys Pilot surveys Secondary data Qualitative research
Secondary data Surveys Panels Observational and other data.
Experiments
Research Problem Status
Unknown or little is
known.
Known
Clear definition.
Source : Emory & Cooper (1991); Easterby-Smith, Thorpe & Lowe (2002); Malhotra (2010); Neuman (2006)

111
3.3.1 Exploratory Research
An exploratory research is undertaken when there is no or limited information available
or not much is known about a phenomenon or a situation. It is particularly essential and
useful ‘when a researcher has a limited amount of experience with or knowledge about a
research issue’ (Zikmund et al. 2010). It is a valuable means of finding out ‘what is
happening; to seek new insights; to ask questions and to assess phenomena in a new light
(Robson 2002, p. 59).
Exploratory research is unstructured and highly flexible, versatile with the researchers
following clues, ideas and hunches. Researchers explore all sources of information, and
are alert to new ideas and insights (McDaniel & Gates 1996). The direction of inquiry
may keep changing as new insights are discovered (Saunders, Lewis & Thornhill 2003).
Thus the creativity and ingenuity and open mindedness of the researcher significantly
affects the directions and nature of the exploratory research (Malhotra 2010; Neuman
2006).
While exploratory research may be accomplished with different techniques, it relies more
on qualitative methods which include literature reviews, expert surveys, case studies,
focus groups, personal interviews and participant observations (Cooper & Schindler
2006).
3.3.2 Descriptive Research
The main purpose of descriptive research is to describe market characteristics or
functions or characteristics of a population or phenomenon (Malhotra 2010; Zikmund et
al. 2010). ‘Descriptive research tries to ‘paint a picture’ of a given situation by
addressing who, what, when, where and how questions’ (Zikmund et al. 2010, p. 55) and
may be done in many settings.

112
Descriptive research uses a number of methods for data collection which includes
secondary data, surveys, expert panels, case studies and observations (Malhotra 2010).
The findings of the descriptive research, according to Sekaran (2003, p. 122) will help to:
i) ‘Understand the characteristics of a group in a given situation,
ii) Think systematically about aspects in a given situation,
iii) Offer ideas for further probe and research, and/or
iv) Help make certain simple decisions.’
3.3.3 Explanatory Research
The major purpose of explanatory research is to explain a situation or a problem by
establishing the casual relationships between variables (Saunders, Lewis & Thornhill
2003). Explanatory research builds on exploratory and descriptive research and proceeds
to identify the reason something occurs. The explanatory research is formalized and
structured with hypotheses testing, or research questions to be answered.
Since all factors, except the independent variables, must be controlled and held constant
in explanatory research, it is not suited for most business studies as the business
environment is always changing. Therefore, where applicable, the factors can be
controlled or held constant to help the researcher to draw a firmer conclusion (Cooper &
Schindler 2006; Emory & Cooper 1991).
3.3.4 The Preferred Research Design
The findings of the literature review in Chapter Two revealed gaps in the existing body of
knowledge relating to the research problem. For this reason, it was necessary to use
exploratory research for securing a better understanding of the research problem and the
data required to conduct the research.
However, exploratory research has two main limitations. Being qualitative in nature the
findings can be subjective. Secondly, the use of small sample size impedes the
projectibility, transferability and the generalizability of the findings to meet the validity

113
and credibility criteria of the research. Furthermore, the objectives of the study extended
beyond the mere identification of the research problem. It aimed to obtain a complete
and accurate description of the Malaysian ECS industry and generalize the findings.
Taking these factors into account, the researcher adopted a two stage design approach as
depicted in Figure 3.7 in line with Miles and Huberman (1994) and Perry (2002).
Figure 3.7 : The Preferred Research Design
Stage
The Research Design
Role
Research Method
1
Exploratory
• Collect background information.
Dominant
Qualitative
2
Descriptive
• Obtain complete and accurate description.
• Generalize the findings.
Complementary
Quantitative
Source : Developed for this Research
The first and dominant stage was exploratory. Qualitative data were collected and
analyzed for gaining insights into the research problem. The second and complementary
stage was descriptive. As discussed in Sub-Section 3.4.5, quantifiable data was collected
through a structured questionnaire survey using a five-point Likert scale for measurement
of survey responses.
3.3.5 Unit of Analysis

114
Having determined the research design, the next issue to address was the unit of analysis.
This is defined as ‘the level of aggregation of the data collected during the subsequent
data analysis stage’ (Sekaran 2003; p. 135). It can be ‘the primary empirical object,
individual, or group under investigation’ (Davis 2000, p. 167). This research was
targeted at Malaysian ECS firms, government trade promotion agencies and construction
firms. Due to time and resource constraints, the unit of analysis comprised the Malaysian
ECS firms, government trade promotion agencies and construction firms located mainly
in Kuala Lumpur and the Klang Valley areas.
3.3.6 Conclusion
This Section discussed the three basic types of research design leading to the adoption of
preferred two stage design approach and unit of analysis for the research. The next
section discusses the data collection instruments.
3.4 Data Collection Instruments
This Section discusses the techniques of collecting primary data for the testing of the
research propositions developed in Chapter Two. Good research requires data to be
collected from multiple sources and through multiple collection methods. However, the
choice of the data instruments is dependent on the availability of facilities, time, funding,
the required level of accuracy and the research objectives (Sekaran 2003).
As discussed in Sub-Section 3.3.4, this research adopted a two stage approach involving a
dominant qualitative approach followed by a complementary quantitative approach. The
instruments used for each stage are shown in Figure 3.8 and discussed in the subsequent
sub-sections.
3.4.1 Secondary Data Collection
Secondary data collection has the advantage of being fast and cost effective compared to
primary data collection (Davis 2000; Ghauri & Grønhaug 2005; Sekaran 2003; Zikmund

115
et al. 2010). Secondary data are also easily accessible (Malhotra 2010) and likely to be of
higher quality compared to one’s own primary data collection (Stewart & Kamins 1993).
Secondary data source is easily reviewed by others (Denscombe 1998) and may lead to
unforeseen or unexpected new discoveries (Dale, Arber & Proctor 1988).
Figure 3.8 : Data Collection Plan
Source : Developed for this Research
The secondary data that emerged from the literature review was discussed in Chapter
Two. The sources were written documents and published information such as books,
journals, government publications, periodicals, newspapers, and the internet (Saunders,
Lewis & Thornhill 2003; Sekaran 2003).
3.4.2 The Experience Survey
Literature Review
Focus
Groups
Experience
Survey
Sample
Survey
Secondary Data Discussion
Topics
Pre-Test Questions
Questionnaire
Data
Analysis
Qualitative Quantitative
Data Collection
Case Studies

116
The experience survey is an exploratory research technique for gathering information and
data from a small group of individuals with expert knowledge in the area of study. The
primary aim is to clarify concepts and to help formulate the research problem (Cooper &
Schindler 2006; Zikmund et al. 2010) and to pretest the survey questionnaire.
3.4.2.1 Selection of the Experience Survey Participants
The researcher is the Group Managing Director of a large engineering consulting firm in
Malaysia. Over the years, he has established a wide network of professional and business
contacts with members of the public and private sectors, government bodies, the
academia community and associations representing the business community.
Using his contacts, the researcher identified five knowledgeable persons who agreed to
take part in this research. To maintain their anonymity, only their job positions are stated.
They comprised a senior civil servant, a past president of IEM, a past president of ACEM
and two retired Managing Directors of ECS firms. As discussed in Sub-Section 3.4.5.7,
these knowledgeable persons also helped to pre-test and finalize the survey questionnaire.
3.4.3 Use of Case Studies as a Data Collection Technique
The case study is ‘the method of choice when the phenomenon under study is not readily
distinguishable from the context’ (Yin 2003, p. 4). Case studies focus on ‘a particular
phenomenon with a view to providing an in-depth account of events, relationships,
experiences or processes occurring in that particular instance’ (Denscombe 1998, p. 32)
emphasizing on a number of factors as depicted in Table 3.6. They allow the use of
multiple sources, multiple methods and a variety of types of data in the investigation
(Creswell 2007; Denscombe 1998; Lewis 2003; Ticehurst & Veal 1999).
Case study research is treated differently by authorities as either a ‘method’ or a
‘technique’ (McGuire 1985). The former is a procedure of inquiry, research design or
research strategy that relates to the scale and scope of an investigation and does not
dictate the methods of data collection to be used (Denscombe 1998). The latter is only

117
‘an instrument of the overall research effort for the collection of data for theory building’
(Perry & Coote 1994, p. 107) and therefore a data collection technique.
Table 3.6 : Emphasis of Case Study Research
Case Study Research Characteristically Emphasizes
Depth of study
rather than
Breadth of study
The particular rather than The general
Relationships / processes rather than Outcomes and end-products
Holistic view rather than Isolated factors
Natural settings rather than Artificial situations
Multiple sources rather than One research method
Source : Denscombe (1998, p.32)
While case studies have several advantages as depicted in Table 3.7, it was not possible
for the researcher to use case studies as a methodology as the Malaysian ECS industry is
small and highly competitive. As such the ECS firms were reluctant to be used as case
studies as it would require them to permit this researcher to review all their competitive
strategies, clients’ list and confidential company documents. For this reason, case studies
were employed as a data collection technique and not as a methodology for this research.
Table 3.7 : Advantages of Case Studies
Advantages
• Focus on one or a few cases.
• In-depth study to deal with the subtleties and intricacies of complex social situations.
• Use of multiple research methods.
• Use of multiple sources of data.
• No need to exercise control over events.
• Can be either qualitative, quantitative or mixed.
• Theory–building and theory-testing are permissible.
Source : Adapted from Bryman & Bell (2007); Denscombe (1998); Gay & Diehl (1992); Gill &
Johnson (2010)
3.4.3.1 Criteria of Case Selection

118
Careful attention was given to case selection to ensure that the selected cases met the
purposes of the research. Guided by the authorities, the exercise started with the
formulation of appropriate criteria so that the selected cases:
• Were ‘typical’, or cases that were similar with findings that could be generalized
(Denscombe 1998, p. 33).
• Constituted ‘extreme situations’ or ‘polar types’ that provided a contrast with the
norm and disconfirm patterns from other cases (Pettigrew 1990, p. 275).
• Were both a ‘literal replication’ predicting similar results and a ‘theoretical
replication’ predicting contrasting results (Yin 2009, p. 54).
• Were rich in information offering a deep in-sight about the research issues
(Ghauri & Grønhaug 2005).
A screening process was performed with the desk study of the ECS firms that were
members of the ACEM to identify the suitable cases.
3.4.3.2 The Selected Cases
Hedges (1985, p. 76-77) suggested that ‘in practice four to six groups form a reasonable
minimum for a serious project’. Pettigrew (1990) also suggested four to six. Cooper and
Schindler (2006) recommended a minimum of four cases with a maximum of 15 for
multiple case designs.
Guided by the criteria outlined in Sub-Section 3.4.3.1, four firms were selected in close
consultation with the ACEM as case studies. All the four firms were data rich in
information and useful for cross case analysis to test the research propositions (Eisenhardt
1989; Yin 2009).
3.4.3.3 Salient Features of the Selected Cases
The four selected firms requested anonymity and were therefore only identified by
numerical labels (1, 2, 3 & 4). The representatives from the selected cases also
participated in the focus group interview and the questionnaire survey. A brief profile of

119
each of the four selected cases is described below and their salient features are listed in
Table 3.8. For the purpose of description and to avoid direct identification of the case
firm, the size of the firm was described as ‘big’ if it had a total staff strength of more than
350, ‘medium’ if between 100 and 350, and ‘small’ if it had less than 100. The firm was
‘old’ if it was established earlier than 1970, ‘mature’ if between 1970 and 1990, and
‘young’ if it was established after 1990.
Table 3.8 : Salient Features of the Case Firms
Firm
Age
Firm Size
Speciality
Service Export
1
Old
Big
General and multidisciplinary
Occasional
2
Old
Medium
Water resources
Occasional
3
Mature
Medium
Structures
Occasional
4
Old
Small
General civil
Limited
Source : Company Brochures & Websites of Case Firms
Case 1
This firm can be classified as being ‘old’ and ‘big’. It offers general ECS and has
multidisciplinary capabilities including export services.
Case 2
This is an ‘old’ and ‘medium’ in size. While it is multidisciplinary, its specialty is on
water resources development. It is also an occasional exporter by way of either following
clients or accepting unsolicited orders from overseas markets.
Case 3
This ‘mature’ and ‘medium’ firm specializes in structural engineering. An affiliate of an
international ECS firm, it occasionally exports its services to overseas countries where the
parent firm has no foreign branch offices.

120
Case 4
The firm is ‘old’ but ‘small’ in size. It practices general consulting engineering. Its
international export services are limited and it mainly focuses in the domestic market.
3.4.3.4 Collection of Data from the Case Firms
The required data from the selected cases came from three sources. These were: firstly,
the review of the case firms’ brochures and reports, secondly, participation in the focus
group meeting and lastly, participation in the questionnaire survey.
3.4.4 The Focus Group
The focus group is a special qualitative research technique (Neuman 2006) using group
interviews to elicit data from dialogue and discussion on certain defined research topic
(Jankowicz 2000). As such, the focus group contains elements of two methods: the group
interview and the focused interview (Bryman & Bell 2007). As regards the former, the
members are homogenous and selected because they ‘are known to have been involved in
a particular situation’ (Merton, Fiske, Kendall 1956, p. 3). The discussion is unstructured
and free flowing (Zikmund et al. 2010) based on a number of open-ended items in the
discussion guide prepared by the researcher (Johnson & Turner 2003). As regards the
latter, the participants are encouraged to express their different points of view and the aim
is neither to build consensus nor to determine the strength of their opinions (Vaughn,
Schumm & Sinagub 1996).
Focus groups have strengths and weaknesses as shown in Table 3.9. An important
advantage is that the focus groups ‘offer the researcher the opportunity to observe directly
the construction of meaning in a social context via interactions of group participants’
(Wilkinson 1999, p. 228) and how ‘individuals collectively make sense of a phenomenon
and construct meanings around it’ (Bryman & Bell 2007, p. 512). Some of the specific
advantages are highlighted below:

121
• Focus group interviews are highly synergistic as the dynamic group interaction
produces a wider bank of rich, in-depth data as ‘that would be less accessible without
the interaction found in a group’ (Morgan 1988, p. 12) and ‘that would not be
available outside the group context’ (Wilkinson 1999, p. 229).
• In a focus group, as no one is required to answer any specific questions, the
individual’s responses are likely to be spontaneous and tend to be more accurate
(Malhotra 2010).
Table 3.9 : Strengths and Weaknesses of Focus Groups
Strengths
Weaknesses
• Useful for exploring ideas
• Can obtain in-depth information
• Allows study of participant’s interaction
• Allows probing
• Allows quick turnaround
• Allow observation of non-verbal responses including body language
• Very flexible
• Sometimes expensive
• May be dominated by one or two participants
• Very difficult to generalize due to small sample size
• Moderator may be biased
• May have high dross rate
• Data analysis is sometimes time consuming and difficult
Source : Adapted from Bryman & Bell (2007); Johnson & Turner (2003); Stewart, Shamdasani & Rook
(2007)
The advantages of the focus group justified its use as a primary data collection tool for
the qualitative component of this research.
There is no fixed way to predetermine the exact number of focus groups required for a
research. This is dependent on the purpose of the research, the background information
needed, the nature of the focus group, and the success of the proceeding focus group, if
any. When the population is relatively homogeneous and the research questions are
relatively simple, a single group may be sufficient (Stewart, Shamdasani & Rook 2007).
Due to time and resource constraints, the researcher decided to engage only one focus
group with the consideration that there will be a complementary questionnaire survey
later.
122
3.4.4.1 Selection and Composition of the Focus Group
There is no fixed size for a focus group. Different authorities recommend different
member sizes and there is little consensus on what is most appropriate. Johnson and
Turner (2003) as well as Bryman and Bell (2007) recommended a range of seven to ten
people per focus group. Krueger (1994) suggested three to twelve; Nassar-McMillan &
Borders (2002), four to six. The size must be large enough to generate diverse viewpoint
for generation of in-depth information but not too large for adequate participation by each
group member (Zikmund et al. 2010). Guided by these authorities, the researcher
considered eight focus group participants as this number falls within the range
recommended by most authorities.
The success of the focus group is dependent on its composition so the selection and
recruitment of participants for focus group is critical (Davis 2000). A homogenous group
with similar lifestyles, job classification and experiences will not have too many
arguments and different viewpoints arising from the diverse background of the
participants (Zikmund et al. 2010). Guided by this, the membership of the focus group
for this research was confined to senior personnel.
The participants were identified based on non-probability, non-randomly selected
samples of various groups based on predetermined characteristics. The invited
participants were stratified according to business and organizations covering the ECS
firms, government export support bodies and construction firms which were involved in
foreign projects in partnership with Malaysian ECS firms.
Using his personal and business contacts, the researcher contacted:
• Each of the ACEM four case study firms and requested them to nominate one
participant. The ACEM was also requested to nominate a participant.
• The Malaysia External Trade Development Corporation (MATRADE), the
government agency responsible for export promotion, to nominate one participant.
• The Master Builders Association Malaysian (MBAM) to identify one participant.

123
• City University College of Science and Technology to nominate an academic familiar
with export and promotion issues.
The identified organizations were requested to alert the participants who were selected by
them.
3.4.4.2 Planning the Focus Group Meeting
A discussion guide and topic agenda were drawn up, as depicted in Table 3.10, to
facilitate the focus group discussion. The topic agenda highlighted the key research issues
related to the three propositions.
The researcher telephoned and e-mailed the members of the focus group to reconfirm
their participation and to decide on the time, date and venue of the focus group meeting.
Prior to the meeting, the researcher sent the Discussion Guide, the Information Sheet and
Consent Form to the participants as shown in Appendix A, B and C. The focus group
meeting only proceeded after receipt of the signed consent forms from the participants.
3.4.4.3 Conduct of the Focus Group
The focus group meeting was held on 28th July 2011 in the meeting room of the ACEM’s
office to provide a relaxed and comfortable setting. The researcher played the role of a
facilitator and moderator. Staying at the process level, he only intervened when necessary
to prevent the group from straying and to remain focused on the discussion topics. The
discussion was free flowing and the participants were encouraged to express their frank
views and comments on a range of issues related to the topic. The resulting group
interaction provided valuable data and information on the research topics. The pertinent
points made by the focus group members and which fell outside the scope of the
discussion guide were treated as ‘unplanned data’.
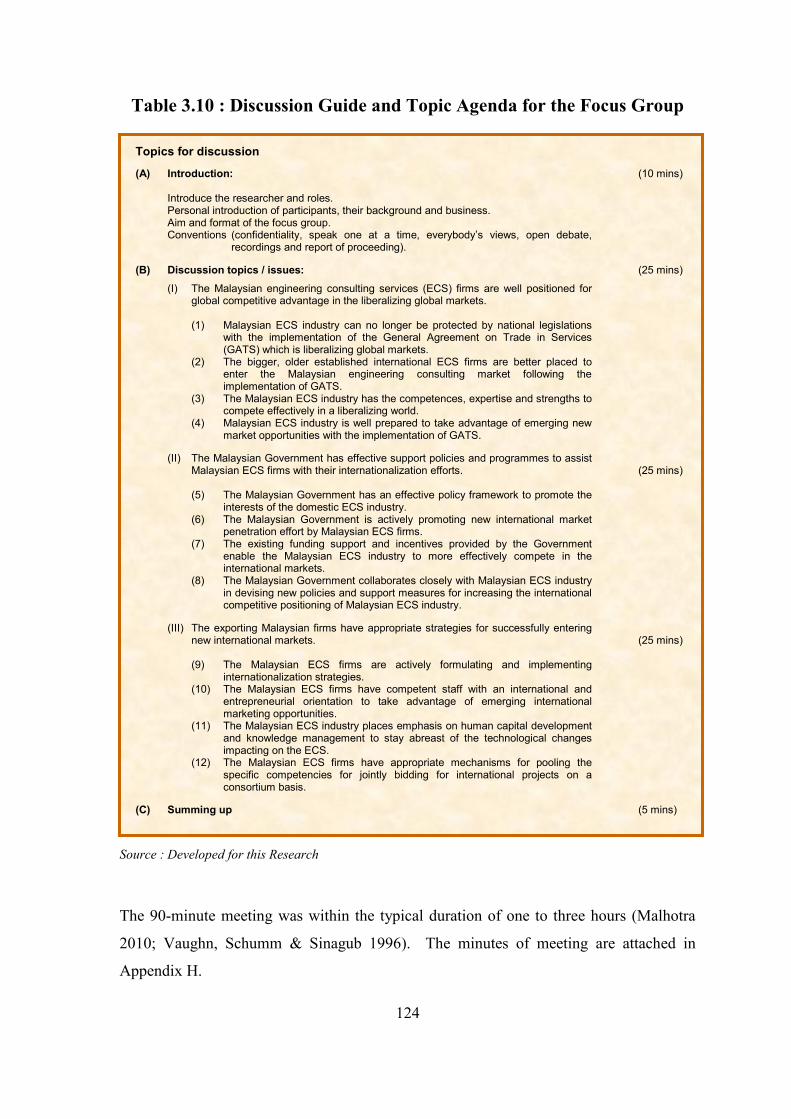
124
Table 3.10 : Discussion Guide and Topic Agenda for the Focus Group
Topics for discussion
(A) Introduction: (10 mins) Introduce the researcher and roles. Personal introduction of participants, their background and business. Aim and format of the focus group.
Conventions (confidentiality, speak one at a time, everybody’s views, open debate, recordings and report of proceeding).
(B) Discussion topics / issues: (25 mins)
(I) The Malaysian engineering consulting services (ECS) firms are well positioned for global competitive advantage in the liberalizing global markets.
(1) Malaysian ECS industry can no longer be protected by national legislations
with the implementation of the General Agreement on Trade in Services (GATS) which is liberalizing global markets.
(2) The bigger, older established international ECS firms are better placed to enter the Malaysian engineering consulting market following the implementation of GATS.
(3) The Malaysian ECS industry has the competences, expertise and strengths to compete effectively in a liberalizing world.
(4) Malaysian ECS industry is well prepared to take advantage of emerging new market opportunities with the implementation of GATS.
(II) The Malaysian Government has effective support policies and programmes to assist Malaysian ECS firms with their internationalization efforts. (25 mins)
(5) The Malaysian Government has an effective policy framework to promote the
interests of the domestic ECS industry. (6) The Malaysian Government is actively promoting new international market
penetration effort by Malaysian ECS firms. (7) The existing funding support and incentives provided by the Government
enable the Malaysian ECS industry to more effectively compete in the international markets.
(8) The Malaysian Government collaborates closely with Malaysian ECS industry in devising new policies and support measures for increasing the international competitive positioning of Malaysian ECS industry.
(III) The exporting Malaysian firms have appropriate strategies for successfully entering new international markets. (25 mins)
(9) The Malaysian ECS firms are actively formulating and implementing
internationalization strategies. (10) The Malaysian ECS firms have competent staff with an international and
entrepreneurial orientation to take advantage of emerging international marketing opportunities.
(11) The Malaysian ECS industry places emphasis on human capital development and knowledge management to stay abreast of the technological changes impacting on the ECS.
(12) The Malaysian ECS firms have appropriate mechanisms for pooling the specific competencies for jointly bidding for international projects on a consortium basis.
(C) Summing up (5 mins)
Source : Developed for this Research
The 90-minute meeting was within the typical duration of one to three hours (Malhotra
2010; Vaughn, Schumm & Sinagub 1996). The minutes of meeting are attached in
Appendix H.

125
3.4.5 The Sample Survey
A sample survey is a method of primary data collection (Zikmund et al. 2010) from
which information is collected about a population of interest based on communication
and responses of a sample drawn from that population (Gay & Diehl 1992). It provides a
quick, inexpensive, efficient and accurate means of data collection (Zikmund et al. 2010).
A sample survey can be either cross-sectional or longitudinal.
In a cross-sectional survey, information is collected once at a specific single point in time
(Gay & Diehl 1992; Bryman & Bell 2007; Neuman 2006). While it is the ‘simplest and
least costly’ it suffers from the weakness that ‘it cannot capture social processes or
change’ (Neuman 2006, p. 37).
In a longitudinal survey, data are collected at more than one point in time and at different
times (Sekaran 2003). Its purpose ‘is to examine continuity of response and to observe
change that occurs over time’ (Zikmund et al. 2010). While it is usually more complex,
costly and time consuming compared to cross-sectional survey, its main strength is in the
study of social change and development (Saunders, Lewis & Thornhill 2003).
Since this researcher had to complete this doctoral thesis within a specific time frame and
with both financial and time constraints, a longitudinal research was not appropriate.
Furthermore, the purpose of the research was to capture the views of the target population
at a point in time. Accordingly, a cross-sectional study was more appropriate.
The sample survey has two main data collection methods, namely structured interview
and questionnaire (Bryman & Bell 2007; Easterby-Smith, Thorpe & Lowe 2002; Gay &
Diehl 1992). The questionnaire method was used for this research and discussed below.
3.4.5.1 Questionnaire Surveys
A questionnaire ‘is a formalized set of questions for obtaining information from
respondents’ (Malhotra 2010, p. 335). Questionnaire surveys have various meanings
(Oppenheim 2000). Some authorities (Kervin 1999; Sekaran 2003) confined

126
questionnaire surveys to surveys where the respondents answer and record their own
answers. Others used the term more generally to also include structured interview surveys
(Bell 2005; Saunders, Lewis & Thornhill 2003). This researcher adopted Kervin’s (1999)
and Sekaran’s (2003) view on questionnaire survey as self-administered survey for this
research.
Questionnaire surveys have advantages and disadvantages. The advantages are:
• Cheap to administer,
• Quick to administer,
• Absence of interviewer effect,
• No interviewer variability, and
• Convenience for respondents (Bryman & Bell 2007).
The main setback of questionnaire survey is the low response rate (Neuman 2006;
Ticehurst & Veal 1999). Factors that affect questionnaire survey response rates as
identified by Ticehurst and Veal (1999, p. 142) are:
• ‘The interest of the respondent in the survey topic;
• The length of the questionnaire;
• Questionnaire design, presentation and complexity;
• The style, content and authorship of the accompanying letter;
• The provision of a reply-paid envelop;
• Rewards for responding; and
• The number and timing of reminders and follow-ups.’
Despite the disadvantages, the questionnaire survey was chosen for this research due to
the cheaper cost incurred and faster data collection especially when the survey covered a
wide area. Furthermore, it was considered more appropriate and practical when a large
sample size was required to improve the trustworthiness of the research and for the
generalizability of the research findings.

127
3.4.5.2 Sampling
Sekaran (2003, p. 266-267) defined sampling as
‘The process of selecting a sufficient number of elements from the population, so that a
study of the sample and an understanding of its properties or characteristics would make
it possible for us to generalize such properties or characteristics to the population
elements’.
It is practically impossible to collect data from every element due to the constraint of time,
cost, and other human resources (Gay & Diehl 1992; Sekaran 2003; Zikmund et al. 2010).
If a sample is well selected, the research results from that sample will be ‘reasonably
accurate’ (Zikmund et al. 2010, p. 388) and ‘generalizable to the population’ (Gay &
Diehl 1992, p. 126).
There are two major types of sampling techniques: probability sampling and non-
probability sampling (Bryman & Bell 2007; Saunders, Lewis & Thornhill 2003).
Probability Sampling
In probability sampling or random sampling, all elements in the defined population have
‘an equal and independent chance of being selected for the sample’ (Gay & Diehl 1992, p.
129). This permits the determination of the precision of the sample estimates of the
characteristic of interest and hence the inferences or projections about the target
population from which the sample was drawn (Malhotra 2010). However, the probability
sampling was not adopted for this research in view of the small target population since
the Malaysian ECS industry is relatively small. Furthermore, few members of the ECS
industry were knowledgeable about the internationalization of Malaysian ECS industry.
Non-Probability Sampling
In non-probability sampling, ‘it is not possible to specify the probability, or chance, that
each member of a population has of being selected for the sample’ (Gay & Diehl 1992, p.

128
142). As such, ‘the estimates obtained are not statistically projectable to the population’
(Malhotra 2010, p. 376). However, it is still ‘able to generalize from non-probability
samples about the population, but not on statistical grounds’ (Saunders, Lewis &
Thornhill 2003, p. 152). Non-probability sampling depends on the personal judgement of
the researcher to arbitrarily or consciously decide what elements or members to include in
the sample (Malhotra 2010). Commonly used non-probability sampling techniques
include convenience sampling, judgemental sampling, quota sampling, and snowball
sampling as depicted in Table 3.11 and briefly described below.
Table 3.11 : Non-Probability Sampling Techniques
Techniques
Sample Selection
Convenience sampling
The elements are haphazardly chosen depending on the ease and convenience of obtaining the information.
Judgemental sampling or purposive sampling
The elements are selected based on the researcher’s judgement about some appropriate characteristics required of the sample elements that will best answer the research questions and meet the research objectives.
Quota sampling
The sample is chosen on the basis that the pertinent sample characteristics are the same as those in the population.
Snowballing sampling
Initial elements are selected and who identify further elements of the population. The latter identify more elements and so on resulting in a snowballing effect in the recruitment and size of the sample.
Source : Adapted from Saunders, Lewis & Thornhill (2003); Zikmund et al. (2010)
• Convenience Sampling
In convenience sampling, the elements are selected on the basis that they are
conveniently available. Convenience samples are therefore not representative of
any definable population and are not appropriate for research involving population
inferences. They are also not recommended for descriptive or explanatory
research, but can be used for exploratory research (Malhotra 2010).
• Judgemental Sampling
In judgemental sampling, the elements are selected based on the judgement of the
researcher who believes that the elements are appropriate for the population of

129
interest. Judgemental sampling is therefore subjective and not appropriate for
population inferences. Its value is dependent on the researcher’s expertise in
making the right judgement on element selection (Malhotra 2010).
• Quota Sampling
In quota sampling, quotas are used to ‘ensure that the composition of the sample is
the same as the composition of the population with respect to the characteristics of
interest’ (Malhotra 2010, p. 380). Once the quotas have been assigned, the sample
elements are freely selected based on either convenience or judgement, hence
selection bias are potentially present (Malhotra 2010).
• Snowballing Sampling
In snowballing sampling, the initial sample elements are randomly selected.
Subsequent elements are chosen based on the referrals or information provided by
the initial elements to locate elements of rare population. This process is repeated
in cycles by obtaining referrals from referrals leading to snowballing effect. Even
though probability sampling is used to select the initial sample, the final sample is
a non-probability sample (Malhotra 2010).
Taking all factors into account in particular the objectives of the study, the researcher
adopted a combination of judgemental and quota sampling for this research. Judgemental
sampling permitted the sample to comprise participants who were knowledgeable about
the research issues. Quota sampling enabled the sample size to include the varied groups
of people who were associated with the export of Malaysian ECS. Furthermore, it also
permitted the data to be collected at a cheaper cost and at faster rate.
3.4.5.3 The Target Population and the Sample Size
The target population for this research was Malaysian ECS firms who were members of
ACEM. In order to secure a broad spectrum of data, other government agencies and
construction firms involved in the export of Malaysian ECS were also targeted for the
survey sample. They were grouped under four categories as follow:

130
• Group A - Four case study Malaysian ECS firms.
• Group B - Non-case study Malaysian ECS firms.
• Group C - Representatives from government agencies such as MATRADE, CIDB.
• Group D - Members of Master Builders Association of Malaysia (MBAM).
Sample size is important for the generalizability of the research findings. Roscoe (1975)
recommended a sample size larger than 30 and less than 500 being appropriate for most
research. Guided by these authorities, 180 participants were identified from the target
population to participate in the survey questionnaire. While this might appear small to
generalize the findings of the research, it was considered sufficient for this study. The
composition of the respondents by way of each of the groups A, B, C and D is shown in
Figure 3.9 and is described below:
• Group A comprised 60 participants from 15 each of the four case study ECS firms.
• Group B comprised 60 participants from non-case study ECS firms.
• Group C comprised 30 participants from government agencies such as MATRADE,
CIDB.
• Group D comprised 30 participants from members of MBAM.
3.4.5.4 Recruitment of the Survey Participants
The researcher used his business and personal contacts to secure meetings with
representatives of ACEM, MATRADE, CIDB and MBAM. They were informed of the
purposes of the research survey and were requested to assist in the identification of
suitable persons as respondents.
After receiving their suggestions on prospective participants, the researcher contacted the
suggested participants, by phone or e-mail or both to seek their agreement to participate.
They were briefed on the purpose of the research survey and their expected roles. The
researcher assured them that their rights would be protected and that information
provided would be kept confidential. They were also entitled to receive the results of the

131
Figure 3.9 : Composition of the Survey Sample
Source : Developed for this research
research in which they participated once the research was completed. All 180 persons
expressed their interest to participate and returned the duly filled questionnaire. This also
indicated their implied consent.
3.4.5.5 Designing the Questionnaire
‘A research survey is only as good as the questions it asks ………. questionnaire design
is one of the most critical stages in the survey research processes’ (Zikmund 2000, p. 309).
‘When designing questionnaires, it is important to take it slowly and carefully and also to
remember why the research is being done’ (Ticehurst & Veal 1999, p.143). The
questionnaire design process started with the examination of the research problem and
research questions. It was followed by a listing of information required and the
development of the questions in the questionnaire (Ticehurst & Veal 1999) as depicted in
Figure 3.10.
Organization
Ca
se
Stu
dy F
irm
s
No
n-C
ase
Stu
dy F
irm
s
Go
ve
rnm
en
t A
ge
ncie
s
MB
AM
30 30
60 60
A B
D
Group Sample
Size
C

132
List of
Information
required
Questionnaire
Survey
Other Research
Method
Draft Design
Pilot Test
Final Design
Direct link between questions and information needs
Management
Problem
Conceptual
Problem
Research Question
Figure 3.10 : Questionnaire Design Process
Source : Adapted from Ticehurst & Veal (1999, p. 144)
The designing of the research questionnaire took account of five key factors. They were
relevancy, accuracy, minimizing bias, sequencing the questions and the length of the
questionnaire and these are discussed below.
(i) Relevancy
‘A questionnaire is relevant to the extent that all information collected addresses a
research question’ (Zikmund et al. 2010, p. 336). The questions were related to the
information need and linked back to the research questions (Ticehurst & Veal 1999) as
shown in Figure 3.10. Wrong or irrelevant questions were not included in the
questionnaire.
(ii) Accuracy
‘Accuracy means that the information is reliable and valid’ (Zikmund et al. 2010, p. 337).
The questions were presented in simple, understandable and unbiased manner. They were
also specific and set in clear terms to avoid misunderstanding by the respondents.
Double-barreled questions were avoided. Both positively and negatively worded

133
questioned were used to overcome the tendency of the respondents to answer at one end
of the scale. Furthermore, the sample comprised participants who were proficient in
English, well educated and interested in the research topic.
(iii) Minimizing Bias
Closed-ended questions were used to minimize bias with the respondents being given
specific, limited alternative responses to choose the one closest to the respondents’ own
viewpoint (Zikmund et al. 2010). Leading and emotionally charged questions were
avoided (Sekaran 2003).
(iv) Sequencing the Questions
The researcher used the funnel approach to sequence the questions (Festinger & Katz
1966). Funnel sequence is defined as ‘organizing survey research questions in a
questionnaire from general to specific questions’ (Neuman 2006, p. 294), and ‘from
questions that are relatively easy to answer to those that are progressively more difficult’
(Sekaran 2003, p. 242). The questionnaire, starting with questions that were general and
easy to answer, enabled the respondent to progress through the questionnaire with ease
and comfort (Zikmund et al. 2010; Sekaran 2003). The more difficult questions were left
to the end of the questionnaire.
(v) The Layout and Length of the Questionnaire
An attractive layout of the questionnaire is crucial for the self-administered questionnaire
as it improves accuracy and completeness and reduce non-response rate (Neuman 2006;
Zikmund et al. 2010). Attractive questionnaire persuades and motivates respondents.
Accordingly ‘questionnaires should be clear, neat and easy to follow’ (Neuman 2006, p.
295). Questionnaire should never be cramped and overcrowded, space should be
provided to ensure decent margins (Zikmund et al. 2010).

134
Guided by these authorities, the researcher prepared a three page questionnaire
comprising 12 questions. The pages were numbered and the questions were printed in 12
point Times New Roman font for easy reading.
3.4.5.6 Attitude Rating Scales
Measurement is defined as ‘the assignment of numbers of other symbols to characteristics
of objects according to certain prespecified rules’ (Malhotra 2010, p. 282). Rating is ‘a
measurement task that requires the respondent to estimate the magnitude of a
characteristic or quality that a brand, store or object possesses’ (Zikmund et al. 2010, p.
316). Scaling is the ‘generation of a continuum upon which measured objects are located’
(Malhotra 2010, p. 282). The survey questionnaire was aimed to collect quantifiable data.
This required the adoption of an appropriate rating scale to measure attitude responses.
There were several rating scales but three were considered here, namely simple attitude
scale, category scale and Likert scale. The features, advantages and disadvantages of
each are shown in Table 3.12.
Table 3.12 : Three Attitude Rating Scales
Type
Features
Advantages
Disadvantages
Simple Attitude
Either agree or disagree with a statement or question.
Ease of response.
Do not allow for making fine distinctions in the attitude of the respondents. No neutral reply.
Category Scale
Several response categories.
Provide more information flexibility and sensitive measure.
Ambiguous items due to few categories. Only gross distinction can be made.
Likert Scale
Statement evaluated on a number of point scale.
Simple and easy to administer.
Difficult to judge what a single summated score means.
Source : Adapted from Zikmund et al. (2010)
A five-point Likert scale was selected for this questionnaire survey as it was considered
appropriate for:
• Drawing distinctions in the attitudes of the survey participants.

135
• The ease and simplicity of administration.
• The flexibility of allowing the respondent to adopt an uncertain or don’t know
position.
As shown in Figure 3.11, respondents could select one of five ranges of attitudes, with
score assigned to the alternative responses. The five points are: ‘strongly disagree’,
‘disagree’, ‘uncertain’, ‘agree’ and ‘strongly agree’.
Figure 3.11 : Likert Scale and Score Assigned for the Survey Strongly Disagree Uncertain Agree Strongly Disagree Agree
1 2 3 4 5
Source : Developed for this Research
3.4.5.7 Pretesting the Questionnaire
Pretesting refers to ‘the testing of the questionnaire on a small sample of respondents to
identify and eliminate potential problems’ (Malhotra 2010, p. 354). All aspects of the
questionnaire were tested for relevancy, accuracy, sequencing, layout, length of question,
wording and instruction.
In line with Malhotra (2010) that the respondents for the pretest should be drawn from the
same population for the questionnaire survey, five knowledgeable persons who
participated in the experience survey were invited to complete and pretest the draft
questionnaire. After they completed the questionnaire, the researcher personally
interviewed each of them to pose the following questions:
• Were the questions relevant to the research issues?
• Were the questions ambiguous and not comprehensible?
• Were the questions sensitive, irritating or offensive?

136
• Was the format of the questionnaire easy to follow?
• Was the questionnaire lengthy?
The pretest yielded useful comments from the knowledgeable persons on some of the
poorly worded and ambiguous questions which could lead to misunderstanding and
misinterpretation by the participants. Guided by these comments, the researcher refined
the questionnaire.
3.4.5.8 The Finalized Questionnaire
The 12 questions were recast as statements as follows:
Research Proposition 1
The Malaysian Engineering Consulting Services (ECS) firms are well positioned for
global competitive advantage in the liberalizing global markets.
1) Malaysian ECS industry can no longer be protected by national legislations with
the implementation of the General Agreement on Trade in Services (GATS)
which is liberalizing global markets.
Strongly Disagree Uncertain Agree Strongly Disagree Agree
1 2 3 4 5
2) The bigger, older established international ECS firms are better placed to enter the
Malaysian engineering consulting market following the implementation of GATS.
Strongly Disagree Uncertain Agree Strongly Disagree Agree
1 2 3 4 5

137
3) The Malaysian ECS industry has the competences, expertise and strengths to
compete effectively in a liberalizing world.
Strongly Disagree Uncertain Agree Strongly Disagree Agree
1 2 3 4 5
4) Malaysian ECS industry is well prepared to take advantage of emerging new
market opportunities with the implementation of GATS.
Strongly Disagree Uncertain Agree Strongly Disagree Agree
1 2 3 4 5
Research Proposition 2
The Malaysia Government has effective targeted support policies and programmes to
assist Malaysian ECS firms with their internationalization effort.
5) The Malaysian Government has an effective policy framework to promote the
interests of the domestic ECS industry.
Strongly Disagree Uncertain Agree Strongly Disagree Agree
1 2 3 4 5
6) The Malaysian Government is actively promoting new international market
penetration effort by Malaysian ECS firms.
Strongly Disagree Uncertain Agree Strongly Disagree Agree
1 2 3 4 5

138
7) The existing funding support and incentives provided by the Government enable
the Malaysian ECS industry to more effectively compete in the international
markets.
Strongly Disagree Uncertain Agree Strongly Disagree Agree
1 2 3 4 5
8) The Malaysian Government collaborates closely with Malaysian ECS industry in
devising new policies and support measures for increasing the international
competitive positioning of Malaysian ECS industry.
Strongly Disagree Uncertain Agree Strongly Disagree Agree
1 2 3 4 5
Research Proposition 3
The exporting Malaysian ECS firms have appropriate strategies for successfully entering
new international markets.
9) The Malaysian ECS firms are actively formulating and implementing
internationalization strategies.
Strongly Disagree Uncertain Agree Strongly Disagree Agree
1 2 3 4 5
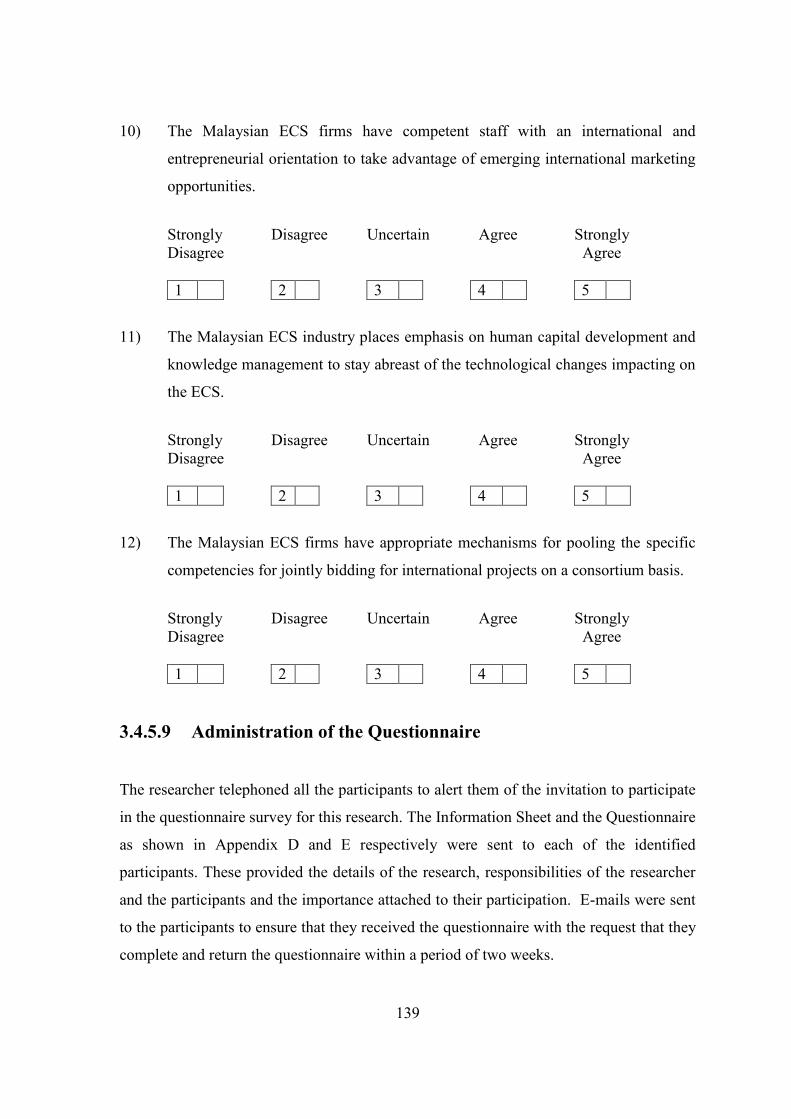
139
10) The Malaysian ECS firms have competent staff with an international and
entrepreneurial orientation to take advantage of emerging international marketing
opportunities.
Strongly Disagree Uncertain Agree Strongly Disagree Agree
1 2 3 4 5
11) The Malaysian ECS industry places emphasis on human capital development and
knowledge management to stay abreast of the technological changes impacting on
the ECS.
Strongly Disagree Uncertain Agree Strongly Disagree Agree
1 2 3 4 5
12) The Malaysian ECS firms have appropriate mechanisms for pooling the specific
competencies for jointly bidding for international projects on a consortium basis.
Strongly Disagree Uncertain Agree Strongly Disagree Agree
1 2 3 4 5
3.4.5.9 Administration of the Questionnaire
The researcher telephoned all the participants to alert them of the invitation to participate
in the questionnaire survey for this research. The Information Sheet and the Questionnaire
as shown in Appendix D and E respectively were sent to each of the identified
participants. These provided the details of the research, responsibilities of the researcher
and the participants and the importance attached to their participation. E-mails were sent
to the participants to ensure that they received the questionnaire with the request that they
complete and return the questionnaire within a period of two weeks.

140
3.4.5.10 The Survey Responses
All the survey participants were located in Kuala Lumpur and the Klang Valley region.
This enabled the researcher to have easy access to the participants. The questionnaire had
only 12 closed end statements for which responses were sought. Due to a combination of
these factors, all 180 participants completed and returned the questionnaire for this
research.
3.4.6 Conclusion
This Section discussed the collection of primary date using the focus group meeting and
questionnaire survey. The next section discusses the measures taken to improve the
quality of primary data collected.
3.5 Research Quality
Research findings must be trustworthy (Bryman & Bell 2007; Neuman 2006). This
section discusses the measures taken to secure valid and reliable data. These relate to
issues of reliability, validity and triangulation.
3.5.1 Reliability
Reliability applies to a measure, which yields consistent similar results across situations
and over time, or similar observations by other observers (Easterby-Smith, Thorpe &
Lowe 2002; Zikmund et al. 2010). ‘Reliability is an indicator of a measure’s internal
consistency’ (Zikmund et al. 2010, p. 305). However, qualitative researchers ‘accept that
different researchers or researchers using alternative measures will get distinctive results’
(Neuman 2006, p. 196). This is because qualitative data is collected in an evolving
interactive setting between the researchers and what are being studied and that the
setting’s context dictates the use of measures that cannot be repeated. Consequently,
reliability may be threatened from four sources of errors: participant error, participant
bias, observer error and observer bias (Robson 2002).

141
The measures taken, in line with Cooper and Schindler (2003), to reduce or eliminate
errors and bias included:
• An attractive layout of questionnaire with funnel sequence and the use of clear
simple words to avoid ambiguity, misunderstanding and misinterpretation by the
participants. Leading questions, loaded questions, double barrel questions,
irritating, offensive or sensitive questions were avoided.
• The use of closed-ended questions in the questionnaire encouraged response
because of the quick and easy way to reply.
• The use of a five-point Likert scale in the questionnaire to accurately measure
variability in the respondents’ responses.
• Pre-testing of the questionnaire by knowledgeable persons to ensure that the
statements were easily understood.
• The selection of the focus group and survey participants with similar demographic
and socioeconomic features in terms of lifestyle, job classification, education,
years of experience and levels of responsibility in their respective organizations.
• The provision of a Discussion Guide and Information Sheet to the focus group
participants to enable them to give informed views on the research issues.
3.5.2 Validity
Validity and reliability are usually complementary but at times they may be in conflict
with each other (Neuman 2006). ‘Reliability is a necessary but not sufficient condition
for validity. A reliable scale may not be valid ……… A reliable but invalid instrument
will yield consistently inaccurate results’ (Zikmund et al. 2010, p. 309). Validity is the
‘accuracy of a measure or the extent to which a score truthfully represents a concept’
(Zikmund et al. 2010, p. 307). There are a number of different forms of validity and three
of the more prominent ones are external validity, internal validity and construct validity.
3.5.2.1 External Validity
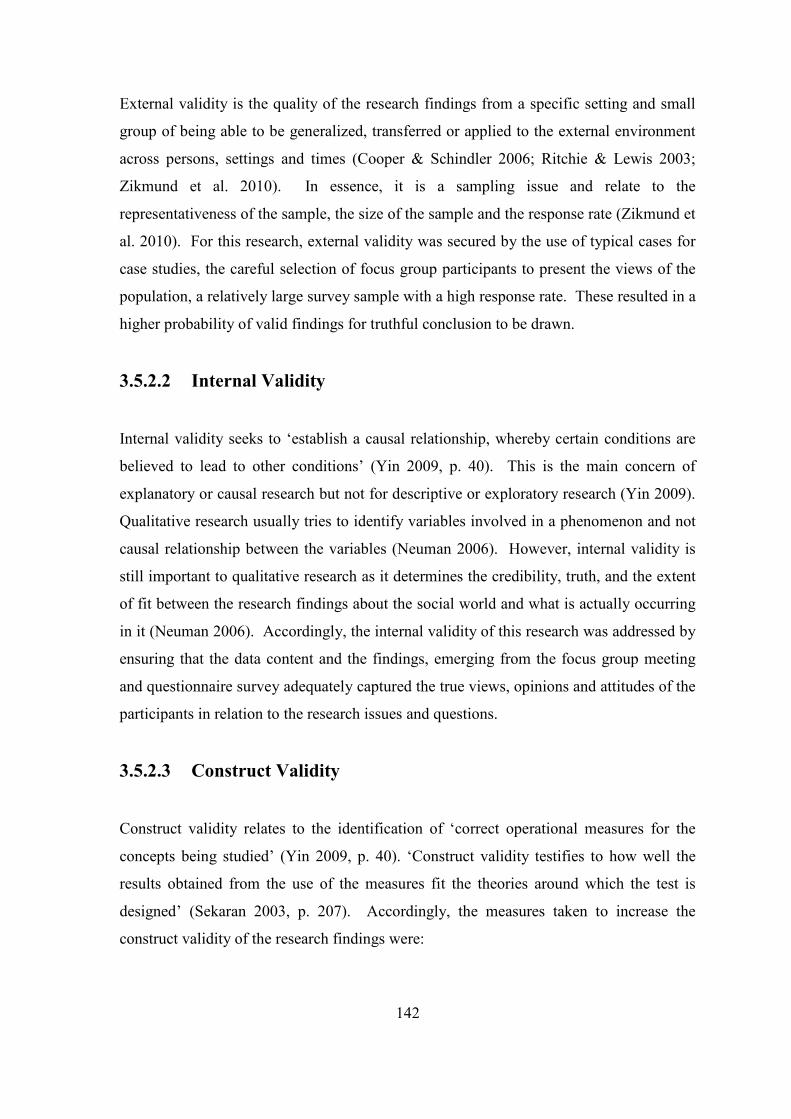
142
External validity is the quality of the research findings from a specific setting and small
group of being able to be generalized, transferred or applied to the external environment
across persons, settings and times (Cooper & Schindler 2006; Ritchie & Lewis 2003;
Zikmund et al. 2010). In essence, it is a sampling issue and relate to the
representativeness of the sample, the size of the sample and the response rate (Zikmund et
al. 2010). For this research, external validity was secured by the use of typical cases for
case studies, the careful selection of focus group participants to present the views of the
population, a relatively large survey sample with a high response rate. These resulted in a
higher probability of valid findings for truthful conclusion to be drawn.
3.5.2.2 Internal Validity
Internal validity seeks to ‘establish a causal relationship, whereby certain conditions are
believed to lead to other conditions’ (Yin 2009, p. 40). This is the main concern of
explanatory or causal research but not for descriptive or exploratory research (Yin 2009).
Qualitative research usually tries to identify variables involved in a phenomenon and not
causal relationship between the variables (Neuman 2006). However, internal validity is
still important to qualitative research as it determines the credibility, truth, and the extent
of fit between the research findings about the social world and what is actually occurring
in it (Neuman 2006). Accordingly, the internal validity of this research was addressed by
ensuring that the data content and the findings, emerging from the focus group meeting
and questionnaire survey adequately captured the true views, opinions and attitudes of the
participants in relation to the research issues and questions.
3.5.2.3 Construct Validity
Construct validity relates to the identification of ‘correct operational measures for the
concepts being studied’ (Yin 2009, p. 40). ‘Construct validity testifies to how well the
results obtained from the use of the measures fit the theories around which the test is
designed’ (Sekaran 2003, p. 207). Accordingly, the measures taken to increase the
construct validity of the research findings were:

143
• The operationalization of the concepts based on the constructs identified in the
literature review of the secondary data in Chapter Two.
• The use of multiple sources of data and evidence to provide multiple measures of
the same phenomenon by triangulation and corroboration of findings.
3.5.3 Triangulation
Triangulation improves research practice by enhancing the validity of research findings
(Mathison 1988). It looks at something from multiple points of view in order to improve
accuracy (Neuman 2006). ‘Triangulation refers to the use of different data collection
methods within one study’ (Saunders, Lewis & Thornhill 2003, p. 99). Miles and
Huberman (1994, p. 266) argued that ‘triangulation is supposed to support a finding by
showing that independent measures of it agree with it or, at least, do not contradict it’.
The logic of triangulation is based on the premise that single investigator or monomethod
is subject to personalistic biases that cannot adequately solve ‘the problem of rival causal
factors. Because each method reveals different aspects of empirical reality, multiple
methods of observations must be employed’ (Denzin 1978, p. 28) to ‘circumvent the
personal biases of investigators and to overcome the deficiencies intrinsic to a single-
investigator, single-theory, or single method study, thus increasing the validity of the
findings’ (Kimchi, Polivka & Stevenson 1991, p. 365). The ‘converging lines of enquiry’
(Yin 2009, p. 115) and agreement between two methods will strengthen the validation
process (Bouchard 1976). Accordingly, to improve confidence in findings the researcher
adopted:
• Data triangulation to enhance construct validity through the use of multiple
sources of data which included secondary data from literature review, archival and
documentary records and primary data which were obtained from a focus group
meeting and a questionnaire survey.
• Methodological triangulation to increase internal and external validity and
reliability. This included the between – method triangulation of using the mixed
methods of qualitative and quantitative approaches (Patton 2002).

144
3.6 Data Analysis Procedures
Data analysis is ‘the application of reasoning to understand the data that have been
gathered’ (Zikmund et al. 2010, p. 70). It gives meaning to the data. The appropriate
analytical technique of data analysis depends on the characteristics of the research design
and the nature of data collected.
This research employed a mixed methodology, generating both qualitative and
quantitative data. Therefore, two methods of data analysis were required and outlined
below:
3.6.1 Qualitative Data Analysis
Qualitative data are empirical information in the form of words, images and symbols
from documents, observations, transcripts, records, notes, artifacts, photographs and
audiovisual materials describing human actions and social events (Neuman 2006; Punch
2005). The qualitative data are usually voluminous, messy, due to its richness and is
therefore time consuming and cumbersome to analyze (Bryman & Bell 2007).
Guided by Miles and Huberman (1994), and Neuman (2006), the researcher adopted a
three step approach for the analysis of the qualitative data emerging from the literature
review and the focus group meeting, namely data reduction, data display, conclusion
drawing and verification. These three analysis activities together with the data collection
activity form an interactive cyclical process as depicted in Figure 3.12.
3.6.1.1 Data Reduction
This refers to the reduction of large volume of qualitative raw data into small manageable
pile by analytic choices of selecting, focusing, simplifying, abstracting, summarizing and
converting the data. To facilitate data reduction, the detailed notes taken during the focus
group meeting were condensed into analytical categories on the basis of themes or

145
concepts. This process continued until major themes emerged for conclusions to be
drawn and verified.
Figure 3.12 : Qualitative Data Analysis
Source : Adapted from Miles & Huberman (1994, p. 12)
3.6.1.2 Data Display
The reduced data were displayed in the form of matrices, graphs, charts and networks to
facilitate the interpretation of data. The display of data in this compact form made the
data immediately accessible for the researcher to draw justified conclusions (Miles &
Huberman 1994).
3.6.1.3 Conclusion Drawing and Verification
The researcher induced conclusions from the research findings basing on data display and
in relation to the research propositions. The conclusions were also verified accordingly
based on the evidence obtained from the data. These are presented in Chapter Four and
Five.
Data
Collection
Data
Display
Data
Reduction
Conclusion Drawing and
Verification

146
3.6.2 Quantitative Data Analysis
The quantifiable data are numbers based on five-point Likert scale in the survey
questionnaire. Before the data were analyzed, the data needed to be prepared and
processed as outlined in Figure 3.13. The process started with the stages of questionnaire
checking, editing, coding, transcribing, data cleaning and finally selecting a data analysis
strategy (Malhotra 2010) as below :
Figure 3.13 : Quantitative Data – Preparation Process
Source : Adapted from Malhotra (2010, p. 453)
• Editing. The questionnaires were screened with the objective of increasing
accuracy and precision by identifying illegible, incomplete, inconsistent, or
ambiguous responses.
• Coding. The response to each question was assigned a code in the form of
number for the purpose of statistical analysis.
• Transcribing. The coded data from the questionnaire were transferred directly
into the computer by keying in a format suitable for the chosen statistical software
for analysis.
• Cleaning. The data were checked for consistency by identifying those that were
out of range, logically inconsistent or extreme. Any missing responses were
treated by either substituting a neutral value or an imputed response, or casewise
or pairwise deletion.
Guided by Carver and Nash (2006), Coakes, Steed and Price (2008), Manning and Munro
(2007), the processed data were analyzed using the Statistical Package for the Social
Sciences (SPSS) Version 19, to produce the following outputs :
Questionnaire Checking
Editing
Coding
Transcribing
Data
Cleaning
Selecting a Data
Analysis Strategy

147
• Cross tabulations;
• Combined and re-coded responses;
• Case summaries;
• Group mean responses;
• ANOVA multiple comparisons; and
• Pearson Product Moment Correlations.
• Principal components analysis.
3.7 Research Ethics
Research ethics was defined by Wells (1994, p. 284) ‘in terms of a code of behaviour
appropriate to academics and the conduct of research’. This is to ensure that research
activities do not cause harm to participants or have any adverse consequences (Cooper &
Schindler 2006; Ticehurst & Veal 1999; Zikmund et al. 2010). There is no single
approach to ethics (Cooper & Schindler 2006, p. 116) as ethical values are influenced by
one’s moral standards and the broader social norms of behaviour (Wells 1994; Zikmund
et al. 2010). Diener and Crandall (1978) considered research ethics to comprise four
main areas: 1) right to privacy, 2) informed consent, 3) deception and 4) harm to
participants.
For this research, ethical issues concerned three parties – the researcher, the participants
and Southern Cross University. Each party has certain rights and obligations to other
parties (Zikmund et al. 2010). On his part, the researcher maintained objectivity,
presented the honest and true research findings and obtained the approval of the Human
Research Ethics Committee of Southern Cross University (Approval Number ECN-10-
223) as shown in Appendix F, before commencing the primary data collection activities.
This research was conducted in compliance with the National Statement on Ethical
Conduct in Human Research (2007) and the ethical issues included:
• Informed consent. The discussion guide and information sheets were sent to the
participants of experience survey and focus group to inform them of the

148
discussion topics. The nature and purpose of the research, the benefits and
possible risk to those involved, and the estimated time taken. Similarly the
information sheets were sent to the survey participants for their information. The
researcher secured the informed consent of the intended focus group interviewees
in writing prior to interviews. The receipt of the completed questionnaires meant
implied consent.
• Voluntary participation. Participation of the interviewees and survey
respondents were voluntary without coercion and inducement. The participants
could withdraw any time without any questions being asked.
• Privacy. The right of privacy of the participants was to be respected and not to be
intruded. Participants had the right to refuse to participate or to refuse answering
any question in the interview or questionnaire.
• Confidentiality. The data collected was kept confidential including participants’
identity and not to be disclosed to third parties. After the mandatory storage
period, the data would be destroyed. In the report, the data will be presented in
the aggregate form and no individual data will be shown.
• Anonymity. The participants would not be named in the report. Case
participants and focus group interviewees were identified using case numbers or
participant alphabets.
• Harm and risk. The participants were informed that the potential harm and risk
for involving in this research was negligible. The confidentiality and anonymity
of the participants were assured and would be maintained. All data published
would be presented as overall data and participants would not be named. Further,
the research dealt with non-personal and non-sensitive issues.
• Deception. Participants would not be deceived to participate or in giving
information.
3.8 Conclusion
This Chapter presented the selected research approach and the research design for a two-
stage mixed methodology. This was followed by a discussion on the data collection

149
instruments and the data analysis procedures. Issues relating to research quality and
ethics were also examined. The next Chapter presents the data analysis for this research.

150
CHAPTER FOUR – DATA ANALYSIS
4.1 Introduction
Chapter Three discussed the preferred research methodology, the preferred research
design and data collection instruments for this research. As explained in Sub-Section
3.2.2, this research adopted a mixed method methodology. Consequently, the data
collection involved two phases with the first being principally qualitative and the second
being quantitative.
The qualitative data for the first phase was collected from the literature review and a
Focus Group meeting. The quantitative data for the second phase was collected through a
questionnaire survey.
The Focus Group comprised eight participants and provided valuable insights to the key
research issues. The questionnaire survey involved 180 respondents. Categorized into
four groups, they were selected by a combination of judgemental and quota sampling.
The collected data were used to test the three Research Propositions, which emerged from
the literature review. Each Research Proposition had four related questions which were
re-cast as statements. The respondent’s responses to each of the statements were
measured using a five-point Likert rating scale. The collected raw survey data, shown in
Appendix G, were analyzed using SPSS Version 19 to identify patterns and relationships.
The outputs were summarized and tabulated, including:
• Cross tabulations of survey responses for each statement;
• Case summary for each statement;
• Cross tabulation of combined responses for each proposition;
• Combined and re-coded responses to each proposition by groups;
• Case summary for each proposition;
• Group mean ratings to each proposition;
• Pearson Product Moment Correlations;

151
• ANOVA multiple comparisons between groups;
• Principal components analysis.
The analysis process for each research proposition involved three stages:
• Stage 1 - Detailed notes were taken to record the views and opinions expressed
by the Focus Group participants. The notes were edited, categorized
and analyzed to identify the common themes and patterns.
• Stage 2 - The quantifiable data from the Questionnaire Survey were analyzed in
two ways. First, the responses to each of the four statements related to
each research proposition were analyzed using cross tabulations, case
summaries and multiple comparisons from one-way analysis of
variance (ANOVA). The responses were combined and re-coded in
terms of the scale ‘disagree’, ‘uncertain’ and ‘agree’. Next, was the
analysis of the combined survey responses to each proposition using
the combined cross tabulation, bar and pie charts to reflect the
breakdown of the overall responses and the composition by group type.
The Pearson Product Moment Correlations were also used to detect
any significant relationship between the statements for each
proposition.
• Stage 3 - Each research proposition was tested during this stage. This was done
by matching the findings of the Focus Group meeting with those of the
questionnaire survey. In situations when the views of the Focus Group
differed from the survey findings, they were categorized as ‘mixed’ or
‘no concrete agreement’.
4.1.1 Structure of Chapter Four
This Chapter presents the findings emerging from the analysis of the views expressed by
the Focus Group and the responses to the Questionnaire Survey. It has five sections as
shown in Figure 4.1.

152
Figure 4.1 : Structure of Chapter Four
Source : Developed for this Research
Section 4.1 introduces the Chapter, providing continuity from Chapter Three. It discusses
the analysis process and outlines the Chapter structure.
Section 4.2 analyzes the qualitative and quantitative data and tests the three Research
Propositions.
Section 4.3 deals with the unplanned data. These related to the views expressed by the
Focus Group participants that fell outside the scope of the Research Propositions and
Statements.
Section 4.4 sets out the conclusion of the Chapter.
Section 4.1 : Introduction
• Analysis Process
• Chapter Structure
Section 4.2 : Data Analysis
• Testing of Research Proposition 1
• Testing of Research Proposition 2
• Testing of Research Proposition 3
Section 4.3 : Unplanned Data
Section 4.4 : Conclusion

153
4.2 Data Analysis for Research Proposition 1
Proposition 1 : The Malaysian Engineering Consulting Services (ECS) firms are well
positioned for global competitive advantage in the liberalizing global
markets.
Statements 1, 2, 3 and 4 in the Questionnaire Survey which relate to Proposition 1 are
presented below:
Statement 1 : Malaysian ECS industry can no longer be protected by national
legislations with the implementation of the General Agreement on Trade
in Services (GATS) which is liberalizing global markets.
Statement 2 : The bigger, older established international ECS firms are better placed
to enter the Malaysian engineering consulting market following the
implementation of GATS.
Statement 3 : The Malaysian ECS industry has the competences, expertise and
strengths to compete effectively in a liberalizing world.
Statement 4 : Malaysian ECS industry is well prepared to take advantage of emerging
new market opportunities with the implementation of GATS.
4.2.1 Analysis of the Focus Group Meeting
All the four statements that related to Proposition 1 were discussed by the eight members
of the Focus Group. They comprised four representatives from each of the four Case
Study Firms, one from a Non-Case Study Firm and one each from MATRADE, MBAM
and academia. The meeting generated a wide range of perspectives and views on global
positioning and competitiveness of the Malaysian ECS industry. The Focus Group
reached consensus on the following issues:

154
(i) The Malaysian Government is progressively opened up the Malaysian market to
foreigners. However, the Malaysian ECS industry is small compared to other
industries. Accordingly, the Malaysian Government could well pay less attention
to protect the interests of the small Malaysian ECS industry as compared to the
larger industrial and other services sectors which have much larger ‘lobbying’
powers. Hence with the implementation of GATS, the Malaysian ECS industry
may not be protected by national legislations. Consequently any existing
prohibitive legislations and barriers could be removed.
(ii) Some of the larger and well established Western foreign ECS firms already have a
presence in Malaysia. They are involved in major complex projects in partnership
with the local firms which lack the necessary expertise. They involve specialist
inputs only and generally hire local staff. This may include local professional
engineers to facilitate signing of plans and reports for submission to authorities.
Due to the localization of their operations, they are able to compete with
indigenous Malaysian firms. Further, they have the advantage of their
international networks to outsource work to other third world countries at low cost.
Following the implementation of GATS, more foreign ECS firms, particularly
those from the developing countries such as China, India, Indonesia and
Philippines, are expected to enter the Malaysian market if the market conditions
are favourable. Accordingly, the Malaysian indigenous ECS firms will have to
face stiff competition from the ECS firms of these developing countries due to the
lower cost factor.
(iii) Malaysian engineers have the competences, expertise and strengths to compete
effectively in the liberalizing world market. A Focus Group member quoted
FIDIC’s view that Asian ECS firms are competitive compared to European ECS
firms and are able to offer low cost engineering solutions. The REA requires the
engineers to be competent and professional in their work while emphasizing on
the code of ethics and professionalism. However, the engineers were not trained
in the management field, thus making them ‘bad businessmen’ and poor

155
entrepreneurs. Furthermore the Malaysian engineers are generally weak in
financial management and also lack the skills required for the pricing of ECS.
(iv) The Malaysian ECS firms are prepared to take advantage of emerging new
opportunities with the implementation of GATS. However, they have difficulty in
securing the financial resources required for entering international markets. This
is compounded by the REA which forbids the general public to own more than
30% shares in Malaysian ECS firms. As such, the ECS firms are unable to secure
the needed finances from public funding and financial institutions. They therefore
have to generate funds from internal sources, personal borrowing or retained
profits. Due to the size limitation, the Malaysian ECS firms also have difficulties
in raising performance bonds and professional indemnity insurance coverage for
major projects.
Taking all the expressed views into consideration, the Focus Group supported the
Research Proposition 1 that the Malaysian ECS firms are well positioned for
global competitive advantage in the liberalizing global markets.
4.2.2 Analysis of Questionnaire Survey Responses
4.2.2.1 Statement 1
Statement 1 : Malaysian ECS industry can no longer be protected by national
legislations with the implementation of the General Agreement on Trade
in Services (GATS) which is liberalizing global markets.
The cross tabulation of survey responses to Statement 1 shown in Table 4.1, and the
combined and re-coded responses shown in Figure 4.2, reveal that the majority or 63.3%
of the survey respondents supported the statement, 19.5% disagreed and 17.2% were
uncertain. The main support was from the Case Study Firms with 63.4%, the Non-Case
Study Firms with 71.7% and the Contractors with 80.0%. However, half of the
respondents from the Government Agencies disagreed with the Statement.

156
Table 4.1 : Cross Tabulation of Survey Responses - Statement 1
Statement 1
Group Type
Statistics
Strongly Disagree
Disagree
Uncertain
Agree
Strongly Agree
Total
Case Study Firms
Count 1 12 9 37 1 60
% within Group Type 1.7% 20.0% 15.0% 61.7% 1.7% 100.0%
% within Statement 1 20.0% 40.0% 29.0% 37.4% 6.7% 33.3%
% of Total 0.6% 6.7% 5.0% 20.6% 0.6% 33.3%
Non-Case Study Firms
Count 1 4 12 33 10 60
% within Group Type 1.7% 6.7% 20.0% 55.0% 16.7% 100.0%
% within Statement 1 20.0% 13.3% 38.7% 33.3% 66.7% 33.3%
% of Total 0.6% 2.2% 6.7% 18.3% 5.6% 33.3%
Government Agencies
Count 2 13 6 7 2 30
% within Group Type 6.7% 43.3% 20.0% 23.3% 6.7% 100.0%
% within Statement 1 40.0% 43.3% 19.4% 7.1% 13.3% 16.7%
% of Total 1.1% 7.2% 3.3% 3.9% 1.1% 16.7%
Contractors Count 1 1 4 22 2 30
% within Group Type 3.3% 3.3% 13.3% 73.3% 6.7% 100.0%
% within Statement 1 20.0% 3.3% 12.9% 22.2% 13.3% 16.7%
% of Total 0.6% 0.6% 2.2% 12.2% 2.2% 16.7%
Total Count 5 30 31 99 15 180
% within Group Type 2.8% 16.7% 17.2% 55.0% 8.3% 100.0%
% within Statement 1 100.0% 100.0% 100.0% 100.0% 100.0% 100.0%
% of Total 2.8% 16.7% 17.2% 55.0% 8.3% 100.0%
Source : Developed from the Survey Data
Figure 4.2 : Combined and Re-coded Responses to Statement 1
Source : Developed from the Survey Data
Table 4.2 shows the case summary of the responses to Statement 1. The overall mean
rating of 3.49 reflects a moderately good support for the Statement even though there
were varied opinions as indicated by a high standard deviation of 0.96. The respondents
from the Non-Case Study Firms, the Contractors and the Case Study Firms were the
strongest supporters with the mean ratings of 3.78, 3.77 and 3.42 respectively. The
respondents from the Government Agencies did not support the Statement as reflected by
the low mean rating of 2.80. They were also divided on the issue given the high standard
deviation of 1.095.

157
Table 4.2 : Case Summary – Statement 1
Group Type N Mean Std. Deviation
Case Study Firms 60 3.42 0.889
Non-Case Study Firms 60 3.78 0.865
Government Agencies 30 2.80 1.095
Contractors 30 3.77 0.774
Total 180 3.49 0.960
Source : Developed from the Survey Data
The Tukey’s Honestly Significant Difference test of one-way ANOVA with multiple
comparisons, appended in Table 4.3, shows a significant difference in opinions between
the Government Agencies and the rest of the groups. However, there were no significant
differences in opinions between the Case Study Firms, the Non-Case Study Firms and the
Contractors.
Table 4.3 : Multiple Comparisons between Groups for Statement 1
Tukey HSD
Dependent Variable (I) GROUP (J) GROUP
Mean Difference (I-J) Std. Error Sig.
95% Confidence Interval
Lower Bound Upper Bound
STATEMENT 1 A B -.367 .165 .120 -.79 .06
C .617* .202 .014 .09 1.14
D -.350 .202 .308 -.87 .17
B A .367 .165 .120 -.06 .79
C .983* .202 .000 .46 1.51
D .017 .202 1.000 -.51 .54
C A -.617* .202 .014 -1.14 -.09
B -.983* .202 .000 -1.51 -.46
D -.967* .233 .000 -1.57 -.36
D A .350 .202 .308 -.17 .87
B -.017 .202 1.000 -.54 .51
C .967* .233 .000 .36 1.57
A : Case Study Firms; B : Non-Case Study Firms; C : Government Agencies; D : Contractors
* The mean difference is significant at the 0.05 level.
Source : Developed from the Survey Data
4.2.2.2 Statement 2
Statement 2 : The bigger, older established international ECS firms are better placed
to enter the Malaysian engineering consulting market following the
implementation of GATS.
The cross tabulation of survey responses to Statement 2 shown in Table 4.4, and the
combined and re-coded responses shown in Figure 4.3, reveal that the majority or 77.2%

158
Table 4.4 : Cross Tabulation of Survey Responses - Statement 2
Statement 2
Group Type
Statistics
Strongly Disagree
Disagree
Uncertain
Agree
Strongly Agree
Total
Case Study Firms
Count 0 3 7 40 10 60
% within Group Type 0.0% 5.0% 11.7% 66.7% 16.7% 100.0%
% within Statement 2 0.0% 25.0% 28.0% 38.1% 29.4% 33.3%
% of Total 0.0% 1.7% 3.9% 22.2% 5.6% 33.3%
Non-Case Study Firms
Count 1 5 10 31 13 60
% within Group Type 1.7% 8.3% 16.7% 51.7% 21.7% 100.0%
% within Statement 2 25.0% 41.7% 40.0% 29.5% 38.2% 33.3%
% of Total 0.6% 2.8% 5.6% 17.2% 7.2% 33.3%
Government Agencies
Count 3 3 6 12 6 30
% within Group Type 10.0% 10.0% 20.0% 40.0% 20.0% 100.0%
% within Statement 2 75.0% 25.0% 24.0% 11.4% 17.6% 16.7%
% of Total 1.7% 1.7% 3.3% 6.7% 3.3% 16.7%
Contractors Count 0 1 2 22 5 30
% within Group Type 0.0% 3.3% 6.7% 73.3% 16.7% 100.0%
% within Statement 2 0.0% 8.3% 8.0% 21.0% 14.7% 16.7%
% of Total 0.0% 0.6% 1.1% 12.2% 2.8% 16.7%
Total Count 4 12 25 105 34 180
% within Group Type 2.2% 6.7% 13.9% 58.3% 18.9% 100.0%
% within Statement 2 100.0% 100.0% 100.0% 100.0% 100.0% 100.0%
% of Total 2.2% 6.7% 13.9% 58.3% 18.9% 100.0%
Source : Developed from the Survey Data
Figure 4.3 : Combined and Re-coded Responses to Statement 2
Source : Developed from the Survey Data
of the survey respondents supported the Statement, 13.9% were uncertain and 8.9%
disagreed. The respondents of the Case Study Firms supported the Statement at 83.4%,
the Non-Case Study Firms at 73.4%, the Government Agencies at 60.0% and the
Contractors at 90.0%.
Table 4.5 shows the case summary of the responses to Statement 2. The overall mean
rating of 3.85 reflects a strong support for the Statement. The respondents from the Case
Study Firms, the Non-Case Study Firms and the Contractors supported the Statement as

159
indicated by the mean ratings of 3.95, 3.83 and 4.03 respectively. The respondents from
the Government Agencies also supported but with the lowest mean rating of 3.50 and they
had varying opinions as indicated by a high standard deviation of 1.225.
Table 4.5 : Case Summary – Statement 2
Group Type N Mean Std. Deviation
Case Study Firms 60 3.95 0.699
Non-Case Study Firms 60 3.83 0.924
Government Agencies 30 3.50 1.225
Contractors 30 4.03 0.615
Total 180 3.85 0.881
Source : Developed from the Survey Data
The multiple comparisons of the Tukey’s test of one-way ANOVA, appended in Table
4.6, show that there are no significant differences in opinions between the groups.
Table 4.6 : Multiple Comparisons between Groups for Statement 2
Tukey HSD
Dependent Variable (I) GROUP
(J) GROUP
Mean Difference (I-J) Std. Error Sig.
95% Confidence Interval
Lower Bound Upper Bound
STATEMENT 2 A B .117 .159 .884 -.30 .53
C .450 .195 .100 -.06 .96
D -.083 .195 .974 -.59 .42
B A -.117 .159 .884 -.53 .30
C .333 .195 .321 -.17 .84
D -.200 .195 .734 -.71 .31
C A -.450 .195 .100 -.96 .06
B -.333 .195 .321 -.84 .17
D -.533 .225 .087 -1.12 .05
D A .083 .195 .974 -.42 .59
B .200 .195 .734 -.31 .71
C .533 .225 .087 -.05 1.12
A : Case Study Firms; B : Non-Case Study Firms; C : Government Agencies; D : Contractors
* The mean difference is significant at the 0.05 level.
Source : Developed from the Survey Data
4.2.2.3 Statement 3
Statement 3 : The Malaysian ECS industry has the competences, expertise and
strengths to compete effectively in a liberalizing world.
The cross tabulation of the survey responses to Statement 3, shown in Table 4.7, and the
combined and re-coded responses shown in Figure 4.4, reveal that more than half or

160
55.6% of all the survey respondents supported the Statement, 25.5% were uncertain and
18.9% disagreed. The respondents of the Government Agencies showed the strongest
support at 70.0%, followed by the Non-Case Study Firms at 61.7%, the Case Study Firms
at 48.4% and the Contractors at 43.3%. A large proportion of the respondents also
showed uncertainty ranging from 20.0% for the Non-Case Study Firms to 36.7% for the
Contractors.
Table 4.7 : Cross Tabulation of Survey Responses - Statement 3
Statement 3
Group Type
Statistics
Strongly Disagree
Disagree
Uncertain
Agree
Strongly Agree
Total
Case Study Firms
Count 0 15 16 25 4 60
% within Group Type 0.0% 25.0% 26.7% 41.7% 6.7% 100.0%
% within Statement 3 0.0% 46.9% 34.8% 28.4% 33.3% 33.3%
% of Total 0.0% 8.3% 8.9% 13.9% 2.2% 33.3%
Non-Case Study Firms
Count 2 9 12 34 3 60
% within Group Type 3.3% 15.0% 20.0% 56.7% 5.0% 100.0%
% within Statement 3 100.0% 28.1% 26.1% 38.6% 25.0% 33.3%
% of Total 1.1% 5.0% 6.7% 18.9% 1.7% 33.3%
Government Agencies
Count 0 2 7 17 4 30
% within Group Type 0.0% 6.7% 23.3% 56.7% 13.3% 100.0%
% within Statement 3 0.0% 6.3% 15.2% 19.3% 33.3% 16.7%
% of Total 0.0% 1.1% 3.9% 9.4% 2.2% 16.7%
Contractors Count 0 6 11 12 1 30
% within Group Type 0.0% 20.0% 36.7% 40.0% 3.3% 100.0%
% within Statement 3 0.0% 18.8% 23.9% 13.6% 8.3% 16.7%
% of Total 0.0% 3.3% 6.1% 6.7% 0.6% 16.7%
Total Count 2 32 46 88 12 180
% within Group Type 1.1% 17.8% 25.5% 48.9% 6.7% 100.0%
% within Statement 3 100.0% 100.0% 100.0% 100.0% 100.0% 100.0%
% of Total 1.1% 17.8% 25.6% 48.9% 6.7% 100.0%
Source : Developed from the Survey Data
Figure 4.4 : Combined and Re-coded Responses to Statement 3
Source : Developed from the Survey Data
Table 4.8 shows the case summary of the responses to Statement 3. The overall mean
rating of 3.42 reflects a fair support for the Statement. The mean ratings for the Case

161
Study Firms, the Non-Case Study Firms, the Government Agencies and the Contractors
are 3.30, 3.45, 3.77 and 3.27 respectively.
Table 4.8 : Case Summary – Statement 3
Group Type N Mean Std. Deviation
Case Study Firms 60 3.30 0.926
Non-Case Study Firms 60 3.45 0.928
Government Agencies 30 3.77 0.774
Contractors 30 3.27 0.828
Total 180 3.42 0.897
Source : Developed from the Survey Data
The Tukey’s test of one-way ANOVA with multiple comparisons shown in Table 4.9
reveals that there are no significant differences in responses between the various groups.
Table 4.9 : Multiple Comparisons between Groups for Statement 3 Tukey HSD
Dependent Variable (I) GROUP
(J) GROUP
Mean Difference (I-J) Std. Error Sig.
95% Confidence Interval
Lower Bound Upper Bound
STATEMENT 3 A B -.150 .162 .791 -.57 .27
C -.467 .198 .091 -.98 .05
D .033 .198 .998 -.48 .55
B A .150 .162 .791 -.27 .57
C -.317 .198 .384 -.83 .20
D .183 .198 .792 -.33 .70
C A .467 .198 .091 -.05 .98
B .317 .198 .384 -.20 .83
D .500 .229 .132 -.09 1.09
D A -.033 .198 .998 -.55 .48
B -.183 .198 .792 -.70 .33
C -.500 .229 .132 -1.09 .09
A : Case Study Firms; B : Non-Case Study Firms; C : Government Agencies; D : Contractors
* The mean difference is significant at the 0.05 level.
Source : Developed from the Survey Data
4.2.2.4 Statement 4
Statement 4 : Malaysian ECS industry is well prepared to take advantage of emerging
new market opportunities with the implementation of GATS.
The cross tabulation of the survey responses to Statement 4 shown in Table 4.10, and the
combined and re-coded responses shown in Figure 4.5, reveal that less than half or 43.9%
of the survey respondents supported the Statement, 32.8% were uncertain and 23.3%

162
disagreed. The respondents from the Government Agencies showed the strongest support
at 56.6%, followed by the Non-Case Study Firms at 41.7%, the Case Study Firms at
41.6% and the Contractors at 40.0%. Uncertain responses were sizable, ranging from
23.3% for the Government Agencies, 26.7% for the Case Study Firms, 38.3% for the
Non-Case Study Firms and 43.3% for the Contractors.
Table 4.10 : Cross Tabulation of Survey Responses - Statement 4
Statement 4
Group Type
Statistics
Strongly Disagree
Disagree
Uncertain
Agree
Strongly Agree
Total
Case Study Firms
Count 0 19 16 23 2 60
% within Group Type 0.0% 31.7% 26.7% 38.3% 3.3% 100.0%
% within Statement 4 0.0% 50.0% 27.1% 33.8% 18.2% 33.3%
% of Total 0.0% 10.6% 8.9% 12.8% 1.1% 33.3%
Non-Case Study Firms
Count 3 9 23 21 4 60
% within Group Type 5.0% 15.0% 38.3% 35.0% 6.7% 100.0%
% within Statement 4 75.0% 23.7% 39.0% 30.9% 36.4% 33.3%
% of Total 1.7% 5.0% 12.8% 11.7% 2.2% 33.3%
Government Agencies
Count 1 5 7 13 4 30
% within Group Type 3.3% 16.7% 23.3% 43.3% 13.3% 100.0%
% within Statement 4 25.0% 13.2% 11.9% 19.1% 36.4% 16.7%
% of Total 0.6% 2.8% 3.9% 7.2% 2.2% 16.7%
Contractors Count 0 5 13 11 1 30
% within Group Type 0.0% 16.7% 43.3% 36.7% 3.3% 100.0%
% within Statement 4 0.0% 13.2% 22.0% 16.2% 9.1% 16.7%
% of Total 0.0% 2.8% 7.2% 6.1% 0.6% 16.7%
Total Count 4 38 59 68 11 180
% within Group Type 2.2% 21.1% 32.8% 37.8% 6.1% 100.0%
% within Statement 4 100.0% 100.0% 100.0% 100.0% 100.0% 100.0%
% of Total 2.2% 21.1% 32.8% 37.8% 6.1% 100.0%
Source : Developed from the Survey Data
Figure 4.5 : Combined and Re-coded Responses to Statement 4
Source : Developed from the Survey Data
Table 4.11 shows the case summary of the responses to Statement 4. The overall mean
rating of 3.24 reflects a weak support for the Statement. The respondents from the Case
Study Firms, the Non-Case Study Firms, the Government Agencies and the Contractors

163
had the mean ratings of 3.13, 3.23, 3.47 and 3.27 respectively. Even though the
Government Agencies had the highest mean rating, their opinions were varied as
indicated by a high standard deviation of 1.042.
Table 4.11 : Case Summary – Statement 4
Group Type N Mean Std. Deviation
Case Study Firms 60 3.13 0.911
Non-Case Study Firms 60 3.23 0.963
Government Agencies 30 3.47 1.042
Contractors 30 3.27 0.785
Total 180 3.24 0.931
Source : Developed from the Survey Data
The Tukey’s test of one-way ANOVA with multiple comparisons shown in Table 4.12
reveals no significant differences in opinions between the groups.
Table 4.12 : Multiple Comparisons between Groups for Statement 4
Tukey HSD
Dependent Variable (I) GROUP
(J) GROUP
Mean Difference (I-J) Std. Error Sig.
95% Confidence Interval
Lower Bound Upper Bound
STATEMENT 4 A B -.100 .170 .936 -.54 .34
C -.333 .208 .382 -.87 .21
D -.133 .208 .919 -.67 .41
B A .100 .170 .936 -.34 .54
C -.233 .208 .678 -.77 .31
D -.033 .208 .999 -.57 .51
C A .333 .208 .382 -.21 .87
B .233 .208 .678 -.31 .77
D .200 .241 .840 -.42 .82
D A .133 .208 .919 -.41 .67
B .033 .208 .999 -.51 .57
C -.200 .241 .840 -.82 .42 A : Case Study Firms; B : Non-Case Study Firms; C : Government Agencies; D : Contractors
* The mean difference is significant at the 0.05 level.
Source : Developed from the Survey Data
4.2.2.5 Analysis of the Combined Survey Responses to Proposition 1
The cross tabulation of combined survey responses to Statements 1, 2, 3 and 4 for
Proposition 1 is shown in Table 4.13. The combined responses re-coded in terms of
‘disagree, uncertain and agree’ are shown in Figure 4.6. The Table and Figure reveal that

164
60% of the survey respondents supported Proposition 1, 22.4% were uncertain and 17.6%
disagreed.
Table 4.13 : Cross Tabulation of Combined Survey Responses for
Proposition 1
Proposition 1
Group Type
Statistics
Strongly Disagree
Disagree
Uncertain
Agree
Strongly Agree
Total
Case Study Firms
Count 1 49 48 125 17 240
% within Group Type 0.4% 20.4% 20.0% 52.1% 7.1% 100.0%
% within Proposition 1 6.7% 43.8% 29.8% 34.7% 23.6% 33.3%
% of Total 0.1% 6.8% 6.7% 17.4% 2.4% 33.3%
Non-Case Study Firms
Count 7 27 57 119 30 240
% within Group Type 2.9% 11.3% 23.7% 49.6% 12.5% 100.0%
% within Proposition 1 46.7% 24.1% 35.4% 33.1% 41.7% 33.3%
% of Total 1.0% 3.8% 7.9% 16.5% 4.2% 33.3%
Government Agencies
Count 6 23 26 49 16 120
% within Group Type 5.0% 19.2% 21.7% 40.8% 13.3% 100.0%
% within Proposition 1 40.0% 20.5% 16.1% 13.6% 22.2% 16.7%
% of Total 0.8% 3.2% 3.6% 6.8% 2.2% 16.7%
Contractors Count 1 13 30 67 9 120
% within Group Type 0.8% 10.8% 25.0% 55.8% 7.5% 100.0%
% within Proposition 1 6.7% 11.6% 18.6% 18.6% 12.5% 16.7%
% of Total 0.1% 1.8% 4.2% 9.3% 1.3% 16.7%
Total Count 15 112 161 360 72 720
% within Group Type 2.1% 15.5% 22.4% 50.0% 10.0% 100.0%
% within Proposition 1 100.0% 100.0% 100.0% 100.0% 100.0% 100.0%
% of Total 2.1% 15.6% 22.4% 50.0% 10.0% 100.0%
Source : Developed from the Survey Data
Figure 4.6 : Combined and Re-coded Responses to Proposition 1
Source : Developed from the Survey Data
The combined and re-coded responses to Proposition 1 by groups are shown in Figure 4.7.
Proposition 1 was supported by 59.2% of the Case Study Firms, 62.1% of the Non-Case
Study Firms, 54.1% of the Government Agencies and 63.3% of the Contractors.

165
0%
10%
20%
30%
40%
50%
60%
70%
Percent
Disagree 20.8% 14.2% 24.2% 11.7%
Uncertain 20.0% 23.7% 21.7% 25.0%
Agree 59.2% 62.1% 54.1% 63.3%
Case Study FirmsNon-Case Study
Firms
Government
AgenciesContractors
Figure 4.7 : Combined and Re-coded Responses to Proposition 1
by Groups
Source : Developed from the Survey Data
Table 4.14 shows the case summary of the responses to Proposition 1 and Figure 4.8
graphically depicts the group mean ratings to Proposition 1. The overall mean rating of
3.50 reflects a strong support for the Proposition. The mean ratings for the Case Study
Firms, the Non-Case Study Firms, the Government Agencies and the Contractors are 3.45,
3.58, 3.38 and 3.58 respectively, reflecting a common consensus to Proposition 1 among
the groups.
Table 4.14 : Case Summary for Proposition 1
Group Type N Mean Std. Deviation
Case Study Firms 60 3.45 0.561
Non-Case Study Firms 60 3.58 0.601
Government Agencies 30 3.38 0.560
Contractors 30 3.58 0.379
Total 180 3.50 0.550
Source : Developed from the Survey Data

166
0
1
2
3
4
5
Case StudyFirms
Non-CaseStudy Firms
GovernmentAgencies
Contractors Total
3.453.58
3.383.58 3.5
Mean
Figure 4.8 : Group Mean Ratings to Proposition 1
Source : Developed from the Survey Data
A composite item P1 representing Proposition 1 was created by taking the mean score
across the scores of Statements 1, 2, 3 and 4. The Pearson Product Moment Correlation
coefficients between P1 and Statements 1, 2, 3 and 4 are shown in Table 4.15. The item-
to-total correlations are all significant and greater than 0.50 (criterion suggested by Hair
et al. (1998)). This indicates that P1 is a good representation of Proposal 1 comprising
Statements 1, 2, 3 and 4. The correlations between Statements 1 and 2 is significant and
positively correlated with the inter-item correlations greater than 0.30; the criterion
recommended by Hair et al. (1998). So are the correlations between Statements 3 and 4.
However, Statements 1 and 2 are not significantly correlated to Statements 3 and 4. This
indicated that P1 has two components and is not homogeneous. One component is
represented by Statements 1 and 2, and the other by Statements 3 and 4. This observation
was also confirmed by principal components analysis with varimax rotation using
Statements 1, 2, 3 and 4 as variables.
Table 4.15 : Pearson Correlations between P1, Statements 1, 2, 3 and 4
P1 Statement 1 Statement 2 Statement 3 Statement 4
P1 1
Statement 1 0.530** 1
Statement 2 0.574** 0.326** 1
Statement 3 0.620** -0.043 -0.011 1
Statement 4 0.672** -0.030 0.086 0.558** 1
** Correlation is significant at the 0.01 level (2-tailed)
Source : Developed from the Survey Data

167
A one-way ANOVA was conducted with P1 as the independent variable and Group as the
dependent variable. Levene’s test was not significant, F(3, 176) = 0.412, p > 0.05,
indicating that the assumption of homogeneity of variances was not violated. The overall
F (3,176) = 1.217 is not significant with p = 0.305 > 0.05. This shows that the opinions
of the groups are not significantly different from one another for Proposition 1. This is
further reflected by the multiple comparisons of the Tukey’s test of one-way ANOVA as
shown in Table 4.16.
Table 4.16 : Multiple Comparisons between Groups for Proposition 1 P1 Tukey HSD
(I) GROUP (J) GROUP Mean Difference
(I-J) Std. Error Sig.
95% Confidence Interval
Lower Bound Upper Bound
A B -.12500 .10033 .599 -.3852 .1352
C .06667 .12287 .948 -.2520 .3854
D -.13333 .12287 .699 -.4520 .1854
B A .12500 .10033 .599 -.1352 .3852
C .19167 .12287 .404 -.1270 .5104
D -.00833 .12287 1.000 -.3270 .3104
C A -.06667 .12287 .948 -.3854 .2520
B -.19167 .12287 .404 -.5104 .1270
D -.20000 .14188 .495 -.5680 .1680
D A .13333 .12287 .699 -.1854 .4520
B .00833 .12287 1.000 -.3104 .3270
C .20000 .14188 .495 -.1680 .5680
A : Case Study Firms; B : Non-Case Study Firms; C : Government Agencies; D : Contractors
* The mean difference is significant at the 0.05 level.
Source : Developed from the Survey Data
4.2.3 Testing of Research Proposition 1
As discussed in Sub-Section 4.2.1, the Focus Group deliberated Statements 1, 2, 3 and 4
of the Research Proposition which states that ‘the Malaysian ECS firms are well
positioned for global competitive advantage in the liberalizing global markets’. Even
though the Focus Group identified several weaknesses of the Malaysian ECS firms in
respect of global competition, the Focus Group unanimously supported the Statements
and the Proposition.
Similarly, the survey respondents also supported Statements 1, 2, 3 and 4. Overall, 60%
of the respondents supported Proposition 1 as shown in Figure 4.6 and all the groups

168
supported the Proposition as shown in Figure 4.7. Thus, Proposition 1 was supported by
the survey respondents.
Taking full account of the Focus Group meeting and the Questionnaire Survey,
Proposition 1 was supported.
4.3 Data Analysis for Research Proposition 2
Proposition 2 : The Malaysian Government has effective targeted support policies and
programmes to assist Malaysian ECS firms with their
internationalization effort.
Statements 5, 6, 7 and 8 in the Questionnaire Survey are related to Proposition 2 and are
presented below:
Statement 5 : The Malaysian Government has an effective policy framework to
promote the interests of the domestic ECS industry.
Statement 6 : The Malaysian Government is actively promoting new international
market penetration effort by Malaysian ECS firms.
Statement 7 : The existing funding support and incentives provided by the
Government enable the Malaysian ECS industry to more effectively
compete in the international markets.
Statement 8 : The Malaysian Government collaborates closely with Malaysian ECS
industry in devising new policies and support measures for increasing
the international competitive positioning of Malaysian ECS industry.
4.3.1 Analysis of the Focus Group Meeting

169
The Focus Group meeting discussed the research issues as reflected by Statements 5, 6, 7
and 8 in relation to Research Proposition 2. They offered a wide range of views and these
permitted the researcher to gain useful insights on the concerned issues.
(i) The Focus Group members were of the view that the Malaysian Government has a
good policy framework which served to develop the interests of the domestic ECS
industry over the past 30 years. However, the policy has been overtaken by the
changes in the international arena and is therefore now ineffective. Furthermore,
it becomes a hindrance and obstacle for the development and promotion of the
domestic ECS industry. There is a need for policy change.
(ii) The Focus Group agreed that the pertinent Malaysian Government agencies were
actively promoting Malaysian ECS overseas. These were via trade missions,
market intelligence, information exchange and government-to-government
bilateral trade arrangements. Notwithstanding, the Focus Group members were of
the view that the desired results and outcomes were not achieved due to the lack
of appropriate strategies and focused planning. Furthermore, most of these
activities were directed at the promotion of goods and not the promotion of
services.
(iii) Significantly all the Focus Group members highlighted the need to funding
support and incentives for the Malaysian ECS firms to compete in the
international markets. It was noted that such support is not being provided by the
Government.
(iv) The Malaysian Government collaborates with all Malaysian service industries in
formulating new policies and support measures to promote the competitive
positioning of all Malaysian service industries. Despite the good policy intentions,
the results and outcomes are poor as reflected by the example of NAPSEC which
represents all service sectors. Its activities were viewed as being unfocused,
diffused and ineffective. The Focus Group also noted that since the Government
agencies invite views from a wide range of industries, the views of the ECS

170
industry as well as the ACEM are often overlooked. Accordingly, the Focus
Group members disagreed with the Statement that the Malaysian Government
collaborates with Malaysian ECS industry in devising new policies and support
measures for increasing the international competitive positioning of Malaysian
ECS industry.
(v) The Focus Group suggested that the Government introduces a coherent policy to
support the ECS industry with a dedicated one stop agency for the focused
implementation and promotion programmes which the agency is to be held
accountable for its achievements.
(vi) The Focus Group also suggested that the Malaysian Government establishes local
presence in prospective countries. This could be providing through foreign trade
offices and establishing network arrangement for Malaysian ECS firms.
On the basis of the views offered, the Focus Group rejected Proposition 2.
4.3.2 Analysis of Questionnaire Survey Responses
4.3.2.1 Statement 5
Statement 5 : The Malaysian Government has an effective policy framework to
promote the interests of the domestic ECS industry.
The cross tabulation of the survey responses to Statement 5 shown in Table 4.17, and the
combined and re-coded responses shown in Figure 4.9, reveal that 40.6% of the survey
respondents did not support the Statement, 35.5% were uncertain and 23.9% agreed. The
main disagreement was from the Non-Case Study Firms at 48.3%, the Contractors at
43.3% and the Case Study Firms at 43.3%. Significant number of respondents was
uncertain varying from 41.7% of the Case Study Firms to 23.3% of the Government
Agencies. However, 60.0% of the respondents from the Government Agencies supported
the Statement.

171
Agree
23.9%
Uncertain
35.5%
Disagree
40.6%
Table 4.17 : Cross Tabulation of Survey Responses - Statement 5
Statement 5
Group Type
Statistics
Strongly Disagree
Disagree
Uncertain
Agree
Strongly Agree
Total
Case Study Firms
Count 5 21 25 9 0 60
% within Group Type 8.3% 35.0% 41.7% 15.0% 0.0% 100.0%
% within Statement 5 41.7% 34.4% 39.1% 23.7% 0.0% 33.3%
% of Total 2.8% 11.7% 13.9% 5.0% 0.0% 33.3%
Non-Case Study Firms
Count 6 23 23 6 2 60
% within Group Type 10.0% 38.3% 38.3% 10.0% 3.3% 100.0%
% within Statement 5 50.0% 37.7% 35.9% 15.8% 40.0% 33.3%
% of Total 3.3% 12.8% 12.8% 3.3% 1.1% 33.3%
Government Agencies
Count 1 4 7 15 3 30
% within Group Type 3.3% 13.3% 23.3% 50.0% 10.0% 100.0%
% within Statement 5 8.3% 6.6% 10.9% 39.5% 60.0% 16.7%
% of Total 0.6% 2.2% 3.9% 8.3% 1.7% 16.7%
Contractors Count 0 13 9 8 0 30
% within Group Type 0.0% 43.3% 30.0% 26.7% 0.0% 100.0%
% within Statement 5 0.0% 21.3% 14.1% 21.1% 0.0% 16.7%
% of Total 0.0% 7.2% 5.0% 4.4% 0.0% 16.7%
Total Count 12 61 64 38 5 180
% within Group Type 6.7% 33.9% 35.5% 21.1% 2.8% 100.0%
% within Statement 5 100.0% 100.0% 100.0% 100.0% 100.0% 100.0%
% of Total 6.7% 33.9% 35.6% 21.1% 2.8% 100.0%
Source : Developed from the Survey Data
Figure 4.9 : Combined and Re-coded Responses to Statement 5
Source : Developed from the Survey Data
Table 4.18 shows the case summary of the responses to Statement 5. The Questionnaire
Survey respondents did not support the Statement as reflected by a mean rating of 2.79.
They were also differed widely on the issue given the high standard deviation of 0.94.
The majority of the respondents from the Case Study Firms, the Non-Case Study Firms
and the Contractors did not agree with the Statement as indicated by the mean ratings of
2.63, 2.58 and 2.83 respectively. However, the respondents from the Government
Agencies supported with a mean rating of 3.50.

172
Table 4.18 : Case Summary – Statement 5
Group Type N Mean Std. Deviation
Case Study Firms 60 2.63 0.843
Non-Case Study Firms 60 2.58 0.926
Government Agencies 30 3.50 0.974
Contractors 30 2.83 0.834
Total 180 2.79 0.944
Source : Developed from the Survey Data
The Tukey’s test of one-way ANOVA provided the multiple comparisons as appended in
Table 4.19. The table shows that there is a significant difference in opinions between the
Government Agencies with the rest of the groups. However, there are no significant
differences in opinions between the Case Study Firms, the Non-Case Study Firms and the
Contractors.
Table 4.19 : Multiple Comparisons between Groups for Statement 5
Tukey HSD
Dependent Variable (I) GROUP
(J) GROUP
Mean Difference (I-J) Std. Error Sig.
95% Confidence Interval
Lower Bound Upper Bound STATEMENT 5 A B .050 .163 .990 -.37 .47
C -.867* .200 .000 -1.38 -.35
D -.200 .200 .748 -.72 .32
B A -.050 .163 .990 -.47 .37
C -.917* .200 .000 -1.43 -.40
D -.250 .200 .594 -.77 .27
C A .867* .200 .000 .35 1.38
B .917* .200 .000 .40 1.43
D .667* .230 .022 .07 1.26
D A .200 .200 .748 -.32 .72
B .250 .200 .594 -.27 .77
C -.667* .230 .022 -1.26 -.07
A : Case Study Firms; B : Non-Case Study Firms; C : Government Agencies; D : Contractors
* The mean difference is significant at the 0.05 level.
Source : Developed from the Survey Data
4.3.2.2 Statement 6
Statement 6 : The Malaysian Government is actively promoting new international
market penetration effort by Malaysian ECS firms.
The cross tabulation of the survey responses to Statement 6 shown in Table 4.20, and the
combined and re-coded responses shown in Figure 4.10, reveal that 37.2% of the survey
respondents did not support the Statement while another 37.2% supported and the rest,

173
25.6% were uncertain. The main disagreement was from the respondents of the Case
Study Firms and the Non-Case Study Firms at 45.0% and 50% respectively. While the
strongest support came from the Government Agencies at 80.0%. 40% of the respondents
from the Contractors supported and 36.7% were uncertain with the Statement.
Table 4.20 : Cross Tabulation of Survey Responses - Statement 6
Statement 6
Group Type
Statistics
Strongly Disagree
Disagree
Uncertain
Agree
Strongly Agree
Total
Case Study Firms
Count 2 25 18 14 1 60
% within Group Type 3.3% 41.7% 30.0% 23.3% 1.7% 100.0%
% within Statement 6 28.6% 41.7% 39.1% 23.7% 12.5% 33.3%
% of Total 1.1% 13.9% 10.0% 7.8% 0.6% 33.3%
Non-Case Study Firms
Count 4 26 4 15 1 60
% within Group Type 6.7% 43.3% 23.3% 25.0% 1.7% 100.0%
% within Statement 6 57.1% 43.3% 30.4% 25.4% 12.5% 33.3%
% of Total 2.2% 14.4% 7.8% 8.3% 0.6% 33.3%
Government Agencies
Count 1 2 3 18 6 30
% within Group Type 3.3% 6.7% 10.0% 60.0% 20.0% 100.0%
% within Statement 6 14.3% 3.3% 6.5% 30.5% 75.0% 16.7%
% of Total 0.6% 1.1% 1.7% 10.0% 3.3% 16.7%
Contractors Count 0 7 11 12 0 30
% within Group Type 0.0% 23.3% 36.7% 40.0% 0.0% 100.0%
% within Statement 6 0.0% 11.7% 23.9% 20.3% 0.0% 16.7%
% of Total 0.0% 3.9% 6.1% 6.7% 0.0% 16.7%
Total Count 7 60 46 59 8 180
% within Group Type 3.9% 33.3% 25.6% 32.8% 4.4% 100.0%
% within Statement 6 100.0% 100.0% 100.0% 100.0% 100.0% 100.0%
% of Total 3.9% 33.3% 25.6% 32.8% 4.4% 100.0%
Source : Developed from the Survey Data
Figure 4.10 : Combined and Re-coded Responses to Statement 6
Source : Developed from the Survey Data
The case summary of the responses to Statement 6 is shown in Table 4.21. The overall
mean rating for the Statement is 3.01 with standard deviation of 1.0. This reflects mixed

174
responses with widely differing opinions. The Case Study Firms and Non-Case Study
Firms disagreed with the Statement and had the mean ratings of 2.78 and 2.72
respectively. The Contractors provided a weak support with a mean rating at 3.17. The
strongest support was from the Government Agencies at a mean rating of 3.87.
Table 4.21 : Case Summary – Statement 6
Group Type N Mean Std. Deviation
Case Study Firms 60 2.78 0.904
Non-Case Study Firms 60 2.72 0.976
Government Agencies 30 3.87 0.937
Contractors 30 3.17 0.791
Total 180 3.01 1.000
Source : Developed from the Survey Data
The multiple comparisons from the Tukey’s test of one-way ANOVA, as shown in Table
4.22 shows that there is a significant difference in responses between the Government
Agencies compared to the rest of the groups. However, there are no significant
differences in opinions between the Case Study Firms, the Non-Case Study Firms and the
Contractors.
Table 4.22 : Multiple Comparisons between Groups for Statement 6
Tukey HSD
Dependent Variable (I) GROUP
(J) GROUP
Mean Difference (I-J) Std. Error Sig.
95% Confidence Interval
Lower Bound Upper Bound
STATEMENT 6 A B .067 .167 .979 -.37 .50
C -1.083* .205 .000 -1.62 -.55
D -.383 .205 .245 -.92 .15
B A -.067 .167 .979 -.50 .37
C -1.150* .205 .000 -1.68 -.62
D -.450 .205 .129 -.98 .08
C A 1.083* .205 .000 .55 1.62
B 1.150* .205 .000 .62 1.68
D .700* .237 .018 .09 1.31
D A .383 .205 .245 -.15 .92
B .450 .205 .129 -.08 .98
C -.700* .237 .018 -1.31 -.09
A : Case Study Firms; B : Non-Case Study Firms; C : Government Agencies; D : Contractors
* The mean difference is significant at the 0.05 level.
Source : Developed from the Survey Data

175
4.3.2.3 Statement 7
Statement 7 : The existing funding support and incentives provided by the
Government enable the Malaysian ECS industry to more effectively
compete in the international markets.
The cross tabulation of the survey responses to Statement 7 shown in Table 4.23, and the
combined and re-coded responses shown in Figure 4.11, reveal that more than half or
51.1% of the survey respondents disagreed with the Statement, 31.7% was uncertain and
17.2% agreed. The main disagreement was from the Case Study Firms with 60.0%, the
Non-Case Study Firms with 56.6% and the Contractors with 53.3%. However, 60.0% of
the respondents from the Government Agencies supported the Statement.
Table 4.23 : Cross Tabulation of Survey Responses - Statement 7
Statement 7
Group Type
Statistics
Strongly Disagree
Disagree
Uncertain
Agree
Strongly Agree
Total
Case Study Firms
Count 6 30 19 5 0 60
% within Group Type 10.0% 50.0% 31.7% 8.3% 0.0% 100.0%
% within Statement 7 31.6% 41.1% 33.3% 19.2% 0.0% 33.3%
% of Total 3.3% 16.7% 10.6% 2.8% 0.0% 33.3%
Non-Case Study Firms
Count 11 23 23 3 0 60
% within Group Type 18.3% 38.3% 38.3% 5.0% 0.0% 100.0%
% within Statement 7 57.9% 31.5% 40.4% 11.5% 0.0% 33.3%
% of Total 6.1% 12.8% 12.8% 1.7% 0.0% 33.3%
Government Agencies
Count 1 5 6 13 5 30
% within Group Type 3.3% 16.7% 20.0% 43.3% 16.7% 100.0%
% within Statement 7 5.3% 6.8% 10.5% 50.0% 100.0% 16.7%
% of Total 0.6% 2.8% 3.3% 7.2% 2.8% 16.7%
Contractors Count 1 15 9 5 0 30
% within Group Type 3.3% 50.0% 30.0% 16.7% 0.0% 100.0%
% within Statement 7 5.3% 20.5% 15.8% 19.2% 0.0% 16.7%
% of Total 0.6% 8.3% 5.0% 2.8% 0.0% 16.7%
Total Count 19 73 57 26 5 180
% within Group Type 10.5% 40.6% 31.7% 14.4% 2.8% 100.0%
% within Statement 7 100.0% 100.0% 100.0% 100.0% 100.0% 100.0%
% of Total 10.6% 40.6% 31.7% 14.4% 2.8% 100.0%
Source : Developed from the Survey Data

176
Agree
17.2%
Uncertain
31.7%
Disagree
51.1%
Figure 4.11 : Combined and Re-coded Responses to Statement 7
Source : Developed from the Survey Data
Table 4.24 shows the case summary of the responses to Statement 7. The overall mean
rating is 2.58 which reflect disagreement to the Statement. The respondents were also
having widely different opinions as reflected by the high standard deviation of 0.956.
The main disagreement was from the Case Study Firms, the Non-Case Study Firms and
the Contractors as shown by the mean ratings of 2.38, 2.30 and 2.60 respectively.
However, the Government Agencies supported the Statement at a mean rating of 3.53.
Table 4.24 : Case Summary – Statement 7
Group Type N Mean Std. Deviation
Case Study Firms 60 2.38 0.783
Non-Case Study Firms 60 2.30 0.830
Government Agencies 30 3.53 1.074
Contractors 30 2.60 0.814
Total 180 2.58 0.956
Source : Developed from the Survey Data
The multiple comparisons of the Tukey’s test of one-way ANOVA, shown in Table 4.25,
reveal that the respondents from the Government Agencies had significantly different
opinions compared to those of the Case Study Firms, the Non-Case Study Firms and the
Contractors. The latter three groups did not have significant differences in opinions
between them.

177
Table 4.25 : Multiple Comparisons between Groups for Statement 7
Tukey HSD
Dependent Variable (I) GROUP
(J) GROUP
Mean Difference (I-J) Std. Error Sig.
95% Confidence Interval
Lower Bound Upper Bound
STATEMENT 7 A B .083 .157 .951 -.32 .49
C -1.150* .192 .000 -1.65 -.65
D -.217 .192 .672 -.71 .28
B A -.083 .157 .951 -.49 .32
C -1.233* .192 .000 -1.73 -.74
D -.300 .192 .402 -.80 .20
C A 1.150* .192 .000 .65 1.65
B 1.233* .192 .000 .74 1.73
D .933* .221 .000 .36 1.51
D A .217 .192 .672 -.28 .71
B .300 .192 .402 -.20 .80
C -.933* .221 .000 -1.51 -.36
A : Case Study Firms; B : Non-Case Study Firms; C : Government Agencies; D : Contractors
* The mean difference is significant at the 0.05 level.
Source : Developed from the Survey Data
4.3.2.4 Statement 8
Statement 8 : The Malaysian Government collaborates closely with Malaysian ECS
industry in devising new policies and support measures for increasing
the international competitive positioning of Malaysian ECS industry.
The cross tabulation of the survey responses to Statement 8 shown in Table 4.26, and the
combined and re-coded responses shown in Figure 4.12, reveal that 36.7% of the
respondents were not sure about the Statement, 35.0% disagreed and 28.3% agreed. The
uncertain respondents comprised 45.0% of the respondents from Case Study Firms,
38.3% from the Non-Case Study Firms, 40.0% from the Contractors and 13.3% from the
Government Agencies. 35% of the respondents from the Case Study Firms disagreed
with the Statement, so were 46.7% from the Non-Case Study Firms and 40% from the
Contractors. However, 80% of the respondents from the Government Agencies supported
the Statement.

178
Agree
28.3%
Uncertain
36.7%
Disagree
35.0%
Table 4.26 : Cross Tabulation of Survey Responses - Statement 8
Statement 8
Group Type
Statistics
Strongly Disagree
Disagree
Uncertain
Agree
Strongly Agree
Total
Case Study Firms
Count 2 19 27 11 1 60
% within Group Type 3.3% 31.7% 45.0% 18.3% 1.7% 100.0%
% within Statement 8 28.6% 33.9% 40.9% 26.2% 11.1% 33.3%
% of Total 1.1% 10.6% 15.0% 6.1% 0.6% 33.3%
Non-Case Study Firms
Count 4 24 23 9 0 60
% within Group Type 6.7% 40.0% 38.3% 15.0% 0.0% 100.0%
% within Statement 8 57.1% 42.9% 34.8% 21.4% 0.0% 33.3%
% of Total 2.2% 13.3% 12.8% 5.0% 0.0% 33.3%
Government Agencies
Count 0 2 4 16 8 30
% within Group Type 0.0% 6.7% 13.3% 53.3% 26.7% 100.0%
% within Statement 8 0.0% 3.6% 6.1% 38.1% 88.9% 16.7%
% of Total 0.0% 1.1% 2.2% 8.9% 4.4% 16.7%
Contractors Count 1 11 12 6 0 30
% within Group Type 3.3% 36.7% 40.0% 20.0% 0.0% 100.0%
% within Statement 8 14.3% 19.6% 18.2% 14.3% 0.0% 16.7%
% of Total 0.6% 6.1% 6.7% 3.3% 0.0% 16.7%
Total Count 7 56 66 42 9 180
% within Group Type 3.9% 31.1% 36.7% 23.3% 5.0% 100.0%
% within Statement 8 100.0% 100.0% 100.0% 100.0% 100.0% 100.0%
% of Total 3.9% 31.1% 36.7% 23.3% 5.0% 100.0%
Source : Developed from the Survey Data
Figure 4.12 : Combined and Re-coded Responses to Statement 8
Source : Developed from the Survey Data
The case summary of the responses to Statement 8 as depicted in Table 4.27, shows that
the overall mean rating is 2.94 indicating mild disagreement to the Statement. The
disagreement mainly derived from the Case Study Firms, the Non-Case Study Firms and
the Contractors as indicated by the mean ratings of 2.83, 2.62 and 2.77 respectively.
However, the Government Agencies exhibited strong support to the Statement as
reflected by the mean rating of 4.00.

179
Table 4.27 : Case Summary – Statement 8
Group Type N Mean Std. Deviation
Case Study Firms 60 2.83 0.827
Non-Case Study Firms 60 2.62 0.825
Government Agencies 30 4.00 0.830
Contractors 30 2.77 0.817
Total 180 2.94 0.950
Source : Developed from the Survey Data
The multiple comparisons of the Tukey’s test of one-way ANOVA for Statement 8,
shown in Table 4.28, reveal that the Government Agencies had significant different
opinions compared to the rest of the groups. However, there were no significant
differences in opinions between the Case Study Firms, the Non-Case Study Firms and the
Contractors.
Table 4.28 : Multiple Comparisons between Groups for Statement 8
Tukey HSD
Dependent Variable (I) GROUP
(J) GROUP
Mean Difference (I-J) Std. Error Sig.
95% Confidence Interval
Lower Bound Upper Bound
STATEMENT 8 A B .217 .151 .477 -.17 .61
C -1.167* .185 .000 -1.65 -.69
D .067 .185 .984 -.41 .55
B A -.217 .151 .477 -.61 .17
C -1.383* .185 .000 -1.86 -.90
D -.150 .185 .848 -.63 .33
C A 1.167* .185 .000 .69 1.65
B 1.383* .185 .000 .90 1.86
D 1.233* .213 .000 .68 1.79
D A -.067 .185 .984 -.55 .41
B .150 .185 .848 -.33 .63
C -1.233* .213 .000 -1.79 -.68
A : Case Study Firms; B : Non-Case Study Firms; C : Government Agencies; D : Contractors
* The mean difference is significant at the 0.05 level.
Source : Developed from the Survey Data
4.3.2.5 Analysis of the Combined Survey Responses to Proposition
2
The cross tabulation of the combined survey responses to Statements 5, 6, 7 and 8 for
Proposition 2 is shown in Table 4.29. The combined and re-coded responses in terms of
‘disagree, uncertain and agree’ are shown in Figure 4.13. They reveal that 40.9% of the
respondents disagreed with the Proposition, 32.4% were uncertain and 26.7% agreed.

180
Uncertain
32.4%
Disagree
40.9%
Disagree
40.9%
Agree
26.7%
Table 4.29 : Cross Tabulation of Combined Survey Responses for Proposition 2
Proposition 2
Group Type
Statistics
Strongly Disagree
Disagree
Uncertain
Agree
Strongly Agree
Total
Case Study Firms
Count 15 95 89 39 2 240
% within Group Type 6.3% 39.6% 37.1% 16.2% 0.8% 100.0%
% within Proposition 2 33.3% 38.0% 38.2% 23.6% 7.4% 33.3%
% of Total 2.1% 13.2% 12.4% 5.4% 0.3% 33.3%
Non-Case Study Firms
Count 25 96 83 33 3 240
% within Group Type 10.4% 40.0% 34.6% 13.7% 1.3% 100.0%
% within Proposition 2 55.6% 38.4% 35.6% 20.0% 11.1% 33.3%
% of Total 3.5% 13.3% 11.5% 4.6% 0.4% 33.3%
Government Agencies
Count 3 13 20 62 22 120
% within Group Type 2.5% 10.8% 16.7% 51.7% 18.3% 100.0%
% within Proposition 2 6.7% 5.2% 8.6% 37.6% 81.5% 16.7%
% of Total 0.4% 1.8% 2.8% 8.6% 3.1% 16.7%
Contractors Count 2 46 41 31 0 120
% within Group Type 1.7% 38.3% 34.2% 25.8% 0.0% 100.0%
% within Proposition 2 4.4% 18.4% 17.6% 18.8% 0.0% 16.7%
% of Total 0.3% 6.4% 5.7% 4.3% 0.0% 16.7%
Total Count 45 250 233 165 27 720
% within Group Type 6.3% 34.7% 32.4% 22.9% 3.7% 100.0%
% within Proposition 2 100.0% 100.0% 100.0% 100.0% 100.0% 100.0%
% of Total 6.2% 34.7% 32.4% 22.9% 3.8% 100.0%
Source : Developed from the Survey Data
Figure 4.13 : Combined and Re-coded Responses to Proposition 2
Source : Developed from the Survey Data
Figure 4.14 shows the combined and re-coded responses to Proposition 2 by groups. The
Proposition was not accepted by 45.9% of the respondents from the Case Study Firms,
50.4% of the Non-Case Study Firms and 40.0% of the Contractors. However, 70.0% of
the respondents from the Government Agencies supported the Proposition. Furthermore,
a significant number of respondents from the Case Study Firms (37.1%), Non-Case Study
Firms (34.6%) and Contractors (34.2%) were uncertain.

181
0%
10%
20%
30%
40%
50%
60%
70%
Percent
Disagree 45.9% 50.4% 13.3% 40.0%
Uncertain 37.1% 34.6% 16.7% 34.2%
Agree 17.0% 15.0% 70.0% 25.8%
Case Study FirmsNon-Case Study
Firms
Government
AgenciesContractors
Figure 4.14 : Combined and Re-coded Responses to Proposition 2 by
Groups
Source : Developed from the Survey Data
Table 4.30 shows the case summary of the responses to Proposition 2 and the group mean
ratings are shown diagrammatically in Figure 4.15. The overall mean rating for
Proposition 2 is 2.83 reflecting a weak disagreement to Proposition 2. The mean ratings
of 2.66, 2.55 and 2.84 respectively for the Case Study Firms, the Non-Case Study Firms
and the Contractors show that these groups disagreed with the Proposition. However, at a
mean rating of 3.73, the Government Agencies strongly supported the Proposition.
Table 4.30 : Case Summary for Proposition 2
Group Type N Mean Std. Deviation
Case Study Firms 60 2.66 0.642
Non-Case Study Firms 60 2.55 0.745
Government Agencies 30 3.73 0.769
Contractors 30 2.84 0.658
Total 180 2.83 0.809
Source : Developed from the Survey Data

182
0
1
2
3
4
5
Case StudyFirms
Non-CaseStudy Firms
GovernmentAgencies
Contractors Total
2.66 2.55
3.73
2.84 2.83
Mean
Figure 4.15 : Group Mean Ratings to Proposition 2
Source : Developed from the Survey Data
A composite item P2 representing Proposition 2 was created by taking the mean score
across the scores of Statements 5, 6, 7 and 8. The Pearson Product Moment Correlation
coefficients between P2 and Statements 5, 6, 7 and 8 are shown in Table 4.31. Using the
criteria presented by Hair et al. (1998), the item-to-total correlations are all greater than
the criterion of 0.50. They are positive and significant, indicating that P2 is a good
representation of Proposition 2 comprising Statements 5, 6, 7 and 8. P2 is homogeneous
and has good reliability with Cronbach’s alpha equals 0.862 (Gregory 2004). Statements
5, 6, 7 and 8 also displayed inter-item correlations greater than the criterion of 0.30 and
are significant. Principal components analysis was performed with varimax rotation.
One component was extracted with an eigenvalue greater than 1 and the component
loadings are all greater than 0.50. Thus, Statements 5, 6, 7 and 8 represent a single
underlying construct and jointly account for 70.7% of the total variance.
Table 4.31 : Pearson Correlations between P2, Statements 5, 6, 7 and 8
P2 Statement 5 Statement 6 Statement 7 Statement 8
P2 1
Statement 5 0.834** 1
Statement 6 0.830** 0.564** 1
Statement 7 0.855** 0.641** 0.604** 1
Statement 8 0.846** 0.611** 0.606** 0.632** 1
** Correlation is significant at the 0.01 level (2-tailed)
Source : Developed from the Survey Data
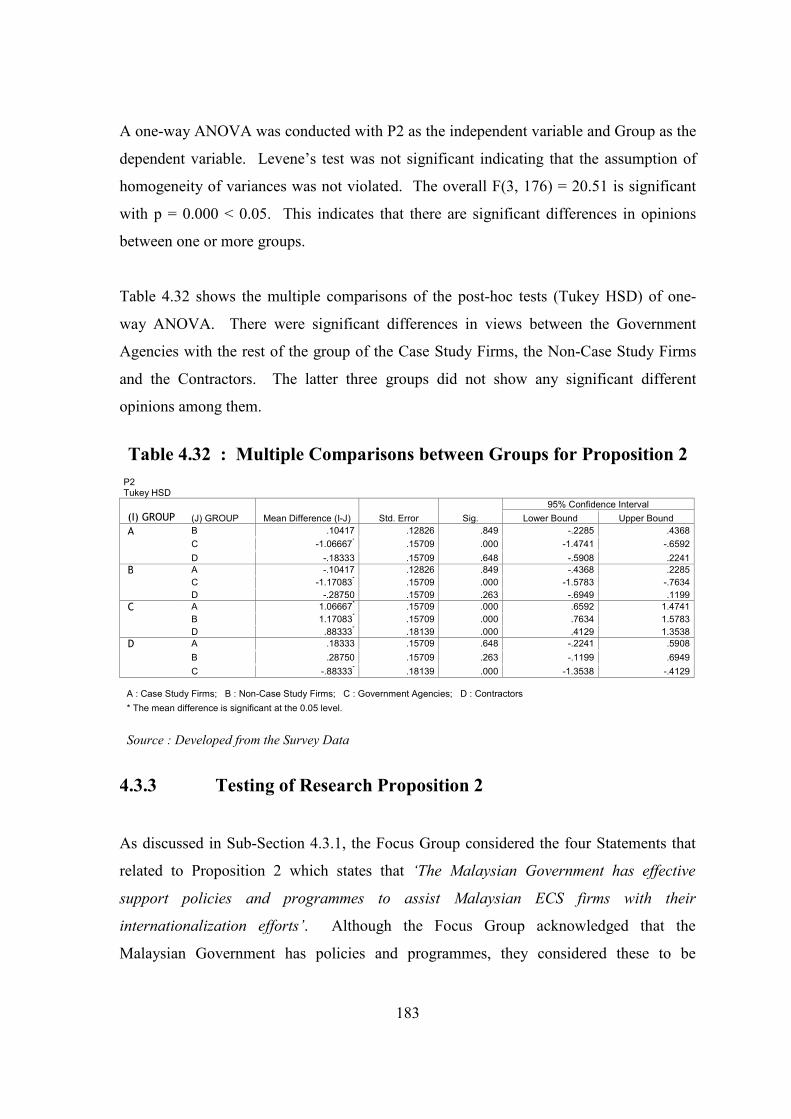
183
A one-way ANOVA was conducted with P2 as the independent variable and Group as the
dependent variable. Levene’s test was not significant indicating that the assumption of
homogeneity of variances was not violated. The overall F(3, 176) = 20.51 is significant
with p = 0.000 < 0.05. This indicates that there are significant differences in opinions
between one or more groups.
Table 4.32 shows the multiple comparisons of the post-hoc tests (Tukey HSD) of one-
way ANOVA. There were significant differences in views between the Government
Agencies with the rest of the group of the Case Study Firms, the Non-Case Study Firms
and the Contractors. The latter three groups did not show any significant different
opinions among them.
Table 4.32 : Multiple Comparisons between Groups for Proposition 2
P2 Tukey HSD
(I) GROUP (J) GROUP Mean Difference (I-J) Std. Error Sig.
95% Confidence Interval
Lower Bound Upper Bound
A B .10417 .12826 .849 -.2285 .4368
C -1.06667* .15709 .000 -1.4741 -.6592
D -.18333 .15709 .648 -.5908 .2241
B A -.10417 .12826 .849 -.4368 .2285
C -1.17083* .15709 .000 -1.5783 -.7634
D -.28750 .15709 .263 -.6949 .1199
C A 1.06667* .15709 .000 .6592 1.4741
B 1.17083* .15709 .000 .7634 1.5783
D .88333* .18139 .000 .4129 1.3538
D A .18333 .15709 .648 -.2241 .5908
B .28750 .15709 .263 -.1199 .6949
C -.88333* .18139 .000 -1.3538 -.4129
A : Case Study Firms; B : Non-Case Study Firms; C : Government Agencies; D : Contractors
* The mean difference is significant at the 0.05 level.
Source : Developed from the Survey Data
4.3.3 Testing of Research Proposition 2
As discussed in Sub-Section 4.3.1, the Focus Group considered the four Statements that
related to Proposition 2 which states that ‘The Malaysian Government has effective
support policies and programmes to assist Malaysian ECS firms with their
internationalization efforts’. Although the Focus Group acknowledged that the
Malaysian Government has policies and programmes, they considered these to be

184
ineffective. They also suggested policy changes. Accordingly, the Focus Group did not
support this Proposition.
The Survey Respondents disagreed with Statements 5, 7 and 8, and were divided on
Statement 6. Overall, 40.9% of the respondents disagreed with Proposition 2, 32.4%
were uncertain and only 26.7% agreed as shown in Figure 4.13. The Case Study Firms,
The Non-Case Study Firms and the Contractors rejected all the Statements while the
Government Agencies supported them. Thus overall, Proposition 2 was not supported.
Taking full account of the Focus Group meeting and the Questionnaire Survey,
Proposition 2 was not supported.
4.4 Data Analysis for Research Proposition 3
Proposition 3 : The exporting Malaysian ECS firms have appropriate strategies for
successfully entering new international markets.
Statements 9, 10, 11 and 12 in the Questionnaire Survey are related to Proposition 3 and
are presented below:
Statement 9 : The Malaysian ECS firms are actively formulating and implementing
internationalization strategies.
Statement 10 : The Malaysian ECS firms have competent staff with an international
and entrepreneurial orientation to take advantage of emerging
international marketing opportunities.
Statement 11 : The Malaysian ECS industry places emphasis on human capital
development and knowledge management to stay abreast of the
technological changes impacting on the ECS.

185
Statement 12 : The Malaysian ECS firms have appropriate mechanisms for pooling the
specific competencies for jointly bidding for international projects on a
consortium basis.
4.4.1 Analysis of the Focus Group Meeting
The Focus Group addressed Statements 9, 10, 11 and 12 which relate to the Proposition 3
that ‘the exporting Malaysian firms have appropriate strategies for successfully entering
new international markets’. The Focus Group meeting generated a wide range of views
and enabled the researcher to gain useful insights on the concerned issues.
(i) The Focus Group members were generally of the view that the Malaysian ECS
firms are not actively formulating and implementing internationalization strategies
for their service exports. The current practice of following client on ad-hoc, one-
off, project to project basis is not sustainable. They noted that ECS firms are
reluctant to be more proactive as this exposes them to higher risk. The absence of
physical presence in foreign markets has also acted against networking strategies
which is important for business and export expansion.
(ii) The Focus Group participants noted that while the Malaysian ECS firms have
competent technical staff, they lack entrepreneurship, management, marketing and
soft skills. The CEs are generally competent engineers but not necessarily
effective managers, possibly due to the REA which are a hindrance to the
advancement of engineers in business field.
(iii) The ECS industry is a knowledge driven industry which emphasizes on
knowledge development and knowledge management. Since new knowledge is
continually emerged, engineers must be able to harness the new knowledge and
apply it in their work. They also need to develop knowledge from their database
to facilitate the ease and speed of application of this knowledge.

186
(iv) The Focus Group highlighted that the Malaysian engineers are egocentric.
Largely for this reason, they find it difficult to work together as a team and
therefore they prefer to work independently.
The Focus Group was of the view that the Malaysian ECS firms have yet to develop
appropriate internationalization strategies and appropriate mechanisms for pooling their
resources for international marketing. On the basis of these views, the Focus Group
rejected Proposition 3.
4.4.2 Analysis of Questionnaire Survey Responses
4.4.2.1 Statement 9
Statement 9 : The Malaysian ECS firms are actively formulating and implementing
internationalization strategies.
The cross tabulation of the Survey responses to Statement 9 shown in Table 4.33, and the
Table 4.33 : Cross Tabulation of Survey Responses - Statement 9
Statement 9
Group Type
Statistics
Strongly Disagree
Disagree
Uncertain
Agree
Strongly Agree
Total
Case Study Firms
Count 0 20 14 26 0 60
% within Group Type 0.0% 33.3% 23.3% 43.3% 0.0% 100.0%
% within Statement 9 0.0% 43.5% 23.7% 37.7% 0.0% 33.3%
% of Total 0.0% 11.1% 7.8% 14.4% 0.0% 33.3%
Non-Case Study Firms
Count 1 14 21 23 1 60
% within Group Type 1.7% 23.3% 35.0% 38.3% 1.7% 100.0%
% within Statement 9 33.3% 30.4% 35.6% 33.3% 33.3% 33.3%
% of Total 0.6% 7.8% 11.7% 12.8% 0.6% 33.3%
Government Agencies
Count 2 0 13 14 1 30
% within Group Type 6.7% 0.0% 43.3% 46.7% 3.3% 100.0%
% within Statement 9 66.7% 0.0% 22.0% 20.3% 33.3% 16.7%
% of Total 1.1% 0.0% 7.2% 7.8% 0.6% 16.7%
Contractors Count 0 12 11 6 1 30
% within Group Type 0.0% 40.0% 36.7% 20.0% 3.3% 100.0%
% within Statement 9 0.0% 26.1% 18.6% 8.7% 33.3% 16.7%
% of Total 0.0% 6.7% 6.1% 3.3% 0.6% 16.7%
Total Count 3 46 59 69 3 180
% within Group Type 1.7% 25.6% 32.8% 38.3% 1.7% 100.0%
% within Statement 9 100.0% 100.0% 100.0% 100.0% 100.0% 100.0%
% of Total 1.7% 25.6% 32.8% 38.3% 1.7% 100.0%
Source : Developed from the Survey Data
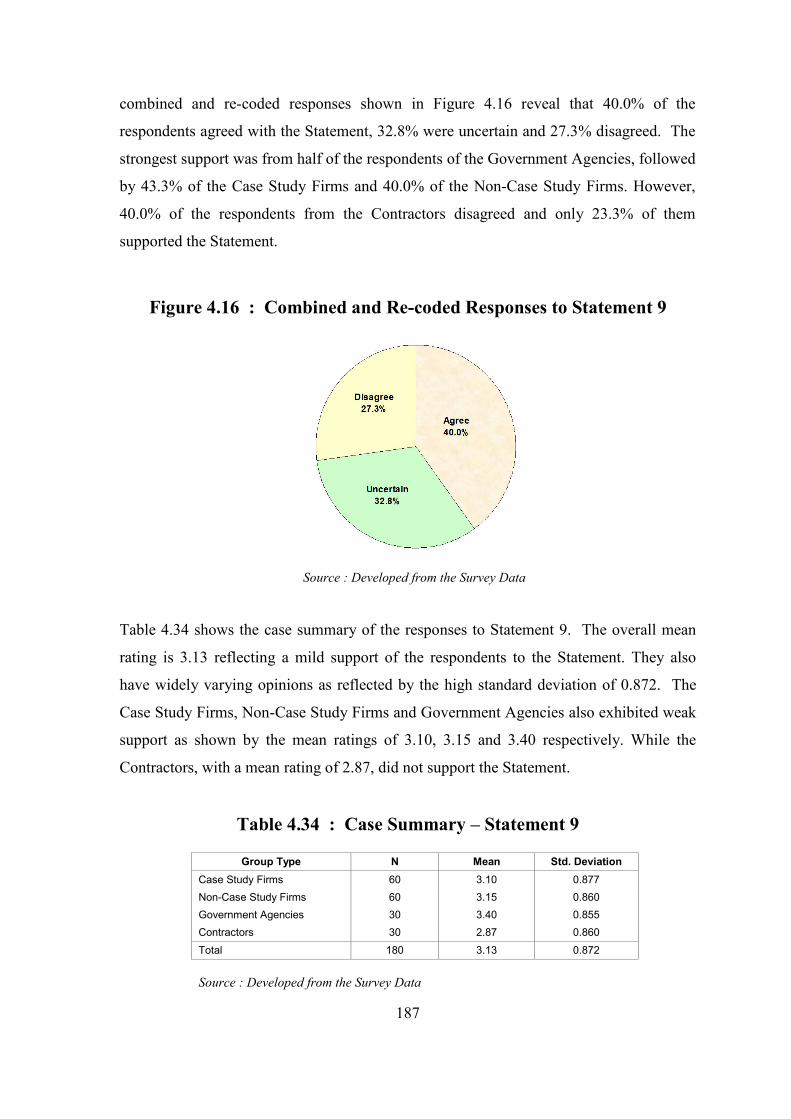
187
combined and re-coded responses shown in Figure 4.16 reveal that 40.0% of the
respondents agreed with the Statement, 32.8% were uncertain and 27.3% disagreed. The
strongest support was from half of the respondents of the Government Agencies, followed
by 43.3% of the Case Study Firms and 40.0% of the Non-Case Study Firms. However,
40.0% of the respondents from the Contractors disagreed and only 23.3% of them
supported the Statement.
Figure 4.16 : Combined and Re-coded Responses to Statement 9
Source : Developed from the Survey Data
Table 4.34 shows the case summary of the responses to Statement 9. The overall mean
rating is 3.13 reflecting a mild support of the respondents to the Statement. They also
have widely varying opinions as reflected by the high standard deviation of 0.872. The
Case Study Firms, Non-Case Study Firms and Government Agencies also exhibited weak
support as shown by the mean ratings of 3.10, 3.15 and 3.40 respectively. While the
Contractors, with a mean rating of 2.87, did not support the Statement.
Table 4.34 : Case Summary – Statement 9
Group Type N Mean Std. Deviation
Case Study Firms 60 3.10 0.877
Non-Case Study Firms 60 3.15 0.860
Government Agencies 30 3.40 0.855
Contractors 30 2.87 0.860
Total 180 3.13 0.872
Source : Developed from the Survey Data
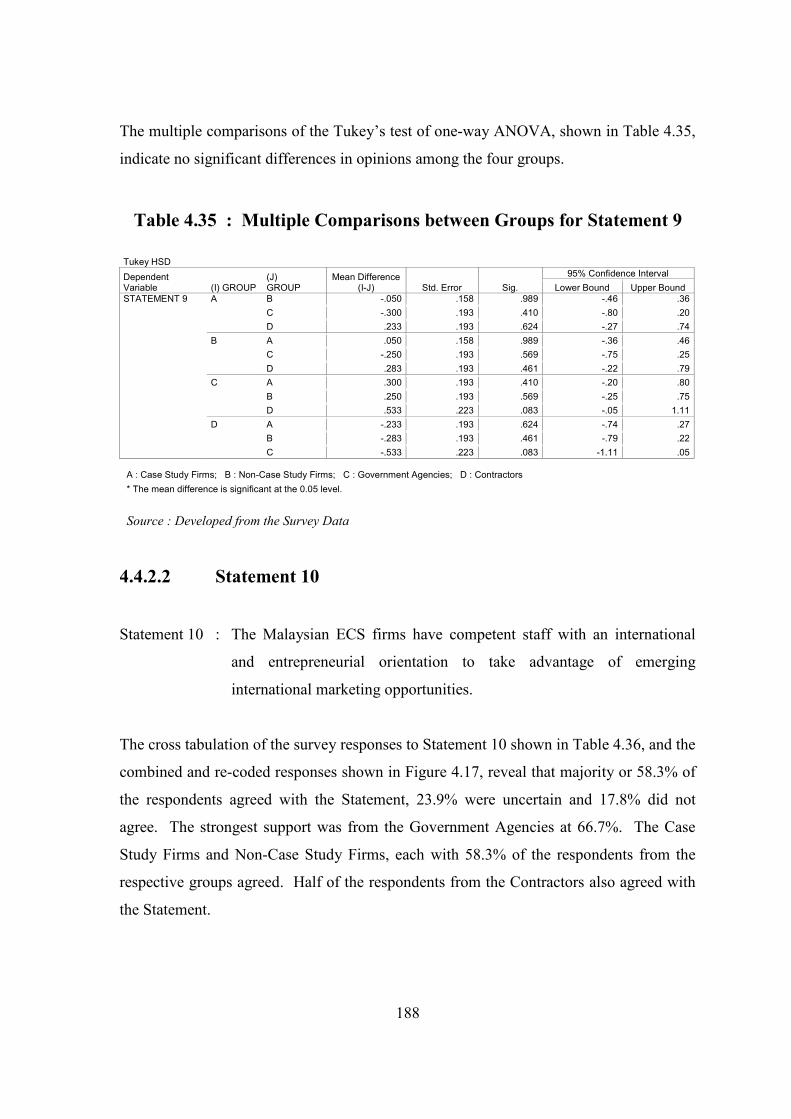
188
The multiple comparisons of the Tukey’s test of one-way ANOVA, shown in Table 4.35,
indicate no significant differences in opinions among the four groups.
Table 4.35 : Multiple Comparisons between Groups for Statement 9
Tukey HSD
Dependent Variable (I) GROUP
(J) GROUP
Mean Difference (I-J) Std. Error Sig.
95% Confidence Interval
Lower Bound Upper Bound
STATEMENT 9 A B -.050 .158 .989 -.46 .36
C -.300 .193 .410 -.80 .20
D .233 .193 .624 -.27 .74
B A .050 .158 .989 -.36 .46
C -.250 .193 .569 -.75 .25
D .283 .193 .461 -.22 .79
C A .300 .193 .410 -.20 .80
B .250 .193 .569 -.25 .75
D .533 .223 .083 -.05 1.11
D A -.233 .193 .624 -.74 .27
B -.283 .193 .461 -.79 .22
C -.533 .223 .083 -1.11 .05
A : Case Study Firms; B : Non-Case Study Firms; C : Government Agencies; D : Contractors
* The mean difference is significant at the 0.05 level.
Source : Developed from the Survey Data
4.4.2.2 Statement 10
Statement 10 : The Malaysian ECS firms have competent staff with an international
and entrepreneurial orientation to take advantage of emerging
international marketing opportunities.
The cross tabulation of the survey responses to Statement 10 shown in Table 4.36, and the
combined and re-coded responses shown in Figure 4.17, reveal that majority or 58.3% of
the respondents agreed with the Statement, 23.9% were uncertain and 17.8% did not
agree. The strongest support was from the Government Agencies at 66.7%. The Case
Study Firms and Non-Case Study Firms, each with 58.3% of the respondents from the
respective groups agreed. Half of the respondents from the Contractors also agreed with
the Statement.

189
Table 4.36 : Cross Tabulation of Survey Responses - Statement 10
Statement 10
Group Type
Statistics
Strongly Disagree
Disagree
Uncertain
Agree
Strongly Agree
Total
Case Study Firms
Count 0 11 14 35 0 60
% within Group Type 0.0% 18.3% 23.3% 58.3% 0.0% 100.0%
% within Statement 10 0.0% 39.3% 32.6% 34.7% 0.0% 33.3%
% of Total 0.0% 6.1% 7.8% 19.4% 0.0% 33.3%
Non-Case Study Firms
Count 2 6 17 32 3 60
% within Group Type 3.3% 10.0% 28.3% 53.3% 5.0% 100.0%
% within Statement 10 50.0% 21.4% 39.5% 31.7% 75.0% 33.3%
% of Total 1.1% 3.3% 9.4% 17.8% 1.7% 33.3%
Government Agencies
Count 1 3 6 20 0 30
% within Group Type 3.3% 10.0% 20.0% 66.7% 0.0% 100.0%
% within Statement 10 25.0% 10.7% 14.0% 19.8% 0.0% 16.7%
% of Total 0.6% 1.7% 3.3% 11.1% 0.0% 16.7%
Contractors Count 1 8 6 14 1 30
% within Group Type 3.3% 26.7% 20.0% 46.7% 3.3% 100.0%
% within Statement 10 25.0% 28.6% 14.0% 13.9% 25.0% 16.7%
% of Total 0.6% 4.4% 3.3% 7.8% 0.6% 16.7%
Total Count 4 28 43 101 4 180
% within Group Type 2.2% 15.6% 23.9% 56.1% 2.2% 100.0%
% within Statement 10 100.0% 100.0% 100.0% 100.0% 100.0% 100.0%
% of Total 2.2% 15.6% 23.9% 56.1% 2.2% 100.0%
Source : Developed from the Survey Data
Figure 4.17 : Combined and Re-coded Responses to Statement 10
Source : Developed from the Survey Data
Table 4.37 shows the case summary of the responses to Statement 10. The overall mean
rating is 3.41 indicating good support to the Statement. The mean ratings for the groups
are: 3.4 for the Case Study Firms, 3.47 for the Non-Case Study Firms, 3.5 for the
Government Agencies and 3.20 for the Contractors. This implies that all the groups
unanimously supported the Statement.

190
Table 4.37 : Case Summary – Statement 10
Group Type N Mean Std. Deviation
Case Study Firms 60 3.40 0.785
Non-Case Study Firms 60 3.47 0.873
Government Agencies 30 3.50 0.820
Contractors 30 3.20 0.997
Total 180 3.41 0.857
Source : Developed from the Survey Data
The multiple comparisons of the Tukey’s test of one-way ANOVA, shown in Table 4.38,
indicate no significant differences in opinions among the four groups regarding Statement
10.
Table 4.38 : Multiple Comparisons between Groups for Statement 10
Tukey HSD
Dependent Variable (I) GROUP
(J) GROUP
Mean Difference (I-J) Std. Error Sig.
95% Confidence Interval
Lower Bound Upper Bound
STATEMENT 10 A B -.067 .157 .974 -.47 .34
C -.100 .192 .954 -.60 .40
D .200 .192 .725 -.30 .70
B A .067 .157 .974 -.34 .47
C -.033 .192 .998 -.53 .46
D .267 .192 .508 -.23 .76
C A .100 .192 .954 -.40 .60
B .033 .192 .998 -.46 .53
D .300 .222 .530 -.27 .87
D A -.200 .192 .725 -.70 .30
B -.267 .192 .508 -.76 .23
C -.300 .222 .530 -.87 .27
A : Case Study Firms; B : Non-Case Study Firms; C : Government Agencies; D : Contractors
* The mean difference is significant at the 0.05 level.
Source : Developed from the Survey Data
4.4.2.3 Statement 11
Statement 11 : The Malaysian ECS industry places emphasis on human capital
development and knowledge management to stay abreast of the
technological changes impacting on the ECS.
The cross tabulation of the survey responses to Statement 11 shown in Table 4.39, and the
combined and re-coded responses shown in Figure 4.18, reveal that less than half or

191
47.2% of the respondents agreed with the Statement, 33.3% were uncertain and 19.4%
disagreed. 60.0% of the respondents from the Government Agencies supported the
Statement. The support also was from the Case Study Firms at 51.7%, from the Non-
Case Study Firms and the Contractors at 40.0% each. Generally, about one third from
each groups were uncertain.
Table 4.39 : Cross Tabulation of Survey Responses - Statement 11
Statement 10
Group Type
Statistics
Strongly Disagree
Disagree
Uncertain
Agree
Strongly Agree
Total
Case Study Firms
Count 0 11 18 31 0 60
% within Group Type 0.0% 18.3% 30.0% 51.7% 0.0% 100.0%
% within Statement 11 0.0% 35.5% 30.0% 38.3% 0.0% 33.3%
% of Total 0.0% 6.1% 10.0% 17.2% 0.0% 33.3%
Non-Case Study Firms
Count 1 14 21 23 1 60
% within Group Type 1.7% 23.3% 35.0% 38.3% 1.7% 100.0%
% within Statement 11 25.0% 45.2% 35.0% 28.4% 25.0% 33.3%
% of Total 0.6% 7.8% 11.7% 12.8% 0.6% 33.3%
Government Agencies
Count 2 1 9 16 2 30
% within Group Type 6.7% 3.3% 30.0% 53.3% 6.7% 100.0%
% within Statement 11 50.0% 3.2% 15.0% 19.8% 50.0% 16.7%
% of Total 1.1% 0.6% 5.0% 8.9% 1.1% 16.7%
Contractors Count 1 5 12 11 1 30
% within Group Type 3.3% 16.7% 40.0% 36.7% 3.3% 100.0%
% within Statement 11 25.0% 16.1% 20.0% 13.6% 25.0% 16.7%
% of Total 0.6% 2.8% 6.7% 6.1% 0.6% 16.7%
Total Count 4 31 60 81 4 180
% within Group Type 2.2% 17.2% 33.3% 45.0% 2.2% 100.0%
% within Statement 11 100.0% 100.0% 100.0% 100.0% 100.0% 100.0%
% of Total 2.2% 17.2% 33.3% 45.0% 2.2% 100.0%
Source : Developed from the Survey Data
Figure 4.18 : Combined and Re-coded Responses to Statement 11
Source : Developed from the Survey Data
The case summary of the responses to Statement 11 is shown in Table 4.40. The overall
mean rating is 3.28 which indicate a weak support for the Statement. This is also borne

192
out by the high standard deviation of 0.853. All the groups supported the Statement, as
reflected by the mean rating of 3.33 for the Case Study Firms, 3.15 for the Non-Case
Study Firms, 3.5 for the Government Agencies and 3.2 for the Contractors.
Table 4.40 : Case Summary – Statement 11
Group Type N Mean Std. Deviation
Case Study Firms 60 3.33 0.774
Non-Case Study Firms 60 3.15 0.860
Government Agencies 30 3.50 0.938
Contractors 30 3.20 0.887
Total 180 3.28 0.853
Source : Developed from the Survey Data
The multiple comparisons of the Tukey’s test of one-way ANOVA, shown in Table 4.41,
indicate no significant differences in opinions among the four groups with respect to
Statement 11.
Table 4.41 : Multiple Comparisons between Groups for Statement 11
Tukey HSD
Dependent Variable (I) GROUP
(J) GROUP
Mean Difference (I-J) Std. Error Sig.
95% Confidence Interval
Lower Bound Upper Bound
STATEMENT 11 A B .183 .155 .640 -.22 .59
C -.167 .190 .817 -.66 .33
D .133 .190 .897 -.36 .63
B A -.183 .155 .640 -.59 .22
C -.350 .190 .258 -.84 .14
D -.050 .190 .994 -.54 .44
C A .167 .190 .817 -.33 .66
B .350 .190 .258 -.14 .84
D .300 .220 .522 -.27 .87
D A -.133 .190 .897 -.63 .36
B .050 .190 .994 -.44 .54
C -.300 .220 .522 -.87 .27
A : Case Study Firms; B : Non-Case Study Firms; C : Government Agencies; D : Contractors
* The mean difference is significant at the 0.05 level.
Source : Developed from the Survey Data
4.4.2.4 Statement 12
Statement 12 : The Malaysian ECS firms have appropriate mechanisms for pooling the
specific competencies for jointly bidding for international projects on a
consortium basis.
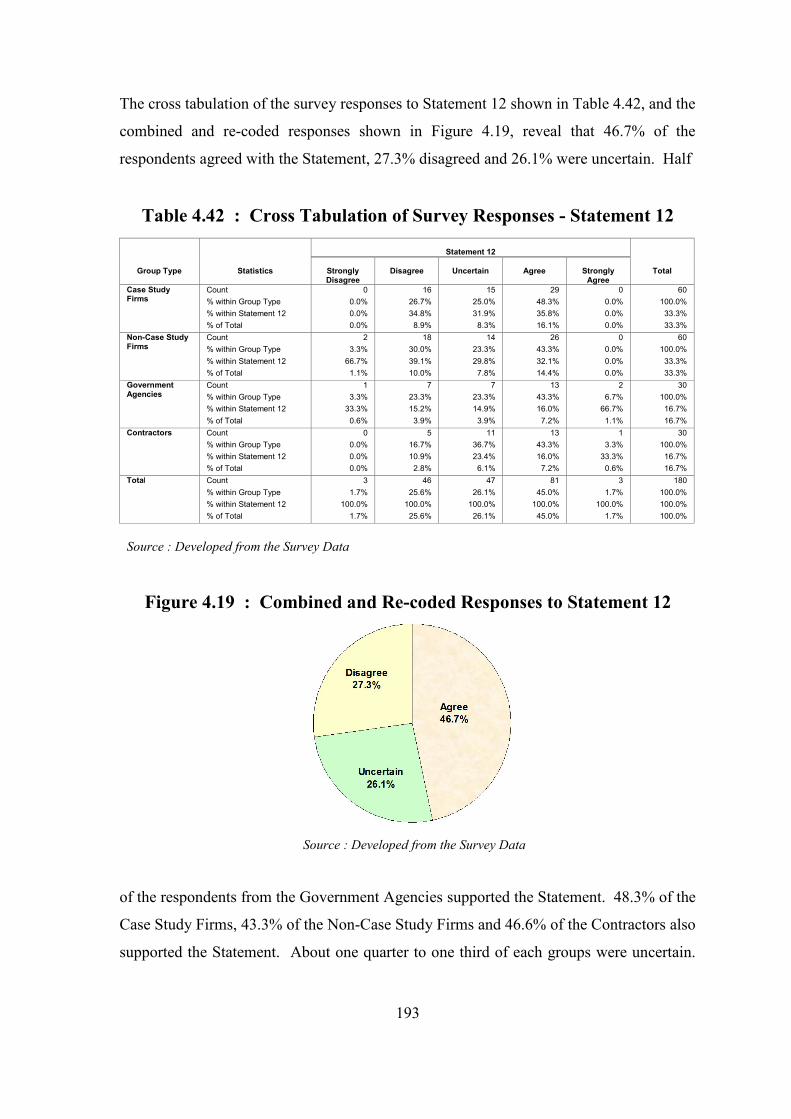
193
The cross tabulation of the survey responses to Statement 12 shown in Table 4.42, and the
combined and re-coded responses shown in Figure 4.19, reveal that 46.7% of the
respondents agreed with the Statement, 27.3% disagreed and 26.1% were uncertain. Half
Table 4.42 : Cross Tabulation of Survey Responses - Statement 12
Statement 12
Group Type
Statistics
Strongly Disagree
Disagree
Uncertain
Agree
Strongly Agree
Total
Case Study Firms
Count 0 16 15 29 0 60
% within Group Type 0.0% 26.7% 25.0% 48.3% 0.0% 100.0%
% within Statement 12 0.0% 34.8% 31.9% 35.8% 0.0% 33.3%
% of Total 0.0% 8.9% 8.3% 16.1% 0.0% 33.3%
Non-Case Study Firms
Count 2 18 14 26 0 60
% within Group Type 3.3% 30.0% 23.3% 43.3% 0.0% 100.0%
% within Statement 12 66.7% 39.1% 29.8% 32.1% 0.0% 33.3%
% of Total 1.1% 10.0% 7.8% 14.4% 0.0% 33.3%
Government Agencies
Count 1 7 7 13 2 30
% within Group Type 3.3% 23.3% 23.3% 43.3% 6.7% 100.0%
% within Statement 12 33.3% 15.2% 14.9% 16.0% 66.7% 16.7%
% of Total 0.6% 3.9% 3.9% 7.2% 1.1% 16.7%
Contractors Count 0 5 11 13 1 30
% within Group Type 0.0% 16.7% 36.7% 43.3% 3.3% 100.0%
% within Statement 12 0.0% 10.9% 23.4% 16.0% 33.3% 16.7%
% of Total 0.0% 2.8% 6.1% 7.2% 0.6% 16.7%
Total Count 3 46 47 81 3 180
% within Group Type 1.7% 25.6% 26.1% 45.0% 1.7% 100.0%
% within Statement 12 100.0% 100.0% 100.0% 100.0% 100.0% 100.0%
% of Total 1.7% 25.6% 26.1% 45.0% 1.7% 100.0%
Source : Developed from the Survey Data
Figure 4.19 : Combined and Re-coded Responses to Statement 12
Source : Developed from the Survey Data
of the respondents from the Government Agencies supported the Statement. 48.3% of the
Case Study Firms, 43.3% of the Non-Case Study Firms and 46.6% of the Contractors also
supported the Statement. About one quarter to one third of each groups were uncertain.

194
About one third of the Non-Case Study Firms and one quarter of the Case Study Firms
and the Government Agencies did not agree with the Statement.
The case summary of the responses to Statement 12 is shown in Table 4.43. The overall
mean rating of 3.19 indicates weak support for the Statement. Since the mean ratings for
each groups ranged from 3.22 for the Case Study Firms, 3.07 for the Non-Case Study
Firms, 3.27 for the Government Agencies and 3.33 for the Contractors, it can be
concluded that the respondents generally expressed support for the Statement.
Table 4.43 : Case Summary – Statement 12
Group Type N Mean Std. Deviation
Case Study Firms 60 3.22 0.846
Non-Case Study Firms 60 3.07 0.936
Government Agencies 30 3.27 1.015
Contractors 30 3.33 0.802
Total 180 3.19 0.898
Source : Developed from the Survey Data
The multiple comparisons of the Tukey’s test of one-way ANOVA, shown in Table 4.44,
indicate no significant differences in views between the four groups with respect to
Statement 12.
Table 4.44 : Multiple Comparisons between Groups for Statement 12
Tukey HSD
Dependent Variable (I) GROUP
(J) GROUP
Mean Difference (I-J) Std. Error Sig.
95% Confidence Interval
Lower Bound Upper Bound
STATEMENT 12 A B .150 .164 .798 -.28 .58
C -.050 .201 .995 -.57 .47
D -.117 .201 .938 -.64 .41
B A -.150 .164 .798 -.58 .28
C -.200 .201 .753 -.72 .32
D -.267 .201 .548 -.79 .26
C A .050 .201 .995 -.47 .57
B .200 .201 .753 -.32 .72
D -.067 .232 .992 -.67 .54
D A .117 .201 .938 -.41 .64
B .267 .201 .548 -.26 .79
C .067 .232 .992 -.54 .67
A : Case Study Firms; B : Non-Case Study Firms; C : Government Agencies; D : Contractors
* The mean difference is significant at the 0.05 level.
Source : Developed from the Survey Data
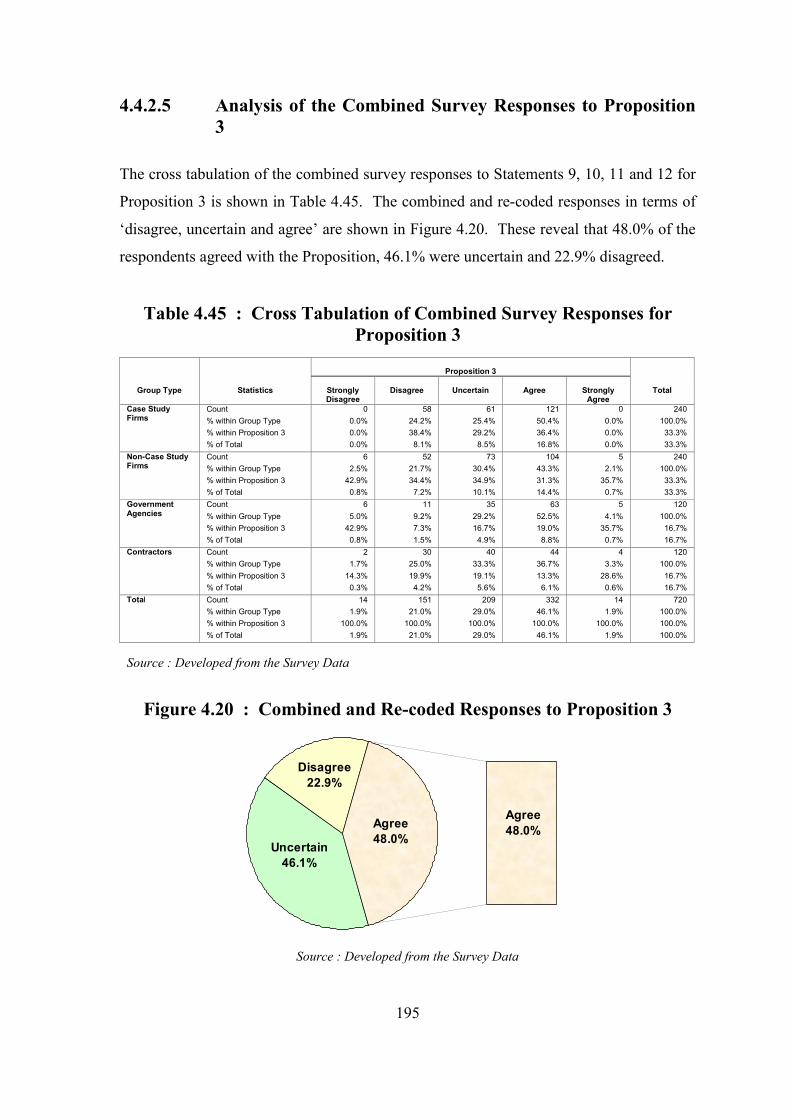
195
Uncertain
46.1%
Disagree
22.9%
Agree
48.0%Agree
48.0%
4.4.2.5 Analysis of the Combined Survey Responses to Proposition 3
The cross tabulation of the combined survey responses to Statements 9, 10, 11 and 12 for
Proposition 3 is shown in Table 4.45. The combined and re-coded responses in terms of
‘disagree, uncertain and agree’ are shown in Figure 4.20. These reveal that 48.0% of the
respondents agreed with the Proposition, 46.1% were uncertain and 22.9% disagreed.
Table 4.45 : Cross Tabulation of Combined Survey Responses for Proposition 3
Proposition 3
Group Type
Statistics
Strongly Disagree
Disagree
Uncertain
Agree
Strongly Agree
Total
Case Study Firms
Count 0 58 61 121 0 240
% within Group Type 0.0% 24.2% 25.4% 50.4% 0.0% 100.0%
% within Proposition 3 0.0% 38.4% 29.2% 36.4% 0.0% 33.3%
% of Total 0.0% 8.1% 8.5% 16.8% 0.0% 33.3%
Non-Case Study Firms
Count 6 52 73 104 5 240
% within Group Type 2.5% 21.7% 30.4% 43.3% 2.1% 100.0%
% within Proposition 3 42.9% 34.4% 34.9% 31.3% 35.7% 33.3%
% of Total 0.8% 7.2% 10.1% 14.4% 0.7% 33.3%
Government Agencies
Count 6 11 35 63 5 120
% within Group Type 5.0% 9.2% 29.2% 52.5% 4.1% 100.0%
% within Proposition 3 42.9% 7.3% 16.7% 19.0% 35.7% 16.7%
% of Total 0.8% 1.5% 4.9% 8.8% 0.7% 16.7%
Contractors Count 2 30 40 44 4 120
% within Group Type 1.7% 25.0% 33.3% 36.7% 3.3% 100.0%
% within Proposition 3 14.3% 19.9% 19.1% 13.3% 28.6% 16.7%
% of Total 0.3% 4.2% 5.6% 6.1% 0.6% 16.7%
Total Count 14 151 209 332 14 720
% within Group Type 1.9% 21.0% 29.0% 46.1% 1.9% 100.0%
% within Proposition 3 100.0% 100.0% 100.0% 100.0% 100.0% 100.0%
% of Total 1.9% 21.0% 29.0% 46.1% 1.9% 100.0%
Source : Developed from the Survey Data
Figure 4.20 : Combined and Re-coded Responses to Proposition 3
Source : Developed from the Survey Data

196
0%
10%
20%
30%
40%
50%
60%
Percent
Disagree 24.2% 24.2% 14.2% 26.7%
Uncertain 25.4% 30.4% 29.2% 33.3%
Agree 50.4% 45.0% 56.6% 40.0%
Case Study FirmsNon-Case Study
Firms
Government
AgenciesContractors
The combined and re-coded responses to Proposition by groups are shown in Figure 4.21.
The Proposition was supported by 50.4% of the Case Study Firms, 45.0% of the Non-
Case Study Firms, 56.6% of the Government Agencies and 40.0% of the Contractors.
About a quarter to one third of the respondents in each group were uncertain. The Case
Study Firms, the Non-Case Study Firms and the Contractors accounted for a quarter of
the respondents who disagreed with the Proposition.
Figure 4.21 : Combined and Re-coded Responses to Proposition 3 by Groups
Source : Developed from the Survey Data
Table 4.46 shows the case summary of the responses to Proposition 3 and the group mean
ratings are graphically shown in Figure 4.22. The overall mean rating for Proposition 3 is
3.25 indicating a weak support to Proposition 3. The mean ratings for the groups are:
3.26 for the Case Study Firms, 3.21 for Non-Case Study Firms, 3.42 for Government
Agencies and 3.15 for the Contractors, implying that the respondents of all the groups
generally supported Proposition 3.

197
0
1
2
3
4
5
Case StudyFirms
Non-CaseStudy Firms
GovernmentAgencies
Contractors Total
3.26 3.213.42
3.15 3.25
Mean
Table 4.46 : Case Summary for Proposition 3
Group Type N Mean Std. Deviation
Case Study Firms 60 3.26 0.588
Non-Case Study Firms 60 3.21 0.588
Government Agencies 30 3.42 0.726
Contractors 30 3.15 0.681
Total 180 3.25 0.630
Source : Developed from the Survey Data
Figure 4.22 : Group Mean Ratings to Proposition 3
Source : Developed from the Survey Data
A composite item P3 representing Proposition 3 was created by taking the mean score
across the scores of Statements 9, 10, 11 and 12. The Pearson Product Moment
Correlation coefficients between P3 and Statements 9, 10, 11 and 12 are shown in Table
4.47. Using the criteria presented by Hair et al. (1998), the item-to-total correlations are
all greater than the criterion of 0.50, indicating that P3 is a good representation of
Proposition 3 comprising Statements 9, 10, 11 and 12. The Statements also displayed
inter-item correlations greater than the criterion of 0.3 and are significant, except the
correlation between Statement 9 and 11 which is 0.290. P3 is homogeneous and has an
acceptable reliability with Cronbach’s alpha of 0.70 (Gregory 2004). From the principal
components analysis, one component was extracted with an eigenvalue greater than 1 and
the component loadings are all greater than 0.5. Thus, Statements 9, 10, 11 and 12
represent a single underlying construct and explain 52.33% of the total variance.

198
Table 4.47 : Pearson Correlations between P3, Statements 9, 10, 11 and
12
P3 Statement 9 Statement 10 Statement 11 Statement 12
P3 1
Statement 9 0.720** 1
Statement 10 0.743** 0.469** 1
Statement 11 0.697** 0.290** 0.327** 1
Statement 12 0.732** 0.325** 0.362** 0.411** 1
** Correlation is significant at the 0.01 level (2-tailed)
Source : Developed from the Survey Data
A one-way ANOVA was conducted with P3 as the independent variable and Group as the
dependent variable. Lavene’s test was not significant indicating that the assumption of
homogeneity of variances was not violated. The overall F(3, 176) = 1.051 is not
significant with p = 0.371 > 0.05. This indicates that there were no significant differences
in opinions between the four groups. This is further reflected by the multiple
comparisons of the Tukey’s test of one-way ANOVA as shown in Table 4.48.
Table 4.48 : Multiple Comparisons between Groups for Proposition 3 P3 Tukey HSD
(I) GROUP (J) GROUP Mean Difference (I-J) Std. Error Sig.
95% Confidence Interval
Lower Bound Upper Bound
A B .05417 .11478 .965 -.2436 .3519
C -.15417 .14058 .692 -.5188 .2105
D .11250 .14058 .854 -.2521 .4771
B A -.05417 .11478 .965 -.3519 .2436
C -.20833 .14058 .451 -.5730 .1563
D .05833 .14058 .976 -.3063 .4230
C A .15417 .14058 .692 -.2105 .5188
B .20833 .14058 .451 -.1563 .5730
D .26667 .16233 .357 -.1544 .6877
D A -.11250 .14058 .854 -.4771 .2521
B -.05833 .14058 .976 -.4230 .3063
C -.26667 .16233 .357 -.6877 .1544
A : Case Study Firms; B : Non-Case Study Firms; C : Government Agencies; D : Contractors
* The mean difference is significant at the 0.05 level.
Source : Developed from the Survey Data

199
4.4.3 Testing of Research Proposition 3
As discussed in Sub-Section 4.4.1, the Focus Group addressed Statements 9, 10, 11 and
12 of the Research Proposition 3 which states that ‘the exporting Malaysian firms have
appropriate strategies for successfully entering new international markets’. Although the
Focus Group agreed with the emphasis placed by Malaysian ECS firms on human capital
development and knowledge development, they disagreed that Malaysian ECS firms have
internationalization strategies, competent staff with international and entrepreneurial
orientation, and appropriate mechanisms for the pooling of resources for international
bidding. Accordingly, the Focus Group did not support Proposition 3.
The survey respondents weakly supported all the Statements 9, 10, 11 and 12. Overall
48.0% of the respondents agreed with Proposition 3 as shown in Figure 4.20 and all the
groups showed mild support to Proposition 3. On balance, there was weak support for
Proposition 3 by the survey respondents.
Taking account of the findings of the Focus Group meeting and the Questionnaire Survey,
there was no concrete agreement. Hence Proposition 3 could not be supported.
4.5 Analysis of Unplanned Data
As discussed in Section 2.8, the literature review revealed several gaps in the existing
body of knowledge. These formed the basis for developing the research propositions for
testing. The researcher endeavoured to identify all the research issues that merited
addressing by the Focus Group. However, some Focus Group members raised some
pertinent and relevant issues which were outside the scope of the Questionnaires and
Discussion Guides. They were therefore treated as ‘unplanned’ data and these are
presented below:
(i) The Focus Group members commented that the REA is limiting to engineering
business practices and professionalism and not for the business development of
the Malaysian ECS industry. Accordingly, the Focus Group suggested that the
REA be amended to separate the business and the profession so that the ECS

200
industry can move forward in the changing domestic and international engineering
business landscape.
(ii) The Focus Group noted that the standard of education is declining in Malaysia.
Malaysian ECS industry has a narrow lead of 10 years ahead of other developing
countries. However, this advantage is being quickly eroded when the other
developing countries are catching up fast and the current good, experienced and
aging Malaysian engineers retire.
4.6 Conclusion
This chapter presented and analyzed the primary data collected from the Focus Group
meeting and the Questionnaire Survey. Qualitative analysis procedures were used for the
views expressed by the members of the Focus Group. The quantitative data from the
Questionnaire Survey were analyzed using SPSS statistical software package. The
findings permitted the testing of the three Research Propositions. The unplanned data that
emerged during the Focus Group meeting were also recorded.
The next and final chapter discusses the conclusions that can be drawn with the testing of
the Research Propositions. It then discusses the implications on the Research Problem,
theory development, policy and practice.
201
CHAPTER FIVE – CONCLUSION
5.1 Introduction
This research investigated the internationalization of Malaysia ECS firms and the factors
necessary for their successful internationalization. This Chapter presents the findings of
this research and commences with an overview of the earlier chapters.
Chapter One introduced the Research Problem: ‘What are the important critical factors
for the successful internationalization of Malaysian ECS firms?’. It presented the
background and justification for this research. It outlined the research methodology and
the measures taken to safeguard research quality and addressed the ethical issues. It also
defined the key terms and set out the limitations of this research.
The second Chapter reviewed the literature on the background and focal theories (Phillips
& Pugh 2005) with the primary aims of developing the theoretical foundations for the
research and identifying the research gaps. The review included a discussion on the
national setting, the pertinent theories and models on internationalization, the global and
Malaysian engineering consulting industry and the Malaysian Government policies
towards services export. The review pin-pointed the key research issues and identified
gaps in the existing body of knowledge on the internationalization of Malaysian ECS
firms in a globalizing business environment. It also reaffirmed the relevance of the
research questions and these were the basis for the crafting of the three Research
Propositions that were tested by this research. The Research Propositions were:
• Research Proposition 1 : The Malaysian ECS firms are well positioned for
global competitive advantage in the liberalizing global
markets.
• Research Proposition 2 : The Malaysian Government has effective targeted
supported policies and programmes to assist
Malaysian ECS firms with their internationalization
effort.

202
• Research Proposition 3 : The exporting Malaysian ECS firms have appropriate
strategies for successfully entering new international
markets.
Chapter Three discussed the research paradigm and research design. It justified the
adoption of the mixed methodology for the research, using both the qualitative and
quantitative methods. It discussed the use of case studies, a Focus Group meeting and
Sample Survey as the data collection instruments. The Chapter presented the data
analysis processes, the measures taken to address the issues of reliability, validity and
ethical concerns.
Chapter Four analyzed and presented the findings of the primary data collected from the
Focus Group meeting and the Questionnaire Survey. The three Research Propositions
were tested in accordance with the established procedures of data analysis and techniques.
It also presented the unplanned data that emerged from the Focus Group meeting.
This final Chapter presents the conclusions, implications and impact of the research on
the basis of the evidence emerging from the primary data analysis process detailed in
Chapter Four and the findings of the literature review in Chapter Two. Accordingly, this
Chapter is divided into eight sections as shown in Figure 5.1.
Section 5.1 introduces the Chapter and outlines the chapter structure.
Section 5.2 presents the conclusions on each of the three Research Propositions. These
are derived from the findings of the literature review and the primary data analysis.
Section 5.3 addresses the Research Problem and provides the overall conclusions for this
research.

203
Figure 5.1 : Structure of Chapter Five
Source : Developed for this Research
Section 5.1 : Introduction
• Chapter Structure
Section 5.2 : Conclusios about Each Research Proposition
• Research Proposition 1
• Research Proposition 2
• Research Proposition 3
Section 5.3 : Conclusions about the Research Problem
Section 5.4 : Implications for Theory
Section 5.5 : Implications for Policy and Practice
Section 5.6 : Research Limitations
Section 5.7 : Further Research
Section 5.8 : Conclusion

204
Section 5.4 discusses the implications of the research on new theory development.
Section 5.5 presents the contributions of this research for Government policies and
practices by the ECS firms.
Section 5.6 deals with the limitations for this research.
Section 5.7 addresses the areas that warrant further research.
Section 5.8 sets out the conclusions.
5.2 Conclusions about Each Research Proposition
This Section aims to draw pertinent conclusions for each of the three Research
Propositions as a prelude to addressing the Research Problem in the next section. The
conclusions about each Research Proposition were drawn from the evidence and findings
of the literature review in Chapter Two and the analysis of the primary data obtained from
the Focus Group meeting and the Questionnaire Survey as discussed in Chapter Four.
The triangulation of findings served to ensure reliability and validity for each Research
Proposition.
5.2.1 Research Proposition 1
This Section summarizes the findings emerging from the testing of Research Proposition
1 that ‘The Malaysian ECS firms are well positioned for global competitive advantage in
the liberalizing global markets’. The discussion takes into account the findings of the data
analysis presented in Chapter Four relative to the literature review findings presented in
Chapter Two.
The literature review revealed that the Malaysian Government attaches high priority to
the expansion of services exports including ECS exports. However, the industry now has
to contend with the forces of globalization which is intensifying competition with the
removal of tariff and non-tariff barriers. The Malaysian ECS firms are also challenged by

205
lower cost rivals from neighbouring countries including Indonesia, India, China and the
Philippines.
The literature also revealed that Malaysian ECS firms have the technical competences
and world class expertise for undertaking a variety of projects in the domestic as well as
international markets. However, the literature was silent on whether Malaysian ECS
firms had the necessary attributes and the competitive positioning to take advantage of the
emerging new market opportunities arising from the global liberalization of the ECS
industry. These are shown in Table 2.21 and Table 5.1 below.
Table 5.1 : Response Pattern to Research Proposition 1
Issues
Literature Review
Focus Group
Questionnaire Survey
National legislation protection
Known
Agreed
Agreed
Entry of international ECS firms
Known
Agreed
Agreed
Competences, expertise and strengths to compete in world market
Unknown
Agreed
Agreed
Taking advantage of emerging new market opportunities
Unknown
Agreed
Agreed
Source : Developed from the Research Data
Sub-Section 4.2.1 presented the findings of the Focus Group, while Sub-Sections 4.2.2
presented the results of the Questionnaire Survey in respect of Research Proposition 1.
The issues, reflected in Statements 1, 2, 3 and 4 of the Questionnaire Survey and in the
Discussion Guide for the Focus Group meeting, are summarized in Table 5.1. On the
basis of the findings, the following conclusions can be drawn:
(i) With the implementation of GATS and the liberalization of the ECS sector, the
Malaysian ECS industry will no longer be fully protected by legislations in the
domestic market from foreign competition. Existing prohibitive legislations and
protective barriers could be changed.

206
(ii) The bigger, older and well established international ECS firms already have
presence in the Malaysian market even prior to the implementation of GATS.
They are well positioned with their more superior technical know-how, expertise
and international experience. In line with GATS, more foreign ECS firms
particularly those from the developing countries such as China, India, Indonesia
and Philippines could extend their activities to Malaysia and compete with the
Malaysian indigenous firms. This does not bode well for the Malaysian ECS firms
as the larger international ECS firms have the advantage at the high end of the
market and the ECS firms from the developing countries being more competitive
at the low end.
(iii) The Malaysian ECS industry has the technical competencies, expertise and
strengths to compete effectively in the liberalizing world markets, particularly the
third world countries. However, Malaysian engineers are weak in management,
financial knowledge, marketing and soft skills to compete effectively.
(iv) The Malaysian ECS industry has to be well prepared to take advantage of the
opportunities arising from the emerging new markets with the implementation of
GATS. For this purpose, they have to overcome the difficulties of securing the
financial resources required for entering international markets. A stumbling block
is the REA which limits the general public to not more than 30% shares in the
Malaysian ECS firms. Furthermore, the Malaysian ECS firms have difficulties to
secure the needed finances from public funding and financial institutions. This is
particularly so with the smaller Malaysian ECS firms that find raising the
necessary performance bonds and professional indemnity insurance for large
projects a formidable task.
(v) The Malaysian ECS firms are well positioned technically for global competition
in the liberalizing world markets. However, they have to improve their
management and marketing skills as well as increase their access to financial
resources. Malaysian CEs also generally prefer to work in Malaysia rather than to
take up overseas postings as this could disrupt their children’s schooling and long

207
term career prospects. Furthermore, the Malaysian CEs are not mobile and do not
like overseas posting.
5.2.2 Research Proposition 2
This Section summarizes the findings emerging from the testing of Research Proposition
2. This was stated as ‘The Malaysian Government has effective targeted support policies
and programmes to assist Malaysian ECS firms with their internationalization effort’.
The discussion takes into account the findings of the data analysis presented in Chapter
Four relative to the literature review findings presented in Chapter Two.
The literature review, in Section 2.6, revealed that the Malaysian Government actively
promotes export orientated Malaysian ECS firms. The Government provides funding
support and incentives and collaborates closely with the Malaysian ECS industry to
devise new policies and support measures for international market entry. However, as
indicated in Table 2.21 and Table 5.2 there were gaps in the literature on the adequacy
and effectiveness of the Malaysian Government policy framework for promoting the
Malaysian ECS industry
Table 5.2 : Response Pattern to Research Proposition 2
Issues
Literature Review
Focus Group
Questionnaire Survey
Effective Government policy framework
Unknown
Disagreed
Disagreed
Government promotion of new international market penetration
Known
Agreed
Divided
Government funding and incentives for service export
Known
Disagreed
Disagreed
Government collaboration with Malaysian ECS industry to devise new policies and support measures
Known
Disagreed
Disagreed
Source : Developed from the Research Data
Sub-Section 4.3.1 presented the findings of the Focus Group, while Sub-Section 4.3.2
provided the results of the Questionnaire Survey in respect of Research Proposition 2 in
relation to Statements 5, 6, 7 and 8. These are summarized in Table 5.2. The majority of
the Focus Group participants and Questionnaire Survey respondents, particularly the Case
208
Study Firms, the Non-Case Study Firms and the Contractors, rejected the Proposition
while the Government Agencies strongly supported it. Despite the Government Agencies
being a minority in the survey, their stance has an important bearing, as they are
instrumental in initiating policy changes. On the basis of the findings, the following
conclusions can be drawn:
(i) The Government has policies to support Malaysian export ready firms that are
venturing into international markets. The emphasis however, is on the export of
goods rather than the ECS. MATRADE, the Government agency responsible for
promoting Malaysian exports also mainly focuses on products rather than services
and more specifically ECS. The requirement therefore, is a focused services
export policy to encourage Malaysian ECS firms to develop the capabilities
necessary for successfully internationalizing their operations. The Government
also has export assistance programmes which reflect support for export ready and
exporting firms. Since these programmes are implemented by several government
agencies, there is considerable overlap and duplication of efforts. Furthermore, the
Malaysian ECS industry has not been able to benefit much from the export
assistance programmes.
(ii) The Malaysian government is promoting ECS overseas by organizing trade
missions, market information, market intelligence and government-to-government
bilateral trade arrangements. Notwithstanding, the activities have to be supported
by focused planning and effective strategies in order to achieve the desired
outcomes. Since the current activities are more appropriate and geared to the
trading of goods, these have to be re-orientated towards the needs of engineering
services.
(iii) The Malaysian ECS firms require Government funding and incentives to enter and
compete in the world markets. The lack of funding also constraints the
Government Agencies from effectively carrying out the necessary programmes for
services exports.

209
(iv) Although the Government collaborates with the ECS industry players to device
new policies and support measures, the nature of engagement and the bodies with
which the Government collaborates also requires review. This is necessary as the
existing activities with NAPSEC appear to be unfocused, too diffused and
ineffective. To rectify the situation, the Government agencies should also engage
with the ECS industry and the ACEM.
5.2.3 Research Proposition 3
This Section summarizes the findings emerging from the testing of Research Proposition
3. This was stated as ‘The exporting Malaysian ECS firms have appropriate strategies for
successfully entering new international markets’. The discussion takes into account the
findings of the data analysis presented in Chapter Four relative to the literature review
findings presented in Chapter Two.
The literature revealed much information on internationalization strategy and human
resource to take advantage of international marketing opportunities. The literature review,
in Sub-Section 2.5.5.4 indicated that Malaysia’s commitment to human capital
development is on par with the NIEs and developed countries. Further, in Sub-Sections
2.5.1, the literature revealed that the ECS industry emphasizes on human capital
development and knowledge development. This is necessary for the CEs to be well
equipped with the latest know-how for continuously upgrading their engineering skills.
The network perspective, as discussed in Sub-Section 2.4.3.2, revealed that firms can take
advantage of emerging internationalization opportunities by collaborating and pooling
expertise and resources with other firms in the networks. However, there are gaps in the
existing body of knowledge on whether the exporting Malaysian ECS firms have the
appropriate strategies for successfully entering new international markets. These are
shown in Table 2.21 and Table 5.3.
Sub-Section 4.4.1 presented the findings of the Focus Group, while Sub-Sections 4.4.2
provided the findings of the Questionnaire Survey in respect of Research Proposition 3 in
relation to Statements 9, 10, 11 and 12 as summarized in Table 5.3. Proposition 3 was
not supported by the Focus Group participants while the Questionnaire Survey

210
respondents expressed weak support. On the basis of the findings, as depicted in Table
5.3, the following conclusions can be drawn:
Table 5.3 : Response Pattern to Research Proposition 3
Issues
Literature Review
Focus Group
Questionnaire Survey
Internationalization strategies of Malaysian ECS firms
Unknown
Disagreed
Agreed
Malaysian ECS firms have Competent staff with international and entrepreneurial orientation
Unknown
Disagreed
Agreed
The Malaysian ECS industry emphasizes on human capital development and knowledge development
Known
Agreed
Agreed
The Malaysian ECS firms have appropriate mechanisms for pooling competencies and resources for international bidding
Unknown
Disagreed
Agreed
Source : Developed from the Research Data
(i) The exporting Malaysian ECS firms have to give greater emphasis to the
formulation and implementation of appropriate strategies for successfully entering
new international markets. Furthermore, the current internationalization practices
of the Malaysian ECS firms following clients on an ad-hoc, one off, and project to
project basis are not sustainable. The Malaysian ECS firms should also be more
proactive and be prepared to deal with the risks associated with overseas ventures.
They should also establish a local presence in foreign markets to enable them to
participate in rewarding network arrangements.
(ii) The Malaysian ECS firms have competent technical personnel who are well suited
to take advantage of emerging international market opportunities. They however
require staff with a strategic global outlook, international marketing capabilities,
knowledgeable about legal structures, financial knowledge and language skills for
competing successfully in foreign markets.
(iii) The Malaysian ECS firms and engineering organizations recognize the importance
of human capital development and knowledge management to stay abreast of the
technological changes impacting on the ECS industry. Since this is basically a
knowledge driven industry, new knowledge is continuously generated and CEs

211
must be able to harness and apply them to their work to remain competitive. The
stock of knowledge in the CEs’ database also has to be utilized and shared by all
staff in the ECS firms to enhance their professional competencies.
(iv) The Malaysian ECS firms appear to be disinclined to establish and implement
appropriate mechanisms for pooling their specialized skills to make them better
positioned to bid for international projects on a consortium basis. The Malaysian
ECS firms therefore have to adopt a broader perspective and cooperate with each
other for mutual benefit.
5.3 Conclusions about the Research Problem
This Section discusses the findings emerging from the research that relate to the Research
Problem. The literature review in Chapter Two identified the key research issues and the
pertinent theories that underpinned the parent and immediate disciplines of the research.
The findings of earlier related research revealed that:
• Malaysian ECS firms are giving greater emphasis to the internationalization of
their operations and moving away from the past practice of preferring the
‘comfort zone’ of the domestic market. This was largely due to the difficulties
faced by the firms in expanding their operations in the small domestic market.
• The implementation of GATS, under the WTO, has resulted in the global market
for trade and services being rapidly liberalized. This is generating intense
competition in the ECS industry worldwide and compelling Malaysian ECS firms
to venture abroad. However, they face several challenges including changes in
their mindsets, the mastering of global languages, securing financial resources and
formulating appropriate strategies for successfully penetrating international
market.

212
• The Malaysian Government has policies to promote the export of services.
However, there were doubts as to whether they were geared to the needs of the
ECS firms.
Notwithstanding, the existing body of knowledge did not fully address several key issues
that affect and contribute to the successful internationalization of Malaysian ECS firms.
These gaps presented in Table 2.21 are summarized as follows and relate to:
i) The competitive positioning of the Malaysian ECS industry under the GATS and
the adequacy of national legislations.
ii) The effectiveness of the Malaysian government’s support policies and programs
for ECS exports in particular the policy frameworks.
iii) The desired strategies for enhancing the global outreach of the Malaysian ECS
industry. The literature was also silent on the strategies adopted by Malaysian
ECS firms and on whether they had appropriate mechanisms for pooling their
specific competencies to better position themselves for joint international bidding.
The research gaps formed the basis for the development of the Research Propositions that
were tested by this research. Qualitative and quantitative data were collected through a
Focus Group meeting and a Questionnaire Survey. The analysis of the literature review,
the qualitative and quantifiable primary research data yielded comprehensive and useful
insights on the research gaps as set out in Table 5.4 and underlined the relevance of the
Research Problem stated as ‘What are the important critical factors for the successful
internationalization of Malaysian ECS firms ?’
These findings indicate that:
• There is a need to enhance human capital development and knowledge
management since human resource is a strategic and competitive asset for the
knowledge driven ECS industry. Furthermore, ECS firms should also have
technically competent staff with global mindsets and equipped with management,
financial, marketing and soft skills in order to compete in the world markets.

213
Table 5.4 : Investigation of Research Issues
Research Issues
Prior Literature
Research Gaps
Research Findings
The Malaysian Economic Development Policies
Adequate
Globalization of Services
Adequate
Internationalization Theories
Adequate
The Global ECS Industry
Adequate
The Malaysian ECS Industry
Adequate
Competitive positioning of Malaysian ECS industry under GATS
• National legislations
Inadequate
Known
• No
Yes
Yes
• Entry of international ECS firms
Known
• Impact on Malaysian ECS market.
Yes
• Competences, expertise and strengths to compete in world market
Unknown
• Yes
Yes
• Industry preparedness
Unknown
• To take advantage of emerging new market opportunities.
Yes
The Malaysian Government’s support policies and programmes for exports services
Adequate
Adequacy of Malaysian Government support policies and programmes for ECS exports.
• Effective Policy frameworks
Inadequate
Unknown
• Yes
Yes
Yes
• International promotion
Known
• Effectiveness
Yes
• Support schemes
Known
• Effectiveness
Yes
• Collaboration with Malaysian ECS industry
Known
• Effectiveness
Yes
The appropriate strategies for enhancing the global outreach of the Malaysian ECS industry
• Strategy adoption
Inadequate
Unknown
• Active formulation and implementation of internationalization strategies.
Yes
Yes
• Competent staff
Unknown
• Staff with international and entrepreneurial orientation.
Yes
• Human capital development and knowledge management
Known
• No
Yes
• Appropriate mechanisms for pooling specific competencies for joint international bidding
Unknown
• Yes
Yes
Source : Developed for this Research
• That appropriate strategies are important for successfully entering international
markets. This requires ECS firms that are internationalizing their operations to

214
foreign countries to create and maintain relationships and networks with business
network actors in foreign market. The current practices of Malaysian ECS firms
following clients on ad-hoc, one-off, project to project basis are not sustainable.
• It is necessary for the Malaysian Government to have policies and provide
funding support and incentives for the Malaysian ECS industry to export its
services. The existing Government policies and support effort have been
overtaken by the changing world economic environment and need to be reviewed
in order to stay relevant and be effective.
5.3.1 Summary
This Section summarized the findings of this research and matched them with the gaps in
the existing body of knowledge which were identified by the literature review. The
research findings enabled the research gaps to be bridged. This permitted the
reaffirmation of the relevance of the Research Problem stated as ‘What are the important
critical factors for the successful internationalization of Malaysian ECS firms?’. The
next Section discusses the implications of this research on theory development.
5.4 Implications for Theory
This research is mainly exploratory and fits into the interpretive paradigm. Accordingly,
the inductive reasoning of the research findings yields useful insights for theory building.
The literature review identified three theories pertinent to the internationalization of ECS.
As discussed in Sub-Section 2.4.3, these are the stage theories, network theory as well as
the internationalization framework for service firms.
The stage theories, comprising the Uppsala Internationalization Model (U-Model) and the
Innovation-Related Internationalization Model (I-Model), suggest that
internationalization activities are time dependent and occur in distinct incremental and
sequential steps or stages (Melin 1992, Axinn & Matthyssens 2001). The findings of this
research indicated otherwise and that the international expansion of the Malaysian ECS

215
firms occurred on ad-hoc, one-off and project to project basis. Thus, the research
supported the views of Sharma and Johanson (1987), Engwall and Wallenstal (1988) and
Buckley, Pass and Prescott (1992) that the stage models were not appropriate for
knowledge-intensive and business service industries.
The network theory postulates that a firm is embedded in a complex and evolving web of
interdependent social, business and industrial relationships (Bridgewater 1999; Johanson
& Mattsson 1988). A firm can internationalize by developing, establishing and
maintaining relationships and networks with business actors in foreign markets by
extension, penetration and integration (Johanson & Mattsson 1988). Sharma and
Johanson (1987) suggested that the network theory is most appropriate for the
internationalization of technical consultancy firms. The findings of this research support
this view. Furthermore, to achieve internationalization with network relationships, this
research revealed that a ‘local presence’ is necessary.
‘The internationalization framework’ offered by Asgari, Ahmad and Gurrib (2010), and
discussed in Sub-Section 2.4.3.3 and depicted in Figure 2.9 highlighted the key variables
for the internationalization of Malaysian services sectors. The key variables included the
firm internal factors of strategic considerations and competitive advantages, and external
factors of industry characteristics and target market factors.
However, based on the findings of this research, there are other important critical factors
that need to be considered for the successful internationalization of Malaysian ECS.
These are:
(i) A strong regulatory framework as this is now important to promote ECS exports.
The existing policies have to be reviewed for this purpose.
(ii) Export funding support since the Malaysian ECS firms are mostly small and
international expansion requires major financial commitment. This requires the
Government to provide export funding support.

216
(iii) Appropriate internationalization strategies which clearly determine the target
markets. Equally important are the timing of market entry and the choice of the
entry mode.
(iv) Adoption of the network strategy which involves the development, establishment
and maintaining of foreign business networks characterized by relationships of
collaboration or interdependence among firms. By utilizing such networks, ECS
firms can gain access to valuable resources and potential markets.
Accordingly, Asgari, Ahmad and Gurrib’s framework was modified by the researcher to
reflect the additional critical factors that emerged from this research for the successful
internationalization of Malaysian ECS firms. This is depicted in Figure 5.2.
5.5 Implications for Policy and Practice
As stated in Sub-Section 1.4.3, an important objective of this research was to recommend
appropriate corporate strategies for adoption by the Malaysian ECS firms to successfully
enter new international markets. Another significant objective was to examine the
adequacy and effectiveness of the existing Malaysian Government’s support programs for
the internationalization of the Malaysian ECS firms.
In line with these objectives, this Section offers recommendations, based on the findings
of the research, to support the efforts of the Malaysian ECS firms to become major
service providers in the highly competitive international market. As these
recommendations are for consideration by the government policy makers and Malaysian
ECS firms, this Section has two parts. The first, to examine the impact of the research
findings on public policies and the second, offers recommendations for consideration by
the Malaysian ECS firms.

217
Figure 5.2 : Modified Internationalization Framework for Malaysian ECS Firms
Source : Modified from Asgari, Ahmad & Gurrib (2010, p. 71)
5.5.1 Implications for Policy
As discussed in Chapter Four, several conclusions emerged from the analysis of the
research propositions. These call for a critical review of the existing policies on ECS
industry as they appear to hinder, rather than promote, the further development of the
industry in a rapidly changing international business landscape. The findings also indicate
the need for additional policy support to promote the internationalization of the Malaysian
ECS. The policy changes that merit considerations are listed below and elaborated.
(i) The Registration of Engineers Act 1967
(ii) A dedicated ECS Support Agency
Strategic Considerations
• Motives for expansion
• Business strategy
Competitive Advantages
• Firm specific resources
• Network relationships
Industry Characteristics
• Industry potential
• Industry uncertainty
Target Market Factors
• Market potential
• Country risk
Government
• Regulatory Framework
• Funding support
Network Strategy
• Extension
• Penetration
• Integration
Expansion Outcomes
• Business performance
• Country images
Represents the new relevant factors
Internationalization Strategy
• Choice of target market
• Timing of market entry
• Choice of entry mode
218
(iii) Additional Financial Support Measures
5.5.1.1 The Registration of Engineers Act 1967
Enacted in 1967 to regulate the professional conduct and practice of registered engineers,
the main objective of the REA is to safeguard the safety and the interests of the public. It
has also served to nurture the infant ECS industry by protecting it from foreign
competition. Over the past five decades, the Malaysian ECS industry has made rapid
progress and now has the skills and expertise to undertake a variety of mega projects
(Accenture 2010; IEM 2001). Furthermore, the small size of the domestic market
compels Malaysian ECS firms to participate in global projects (Wong 2000). Despite
these significant developments, the REA has not benefitted from a critical review with the
aim of enabling the ECS industry to move forward in an era of trade and service
liberalization. Viewed in this context, the following recommendations are offered.
Recommendations
• With the implementation of GATS under WTO and AFAS under AFTA, the REA
needs to change and allows entry of foreign ECS firms and PEs to practice and
compete in Malaysia. As a safeguard measure, all PEs should also be required to
pass a Competency Examination to demonstrate that they have a full
understanding of national and local standards, rules, regulations and laws.
• That the REA be amended to provide for the separation or the de-coupling of the
regulations on professionalism and consultancy practice. The amendments in
respect of the professionalism aspect could be limited to academic qualifications,
training needs, the registration of engineers and a code of ethics. However, the
ECS practice as a business entity should be treated as any other business entity
and fall under the purview of the existing Company’s Act.
• That the BEM council members comprise largely of PEs representing ECS firms
that are members of the ACEM. This is on the grounds that they are better placed
to fully understand and address the issues affecting the ECS industry.
219
• That the current requirement, a minimum 70% of the shareholding of ECS firms is
owned by only PEs, members of other allied professions such as architects and
quantity surveyors be changed to also permit ownership by the public. This will
increase the access of ECS firms to the financial resources required for funding
their overseas operations.
• That the composition of the board of directors of the ECS firm be changed to
include experts from other professions and not be confined to regulated
professionals. This change would enable the industry and the firms to benefit from
their talents and contributions for moving ahead as successful and expanding
business entities.
5.5.1.2 A Dedicated ECS Support Agency
The research findings revealed that several Government Ministries and agencies now
have responsibility for the delivery of services export promotion and assistance
programmes. Consequently, this has led to the duplication of efforts as well as
overlapping responsibilities and this has resulted in the non-achievement of the desired
results and outcomes. Furthermore, the existing policy environment does not provide for
funding support, grants or incentives for the Malaysian ECS firms to venture overseas.
Recommendations
• It is necessary for the Government to introduce a coherent policy to support the
ECS industry with a dedicated ‘one stop agency’. This accountable agency should
have the full responsibilities for the formulation of effective strategies and the
implementation of all export support programs. These could include capacity
building programs to enhance the qualifications and standards of Malaysian
engineers to better positioned themselves for competing successfully in
international markets. Another supportive measure is the provision of incentives
to Malaysian ECS firms to encourage them to grow in size by way of mergers and
acquisitions.

220
• Although national legislation may be changed to allow the access of foreign firms
to the domestic market, under the MFN Equal Treatment Principle, it is suggested
that the Government introduces stringent requirements such as local experience
and local partners that foreign services providers must satisfy in order to conduct
operations in Malaysia. That the Malaysian Government introduces the necessary
measures to ensure that all foreign ECS firms fully comply with these
requirements.
• That the Government establishes a local presence in prospective countries where
MATRADE does not have offices to build network arrangement for the benefit of
the Malaysian ECS firms. These offices should be staffed by dedicated foreign
trade officers who are fully supportive of the efforts of the Malaysian ECS firms
which are venturing into unfamiliar but lucrative foreign markets.
• That the Malaysian Government establishes a foreign development aid agency to
conduct feasibility and related studies by Malaysian ECS firms in other
developing countries. This will serve to facilitate the entry of Malaysian ECS
firms to foreign markets.
5.5.1.3 Additional Financial Support Measures
The literature review revealed that the typical Malaysian ECS firm is relatively small
(Ling, Abidin & Heng 2000). As they have difficulty in securing the required funding,
they have to largely rely on internally generated funds or personal borrowings to finance
their business operations (Tambunan 2009). The findings of the Focus Group meeting and
the Questionnaire Survey also revealed that Malaysian ECS firms have difficulties in
securing the financial resources required for entering international markets. This situation
justifies the needs for additional financial support measures.

221
Recommendations
• That the Malaysian Government introduces tax incentives to ECS firms for a
period of five years for profits earned from overseas operations. This will
encourage the Malaysian ECS firms to venture into overseas markets.
• That the Malaysian Government also provides funding support, grants and other
financial incentives to all Malaysian ECS firms to expand to foreign markets. This
is necessary as the majorities of the ECS firms are small and have difficulties in
securing financing for venturing abroad.
5.5.2 Implications for the Malaysian Engineering Consulting
Services Industry
Firms face various barriers, obstacles and challenges in their effort to market and export
their products or services in the international markets (Welch & Luostarinen 1993). The
findings of the literature review, reaffirmed by the findings of the Focus Group meeting
and the Questionnaire Survey, also revealed that Malaysian ECS firms venturing abroad
face key challenges. These include strong global competition, developing technological
capabilities through human resources development, formulating appropriate
internationalization strategies and creating business networks in order to gain better
access to resources and markets (Chetty & Blankenburg-Holm 2000). They also have to
address the growing competitive pressures from the larger ECS global industry players as
well as their low cost rivals from neighbouring developing countries.
The Malaysian ECS firms therefore have to take the necessary measures to overcome
these challenges. This is necessary for improving their positioning in the liberalizing
domestic and global markets. The recommendations based on the findings of this research
are outlined below.
5.5.2.1 Venturing Abroad for Corporate Sustainability

222
As discussed in Chapter Four, the implementation of GATS and AFAS are rapidly
liberalizing the provision of ECS and the Malaysian industry can no longer benefit from
the protection that it enjoyed in the past. It now has to contend with the threats posed by
the larger and well established Western ECS firms, with their superior technological
capabilities, who are gaining entry into the high end of the Malaysian ECS market. The
Malaysian ECS firms are also losing out to their low cost rivals from China, India,
Indonesia and Philippines. The situation implies that the Malaysian ECS firms can no
longer take the domestic market for granted.
Recommendation
• Despite the higher risk, the Malaysian ECS firms must move out and seek
opportunities in foreign countries for their corporate sustainability.
5.5.2.2 Human Capital Development
The resource-based view (RBV) theory postulates that human resource is a strategic asset
in the firm (Wright & McMahan 1992) especially for a knowledge-based ECS firm. The
research findings indicated that Malaysian ECS firms should emphasize on human capital
development to stay abreast of the technological changes impacting on the industry.
While the Malaysian ECS firms have competent technical personnel to undertake major
complex projects, it was necessary for them to develop management and marketing
competencies as these are vital for successful corporate performance.
Recommendations
• Malaysian ECS firms increase the investments in the training of their staff through
formal and structured programs of in-service training on international
management, marketing and entrepreneur skills.

223
• The training programs should also emphasize on financial management and the
development of soft skills to provide the PEs with an international and
entrepreneurial orientation.
5.5.2.3 Internationalization Strategy
An internationalization strategy is ‘…… the determination of the basic long-term goals
and objectives of an enterprise, and the adoption of courses of action and the allocation of
resources necessary for carrying out these goals’ (Chandler 1962, p. 13). An
internationalization strategy involves the choice of target market, choice of entry mode
and timing of market entry. Viewed in this context, the current practice of Malaysian ECS
firms venturing abroad on ad-hoc, one-off, project to project basis requires review.
Recommendations
• The Malaysian ECS firms have to formulate and implement coherent and focused
internationalization strategies in order to successfully venture overseas.
• It is important for the Malaysian ECS firms should commit resources to meet their
internationalization objectives. These include the deployment of personnel and
adequate funding for participation in trade fairs, trade visits and the setting up of
representative offices in prospective markets to gather trade information and
explore market opportunities.
• It is also important that ECS firms take full account of the external challenges that
they would have to address when venturing into external markets. These include
the regulatory requirements of the countries which they have targeted for starting
operations.
5.5.2.4 Network Relationships
224
For competing successfully in a global economy, firms can take advantage of business
network which is characterized ‘by relationships of collaboration or interdependence
among firms’ (Cobb, 1997, p.2). Sharma and Johanson (1987) also contended that the
network relationship is most appropriate for the internationalization of technical
consultancy firms. This has been reaffirmed by the findings of the literature review, the
Focus Group meeting and the Questionnaire Survey. The findings also showed that
Malaysian ECS firms follow their Malaysian clients overseas on the basis of a developed
relationship. However, successful internationalization requires ECS firms to establish a
‘local presence’ for developing and maintaining sustainable network relationships with
actors in foreign markets.
Recommendation
• It would be advantageous for the Malaysian ECS firms to benefit from a local
presence in targeted foreign markets for improving the access to pertinent market
information, knowledge and expertise. The local presence would better position
the Malaysian ECS firms to draw upon the complementary strength of other actors
in the network as well as to learn from their experiences.
5.5.2.5 Mergers and Acquisitions
The findings of this research revealed that the majority of the Malaysian ECS firms are
small. They therefore lack financial and human resources to expand overseas and
compete in the world markets. Furthermore, Malaysian ECS firms were reluctant to pool
their respective specific competences and strengths and to assist each other through
mutually beneficial arrangements.
Recommendation
• The Malaysian ECS firms need to grow in size in order to benefit from economies
of scale and to improve the access to the financing necessary for venturing abroad.
Since organic growth is too slow, they should give serious considerations to

225
mergers and acquisitions (M&As) to increase their pool of competences and
expertise.
5.5.3 Summary
This Section discussed the implications of the research in respect of policy and practice. It
offered recommendations for considerations by the Malaysian Government towards
enhancing the effectiveness of ECS export support programs. It also offered
recommendations for consideration by the ECS firms in order to make them better placed
to successfully venture abroad.
5.6 Research Limitations
The boundaries of the research were broadly outlined in Section 1.9. During the course
of this research, four other significant limitations became apparent.
The first limitation arises from this research being mainly exploratory and qualitative. It
therefore had to rely on a judgemental interpretation of the findings.
The second limitation relates to the use of quota sampling. While this permitted
participation by various important sub-groups related to the industry, the different group
sizes used in the Questionnaire Survey could have created an element of survey bias.
The third limitation stems from the insufficient number of government representatives in
the Focus Group. This may have distorted the findings of the Focus Group.
The fourth relates to the unplanned data which emerged during the Focus Group meeting.
Since these were not taken into account in the Survey Questionnaire, the researcher
considers this as a limitation.
5.7 Further Research

226
This research presented a pre-paradigmatic body of knowledge that required inductive
theory building as opposed to deductive theory testing. The findings provided added
insights to the gaps in the existing body of knowledge and served to clarify the research
problems. During the course of the research, several issues emerged and this pointed to
the need for further research. This final section of the thesis outlines those areas that merit
further exploration.
Although this research adopted a two stage methodology, it was largely exploratory and
qualitative with a relatively small number of survey participants and a single focus group
meeting. It would therefore not be appropriate to generalize the findings. To achieve this,
it is recommended that a more comprehensive and detailed descriptive study with a larger
survey sample size be conducted in order to offer ideas for further probe and research on
the Modified Internationalization Framework for Malaysian ECS firms which was
developed by this research and depicted in Figure 5.2.
5.8 Conclusion
This final Chapter presents the conclusions based on the research findings for each of the
three Research Propositions and the Research Problem. It then discussed the implications
of the findings and their contributions to theory development and offered a Modified
Internationalization Framework for Malaysian ECS firms. Recommendations were also
offered for consideration by Government policy makers and the senior management of
Malaysian ECS firms. The Chapter then discussed the limitations that emerged during
the course of the research and outlined the opportunities for further research.

227
BIBLIOGRAPHY
Aaby, N-E & Slater, SF 1989, ‘Management influences on export performance : A review
of the empirical literature 1978-88’, International Marketing Review, vol. 6, no. 4, pp. 7-26.
ABET 1999, ‘Criteria for accrediting engineering program. Effective for evaluations
during the 2000-2001 accreditation cycle incorporates all changes approved by the ABET Board of Directors as of November 1, 1999’, Engineering Accreditation Commission, Accreditation Board of Engineering and Technology Inc., Baltimore.
Accenture 2010, Increasing the Contribution of Business & Professional Services to the
Malaysian Economy, Report submitted to Economic Planning Unit, Prime Minister’s Department, Accenture, Kuala Lumpur.
ACEM 2011, ACEM Directory 2010, Association of Consulting Engineers Malaysia
Secretariat, Kuala Lumpur. Agarwal, S & Ramaswami, SN 1992, ‘Choice of foreign market entry mode : Impact of
ownership, location and internationalization factors’, Journal of International Business Studies, vol. 23, no. 1, pp. 1-27.
Aguilera, RV & Dencker,JC 2004, ‘The role of human resource management in cross-
border mergers and acquisitions’, International Journal of Human Resource Management, vol. 15, no. 8, pp. 1355-1370.
Aharoni, Y 1966, The Foreign Investment Decision Process, Havard University Press,
Boston. Ahmad, SZ & Kitchen, PJ 2008, ‘Transnational corporations from Asian developing
countries : The internationalization characteristics and business strategies of Sime Darby Berhad’, International Journal of Business Science and Applied Management, vol. 3, no. 2, pp. 21-36.
Ahmed, PK 1998, ‘Culture and climate for innovation’, European Journal of Innovation
Management, vol. 1, no. 1, pp. 30-43. Ahmed, ZU, Mohamed, O, Johnson, JP & Meng, LY 2002, ‘Export promotion programs
of Malaysian firms : An international marketing perspective’, Journal of Business Research, vol. 55, no. 10, pp. 831-843.
Albaum, G 1983, ‘Effectiveness of government export assistance for US smaller-sized
manufacturers : Some further evidence’, International Marketing Review, vol. 1, no. 1, pp. 68-75.
Albaum, G, & Duerr, E 2008, International Marketing and Export Management, 6th edn,
Prentice Hall, Harlow.

228
Albaum, G & Peterson, RA 1984, ‘Empirical research in international marketing : 1976-
1982’, Journal of International Business Studies, vol. 15, no. 1, pp. 161-173. Andersen, O 1993, ‘On the internationalization process of firms : A critical analysis’,
Journal of International Business Studies, vol. 24, no. 2, pp. 209-231. Andersen, O & Buvik, A 2002, ‘Firms’ internationalization and alternative approaches to
the international customer / market selection’, International Business Review, vol. 11, no. 3, pp. 347-363.
Andersson, S 2000, ‘The internationalization of the firm from an entrepreneurial
perspective’, International Studies of Management & Organization, vol. 30, no. 1, Spring, pp. 63-92.
Andersson, S & Florēn, H 2008, ‘Exploring managerial behavior in small international
firms’, Journal of Small Business and Enterprise Development, vol. 15, no. 1, pp. 31-50.
Andersson, S & Wictor, I 2003, ‘Innovative internationalisation in new firms : Born
globals – the Swedish case’, Journal of International Entrepreneurship, vol. 1, no. 3, pp. 249-276.
Andy, S 2004, ‘Meeting the challenge of outsourcing’, Engineering Management, vol. 14,
no. 3, pp. 34-37. Aris, NM 2006, ‘SMEs : Building blocks for economic growth’, Paper presented at the
National Statistics Conference, Department of Statistics, Malaysia, Kuala Lumpur, 4-5 September, viewed 20 January 2011, <www.statistics.gov.my/portal/images/stories/files/journal/smes.pdf?phpM
yAdmin=HsSjziTw4modEUBul.5AeWr139e>. Asgari, M, Ahmad, SZ & Gurrib, MI 2010, ‘Explaining the internationalization process of
Malaysian service firms’, International Journal of Trade, Economics and Finance, vol. 1, no. 1, pp. 68-73.
Asokkumar KSM 2006, ‘Global positioning of Malaysia’s small and medium enterprises
and the effectiveness of government promotional initiatives’, Paper presented at the National Statistics Conference 2006, Malaysia, 4-5 September.
Austrade 1994, Intelligent Exports and the Silent Revolution in Services, Australian Trade
Commission, Sydney. Axelsson, B & Easton, G eds 1992, Industrial Networks : A New View of Reality,
Routledge, London. Axelsson, B & Johanson, J 1992, ‘Foreign market entry – the textbook vs. the network
view’, in Industrial Networks : A New View of Reality, eds B Axelsson & G Easton, Routledge, London, pp. 218-234.
229
Axinn, CN & Matthyssens, P 2001, ‘Limits of internationalization theories in an
unlimited world’, International Marketing Review, vol. 19, no. 5, pp. 436-449. Baark, E 1999, ‘Engineering consultancy : An assessment of IT-enabled international
delivery of services’, Technology Analysis & Strategic Management, vol. 11, no. 1, pp. 55-74.
Baird, IS, Lyles, MA & Orris, JB 1994, ‘The choice of international strategies by small
business’, Journal of Small Business Management, vol. 32, no. 1, pp. 48-59. Baker, MJ 2000, ‘Writing a literature review’, The Marketing Review, vol. 1, no. 2, pp.
219-247. Barney, J 1991, ‘Firm resources and sustained competitive advantage’, Journal of
Management, vol. 17, no. 1, pp. 99-120. Barney, J 1995, ‘Looking inside for competitive advantage’, Academy of Management
Executive, vol. 9, no. 4, pp. 49-61. Barney, JB 1986, ‘Organizational culture : Can it be a scene of sustained competitive
advantage?’, Academy of Management Review, vol. 11, no. 3, pp. 656-665. Barney, J, Wright, M & Ketchen, DJ 2001, ‘The resource-based view of the firm : Ten
years after 1991’, Journal of Management, vol. 27, no. 6, pp. 625-641. Barrett, NJ & Wilkinson, IF 1985, ‘Export stimulation : A segmentation study of the
exporting problems of Australian manufacturing firms’, European Journal of Marketing, vol. 19, no. 2, pp. 53-72.
Barrett, NJ & Wilkinson, IF 1986, ‘Internationalisation behaviour : Management
characteristics of Australian manufacturing firms by level of international development’, in Research in International Marketing, eds PW Turnbull & SJ Paliwoda, Croom Helm, Kent, pp. 213-233.
Bateson, JEG & Hoffman, KD 1999, Managing Services Marketing : Text and Readings,
4th edn, Dryden, Fort Worth, Taxes. Beamish, PW 1990, ‘The internationalization process for smaller Ontario firms : A
research agenda’, in Research in Global Strategic Management – International Business Research for the Twenty-First Century : Canada’s New Research Agenda, ed. AH Rugman, JAI Press, Greenwich, pp. 77-92.
Becker, GS 1993, Human Capital : A Theoretical and Empirical Analysis with Special
Reference to Education, 3rd edn, University of Chicago Press, Chicago. Bell, J 1995, ‘The internationalization of small computer software firms : A further
challenge to “stage” theories’, European Journal of Marketing, vol. 29, no. 8, pp. 60-75.

230
Bell, J 2005, Doing Your Research Project : A Guide for First-Time Researchers in
Education, Health and Social Science, 4th edn, Open University Press, New York. BEM 2011, ‘Official website : Board of Engineers, Malaysia’, viewed 30 September 2011,
<http: //www.bem.org.my/V3/index.html> Berg, BL 2009, Qualitative Research Methods for Social Sciences, 7th edn, Allyn &
Bacon, Boston, Massachusetts. Bhagawati, JN 1984, ‘Splintering and disembodiment of services and developing nations’,
The World Economy, no. 7, pp. 133-144. Bilkey, WJ 1978, ‘An attempted integration of the literature on the export behaviour of
firms’, Journal of International Business Studies, vol. 9, no. 1, pp. 33-46. Bilkey, WJ & Tesar, G 1977, ‘The export behaviour of smaller-sized Wisconsin
manufacturing firms’, Journal of International Business Studies, vol. 8, no. 1, pp. 93-98.
Bjorkman, I & Kock, S 1995, ‘Social relationships and business networks : The case of
western companies in China’, International Business Review, vol. 4, no. 4, pp. 519-535.
Blankenburg-Holm, D 1995, ‘A network approach to foreign market entry’, in Business
Marketing : An Interaction and Network Perspective, ed K Möller, Kluwer Academic Publications, Boston, Massachusetts, pp. 375-405.
Blankenburg-Holm, D, Eriksson, K & Johanson, J 1996, ‘Business networks and
cooperation in international business relationships’, Journal of Internatiional Business Studies, vol. 27, no. 5, pp. 1033-1053.
Blomstermo, A, Sharma, DD & Sallis, J 2006, ‘Choice of foreign market entry mode in
service firms’, International Marketing Review, vol. 23, no. 2, pp. 211-229. BLS 2010, ‘Occupational employment and wages – May 2009’, Bureau of Labour
Statistics, US Department of Labour, viewed 13 July 2010, <http://www.bls.gov/news.release/pdf/ocwage.pdf>.
Boddewyn, JJ, Halbrich, MB & Perry, AC 1986, ‘Service multinationals :
Conceptualisation, measurement and theory’, Journal of International Business Studies, vol. 17, no. 3, pp. 41-57.
Bonoma, T 1985, ‘Case research in marketing : Opportunities problems, and a process’,
Journal of Marketing Research, vol. 22, no. 2, pp. 199-208. Bontis, N, Crossan, M & Hulland, J 2002, ‘Managing an organization learning system by
aligning stocks and flows’, Journal of Management Studies, vol. 39, no. 4, pp. 437-469.
231
Bouchard, TJ 1976, ‘Unobstrusive measures : An inventory of uses’, Sociological
Methods and Research, vol. 4, pp. 267-300. Bridgewater, S 1999, ‘Networks and internationalization : The case of multinational
corporations entering Ukraine’, International Business Review, vol. 8, pp. 99-118. Brito, CM 2001, ‘Towards an institutional theory of the dynamics of industrial networks’,
Journal of Business & Industrial Marketing, vol. 16, no. 3, pp. 150-166. Brush, C, Edelman, L & Manolova, T 2002, ‘The impact of resources on small firm
internationalization’, Journal of Small Business Strategy, vol. 13, no. 1, pp. 1-17. Bryman, A & Bell, E 2007, Business Research Methods, 2nd edn, Oxford University Press,
New York. Buckley, PJ & Casson, MC 1998, ‘Analyzing foreign market entry strategies : Extending
the internationalization approach’, Journal of International Business Studies, vol. 29, no. 3, pp. 539-561.
Buckley, PJ & Ghauri, P 1993, ‘Introduction and overview’, in The Internationalization
of the Firm : A Reader, eds PJ Buckley & P Ghauri, Academic Press, London, pp. ix-xxi.
Buckley, PJ, Pass, CL & Prescott, K 1992, ‘The internationalization of service firms : A
comparison with the manufacturing sector’, Scandinavian International Business Review, vol. 1, no. 1, pp. 39-55.
Calof, JL & Beamish, PW 1995, ‘Adapting to foreign markets : Explaining
internationalization’, International Business Review, vol. 4, no. 2, pp. 115-131. Calof, JL & Viviers, W 1995, ‘Internationalization behavior of small-and medium-sized
South African enterprises’, Journal of Small Business Management, vol. 33, no. 4, pp. 71-79.
Cameron, R & Molina-Azorin, JF 2010, ‘The use of mixed methods across across seven
business and management fields’, Paper presented at 10th IFSAM World Congress on Justice and Sustainability in the Global Economy, 10th International Federation of Schoolarly Association of Management (IFSAM 2010), Paris, France, 8-18 July.
Capron, L 1999, ‘The long term performance of horizontal acquisitions’, Strategic
Management Journal, vol. 20, no. 11, pp. 987-1018. Carver RH & Nash, JG 2006, Doing Data Analysis with SPSS Version 14, Thomson,
Belmont, California.

232
Casebeer, AL & Verhoef, MJ 1997, ‘Combining qualitative and quantitative research methods : Considering the possibilities for enhancing the study of chronic disease’, Chronic Diseases in Canada, vol. 18, no. 3, pp. 130-135.
Cavaye, ALM 1996, ‘Case study research : A multi-faceted research approach for IS’,
Information Systems Journal, vol. 6, pp. 227-242. Cavusgil, ST 1980, ‘On the internationalization process of firms’, European Research,
vol. 8, November, pp. 273-281. Cavusgil, ST 1983, ‘Public policy implications of research on the export behaviour of
firms’, Akron Business and Economic Review, vol. 14, no. 2, pp. 16-22. Cavusgil, ST 1984a, ‘Organizational characteristics associated with export activity’,
Journal of Management Studies, vol. 22, no. 1, pp. 3-22. Cavusgil, ST 1984b, ‘Differences among exporting firms based on their degree of
internationalization’, Journal of Business Research, vol. 12, no. 3, pp. 195-208. Cavusgil ST & Michael, RC (eds) 1990, International Perspectives on Trade Promotion
and Assistance, Greenwood Press, New York. Cavusgil, ST & Nevin, JR 1981, ‘Internal determinants of export marketing behaviour :
An empirical investigation’, Journal of Marketing Research, vol. 18, February, pp. 114-119.
CBI 2009a, ‘CBI market survey : The engineering services market for offshore and
nearshore outsourcing in the UK’, viewed 6 June 2010, <http://www.cbi.eu/?pag=85&doc=5040&type=mid_document>.
CBI 2009b, ‘CBI market survey : The engineering services market for offshore and
nearshore outsourcing in the EU’, viewed 6 June 2010, <http://www.cbi.eu/?pag=85&doc=5026&type=mid_document>.
Chadee, D & Mattsson, J 1998, ‘Do service and merchandise exporters behave and
perform differrently?’, European Journal of Marketing, vol. 32, no. 9/10, pp. 830-842.
Chan, DCY & Coulthard, M 2005, ‘The challenges facing service exporters : Lessons
from the Victoria based transportation and travel sectors’, Paper presented at the Global Business and Technology Association (GBATA) Conference, Cape Town, South Africa, 8-12 June.
Chan, WK 1996, ‘The General Agreement on Trade in Services – An amateur’s
introduction’, Paper presented at the Hong Kong Coalition of Service Industries Seminar on Liberalisation of Trade in Services, Hong Kong, 9 May, The Bulletin, June, pp. 32.

233
Chanda, R 2002, ‘GATS and its implications for developing countries : Key issues and concerns’, Discussion Paper of the United Nations Department of Economic and Social Affairs, No. 25.
Chandler, AD 1962, Strategy and Structure : Chapters in the History of the American
Industrial Enterprise, MIT Press, Cambridge, Massachusetts. Chelliah, S, Pandian, S, Sulaiman, M & Munusamy, J 2010, ‘The moderating effect of
firm size : Internationalization of small and medium enterprises (SMEs) in the manufacturing sector’, African Journal of Business Management, vol. 4, no. 14, pp. 3096-3109.
Chelvanayagam, HE 1994, ‘Global preparatory meeting for the first consultation on
consulting engineering services-country paper - Malaysia’, Suara Perunding, 3rd Quarter, pp. 7-15.
Chetty, S & Blankenburg-Holm, D 2000, ‘Internationalization of small to medium-sized
manufacturing firms : A network approach’, International Business Review, vol. 9, no. 1, pp. 77-93.
Chetty, SK & Hamilton, RT 1996, ‘The process of exporting in owner – controlled firms’,
International Small Business Journal, vol. 14, no. 2, pp. 12-25. Chiam, TT 2009a, ‘Personal experience and observations of the development of
engineering education and professional practice in Malaysia for the past 50 years’, Jurutera, January, pp. 5-9.
Chiam, TT 2009b, ‘Personal experience and observations of the development of
engineering education and professional practice in Malaysia for the past 50 years (Part 2)’, Jurutera, February, pp. 18-28.
Chiam, TT 2009c, ‘Personal experience and observations of the development of
engineering education and professional practice in Malaysia for the past 50 years (Part 3)’, Jurutera, March, pp. 11-16.
Chin, YW 2010, ‘The future of small and medium enterprises (SMEs) in Malaysia :
Constraints and opportunities’, Project Paper 18, Transforming the Nation : A 20 Year Plan of Action for Malaysia, viewed 15 January 2011, <www.20Yearpoa.org/d/file/projectPapers/Articles1/2010-12-30/p18.pdf>.
Choo, S & Mazzarol, T 2001, ‘An impact on performance of foreign market entry choice
by small and medium-sized enterprises’, Journal of Enterprising Culture, vol. 9, no. 3, pp. 291-312.
Christensen, CH, da Rocha, A & Gertner, RK 1987, ‘An empirical investigation of the
factors influencing exporting success of Brazilian firms’, Journal of International Business Studies, vol. 18, no. 3, pp. 61-77.
Chuah, HT 2009, ‘A new era for engineering’, Jurutera, December, p. 6.

234
Chuah, HT 2010, ‘Engineering mobility, globalization and green technology for a
sustainable future’, IEM 51st Presidential Address, Kuala Lumpur, 17 April. Cicic, M, Patterson, PG & Shoham, A 1999, ‘A conceptual model of the
internationalization of services firms’, Journal of Global Marketing, vol. 12, no. 3, pp. 81-106.
Clark, T, Pugh, DS & Mallory G 1997, ‘The process of internationalization in the
operating firm’, International Business Review, vol. 6, no. 6, pp. 605-623. Clark, T, Rajaratnam, D & Smith, T 1996, ‘Toward a theory of international services :
Marketing intangibles in a world of nations’, Journal of International Marketing, vol. 4, no. 2, pp. 9-28.
Coakes, SJ, Steed, L & Price, J 2008, SPSS : Analysis Without Anguish : Version 15.0 for
Windows, John Wiley & Sons, Milton, Queensland. Coase, RH 1937, ‘The nature of the firm’, Economica, November, pp. 386-405. Cobb, RH 1997, ‘Flexible business networks’, Economic Development Review, vol. 15,
no. 1, pp. 30-32. Collis, J & Hussey, R 2003, Business Research, 2nd edn, Palgrave Macmillan,
Basingstoke. Contractor, FJ, Kundu, SK & Hsu, CC 2003, ‘A three-stage theory of international
expansion : The link between multinationality and performance in the service sector’, Journal of International Business Studies, vol. 34, no. 1, pp. 5-18.
Cook KS & Emerson, RM 1978, ‘Power, equity, commitment in exchange networks’,
American Sociological Review, vol. 43, pp. 721-739. Cooper, DR & Schindler, PS 2006, Business Research Methods, 9th edn, McGraw-Hill,
Boston. Coulthard, M 2005, ‘Mastering international business : Lessons from industry on
developing sustainable service exports’, Working Paper 18/05, Department of Management, Monash University, Australia.
Coulthard, M 2008, ‘Increasing service exports : A key contributor in the growth of the
global knowledge economy’, Paper presented at the Global Business and Technolgy Association (GBATA) Conference, Madrid, Spain, 8-12 July.
Coviello, NE & Martin KAM 1999, ‘Internationalization of service SMEs : An integrated
perspective from the engineering consulting sector’, Journal of International Marketing, vol. 7, no. 4, pp. 43-66.

235
Coviello, NE & McAuley, A 1999, ‘Internationalization and the smaller firm : A review of contemporary empirical research’, Management International Review, vol. 39, no. 3, pp. 223-256.
Coviello, NE & Munro, HJ 1995, ‘Growing the entrepreneurial firm : Networking for
international market development’, European Journal of Marketing, vol. 29, no. 7, pp. 49-61.
Coviello, NE & Munro, H 1997, ‘Network relationships and the internationalization
process of small software firms’, International Business Review, vol. 6, no. 4, pp. 361-386.
Creswell, JW 2003, Research Design : Qualitative, Quantitative and Mixed Methods
Approaches, Sage Publications, Thousand Oaks, California. Creswell, JW 2007, Qualitative Inquiry and Research Design : Choosing Among Five
Approaches, 2nd edn, Sage Publications, Thousand Oaks, California. Creswell, JW & Plano Clark, VL 2007, Designing and Conducting Mixed Methods
Research, Sage Publications, Thousand Oaks, California. Crick, D 1997, ‘UK SMEs’ awareness, use and perceptions of selected government export
assistance programs : An investigation into the effect of the internationalization process’, International Trade Journal, vol. 11, no. 1, pp. 135-167.
Crick, D & Chaudhry, S 1997, ‘Small businesses’ motives for exporting : The effect of
internationalization’, Journal of Marketing Practice : Applied Marketing Science, vol. 3, no. 3, pp. 156-170.
Croasdell, DT, Jennex, M, Yu, Z, Christianson, T, Chakradeo, M & Makdum, W 2003,
‘A meta-analysis of methodologies for research in knowledge management, organizational learning and organizational memory : Five years at HICSS’, in Proceedings of the 36th Hawaii International Conference on System Sciences.
Cyert, RM & March JG (eds) 1963, A Behavioural Theory of the Firms, Prentice-Hall,
Englewood Cliffs, New Jersey. Czinkota, MR 1982, Export Development Strategies : US Promotion Policies, Praeger,
New York. Czinkota, MR 1994, ‘A national export assistance policy for new and growing business’,
Journal of International Marketing, vol. 2, no. 1, pp. 91-101. Czinkota, MR & Ronkainen, IA 2006, International Marketing, Dryden Press, Hinsdale,
IL. Czinkota, MR, Ronkainen, IA & Moffett, MH 2005, International Business, 7th edn,
South-Western, Cincinnati, Ohio.

236
Dale, A, Arber, S & Proctor, M 1988, Doing Secondary Analysis, Unwin Hyman, London. Dalli, D 1994, ‘The exporting process : The evolution of small and medium sized firms
towards internationalization’, Advances in International Marketing, vol. 6, pp. 85-110.
Daly, HE 2001, ‘Globalization and its discontents’, Philosophy & Public Quarterly, vol.
21, no. 2/3, pp. 17-21. Datamonitor 2009, Global Construction and Engineering Industry Report 2009,
Datamonitor Group. David, FR 2005, Strategic Management Concept and Cases, 10th edn, Pearson Education,
New Jersey. Davis, D 2000, Business Research for Decision Making, 5th edn, Duxbury, Pacific Grove,
California. De Noble, AF, Castaldi, RM & Moliver, DM 1989, ‘Export intermediaries : Small
business perceptions of services and performance’, Journal of Small Business Management, vol. 27, no. 2, pp. 33-41.
De Vaus, DA 2002, Surveys in Social Research, 5th edn, Routledge, London. den Dekker, W, Jansen, PGW & Vinkenburg, CJ 2005, ‘Dimensions of an individual
global mindset’, No 14, Series Research Memoranda, Faculty of Economics, Business Administration and Econometrics, VU University Amsterdam.
Denis, JE & Depelteau, D 1985, ‘Market knowledge, diversification and export
expansion’, Journal of International Business Studies, vol. 16, no. 3, pp. 77-89. Denscombe, M 1998, The Good Research Guide for Small-Scale Social Research
Projects, Open University Press, Buckingham. Deshpande, R 1983, ‘“Paradigms lost” : on theory and method in research marketing’,
Journal of Marketing, vol. 47, Fall, pp. 101-110. Denzin, NK 1978, The Research Act : A Theoretical Introduction to Sociological
Methods, 2nd edn, McGraw-Hill, New York. Diamantopoulos, A, Schlegelmilch, BB & Allpress, C 1990, ‘Export marketing research
in practice : A comparison of users and non-users’, Journal of Marketing Management, vol. 6, no. 3, pp. 257-274.
Dichtl, LEM, Leibold, M, Koglmayr, HG & Muller, S 1983, ‘The foreign orientation of
managements as a central construct in export centered decision making processes’, Research for Marketing, vol. 10, pp. 7-14.
237
Diener, E & Crandall, R 1978, Ethics in Social and Behavioral Research, University of Chicago Press, Chicago.
Douglas, SP & Craig, CS 1992, ‘Advances in international marketing’, International
Journal of Research in Marketing, vol. 9, pp. 291-318. Duksaitė, E & Tamošiūnienē, R 2009, ‘Why companies decide to participate in mergers
and acquisition transactions’, Business in XXI Century, vol. 1, no. 3, pp. 21-25. Easterby-Smith, M, Thorpe, R & Lowe, A 2002, Management Research : An Introduction,
2nd edn, Sage Publications, London. Easton, G 1992, ‘Industrial networks : A review’, in Industrial Networks : A New View of
Reality, eds B Axelsson & G Easton, Routledge, London, pp. 3-27. Edge 2011, ‘Malaysia needs talent, but talent is leaving’, The Edge, 2 May, p. 54. Edmunds, SE & Khoury, SJ 1986, ‘Exports : A necessary ingredient in the growth of
small business firms’, Journal of Small Business Management, vol. 24, no. 4, pp. 54-65.
Eisenhardt, KM 1989, ‘Building theories from case study research’, The Academy of
Management Review, vol. 14, no. 4, pp. 532-550. Ekeledo, I & Sivakumar, K 1998, ‘Foreign market entry mode choice of service firms : A
contingency perspective’, Journal of Academy of Marketing Science, vol. 26, no. 4, pp. 274-292.
Ekeledo, I & Sivakumar, K 2004, ‘International market entry mode strategies of
manufacturing firms and service firms : A resource-based perspective’, International Marketing Review, vol. 21, no. 1, pp. 68-101.
Emory, CW & Cooper, DR 1991, Business Research Methods, 4th edn, Irwin, Boston,
MA. Endut, AHA 2007, ‘Innovation and global competitiveness : National technology and
innovative strategy’, Paper presented at the Twelve Civil Service Conference on Enhancing National Competitiveness Through Effective Implementation, Kuala Lumpur, 3 September.
Engwall, L & Wallenstal, M 1988, ‘Tit for tat in small steps : The internationalization of
Swedish banks’, Scandinavian Journal of Management, vol. 4, no. 3/4, pp. 147-155.
ENR 2010, Engineering News-Record, McGraw-Hill Construction News, 26 July. Erramilli, MK 1990, ‘Entry mode choice in service industries’, International Marketing
Review, vol. 7, no. 5, pp. 50-62.

238
Erramilli, MK & Rao, CP 1990, ‘Choice of foreign market entry modes by service firms : Role of market knowledge’, Management International Review, vol. 30, no. 2, pp. 135-150.
Erramilli, MK & Rao, CP 1993, ‘Service firms’ international entry mode choice : A
modified transaction – cost analysis approach’, Journal of Marketing, vol. 57, no. 3, pp. 19-38.
Eshghi, A 1992, ‘Attitude – behaviour inconsistency in exporting’, International
Marketing Review, vol. 9, no. 3, pp. 40-61. Etemad, H & Wright, RW 1999, ‘Internationalization of SMEs : Management responses
to a changing environment’, Journal of International Marketing, vol. 7, no. 4, pp. 4-10.
Festinger, L & Katz, D 1966, Research Methods in the Behavioral Sciences, Holt,
Rinehart & Winston, New York. FIDIC 1998, Engineering Our Future, International Federation of Consulting Engineers,
Switzerland. FIDIC 2002, Industry as a Partner for Sustainable Development : Consulting
Engineering, International Federation of Consulting Engineers, Switzerland. FIDIC 2004, Engineering Our Future 2004, International Federation of Consulting
Engineers, Switzerland. Fina, E & Rugman, AM 1996, ‘A test of internalization theory and internationalization
theory : The Upjohn company’, Management International Review, vol. 36, no. 3, pp. 199-213.
Fok, WP 2007, ‘Internationalization of higher education in Hong Kong’, International
Education Journal, vol. 8, no. 1, pp. 184-193. Fong, CO 1989, The Malaysian Economic Challenge in the 1990s : Transformation for
Growth, Longman, Singapore. Ford, D, Gadde, L-E, Håkansson, H & Snehota, I 2003, Managing Business Relationships,
2nd edn, John Wiley & Sons, Chichester. Gankema, HGJ, Snuif, HR & Zwart, PS 2000, ‘The internationalization process of small
and medium-sized enterprises : An evaluation of stage theory’, Journal of Small Business Management, vol. 38, no. 4, pp. 15-27.
Gay, LR & Diehl, PL 1992, Research Methods for Business and Management, Macmillan,
New York.
239
Gencturk, E & Kotabe, M 2001, ‘The effect of export assistance program usage on export performance : A contingency explanation’, Journal of International Marketing, vol. 9, no. 2, pp. 51-72.
Ghauri, PN & Grønhaug, K 2005, Research Methods in Business Studies : A Practical
Guide, 3rd edn, Financial Times Prentice Hall, London. Ghauri, PN & Buckley, PJ 2003, ‘International mergers and acquisitions : Past, present
and future’, Advances in Mergers and Acquisitions, vol. 2, pp. 207-229. Gill, J & Johnson, P 2010, Research Methods for Managers, 4th edn, Sage Publications,
London. GOHK 1997a, Engineers Registration Ordinance (Chapter 409), Laws of Hong Kong,
viewed 20 February 2012, <www.legislation.gov.hk/blis_pdf.nsf/c3e01cbdb5665a e64825755c00352e38/02274A3BDBFB766E482575EF00047E9F/$FILE/CAP_40
9_e_b5.pdf>. GOHK 1997b, Buildings Ordinance (Chapter 123), Laws of Hong Kong, viewed 20
February 2012, <www.legislation.gov.hk/blis_pdf.nsf/4f0db701c6c25d4a4825755 c00352e35/439979DE5B92D2C948257EE003EBFB6/$FILE/CAP_123_e_65.pdf >. GOM 1967, Registration of Engineers Act 1967 (Revised 2007), Laws of Malaysia Act
138. GOM 2006a, Third Industrial Master Plan 2006–2020 : Malaysia-Towards Global
Competitiveness, Ministry of International Trade and Industry, Percetakan National Malaysia Berhad, Kuala Lumpur.
GOM 2006b, Ninth Malaysia Plan 2006-2010, Economic Planning Unit, Prime Minister
Department, Percetakan Nasional Malaysia Berhad. GOM 2009, Economic Report 2009/2010, Ministry of Finance, Malaysia, Percetakan
Nasional Malaysia Berhad, Kuala Lumpur. GOM 2010a, The Malaysian Economy in Figures 2010, Economic Planning Unit, Prime
Minister’s Department. GOM 2010b, Tenth Malaysia Plan 2011-2015, Economic Planning Unit, Prime
Minister’s Department, Percetakan National Malaysia Berhad, Putrajaya. GOM 2010c, Economic Transformation Programme : A Roadmap for Malaysia,
Performance Management and Delivery Unit (PEMANDU), Prime Minister Department.
GOS 1991, Professional Engineers Act (Chapter 253), Laws of Singapore, viewed 20
February 2012, <app.peb.gov.sg/Html/PROFESSIONAL%20ENGINEERS%20A CT.htm>.

240
GOT 1999, Engineer Act, B.E. 2542 (1999), Laws of Thailand, viewed 20 February 2012,
<thailaws.com/law/t-laws/tlaw0072_6.pdf>. Grant, RM 1996, ‘Toward a knowledge-based theory of a firm’, Strategic Management
Journal, vol. 17, Winter Special Issue, pp. 109-122. Grant, RM 2005, Contemporary Strategy Analysis, 5th edn, Blackwell Publishing, Malden,
Massachusetts. Greene, JC 2007, Mixed Methods in Social Inquiry, Jossey-Bass, San Francisco,
California. Greene, JC & Caracelli, VJ (eds) 1997, Advances in Mixed-Method Evaluation : The
Challenges and Benefits of Integrating Diverse Paradigms, Jossey-Bass, San Francisco, California.
Gregory, RJ 2004, Psychological Testing : History, Principles and Applications, 4th edn,
Pearson, Boston, Massachusetts. Griffin, RW & Pustay, MW 1999, International Business : A Managerial Perspective, 2nd
edn, Addition-Wesley, Reading, Massachusetts. Grönroos, C 1990, Service Marketing and Management, Lexington Books, Lexington,
MA. Grönroos, C 1999, ‘Internationalization strategies for services’, Journal of Services
Marketing, vol. 13, no. 4/5, pp. 290-297. Guba, EG & Lincoln, YS 1994, ‘Competing paradigms in qualitative research’, in
Handbook of Qualitative Research, eds NK Denzin & YS Lincoln, Sage Publications, Thousand Oaks, pp. 105-117.
Gupta, AK & Govindarajan, V 2002, ‘Cultivating a global mindset’, Academy of
Management Executive, vol. 16, no. 1, pp. 116-126. Hair, JF, Anderson, RE, Tatham, RL & Black, WC 1998, Multivariate Data Analysis, 5th
edn, Prentice Hall, Upper Saddle River, New Jersey. Håkansson, H (ed.) 1982, International Marketing and Purchasing of Industrial Goods :
An Interaction Approach, John Wiley & Sons, Chichester. Håkansson, H & Johanson, J 1992, ‘A model of industrial networks’, in Industrial
Networks : A New View of Reality, eds. B Axelsson & G Easton, Routledge, London, pp. 28-34
Håkansson, H & Johanson, J 1993, ‘Networks as a governance structure’, in The
Embedded Firm : The Socio-economics of Industrial Networks, ed. G Grabher, Routledge, London, pp. 35-51.

241
Håkansson, H & Snehota, I (eds) 1995, Developing Relationships in Business Networks,
Routledge, London. Hamdan, MS 1999, ‘Globalisation of engineering services : Challenges for Malaysian
consulting firms’, DBA thesis, Southern Cross University, Lismore, Australia. Hanson, WE, Creswell, JW, Plano Clark, VL, Petska, KS & Creswell, JD 2005, ‘Mixed
methods research designs in counseling psychology’, Journal of Counseling Psychology, vol. 52, no. 2, pp. 224-235.
Hashim, MK & Hassan, R 2008, ‘Internationalization of SMEs : options, incentives,
problems, and business strategy’, Malaysian Management Review, viewed 11 September 2010, <resources.mim.edu.my/mmr/2008/Internationalization%20of%
20SMEs.pdf>. Healy, M & Perry, C 2000, ‘Comprehensive criteria to judge validity and reliability of
qualitative research within the realism paradigm’, Qualitative Market Research : An International Journal, vol. 3, no. 3, pp. 118-126.
Hedges, A 1985, ‘Group Interviewing’, in Applied Qualitative Research, ed. R Walker,
Aldershot, Gower. Heron, J & Reason, P 1997, ‘A participatory inquiry paradigm’, Qualitative Inquiry, vol.
3, no. 3, pp. 274-294. Hicks, TG & Mueller, JF 1996, Standard Handbook of Consulting Engineering Practice,
2nd edn, McGraw-Hill, New York. HICSS 2003, ‘Proceedings of the 36th Hawaii International Conference on System
Sciences’, 6 - 9 January 2003. Highbeam Business 2010, ‘Engineering services’, viewed 13 July 2010, <http://busines s.highbeam.com/industry-reports/business/engineering-services>. Hill, CWL 2009, Global Business Today, 6th edn, McGraw-Hill/Irwin, New York. Hollensen, S 2004, Global Marketing : A Decision - Oriented Approach, Pearson
Education Limited, Harlow. Hook, RC & Czinkota, M 1988, ‘Export activities and prospects of Hawaiian firms’,
International Market Review, vol. 5, no. 4, pp. 51-57. Hopkins, RW 2005, ‘Will the general agreement on trade in services necessitate Federal
involvement in lawyer regulation ? Some constitutional implications of regulating the global lawyer’, University of Pittsburgh Law Review, vol. 66, pp. 653-686.
Hussey, J & Hussey 1997, Business Research, Macmillian, London.

242
IEM 2001, ‘Globalisation & engineers : Yet to rise to the occasion’, Cover story, Jurutera, November, pp. 11-13.
IMF 2000, ‘Globalization : Threat or opportunity?’, Corrected 2002, viewed 17 April
2010, <http: //www.imf.org/external/np/exr/ib/2000/041200to.htm>. ING 2008, The Consulting Engineering Sector in Europe, ING Economics Department,
ING Bank, Netherlands. Iskanius, PMA & Lamminsalo, MT 2005, ‘Networking as a tool for internationalization
of biotechnology SME’s’, Paper presented at the 21st IMP Conference in Rotterdam, Netherland, viewed 1 March 2011, <www.impgroup.org/uploads/pap
ers/4702.pdf>. Jankowicz, AD 2000, Business Research Projects, 3rd edn, Business Press, London. Javalgi, RG, Griffith, DA & White, DS 2003, ‘An empirical examination of factors
influencing the internationalization of services firms’, Journal of Service Marketing, vol. 17, no. 2, pp. 185-201.
Javalgi, RG & Martin, CL 2007, ‘Internationalization of services : Identifying the
building – blocks for future research’, Journal of Services Marketing, vol. 21, no. 6, pp. 391-397.
Javalgi, RG & White, DS 2002, ‘Strategic challenges for the marketing of services
internationally’, International Marketing Review, vol. 19, no. 6, pp. 563-581. Jick, TD 1979, ‘Mixing qualitative and quantitative methods : Triangulation in action’,
Administrative Science Quarterly, vol. 24, no. 4, pp. 602-611. Johanson, J & Mattsson, L-G 1985, ‘Marketing investments and market investments in
industrial networks’, International Journal of Research in Marketing, vol. 2, no. 3, pp. 185-195.
Johanson, J & Mattsson, L-G 1987, ‘Interorganizational relations in industrial systems : A
network approach compared with the transaction – cost approach’, International Studies of Management and Organization, vol. 17, no. 1, pp. 34-48.
Johanson, J & Mattsson, L-G 1988, ‘Internationalization in industrial systems – A
network approach’, in The Internationalization of the Firms : A Reader, eds PJ Buckley & PN Ghauri, Academic Press, London, pp. 303-321.
Johanson, J & Vahlne, J-E 1977, ‘The internationalization process of the firm - A model
of knowledge development and increasing foreign market commitments’, Journal of International Business Studies, vol. 8, Spring/Summer, pp. 23-32.
Johanson, J & Vahlne, J-E 1990, ‘The mechanism of internationalization’, International
Marketing Business, vol. 7, no. 4, pp. 11-24.
243
Johanson, J & Vahlne, J-E 1992, ‘Management of foreign market entry’, Scandinavian International Business Review, vol. 1, no. 3, pp. 9-27.
Johanson, J & Vahlne, J-E 2003, ‘Business relationship learning and commitment in the
internationalization process’, Journal of International Entrepreneurship, vol. 1, no. 1, pp. 83-101.
Johanson, J & Wiedersheim-Paul, F 1975, ‘The internationalizatiion of the firm – Four
Swedish cases’, The Journal of Management Studies, vol. 12, no. 3, pp. 305-322. Johansson, JK & Nonaka, I 1983, ‘Japanese export marketing : Structures, strategies,
counterstrategies’, International Marketing Review, vol. 1, no. 2, pp. 12-25. Johnson, B & Turner, LA 2003, ‘Data collection strategies in mixed methods research’, in
Handbook of Mixed Methods in Social & Behavioral Research, eds A Tashakkori & C Teddlie, Sage Publications, Thousand Oaks, California, pp. 297-319.
Johnson, RB & Onwuegbuzie, AJ 2004, ‘Mixed methods research : A research paradigm
whose time has come’, Educational Researcher, vol. 33, no. 7, pp. 14-26. Johnson, RB, Onwuegbuzie, AJ & Turner, LA 2007, ‘Toward a definition of mixed
methods research’, Journal of Mixed Methods Research, vol. 1, no. 2, pp. 112-133. Johnston, WJ & Czinkota, MR 1982, ‘Managerial motivations as determinants of
industrial export behaviour’, in Export Management : An International Context, eds MR Czinkota & G Tesar, Praeger, New York, pp. 3-17.
Jomo, KS 1990, Growth and Structural Change in the Malaysian Economy, MacMillan
Press, London. Joynt, P & Welch, L 1985, ‘A strategy for small business internationalization’,
International Marketing Review, vol. 2, no. 3, pp. 64-73. Judin, AK 2001, ‘Malaysian professional engineering service industry confronting the
challenges of globalization and liberation’, Paper presented at the Seminar on Exporting Professional Services, Kuala Lumpur, 20 August.
Juul, M & Walters, GP 1987, ‘The internationalization of Norwegian firms – A study of
UK experience’, Management International Review, vol. 27, no. 1, pp. 58-66. Kanapathy, V 2003, ‘Services sector development in Malaysia : Education and health as
alternate sources of growth’, AT120 Research Conference, 20-21 February, viewed 11 September 2010, <www.nomurafoundation.or.jp/data/20030220_21_V
ijayakumari_Kanapathy.pdf>. Karafakioglu, M 1986, ‘Export activities of Turkish manufacturers’, International
Marketing Review, vol. 3, no. 4, pp. 34-43.

244
Katrishen, FA & Scordis, NA 1998, ‘Economics of scale in services : A study of multinational insurers’, Journal of International Business Studies, vol. 29, no. 2, pp. 305-324.
Katsikeas, CS, Leonidou, LC & Morgan, NA 2000, ‘Firm-level export performance
assessment : Review, evaluation, and development’, Journal of the Academy of Marketing Science, vol. 28, no. 4, pp. 493-511.
Kaynak, E & Erol, C 1989, ‘The export propensity of Turkish manufacturing and trading
house firms’, Journal of Marketing Management, vol. 5, no. 2, pp. 211-229. Kedia, BL & Chhokar, J 1986, ‘Factors inhibiting export performance of firms : An
empirical investigation’, Management International Review, vol. 26, no. 4, pp. 33-43.
Kedia, BL & Mukherji, A 1999, ‘Global managers : Developing a mindset for global
competitiveness’, Journal of World Business, vol. 34, no. 3, pp. 230-251. Keegan, WJ & Green, MC 2005, Global Marketing, 4th edn, Pearson Prentice Hall,
Upper Saddle River, New Jersey. Kefalas, AG 1998, ‘Think globally, act locally’, Thunderbird International Business
Review, vol. 40, no. 6, pp. 547-562. Kennedy, A 2005, ‘Entry mode choice in service firms : A review of contemporary
research’, Advances in International Marketing, vol. 15, pp. 119-145. Kerlinger, FN & Lee, HB 2000, Foundation of Behavioral Research, 4th edn, Harcourt
College Publishers, Fort Worth, Texas. Kervin, JB 1999, Methods for Business Research, 2nd edn, Addison-Wesley, Reading,
Massachusett. Kimchi, J, Polivka, B & Stevenson, JS 1991, ‘Triangulation : Operational definations’,
Nursing Research, vol. 40, no. 6, pp. 364-366. Kitzinger, J 1995, ‘Qualitative research : Introducing focus groups’, British Medical
Journal, vol. 311, July, pp. 299-302. Knight, GA & Cavusgil, ST 1996, ‘The born global firm : A challenge to traditional
internationalization theory’, Advances in International Marketing, vol. 8, pp. 11-26.
Knight, J 1997, ‘Internationalization of higher education : A conceptual framework’, in
Internationalization of Higher Education in Asia Pacific Countries, eds J Knight & H de Wit, European Association for International Education, Amsterdam, pp. 5-19.

245
Knight, J 1999, ‘Issues and trends in internationalization : A comparative perspective’, in A New World of Knowledge : Canadian Universities and Globalization, eds S Bond & JP Lemasson, International Development Research Centre, Ottawa, Canada, pp. 201-239.
Knight, J 2002, GATS – Higher Education Implications, Opinions and Questions,
UNESCO, Paris. Knight, J 2003, GATS, Trade and Higher Education : Perspective 2003 – Where are We?,
The Observatory on Borderless Higher Education, London. Knight, J 2004, ‘Internationalization remodeled : Definition, approaches, and rationales’,
Journal of Studies in International Education, vol. 8, no. 1, pp. 5-31. Knight, J 2005, ‘An internationalization model : Responding to new realities and
challenges’, in Higher Education in Latin America : The International Dimension, eds H de Wit, IC Jaramillo, J Gracel-Avila & J Knight, The World Bank, Washington, DC.
Knight, J & de Wit, H 1995, ‘Strategies for internationalization of higher education :
Historical and conceptual perspectives’, in Strategies for Internationalization : A Comparative Study of Australia, Canada, Europe and the United States of America, ed. H de Wit, EAIE, Amsterdam.
Koch, AJ 2001, ‘Factors influencing market and entry mode selection : Developing the
MEMS model’, Marketing Intelligence and Planning, vol. 19, no. 5, pp. 351-361. Kox, H & Lejour A 2004, ‘A different approach to WTO negotiations in services’, CPB
Discussion Paper, No. 36, July, CPB Netherlands Bureau for Economic Policy Analysis, Hague, Netherlands.
Kreitl, G & Oberndorfer, WJ 2004, ‘Motives for acquisitions among engineering
consulting firms’, Construction Management and Economies, vol. 22, no. 7, pp. 691-700.
Kreitl, G, Urschitz, G & Oberndorfer, WJ 2002, ‘Corporate growth of engineering
consulting firms : A European review’, Construction Management and Economies, vol. 20, no. 5, pp. 437-448.
Krueger, RA 1994, Focus Groups : A Practical Guide for Applied Research, 2nd edn,
Sage Publications, Thousand Oaks, California. Kuada, J 2006, ‘Internationalization of firms in developing countries : Towards an
integrated conceptual framework’, Working Paper Series No. 43, International Business Economies, Aalborg University, Denmark.
Kuhn, TS 1970, The Structure of Scientific Revolutions, 2nd edn, University of Chicago
Press, Chicago.
246
Kumcu, E, Harcar, T & Kumcu, ME 1995, ‘Management perceptions of the adequacy of export incentive programmes : Implications for export-led economic development policy’, Journal of Business Research, vol. 32, pp. 163-174.
Lado, AA & Wilson, MC 1994, ‘Human resource systems and sustained competitive
advantage : A competency-based perspective’, Academy of Management Review, vol. 19, no. 4, pp. 669-727.
Lai, MC & Yap, SF 2004, ‘Technology development in Malaysia and the newly
industrializing economies : A comparative analysis’, Asia-Pacific Development Journal, vol. 11, no. 2, pp. 53-80.
Lall, S 1999, ‘Technology policy and competitiveness in Malaysia’, in Technology,
Competitiveness and the State, eds KS Jomo & G Felker, Routledge, London, pp. 148-179.
Leedy, P & Ormrod, J 2005, A Handbook for Teacher Research from Design to
Implementation, Pearson, New Jersey. Leonidou, LC 1995, ‘Export barriers : Non-exporters’ perceptions’, International
Marketing Review, vol. 12, no. 1, pp. 4-25. Leonidou, LC & Katsikeas, CS 1996, ‘The export development process : An integrative
review of empirical models’, Journal of International Business Studies, vol. 27, no. 3, pp. 517-551.
Leonidou, LC, Katsikeas, CS, Palihawadana, D & Spyropoulou, S 2007, ‘An analytical
review of the factors stimulating smaller firms to export : Implications for policy-makers’, International Marketing Review, vol. 24, no. 6, pp. 735-770.
Lewis, J 2003, ‘ Design issues’, in Qualitative Research Practice : A Guide for Social
Science Students and Researchers, eds J Ritchie & J Lewis, Sage Publications, London, pp. 47-76.
Lim, J-S, Sharkey, TW & Kim, KI 1993, ‘Determinants of international marketing
strategy’, Management International Review, vol. 33, no. 2, pp. 103-120. Lincoln, YS & Guba, EG 1985, Naturalistic Inquiry, Sage Publications, Newburry Park,
California. Lincoln, YS & Guba, EG 2000, ‘Paradigmatic controversies, contradictions, and
emerging confluences’, in Handbook of Qualitative Research, eds NK Denzin & YS Lincoln, Sage Publications, Thousand Oaks, California, pp. 163-188.
Ling, SLM 1992, Producer Services Development and Trade : Malaysia and ASEAN in
the Uruguay Round, Producer Services Research Project, Faculty of Economics and Administration, University of Malaya, Kuala Lumpur, Malaysia.

247
Ling, SLM, Abidin, MZ & Heng, LW 2000, Liberalisation and Deregulation of Malaysia’s Services Sector, University of Malaya Press, Kuala Lumpur.
Lommelen T & Matthyssens, P 2005, ‘The internationalization process of service
providers : A literature review’, Advances in International Marketing, vol. 15, pp. 95-117.
Looi, HP 2003, ‘Globalisation and the professional engineering service sector’, Bulletin
Ingenieur, vol. 20, September, pp. 12-18. Lovelock, C & Wirtz, J 2007, Services Marketing : People, Technology, Strategy, 6th edn,
Pearson Prentice Hall, Upper Saddle River, New Jersey. Lovelock, CH & Yip, GS 1996, ‘Developing global strategies for services businesses’,
California Management Review, vol. 38, no. 2, pp. 64-86. Løwendahl, BR 2000, ‘The globalization of professional business service firms : Fad or
genuine source of competitive advantage?’, in Globalization of Services : Some Implications for Theory and Practice, eds Y Aharoni & L Nachum, Routledge, London, pp. 142-162.
Løwendahl, BR 2005, Strategic Management of Professional Service Firms, 3rd edn,
Copenhagen Business School Press, Copenhagen. Madsen, TK & Servais, P 1997, ‘The internationalization of born globals : An
evolutionary process ?’, International Business Review, vol. 6, no. 6, pp. 561-583. Mahajar, AB 2005, ‘Small firms exporting : How effective are government export
assistance programs’, Jurnal Manajemen & Binis Sriwijaya, vol. 3, no. 5, pp. 1-18. Mahajar, AJ & Yunus, MY 2006, ‘The effectiveness of government export assistance
programs on Malaysia small and medium enterprises (SMEs)’, Problems and Perspectives in Management, vol. 1, pp. 58-71.
Mahbob, S 1992, Issues in Recent Malaysian Economic Growth, Arena Ilmu, Kuala
Lumpur. Mahoney, D, Trigg, M, Griffin, R & Pustay, M 2001, International Business : A
Managerial Perspective, 2nd edn, Pearson Education Australia, Frenchs Forest, NSW.
Majaro, S 1988, The Creative Gap : Managing Ideas for Profit, Longman, London. Majluf, LA & Zarrilli, S 2007, Challenging Conventional Wisdom : Development
Implications of Trade in Services Liberalization, Trade Poverty and Cross-Cutting Development Issues Study Series No. 2, United Nations Conference on Trade and Development, United Nations, New York & Geneva.

248
Malhotra, NK 2010, Marketing Research : An Applied Orientation, 6th edn, Pearson Education, Upper Saddle River, New Jersey.
Mani, S 2000, ‘Policy instruments for stimulating R&D in the enterprise sector : The
contrasting experience of two MNC dominated economies from South East Asia’, Discussion paper, Institute for New Technologies, United Nations University, Maastricht.
Mani, S 2004, ‘Government, innovation and technology policy : An international
comparative analysis’, International Journal of Technology and Globalization, vol. 1, no. 1, pp. 29-44.
Manning, M & Munro, D 2007, The Survey Researcher’s SPSS Cookbook, 2nd edn,
Pearson Education, Sydney. Marandu, EE 1995, ‘Impact of export promotion on export performance : A Tanzanian
study’, Journal of Global Marketing, vol. 9, no. 1/2, pp. 9-39. Marimuthu, M, Arokiasamy, L & Ismail, M 2009, ‘Human capital development and its
impact on firm performance : Evidence from developmental economics’, The Journal of International Social Research, vol. 2, no. 8, pp. 265-272.
Marshall, C & Rossman, GB 1999, Designing Qualitative Research, 3rd edn, Sage
Publications, Thousand Oaks, California. Mathison, S 1988, ‘Why triangulate ?’, Educational Researcher, vol. 17, no. 2, pp. 13-17. Maxcy, SJ 2003, ‘Pragmatic threads in mixed methods research in the social sciences :
The search for multiple modes of inquiry and the end of the philosophy of formalism’, in Handbook of Mixed Methods in Social & Behavioral Research, eds A Tashakkori & C Teddlie, Sage Publications, Thousand Oaks, California, pp. 51-89.
Maxfield, MG & Babbie, E 2007, Research Methods for Criminal Justice and
Criminology, 5th edn, Wadsworth, Belmont, California. McAuley, A 1999, ‘Entrepreneurial instant exporters in the Scottish arts and crafts sector’,
Journal of International Marketing, vol. 7, no. 4, pp. 67-82. McDaniel, C & Gates, R 1996, Contemporary Marketing Research, 3rd edn, West
Publishing, St Paul, MN. McGuire, WJ 1985, ‘Attitudes and attitude change’, in Handbook of Social Psychology
Vol. II, eds G Lindzey & E Aronson, 3rd edn, Random House, New York, pp. 233-346.
McMurray, D 2008, Qualitative Research Methods, Study Guide EDU03262, Southern
Cross University, Lismore.

249
Melin, L 1992, ‘Internationalization as a strategy process’, Strategic Management Journal, vol. 13, Special Issue, Winter, pp. 99-118.
Merton, RK, Fiske, M & Kendall, PL 1956, The Focused Interview : A Manual of
Problems and Procedures , Free Press, New York. Miles, MB & Huberman, AM 1984, Qualitative Data Analysis, Sage Publications,
Beverly Hills, California. Miles, MB & Huberman, AM 1994, Qualitative Data Analysis : An Expanded
Sourcebook, Sage Publications, Thousand Oaks, California. Miller, DC 1991, Handbook of Research Design and Social Measurement, 5th edn, Sage
Publications, London. Moggie, L 2000, Keynote address at the Technical Consultancy Development Programme
for Asia and the Pacific, International Conference and Exhibition on Strategies for Globalisation, Kuala Lumpur, 10-13 April.
Morgan, DL 1988, Focus Groups as Qualitative Research, Qualitative Research Methods
Series, Vol. 16, Sage Publications, London. Morgan, DL 1998, ‘Practical strategies for combining qualitative and quantitative
methods : Applications to health research’, Qualitative Health Research, vol. 8, no. 3, pp. 362-376.
Mohamed, E 2010, ‘Impact of globalization on architectural services’, Paper presented at
PAM CPD Seminar 2010, PAM Centre Kuala Lumpur, 2 October, viewed 17 May 2011, <www.pam.org.my/Library/notes/Impact_of_Globalisation.pdf>.
Moini, AH 1998, ‘Small firms exporting : How effective are government export
assistance programs?’, Journal of Small Business Management, vol. 36, no. 1, pp. 1-15.
Molina-Azorin, JF 2007, ‘Mixed methods in strategy research : Applications and
implications in the resource-based view’, Research Methodology in Strategy and Management, vol. 4, no. 1, pp. 37-73.
Morgan, DL 2007, ‘Paradigms lost and pragmatism regained : Methodological
implications of combining qualitative and quantitative methods’, Journal of Mixed Methods Research, vol. 1, no. 1, pp. 48-76.
Morgan, RE & Katsikeas, CS 1997, ‘Theories of international trade, foreign direct
investment and firm internationalization : A critique’, Management Decision, vol. 35, no. 1, pp. 68-78.
Morse, JM 1991, ‘Approaches to qualitative-quantitative triangulation’, Nursing Research,
vol. 40, pp. 120-123.

250
Mowry, S 2007, ‘How important is R&D for Asia?’, Multi Media Manufacturer, July/August, pp. 18-20.
MSTI 2012, Main Science and Technology Indicators, viewed 14 February 2012,
<stats.oecd.org/Index.aspx?DataSetCode=MSTI_PUB>. Mustapha, R & Abdullah, A 2004, ‘Malaysia transitions toward a knowledge-based
economy’, The Journal of Technology Studies, vol. 30, no. 3, pp. 51-61. Nassar-McMillan, SC & Borders, LD 2002, ‘Use of focus groups in survey item
development’, The Qualitative Report, vol. 7, no. 1, viewed 4 January 2011, <http://www.nova.edu/ssss/QR/QR7-1/nassar.html>
National Statement on Ethical Conduct in Human Research (2007), viewed 31 August
2010, <www.nhmrc.gov.au/_files_nhmrc/file/publications/synopses/e72-jul09.pdf >. NEAC 2010, New Economic Model for Malaysia Concluding Part : Strategic Policy
Measures, National Economic Advisory Council, Percetakan National Malaysia Berhad, Kuala Lumpur.
Neuman, WL 2006, Social Research Methods : Qualitative and Quantitive Approaches,
6th edn, Pearson, Boston, MA. Newburry, W & Zeira, Y 1997, ‘Generic differences between equity international joint
ventures (EIJVS), internation acquisitions (IAs) and international greenfield investments (IGIs) : Implications for parent companies’, Journal of World Business, vol. 32, pp. 87-102.
Nga, CL & Tan, LL 2010, ‘The contextual setting for the Malaysian doctoral experience’,
in Doctoral Research in Management & Business in Malaysia, eds P Millar & A Selvanathan, City University Publishing Centre, Petaling Jaya, Malaysia, pp. 7-29.
Norton, E 2007, ‘Glue that holds it all together’, The Edge, 22 October. O’Farrell, PN, Wood, PA & Zheng, J 1998, ‘Regional influences on foreign market
development by business service companies : Elements of a strategic context explanation’, Regional Studies, vol. 32, no. 10, pp. 31-48.
O’Leary, Z 2005, Researching Real–World Problems : A Guide to Methods of Inquiry,
Sage Publications, London. OECD 2002, ‘GATS : The case for open services markets’, Organisation for Economic
Co-operation and Development, Paris. Oesterle, M-J 1997, ‘Time span until internationalization : Foreign market entry as a
built-in mechanism of innovation’, Management International Review, vol. 37, no. 2, pp. 125-149.

251
Ohmae, K 1990, The Borderless World, HarperCollins, New York. Ojanen, V, Salmi, P & Torkkeli, M 2008, ‘Cross-border acquisitions in technical
engineering sector : Motives, trends and effects in Finnish consultancies’, International Journal of Management Science and Engineering Management, vol. 3, no. 2, pp. 151-160.
Okposin, SB, Halim, A & Ong, HB 1999, The Changing Phases of Malaysian Economy,
Asean Academic Press, London. Oppenheim, AN 2000, Questionnaire Design, Interviewing and Attitude Measurement,
Continuum International, London. Overby, JW & Min, S 2001, ‘International supply chain management in an internet
environment : A network-oriented approach to internationalization’, International Marketing Review, vol. 18, no. 4, pp. 392-420.
Palmer, A 1994, Principles of Services Marketing, McGraw-Hill, London. Parkhe, A 1993, ‘“Messy” research, methodological pre-dispositions and theory
development in international joint ventures’, Academy of Management Review, vol. 18, no. 2, pp. 227-268.
Patterson, PG 2004, ‘A study of perceptions regarding service firm’s attitudes towards
exporting’, Australian Marketing Journal, vol. 12, no. 2, pp. 19-38. Patterson, PG & Cicic, M 1995, ‘A typology of service firms in international markets :
An empirical investigation’, Journal of International Marketing, vol. 3, no. 4, pp. 57-83.
Patton, MQ 1990, Qualitative Evaluation and Research Methods, 2nd edn, Sage
Publications, Newbury Park, California. Patton, MQ 2002, Qualitative Research & Evaluation Methods, 3rd edn, Sage
Publications, Thousand Oaks, California. PEMANDU 2010, Government Transformation Programme Roadmap, Performance
Management and Delivery Unit, Prime Minister’s Department, Malaysia. Peng, D 2007, ‘The globalization challenge’, The Edge (Special Focus), 27 August, p.
S10. Peng, MW & Luo, Y 2000, ‘Managerial ties and firm performance in a transition
economy : The nature of micro-macro link’, Academy of Management Journal, vol. 43, no. 3, pp. 486-501.
Penrose, ET 1959, The Theory of the Growth of the Firm, Basil, Blackwell, London.

252
Perry, C 1995, ‘A five chapter PhD thesis’, Research Workshop Handout, Southern Cross University, Lismore, Australia.
Perry, C 2002, ‘A structured approach to presenting thesis : Notes for students and their
supervisors’, Study Guide, Southern Cross University, Lismore. Perry, C, Alizadeh, Y & Riege, A 1997, ‘Qualitative methods in entrepreneurship
research’, in Proceedings, Small Entreprise Association of Australia and New Zealand, 1997 Annual Conference, pp. 547-567.
Perry, C & Coote, L 1994, ‘Processes of a case study research methodology : Tool for
management development?’ Paper presented at the Annual Conference of the Australian and New Zealand Academy of Management, Wellington, New Zealand, December.
Perry, C, Riege, A & Brown, L 1999, ‘Realism’s role among scientific paradigms in
marketing research’, Irish Marketing Review, vol. 12, no. 2, pp. 16-23. Peters, T 1997, The Circle of Innovation, Hodder & Stoughton, London. Pettigrew, AM 1990, ‘Longitudinal field research on change : Theory and practice’,
Organization Science, vol. 1, no. 3, Special Issue, pp. 267-292. Pfeffer, J 1994, Competitive Advantage through People, Havard Business School Press,
Boston. Phillips, EM & Pugh, DS 2005, How to Get A PhD : A Handbook for Students and Their
Supervisors, 4th edn, Open University Press, McGraw-Hill, England. Piercy, NF, Kaleka, A & Katsikeas, CS 1998, ‘Sources of competitive advantage in high
performing exporting companies’, Journal of World Business, vol. 33, no. 4, pp. 378-393.
Ponterotto, JG 2005, ‘Qualitative research in counseling psychology : A primer on
research paradigms and philosophy of science’, Journal of Counseling Psychology, vol. 52, no. 2, pp. 126-136.
Poon, WC 2006, The Development of Malaysian Economy, Pearson Prentice Hall,
Petaling Jaya, Selangor, Malaysia. Porter, ME 1979, ‘How competitive forces shape strategy’, Havard Business Review,
March – April, pp. 137-145. Porter, ME 1980, Competitive Strategy : Techniques for Analyzing Industries and
Competitors, The Free Press, New York. Porter, ME 1985, Competitive Advantage : Creating and Sustaining Superior
Performance, The Free Press, New York.

253
PSDC 2008, Doing Business in the World : A World Factbook of Malaysian Professional Service Exporters, Professional Services Development Corporation Sdn Bhd., Kuala Lumpur.
PSDC 2010, Endeavours : Malaysian Professionals crossing Borders, The Writers’
Publishing Home, Ampang, Selangor. Punch, KF 2005, Introduction to Social Research : Quantitative and Qualitative
Approaches, 2nd edn, Sage Publications, London. Qian, Y 2003, ‘Financial services liberalisation and GATS-analysis of the commitments
under the General Agreement on Trade in Services (GATS) at the World Trade Organization (WTO)’, Paper presented at the 2nd Annual Conference of PECC Finance Forum on Issues and Challenges for Regional Financial Corporation in the Asia-Pacific, Hua Hin, Thailand, 8-9 July.
Quer, D, Claver, E & Andreu, R 2007, ‘Foreign market entry mode in the hotel industry :
The impact of country–and firm-specific factors’, International Business Review, vol. 16, no. 3, pp. 362-376.
Rabino, S 1980, ‘An attitudinal evaluation of an export incentive program : The case of
DISC’, Columbia Journal World Business, vol. 15, Spring, pp. 61-65. Ramaseshan, B & Soutar, GN 1996, ‘Combined effects of incentives and barriers on
firms’ export decisions’, Internatioal Business Review, vol. 5, no. 1, pp. 53-65. Rasiah, R 2010, ‘Catch up in integrated circuits production : Malaysia compared to Korea
and Taiwan’, viewed 23 January 2011, <umcors.um.edu.my/images/events/Oct20 10/FULL-PAPER-Inaugural-Public-Lecture.pdf>. Reid, SD 1981, ‘The decision-maker and export entry and expansion’, Journal of
International Business Studies, vol. 12, Fall, pp. 101-112. Reid, SD 1983, ‘Firm internationalization, transaction costs and strategic choice’,
International Marketing Review, vol. 1, no. 2, pp. 44-56. Rhinesmith, SH 1993, A Manager’s Guide to Globalization : Six Keys to Success in a
Changing World, Irwin, New York. Rimmer, P 1991, ‘The global intelligence corps and world cities : Engineering
consultancies on the move’, in Services and Metropolitan Development : International Perspectives, ed. P Daniels, Routledge, London, pp. 66-106.
Ritchie, J & Lewis, J (eds) 2003, Qualitative Research Practice : A Guide for Social
Science Students and Researchers, Sage Publications, London. Robinson, WI 2007, ‘Theories of globalisation’, in Blackwell Companion to
Globalization, ed. G Ritzer, Blackwell, Oxford, pp. 125-143.

254
Robson, C 2002, Real World Research : A Resource for Social Scientists and Practicioner-Researchers, 2nd edn, Blackwell, Oxford.
Rogers, EM 1962, Diffusion of Innovations, Free Press, New York. Root, FR 1971, ‘The elements of export promotion’, International Trade Forum, July -
September, pp. 118-121. Roscoe, JT 1975, Fundamental Research Statistics for the Behavioral Sciences, 2nd edn,
Holt, Rinehart & Winston, New York. Rothstein, A 1998, ‘Outsourcing : An accelarating global trend in engineering’,
Engineering Management Journal, vol. 10, no. 1, pp. 7-14. Ruzzier, M, Hisrich, RD & Antoncic, B 2006, ‘SME internationalization research : Past,
present, and future’, Journal of Small Business and Enterprise Development, vol. 13, no. 4, pp. 467-497.
Sale, JEM, Lohfeld, LH & Brazil, K 2002, ‘Revisiting the quantitative–qualitative debate :
Implications for mixed – metods research’, Quality and Quantity, vol. 36, pp. 43-53.
Saleh, AS & Ndubisi, NO 2006, ‘An evaluation of SME development in Malaysia’,
International Review of Business Research Papers, vol. 2, no. 1, pp. 1-14. Samiee, S 1999, ‘The internationalization of services : Trends, obstacles and issues’,
Journal of Services Marketing, vol. 13, no. 4/5, pp. 319-328. Samiee, S & Walters, PGP 1990, ‘Influence of firm size on export planning and
performance’, Journal of Business Research, vol. 20, pp. 235-248. Sampson, G & Snape, R 1985, ‘Identifying the issues in trade in services’, The World
Economy, vol. 8, no. 2, pp. 171-181. Saunders, M, Lewis, P & Thornhill, A 2003, Research Methods for Business Students, 3rd
edn, Prentice Hall, Harlow, England. Sauve, P 2002, ‘Trade, education and the GATS : What’s in, what’s out, what’s all the
fuss about ?’, Higher Education Management and Policy, vol. 14, no. 3, pp. 47-92. Sekaran, U 2003, Research Methods for Business : A Skill-Building Approach, 4th edn,
John Wiley, New York. Selvanathan, A 1999, ‘Enhancing technological capabilities in the Malaysian indigenous
electronics industry’, DBA thesis, Southern Cross University, Lismore, Australia. Seringhaus, FHR 1986, ‘The impact of government export marketing assistance’,
International Marketing Review, vol. 3, no. 2, pp. 55-66.

255
Seringhaus, FHR 1987, ‘Export promotion : The role and impact of government services’, Irish Marketing Review, vol. 3, no. 2, pp. 106-116.
Seringhaus, FHR & Rosson, PJ 1990, Government Export Promotion : A Global
Perspective, Routledge, London. Seringhaus, FHR & Rosson, PJ 1991, Export Development and Promotion : The Role of
Public Organizations, Kluwer Academic Publishing, Massachusetts. Shah, SK & Corley, KG 2006, ‘Building better theory by bridging the quantitative–
qualitative divide’, Journal of Management Studies, vol. 43, no. 8, pp. 1821-1835. Sharma, D 1988, ‘Overseas market entry strategy : The technical consultancy firms’,
Journal of Global Marketing, vol. 2, no. 2, pp. 89-110. Sharma, DD & Johanson, J 1987, ‘Technical consultancy in internationalisation’,
International Marketing Review, Winter, pp. 20-29. Silverman, D 1998, ‘Qualitative research : Meanings or practices ?’, Information Systems
Journal, vol. 8, no. 1, pp. 3-20. Sjöholm, F 2002, ‘Educational reforms and challenges in Southeast Asia’, EIJS Working
Paper 152, European Institute of Japanese Studies, Stockholm School of Economics, Stockholm.
SMECM 2011, SME Annual Report 2010 / 2011, viewed 23 February 2012,
<www.smecorp.gov.my/v4/node/460>. Solum, NH & Hubak, M 2004, Country Report : The Norwegian Design Industry, Nordic
Innovation Centre, Norway. Steckler, A, McLeroy, KR, Goodman, RM, Bird, ST & McCormick, L 1992, ‘Toward
integrating qualitative and quantitative methods : An introduction’, Health Education Quarterly, vol. 19, pp. 1-8.
Stewart, DW & Kamins, MA 1993, Secondary Research : Information Sources and
Methods, Applied Social Research Methods Series, Volume 4, 2nd edn, Sage Publications, Newbury Park, California.
Stewart, DW, Shamdasani, PN & Rook, DW 2007, Focus Group : Theory and Practice,
Applied Social Research Methods Series, Volume 20, 2nd edn, Sage Publications, Thousand Oaks, California.
Strauss, AL 1990, Qualitative Analysis for Social Scientists, Cambridge University Press,
Cambridge, UK. Strickner, A & Clarke, T 2006, ‘Five danger signs : The GATS assault on sovereignty and
democracy’, Institute for Agriculture and Trade Policy, Polaris Institute, Ottawa, Canada.

256
Styles, C & Ambler, T 1994, ‘Successful export practice : The UK experience’,
International Marketing Review, vol. 11, no. 6, pp. 23-47. Sullivan, D & Bauerschmidt, A 1998, ‘Common factors underlying incentive to export :
Studies in the European forest products industry’, European Journal of Marketing, vol. 22, no. 10, pp. 41-55.
Syed-Ikhsan, SOS & Rowland, F 2004, ‘Benchmarking knowledge management in a
public organization in Malaysia’, Benchmarking : An International Journal, vol. 11, no. 3, pp. 238-266.
Tambunan, T 2009, ‘Development of SME in Asia’, Center for Industry, SME &
Business Competition Studies, University of Trisakti, viewed 29 January 2011, <202.155.48.50/pusatstudi_industri/pusat%study%20tulus%20tambunan/pusat%st
udi/hasil%20penelitian/2009%20tambunan.pdf>. Tan, LL 2008, ‘The internationalization of Malaysian manufacturing small and medium
enterprises’, DBA thesis, Southern Cross University, Lismore, Australia. Tashakkori, A & Teddlie, C 1998, Mixed Methodology : Combining Qualitative and
Quantitative Approaches, Sage Publications, Thousand Oaks, California. Tashakkori, A & Teddlie, C 2003, ‘The past and future of mixed methods research : From
data triangulation to mixed model designs’, in Handbook of Mixed Methods in Social & Behavioral Research , eds A Tashakkori & C Teddlie, Sage Publications, Thousand Oaks, California, pp. 671-701.
Taylor, SJ & Bogdan, R 1998, Introduction to Qualitative Research Methods : A
Guidebook and Resource, 3rd edn, John Wiley & Sons, New York. Teddlie, C & Tashakkori, A 2003, ‘Major issues and controversies in the use of mixed
methods in the social and behavioral sciences’, in Handbook of Mixed Methods in Social & Behavioral Research, eds A Tashakkori & C Teddlie, Sage Publications, Thousand Oaks, California, pp. 3-50.
Terpstra, V & Sarathy, R 2000, International Marketing, 8th edn, Dryden Press, Forth
Worth, Texas. Thompson, A, Strickland, A & Gamble, J 2007, Crafting & executing Strategy : The
Quest for Competitive Advantage, McGraw-Hill Irwin, New York. Thorelli, HB 1986, ‘Networks : Between markets and hierarchies’, Strategic Management
Journal, vol. 7, no. 1, pp. 37-51. Ticehurst, GW & Veal, AJ 1999, Business Research Methods : A Managerial Approach,
Addison Wesley Longman, Australia.

257
Trow, M 1957, ‘Comment on participant observation and interviewing’, Human Organization, vol. 16, no. 3, pp. 33-35.
Turnbull, P, Ford, D & Cunningham, M 1996, ‘Interaction, relationships and networks in
business markets : An evolving perspective’, Journal of Business & Industrial Marketing, vol. 11, no. 3/4, pp. 44-62.
Turnbull, PW 1987, ‘A challenge to the stages theory of the internationalization process’,
in Managing Export Entry and Expansion, eds PJ Rosson & SD Reid, Praeger, New York, pp. 21-40.
Turnbull, PW & Valla, J-P 1986, Strategies for International Industrial Marketing,
Croom Helm, London. Turnbull, PW & Wilson, D 1989, ‘Developing and protecting profitable customer
relationships’, Industrial Marketing Management, vol. 18, no. 1, pp. 1-6. UISE 2011, UNESCO Institute for Statistics in EdStats, 2011, viewed 14 February 2012,
<web.worldbank.org/WBSITE/EXTERNAL/TOPICS/EXTEDUCATION/EXTDA TASTATISTICS/EXTEDSTATS/0,,contentMDK:22614780 ͂menuPK:7196605 ͂>. UNCTAD 2000, World Investment Report 2000 : Cross-border Mergers and Acquisitions
and Development, United Nations Conference on Trade and Development, United Nations, New York.
UNCTAD 2002, The Tradability of Consulting Services and Its Implications for
Developing Countries, United Nations Conference on Trade and Development, United Nations, New York & Geneva.
UNDP 2010, Human development reports : International human development indicators,
United Nations Development Programme, viewed 7 February 2011, <hdrstats.undp.org/en/indicators/38006.html>.
USPTO 2009, ‘Patents by country, state, and year-all patent types’, United States Patent
& Trademark Office, viewed 30 January 2011, <www.uspto.gov/web/offices/a c/ido/oeip/taf/cst_all.htm>. USTR 2010, 2010 National Trade Estimate Report on Foreign Trade Barriers, United
States Trade Representative, viewed 9 September 2010, <http://www.ustr.gov/site s/default/files/uploads/reports/2010/NTE/NTE_COMPLETE_WITH_APPENDno nameack.pdf>. Van de Ven, A 1992, ‘Suggestions for studying strategy processes : A research note’,
Strategic Management Journal, vol. 13, Summer, pp. 169-188. Van Maanen, J 1982, ‘Introduction’, in Varieties of Qualitative Research, eds J Van
Maanen, JM Debbs & RR Faulkner, Sage Publications, Beverly Hills, California, pp. 11-29.

258
Vaughn, S, Schumm, JS & Sinagub, J 1996, Focus Group Interviews in Education and Psychology, Sage Publications, Thousand Oaks, California.
Vida, I & Fairhurst, A 1998, ‘International expansion of retail firms : A theoretical
approach for future investigation’, Journal of Retailing and Consumer Services, vol. 5, no. 3, pp. 143-151.
Warf, B 1996, ‘International engineering services 1982-92’, Environment and Planning A,
vol. 28, pp. 667-686. Welch, D & Welch, L 1996, ‘The internationalization process and networks : A strategic
management perspective’, Journal of International Marketing, vol. 4, no. 3, pp. 11-28.
Welch, LS & Luostarinen R 1988, ‘Internationalization : Evolution of a concept’, Journal
of General Management, vol. 14, no. 2, pp. 34-55. Welch, LS & Luostarinen R 1993, ‘Internationalization : Evolution of a concept’, in The
Internationalization of the Firm : A Reader, eds PJ Buckley & P Ghauri, Academic Press, London, pp. 155-171.
Welch, LS & Wiedersheim-Paul, F 1979, ‘Export promotion policy – A new approach’,
Australian Journal of Management, vol. 4, no. 2, pp. 165-177. Wells, P 1994, ‘Ethics in business and management research’, in Principles and Practice
in Business and Management Research, eds VJ Wass & PE Wells, Aldershot, Dartmouth, pp. 277-297.
Westhead, P, Wright, M, Ucbasaran, D & Martin, F 2001, ‘International market selection
strategies by manufacturing and services firms’, Entrepreneurship and Regional Development, vol. 13, no. 1, pp. 17-46.
Wiedersheim-Paul, F, Olson, HC & Welch, LS 1978, ‘Pre-export activity : The first step
in internationalization’, Journal of International Business Studies, vol. 9, no. 1, pp. 47-58.
Wild, JJ, Wild, KL & Han, JCY 2006, International Business : The Challenges of
Globalization, 3rd edn, Pearson Prentice Hall, Upper Saddle River, New Jersey. Wilkinson, S 1999, ‘Focus groups’, Psychology of Women Quarterly, vol. 23, pp. 221-
244. Williamson, OE 1971, ‘The vertical integration of production : Market failure
considerations’, American Economic Review, vol. 61, pp. 112-123. Williamson, OE 1976, ‘The economics of internal organization : Exit and voice in
relation to markets and hierarchies’, American Economic Review, vol. 66, no. 2, pp. 369-377.

259
Windrum, P, Reinstaller, A & Bull, C 2009, ‘The outsourcing productivity paradox : Total outsourcing, organizational innovation, and long run productivity growth’, Journal of Evolutionary Economics, vol. 19, no. 2, pp. 197-229.
Winsted, KF & Patterson, PG 1998, ‘Internationalization of services : The service
exporting decision’, The Journal of Services Marketing, vol. 12, no. 4, pp. 294-311.
Wong, HT 2000, ‘Prospects for greater utilization of services from TCDPAP countries’,
Paper presented at International Conference and Exhibition on Technical Consultancy Services, Strategies for Globalisation, Kuala Lumpur, 10-12 April.
Wong, SW 2011, ‘Plugging the talent leak’, The Star, 27 May, p. 40. World Bank 2011, Malaysia Economic Monitor : Brain Drain, Washington. Wright, PM & McMahan, G 1992, ‘Theoretical perspectives for strategic human
resources management’, Journal of Management, vol. 18, no. 2, pp. 295-320. WTO 2001, GATS – Fact and Fiction, World Trade Organisation, Geneva, Switzerland. WTO 2007, Legal Texts : The Results of the Uruguay Round of Multilateral Trade
Negotiations, World Trade Organization, Publications Sales Department, Geneva, Switzerland.
WTO 2008, Understanding The WTO, World Trade Organization, Geneva, Switzerland. Yang, R 2003, ‘Globalisation and higher education development : A critical analysis’,
International Review of Education, vol. 49, no. 3-4, pp. 269-291. Yardley, L & Bishop, F 2008, ‘Mixing qualitative and quantitative methods : A pragmatic
approach’, in The Sage Handbook of Qualitative Research in Psychology, eds C Willig & W Stainton-Rogers, Sage Publications, Thousand Oaks, California, pp. 352-369.
Yin, RK 2003, Applications of Case Study Research, Applied Social Research Methods
Series, Volume 34, 2nd edn, Sage Publications, Thousand Oaks, California. Yin, RK 2009, Case Study Research : Design and Methods, Applied Social Research
Methods Series, Volume 5, 4th edn, Sage Publications, Thousand Oak, California. Yogeesvaran, K 2004, ‘Transparency and accountability for the result of government
policies and programs’, Paper presented at the International Forum on National Visions and Strategies, Santiago, Chile, 25-27 July.
Young, S, Huang, C & McDermott, M 1996, ‘Internationalization and competitive catch-
up processes : Case study evidence on Chinese multinational enterprise’, Management International Review, vol. 36, no. 4, pp. 295-314.

260
Yusof, ZA & Bhattasali, D 2008, ‘Economic growth and development in Malaysia : Policy making and leadership’, Working Paper No. 27, Commission on Growth and Development, The World Bank.
Yusoff, MB, Hasan, FA & Jalil, SA 2000, ‘Globalisation, economic policy, and equity :
The case of Malaysia’, Paper presented at the Conference on Poverty and Income Inaquality in Developing Countries : A Policy Dialogue on the Effects of Globalization, OECD Development Centre, Paris, 30 November – 1 December.
Zeithaml, VA & Bitner, MJ 1996, Services Marketing, McGraw-Hill, London. Zikmund, WG 2000, Business Research Methods, 6th edn, Dryden Press, Fort Worth,
Texas. Zikmund, WG, Babin, BJ, Carr, JC & Griffin M 2010, Business Research Method, 8th edn,
South-Western, Canada.

261
APPENDIX A
DISCUSSION GUIDE
FOCUS GROUP
THE INTERNATIONALIZATION OF MALAYSIAN ENGINEERING CONSULTING SERVICES FIRMS
(A) INTRODUCTION:
• Introduction of the researcher and roles. • Personal introduction of participants, their background and business. • Aim and format of the focus group. • Conventions (confidentiality, speak one at a time, everybody’s views, open
debate, recordings and report of proceeding). (B) DISCUSSION TOPICS / ISSUES: (I) The Malaysian engineering consulting services (ECS) firms are well positioned for
global competitive advantage in the liberalizing global markets. (1) Malaysian ECS industry can no longer be protected by national legislations
with the implementation of the General Agreement on Trade in Services (GATS) which is liberalizing global markets.
(2) The bigger, older established international ECS firms are better placed to
enter the Malaysian engineering consulting market following the implementation of GATS.
(3) The Malaysian ECS industry has the competences, expertise and strengths
to compete effectively in a liberalizing world. (4) Malaysian ECS industry is well prepared to take advantage of emerging
new market opportunities with the implementation of GATS. (II) The Malaysian Government has effective support policies and programmes to
assist Malaysian ECS firms with their internationalization efforts. (5) The Malaysian Government has an effective policy framework to promote
the interests of the domestic ECS industry.

262
(6) The Malaysian Government is actively promoting new international market
penetration effort by Malaysian ECS firms. (7) The existing funding support and incentives provided by the Government
enable the Malaysian ECS industry to more effectively compete in the international markets.
(8) The Malaysian Government collaborates closely with Malaysian ECS
industry in devising new policies and support measures for increasing the international competitive positioning of Malaysian ECS industry.
(III) The exporting Malaysian firms have appropriate strategies for successfully
entering new international markets. (9) The Malaysian ECS firms are actively formulating and implementing
internationalization strategies. (10) The Malaysian ECS firms have competent staff with an international and
entrepreneurial orientation to take advantage of emerging international marketing opportunities.
(11) The Malaysian ECS industry places emphasis on human capital
development and knowledge management to stay abreast of the technological changes impacting on the ECS.
(12) The Malaysian ECS firms have appropriate mechanisms for pooling the
specific competencies for jointly bidding for international projects on a consortium basis.
(C) SUMMING UP

263
APPENDIX B
INFORMATION SHEET
FOCUS GROUP
THE INTERNATIONALIZATION OF MALAYSIAN ENGINEERING CONSULTING SERVICES FIRMS
My name is Wong Wai Wah and I am conducting research as part of my Doctor of Business Administration (DBA) degree at Southern Cross University, Australia. My thesis is investigating the critical success factors and the impact of strategic issues on the successful internationalization of Malaysian engineering consulting services firms. I am inviting selected informed individuals to participate in the Focus Group meeting as part of this study and would welcome and appreciate your participation. I believe your participation will contribute useful and valuable information for the research. Overview of the Research:
The Malaysian engineering consulting services (ECS) sector will be gradually liberalized under the impact of the General Agreements on Trade in Services and Asean Free Trade in Services. The Malaysian ECS firms will face intense competition in the domestic market from both the local and foreign players. On top of that, the Malaysian ECS market has not been growing since the Asian Financial Crises in 1997/1998. This necessitates the Malaysian ECS firms to strategize by seeking new avenues for growth, sustainability and survival.
My research aims to determine the competitive positioning of the Malaysian ECS firms in the face of globalization and to identify the appropriate strategies for successful entry into new international markets. The findings of this research will lead to recommendations for Malaysian ECS firms to be better prepared for successful competition in the global economy. Procedures of the Focus Group Meeting: The Focus Group meeting will take approximately 90 minutes and will be held at a date, time and place to be determined later.

264
The forum will provide an opportunity for all 8 participants to share their views, opinions and issues facing Malaysian ECS firms as they internationalize. Participation is on a voluntary basis and no financial remuneration or incentive will be offered for taking part. Refreshments and light snacks will be served, however, travel expenses or any other costs associated for participation will not be reimbursed. Responsibilities of the Researcher: As the facilitator and moderator for the focus group meeting, I will ensure that the discussion remains focused and I will clarify and summaries key points where required and appropriate. To ensure confidentiality, apart from utilizing your name and contact details for the invitation for participation, your name and other identifying information will not be attached in the data collected. As a participant, you will be required to sign a consent form. The consent form outlines your permission to utilize the information collected in the focus group meeting as part of this study, without identifying you or your organization. All signed consent forms will be held in safe storage for a period of seven years before being destroyed. The research findings may be submitted for publication. All data collected will be presented as overall data and participating organizations will only be referred to as cases with numbers. The results of the research will be made available as part of the Final Thesis through the Southern Cross University library.
Responsibilities of the Participants: Your responsibility in participating in this research involves your time, opinions, ideas and views about the research topic. There is no risk associated to participants in this research. You will be free to leave and withdraw consent without any explanation at any time. Research Results: The research findings may be submitted for publication. All data collected will be presented as overall data. The results of the research will be made available as part of the Final Thesis at the Southern Cross University library. As a participant, you are entitled to the feedback and the summary results of the research. If you wish to receive the summary results, please provide your e-mail address or mailing address (confidential) as indicated in the consent form. Enquiries: The form is yours to keep for future reference. Please feel free to contact us should you require any additional information or have any queries:

265
Researcher Candidate Wong Wai Wah c/o City University College of Science and Technology Phone: +6012-9594181 E-Mail: [email protected]
Supervisor
Professor Dr A. Selvanathan Deputy Vice Chancellor (Research and Internationalization) City University College of Science and Technology Telephone: +6012-2231664 E-Mail: [email protected]
This research has been approved by the Human Research Ethics Committee at Southern Cross University. The approval number is ECN-10-223. If you have concerns about the ethical aspects of this research or the researcher, please write to the following: The Ethics Complaints Officer Southern Cross University PO Box 157 Lismore NSW 2480 Email: [email protected] All information is confidential and will be handled as soon as possible.

266
APPENDIX C
CONSENT FORM - FOCUS GROUP AS PART OF A DOCTOR OF BUSINESS ADMINISTRATION (DBA)
RESEARCH THESIS
Title of research project: The Internationalization of Malaysian Engineering Consulting Services Firms
Name of researcher: Wong Wai Wah
Name of Supervisor: Prof. Dr A Selvanathan, Deputy Vice Chancellor (Research and Internationalization) City University College of Science and Technology Telephone: +6012-2231664 E-Mail: [email protected] Tick ( √ ) the box that applies, sign and date and give to the researcher
* I agree to take part in this Southern Cross University research project Yes No
* I understand the information that has been provided to me by the Researcher in relation to my participation Yes No
* I agree to be interviewed by the researcher Yes No * I agree to make myself available for further interview if required Yes No * I understand that my participation is voluntary Yes No
* I understand that I can choose not to participate in part or all of this research at any time, without negative consequence to me Yes No
* I understand that any information that may identify me, will be de-identified at the time of analysis of any data. Yes No
* I understand that all information gathered in this research is confidential.
It will be kept securely and confidentially for 7 years at the University. Yes No
* I am aware that I can contact the supervisor or researcher at any time with any queries Yes No
* I understand that the ethical aspects of this research have been approved by the SCU Human Research Ethics Committee Yes No

267
Participant’s Name
Signature
Date
If you wish to receive the summary results of the research, please provide your email address or mail address (confidential) below : Email :
Mailing Address :

268
APPENDIX D
INFORMATION SHEET
QUESTIONNAIRE
THE INTERNATIONALIZATION OF MALAYSIAN ENGINEERING CONSULTING SERVICES FIRMS
My name is Wong Wai Wah and I am conducting research as part of my Doctor of Business Administration (DBA) degree at Southern Cross University, Australia. My thesis is investigating the critical success factors and the impact of strategic issues on the successful internationalization of Malaysian engineering consulting services firms. I am inviting selected informed individuals to participate in the questionnaire survey as part of this study and would welcome and appreciate your participation. I believe your participation will contribute useful and valuable information for the research. Overview of the Research:
The Malaysian engineering consulting services (ECS) sector will be gradually liberalized under the impact of the General Agreements on Trade in Services and Asean Free Trade in Services. The Malaysian ECS firms will face intense competition in the domestic market from both the local and foreign players. On top of that, the Malaysian ECS market has not been growing since the Asian Financial Crises in 1997/1998. This necessitates the Malaysian ECS firms to strategize by seeking new avenues for growth, sustainability and survival.
My research aims to determine the competitive positioning of the Malaysian ECS firms in the face of globalization and to identify the appropriate strategies for successful entry into new international markets. The findings of this research will lead to recommendations for Malaysian ECS firms to be better prepared for successful competition in the global economy.

269
Procedures of the Questionnaire Survey: The questionnaire comprises 12 questions which have been cast as statements. Each statement relates to an issue which is pertinent to the research. In order to measure your responses, a five-point Likert scale is used. There are five boxes ranging from ‘Strongly Disagree’ to ‘Strongly Agree’ for each statement. Please tick the appropriate box for your answer. Based on an earlier pre-testing of the questionnaire, it is estimated that you would require no more than 15 minutes in total to complete all the questions. After you have completed the questionnaire, please return the questionnaire to us in the enclosed self-addressed and stamped envelope or by returned e-mail. Participation is purely voluntary and no financial remuneration or incentive will be offered for taking part in this research. There are no travel expenses, nor are there any costs associated with participation in this research apart from your time. Responsibilities of the Researcher:
It is our duty to make sure that any information given by you is protected. To ensure confidentiality, apart from utilizing your name and contact details for the invitation for participation, your name and other identifying information will not be attached in the data collected. The returned questionnaire is an implied consent that you have given your permission to utilize the information collected in the survey as part of this study, without identifying you or your organization. All returned questionnaire will be held in safe storage for a period of seven years before being destroyed. Responsibilities of the Participants:
Your responsibility in participating in this research involves your time, opinions, ideas and views about the research topic. If there is anything that might unduly affect your response to the statements in the questionnaire, you can decline to answer. There is no risk associated to you in this research. You are free to withdraw and to discontinue participation at any time without explanation. However, we would appreciate you letting us know your decision. Research Results The research findings may be submitted for publication. All data collected will be presented as overall data. The results of the research will be made available as part of the Final Thesis at the Southern Cross University library. As a participant, you are entitled to the feedback and the summary results of the research. If you wish to receive the summary results, please provide your e-mail address or mailing address (confidential) as indicated in the front page of the survey questionnaire.

270
Enquiries: The form is yours to keep for future reference. Please feel free to contact us should you require any additional information or have any queries: Researcher Candidate Wong Wai Wah c/o City University College of Science and Technology Phone: +6012-9594181 E-Mail: [email protected]
Supervisor
Professor Dr A. Selvanathan Deputy Vice Chancellor (Research and Internationalization) City University College of Science and Technology Telephone: +6012-2231664 E-Mail: [email protected]
This research has been approved by the Human Research Ethics Committee at Southern Cross University. The approval number is ECN-10-223. If you have concerns about the ethical aspects of this research or the researchers, please write to the following: The Ethics Complaints Officer Southern Cross University PO Box 157 Lismore NSW 2480 Email: [email protected] All information is confidential and will be handled as soon as possible.

271
APPENDIX E
THE SURVEY QUESTIONNAIRE
THE INTERNATIONALIZATION OF MALAYSIAN ENGINEERING CONSULTING SERVICES FIRMS
INSTRUCTIONS: Please read carefully and complete the appropriate sections. Upon completing the survey, please return the survey sealed in the self-addressed and stamped envelope provided. (A) Your Organization Please Tick ( √ ) only One Box: Government / Regulatory Body Consulting Firm Contracting Firm (B) Your Position in Your Organization: (C) If you wish to have the summary results of this research, please provide your e-
mail address or mailing address (confidential) as indicated below:
E-mail :
Mailing Address :

272
INSTRUCTIONS: Please rate how strongly you agree or disagree with each of the following statements by placing a tick ( √ ) in the appropriate box. RESEARCH PROPOSITION 1: The Malaysian Engineering Consulting Services (ECS) firms are well positioned for global competitive advantage in the liberalizing global markets. STATEMENT 1 Malaysian ECS industry can no longer be protected by national legislations with the implementation of the General Agreement on Trade in Services (GATS) which is liberalizing global markets.
STATEMENT 2 The bigger, older established international ECS firms are better placed to enter the Malaysian engineering consulting market following the implementation of GATS.
STATEMENT 3 The Malaysian ECS industry has the competences, expertise and strengths to compete effectively in a liberalizing world.
STATEMENT 4 Malaysian ECS industry is well prepared to take advantage of emerging new market opportunities with the implementation of GATS.
1 2 3 4 5
Strongly Disagree
Disagree
Uncertain
Agree
Strongly Agree
1 2 3 4 5
Strongly Disagree
Disagree
Uncertain
Agree
Strongly Agree
1 2 3 4 5
Strongly Disagree
Disagree
Uncertain
Agree
Strongly Agree
1 2 3 4 5
Strongly Disagree
Disagree
Uncertain
Agree
Strongly Agree

273
RESEARCH PROPOSITION 2: The Malaysian Government has effective targeted support policies and programmes to assist Malaysian ECS firms with their internationalization effort. STATEMENT 5 The Malaysian Government has an effective policy framework to promote the interests of the domestic ECS industry.
STATEMENT 6 The Malaysian Government is actively promoting new international market penetration effort by Malaysian ECS firms.
STATEMENT 7 The existing funding support and incentives provided by the Government enable the Malaysian ECS industry to more effectively compete in the international markets.
STATEMENT 8 The Malaysian Government collaborates closely with Malaysian ECS industry in devising new policies and support measures for increasing the international competitive positioning of Malaysian ECS industry.
1 2 3 4 5
Strongly Disagree
Disagree
Uncertain
Agree
Strongly Agree
1 2 3 4 5
Strongly Disagree
Disagree
Uncertain
Agree
Strongly Agree
1 2 3 4 5
Strongly Disagree
Disagree
Uncertain
Agree
Strongly Agree
1 2 3 4 5
Strongly Disagree
Disagree
Uncertain
Agree
Strongly Agree

274
RESEARCH PROPOSITION 3:
The exporting Malaysian ECS firms have appropriate strategies for successfully entering new international markets. STATEMENT 9
The Malaysian ECS firms are actively formulating and implementing internationalization strategies.
STATEMENT 10
The Malaysian ECS firms have competent staff with an international and entrepreneurial orientation to take advantage of emerging international marketing opportunities.
STATEMENT 11
The Malaysian ECS industry places emphasis on human capital development and knowledge management to stay abreast of the technological changes impacting on the ECS.
STATEMENT 12
The Malaysian ECS firms have appropriate mechanisms for pooling the specific competencies for jointly bidding for international projects on a consortium basis.
Thank you for your participation!
Please remember to mail the survey back in the self-addressed and stamped envelope.
1 2 3 4 5
Strongly Disagree
Disagree
Uncertain
Agree
Strongly Agree
1 2 3 4 5
Strongly Disagree
Disagree
Uncertain
Agree
Strongly Agree
1 2 3 4 5
Strongly Disagree
Disagree
Uncertain
Agree
Strongly Agree
1 2 3 4 5
Strongly Disagree
Disagree
Uncertain
Agree
Strongly Agree

275
APPENDIX F
HUMAN RESEARCH ETHICS COMMITTEE (HREC)
NOTIFICATION
To: Professor A. Selvanathan/Wong, Wai Wah Graduate College of Management [email protected],[email protected]
From: Secretary, Human Research Ethics Committee Division of Research, R. Block Date: 23 December 2010 Project: The Internalization of Malaysian Engineering Consulting Services Firms.
Approval Number ECN-10-223 The Southern Cross University Human Research Ethics Committee has established, in accordance with the National Statement on Ethical Conduct in Human Research – Section 5/Processes of Research Governance and Ethical Review, a procedure for expedited review by a delegated authority. Your application has been considered by the HRESC, Tweed Heads/GC and has now been approved. Please note that this approval is subject to the usual standard conditions of approval. Standard Conditions in accordance with the National Statement on Ethical Conduct in Human Research (National Statement) (NS). 1. Monitoring NS 5.5.1 – 5.5.10 Responsibility for ensuring that research is reliably monitored lies with the
institution under which the research is conducted. Mechanisms for monitoring can include:
(a) reports from researchers; (b) reports from independent agencies (such as a data and safety monitoring
board);
T (61 2) 6620 3000 F (61 2) 6620 3700 PO Box 157 Lismore NSW 2480 Australia www.scu.edu.au ABN 41 995 651 524

276
APPENDIX F
(c) review of adverse event reports; (d) random inspections of research sites, data, or consent documentation; and (e) interviews with research participants or other forms of feedback from them. The following should be noted:
(a) All ethics approvals are valid for 12 months unless specified otherwise. If research is continuing after 12 months, then the ethics approval MUST be renewed. Complete the Annual Report/Renewal form and send to the Secretary of the HREC.
(b) NS 5.5.5
Generally, the researcher/s provide a report every 12 months on the progress to date or outcome in the case of completed research specifically including: • The maintenance and security of the records. • Compliance with the approved proposal. • Compliance with any conditions of approval. • Any changes of protocol to the research.
Note: Compliance to the reporting is mandatory to the approval of this research. (c) Specifically, that the researchers report immediately and notify the HREC, in
writing, for approval of any change in protocol. NS 5.5.3 (d) That a report is sent to HREC when the project has been completed. (e) That the researchers report immediately any circumstance that might affect
ethical acceptance of the research protocol. NS 5.5.3 (f) That the researchers report immediately any serious adverse events/effects on
participants. NS 5.5.3 2. Research conducted overseas
NS 4.8.1 – 4.8.21 That, if research is conducted in a country other than Australia, all research
protocols for that country are followed ethically and with appropriate cultural sensitivity.
T (61 2) 6620 3000 F (61 2) 6620 3700 PO Box 157 Lismore NSW 2480 Australia www.scu.edu.au ABN 41 995 651 524

277
APPENDIX F
3. Complaints
NS 5.6.1 – 5.6.7 Institutions may receive complaints about researchers or the conduct of research, or
about the conduct of a Human Research Ethics Committee (HREC) or other review body. Complaints may be made by participants, researchers, staff of institutions, or others. All complaints should be handled promptly and sensitively. Complaints about the ethical conduct of this research should be addressed in writing to the following: Ethics Complaints Officer HREC Southern Cross University PO Box 157 Lismore, NSW, 2480 Email: [email protected] All complaints are investigated fully and according to due process under the National Statement on Ethical Conduct in Human Research and this University. Any complaint you make will be treated in confidence and you will be informed of the outcome. All participants in research conducted by Southern Cross University should be advised of the above procedure and be given a copy of the contact details for the Complaints Officer. They should also be aware of the ethics approval number issued by the Human Research Ethics Committee.
Sue Kelly Prof Bill Boyd HREC Administration Chair, HREC Ph: (02) 6626 9139 Ph: 02 6620 3650 E. [email protected] E. [email protected]
T (61 2) 6620 3000 F (61 2) 6620 3700 PO Box 157 Lismore NSW 2480 Australia www.scu.edu.au ABN 41 995 651 524

278
APPENDIX G
QUESTIONNAIRE SURVEY RESPONSES (RAW DATA)
No. Group S1 S2 S3 S4 S5 S6 S7 S8 S9 S10 S11 S12
1 1 2 2 2 2 1 2 2 1 3 3 3 2
2 1 4 4 3 2 2 2 2 2 4 4 4 2
3 1 4 5 2 4 1 2 2 3 4 2 2 4
4 1 2 4 2 2 2 2 2 2 2 3 2 2
5 1 2 4 2 2 2 2 1 1 2 2 2 2
6 1 4 5 4 4 4 2 2 2 2 4 4 4
7 1 4 4 2 2 2 4 3 2 2 3 4 2
8 1 4 4 4 4 4 4 4 4 3 4 4 4
9 1 2 4 2 4 2 4 2 2 3 4 2 2
10 1 4 4 3 3 2 2 2 2 2 2 2 2
11 1 4 5 4 4 3 3 3 3 3 4 4 4
12 1 4 4 3 3 2 2 3 3 2 4 3 3
13 1 4 5 4 3 3 3 3 3 4 4 3 3
14 1 4 4 3 2 2 2 2 3 3 4 4 2
15 1 4 4 3 2 3 2 2 2 4 4 4 2
16 1 2 4 4 4 4 2 4 4 4 4 3 4
17 1 2 4 5 4 3 4 2 3 4 4 3 3
18 1 3 4 4 4 2 2 2 4 4 4 4 4
19 1 4 3 4 4 3 4 3 4 4 4 3 4
20 1 4 3 3 2 2 3 3 2 2 4 3 2
21 1 4 5 2 2 2 4 2 2 2 2 2 4
22 1 2 3 2 4 3 3 3 3 4 3 4 4
23 1 5 4 2 3 3 3 2 4 4 2 2 4
24 1 4 4 4 3 2 4 3 3 4 4 4 4
25 1 4 4 4 4 4 4 3 4 4 4 4 4
26 1 4 4 3 3 2 2 2 2 2 2 3 2
27 1 4 4 4 4 3 4 2 4 4 3 4 4
28 1 4 4 3 3 3 3 3 4 3 3 3 3
29 1 4 3 3 3 3 3 3 3 4 3 3 3
30 1 4 4 2 2 2 4 2 4 2 3 2 2
31 1 4 4 4 3 2 4 2 2 2 4 3 3
32 1 4 4 3 3 2 2 2 3 2 3 3 3
33 1 4 4 4 2 3 2 2 2 4 3 2 2
34 1 4 5 3 4 3 3 3 3 4 3 3 3
35 1 3 4 2 2 2 2 2 2 4 4 4 4
36 1 3 4 4 3 2 2 2 2 4 3 4 3
37 1 2 4 2 2 1 1 1 2 2 2 4 3
38 1 3 4 3 3 3 2 2 3 4 4 4 4
39 1 3 4 4 4 4 4 4 3 4 4 4 4
40 1 4 4 4 4 3 3 3 3 4 4 4 4

279
QUESTIONNAIRE SURVEY RESPONSES (RAW DATA)
No. Group S1 S2 S3 S4 S5 S6 S7 S8 S9 S10 S11 S12
41 1 3 4 3 2 4 4 2 3 4 4 4 4
42 1 2 3 4 4 3 3 4 3 4 4 4 4
43 1 4 2 5 4 3 3 3 3 4 4 4 4
44 1 4 5 5 5 3 2 2 3 4 4 4 3
45 1 4 4 4 4 2 2 2 2 3 4 4 4
46 1 3 3 4 4 3 3 3 3 3 4 4 4
47 1 1 3 2 2 1 1 1 3 2 4 4 2
48 1 4 4 2 2 1 2 1 3 2 4 3 4
49 1 3 4 4 3 3 3 3 3 3 4 4 4
50 1 2 4 4 2 4 4 1 4 2 4 4 4
51 1 4 5 3 3 3 3 2 2 3 2 4 3
52 1 4 4 3 3 3 2 2 2 2 2 3 4
53 1 4 2 4 4 2 3 1 3 3 4 3 3
54 1 4 5 5 4 3 3 3 5 3 4 4 4
55 1 4 4 4 4 3 3 3 3 2 2 4 3
56 1 2 4 2 2 3 2 2 3 2 2 2 2
57 1 4 4 3 3 3 3 3 3 3 4 3 3
58 1 3 4 4 4 4 2 2 3 3 3 4 4
59 1 4 4 4 5 4 5 4 4 4 3 3 4
60 1 2 5 4 2 2 2 2 2 2 4 2 2
61 2 4 2 2 2 2 4 2 2 2 2 2 2
62 2 2 5 5 5 3 1 1 1 3 4 3 3
63 2 4 4 3 4 4 2 2 3 3 3 4 2
64 2 3 2 4 3 5 4 4 4 4 4 4 4
65 2 4 3 2 2 2 2 2 2 3 3 4 2
66 2 4 5 2 2 1 2 1 2 4 4 2 1
67 2 4 5 4 4 3 3 3 4 3 3 4 4
68 2 3 3 2 2 2 2 2 2 2 2 2 2
69 2 4 5 3 3 3 4 4 4 3 3 4 4
70 2 4 5 4 4 3 4 3 3 4 4 3 4
71 2 4 4 4 3 3 4 3 3 3 4 3 2
72 2 5 4 4 4 3 3 3 3 4 4 3 3
73 2 4 5 3 1 1 1 1 1 2 3 4 4
74 2 4 3 2 3 2 3 2 2 2 3 2 4
75 2 4 5 4 4 2 2 2 3 3 4 4 4
76 2 4 3 4 4 2 3 2 2 3 4 2 3
77 2 2 4 1 2 2 2 1 2 3 2 4 2
78 2 4 4 4 4 4 4 4 4 4 5 4 4
79 2 2 4 4 4 2 2 2 2 3 4 2 2
80 2 1 1 1 1 5 4 2 4 5 5 2 2

280
QUESTIONNAIRE SURVEY RESPONSES (RAW DATA)
No. Group S1 S2 S3 S4 S5 S6 S7 S8 S9 S10 S11 S12
81 2 5 3 4 3 2 3 1 2 4 4 4 2
82 2 3 3 4 3 2 2 2 2 2 1 3 2
83 2 5 4 4 4 3 3 3 3 4 4 3 3
84 2 5 2 3 3 2 4 2 3 4 4 4 4
85 2 3 2 4 3 2 3 2 2 3 4 3 2
86 2 5 5 3 1 1 1 1 2 1 2 3 1
87 2 5 4 4 4 3 3 3 3 3 4 4 3
88 2 4 4 2 3 3 3 3 3 3 3 3 4
89 2 5 4 4 3 2 2 2 3 2 3 3 4
90 2 3 5 3 3 2 2 3 3 2 4 2 2
91 2 3 4 4 4 3 3 3 3 4 4 4 4
92 2 4 5 3 3 2 2 1 2 3 3 3 2
93 2 4 4 3 4 3 2 3 2 3 4 3 3
94 2 3 3 4 5 3 2 2 2 4 4 4 4
95 2 4 3 4 4 2 2 3 3 4 5 3 4
96 2 5 4 3 3 2 2 1 3 3 1 4 3
97 2 3 4 4 2 1 1 1 1 2 3 3 2
98 2 4 5 3 3 4 4 3 3 4 3 3 4
99 2 5 5 3 4 2 3 1 2 2 4 3 3
100 2 4 3 4 3 3 4 3 3 4 4 4 4
101 2 4 4 4 4 3 4 3 3 4 4 4 3
102 2 3 4 4 3 3 2 2 3 4 4 2 4
103 2 4 4 4 4 3 3 3 3 4 3 4 4
104 2 4 4 4 2 2 2 2 3 3 4 2 2
105 2 4 4 3 2 2 2 3 2 2 2 3 3
106 2 4 5 5 5 2 2 2 2 2 2 3 2
107 2 4 4 4 4 2 2 1 1 4 3 2 2
108 2 3 4 4 4 3 3 3 3 4 4 4 4
109 2 2 2 5 5 1 2 2 2 3 4 1 4
110 2 3 4 4 3 3 2 2 3 2 3 3 3
111 2 5 4 4 4 2 2 3 2 3 4 3 4
112 2 4 4 2 3 4 2 2 2 3 3 3 3
113 2 4 4 4 3 4 3 3 4 4 4 4 4
114 2 4 4 2 3 3 2 3 3 2 3 5 3
115 2 4 4 4 3 3 4 3 2 2 3 4 4
116 2 3 4 4 3 4 4 3 4 4 4 2 4
117 2 4 4 4 4 3 4 3 4 4 4 4 4
118 2 4 4 4 3 3 4 2 2 4 4 4 3
119 2 4 3 2 2 1 2 2 2 3 4 2 4
120 2 4 4 4 4 3 5 2 4 4 4 2 2
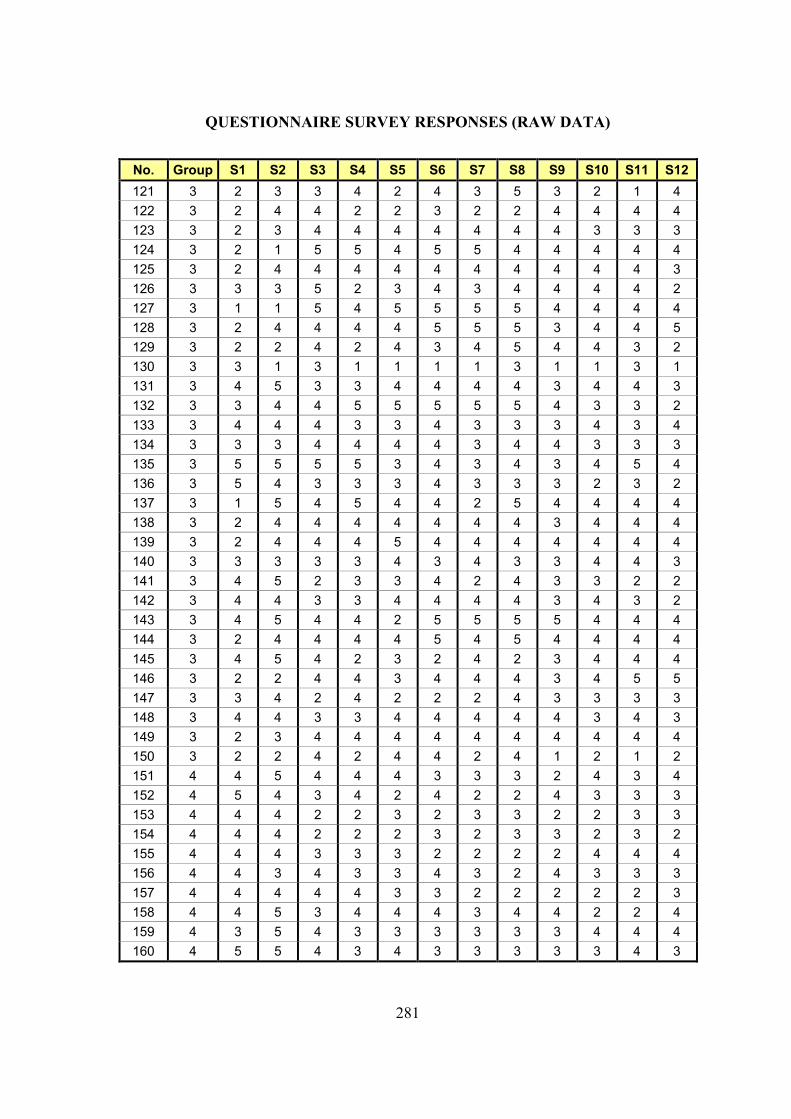
281
QUESTIONNAIRE SURVEY RESPONSES (RAW DATA)
No. Group S1 S2 S3 S4 S5 S6 S7 S8 S9 S10 S11 S12
121 3 2 3 3 4 2 4 3 5 3 2 1 4
122 3 2 4 4 2 2 3 2 2 4 4 4 4
123 3 2 3 4 4 4 4 4 4 4 3 3 3
124 3 2 1 5 5 4 5 5 4 4 4 4 4
125 3 2 4 4 4 4 4 4 4 4 4 4 3
126 3 3 3 5 2 3 4 3 4 4 4 4 2
127 3 1 1 5 4 5 5 5 5 4 4 4 4
128 3 2 4 4 4 4 5 5 5 3 4 4 5
129 3 2 2 4 2 4 3 4 5 4 4 3 2
130 3 3 1 3 1 1 1 1 3 1 1 3 1
131 3 4 5 3 3 4 4 4 4 3 4 4 3
132 3 3 4 4 5 5 5 5 5 4 3 3 2
133 3 4 4 4 3 3 4 3 3 3 4 3 4
134 3 3 3 4 4 4 4 3 4 4 3 3 3
135 3 5 5 5 5 3 4 3 4 3 4 5 4
136 3 5 4 3 3 3 4 3 3 3 2 3 2
137 3 1 5 4 5 4 4 2 5 4 4 4 4
138 3 2 4 4 4 4 4 4 4 3 4 4 4
139 3 2 4 4 4 5 4 4 4 4 4 4 4
140 3 3 3 3 3 4 3 4 3 3 4 4 3
141 3 4 5 2 3 3 4 2 4 3 3 2 2
142 3 4 4 3 3 4 4 4 4 3 4 3 2
143 3 4 5 4 4 2 5 5 5 5 4 4 4
144 3 2 4 4 4 4 5 4 5 4 4 4 4
145 3 4 5 4 2 3 2 4 2 3 4 4 4
146 3 2 2 4 4 3 4 4 4 3 4 5 5
147 3 3 4 2 4 2 2 2 4 3 3 3 3
148 3 4 4 3 3 4 4 4 4 4 3 4 3
149 3 2 3 4 4 4 4 4 4 4 4 4 4
150 3 2 2 4 2 4 4 2 4 1 2 1 2
151 4 4 5 4 4 4 3 3 3 2 4 3 4
152 4 5 4 3 4 2 4 2 2 4 3 3 3
153 4 4 4 2 2 3 2 3 3 2 2 3 3
154 4 4 4 2 2 2 3 2 3 3 2 3 2
155 4 4 4 3 3 3 2 2 2 2 4 4 4
156 4 4 3 4 3 3 4 3 2 4 3 3 3
157 4 4 4 4 4 3 3 2 2 2 2 2 3
158 4 4 5 3 4 4 4 3 4 4 2 2 4
159 4 3 5 4 3 3 3 3 3 3 4 4 4
160 4 5 5 4 3 4 3 3 3 3 3 4 3
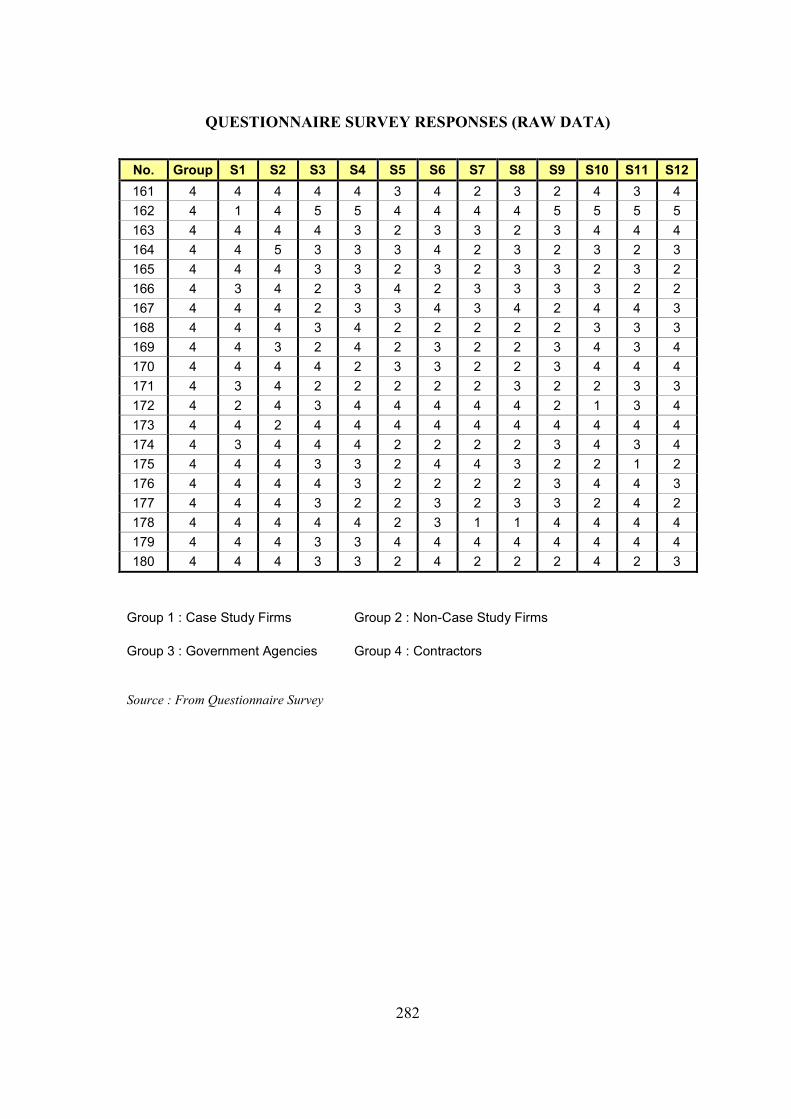
282
QUESTIONNAIRE SURVEY RESPONSES (RAW DATA)
No. Group S1 S2 S3 S4 S5 S6 S7 S8 S9 S10 S11 S12
161 4 4 4 4 4 3 4 2 3 2 4 3 4
162 4 1 4 5 5 4 4 4 4 5 5 5 5
163 4 4 4 4 3 2 3 3 2 3 4 4 4
164 4 4 5 3 3 3 4 2 3 2 3 2 3
165 4 4 4 3 3 2 3 2 3 3 2 3 2
166 4 3 4 2 3 4 2 3 3 3 3 2 2
167 4 4 4 2 3 3 4 3 4 2 4 4 3
168 4 4 4 3 4 2 2 2 2 2 3 3 3
169 4 4 3 2 4 2 3 2 2 3 4 3 4
170 4 4 4 4 2 3 3 2 2 3 4 4 4
171 4 3 4 2 2 2 2 2 3 2 2 3 3
172 4 2 4 3 4 4 4 4 4 2 1 3 4
173 4 4 2 4 4 4 4 4 4 4 4 4 4
174 4 3 4 4 4 2 2 2 2 3 4 3 4
175 4 4 4 3 3 2 4 4 3 2 2 1 2
176 4 4 4 4 3 2 2 2 2 3 4 4 3
177 4 4 4 3 2 2 3 2 3 3 2 4 2
178 4 4 4 4 4 2 3 1 1 4 4 4 4
179 4 4 4 3 3 4 4 4 4 4 4 4 4
180 4 4 4 3 3 2 4 2 2 2 4 2 3
Group 1 : Case Study Firms Group 2 : Non-Case Study Firms
Group 3 : Government Agencies Group 4 : Contractors
Source : From Questionnaire Survey

283
APPENDIX H
MINUTES OF FOCUS GROUP MEETING
Date : 28 July 2011 Time : 3.00 pm – 5.30 pm Venue : ACEM Conference Room (2nd Floor) 63-2 & 65-2 Medan Setia 1 Damansara Heights 50490 Kuala Lumpur Attendees : 9 persons (names removed for reason of anonymity in line with ethical
requirements)
Issues
Salient Points
1)
• It is the trend that the Government intends to open up the Malaysian
market. • The Malaysian ECS industry is small compared to other industries. • In GATS, there is no classification for engineering services. It is
parked under construction. • Government has other bigger issues to consider and to weigh the
benefits. If necessary, it can sacrifice the small Malaysian ECS industry for greater benefits of other important industries.
• Agreed to Statement 1 because we are forced to. • USA is requesting Malaysian Government to liberalize its
procurement.

284
Issues
Salient Points
2)
• Foreign ECS firms are already here. They will come if there are
major projects. • They are mobile. Typical characteristics of the service industry. • In terms of competition from foreign firms, it is neutral as service
procurement is still very much depended on personal relationship. • The operation of foreign ECS firms is not full scale. Just one foreign
expatriate and the rest are hired locally including signing for authority submission. Foreign input as and when required.
• Foreign ECS firms from first world country take the high end of the
project while the firms from the less developed countries will take the low end. Malaysian ECS firms will get stuck in the middle and nowhere to go.
• Competition is expected from China, India, Indonesia and
Philippines. • Foreign firms here have the network to outsource to third world
countries at lower cost. • Foreign ECS firms learn to be localized to compete with local firms. • Statement 2 is agreed. Malaysian ECS firms have to go out in order
not to get stuck in the middle.
3) & 4)
• Agreed, but the major problem is that Malaysian ECS firms have no
finance and no money to compete. • Government does not have a coherent policy to support. • The Act is an impediment as Malaysia ECS firms cannot be owned
by the public. • FIDIC recognized that the future ECS markets are in Middle East,
China and South East Asia. • Asian ECS firms are competitive compared to European firms and
are able to offer low cost solutions using better technology.

285
Issues
Salient Points
3) & 4)
(cont…d)
• Malaysian engineers are equally good compared to European
engineers. • Malaysian ECS firms are at a disadvantage due to size limitation and
weak financial resources. Difficult to compete with large foreign firms and have difficulty to raise performance bond.
• Malaysian mindset still has old school of thought where business and
professionalism are mixed. • Malaysian Act is used to protect the profession resulting in reduced
competitive advantage. • Act needs to change to support the profession. However, the Boards
including BEM, BAM and BQSM are very defensive. The Board is creating the Act and not the Act creates the Board. Act should not be used to protect the practice but to protect the public. The Act only protects if one is weak. There is a lot of vested interest in the Boards which are difficult to change. The learn society / institution is far from practice and profession.
• Act must recognize the separation of business and professionalism. • Malaysian ECS industry is hindered by the Act. • Malaysian ECS firms should go out. Malaysian engineers are too
complacent. Fees are good and projects are given. Therefore there is no incentive to go out and compete. However, Malaysians are not mobile.
• Malaysian standard of education is declining. We have a narrow
window to be ahead of others. The opportunity is fast closing. In 10 year time, we will be taken over by other developing 3rd world countries as the current competent engineers will be retired.
• The Malaysian ECS markets are shrinking but the CEs are increasing
in number. There is insufficient cake to go by. • Past policy is acting against the profession now instead of promoting
it.
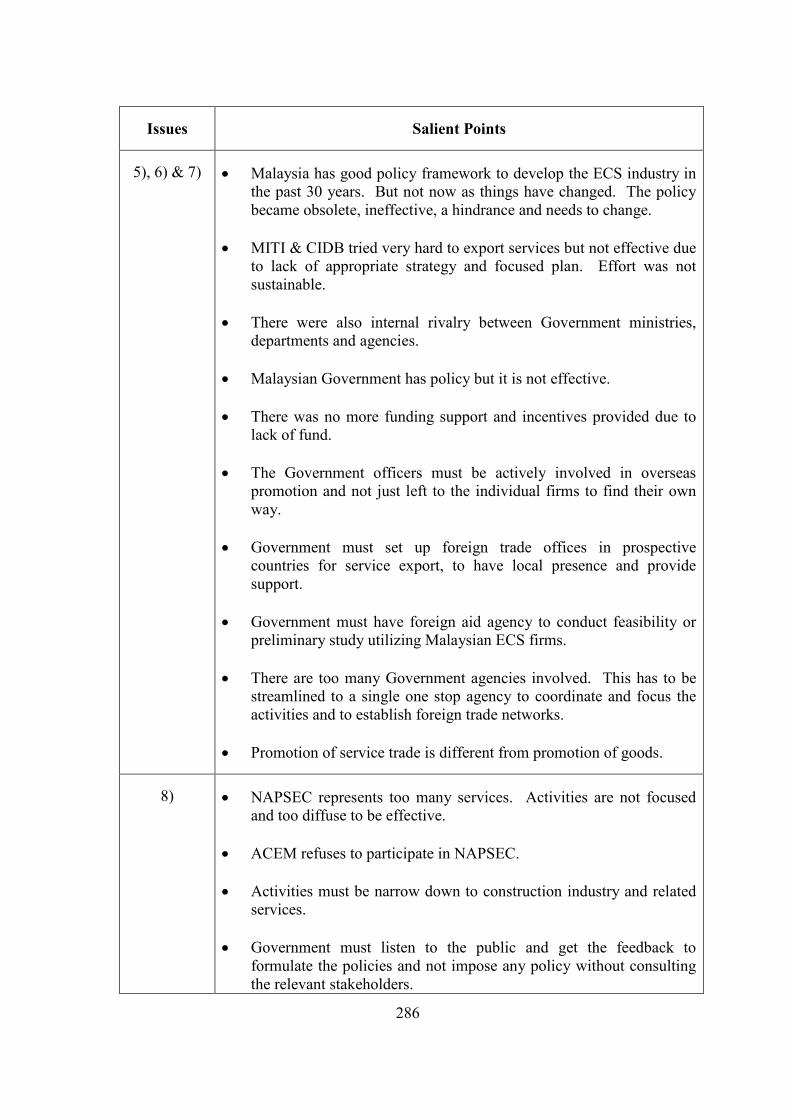
286
Issues
Salient Points
5), 6) & 7)
• Malaysia has good policy framework to develop the ECS industry in the past 30 years. But not now as things have changed. The policy became obsolete, ineffective, a hindrance and needs to change.
• MITI & CIDB tried very hard to export services but not effective due
to lack of appropriate strategy and focused plan. Effort was not sustainable.
• There were also internal rivalry between Government ministries,
departments and agencies. • Malaysian Government has policy but it is not effective. • There was no more funding support and incentives provided due to
lack of fund. • The Government officers must be actively involved in overseas
promotion and not just left to the individual firms to find their own way.
• Government must set up foreign trade offices in prospective
countries for service export, to have local presence and provide support.
• Government must have foreign aid agency to conduct feasibility or
preliminary study utilizing Malaysian ECS firms. • There are too many Government agencies involved. This has to be
streamlined to a single one stop agency to coordinate and focus the activities and to establish foreign trade networks.
• Promotion of service trade is different from promotion of goods.
8)
• NAPSEC represents too many services. Activities are not focused and too diffuse to be effective.
• ACEM refuses to participate in NAPSEC. • Activities must be narrow down to construction industry and related
services. • Government must listen to the public and get the feedback to
formulate the policies and not impose any policy without consulting the relevant stakeholders.

287
Issues
Salient Points
8) (cont…d)
• However, if all are invited, then the purpose is defeated and the ECS industry is too minor to speak compared to other service industries.
• Often, the Government does not listen to the industry. • According to the Government study, the service industries that are
projected to have high growth are: 1) health and 2) engineering. • Engineering ECS industry is small but has a lot of spin off e.g.
construction, manufacturing, education, etc. • Construction is treated a strategic industry in some countries.
9) & 10)
• Malaysian ECS firms adopt client following strategy and not market seeking in the service export.
• Malaysian ECS firms do not implement network strategy due to
absence of physical presence in foreign countries. • Malaysian ECS firms do not have strategy to enter foreign market. • The method is touch and go or hit and run approach. • Any coordinated strategy among ECS industry players has to be
organized by the Government. At the moment, individual ECS firms try to enter the market on their own and are therefore weak.
• Any foreign involvement without appropriate strategy will ultimately
lead to failure of the expansion endeavour. • However, having a strategy in foreign expansion will not necessary
lead to success. • Engineers are trained to be a technocrat but they are bad businessman
and poor entrepreneur. • They work from bottom up. First as engineer, then they grow into
the business and end up in management where they learn to manage. • Engineers are protected by the Act to only work as engineers, be
professional and competent and not in management. The emphasis is on ethics and professionalism.

288
Issues
Salient Points
9) & 10)
(cont…d)
• Malaysian does not like to go overseas. Culture may be a factor. It also depends on the compensation and reward.
• For foreign expansion, the ECS firms have to be selective in
entering. Preferably to choose those with least psychic distance and have similar cultural background.
11)
• Must choose the countries to enter where we have competitive advantage with low risk especially with good or similar legal institutions. ECS firms must learn how to manage risk.
• Consultancy industry emphasizes on knowledge and knowledge
management. It is a knowledge driven industry. New knowledge is continually generated and emerged all the times. Engineers must assimilate the new knowledge and use it all the times.
• Marketing also requires knowledge. • Engineers lack soft skill. • The productivity of Malaysian engineers is low compared to western
engineers. This will somewhat negate the lower factor cost. • The Government system does not encourage competition. • Engineers lack the skill in pricing their products. • Malaysian engineers are not geared for competition. They are
technically sound but weak in financial knowledge to make management or business decision.
12)
• Engineers are egocentric. • PSDC at one time tried to form cluster of consultants to bid for
overseas projects. There was no follow up activities. Consulting engineers are too egoistic as everyone tries to be the leader in the team.
• It is best that the team members are of similar size and strength so
that personnel ego does not come into the picture. • Locks in the middle, the Malaysia ECS firms have no opportunity to
move up.