the international imperative: why should we care so oecd ... · 540 550 560 570 580 2003 2003 2003...
TRANSCRIPT

OECD EMPLOYER
BRAND
Playbook
1
The International
Imperative: Why
Should We Care So
Much About Other
Countries’ Education
Systems?
National Conference of
State Legislatures:
Legislative Summit
Seattle, August 2015
Yuri Belfali
Head, Early Childhood and
Schools Division
OECD

Fig II.3.3
International comparisons matter:
2
To understand where you stand, how others are performing, and what strong performers are doing:
By sailing to different countries…
and looking at the world through…
PISA TALIS
Adult Skills Survey
Etc.

3 PISA in brief
• Over half a million students…– representing 28 million 15-year-olds in 65 countries/economies
… took an internationally agreed 2-hour test…– Goes beyond testing whether students can
reproduce what they were taught…
… to assess students’ capacity to extrapolate from what they know and creatively apply their knowledge in novel situations
– Mathematics, reading, science, problem-solving, financial literacy
– Total of 390 minutes of assessment material
… and responded to questions on…– their personal background, their schools
and their engagement with learning and school
• Parents, principals and system leaders provided data on…– school policies, practices, resources and institutional factors that
help explain performance differences .

What do 15-year-olds know……and what can they do with what they know?
PISA 2012 results
4
Each year OECD countries spend 200bn$ on math education in school
Singapore
Hong Kong-ChinaChinese Taipei
Korea
Macao-ChinaJapan LiechtensteinSwitzerland
NetherlandsEstonia FinlandCanada
PolandBelgiumGermany Viet Nam
Austria AustraliaIrelandSlovenia
DenmarkNew ZealandCzech Republic France
United KingdomIceland
LatviaLuxembourg NorwayPortugal ItalySpain
Russian Fed.Slovak Republic United StatesLithuaniaSwedenHungary
CroatiaIsrael
GreeceSerbiaTurkey
Romania
BulgariaU.A.E.KazakhstanThailand
ChileMalaysia
Mexico410
420
430
440
450
460
470
480
490
500
510
520
530
540
550
560
570
580
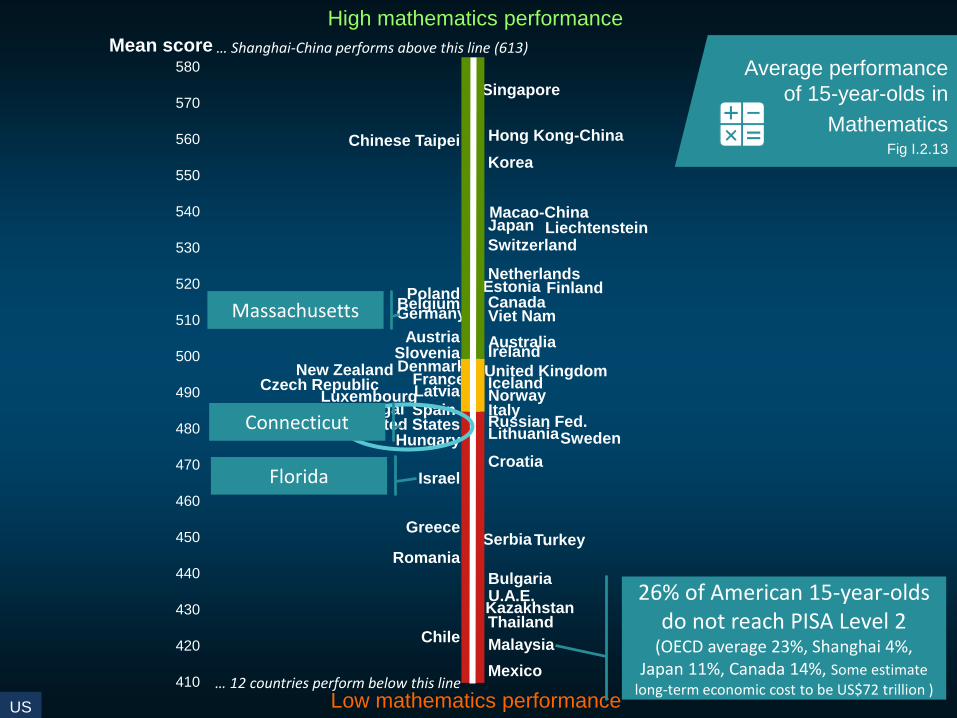
Mean score
High mathematics performance
Low mathematics performance
… Shanghai-China performs above this line (613)
… 12 countries perform below this line
Average performance
of 15-year-olds in
MathematicsFig I.2.13
US
Massachusetts
Connecticut
Florida
26% of American 15-year-olds do not reach PISA Level 2
(OECD average 23%, Shanghai 4%, Japan 11%, Canada 14%, Some estimate
long-term economic cost to be US$72 trillion )

Test Questions (Level 2): Helen the Cyclist
Helen has just got a new bike. It has a speedometer which sits on the handlebar.
The speedometer can tell Helen the distance she travels and her average speed for a trip.
Question
On one trip, Helen rode 4 km in the first 10 minutes and then 2 km in the next 5 minutes.
Which one of the following statements is correct?
A. Helen's average speed was greater in the first 10 minutes than in the next 5 minutes.
B. Helen's average speed was the same in the first 10 minutes and in the next 5 minutes.
C. Helen's average speed was less in the first 10 minutes than in the next 5 minutes.
D. It is not possible to tell anything about Helen's average speed from the information given.
Try the test!
Sh
an
gh
ai-
Chin
aS
inga
po
reH
on
g K
on
g-C
hin
aK
ore
aE
sto
nia
Ma
ca
o-C
hin
aJa
pa
nF
inla
nd
Sw
itze
rla
nd
Chin
ese
Ta
ipe
iC
an
ad
aL
iech
ten
ste
inV
ietn
am
Po
lan
dN
eth
erla
nd
sD
en
ma
rkIr
ela
nd
Ge
rma
ny
Au
str
iaB
elg
ium
Au
str
alia
La
tvia
Slo
ve
nia
Cze
ch
Re
pu
blic
Ice
lan
dU
nite
d K
ingd
om
Norw
ay
Fra
nce
New
Ze
ala
nd
OE
CD
ave
rage
Sp
ain
Russia
n F
ed
era
tio
nL
uxe
mb
ou
rgIt
aly
Po
rtu
ga
lU
nite
d S
tate
sL
ith
ua
nia
Sw
ed
en
Slo
va
k R
ep
ub
licH
un
ga
ryC
roa
tia
Isra
el
Gre
ece
Se
rbia
Rom
an
iaT
urk
ey
Cyp
rus*
Bu
lga
ria
Ka
za
kh
sta
nU
nite
d A
rab
Em
ira
tes
Th
aila
nd
Chile
Ma
laysia
Me
xic
oU
rugu
ay
Mo
nte
ne
gro
Costa
Ric
aA
lba
nia
Arg
en
tin
aB
razil
Tu
nis
iaJo
rda
nQ
ata
rC
olo
mb
iaP
eru
Ind
on
esia
0
10
20
30
40
50
60
70
80
90
100
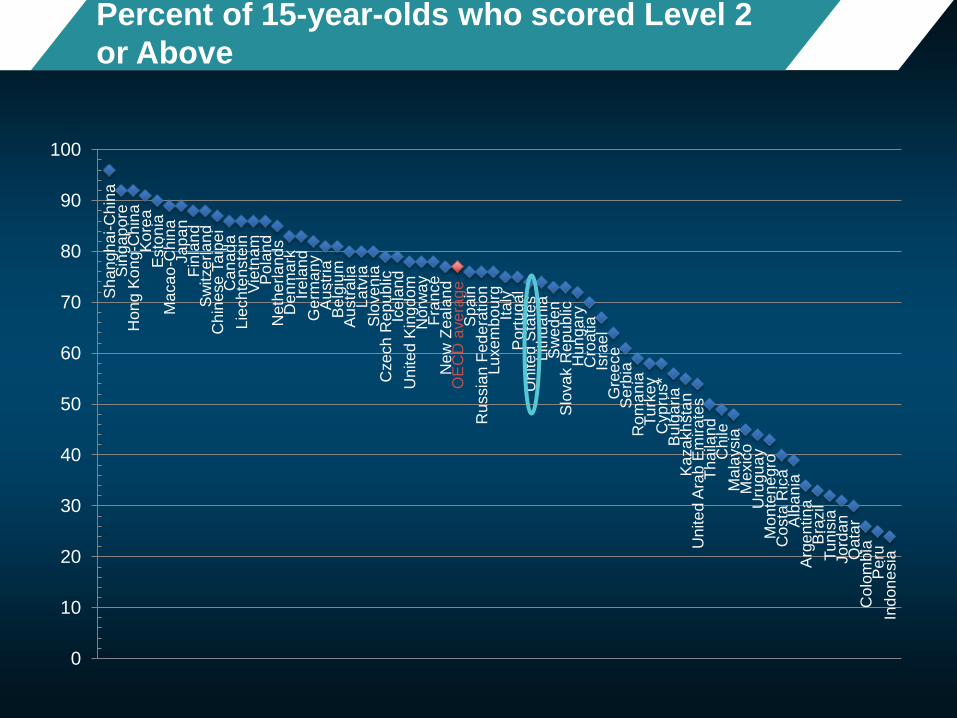
Percent of 15-year-olds who scored Level 2
or Above

AustraliaAustria
Belgium Canada
Chile
Czech Rep.
Denmark
Estonia
Finland
France
Germany
Greece
Hungary
IcelandIreland
Israel
Italy
Japan
Korea
Luxembourg
Mexico
Netherlands
New Zealand
Norway
Poland
Portugal
Slovak Rep.
Slovenia
Spain Sweden
Switzerland
Turkey
UK
US
Singapore
Hong Kong-ChinaChinese Taipei
Macao-China
Liechtenstein
Viet Nam
Latvia
Russian Fed.Lithuania
Croatia
SerbiaRomania
Bulgaria United Arab Emirates
Kazakhstan
Thailand
Malaysia
02468101214161820222426
2012
Socially equitable
distribution of learning
opportunities
Strong socio-economic
impact on student
performance
Massachusetts
Connecticut
Florida

420
430
440
450
460
470
480
490
500
510
520
530
540
550
560
570
580
2003
2003
2003
2012
2012
2012
9Don’t close achievement gaps the wrong wayPerformance differences between top and bottom quarter of socio-economic distributionP
ISA
per
form
ance
(m
ath
emat
ics)
Source: PISA 2012

1010Poverty isn’t destiny:
PISA performance by decile of social background300
325
350
375
400
425
450
475
500
525
550
575
600
625
650
675
Mexi
co
Chile
Gre
ece
Norw
ay
Sw
eden
Icela
nd
Isra
el
Italy
United S
tate
s
Spain
Denm
ark
Luxe
mbourg
Aust
ralia
Irela
nd
United K
ingdom
Hungary
Canada
Fin
land
Aust
ria
Turk
ey
Liech
tenst
ein
Cze
ch R
epublic
Est
onia
Portugal
Slo
venia
Slo
vak R
epublic
New
Zeala
nd
Germ
any
Neth
erlands
Fra
nce
Sw
itze
rland
Pola
nd
Belg
ium
Japan
Maca
o-C
hin
a
Hong K
ong-C
hin
a
Kore
a
Sin
gapore
Chin
ese
Taip
ei
Shanghai-Chin
a
Source: PISA 2012

100
80
60
40
20
0
20
40
60
80
100
Alb
an
iaF
inla
nd
Icela
nd
Sw
ede
nN
orw
ay
Denm
ark
Esto
nia
Ire
land
Spa
inC
ana
da
Pola
nd
Latv
iaK
aza
kh
sta
nU
nited
Sta
tes
Me
xic
oC
olo
mb
iaC
osta
Ric
aR
ussia
n F
ed.
Ma
laysia
Jo
rdan
Ne
w Z
eala
nd
Lithu
ania
Gre
ece
Mo
nte
neg
roU
nited
Kin
gd
om
Arg
en
tin
aA
ustr
alia
Bra
zil
Port
ug
al
Ind
one
sia
Chile
Th
aila
nd
Rom
ania
Tu
nis
iaS
witze
rla
nd
Peru
Uru
gua
yC
roa
tia
U.A
.E.
Ma
ca
o-C
hin
aS
erb
iaV
iet N
am
Kore
aH
ong
Kon
g-C
hin
aS
inga
po
reA
ustr
iaIt
aly
Luxe
mb
ou
rgC
ze
ch R
ep
ub
licJa
pa
nB
ulg
aria
Isra
el
Qata
rS
ha
ngh
ai-
Ch
ina
Germ
any
Slo
ven
iaS
lovak R
epu
blic
Tu
rkey
Belg
ium
Hung
ary
Lie
ch
tenste
inN
eth
erla
nds
Chin
ese
Taip
ei
Variability in student mathematics performance
between and within schoolsVariation in s
tudent
perf
orm
ance
as
% o
f O
ECD
avera
ge v
ariation
Fig II.2.7
OECD average
OECD average
11
Performance variation of
students within schools
Performance differences
between schools

0
10
20
30
40
50
60S
ha
ngh
ai-
Ch
ina
Sin
ga
po
reC
hin
ese
Taip
ei
Ho
ng
Kon
g-C
hin
aK
ore
aL
iech
tenste
inM
aca
o-C
hin
aJa
pa
nS
witze
rla
nd
Belg
ium
Neth
erla
nds
Germ
any
Pola
nd
Cana
da
Fin
land
New
Ze
ala
nd
Austr
alia
Esto
nia
Austr
iaS
loven
iaV
iet N
am
Fra
nce
Czech R
ep
ub
licO
EC
D a
ve
rag
eU
nited
Kin
gd
om
Luxe
mb
ou
rgIc
ela
nd
Slo
vak R
epu
blic
Ire
land
Port
ug
al
Denm
ark
Italy
Norw
ay
Isra
el
Hung
ary
United
Sta
tes
Lithu
ania
Sw
ede
nS
pa
inL
atv
iaR
ussia
n F
ede
ratio
nC
roa
tia
Tu
rke
yS
erb
iaB
ulg
aria
Gre
ece
Un
ited
Ara
b E
mira
tes
Rom
ania
Th
aila
nd
Qata
rC
hile
Uru
gua
yM
ala
ysia
Mo
nte
neg
roK
aza
kh
sta
nA
lban
iaT
unis
iaB
razil
Me
xic
oP
eru
Costa
Ric
aJo
rdan
Colo
mb
iaIn
do
ne
sia
Arg
en
tin
a
%
Percentage of top performers
in mathematics12 Tab I.2.1a
UK
Across OECD, 13% of students are top performers (Level 5 or 6). They can develop and work with models for complex situations, and work strategically with advanced thinking and reasoning skills
Massachusetts
Connecticut
Florida

Au
str
alia
Bra
zil
Ma
ca
o-C
hin
a
En
gla
nd
(U
.K.)
Ita
ly
Unite
d S
tate
s
Se
rbia
Ja
pa
n
Ko
rea
Au
str
ia
Slo
va
k R
ep
ub
lic
Russia
n F
ed
era
tio
n
Po
rtu
ga
l
Sw
ed
en
Can
ad
a
Cze
ch
Re
pu
blic
Chile
Norw
ay
Sin
ga
po
re
Fra
nce
Bu
lga
ria
Sh
an
gh
ai-C
hin
a Po
lan
d
Unite
d A
rab
Em
ira
tes
Hun
ga
ry
Slo
ve
nia Is
rae
l
Uru
gu
ay
Mo
nte
ne
gro
Cro
atia
Sp
ain
Ire
lan
d
Hon
g K
on
g-C
hin
a
Neth
erla
nd
s
Esto
nia
Tu
rkey
Ma
laysia
Ge
rma
ny
Den
ma
rk
Be
lgiu
m
Chin
ese
Ta
ipe
i
Fin
lan
d
OE
CD
ave
rage
Colo
mb
ia
-60
-40
-20
0
20
40
%
Relative performance in problem solving Fig V.2.15
Students' performance in problem solving
is lower than their expected performance
Students' performance in problem solving
is higher than their expected performance
13

1414L
essons f
rom
hig
h p
erf
orm
ers
Catching up with the top-performers
Low impact on outcomes
High impact on outcomes
Low feasibility High feasibility
Money pits
Must haves
Low hanging fruits
Quick wins

1515L
essons f
rom
hig
h p
erf
orm
ers
Low impact on outcomes
High impact on outcomes
Low feasibility High feasibility
Money pits
Must haves
Low hanging fruits
Quick wins
Commitment to universal achievement
Gateways, instructional systems
Capacity at point of delivery
Incentive structures and accountability
Resources where they yield most
A learning systemCoherence

1616L
essons f
rom
hig
h p
erf
orm
ers
Low impact on outcomes
High impact on outcomes
Low feasibility High feasibility
Money pits
Must haves
Low hanging fruits
Quick wins
Commitment to universal achievement
Gateways, instructional systems
Capacity at point of delivery
Incentive structures and accountability
Resources where they yield most
A learning systemCoherence
A commitment to education and the belief that competencies can be learned and therefore all children can achieve Universal educational standards and personalization as
the approach to heterogeneity in the student body…
… as opposed to a belief that students have different destinations to be met with different expectations, and selection/stratification as the approach to heterogeneity
Clear articulation who is responsible for ensuring student success and to whom

United States
Poland
Hong Kong-China
Brazil
New Zealand
Greece
Uruguay
United Kingdom
EstoniaFinland
Albania
Croatia
Latvia
Slovak RepublicLuxembourg
Germany
Lithuania
Austria
Czech Republic
Chinese Taipei
France
Thailand
Japan
Turkey Sweden
HungaryAustralia
Israel
Canada
IrelandBulgaria
Jordan
Chile
Macao-China
U.A.E.
Belgium
Netherlands
Spain
Argentina
Indonesia
Denmark
Kazakhstan
Peru
Costa Rica
Switzerland
Montenegro
Tunisia
Iceland
Slovenia
Qatar
Singapore
Portugal
Norway
Colombia
Malaysia
Mexico
Liechtenstein
Korea
Serbia
Russian Fed.
Romania
Viet Nam
Italy
Shanghai-China
R² = 0.36
300
350
400
450
500
550
600
650
-0.60 -0.40 -0.20 0.00 0.20 0.40 0.60 0.80 1.00 1.20
Me
an
ma
the
ma
tic
s p
erf
orm
an
ce
Mean index of mathematics self-efficacy
OE
CD
ave
rag
e
Countries where students have stronger beliefs
in their abilities perform better in mathematics17 Fig III.4.5

Perceived self-responsibility for failure
in mathematics
Percentage of students who reported "agree" or "strongly agree" with the following statements:
0 20 40 60 80 100
I’m not very good at solving mathematics problems
My teacher did not explain the concepts wellthis week
This week I made bad guesses on the quiz
Sometimes the course material is too hard
The teacher did not get students interested inthe material
Sometimes I am just unlucky
%
France Shanghai-China OECD average
Fig III.3.618
US

1919L
essons f
rom
hig
h p
erf
orm
ers
Low impact on outcomes
High impact on outcomes
Low feasibility High feasibility
Money pits
Must haves
Low hanging fruits
Quick wins
Commitment to universal achievement
Gateways, instructional systems
Capacity at point of delivery
Incentive structures and accountability
Resources where they yield most
A learning systemCoherence
Clear ambitious goals that are shared across the system and aligned with high stakes gateways and instructional systems
Well established delivery chain through which curricular goals translate into instructional systems, instructional practices and student learning (intended, implemented and achieved)
High level of metacognitive content of instruction …

2020L
essons f
rom
hig
h p
erf
orm
ers
Low impact on outcomes
High impact on outcomes
Low feasibility High feasibility
Money pits
Must haves
Low hanging fruits
Quick wins
Commitment to universal achievement
Gateways, instructional systems
Capacity at point of delivery
Incentive structures and accountability
Resources where they yield most
A learning systemCoherence
Capacity at the point of delivery
Attracting, developing and retaining high quality teachers and school leaders and a work organisation in which they can use their potential
Instructional leadership and human resource management in schools
Keeping teaching an attractive profession
System-wide career development …

Mean mathematics performance, by school location,
after accounting for socio-economic statusFig II.3.32121 TALIS in Brief
…representing more than 4 million teachers in 34 countries…
Over 100 thousand randomly selected lower secondary
teachers and their school leaders from over 6500 schools
…took an internationally-agreed survey about the working
conditions and learning environments in their schools…
…responding to questions about their background, their teaching
practices, support and development, their relationships with
colleagues and students and the leadership in their schools

Developing Teaching
as a profession
Recruit top candidates into the profession
Support teachers in continued
development of practice
Retain and recognise effective teachers –path for growth
Improve the societal
view of teaching as
a profession
Mean mathematics performance, by school location, after acc
ounting for socio-economic status2222 Implementing highly effective teacher policy and practice
Mean mathematics performance, by school location,
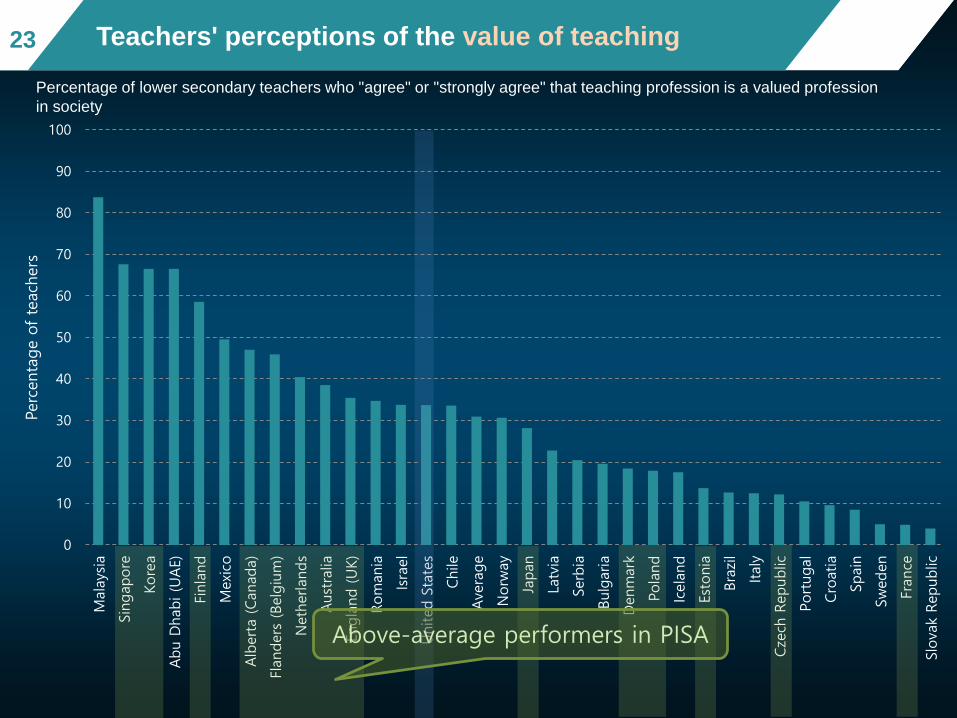
after accounting for socio-economic statusFig II.3.32323 Teachers' perceptions of the value of teaching
Percentage of lower secondary teachers who "agree" or "strongly agree" that teaching profession is a valued profession
in society
0
10
20
30
40
50
60
70
80
90
100
Mala
ysia
Sin
gapore
Kore
a
Abu D
habi (U
AE)
Finla
nd
Mexi
co
Alb
erta (Canada)
Flanders
(Belg
ium
)
Neth
erlands
Aust
ralia
Engla
nd (UK)
Rom
ania
Isra
el
United S
tate
s
Chile
Ave
rage
Norw
ay
Japan
Latv
ia
Serb
ia
Bulg
aria
Denm
ark
Pola
nd
Icela
nd
Est
onia
Bra
zil
Italy
Cze
ch R
epublic
Portugal
Cro
atia
Spain
Sw
eden
France
Slo
vak
Republic
Perc
enta
ge o
f te
ach
ers
Above-average performers in PISA

Mean mathematics performance, by school location,
after accounting for socio-economic statusFig II.3.32424
Countries where teachers believe their profession is valued
show higher levels of student achievement
Relationship between lower secondary teachers' views on the value of their profession in society and the country’s
share of top mathematics performers in PISA 2012
Australia
Brazil
Bulgaria
Chile
Croatia
Czech Republic
Denmark
EstoniaFinland
France
IcelandIsrael
Italy
Japan
Korea
Latvia
Mexico
Netherlands
Norway
Poland
Portugal
Romania
Serbia
Singapore
Slovak Republic
SpainSweden
Alberta (Canada)
England (UK)
Flanders (Belgium)
United States
0
5
10
15
20
25
30
35
40
45
0 10 20 30 40 50 60 70 80
Share
of
math
em
atics
top p
erf
orm
ers
Percentage of teachers who agree that teaching is valued in society
R2 = 0.24 r= 0.49

Mean mathematics performance, by school location, after acc
ounting for socio-economic statusFig II.3.32525 Teachers' needs for professional development
Percentage of lower secondary teachers indicating they have a high level of need for professional development in the
following areas
0 5 10 15 20 25 30 35 40
Knowledge of the curriculum
Knowledge of the subject field(s)
School management and administration
Pedagogical competencies
Developing competencies for future work
Teaching cross-curricular skills
Student evaluation and assessment practice
Student career guidance and counselling
Approaches to individualised learning
Teaching in a multicultural or multilingual setting
Student behaviour and classroom management
New technologies in the workplace
ICT skills for teaching
Teaching students with special needs
United States Average

230 250 270 290 310 330 350
Italy
Poland
Estonia
United States
Canada
Ireland
Korea
England (UK)
England/N. Ireland (UK)
Denmark
Northern Ireland (UK)
Slovak Republic
France
Australia
Sweden
Czech Republic
Austria
Netherlands
Norway
Germany
Flanders (Belgium)
Finland
Japan
Middle half of the numeracy
skill distribution of graduates
(16-65 years)
PIAAC test scores (numeracy)
Test scores of teachers and graduates (numeracy)

Test scores of teachers and graduates (numeracy)
230 250 270 290 310 330 350
Italy
Poland
Estonia
United States
Canada
Ireland
Korea
England (UK)
England/N. Ireland (UK)
Denmark
Northern Ireland (UK)
Slovak Republic
France
Australia
Sweden
Czech Republic
Austria
Netherlands
Norway
Germany
Flanders (Belgium)
Finland
Japan
Middle half of the numeracy
skill distribution of graduates
(16-65 years)
Numeracy skills of teachers
PIAAC test scores (numeracy)

2828L
essons f
rom
hig
h p
erf
orm
ers
Low impact on outcomes
High impact on outcomes
Low feasibility High feasibility
Money pits
Must haves
Low hanging fruits
Quick wins
Commitment to universal achievement
Gateways, instructional systems
Capacity at point of delivery
Incentive structures and accountability
Resources where they yield most
A learning systemCoherence
Incentives, accountability, knowledge management
Aligned incentive structures
For students How gateways affect the strength, direction, clarity and nature of the
incentives operating on students at each stage of their education
Degree to which students have incentives to take tough courses and study hard
Opportunity costs for staying in school and performing well
For teachers Make innovations in pedagogy and/or organisation
Improve their own performance and the performance of their colleagues
Pursue professional development opportunities that lead to stronger pedagogical practices
A balance between vertical and lateral accountability
Effective instruments to manage and share knowledge and spread innovation – communication within the system and with stakeholders around it
A capable centre with authority and legitimacy to act

2929L
essons f
rom
hig
h p
erf
orm
ers
29
29
Hong Kong-China
Brazil
Uruguay
Albania
Croatia
Latvia
Lithuania
Chinese Taipei
ThailandBulgaria
Jordan
Macao-China
UAE Argentina
Indonesia
Kazakhstan
Peru
Costa Rica
Tunisia
Qatar
Singapore
Colombia
Malaysia
Serbia
Romania
Viet Nam
Shanghai-China
USA
Poland
New Zealand
Greece
UK
Estonia
Finland
Slovak Rep.
Luxembourg
GermanyAustria
Czech Rep.
France
Japan
Turkey
Sweden
HungaryAustralia
Israel
Canada
Chile
Belgium
NetherlandsSpain
Denmark
Switzerland
Iceland
Slovenia
Portugal
Norway
Korea
Italy
R² = 0.13
300
350
400
450
500
550
600
650
-1.5 -1 -0.5 0 0.5 1 1.5
Ma
the
ma
tic
s p
erf
orm
an
ce
(sc
ore
po
ints
)
Index of school responsibility for curriculum and assessment (index points)
Countries that grant schools autonomy over curricula and
assessments tend to perform better in mathematics
Source: PISA 2012

0 20 40 60 80 100
Written specification of the school's curriculum andeducational goals
Written specification of student-performance standards
Systematic recording of data, including teacher andstudent attendance and graduation rates, test results…
Internal evaluation/self-evaluation
External evaluation
Written feedback from students (e.g. regarding lessons,teachers or resources)
Teacher mentoring
Regular consultation with one or more experts over aperiod of at least six months with the aim of improving…
Implementation of a standardised policy for mathematics
%
Percentage of students in schools whose principal reported that their schools have the following for quality assurance and improvement:
Singapore OECD average
Quality assurance and school improvement Fig IV.4.1430

3131L
essons f
rom
hig
h p
erf
orm
ers
Low impact on outcomes
High impact on outcomes
Low feasibility High feasibility
Money pits
Must haves
Low hanging fruits
Quick wins
Commitment to universal achievement
Gateways, instructional systems
Capacity at point of delivery
Incentive structures and accountability
Resources where they yield most
A learning systemCoherence
Investing resources where they can make mostof a difference
Alignment of resources with key challenges (e.g. attracting the most talented teachers to the most challenging classrooms)
Effective spending choices that prioritise high quality teachers over smaller classes
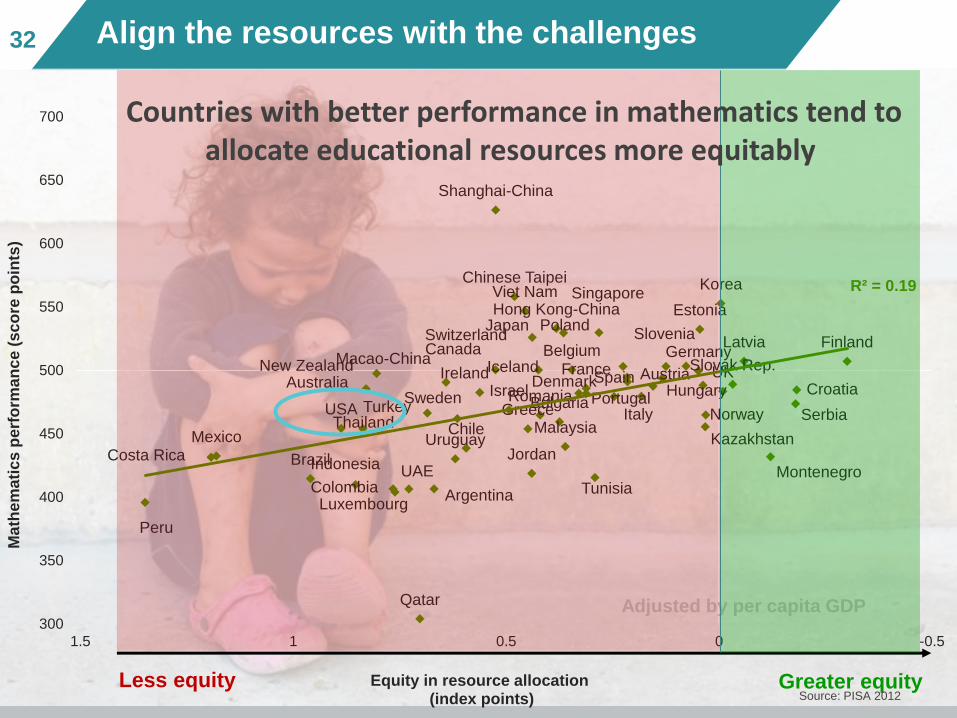
3232 Align the resources with the challenges
Hong Kong-China
Brazil
Uruguay
Croatia
Latvia
Chinese Taipei
Thailand
Bulgaria
Jordan
Macao-China
UAE
Argentina
Indonesia
Kazakhstan
Peru
Costa RicaMontenegro
Tunisia
Qatar
Singapore
Colombia
MalaysiaSerbia
Romania
Viet Nam
Shanghai-China
USA
Poland
New Zealand
Greece
UK
Estonia
Finland
Slovak Rep.
Luxembourg
Germany
AustriaFrance
Japan
TurkeySweden Hungary
AustraliaIsrael
Canada
Ireland
Chile
Belgium
SpainDenmark
Switzerland
Iceland
Slovenia
PortugalNorway
Mexico
Korea
Italy
R² = 0.19
300
350
400
450
500
550
600
650
700
-0.500.511.5
Ma
the
ma
tic
s p
erf
orm
an
ce
(sc
ore
po
ints
)
Equity in resource allocation(index points)
Greater equityLess equity
Adjusted by per capita GDP
Countries with better performance in mathematics tend to allocate educational resources more equitably
Source: PISA 2012

3333L
essons f
rom
hig
h p
erf
orm
ers
Low impact on outcomes
High impact on outcomes
Low feasibility High feasibility
Money pits
Must haves
Low hanging fruits
Quick wins
Commitment to universal achievement
Gateways, instructional systems
Capacity at point of delivery
Incentive structures and accountability
Resources where they yield most
A learning systemCoherence
Coherence of policies and practices
Alignment of policies across all aspects of the system
Coherence of policies over sustained periods of time
Consistency of implementation
Fidelity of implementation (without excessive control)

3434L
essons f
rom
hig
h p
erf
orm
ers
34 Innovating to create 21st-century learning environments
Four dimensions
Regrouping educators
Regrouping learners
Rescheduling learning
Widening pedagogic
repertoires
• To gain the benefits of collaborative planning, work, and shared professional development strategies
• To open up pedagogical options • To give extra attention to groups of
learners • To give learners a sense of belonging
& engagement• To mix students of different ages• To mix different abilities and strengths• To widen pedagogical options,
including peer teaching• To allow for deeper learning• To create flexibility for more
individual choices• To accelerate learning• To use out-of-school learning in
effective & innovative ways
• Inquiry, authentic learning, collaboration, and formative assessment
• A prominent place for student voice & agency

3535L
essons f
rom
hig
h p
erf
orm
ers
Mean mathematics performance, by school location,
after accounting for socio-economic statusFig II.3.33535 Most teachers value 21st century pedagogies…
Percentage of lower secondary teachers who "agree" or "strongly agree" that:
0 10 20 30 40 50 60 70 80 90 100
Students learn best by finding solutions to problems on theirown
Thinking and reasoning processes are more important thanspecific curriculum content
Students should be allowed to think of solutions to practicalproblems themselves before the teacher shows them how they
are solved
My role as a teacher is to facilitate students' own inquiry
United States Average
3636L
essons f
rom
hig
h p
erf
orm
ers
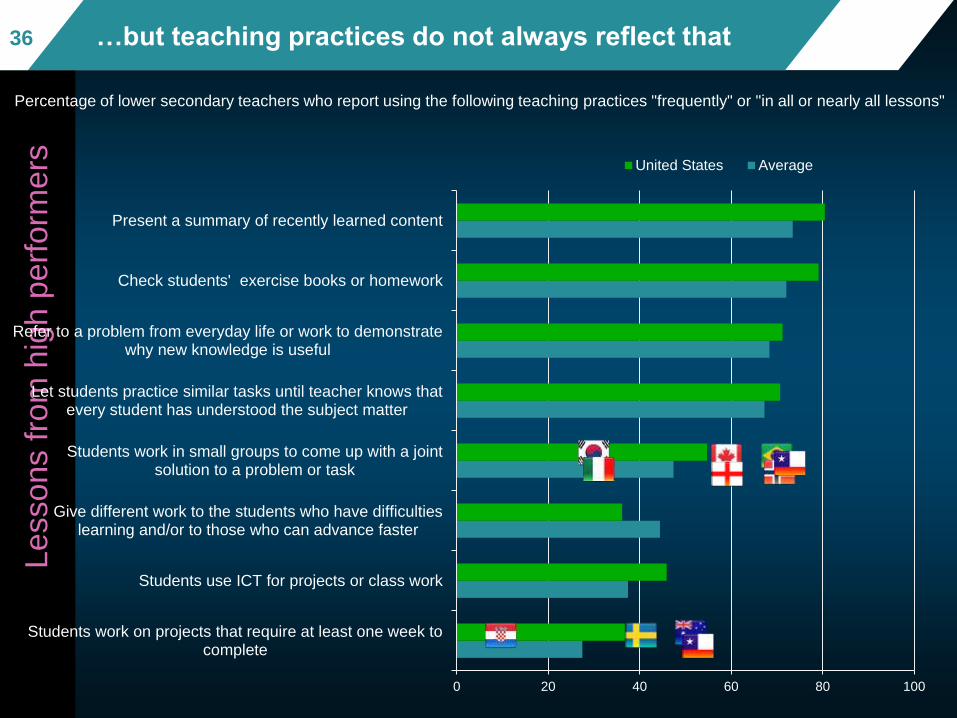
0 20 40 60 80 100
Students work on projects that require at least one week tocomplete
Students use ICT for projects or class work
Give different work to the students who have difficultieslearning and/or to those who can advance faster
Students work in small groups to come up with a jointsolution to a problem or task
Let students practice similar tasks until teacher knows thatevery student has understood the subject matter
Refer to a problem from everyday life or work to demonstratewhy new knowledge is useful
Check students' exercise books or homework
Present a summary of recently learned content
United States Average
Mean mathematics performance, by school location, after acc
ounting for socio-economic statusFig II.3.33636 …but teaching practices do not always reflect that
Percentage of lower secondary teachers who report using the following teaching practices "frequently" or "in all or nearly all lessons"

3737L
essons f
rom
hig
h p
erf
orm
ers
Increase percentage correct
0.8
1.71.7
6.5
0
1
2
3
4
5
6
7
8
9
10
Multiple-choice - reproducing knowledge
Open-ended - constructing knowledge (21st century skills)
OECD Japan
OECDOECDJapan
Japan
37 Changes in instructional practice – PISA 2006-9

Some students learn at high levels All students need to learn at high levels
Student inclusion
Routine cognitive skills, rote learning Learning to learn, complex ways of thinking, ways of working
Curriculum, instruction and assessment
Few years more than secondary High-level professional knowledge workers
Teacher quality
‘Tayloristic’, hierarchical Flat, collegial
Work organisation
Primarily to authorities Primarily to peers and stakeholders
Accountability
What it all means
Average performers Top performers

oecdeducationtoday.blogspot.com
oecdmybrochure.org/edu
39
www.oecd.org/education
@YuriBelfali_EDU
Thank you
Follow us on Twitter@OECD_Edu