the integration of china and east european countries in ... · countries in global networks are...
TRANSCRIPT

1
Tokyo Club Research Meeting
Revised, March 2004
The Integration of China and East European Countries in Global Networks
Are European Multinationals Different?
Frédérique Sachwald1, ifri
1 I am indebted to Vincent Vasques and Rachid Zairi for research assistance.

2
Contents
Introduction ..............................................................................................................................3
1. Global production networks and vertical specialization.................................................4 1.1 The emergence of Global Production Networks..............................................................4 1.2 The impact of GPNs on trade flows and specialization...................................................9
2. Are production networks of European multinationals different? ................................ 13 2.1 The regional configuration of production networks ....................................................... 13 2.2 China and CEECs in French intra-firm trade................................................................. 16
IFT between France and China ....................................................................................... 18 IFT between France and CEECs..................................................................................... 23
Summary and Conclusions................................................................................................... 28 Summary of main results................................................................................................. 28 Vertical specialization and the hollowing out syndrome .................................................. 29
Appendix 1. The French Survey on Intra-Group Trade ..................................................... 30
References.............................................................................................................................. 31

3
Introduction
The emergence of high growth zones in Asia and to a lesser extent in Central and Eastern Europe tends to increase the mid-term world growth. This trend has nevertheless raised worries both in high -income countries and in some emerging countries because of short-term adjustment issues. This is due to the fact that high growth in emerging zones is partly based on the transfer of production from industrial countries to these emerging zones. Industrial production has thus been growing much faster in China than in high-income countries. As a consequence of this impressive growth of industrial production, China is regularly portrayed as the new “factory of the world”.
China is nevertheless not seen as equally threatening around the world. At the end of the 1990s, as Chinese imports surged and shifted to higher value added products, Japan perceived China as a potential threat. Japanese firms had started to invest in China to manufacture state-of-the-art consumer products such as digital cameras. Hence the return of the fear of hollowing out. The perception of China has nevertheless begun to change around 2002, when Japan began to consider the vast opportunity represented by the development of China. According to some, such a change of attitude has been triggered by the fact that Japanese manufacturers seem to “have avoided head-to-head competition with producers in China and shifted domestic production to higher value added devices and materials” (Munakata 2003).2 The attitude of the United States vis-à-vis China’s economic performance has on the contrary become increasingly critical as the bilateral deficit has deepened. EU countries have weaker economic links with China, but they fear the combined emergence of new competitors from Asia and Eastern Europe. More generally, China is not the sole source of the rapidly increasing global manufacturing capacity. To the extent that decreasing capacity in high -income countries for the same products does not compensate increasing capacity in emerging zones, global over-capacity builds up.
In order to benefit from dynamic growth in emerging zones, high -income countries need to evolve towards more favorable specialization. Some countries may have a relatively more favorable specialization from the outset. Besides, some countries may prove more mobile. This paper examines the role of multinational companies in this dynamics.
Part one explains the emergence of global production networks and their impact on trade between low- and high-wage countries. Part two examines the differences between multinationals from Japan, the United -States and Europe, focusing on trade with China. It then examines intra-firm trade by companies located in France, comparing trade patterns with China on the one hand and CEECs on the other hand. The conclusion relates intra -firm trade, global production networks and the dynamics of international specialization.
2 Others however consider that Japanese firms have not yet organized to take full advantage of China’s growth (Masuyama 2004).

4
1. Global production networks and vertical specialization
Since the 1980s, foreign direct investment has been particularly dynamic and has been one of the drivers of globalization. The expansion of multinational companies has increased global integration and has had an important impact on the qualitative composition of international trade. One characteristic of our integrated world is nevertheless that the cost of international transactions tends to fall and that all companies have an easier access to both foreign clients and foreign suppliers. This section discusses the development of global production networks (GPNs) as one major feature of this context. It then examines the consequences on the trade flows and their qualitative composition. It shows in particular that GPNs constitute a major channel for developing countries to increase their participation to world trade in manufactures, including in non-traditional sectors.
1.1 The emergence of Global Production Networks
The re-organization of production processes on a global basis has been one major feature of globalization. Since the 1980s, leading firms design global production networks, where manufacturing processes are divided in discrete production stages and assigned to different countries. While sectoral and product specialization has long been a basis for the development of trade, global production sharing operates an increasingly fine international division of labor both between and within industries.
GPNs organize the sourcing of specialized items and sub-systems from multiple locations across the globe. The emergence of such complex global networks, which require technical and commercial interactions between industrial suppliers and clients, results from a whole set of changes in the global competitive environment. Global competition and technological evolutions have been major incentives to fragment production processes. However, such a fragmentation and the related exchanges could not have been implemented if trade and foreign direct investment had not been eased by liberalization. As argued by Feenstra (1998), in the global economy, the disintegration of production has built upon the integration of trade. The emergence of GPNs thus depends on technological, economic and institutional factors. It is important to consider all three sets of factors in order to understand the dynamics and evolving morphology of GPNs, which typically span across different countries with contrasting comparative advantages.
Technological evolutions have created new opportunities and have had an impact on both the ability to fragment the production process in separable segments and the ability to source various components from distant suppliers. Since the 1980s, increasing codification of knowledge, standardization of interfaces and flexible manufacturing technologies have led firms to progressively disintegrate vertically integrated plants into networks of suppliers.3
Figure 1 shows the impact of increasing modularity along the value chain on the degree of firm vertical integration. Progress in transport and communication technologies has further allowed this general evolution to develop on a global scale. Disintegration among different production units along the value chain may occur within multinational companies, among
3 This trend is related to the development of « markets for technology », where previously internal knowledge is exchanged between companies (Arora et al. 2001).

5
subsidiaries, or more radically, between independent companies. Besides, independent may be related to leading firms 4 through various contractual arrangements or alliances. Multinationals thus develop both an internal network of subsidiaries and an external network of contractors and allied companies. Both the internal and external networks are international in scope.
These technological evolutions, including the development of new information networks, have been fundamental because the fragmentation of the value chain between different partners implies exchanges of huge amounts of information. GPNs thus depend on ever more efficient logistics, but also on intense exchange of information around the globe.
Technological change has also had an influence through the evolution of the mix of products within manufacturing. The expansion of production in electronics in particular has stimulated the constitution of networks as these products typically involve separable steps. Besides, tough innovation-based competition generates a continuous flow of new products, and leading firms tend to focus on their core competences, including in particular, research, design and marketing. Manufacturing operations themselves may also lose their status of core competences as automation and modularity enable contract manufacturers to be efficient and reap economies of scale (Sturgeon 2002).
4 Which are sometimes described as « flagship companies ».

6
Fig
ure 1. V
alue ch
ain m
od
ularity an
d vertical sp
ecialization
amo
ng firms
1. V
ertical Integ
ration
Traditional Integrated M
anufacturing Firm
Market C
hannel
Sales rep. E
nd user S
ystem int.
Firm
boundary
2. V
alue C
hain
Mo
du
larity and
Pro
du
ction
Netw
ork
Brand N
ame F
irm C
ontract Manufacturer M
arket Channel
Sales rep. E
nd user S
ystem int. use S
ystem int.
Inter-firm link: codifiable transfer of specifications (C
AE
, CA
D, C
AM
, ED
I...)
Source: A
dapted from S
turgeon (2002)
P
roduct strategy Prototype fabrication
Product R
&D
Parts purchasing
A
dmin. P
rocess R&
D M
anufacturing Marketing
F
unctional design Testing
Form
design Packaging
P
roduct strategy P
roduct R&
D.
Adm
in. Functional design M
arketing F
orm des
ign P
rototype fabrication
Process R
&D
D
esign for mfg.
Adm
in. Parts purchasing
Manufacturing M
arketing T
esting P
ackaging

7
Trade and foreign direct investment liberalization has constituted the second fundamental set of factors underlying the diffusion of the global production networks organization. Trade liberalization is important of course since GPNs are based on the international circulation of parts, components and final products. But GPNs also depend on the liberalization of factor movements, and more particularly of foreign direct investment. GPNs are to a large extent organized as intra-firm networks involving production sites in the home country and subsidiaries across the world. Some members of the network are independent producers, but the global architecture generally relies on a web of subsidiaries. Trade and FDI liberalization by developing and transition economies since the 1980s have thus created much more favorable conditions for the development of GPNs.
Fro m the 1980s on, developing countries have been reversing their hostile policies towards FDI. Countries from Eastern and Central Europe have also opened to FDI during the 1990s. Since the 1980s, a large number of countries have actually sought to attract FDI through various promotion schemes. As a result, the role of FDI has dramatically increased in a number of developing countries (figure 2).
Figure 2. FDI intensity* in developing countries, China and CEECs
* FDI inward stock as a share of GDP Source: calculation from UNCTAD data
Some countries have more specifically promoted local assembly through special custom provisions. China for example has granted duty exemptions to selected categories of imports as part of the promotion of export oriented sectors (Lemoine and Unal-Kesenci 2002a). Other emerging countries from Asia or Eastern Europe have also tried to design supplier-oriented development strategies (Hobday 2000, Sturgeon and Lester 2003).
Finally, the emergence of GPNs depends on the availability and quality of adequate production capabilities around the globe. Here again, evolutions since the 1980s have been favorable as a number of emerging countries have greatly improved their manufacturing capabilities. Some have even started to nurture design and product development
0
5
10
15
20
25
30
35
40
1990 2000 2002
All developing countries China CEECs
8
capabilities in high tech sectors.5 Multinational companies have contributed to the process through investment in equipment and training of the local work force, both in their subsidiaries and in various local suppliers. Increasing local capabilities and investment by multinationals to develop GPNs have thus interacted.
From the mid-1980s on, low and mid-income countries have steadily increased their trade openness, as measured by the share of trade in their GDP. As a group, they have become more open than high -income countries since the 1990s (Sachwald 2003). Developing countries have also increased their share of global trade, from about one fourth in 1980 to one third. Their specialization has simultaneously moved beyond resource intensive exports into manufactures. The share of manufactures in their exports has dramatically increased, from about 20% at the beginning of the 1980s, to 80%.
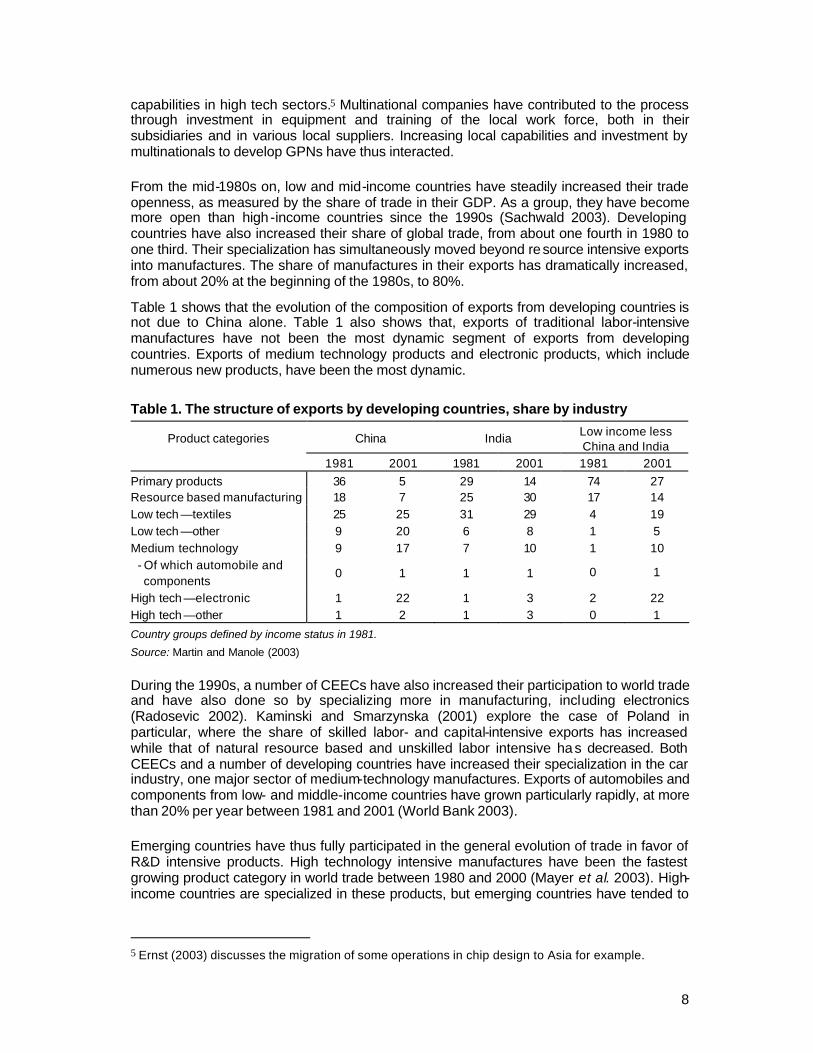
Table 1 shows that the evolution of the composition of exports from developing countries is not due to China alone. Table 1 also shows that, exports of traditional labor-intensive manufactures have not been the most dynamic segment of exports from developing countries. Exports of medium technology products and electronic products, which include numerous new products, have been the most dynamic.
Table 1. The structure of exports by developing countries, share by industry
Product categories China India Low income less China and India
1981 2001 1981 2001 1981 2001 Primary products 36 5 29 14 74 27 Resource based manufacturing 18 7 25 30 17 14 Low tech —textiles 25 25 31 29 4 19 Low tech —other 9 20 6 8 1 5 Medium technology 9 17 7 10 1 10
- Of which automobile and components
0 1 1 1 0 1
High tech —electronic 1 22 1 3 2 22 High tech —other 1 2 1 3 0 1
Country groups defined by income status in 1981.
Source: Martin and Manole (2003)
During the 1990s, a number of CEECs have also increased their participation to world trade and have also done so by specializing more in manufacturing, including electronics (Radosevic 2002). Kaminski and Smarzynska (2001) explore the case of Poland in particular, where the share of skilled labor- and capital-intensive exports has increased while that of natural resource based and unskilled labor intensive ha s decreased. Both CEECs and a number of developing countries have increased their specialization in the car industry, one major sector of medium-technology manufactures. Exports of automobiles and components from low- and middle-income countries have grown particularly rapidly, at more than 20% per year between 1981 and 2001 (World Bank 2003).
Emerging countries have thus fully participated in the general evolution of trade in favor of R&D intensive products. High technology intensive manufactures have been the fastest growing product category in world trade between 1980 and 2000 (Mayer et al. 2003). High-income countries are specialized in these products, but emerging countries have tended to
5 Ernst (2003) discusses the migration of some operations in chip design to Asia for example.

9
increase their contribution to global exports of these products too, partly through their participation to GPNs.
The development of GPNs is a quite general phenomenon, involving thousands of companies around the globe. GPNs are nevertheless much more pervasive and sophisticated in some industries. Due to their technical and economic characteristics, industries that manufacture equipment have developed GPNs the most. They first tend to involve production stages, such as design, component manufacturing and final assembly – which are physically separable. Second, these separable production stages exhibit different factor intensities, with assembly being typically less skill-intensive. This constitutes an incentive for companies to locate labor-intensive stages in labor-abundant countries.
Simple electronic products have been produced in low wage countries quite early and the production of some more sophisticated products such as hard disk drives has progressively organized through GPNs since the early 1980s (Mc Kendrick 2000). A wide array of electronic products are now the result of global production processes, including television and radio receivers, various office equipment or cameras. Electrical machinery, power and machine tools are also largely involved in global value chains (Kaminski and Ng 2001). Finally, the role of GPNs has markedly increased in the car industry since the 1990s, involving countries from all continents (Sturgeon and Lester 2003).
GPNs have also been developed differently by different multinational companies. One reason being that different leader countries are specialized in different industrial sectors. European countries tend to be more specialized in cars and machinery than in electronics. Japan and the United States both have strong positions in electronics, but focus on different products. The degree of development of GPNs also depends on manufacturing practices and traditions. American companies have been less focused on manufacturing than Japanese and Europeans, which may have influenced their earlier propensity to outsource in the office equipment and electronic industries (Mc. Kendrick 2000, Sturgeon 2002). A third reason for the various scopes and shape of GPNs is that they tend to have a regional focus. The relationship between the national origin of the leading company and the regional focus of its GPN will be explored below by comparing American and Japanese multinationals with European ones.
1.2 The impact of GPNs on trade flows and specialization
The development of GPNs involving companies from both high -income and lower-income countries has had a substantial impact on the location of manufacturing production and the specialization of countries. One difficulty in assessing this impact is that trade flows and specialization develop within industries.
A significant portion of trade within production networks is intra-firm, i.e. taking place among subsidiaries of multinational companies. Part of these exchanges nevertheless takes place between independent partners through outsourcing. Due to the variety of forms of GPNs, they generate various types of trade flows. As a result, different indicators have measured the phenomenon of international segmentation of production. Two main approaches have been developed to evaluate the impact of GPN on trade patterns. The first approach studies intra-firm trade. The second approach evaluates the share of production related flows of components in total trade. This second approach has often involved an evaluation of the vertical component of intra-industry trade (Box 1).

10
Box 1. Intra-industry and intra-firm trade
Intra-firm trade (IFT)
IFT takes place among subsidiaries of multinational companies. It may be horizontal, when subsidiaries exchange differentiated finished goods, or it may be vertical when the multinational has organized a global network with parts and components circulating between subsidiaries. Intra-firm trade is thus an important component of intra-industry trade. Horizontal intra -firm trade is also intra -industry trade. Vertical intra -firm trade may be more diverse though, especially if intra -industry is observed at a highly disaggregated level.
Intra-firm trade is not systematically recorded and some countries have conducted surveys to observe its evolution. This paper uses data from the U.S., Japan and mostly France. The last section of the paper is based on the latest French survey of intra-firm trade, which is presented in Appendix 1.
Intra-industry trade (IIT)
IIT has both a horizontal and a vertical component. The analysis of GPNs and associated trade flows focuses on vertical IIT (VIIT). Vertical flows are distinguished from horizontal flows within IIT on the basis of price differences between imports and exports. Differentiated products exchanged through horizontal IIT are supposed to have similar prices. On the contrary products with different levels of quality, or components are supposed to have substantially different prices. Hu and Ma (1999) for example define VIIT as the simultaneous exports and imports of 3-digit SITC products where the unit value of exports relative of the unit value of imports was outside the range of +/- 25%.
Vertical specialization
Vertical specialization can be evaluated based on the extent of VIIT. Another approach to estimate vertical specialization has been to calculate the rate of imported intermediate inputs used in the production of goods exported (Hummels et al. 2001, Martin and Manole 2003, Strauss-Kahn 2003). Some of these studies however estimate vertical specialization by multiplying on the value of inputs of industry A into industry B by the import ratio of the former. Such an indicator may overstate vertical specialization if what is the share of final products is high industry A. It may also understate vertical specialization if components are exported to be assembled abroad.
Estimates using different methods nevertheless converge to consider that vertical trading chains have taken an increasing role in international trade. Different methods also indicate similar sectoral and country differences.
According to the available estimates, the share of intra-firm trade has been increasing during the 1990s. Table 2 shows that intra-firm trade has increased in all the three countries for which we have surveys for the beginning and the end of the 1990s. Increase in intra -firm trade has been particularly rapid for Japanese multinationals, both on the export and import sides. American and French multinationals have increased their intra-firm trade in smaller proportions. Between 1993 and 1999, the share of intra -firm imports has more than doubled in the case of foreign multinationals located in France.

11
Table 2. Increasing intra -firm trade, in % of total trade
Exports Imports Country 19901 19992 19901 19992
United States of which
32.8 36.2 43.7 39.4
- domestically-based parent company
23.1 27.7 16.1 17.2
- foreign -based parent company 9.7 8.6 27.6 22.2 Japan of which
16.6 30.8 14.7 23.6
- domestically-based parent company
14.5 28.6 4.2 14.8
- foreign -based parent company 2.1 2.2 10.5 8.8 France of which
34.0 40.1 19.0 36.8
- domestically-based parent company
21.0 23.0 7.0 7.5
- foreign -based parent company 13.0 17.1 11.0 28.3 1. 1993 for French data. 2. For United States data for 1998. Note: comparisons are indicative, as methodology is different in the different national surveys. Sources: OECD (2002) and survey from the SESSI for France (see Appendix 1).
A large share of intra-firm trade between high -income countries is composed of finished goods destined to be distributed without additional processing taking place. Intra-firm trade between high -income countries is thus a way for multinational companies to produce and sell differentiated products. On the contrary, intra-firm trade with middle- and low-income countries tends to reflect the development of GPNs.
At the aggregate level, this expansion of the GPNs leads to an increasing share of intermediate inputs and components in trade by developed countries since the 1980s (Feenstra 1998, Barba Navaretti et al. 2002). As a consequence of this trend, the share of vertical IIT between industrial countries and less developed countries increases (Box 1). In the mid-1990s, vertical IIT already accounted for 80 to 90% of total IIT between the CEECs and the EU for example (Aturupane et al. 1999). Moreover, during the second half of the 1990s, trade in parts and components by CEECs has been very dynamic (Kaminsky and Ng 2001). By the mid -1990s, IIT between China and different high -income countries, as well as the share of vertical IIT in total IIT were already quite high (Hu and Ma 1999). As a result, China has a relatively high and growing index of vertical specialization (Martin and Manole 2003).
More generally, IIT has been increasing both in a number of high-income countries and in poorer countries. Table 3 indicates that among OECD countries, IIT has been increasing for mid-income countries that became more open to trade during the 1990s and for high-income countries that are the closest to the former. Since the creation of NAFTA, Mexican production facilities have thus become more tightly integrated into the production networks of American firms. IIT has also substantially increased for the countries which have become more integrated with EU members, including Portugal and future members from Central and Eastern Europe. The rapidly increasing rate of IIT in Korea and Japan may be due to both more open trade and tighter integration with lower-income countries in Asia. Overall, vertical IIT has played a larger role in raising the intensity of IIT than horizontal IIT by which

12
countries exchange similar but differentiated products.
Table 3. Intra-Industry Trade as a percentage of total manufacturing trade
1988-91 1992-95 1996-2000 Change over the period
High and increasing intra-industry trade
Czech Republic n.a. 66.3 77.4 11.1 Slovak Republic n.a. 69.8 76.0 6.2 Mexico 62.5 74.4 73.4 10.9 Hungary 54.9 64.3 72.1 17.2 Germany 67.1 72.0 72.0 5.0 United States 63.5 65.3 68.5 5.0 Poland 56.4 61.7 62.6 6.2 Portugal 52.4 56.3 61.3 8.9
High and stable intra-industry trade
France 75.9 77.6 77.5 1.6 Canada 73.5 74.7 76.2 2.7 United Kingdom 70.1 73.1 73.7 3.6 Switzerland 69.8 71.8 72.0 2.2 Belgium/Luxembourg 77.6 77.7 71.4 - 6.2 Spain 68.2 72.1 71.2 3.0 Netherlands 69.2 70.4 68.9 - 0.3 Sweden 64.2 64.6 66.6 2.4 Denmark 61.6 63.4 64.8 3.2 Italy 61.6 64.0 64.7 3.1 Finland 53.8 53.2 53.9 0.1
Low and increasing intra-industry trade
Korea 41.4 50.6 57.5 16.1 Japan 37.6 40.8 47.6 10.0
Note: Countries are classified as having a high level of intra- industry trade if intra- industry trade is above 50 per cent on average over all periods shown and “increasing” if intra-industry trade increases by more than 5 percentage points between the first and last periods. Source: OECD (2002).
Trade within GPNs develops as multinationals expand their global operations. As a consequence vertical trade tends to be positively correlated with FDI, which has important consequences for the geographical orientation of trade flows and for their sectoral specialization. FDI is a channel for capital, but also technology transfer and various production and management know how transfers.6 As a result, there are interactions between the home country and host country specialization.
Foreign firms have been playing a crucial role in the surge of exports from China. Chinese policy has strongly favored the use of imported inputs in labor-intensive production of manufactures and exports based on the processing of imported intermediates account for half of total exports (World Bank 2003, Lemoine and Unal-Kesenci 2002). As a result the intensity of vertical IIT is positively correlated with FDI (Hu and Ma 1999). The rate of
6 This is a major theme of the literature on multinationals and development; for a recent survey, see (Sachwald and Perrin 2002).

13
growth of high tech exports by China has been particularly remarkable (table 1 above) and it is clearly related to FDI by leading companies and vertical trade with high-income countries. The diversification of exports by China towards more technologically advanced products such as electronics was achieved through specializing in processing and assembly in relation with foreign firms. For high tech sectors, comparative advantage only appears for final goods, while China exhibits a strong disadvantage for parts and components (Lemoine and Unal-Kesenci 2002).
Similarly, the diversification of trade by CEECs has been led by FDI and the integration of local subsidiaries and local firms into GPNs. Industrial specialization of these countries are still characterized by comparative advantage in labor-intensive industries and, for some of them, in resource-intensive sectors. There are however increasing differences between Central European countries and Balkan and Baltic States. In most Central European countries, there has been a trend towards an evolution of specialization since the mid-1990s (Freudenberg and Lemoine 1999, Kaminski and Smarzynska 2001, Boilllot et al. 2003). This evolution is partly driven by exports in new sectors, where FDI is high. As in the case of China comparative advantage in the manufacturing of parts increases through the integration into GPNs (Freudenberg and Lemoine 1999, Kaminski and Ng 2001).
Some CEECs have become involved in the global production networks of electronic goods, office machinery and telecommunication. The automotive industry however plays a relatively more important role in some CEECs. Since the mid -1990s, the automotive industry has been driving production sharing for a number of countries (Kaminsky and Ng 2001). In this industry, production networks mainly involve EU carmakers and CEECs trade in parts and components is especially concentrated toward the EU.
This rapid comparison between China and CEECs underscore both similarities in the dynamic evolution of trade and specialization, but also differences in the focus of the new specialization in manufactures. These differences are connected with the regional orientation of trade for each zone. Structure of trade between both emerging zones and high-income countries seem to be related to the specialization of the latter. Next section explores this hypothesis by looking at the relationships between multinationals’ strategies, the specialization of the countries of origin and trade flows with emerging countries.
2. Are production networks of European multinationals different?
This section examines first the regional focus of production networks and whether American, Japanese and European multinationals build different types of GPNs. This issue is examined in more details in the case of France, by comparing intra -firm trade with China and CEECs.
2.1 The regional configuration of production networks
The analysis of trade flows indicates that multinationals build global networks, through which they organize both production and distribution activities. Distribution activities are conducted through subsidiaries located in high-income countries and typically generate horizontal intra-industry and intra-firm trade among similar countries. Production activities tend to be globally organized and involve FDI in emerging countries, so as to take advantage of their lower labor cost. And as we have seen GPNs generate intense vertical intra-industry trade flows between countries with different income levels. We now focus of the scope of these production networks and more particularly on the issue of regionalization.

14
A detailed examination of the location of their new affiliates suggests that U.S. multinationals have been shifting activities towards low-income countries since the 1990s. Growth of U.S. majority-owned foreign affiliate activity has been the most dynamic for industrial machinery in non-OECD Asia, with an annual growth rate of 23% between 1982 and 1998 (Hanson et al. 2001). Computers and office equipment account for about two thirds of industrial machinery sales, but that fraction rises to more than 90% in non -OECD Asia. Besides, the export-to-sales ratios of U.S. foreign affiliates are highest in industries commonly associated with outsourcing: computer and office equipment, electronic equipment, as well as transportation equipment. Based on these observations, Hanson et al. (2001) study the determinants of the share of imports by affiliates for further processing in affiliates’ total sales, which may be considered as a measure of vertical specialization by American multinationals. They find that vertical specialization is negatively correlated with GDP and per capita GDP. American multinationals thus tend to outsource more to low-labor-productivity countries. Vertical specialization is also negatively related to the distance from the United States, which is consistent with outsourcing requiring substantial back-and-forth movements of components and managers between parents and foreign affiliates.
Since American multinationals tend to prefer countries that are closer to the United States to organize vertical specialization, their production networks should have a regional focus. Data in table 4 confirms this hypothesis, especially for the industries in which GPNs are most developed. It shows in particular that U.S. affiliates in Mexico are the most involved in vertical specialization with their parent. Canadian affiliates are more involved in GPNs than other OECD countries, while low-income Asian countries are less involved than Mexico or other Latin American countries.
Table 4. Affiliate imports of goods for further processing as a share of American affiliate total sales in 1994, %
World Canada Mexico Other Latin America
Non OECD Asia
Total manufacturing 12.2 33.5 42.3 21.1 14.3
Industrial machinery and equipment
10.9 36.7 44.3 23.8 8.7
Electronic and other electric equipment
22.2 21.2 131.6 96.1 25.9
Transportation equipment
23.2 49.6 56.1 36.7 7.0
Source: Hanson et al. (2001)
Table 5 confirms the regional configuration of GPNs. It both looks at reverse flows from affiliates abroad to parents and compares American and Japanese multinationals. It shows that multinationals tend to focus on the local markets, but that this tendency is stronger in high-income countries. Europe is in a specific situation since regional integration and the limited size of each national market compound as incentives for multinationals to organize horizontal intra -firm trade. The table further shows that exports to the home country are more intense from low-income countries that are closer, such as Mexico in the case of the United States and China in the case of Japan.
Table 5. Destination of sales by subsidiaries of Japanese and US Firms, by Location, 1999

15
Location of Operation Destination of sales
Japan U.S. Europe East Asia (exc.
Japan)
China Latin America
All countries
U.S. Subsidiaries Local Market 90.1 - 56.7 39.6 50.4 65.1 57.7
Exports to other countries 7.1 - 37.5 32.8 29.6 13.1 27.2 Export to the U.S. 2.8 - 5.8 27.6 20.0 21.8 15.1
Japanese Subsidiaries
Local Market - 90.4 60.1 48.2 47.0 77.3 70.0 Exports to other countries - 7.3 36.3 28.5 21.8 17.7 20.4
Exports to Japan - 2.3 3.6 26.0 31.2 5.0 9.6
Source: Fukao et al. (2003), based on data from the Department of Commerce (U.S.) and METI (Japan)
According to table 5, both Japanese and American subsidiaries in East Asia nevertheless tended to export a substantial part of their total sales to other countries than the home country. This fits well with the emerging regional division of labor in East Asia and to the increasing role of China. It also suggests that East Asia is attractive even for American companies as a manufacturing platform.
Table 6 focuses on the case of China and allows us to have a more precise assessment of the role of China in the production networks of multinationals from different home countries. Subsidiaries with Asian parents exhibit the tightest production links with their parent and intense vertical intra -firm trade. Trade for processing represents more than 40% of both their imports and exports. American affiliates export a similar share of their production after processing in China, but import much less for processing into China. American parents have not organized to export intensely components to their Chinese subsidiaries, which suggests that they rely relatively more on local or regional sourcing.
These patterns could be related to the more general approach of American firms to outsourcing, which has been discussed above in section. The major contract manufacturers in electronics, such as Flextronics or Solectron, are American. As they focus on manufacturing operations and efficiency, they are very mo re mobile and keen to take advantage of low cost capabilities in emerging regions, especially Latin America and Asia. As a result, they may be quicker to localize production facilities in new areas, which could lower intra -firm trade between the home country and low cost regions.
European multinationals exhibit yet another behavior, with a much lower rate of vertical intra-firm trade. Their subsidiaries have only one third of their exports being classified as “processed exports”. Moreover, a very small portion of the imports by French and German subsidiaries is aimed at further processing. This dovetails with conclusions from studies on trade, which have emphasized that European firms tend to focus on sales to the Chinese domestic market, including in particular for machinery. An analysis of Chinese trade by stages of production shows that China has its largest trade deficit for capital goods with Europe. In high tech products, 43% of Chinese imports of capital goods come from Europe, 28% from Asia and 26% from America.7 For the same products, capital goods represented 65% of imports from Europe in 1999, while parts and components represented only 30%.
7 Calculated from data for 1999 in Lemoine and Unal Kesenci (2002a) on trade in high tech products broken down by stages of production.

16
Table 6. Share of Foreign Subsidiaries in Chinese Trade, in % of Total Trade by Partner, 1999
World Japan Korea Taiwan U.S. E.U. 15
Germany2 France2 UK2
Total exports 100 100 100 100 100 100 100 100 100 Exports by foreign firms
45 55 44 50 54 42 38 42 42
- of which after processing 1
38 43 36 42 48 36 33 37 38
Total imports 100 100 100 100 100 100 100 100 100 Imports by foreign firms
52 63 58 65 43 49 60 39 59
- of which for processing 1
32 43 44 50 21 12 11 6 19
1. China’s custom data distinguishes “ordinary” trade and “trade processing”. 2. For France, Germany and the UK, data is for 1997. Data for other countries were little different in 1997,
which means that in 1999, the contrast was certainly still very strong with European countries. Source: Lemoine and Unal-Kesenci (2002b); personal communication of data by the authors for France, Germany and the UK.
The specific profile of European multinationals could be due to distance from China. Total EU FDI in China has been equivalent to that of the United States and Japan, but European multinationals are relatively more involved in CEECs, where they are on the main first investors. The specific profile of European multinationals could also be due to their industries of specialization. Next section explores these hypotheses. It more specifically studies whether the more intensive involvement of French multinationals in CEECs generates a different trade pattern with Eastern Europe by exploring the characteristics of intra-firm trade. It examines in particular the intensity and distribution of vertical specialization with China and CEECs.
2.2 China and CEECs in French intra-firm trade
French trade with China and CEECs has been increasing since the 1990, but remains relatively low. The share of trade with China in French international exchanges is much lower than for Japan and the United States, but also lower than for Germany, the largest EU economy. Since the end of the 1990s, the share of German exports going to China has increased, while the share of French exports to China is less dynamic. As a result, the share of China in total exports, which was similar and around 1% for both countries in the early 1990s, is now around 2% for Germany. The share of German exports to CEECs has consistently been higher for Germany and at the beginning of the 2000s, it is around 8%, as opposed to 3% for France.
The geographical structure of French trade partly reflects the development of French multinationals. French firms have rapidly internationalized from the end of the 1980s on and have to a large extent caught up with firms from other high-income countries. During the 1990s, French firms have in particular actively invested in the United States. French multinationals nevertheless remain quite centered on the EU. This major characteristic has to be emphasized when discussing the development of GPNs by French firms.
Intra-EU trade represents two thirds of total French trade. The weight of EU is even higher in French IFT, reaching 70%. As a consequence of the completion of the Single market in

17
the early 1990s, French and European multinationals have rationalized their production sites at the regional level, which has generated intense intra -firm intra-regional trade. The share of IFT with the EU is higher than the share of intra-firm in total French trade (table 9). The share of IFT is generally high with all the Triad zones, but American subsidiaries exhibit a relatively low rate of intra-firm imports, while on the contrary Japanese subsidiaries exhibit a relatively low intra-firm export rate (table 9).
Table 9. Intra firm trade as a share of total French trade, in %, 1999
Imports Exports EU 38.8 45.1 U.S. 34.3 51.6 Japan 51.8 44.3 China 15.3 22.3 CEECs 37.0 38.5 Total trade 36.8 40.1
IFT flows among Triad countries are mainly distribution oriented as three fourth of the products that are shifting within multinationals are sold without any further transformation (appendix 1 on the survey). European groups exhibit a distinctive behavior, with most of their intra-firm imports coming from their home country. 90% of imports by German subsidiaries in France are intra-firm and more than three fourth of these imports come from Germany. The profile is similar for Italian and British subsidiaries, but quite different for extra-European multinationals. American subsidiaries in France for example exhibit a quite even distribution of the ir intra-firm imports, including in particular the U.S. (14%), Germany (19%), the UK (19%) and Ireland (12%). Japanese subsidiaries source most of their intra-firm imports (53%) from Japan, but also 11% from the UK and about 20% from outside the Triad.
French IFT is thus mainly horizontal IIT among Triad countries and even more intensely within the EU. European firms have specialized their production sites in Europe so as to reap more economies of scale. This is the case in particular in automobiles and pharmaceuticals, the two sectors in which IFT is the most intense. The situation is nevertheless quite different for IFT with countries from outside of the Triad.
IFT is relatively less important with emerging countries (table 9), where French industrial multinationals have yet relatively little operations. A comparison with the previous survey conducted in 1993 nevertheless shows that IFT with emerging countries increases. It is the highest for Latin America, for which 39% of exports are intra-firm. It has remarkably increased with emerging Asia8: from 4.4% of imports in 1993 to 21.8% in 1999, and from 7.8% of exports to 32.1%. This rate is approaching that of IFT with CEECs (table 9). IFT with China has also increased, but remains much lower than with CEECs. These observations confirm the relationship between FDI and IFT.
IFT with both CEECs and China has also very different characteristics from IFT with high-income countries. A comparison between the two zones further shows that the regional focus of GPNs also has an impact on the products being exchanged through IFT.
Studies have generally been interested in the share of IFT in total trade in order to evaluate
8 China, Hong Kong, Indonesia, Korea, Malaysia, Philippines, Singapore, Taiwan, Thailand.

18
the role of multinationals in total trade, as in table 9. In order to study in detail IFT and the organization of GPNs, it seems at least as interesting to examine IFT intensity, which I define as the share of IFT in total exports or imports of a specific industrial group.9 Table 10 shows IFT intensity and clearly indicates the differences between groups from different home countries. French groups tend to have a lower IFT intensity than foreign multinationals, except for trade with CEECs. In that case, firms from other EU countries trade relatively more with CEECs from their own territory. The IFT in tensity of French firms is on the contrary very low with China, reflecting their limited presence in the country.
A comparison of IFT with China between tables 9 and 10 further indicates that multinationals represent a small share of total French imports from China. Intra-firm imports from China represent 15% of total trade and intra -firm import intensity for industrial groups 44%. This suggests that independent firms make a substantial share of imports from China, which may be smaller firms or various distribution channels, importing directly from Chinese suppliers. Such a discrepancy between IFT as a share of total trade and IFT intensity does not exist on the export side, with groups being the major actors.
Table 10. Intra firm trade intensity, in % of total trade by industrial groups
Imports Exports Trade partner All industrial
groups French groups
Foreign owned firms
All industrial groups
French groups
Foreign owned firms
EU 59.5 31.8 73.1 60.0 58.3 62.7 U.S. 55.6 14.5 67.1 61.0 59.0 64.6 Japan 72.0 2.31 81.0 59.2 58.1 62.2 China 43.8 25.7 51.9 23.0 12.2 54.3 CEECs 39.0 44.8 27.3 49.0 50.1 48.2 Total trade 56.8 31.6 70.1 54.0 50.0 59.2
IFT between France and China
IFT is quite low in imports from China (tables 9 and 11). IFT is thus relatively low for the first import from China, i.e. office equipment. Table 11 nevertheless shows that IFT is much more intense for some of the most important imports from China. This is the case in particular for consumer electronics,10 toys and basic chemicals, with IFT intensity reaching 76%, 72% and 69% respectively. Intra -firm imports are also relatively high for domestic appliances and photographic equipment. The production process of most of these products can be divided into separable segments or modules and Ch ina has a comparative advantage for some of these segments. For electronic goods, China has an advantage in the assembly stage, while multinationals control distribution networks. As a result, most of these imports are for resale. This is also the case for toys and sport goods, where distribution networks are important. On the contrary, most imports of basic chemicals are for further transformation. A substantial share of intra-firm imports are also aimed at further transformation in the sectors where advanced countries may still have some technological advantage, like optics and products for the emission and transmission of sounds and
9 See the definition of groups (which are basically multinationals) in appendix 1. In 1999, overall, trade by industrial groups represented 75% of French exports and 64% of French imports of industrial products. 10 Products for the reception, recording and reproduction of sounds and images.

19
images. Conversely, IFT is very low for apparel.
Table 11. Characteristics of imports by groups from China
Share in imports from
China
IFT intensity Share of resale in own IFT*
Share of transformation
in own IFT* Office equipment, data processing
18.2 37.4 96.0 4.0
Products for the reception, recording and reproduction of sounds and images**
11.9 76.1 72.3 27.7
Basic chemicals 9.1 68.9 0.8 99.2 Electrical engines, generators and transformators
4.9 43.6 67.3 32.7
Toys and games 4.8 72.7 98.1 1.9 Products for emission and transmission of sounds and images**
4.7 59.3 65.9 34.1
Apparel 4.5 16.5 89.7 10.3 Plastic products 4.1 26.0 72.2 27.8 Optical and photographic equipment
3.9 67.1 76.7 23.3
Other electrical material 3.0 9.8 59.9 40.1 Travel goods 2.5 31.7 87.3 12.7 Domestic appliances 1.4 66.7 99.3 0.7 Sport goods 0.9 56.6 100 0 Car components 0.1 59.9 68.2 31.8 Total imports by groups 100 43.8 68.8 31.2 * Intra- firm trade may also be used for investment. This use is generally very low and not reported here. Finally, some firms did not answer this question from the survey (appendix), but they represent a very low share of trade. Shares for resale and transformation are calculated on the total of firms that answered this question.
** Products in italics belong both to the most imported and most imported products from China.
Table 12 shows that for some of products foreign firms play a major role in intra -firm imports from China. American subsidiaries represent more than 50% of imports of toys and office equipment, and firms from Switzerland 68% of imports of basic chemicals. The observation of table 12 further suggests that the origin and characteristics of intra -firm trade flows depend on the competitiveness of the parent company. American and Japanese groups are thus the main importers of office equipment from China, while French and German groups play a marginal role. Imports by American and Japanese groups, which are for resale, have presumably been assembled in China. Conversely, imports of products for the emission and transmission of sounds and images are mainly controlled by French and Dutch firms, which may be related to the strong position of such firms as Alcatel.
Consumer electronics as well as products for the emission of sounds and images are quite interesting to examine because they are intensely imported and exported by groups (tables 11 and 13). Consumer electronics represent a higher share of imports, while professional electronics11 represent a higher share of exports. This seems consistent with comparative advantage. In both cases, the data on IFT in tables 11 to 14 suggest that there is
11 Products for the emission and transmission of sounds and images.

20
fragmentation of production between France and China. Groups from various nationalities participate in intra-firm imports, including firms from South Korea and China. Chinese groups only appear for consumer electronics and their imports are for further transformation in France. This is also the case of the majpority of imports by Japanese firms. On the export side, consumer electronics are mainly for resale in China. Professional electronics for the emission and transmission of sounds and images are mainly imported by French groups for further transformation. They are mainly exported to China by Canadian and French firms and exclusively for resale on the local market. These observations do suggest a pattern of vertical specialization between France and China for both consumer and professional electronics. Overall, consumer electronics seem to be the major products for which firms have developed fragmentation of production between France and China. Groups from different nationalities participate in this process, including in particular Japanese companies.

21
Table 12. Intra -firm imports from China, by nationality of the parent company Share in
imports from China
IFT intensity
Share of resale in own IFT
Share of transformation in own
IFT Office equipment
United States 52.4 2.3 100 0 Japan 37.0 84.8 95.7 4.3 Germany 3.8 1.7 100 0 France 2.1 31.8 78.6 21.4
Products for the reception, recording and reproduction of sounds and images Netherlands 27.8 91.5 100 0 Japan 26.9 66.3 31.8 68.2 France 25.5 59.5 74.3 25.7 South Korea 5.3 99.9 100 0 China 5.0 100 0 100 United States 2.0 85.1 100 0
Basic chemicals Switzerland 67.6 99 0 100 France 21.4 1.2 99.3 0.7 United States 4.9 27.5 0 100
Electrical engines, generators and transformators France 37.8 27.9 2.2 97.8 United States 26.2 51.1 100 0 Netherlands 14.7 95.2 100 0 Japan 11.1 50.3 30.6 69.4 Germany 7.9 0.6 0.7 99.3 Toys and games
United States 53.3 89.8 100 0 France 15.0 11.6 19.4 80.6 Japan 13.2 80.0 100 0 Germany 11.3 48.7 100 0
Products for emission and transmission of sounds and images France 60.2 38.6 17.2 82.8 Netherlands 24.8 100 100 0 Japan 11.5 88.3 91.5 8.5 United States 2.3 27.8 100 0
Apparel France 53.1 8.2 61.5 38.5 United States 22.5 9.8 100 0 Germany 10.2 8.6 100 0 Switzerland 9.8 87.3 100 0
Exports to China are very concentrated on aerospace products and boilers (table 13), both industries for which France exhibits a strong comparative advantage. In both cases French firms account for all exports. Aerospace products are directly exported to Chinese clients and IFT is zero. Intra-firm exports represent a small share of total exports for boilers, but mostly for resale. Intra-firm exports are much higher in electronics. The share of French groups is low in exports of electronic components, which are dominated by American subsidiaries (table 14).

22
Table 13.Characteristics of exports by groups from China
Share in exports to
China
IFT intensity Share of resale in own IFT*
Share of transformation
in own IFT* Aerospace products 31.3 0 - - Boilers 10.5 12.5 72.85 27.15 Products for emission and transmission of sounds and images**
7.6 81.8 98.8 1.2
Equipment for the distribution of electricity
4.9 47.0 71.5 28.5
Other machines with specific use
4.2 14.0 22.1 77.9
Mechanical equipment 3.9 6.8 47.5 52.5 Electronic components 3.8 88.4 57.9 42.1 Basic chemicals 3.3 14.6 86.7 13.3 Oil and natural gas 2.9 0 - - General machinery 2.3 26.8 46.3 53.7 Products for the reception, recording and reproduction of sounds and images**
2.3 65.3 97.4 2.6
Measurement instruments 2.2 17.7 18.9 81.1 Car components 2.0 80 0 100 Total exports by groups 100 23 66 34
* Intra- firm trade may also be used for investment. This use is generally very low and not reported here. Finally, some firms did not answer this question from the survey (appendix), but they represent a very low share of trade. Shares for resale and transformation are calculated on the total of firms that answered this question.
** Products in italics belong both to the most imported and most imported products from China.

23
Table 14. Intra -firm exports to China, by nationality of the parent company Nationality of
parent companies
Share in exports to
China
IFT intensity
Share of resale in own IFT
Share of transformation in own
IFT
Aerospace products
France 99.8 0 nd nd
Boilers France 95.6 9.2 100 0
Products for emission and transmission of sounds and images
Canada 65.4 100 100 0
France 29.0 50 100 0 Equipment for the distribution of electricity
France 89.1 47.3 73.7 23.3
United States 7.9 36.3 26.6 73.4
Other machine with specific use
France 45.1 13.9 11.8 88.2
United States 21.5 18.9 17 83
Netherlands 16.6 0 nd nd
Switzerland 12.2 21.5 60.3 39.7
Electronic components
United States 51.6 95.6 92.0 8
France 20.5 67.1 42.5 57.5
Netherlands 25.2 100 0 100
Mechanical equipment
France 59.7 0.17 100 0
Germany 7.6 0.15 Nd nd
United States 7.4 13.2 20.5 79.5
Basic chemicals France 71.3 6.2 78.4 21.6
United States 10.0 16.2 99 1
United Kingdom 4.8 100 100 0
IFT between France and CEECs
On average, IFT is more intense with CEECs than with China, especially on the export side. Table 15 shows that it is extremely high for the two major imported products, cars and consumer electronics. In both cases, imports are for resale. In the case of cars, the majority of imports are made by German firms and in the case of consumer electronics, by Dutch firms (table 16).

24
Table 15. Characteristics of imports from CEECs by groups
Share in intra-firm imports from CEECs
IFT intensity Share of resale in IFT
Share of transformation
in IFT Cars 17.2 99.9 100 0 Products for the reception, recording and reproduction of sounds and images
15.5
94.1
87.5
12.4
Apparel 5.4 36.9 98.3 1.7 Car components 5.2 45.7 22.5 77.5
Other metal work 4.2 20.9 86.6 13.4 Electronic components 3.7 28.3 13.0 87.0 Non ferrous metals 3.3 41.1 10.3 89.7 Rubber products 3.2 75.5 95.5 4.5 Basic chemicals 2.9 30.1 0.7 99.2 Office equipment, data processing
2.8 35.9 87.3 12.7
Domestic appliances 2.7 97.7 98.6 1.4 Equipment for the distribution of electricity
2.4 75.3 42.4 57.6
Lamps and lighting material 2.0 99.9 100 0
Total imports by groups 100 61.0 78.3 21.7
* Intra- firm trade may also be used for investment. This use is generally very low and not reported here. Finally, some firms did not answer this question from the survey (appendix), but they represent a very low share of trade. Shares for resale and transformation are calculated on the total of firms that answered this question.
** Products in italics belong both to the most imported and most imported products from CEECs.
The car industry exhibits a quite clear pattern of fragmentation between France and CEECs, with intense trade of both cars and components. Cars and car components together account for 22% of both imports and exports by industrial groups. Vertical fragmentation seems quite classical in the case of car components, with both resale and further transformation. Car components are nevertheless mainly exported for resale. This complex pattern may be due to the fact that component suppliers have tended to follow carmakers in CEECs and that components are to a certain extent being produced within CEECs, and also in connection with other European countries (Brocard and Darmaillacq 2003). In the case of cars, both intra-firm imports and exports are mostly for resale, which suggests a pattern of specialization by quality level, with lower end models be ing produced in CEECs and exported to EU countries. French firms are the main actors in the case of IFT of car components with CEECs. Foreign firms are nevertheless important actors in the automobile industry and in IFT. German carmakers are by far the main importers of cars from CEECs, which reflects in particular the extensive operations of Volkswagen in these countries. For car components, the second traders after French firms are American companies.

25
Table 16. Intra -firm imports from CEECs, by nationa lity of the parent company
Share in imports to
CEECs
IFT intensity
Share of resale in own IFT
Share of transformation in own
IFT
Cars Germany 57.3 100 100 0 France 32.5 99.8 100 0 Italy 7.8 100 100 0
Products for the reception, recording and reproduction of sounds and images Netherlands 67.0 92.2 100 0 Japan 12.7 97.5 15.0 85.0
France 10.1 97.3 99.3 0.7
South Korea 9.2 100 88.4 11.5
Apparel
France 55.6 60.8 100 0 Switzerland 24.5 0.2 nd nd
United States 12.9 22.3 77.7 22.3
Germany 6.7 2.1 100 0
Car components
France 56.4 32.4 39 61
United States 19.9 69.8 6.9 93.1 Germany 17.6 74.7 13.7 88.3
Electronic components
United States 54.6 6.9 93.7 6.3 France 15.7 85.3 0.1 99.9
Netherlands 15.6 71.3 1.2 98.8
China 10.0 Na Na Na
Office equipment and data processing
United States 86.8 26.4 86.4 13.6 Netherlands 13.3 93.2 100 0
Electronic products also account for a substantial share of trade by groups between France and CEECs. Electronic components, which include some electronic car components, and office equipment account for 11% of firms’ exports and 6% of imports. IFT is much lower on the import side than on the export side. The majority of imports of electronic components are made by American subsidiaries and are for resale. Exports are mainly done by firms from the Netherlands, including the franco -italian STMicroelectronics, which is incorporated in the Netherlands. And these exports are mainly for transformation. These patterns suggest that the re is some vertical specialization in electronic components. The observation of the IFT pattern in office equipment and consumer electronics also suggests vertical specialization between France and CEECs. In office equipment, most exports originate from American subsidairies.

26
Table 17. Characteristics of exports from CEECs by groups
Share in intra-firm exports to
CEECs
IFT intensity Share of resale in IFT
Share of transformation
in IFT Cars 16.4 84.6 88.5 11.5 Electronic components
8.6
95.4
8.3
91.7
Pharmaceuticals 6.3 55.1 91.1 8.9 Car components 6.1 83.0 88.1 11.9 Products for emission and transmission of sounds and images
5.4
13.2
66.5
33.5
Basic chemicals 3.6 23.4 66.5 33.5 Other machinery for specific use
3.4 26.4 39.2 60.8
Office equipment, data processing
3.1 92.2 99.4 0.6
Other chemical products 2.9 13.6 77.2 22.8 General machinery 2.9 48.1 35.4 64.6 Equipment for the distribution of electricity
2.6 73.8 61.0 39.0
Soap, perfume and detergents 2.1 55.1 91.1 8.9 Products for the reception, recording and reproduction of sounds and images
1.8 61.4 70.3 29.7
Total exports by groups 100 55.0 65.6 34.4 * Intra- firm trade may also be used for investment. This use is generally very low and not reported here. Finally, some firms did not answer this question from the survey (appendix), but they represent a very low share of trade. Shares for resale and transformation are calculated on the total of firms that answered this question.
** Products in italics belong both to the most imported and most imported products from CEECs.
Like in the case of trade with China, in a number of sectors, comparative advantage are clearer and production is less vertically fragmented between France and CEECs. Exports of pharmaceuticals and soaps, perfume and detergents have a relatively low IFT intensity and are mainly for resale. French firms are the main exporters. Similarly, on the import side, apparel exhibit both low IFT intensity and a high share of resale. French firms are the main importers.

27
Table 18. Intra -firm exports from CEECs, by nationality of the parent company Nationality of
parent company
Share in exports to
CEECs
IFT intensity
Share of resale in own IFT
Share of transfor-mation in own IFT
Cars
France 98.7 85.5 88.5 11.5
Electronic components Netherlands 81.6 100 1.7 98.3 United States 9.3 83.5 55.9 44.1 France 8.6 70 43.6 56.4
Pharmaceuticals
France 75.3 63.9 95.6 4.4 United Kingdom 6.1 69.4 100 0 Switzerland 4.1 86 100 0 United States 3.5 82.5 100 0
Car components France 83.8 92.4 92.7 7.3 United States 10.3 30.7 37.7 62.3 Allemagne 2.4 19.2 15.5 84.5
Products for emission and transmission of sounds and images France 60.4 8.3 50 50 Canada 28.8 1.7 100 0 Netherlands 3.5 100 100 0 Japan 3.3 50 0 100
Basic chemicals France 46.7 12 4.7 95.3 United States 18.2 36.6 99.8 0.2 Germany 6.9 75 91.6 8.4 Netherlands 9.6 28.7 60.1 39.9 United Kingdom 5.6 29.9 100 0
Soap, perfume and detergents France 62.4 62.5 98.9 1.1 United States 10.7 65.4 38.8 61.2 Switzerland 6.1 0 - - United Kingdom 6.1 100 100 0
Office equipment and data processing United States 89.4 96.4 99.7 0.3 France 9.0 75.3 98.0 2.0
Products for the reception, recording and reproduction of sounds and images
France 56.9 67.9 79.9 20.1 Canada 16.5 4.9 100 0 Japan 9.4 50.5 1.5 98.5 Netherlands 8.3 99.5 33.2 66.7
These patterns suggest that French and foreign firms located in France have started to integrate CEECs into their European networks. They further indicate that CEECs play a more important role than China in the industrial networks of French firms, but vertical specialization with China is relatively more important . The same is true for foreign firms,

28
even if there are also specific national profiles. Japanese firms thus tend to be more involved in vertical specialization, both in the case of China and CEECs .
These comparisons between IFT with China and CEECs confirm the role of regional proximity. Trade patterns are also influenced by the differences in wage levels and specialization of home countries. For example, the comparative advantage of France and Germany in the car industry strongly influences the organization of production networks with CEECs. American and Japanese firms play a relatively more important role in electronic GPNs.
Summary and Conclusions
Summary of main results
The examination of French IFT confirms a number of conclusions drawn from the comparison of multinationals’ behavior in Asia and in China in particular. One such conclusion is the focus of European groups on the Chinese local market. American and even more Japanese companies tend to be more involved in vertical trade with China. These differences may be related to the international specialization of European countries. In the case of France for example, aerospace products represent a major export to China, and it does not generate much intra -firm trade or vertical specialization. On the contrary, there is intense IFT, including for transformation, in consumer electronics, for which European countries typically have no comparative advantage. IFT in electronics is largely organized by foreign subsidiairies.
The role of wage levels in the location of production and trade flows is often underscored in the literature. This consideration is indeed important when comparing the role of China and CEECs in world trade and their respective positions in GPNs. The examination of French IFT nevertheless draws attention to the importance of the specialization of flagships’ home country. The comparison between the car industry and electronics is a case in point. One major characteristic of European multinationals is thus related to the comparative advantage of major European countries in the car industry.
French IFT patterns also confirm the regional focus of GPNs. The geographical patterns of IFT with CEECs are strongly influenced by the proximity with EU countries, in particular France and Germany. Conversely, American and Japanese firms weigh relatively more in IFT with China.12 One characteristic of European multinationals is thus related to the integration of the EU and the enlargement process.
Finally, the examination of French IFT reminds us that multinationals are only one type of actor in world trade and in the development of global sourcing. The share of IFT in total trade is lower for exchanges with CEECs, and even more with China, than in total French trade. Most imports from China and exports to China in particular are not traded within multinationals. This is again related to specialization patterns. High-income countries have lost their comparative advantage in textiles and other labor-intensive goods, where traditional patterns of country specialization develop, with companies from low wage countries and SMEs being important actors. Some products, such as apparel, represent a
12 Differences between imports and exports have been discussed in the paper.

29
relatively large share of imports by industrial groups in France, but exhibit a low IFT intensity. In labor-intensive sectors, IFT may nevertheless be quite intense if marketing plays an important role. This seems to be the case for toys and games imported from China for example.
Vertical specialization and the hollowing out syndrome
The technological and institutional dynamics that stimulate the development of GPNs should allow yet further vertical specialization in a number of sectors. Leading companies are only one type of actors in this global process. They can nevertheless use GPNs to increase their competitiveness by focusing their resources and efforts on core competences. American companies in electronics and data processing have thus strategically outsourced a large part of their manufacturing operations in order to focus on R&D, design and marketing and to speed up innovation. By doing so, they have also created a new business segment for contract manufacturers, some of which have become (American) multinationals on their own. European carmakers have also operated some vertical disintegration and expanded their GPNs to strengthen their competitiveness. Leading companies are demanding ever more competences and flexibility from electronic contract manufacturers or automobile suppliers, which in turn implies that these companies also have to keep upgrading their capabilities.
Leading companies and some of their contractors thus tend to integrate new suppliers into their global strategy. Early movers may reinforce their competitive advantage by exploiting new opportunities to simultaneously lower manufacturing costs and speed up new product development. In such a perspective, the reloca tion of some manufacturing activities abroad should not be seen by high income countries as a symptom of hollowing out and industrial decline, but rather as an opportunity to speed up the evolution of international specialization.
The sheer pace of some evolutions may be impressive. Despite anecdotes, it nevertheless seems that international specialization and in particular the specialization of China in labor intensive products, does not change rapidly (Roland Holst 2003, Ahearne et al. 2003). The objective for high income countries to reinforce their comparative advantage in knowledge-intensive products and services thus seems reasonable, provided adequate policies are further developed to improve the adaptation of low-skilled workers and lower the cost of displacement for them. Besides, firms from high income countries also benefit from the expansion of business opportunities in China. These should further develop as China becomes more open to trade and does not focus so much on building a global manufacturing platform.
The rapid evolution of some emerging countries as well as in the constant restructuring of GPNs call for further research and the examination of more recent data. It seems particularly interesting to observe the interactions between leading firms’ strategies and the evolution of national specialization. On this issue, comparisons among both home countries and host countries should bring interesting insights.

30
Appendix 1. The French Survey on Intra-Group Trade
The « survey on international intra-group exchanges » has been conducted by the SESSI from the French Ministry of the Economy, Finance and Industry. It deals with intra-firm trade by industrial groups located in France.
This second survey was launched in 2000, and questionnaires asked about 1999 operations. The first French survey of this kind on intra-firm trade had been conducted for 1993 operations.
The scope of the survey was industrial or wholesale companies located in France and being majority owned by industrial groups. International industrial groups (IIG) are defined as groups possessing at least one manufacturing subsidiary and at least one subsidiary abroad. All subsidiaries taken into consideration are majorit-owned.
The survey has been limited to firms with substantial international exchanges, i.e more than EURO 1 millions for the sum of exports and imports. The survey focused on manufactures, except military equipment.
4,305 companies belonging to 2,114 IIG have responded to the survey. These companies represent 52% of the population, but 78% of international exchanges by IIGs.

31
References
Ahearne, A. and 2003, China and Emerging Asia: Comrades or Competitors?,
Arora, A. and A. Fosfuri, A. Gambardella, 2001, Markets for Technology . The Economics of Innovation and Corporate Strategy, The MIT Press.
Artus, P., 2003, “Pourquoi le Japon exporte t-il beaucoup vers la Chine et pas les Etats -Unis?”, Flash , CDC IXIS, Paris, 4 December.
Artus, P., 2004, “La chronologie des effets de la Chine sur les pays de l’OCDE”, Flash, CDC IXIS, Paris, 21 January.
Aturupane, C. and S. Djankov, B. Hoekman, 1999, “Horizontal and Vertical Intra-Industry Trade between Eastern Europe and the European Union”, Weltwirtschaftliches Archiv, 1999, 1.
Barba Navaretti, G. and J. Haaland, A. Venables, 2003, Multinational Corporations and Global Production Networks: The Implications for Trade Policy, CEPR report, London, 8 March.
Boillot, J-J. and J. Lefilleur, Y. Lepape, 2003, Quel avenir au commerce intra -PECO?, DREE-MINEFI, Paris, available at www.dree.org/elargissement/RapportSite/EchIntraVF.pdf
Brocard, P. and C. Darmaillacq, “La filière automobile française en Europe”, Le 4 Pages, SESSI/Ministère de l’Economie, des Finances et d e l’Industrie, Paris, oct.
Ernst, D., 2003, Internationalisation of Innovation: Why is Chip Design Moving to Asia?, East-West Center Working paper, Honolulu.
Feenstra, R., 1998, “Integration of Trade and Disintegration of Production in the Global Economy”, Journal of Economic Perspectives , Vol. 12, 4.
Freudenberg, M. and F. Lemoine, 1999, Central and Eastern European Countries in the International Division of Labour in Europe, Working paper 05, CEPII, Paris.
Fukao, K., H. Ishido and K. Ito, Vertical intra-industry trade and FDI in East Asia, Hitostsubashi University, 01-2003
Hanson, G. and R. Mataloni, M. Slaughter, 2001, Expansion Strategies of U.S. Multinational firms, NBER, Draft, April.
Hobday, M., 2000, “East versus Southeast Asian Innovation Systems: Comparing OME and TNC-led Growth in Electronics”, L. Kim and R. Nelson (eds.), Technology, Leraning, & Innovation, Cambridge University Press.
Hu, X. and Y. Ma, “International Intra-Industry Trade of China”, Weltwirtschaftliches Archiv , 1999, 1,.
Hummels, D. and J. Ishii, K-M. Yi, 2001,” The nature and growth of vertical specialization in world trade”, Journal of International Economics , 54, 75 -96.
Kaminski, B. and F. Ng, 2001, Trade and Production Fragmentation: Central European Economies in EU Networks of Production and Marketing, Policy Research Working Paper 2616, The World Bank, Washington DC., June
Kaminski, B. and B. Smarzynska, 2001, Foreign Direct Investment and Integration into Global Production and Distribution Networks: The Case of Poland , Working paper 2646, World Bank, Washington DC.
Lemoine, F. and D. Unal-Kesenci, 2002a, China in the International Segmentation of Production Processes, Working paper 02, CEPII, Paris.

32
Lemoine, F. and D. Unal-Kesenci, 2002b, “Chine: spécialisation internationale et rattrapage technologique”, Economie Internationale, 4è trim., CEPII, 11 -40.
Martin, W. and V. Manole, 2003, China’s Emergence as the Workshop of the World , World Bank mimeo, sept.
Masuyama, S., 2004, “The Asian Strategy of Japanese Multinationals: Focus on China”, draft prepared for the Tokyo Club research meeting, Feb. 9-10.
Mayer, J. and A. Butkevicius, A. Kadri, J. Pizarro, 2003, “Dynamic Products in World Exports”, Review of World Economics , vol. 139, n°4, 763 -795.
Munakata, N., 2003, “The Impact of the Rise of China and Regional Economic Integration in Asia – A Japanese Perspective”, Statement before the U.S.-China Economic and Secutiry Review Commission, Dec, 4. Washington D.C.
OECD, 2002, “Intra-Industry and Intra-Firm Trade and the Internationalization of Production”, OECD Economic Outlook n°71, June.
Radosevic, S., 2002, The electronics industry in central and eastern Europe: An emerging production location in the alignment of networks perspective, Working paper 21, Centre of the study of economic & social change, University College London, March.
Sachwald, F., 2003, “Du bon usage de la mondialisation”, Politique Etrangère , Summer, IFRI, Paris.
Sachwald, F. and S. Perrin, 2003, Multinationales et développement. Le rôle des politiques nationales, Agence Française de Développement, Paris. A previous English version is available on www.ifri.org
Sturgeon, T., 2002, “Modular production networks: a new American model of industrial organization”, Industrial and Corporate Change, vol. 11, nb. 3, 451-496.
Sturgeon, T. and R. Lester, 2003, The New Global Supply-Base: New Challenges for Local Suppliers for East Asia, MIT IPC Working paper 03-001, MIT, Cambridge.
Radosevic, S., 2002, The electronics industry in central and eastern Europe: An emerging production location in the alignment of networks perspective, Working Paper n°21, Centre for the study of Economic and Social change in Europe, University College London, March.
World Bank, 2003, Global Economic Prospects 2004, World Bank, Washington D.C.