the inner region of the milky way galaxy in high energy ... · pdf filemilky way galaxy in...
TRANSCRIPT

UCLA Dark Matter 2012Marina del Rey
22-24 February 2012
The Inner Region of the Milky Way Galaxy in High
Energy Gamma Rays
Simona Murgia, SLAC-KIPACfor the Fermi LAT Collaboration

Gamma rays from DM Annihilation
arXiv:0908.0195

Dark Matter Distribution
NFW profile
�0 = 0.3 GeV/cm3
a0 = 20 kpc, r0 = 8.5 kpc
The dark matter annihilation (or decay) signal strongly depends on the dark matter distribution.Cuspier profiles and clumpiness of the dark matter halo can provide large boost factors
Bertone et al., arXiv:0811.3744
✓ Via Lactea II (Diemand et al 2008) predicts a cuspier profile, ρ(r)∝r-1.2
✓ Aquarius (Springel et al 2008) predicts a shallower than r-1
innermost profile
Navarro, Frenk, and White 1997
3
⇢(r) = ⇢0r0r
(1 + r0/a0)2
(1 + r/a0)2

The Fermi Sky
Fermi LAT data 2 years, E > 1 GeV

Understanding the Gamma-ray Sky
= + +data sources galactic diffuse isotropic
+dark matter??

The diffuse gamma-ray emission from the Milky Way is produced by cosmic rays interacting with the interstellar gas and radiation field and carries important information on the acceleration, distribution, and propagation of cosmic rays.
Galactic Diffuse Emission
= + +data sources galactic diffuse isotropic
Inverse Compton Bremsstrahlung π0-decay
x-ray, gamma-rayx-ray, gamma-ray
proton
proton
synchotron radiation inverse Compton scattering
bremsstrahlung radiation
All of these mechanisms create also non γ-ray radiation

Example model:CR source distribution: SNRsCR confinement region: 20 kpc radius, 4 kpc height
Cosmic ray origin, propagation, and properties of the interstellar medium can be constrained by comparing the data to predictions.
Generate models (in agreement with CR data) varying CR source distribution, CR halo size, gas distribution (GALPROP, http://galprop.stanford.edu) and compare with Fermi LAT data (21 months, 200 MeV to 100 GeV, P6 DATACLEAN)
– 88 –
Fig. 7.— Fractional residual maps, (model ! data)/data, in the energy range 200 MeV –
100 GeV. Shown are residuals for model SSZ4R20T150C5 (top) and model SLZ6R20T"C5
(bottom). The maps have been smoothed with an 0.5! hard edge kernel, see Figure 6.
– 96 –
Fig. 15.— Spectra extracted from the inner Galaxy region for model SSZ4R20T150C5. See
Figure 12 for legend.
(data - prediction)/prediction) for example model
Inner galaxy
isotropic
IC
DGE Total π0-decaybremsstrahlung
sources
All Sky Modeling
On a large scale the agreement between data and prediction is overall good, however some extended excesses stand out.
Fermi LAT Collaboration, to appear in ApJ
Fermi LAT Collaboration, arXiv:1202.4039 (to appear in ApJ)

Outflow from the center of the Milky Way: jets from the supermassive black hole? starburst?
Gamma-ray bubbles (Su et al 2010):
‣ very extended (~ 50o from plane)
‣ hard spectrum (~E-2, 1-100 GeV)
‣ sharp edges
‣ possible counterparts in other wavelengths (ROSAT, WMAP, and Planck)
“Gamma-ray Bubbles” Su, Slatyer, and Finkbeiner (2010)
Extended Lobe-like Features in the Fermi Sky
Fermi LAT data, E>10 GeV

☺ Steep DM profiles predicted by CDM ⇒ Large DM annihilation/decay signal from GC!
Galactic Center Region
☹ Good understanding of the conventional astrophysical background is crucial to extract a potential DM signal from this complex region of the sky:
‣ source confusion: many energetic sources near to or in the line of sight of the GC
‣ diffuse emission modeling: large uncertainties due to the overlap of structures along the line of sight, difficult to model

☺ Steep DM profiles predicted by CDM ⇒ Large DM annihilation/decay signal from GC!
☹ Good understanding of the conventional astrophysical background is crucial to extract a potential DM signal from this complex region of the sky:
‣ source confusion: many energetic sources near to or in the line of sight of the GC
‣ diffuse emission modeling: large uncertainties due to the overlap of structures along the line of sight, difficult to model
Galactic Center Region
– 82 –
Fig. 1.— CR source density at z = 0 in arbitrary units as a function of Galactocentric
radius. Solid black curve: SNRs (Case & Bhattacharya 1998). Dashed blue curve: Pulsars
(Lorimer et al. 2006). Dotted red curve: Pulsars (Yusifov & Kucuk 2004). Dash-dotted
green curve: OB stars (Bronfman et al. 2000). While the units are arbitrary, the relative
normalisations of the curves in the figure match those found in the GALPROP models used
in this analysis. The CR flux of the models is normalised to the observed CR flux at the solar
circle after propagation. The normalisation is done at 100 GeV and is therefore una!ected
by modulation.
Average gas density
Interstellar radiation fieldCosmic ray source density
SNRs
Pulsars (Lorimer 2006)
Pulsars (Yusifov&Kukuk 2004)
OB stars
z= 0 pc 100 pc 200 pc

DATA
Fermi’s View of the Inner Galaxy (15ox15o region)
Fermi LAT preliminary results with 32 months of data, E>1 GeV (P7CLEAN_V6, FRONT):

DATA
Fermi’s View of the Inner Galaxy (15ox15o region)
Fermi LAT preliminary results with 32 months of data, E>1 GeV (P7CLEAN_V6, FRONT):
Galactic diffuse emission model: all sky GALPROP model tuned to the inner galaxy
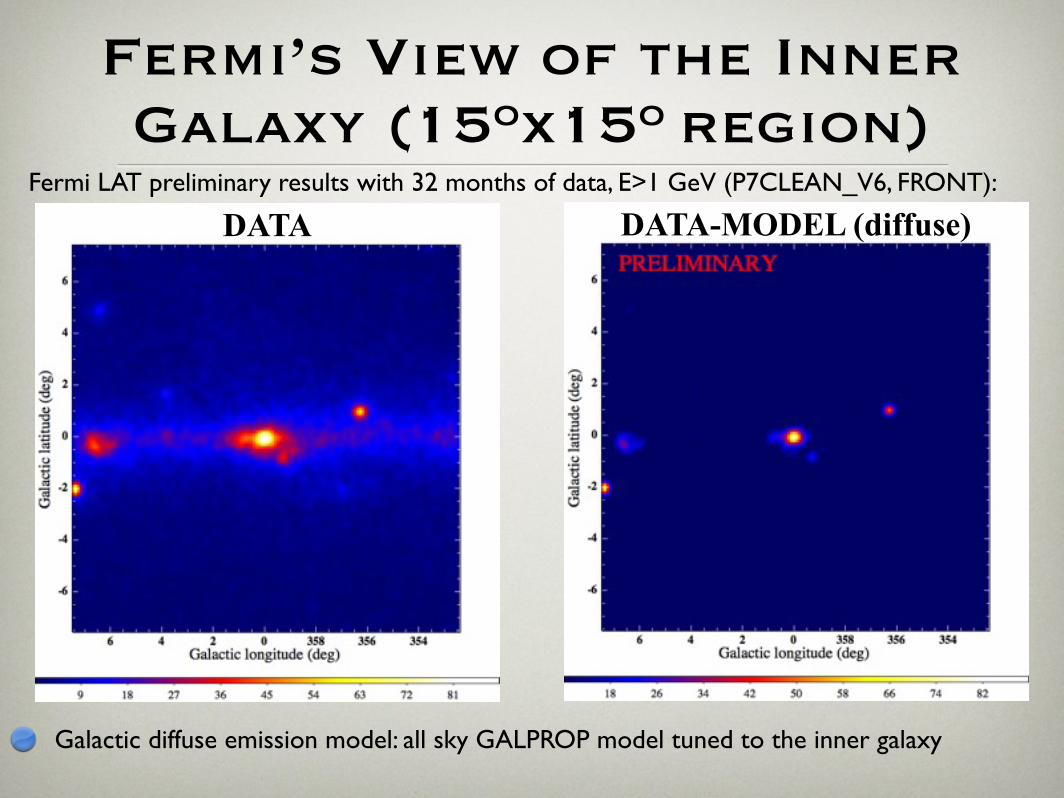
DATA DATA-MODEL (diffuse)
Fermi’s View of the Inner Galaxy (15ox15o region)
Fermi LAT preliminary results with 32 months of data, E>1 GeV (P7CLEAN_V6, FRONT):
Galactic diffuse emission model: all sky GALPROP model tuned to the inner galaxy

DATA DATA-MODEL (diffuse)
Fermi’s View of the Inner Galaxy (15ox15o region)
Fermi LAT preliminary results with 32 months of data, E>1 GeV (P7CLEAN_V6, FRONT):
W28
LAT PSR J1809-2332
LAT PSR J1732-3131
2FGL J1745.6-2858
➡ Bright excesses after subtracting diffuse emission model are consistent with known sources.
Galactic diffuse emission model: all sky GALPROP model tuned to the inner galaxy

DATADATA DATA-MODEL (diffuse+sources)
Fermi’s View of the Inner Galaxy (15ox15o region)
Fermi LAT preliminary results with 32 months of data, E>1 GeV (P7CLEAN_V6, FRONT):

DATADATA DATA-MODEL (diffuse+sources)
Fermi’s View of the Inner Galaxy (15ox15o region)
Fermi LAT preliminary results with 32 months of data, E>1 GeV (P7CLEAN_V6, FRONT):
➡ Diffuse emission and point sources account for most of the emission observed in the region.

HESS
H.E.S.S., MAGIC, VERITAS: Galactic Center Source
GC source spectrum consistent with astrophysical particle accelerators
Consistent spectrum observed by HESS (>100 hrs), MAGIC and VERITAS (~ 25 hrs, large zenith angle observations)
Aharonian et al 2006
HESS

HESS
H.E.S.S., MAGIC, VERITAS: Galactic Center Source
GC source spectrum consistent with astrophysical particle accelerators
Consistent spectrum observed by HESS (>100 hrs), MAGIC and VERITAS (~ 25 hrs, large zenith angle observations)
Aharonian et al 2006
HESS

Galactic Center Source: GeV/TeV
GeV/TeV spectrum compatible with gamma-ray production from protons accelerated in Sgr A* and diffusing in the interstellar medium
No time variability
R. Ong, TeVPA 2011
Aharonian et al 2006
HESS

Diffuse TeV Emission
Single source of cosmic rays does not seem to explain the observed diffuse emission in the galactic ridge observed by HESS
Wommer et al 2008
0.2-10 TeV emission if Sgr A* is sole source of CR
Aharonian et al 2006
HESS
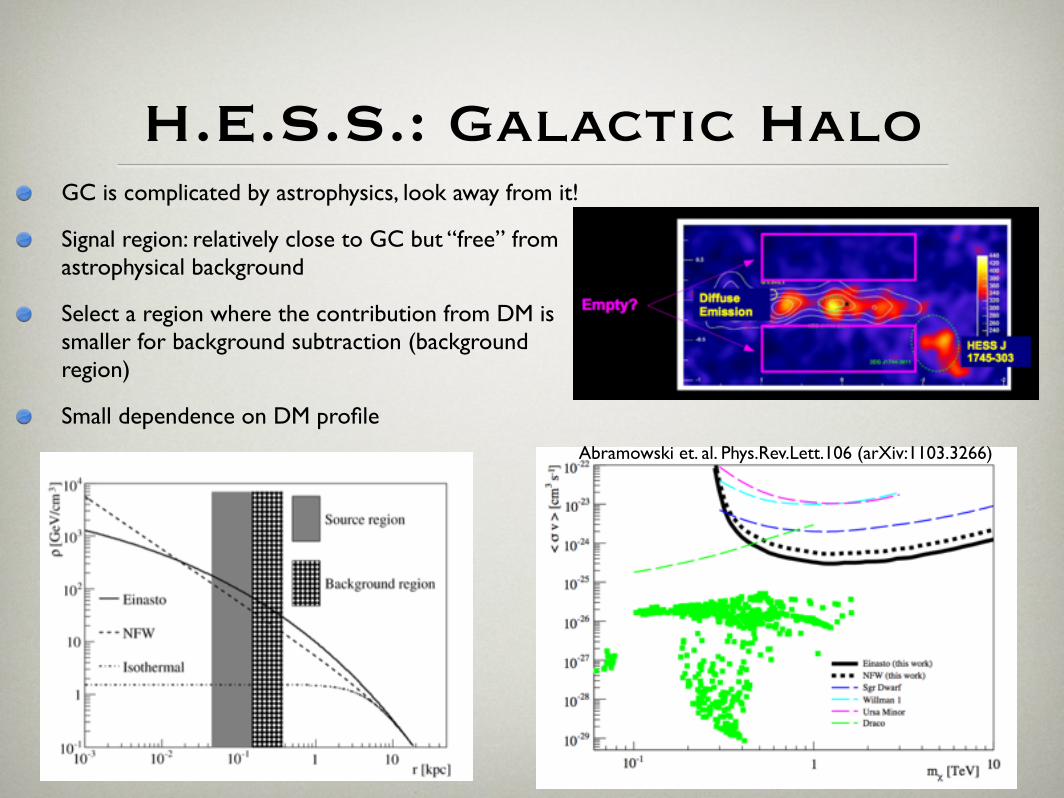
H.E.S.S.: Galactic HaloGC is complicated by astrophysics, look away from it!
Signal region: relatively close to GC but “free” from astrophysical background
Select a region where the contribution from DM is smaller for background subtraction (background region)
Small dependence on DM profile
Abramowski et. al. Phys.Rev.Lett.106 (arXiv:1103.3266)

Preliminary results from Fermi LAT show that most of the emission from a 15ox15o region around the direction of the Galactic center can be modeled in terms of diffuse emission and sources. Papers are forthcoming and will include dark matter results
Interesting constraints on the nature of dark matter have been determined by HESS with very high energy gamma rays
Our knowledge of the conventional astrophysical background is uncertain. This is currently a big limitation for the search of dark matter in the Galactic center with gamma rays, which otherwise has huge potential for discovery or for setting constraints.
In addition, better understanding of the dark matter density distribution in the Galactic center is essential in interpreting observations.
Conclusions
Thank you!