the influence of temperature on ozone production …...j. coates et al.: the influence of...
TRANSCRIPT
Atmos. Chem. Phys., 16, 11601–11615, 2016www.atmos-chem-phys.net/16/11601/2016/doi:10.5194/acp-16-11601-2016© Author(s) 2016. CC Attribution 3.0 License.
The influence of temperature on ozone production under varyingNOx conditions – a modelling studyJane Coates1, Kathleen A. Mar1, Narendra Ojha2, and Tim M. Butler1
1Institute for Advanced Sustainability Studies, Potsdam, Germany2Atmospheric Chemistry Department, Max Planck Institute for Chemistry, Mainz, Germany
Correspondence to: Jane Coates ([email protected])
Received: 24 March 2016 – Published in Atmos. Chem. Phys. Discuss.: 9 May 2016Revised: 24 August 2016 – Accepted: 3 September 2016 – Published: 20 September 2016
Abstract. Surface ozone is a secondary air pollutant pro-duced during the atmospheric photochemical degradation ofemitted volatile organic compounds (VOCs) in the presenceof sunlight and nitrogen oxides (NOx). Temperature directlyinfluences ozone production through speeding up the rates ofchemical reactions and increasing the emissions of VOCs,such as isoprene, from vegetation. In this study, we usedan idealised box model with different chemical mechanisms(Master Chemical Mechanism, MCMv3.2; Common Repre-sentative Intermediates, CRIv2; Model for OZone and Re-lated Chemical Tracers, MOZART-4; Regional Acid Depo-sition Model, RADM2; Carbon Bond Mechanism, CB05)to examine the non-linear relationship between ozone, NOx
and temperature, and we compared this to previous obser-vational studies. Under high-NOx conditions, an increase inozone from 20 to 40 ◦C of up to 20 ppbv was due to fasterreaction rates, while increased isoprene emissions added upto a further 11 ppbv of ozone. The largest inter-mechanismdifferences were obtained at high temperatures and high-NOx emissions. CB05 and RADM2 simulated more NOx-sensitive chemistry than MCMv3.2, CRIv2 and MOZART-4,which could lead to different mitigation strategies being pro-posed depending on the chemical mechanism. The increasedoxidation rate of emitted VOC with temperature controlledthe rate of Ox production; the net influence of peroxy nitratesincreased net Ox production per molecule of emitted VOCoxidised. The rate of increase in ozone mixing ratios withtemperature from our box model simulations was about halfthe rate of increase in ozone with temperature observed overcentral Europe or simulated by a regional chemistry transportmodel. Modifying the box model set-up to approximate stag-nant meteorological conditions increased the rate of increase
of ozone with temperature as the accumulation of oxidantsenhanced ozone production through the increased productionof peroxy radicals from the secondary degradation of emit-ted VOCs. The box model simulations approximating stag-nant conditions and the maximal ozone production chemicalregime reproduced the 2 ppbv increase in ozone per degreeCelsius from the observational and regional model data overcentral Europe. The simulated ozone–temperature relation-ship was more sensitive to mixing than the choice of chemi-cal mechanism. Our analysis suggests that reductions in NOx
emissions would be required to offset the additional ozoneproduction due to an increase in temperature in the future.
1 Introduction
Surface-level ozone (O3) is a secondary air pollutant formedduring the photochemical degradation of volatile organiccompounds (VOCs) in the presence of nitrogen oxides(NOx ≡NO+NO2). Due to the photochemical nature ofozone production, it is strongly influenced by meteorologi-cal variables such as temperature (Jacob and Winner, 2009).In particular, heatwaves, characterised by high temperaturesand stagnant meteorological conditions, are correlated withhigh ozone levels as was the case during the European heat-wave in 2003 (Solberg et al., 2008; Vautard et al., 2005). Fur-thermore, Otero et al. (2016) showed that temperature was amajor meteorological driver of summertime ozone concen-trations in many areas of central Europe.
Temperature primarily influences ozone production in twoways: speeding up the rates of many chemical reactionsand increasing emissions of VOCs from biogenic sources
Published by Copernicus Publications on behalf of the European Geosciences Union.

11602 J. Coates et al.: The influence of temperature on ozone production under varying NOx conditions
(BVOCs) (Sillman and Samson, 1995). While emissionsof anthropogenic VOCs (AVOCs) are generally not depen-dent on temperature, evaporative emissions of some AVOCsdo increase with temperature (Rubin et al., 2006). The re-view of Pusede et al. (2015) provides further details of thetemperature-dependent processes impacting ozone produc-tion.
Regional modelling studies over the US (Sillman andSamson, 1995; Steiner et al., 2006; Dawson et al., 2007) ex-amined the sensitivity of ozone production during a pollu-tion episode to increased temperatures. These studies notedthat increased temperatures (without changing VOC or NOx
conditions) led to higher ozone levels, often exceeding localair quality guidelines. Sillman and Samson (1995) and Daw-son et al. (2007) varied the temperature dependence of thePAN (peroxy acetyl nitrate) decomposition rate during simu-lations of the eastern US, determining the sensitivity of ozoneproduction with temperature to the PAN decomposition rate.In addition to the influence of PAN decomposition on ozoneproduction, Steiner et al. (2006) correlated the increase inozone mixing ratios with temperature over California to in-creased mixing ratios of formaldehyde, a secondary degra-dation production of many VOCs and an important radicalsource. Steiner et al. (2006) also noted that increased emis-sions of BVOCs at higher temperatures in urban areas withhigh-NOx emissions also increased ozone levels with tem-perature.
The modelling study of Vogel et al. (1999) looked at theNOy transition value as an indicator of ozone productionsensitivity at different VOC and NOx conditions and inves-tigated the sensitivity of this transition value with differ-ent meteorological conditions. Higher temperatures led to ahigher transition value of NOy , which was attributed to thefaster thermal decomposition of PAN. Vogel et al. (1999) alsoshowed that vertical mixing and dry deposition decreased thetransition value of NOy , showing that ozone production issensitive to other non-chemical processes.
Pusede et al. (2014) used an analytical model constrainedby observations over the San Joaquin Valley, California, toinfer a non-linear relationship between ozone, temperatureand NOx , similar to the well-known non-linear relation-ship of ozone production on NOx and VOC levels (Sillman,1999). Moreover, Pusede et al. (2014) showed that temper-ature can be used as a surrogate for VOC levels when con-sidering the relationship of ozone under different NOx con-ditions.
Environmental chamber studies have also been used toanalyse the relationship of ozone with temperature using afixed mixture of VOCs. The chamber experiments of Carteret al. (1979) and Hatakeyama et al. (1991) showed increasesin ozone from a VOC mix with temperature. Both stud-ies compared the concentration time series of ozone andnitrogen-containing compounds (NOx , PAN, HNO3) at vari-ous temperatures, linking the maximum ozone concentration
to the decrease in PAN concentrations at temperatures greaterthan 303 K.
The review of Pusede et al. (2015) highlights a generallack of modelling studies looking at the relationship of ozonewith temperature under different NOx conditions. The re-gional modelling studies described previously concentratedon reproducing ozone levels (using a single chemical mech-anism) over regions with known meteorology and NOx con-ditions and then varying the temperature. These regionalmodelling studies did not consider the relationship betweenozone, NOx and temperature. Vogel et al. (1999) only con-sidered the effect of faster reaction rates at higher tempera-ture and not the additional contribution of increased biogenicemissions to ozone levels at higher temperatures.
Comparisons of different chemical mechanisms, such asEmmerson and Evans (2009) and Coates and Butler (2015),showed that different representations of tropospheric chem-istry influenced ozone production. Neither of these studiesexamined the ozone–temperature relationship differences be-tween chemical mechanisms. Furthermore, Rasmussen et al.(2013) acknowledged that the modelled ozone–temperaturerelationship may be sensitive to the choice of chemicalmechanism and recommended investigating this sensitivity.Comparing the ozone–temperature relationship predicted bydifferent chemical mechanisms is potentially important formodelling of future air quality due to the expected increasein heatwaves (Karl and Trenberth, 2003).
In this study, we use an idealised box model to determinehow ozone levels vary with temperature under different NOx
conditions. We determine whether faster chemical reactionrates or increased BVOC emissions have a greater influenceon instantaneous ozone production with higher temperatureunder different NOx conditions. Furthermore, we comparethe ozone–temperature relationship produced by differentchemical mechanisms and determine which chemical pro-cesses drive the increase of ozone with temperature. Finally,we compare the rate of increase of ozone with temperatureobtained from the box model to both observations and re-gional model output and consider the role of stagnation onthe rate of increase of ozone with temperature.
2 Methodology
2.1 Model set-up
We performed idealised simulations using the Module Ef-ficiently Calculating the Chemistry of the Atmosphere(MECCA) box model (Sander et al., 2005) to determine theimportant gas-phase chemical processes for ozone produc-tion under different temperatures and NOx conditions. TheMECCA box model was set up as described in Coates andButler (2015) and updated to include vertical mixing withthe free troposphere using a diurnal cycle for the plane-tary boundary layer height. The vertical mixing scheme was
Atmos. Chem. Phys., 16, 11601–11615, 2016 www.atmos-chem-phys.net/16/11601/2016/

J. Coates et al.: The influence of temperature on ozone production under varying NOx conditions 11603
based on the approach of Lourens et al. (2016) with themodel using the mean mixing layer height from the BAER-LIN campaign over Berlin, Germany (Bonn et al., 2016).
Our simulations were designed as an idealised case and notto be exact representations of any particular place. The sim-ulations used a latitude of 51◦ N, broadly representative ofconditions in central Europe, and were run for daylight hoursfor one full day. Methane was fixed at 1.7 ppmv through-out the model run; carbon monoxide (CO) and ozone wereinitialised at 200 and 40 ppbv and then allowed to evolvefreely throughout the simulation. All VOC emissions wereheld constant until noon, simulating a plume of freshly emit-ted VOC. the mixing ratios of O3, CO and CH4 in the freetroposphere were respectively set to 50 ppbv, 116 ppbv and1.8 ppmv. These conditions were taken from the Model ofAtmospheric Transport and Chemistry–Max Planck Institutefor Chemistry (MATCH-MPIC) chemical weather forecastmodel on 21 March (the start date of the simulations). Themodel results (http://cwf.iass-potsdam.de/) at 700 hPa heightwere chosen, and the daily average was used as input into thebox model.
Separate box model simulations were performed bysystematically varying the temperature between 288and 313 K (15–40 ◦C) in steps of 0.5 K. NO emis-sions were systematically varied between 5.0× 10⁹
and 1.5× 10¹² molecules(NO) cm−2 s−1 in steps of1× 1010 molecules(NO) cm−2 s−1 at each temperaturestep. At 20 ◦C, these NO emissions corresponded to peakNOx mixing ratios of 0.02 and 10 ppbv respectively; thisrange of NOx mixing ratios covers the NOx conditionsfound in pristine and urban conditions (von Schneidemesseret al., 2015).
All simulations were repeated using different chemicalmechanisms to investigate whether the relationship betweenozone, temperature and NOx changes using different rep-resentations of ozone production chemistry. The referencechemical mechanism was the near-explicit Master Chemi-cal Mechanism, MCMv3.2 (Jenkin et al., 1997, 2003; Saun-ders et al., 2003; Rickard et al., 2015). The reduced chemicalmechanisms in our study were Common Representative In-termediates, CRIv2 (Jenkin et al., 2008); Model for OZoneand Related Chemical Tracers, MOZART-4 (Emmons et al.,2010); Regional Acid Deposition Model, RADM2 (Stock-well et al., 1990); and the Carbon Bond Mechanism, CB05(Yarwood et al., 2005). These reduced chemical mechanismswere chosen as they are all currently used by modellinggroups in 3-D regional and global models (Baklanov et al.,2014). Coates and Butler (2015) described the implementa-tion of these chemical mechanisms in MECCA.
The chemical mechanisms use temperature-dependent rateconstants, k(T ), to represent temperature-dependent chemi-cal processes, including the initial oxidation of VOC, per-oxy nitrate (RO2NO2) formation and destruction, and reac-tions between peroxy radicals and NO leading to alkyl nitrate(RONO2) formation. However, not all chemical mechanisms
represent the same chemical processes by a temperature-dependent rate constant. For example, in CB05, the rateconstant of RONO2 formation during isoprene degradationis temperature dependent, while RONO2 formation duringalkane degradation is temperature independent. Furthermore,none of the chemical mechanisms in our study represent theRONO2 branching ratio as a temperature-dependent process.Laboratory experiments have shown the temperature depen-dence of the RONO2 branching ratio for some VOCs (Atkin-son et al., 1987), but generally RONO2 chemistry is not wellknown (Pusede et al., 2015), and this level of detail is notrepresented by the chemical mechanisms. Before chemicalmechanisms can include the temperature dependence of theRONO2 branching ratio, further research is required.
Model runs were repeated using a temperature-independent and temperature-dependent source of BVOCemissions to determine the relative importance of increasedemissions of BVOC and faster reaction rates of chemicalprocesses for the increase of ozone with temperature. Manytypes of VOCs are emitted from vegetation, with isopreneand monoterpenes globally having the largest emissions,535 and 162 Tg yr−1 respectively (Guenther et al., 2012).Temperature-dependent emissions of these highly reactiveBVOCs in urban areas during the summer months have beenlinked to high levels of ozone pollution. For example, Wanget al. (2013) attributed high summertime levels of ozonein Taipei to increased isoprene emissions from vegetationduring the hotter summer months. Vegetation in urban areasalso provides additional ozone sinks through stomatal uptakeand ozonolysis of emitted BVOCs; the review of Calfapietraet al. (2013) discusses the role of BVOCs emitted by trees inurban areas in more detail.
Biogenic emissions of monoterpenes and isoprene areincluded in all model simulations. Model runs using atemperature-dependent source of BVOC emissions consid-ered only the temperature dependence of isoprene emis-sions as specified by the Model of Emissions of Gases andAerosols from Nature (MEGAN2.1; Guenther et al., 2012);Sect. 2.3 provides further details. Since isoprene is the mostimportant BVOC on the global scale, we focused on theinfluence of the temperature-dependent biogenic emissionsof isoprene on ozone levels. Future work should assessthe influence of temperature-dependent biogenic emissionsof monoterpenes on ozone production. In the temperature-dependent set of model simulations, only isoprene emis-sions were dependent on temperature, and all other emissionswere constant in all simulations. In reality, evaporative emis-sions from anthropogenic sources increase with temperature(Rubin et al., 2006), and isoprene has also been measuredfrom vehicular exhausts (Borbon et al., 2001). Represent-ing a temperature-dependent evaporative source of AVOCand an anthropogenic source of isoprene requires detailedlocal knowledge of these emission sources (such as the traf-fic fleet). Since our box modelling study was designed as anidealised study and not to characterise the influence of all
www.atmos-chem-phys.net/16/11601/2016/ Atmos. Chem. Phys., 16, 11601–11615, 2016

11604 J. Coates et al.: The influence of temperature on ozone production under varying NOx conditions
temperature-dependent emission sources in a particular re-gion, we have not considered the potentially larger increaseof ozone at higher temperatures due to these additional emis-sion sources. Further modelling work assessing the influenceof these temperature-dependent emission sources on ozoneproduction would be useful for mitigating ozone pollution inurban areas.
Simulations were also performed to assess the role of mix-ing on the increase of ozone with temperature. In these boxmodel simulations, the box model was set up as describedpreviously but without mixing of the chemical species withthe free troposphere. Thus, these simulations approximatestagnant conditions that favour accumulation of secondaryVOC oxidation products and enhanced ozone production.
2.2 VOC emissions
Emissions of urban AVOC over central Europe weretaken from the TNO Monitoring Atmospheric Composi-tion and Climate (TNO-MACC_III) emission inventory forthe Benelux (Belgium, Netherlands and Luxembourg) re-gion for the year 2011. TNO-MACC_III is the updatedTNO-MACC_II emission inventory created using the samemethodology as Kuenen et al. (2014) and based upon im-provements to the existing emission inventory during the AirQuality Model Evaluation International Initiative (AQMEII-2; Pouliot et al., 2015).
Temperature-independent emissions of isoprene andmonoterpenes from biogenic sources were calculated as afraction of the total AVOC emissions from each country inthe Benelux region. These data were obtained from the sup-plementary data available from the EMEP (European Mon-itoring and Evaluation Programme) model (Simpson et al.,2012). Temperature-dependent emissions of isoprene are de-scribed in Sect. 2.3.
Table 1 shows the quantity of VOC emissions from eachsource category and the temperature-independent BVOCemissions. These AVOC emissions were assigned to chem-ical species and groups based on the profiles provided byTNO. The non-methane VOC (NMVOC) emissions werespeciated to MCMv3.2 species as described by von Schnei-demesser et al. (2016). For simulations done with otherchemical mechanisms, the VOC emissions represented bythe MCMv3.2 were mapped to the mechanism species rep-resenting VOC emissions in each reduced chemical mecha-nism based on the recommendations of the source literatureand Carter (2015). The VOC emissions in the reduced chem-ical mechanisms were weighted by the carbon numbers ofthe MCMv3.2 species and the emitted mechanism species,thus keeping the amount of emitted reactive carbon constantbetween simulations. The Supplement outlines the primaryVOC and calculated emissions with each chemical mecha-nism.
0e+00
1e+11
2e+11
3e+11
15 20 25 30 35 40Temperature (°C)
Isop
rene
em
issi
ons
(mol
ecul
es c
m s
)-2
-1
Figure 1. The estimated isoprene emissions(molecules isoprene cm−2 s−1) using MEGAN2.1 at each temper-ature used in the study.
2.3 Temperature-dependent isoprene emissions
Temperature-dependent emissions of isoprene were esti-mated using the MEGAN2.1 algorithm for calculating theemissions of VOC from vegetation (Guenther et al., 2012).Emissions from nature are dependent on many variables, in-cluding temperature, radiation and age of vegetation, but forthe purpose of our study all variables except temperaturewere held constant. The aim of the study was to determinethe additional influence of temperature-dependent isopreneemissions on top of the temperature-dependent chemistry.In order to achieve this aim, we chose the MEGAN2.1 pa-rameters used to calculate isoprene emissions online by themodel to give similar isoprene mixing ratios at 20 ◦C to thetemperature-independent emissions of isoprene. MEGAN2.1was used to reflect the temperature-dependent emission pro-file of isoprene emissions and not to accurately representthe isoprene emissions of a particular region. The estimatedemissions of isoprene with MEGAN2.1 using these assump-tions are illustrated in Fig. 1 and show the expected exponen-tial increase in isoprene emissions with temperature (Guen-ther et al., 2006).
The estimated emissions of isoprene at 20 ◦C lead to0.07 ppbv of isoprene in our simulations, while at 30 ◦C theincreased emissions of isoprene using MEGAN2.1 estima-tions lead to 0.35 ppbv of isoprene in the model. A measure-ment campaign over Essen, Germany (Wagner and Kuttler,2014), measured 0.1 ppbv of isoprene at temperature 20 ◦Cand 0.3 ppbv of isoprene were measured at 30 ◦C. The sim-ilarity of the simulated and observed isoprene mixing ratiosindicates that the MEGAN2.1 variables chosen for calculat-ing the temperature-dependent emissions of isoprene weresuitable for simulating urban conditions over central Europe.
Atmos. Chem. Phys., 16, 11601–11615, 2016 www.atmos-chem-phys.net/16/11601/2016/
J. Coates et al.: The influence of temperature on ozone production under varying NOx conditions 11605
Table 1. Total AVOC emissions in 2011 in tonnes from each anthropogenic source category assigned from TNO-MACC_III emissioninventory and temperature-independent BVOC emissions from the Benelux region assigned from EMEP. The allocation of these emissionsto MCMv3.2, CRIv2, CB05, MOZART-4 and RADM2 species is found in the Supplement.
Source category Total emissions Source category Total emissions
Public power 13 755 Road transport: diesel 6727Residential combustion 21 251 Road transport: others 1433Industry 62 648 Road transport: evaporation 2327Fossil fuel 15 542 Non-road transport 17 158Solvent use 100 826 Waste 1342Road transport: gasoline 24 921 BVOC 10 702
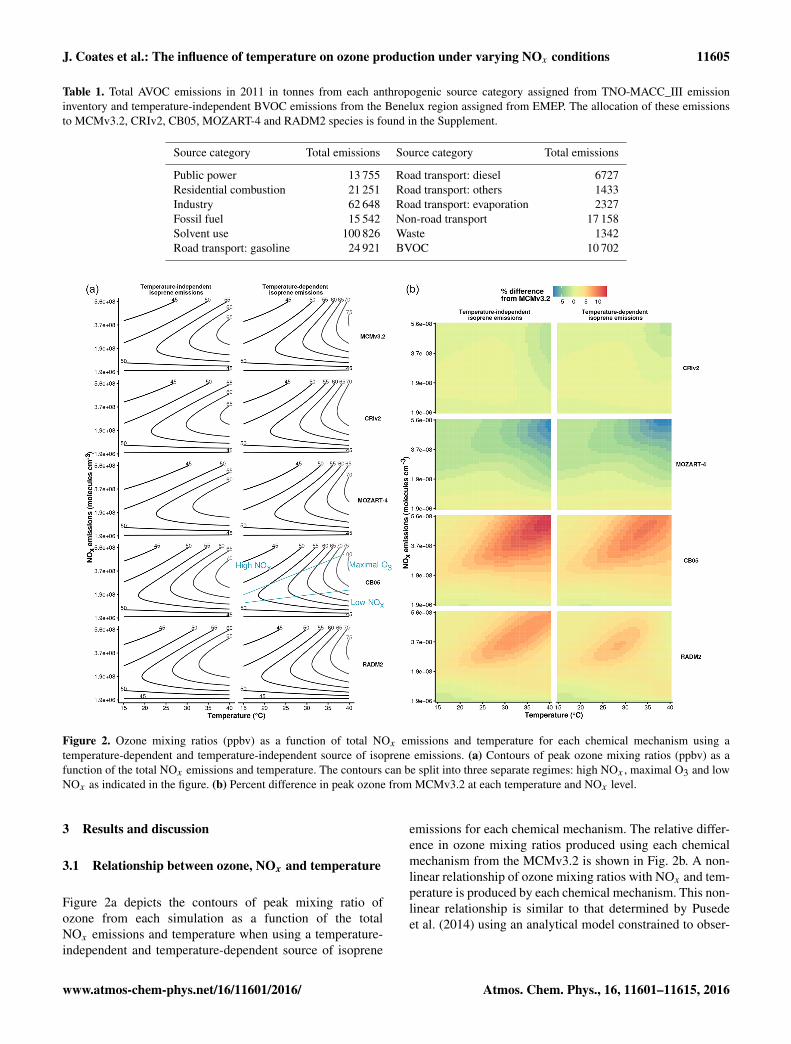
Figure 2. Ozone mixing ratios (ppbv) as a function of total NOx emissions and temperature for each chemical mechanism using atemperature-dependent and temperature-independent source of isoprene emissions. (a) Contours of peak ozone mixing ratios (ppbv) as afunction of the total NOx emissions and temperature. The contours can be split into three separate regimes: high NOx , maximal O3 and lowNOx as indicated in the figure. (b) Percent difference in peak ozone from MCMv3.2 at each temperature and NOx level.
3 Results and discussion
3.1 Relationship between ozone, NOx and temperature
Figure 2a depicts the contours of peak mixing ratio ofozone from each simulation as a function of the totalNOx emissions and temperature when using a temperature-independent and temperature-dependent source of isoprene
emissions for each chemical mechanism. The relative differ-ence in ozone mixing ratios produced using each chemicalmechanism from the MCMv3.2 is shown in Fig. 2b. A non-linear relationship of ozone mixing ratios with NOx and tem-perature is produced by each chemical mechanism. This non-linear relationship is similar to that determined by Pusedeet al. (2014) using an analytical model constrained to obser-
www.atmos-chem-phys.net/16/11601/2016/ Atmos. Chem. Phys., 16, 11601–11615, 2016

11606 J. Coates et al.: The influence of temperature on ozone production under varying NOx conditions
50
60
70
80
50
60
70
80
50
60
70
80
Low NO
Maximal O
High NO
15 20 25 30 35 40 15 20 25 30 35 40Temperature (°C)
O3
(ppb
v)
CRIv2MOZART-4
MCMv3.2RADM2CB05
Temperature-independent isoprene emissions Temperature-dependent isoprene emissions
emissionsIsoprene
Chemistry
x
x
3
Figure 3. Mean ozone mixing ratios (ppbv) at each temperature after allocation to the different NOx regimes of Fig. 2a. The differencesin ozone mixing ratios due to chemistry (solid line) and isoprene emissions (dotted line) are represented graphically for MOZART-4 withhigh-NOx conditions. Table 2 details the differences for each chemical mechanism and NOx condition.
vational measurements over the San Joaquin Valley, Califor-nia.
Higher peak ozone mixing ratios are produced when us-ing a temperature-dependent source of isoprene emissions(Fig. 2a). The highest mixing ratios of peak ozone are pro-duced at high temperatures and moderate emissions of NOx
regardless of the temperature dependence of isoprene emis-sions. Conversely, the least amount of peak ozone is pro-duced with low emissions of NOx over the whole tem-perature range (15–40 ◦C) when using both a temperature-independent and temperature-dependent source of isopreneemissions. The larger increases in ozone levels in themaximal-O3 and high-NOx regimes indicate that strong re-ductions in NOx emissions are necessary to offset the in-crease in ozone pollution at higher temperatures, especiallyin urban areas containing a significant amount of isoprene-emitting vegetation.
As shown in Fig. 2b, regions of high temperatures andhigh-NOx emissions generally lead to the largest inter-mechanism differences between ozone mixing ratios usingreduced chemical mechanisms from the MCMv3.2 (up to13 %). These differences in peak ozone mixing ratio pro-duced from the reduced chemical mechanisms comparedwith the MCMv3.2 in each NOx condition are consistentwith Fig. 3 (described below), where RADM2 and CB05generally produced higher ozone levels than the MCMv3.2.Also consistent with Fig. 3, CRIv2 produced the most similaramounts of ozone to the MCMv3.2 in each NOx condition,whereas MOZART-4 tended to produce lower ozone mixingratios than the MCMv3.2 in high-NOx conditions. In Fig. 3,a maximum difference of 10 ppbv between ozone mixing ra-tios produced using the chemical mechanisms is reached at
40 ◦C in the high-NOx state when using both a temperature-independent and temperature-dependent source of isopreneemissions.
The NOx emissions required for maximum ozone pro-duction (the contour ridges in Fig. 2a) at each temperatureare displayed in Fig. S1 of the Supplement. This figure il-lustrates that RADM2 and CB05 require higher NOx emis-sions than the MCMv3.2 to achieve maximum ozone produc-tion at each temperature for both a temperature-independentand temperature-dependent source of isoprene emissions. At20 ◦C, maximum ozone production is reached with ∼ 30 %more NOx emissions using CB05 and RADM2 than theMCMv3.2 with a temperature-independent and temperature-dependent source of isoprene emissions. The CRIv2 andMOZART-4 chemical mechanisms require very similar NOx
emissions to the MCMv3.2 at each temperature to producemaximum levels of ozone. Thus when modelling the airquality over a particular region using RADM2 and CB05,these mechanisms would be expected to simulate more NOx-sensitive chemistry and a lower increase of ozone with tem-perature than the MCMv3.2, CRIv2 and MOZART-4 chemi-cal mechanisms for the same conditions (i.e. emissions, me-teorology and radiation).
The contours of ozone mixing ratios in Fig. 2a as a func-tion of NOx and temperature can be split into three NOx
regimes (low NOx , maximal O3 and high NOx), similar to theNOx regimes defined for the non-linear relationship of ozonewith VOC and NOx . The low-NOx regime corresponds withregions having little increase in ozone with temperature, alsocalled the NOx-sensitive regime. The high-NOx (or NOx-saturated) regime is when ozone levels increase rapidly withtemperature. The contour ridges correspond to regions of
Atmos. Chem. Phys., 16, 11601–11615, 2016 www.atmos-chem-phys.net/16/11601/2016/
J. Coates et al.: The influence of temperature on ozone production under varying NOx conditions 11607
Table 2. Increase in mean ozone mixing ratio (ppbv) due to chemistry (i.e. faster reaction rates) and temperature-dependent isoprene emis-sions from 20 to 40 ◦C in the NOx regimes of Fig. 3.
Chemical mechanism Source of difference Increase in ozone from 20 to 40 ◦C (ppbv)
Low NOx Maximal O3 High NOx
MCMv3.2 Isoprene emissions 4.6 7.7 10.6Chemistry 6.8 12.5 15.2
CRIv2 Isoprene emissions 4.8 7.9 10.8Chemistry 6.0 11.1 13.7
MOZART-4 Isoprene emissions 4.1 6.7 10.0Chemistry 6.0 10.2 12.3
CB05 Isoprene emissions 4.6 7.4 9.8Chemistry 9.3 16.0 19.9
RADM2 Isoprene emissions 3.8 5.7 7.8Chemistry 8.6 14.1 17.3
maximal ozone production; this is the maximal-O3 regime.Pusede et al. (2014) showed that temperature can be usedas a proxy for VOC; thus we assigned the ozone mixing ra-tios from each box model simulation to a NOx regime basedon the H2O2 : HNO3 ratio. This ratio was used by Sillman(1995) and Staffelbach et al. (1997) to designate ozone toNOx regimes based on NOx and VOC levels. The low-NOx
regime corresponds to H2O2 : HNO3 ratios less than 0.5, thehigh-NOx regime corresponds to ratios larger than 0.3 andratios between 0.3 and 0.5 correspond to the maximal-O3regime.
The peak ozone mixing ratio from each simulation wasassigned to a NOx regime based on the H2O2 : HNO3 ratioof that simulation. The peak ozone mixing ratios assignedto each NOx regime at each temperature were averaged andare illustrated in Fig. 3 for each chemical mechanism andeach type of isoprene emission (temperature independent andtemperature dependent). We define the absolute increase inozone from 20 to 40 ◦C due to faster reaction rates as thedifference between ozone mixing ratios from 20 to 40 ◦Cwhen using a temperature-independent source of isopreneemissions. When using a temperature-dependent source ofisoprene emissions, the difference in ozone mixing ratiosfrom 20 to 40 ◦C minus the increase due to faster reactionrates gives the absolute increase in ozone mixing ratios fromincreased isoprene emissions. These differences are repre-sented graphically in Fig. 3 and summarised in Table 2.
Table 2 shows that the absolute increase in ozone withtemperature due to chemistry (i.e. faster reaction rates) islarger than the absolute increase in ozone due to increasedisoprene emissions for each chemical mechanism and eachNOx regime. In all cases the absolute increase in ozone withtemperature is largest under high-NOx conditions and lowestwith low-NOx conditions (Fig. 3 and Table 2). The increasein ozone mixing ratio from 20 to 40 ◦C due to faster reaction
rates with high-NOx conditions is almost double that withlow-NOx conditions. In the low-NOx regime, the increase ofozone with temperature using the reduced chemical mecha-nisms (CRIv2, MOZART-4, CB05 and RADM2) is similarto that from the MCMv3.2. Larger differences occur in themaximal-O3 and high-NOx regimes.
All reduced chemical mechanisms except RADM2 havesimilar increases in ozone due to increased isoprene emis-sions to the MCMv3.2 (Table 2). RADM2 produces 3 ppbvless ozone than the MCMv3.2 due to increased isopreneemissions in each NOx regime, indicating that this differenceis due the representation of isoprene degradation chemistry inRADM2.
Coates and Butler (2015) compared ozone production indifferent chemical mechanisms to the MCMv3.2 using theTOPP metric (tagged ozone production potential) as definedin Butler et al. (2011) and showed that less ozone is pro-duced per molecule of isoprene emitted using RADM2 thanwith MCMv3.2. The degradation of isoprene has been ex-tensively studied, and it is well-known that methyl vinylketone (MVK) and methacrolein are signatures of isoprenedegradation (Atkinson, 2000). All chemical mechanisms inour study except RADM2 explicitly represent MVK andmethacrolein (or in the case of CB05, a lumped species repre-senting both these secondary degradation products). RADM2does not represent methacrolein, and the mechanism speciesrepresenting ketones (KETs) is a mixture of acetone andmethyl ethyl ketone (MEK) (Stockwell et al., 1990). Thusthe secondary degradation of isoprene in RADM2 is un-able to represent the ozone production from the furtherdegradation of the signature secondary degradation prod-ucts of isoprene, MVK and methacrolein. Updated versionsof RADM2, RACM (Stockwell et al., 1997) and RACM2(Goliff et al., 2013) sequentially included methacrolein andMVK, and with these updates the ozone production from iso-
www.atmos-chem-phys.net/16/11601/2016/ Atmos. Chem. Phys., 16, 11601–11615, 2016
11608 J. Coates et al.: The influence of temperature on ozone production under varying NOx conditions
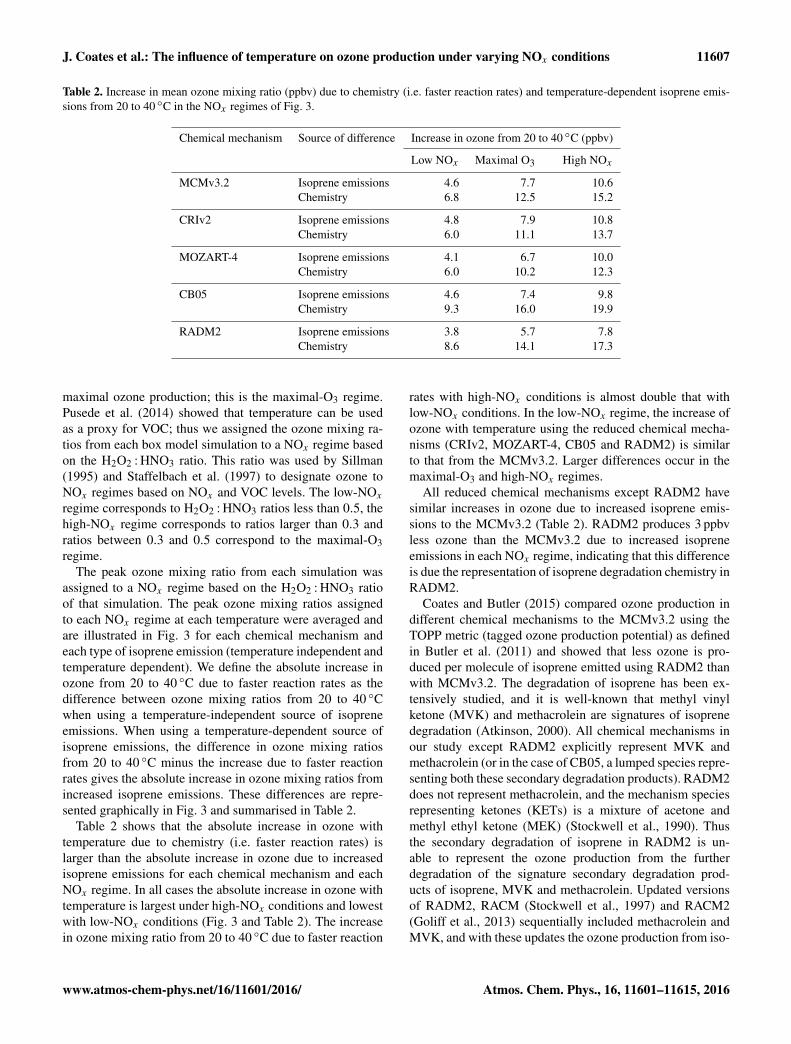
Figure 4. Daytime production and consumption budgets of Ox in the NOx regimes. The white line indicates net production or consumptionof Ox . The net contribution of reactions to Ox budgets is allocated to categories of inorganic reactions, peroxy nitrates (RO2NO2), reactionsof NO with HO2, alkyl peroxy radicals (RO2) and acyl peroxy radicals (ARO2). All other reactions are allocated to the “other organic”category. (a) Ox production and consumption budgets. (b) Ox production and consumption budgets normalised by the total loss rate ofemitted VOC.
prene oxidation approached that of the MCMv3.2 (Coatesand Butler, 2015).
Our simulations produced a non-linear relationship be-tween ozone, temperature and NOx , with the absoluteincrease in ozone with temperature due to temperature-dependent chemistry being larger than the increase in ozonewith temperature due to temperature-dependent isopreneemissions. These results are consistent between each chem-
ical mechanism, although for the same NOx and VOC con-ditions RADM2 and CB05 simulate a more NOx-sensitiveregime at the same temperature than the other chemicalmechanisms (MCMv3.2, CRIv2, MOZART-4). In order todetermine the chemical processes responsible for the in-creased ozone with temperature, we analyse the productionand consumption budgets of ozone in Sect. 3.2.
Atmos. Chem. Phys., 16, 11601–11615, 2016 www.atmos-chem-phys.net/16/11601/2016/
J. Coates et al.: The influence of temperature on ozone production under varying NOx conditions 11609
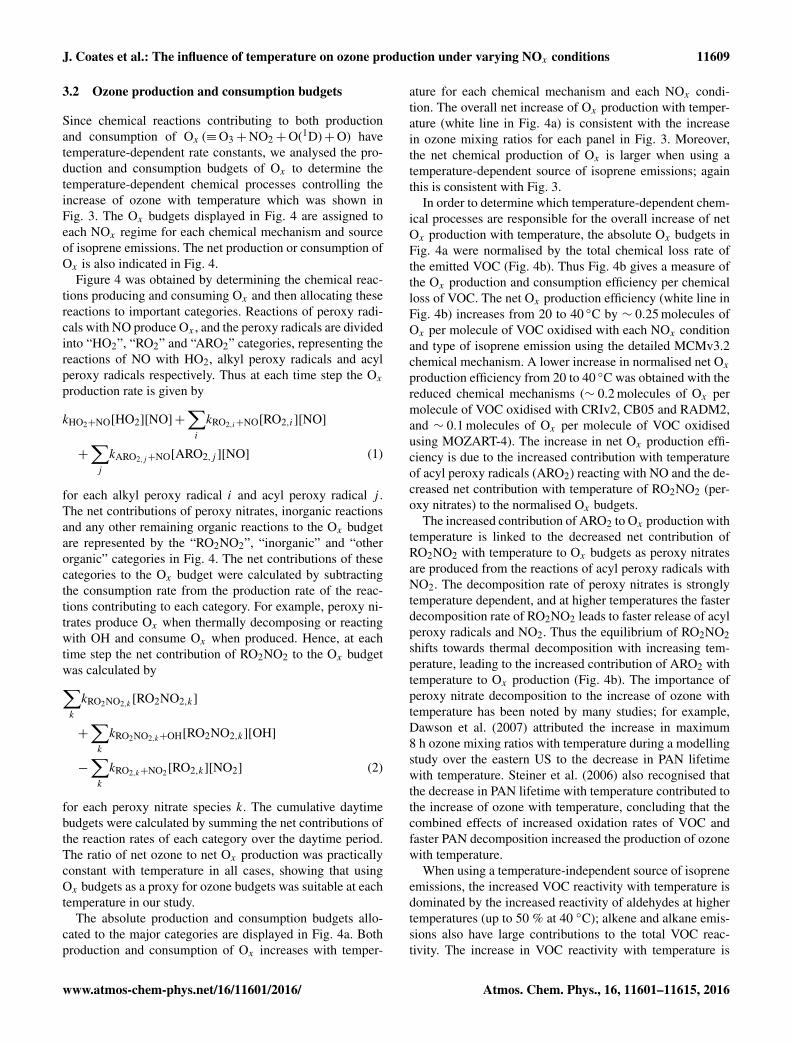
3.2 Ozone production and consumption budgets
Since chemical reactions contributing to both productionand consumption of Ox (≡O3+NO2+O(1D)+O) havetemperature-dependent rate constants, we analysed the pro-duction and consumption budgets of Ox to determine thetemperature-dependent chemical processes controlling theincrease of ozone with temperature which was shown inFig. 3. The Ox budgets displayed in Fig. 4 are assigned toeach NOx regime for each chemical mechanism and sourceof isoprene emissions. The net production or consumption ofOx is also indicated in Fig. 4.
Figure 4 was obtained by determining the chemical reac-tions producing and consuming Ox and then allocating thesereactions to important categories. Reactions of peroxy radi-cals with NO produce Ox , and the peroxy radicals are dividedinto “HO2”, “RO2” and “ARO2” categories, representing thereactions of NO with HO2, alkyl peroxy radicals and acylperoxy radicals respectively. Thus at each time step the Ox
production rate is given by
kHO2+NO[HO2][NO] +∑
i
kRO2,i+NO[RO2,i][NO]
+
∑j
kARO2,j+NO[ARO2,j ][NO] (1)
for each alkyl peroxy radical i and acyl peroxy radical j .The net contributions of peroxy nitrates, inorganic reactionsand any other remaining organic reactions to the Ox budgetare represented by the “RO2NO2”, “inorganic” and “otherorganic” categories in Fig. 4. The net contributions of thesecategories to the Ox budget were calculated by subtractingthe consumption rate from the production rate of the reac-tions contributing to each category. For example, peroxy ni-trates produce Ox when thermally decomposing or reactingwith OH and consume Ox when produced. Hence, at eachtime step the net contribution of RO2NO2 to the Ox budgetwas calculated by∑
k
kRO2NO2,k[RO2NO2,k]
+
∑k
kRO2NO2,k+OH[RO2NO2,k][OH]
−
∑k
kRO2,k+NO2 [RO2,k][NO2] (2)
for each peroxy nitrate species k. The cumulative daytimebudgets were calculated by summing the net contributions ofthe reaction rates of each category over the daytime period.The ratio of net ozone to net Ox production was practicallyconstant with temperature in all cases, showing that usingOx budgets as a proxy for ozone budgets was suitable at eachtemperature in our study.
The absolute production and consumption budgets allo-cated to the major categories are displayed in Fig. 4a. Bothproduction and consumption of Ox increases with temper-
ature for each chemical mechanism and each NOx condi-tion. The overall net increase of Ox production with temper-ature (white line in Fig. 4a) is consistent with the increasein ozone mixing ratios for each panel in Fig. 3. Moreover,the net chemical production of Ox is larger when using atemperature-dependent source of isoprene emissions; againthis is consistent with Fig. 3.
In order to determine which temperature-dependent chem-ical processes are responsible for the overall increase of netOx production with temperature, the absolute Ox budgets inFig. 4a were normalised by the total chemical loss rate ofthe emitted VOC (Fig. 4b). Thus Fig. 4b gives a measure ofthe Ox production and consumption efficiency per chemicalloss of VOC. The net Ox production efficiency (white line inFig. 4b) increases from 20 to 40 ◦C by ∼ 0.25 molecules ofOx per molecule of VOC oxidised with each NOx conditionand type of isoprene emission using the detailed MCMv3.2chemical mechanism. A lower increase in normalised net Ox
production efficiency from 20 to 40 ◦C was obtained with thereduced chemical mechanisms (∼ 0.2 molecules of Ox permolecule of VOC oxidised with CRIv2, CB05 and RADM2,and ∼ 0.1 molecules of Ox per molecule of VOC oxidisedusing MOZART-4). The increase in net Ox production effi-ciency is due to the increased contribution with temperatureof acyl peroxy radicals (ARO2) reacting with NO and the de-creased net contribution with temperature of RO2NO2 (per-oxy nitrates) to the normalised Ox budgets.
The increased contribution of ARO2 to Ox production withtemperature is linked to the decreased net contribution ofRO2NO2 with temperature to Ox budgets as peroxy nitratesare produced from the reactions of acyl peroxy radicals withNO2. The decomposition rate of peroxy nitrates is stronglytemperature dependent, and at higher temperatures the fasterdecomposition rate of RO2NO2 leads to faster release of acylperoxy radicals and NO2. Thus the equilibrium of RO2NO2shifts towards thermal decomposition with increasing tem-perature, leading to the increased contribution of ARO2 withtemperature to Ox production (Fig. 4b). The importance ofperoxy nitrate decomposition to the increase of ozone withtemperature has been noted by many studies; for example,Dawson et al. (2007) attributed the increase in maximum8 h ozone mixing ratios with temperature during a modellingstudy over the eastern US to the decrease in PAN lifetimewith temperature. Steiner et al. (2006) also recognised thatthe decrease in PAN lifetime with temperature contributed tothe increase of ozone with temperature, concluding that thecombined effects of increased oxidation rates of VOC andfaster PAN decomposition increased the production of ozonewith temperature.
When using a temperature-independent source of isopreneemissions, the increased VOC reactivity with temperature isdominated by the increased reactivity of aldehydes at highertemperatures (up to 50 % at 40 ◦C); alkene and alkane emis-sions also have large contributions to the total VOC reac-tivity. The increase in VOC reactivity with temperature is
www.atmos-chem-phys.net/16/11601/2016/ Atmos. Chem. Phys., 16, 11601–11615, 2016

11610 J. Coates et al.: The influence of temperature on ozone production under varying NOx conditions
primarily due to the increased emissions of isoprene withtemperature in simulations using a temperature-dependentsource of isoprene; aldehydes and alkanes also contribute tothe total VOC reactivity when using a temperature-dependentsource of isoprene. The Supplement illustrates the contribu-tions of different VOC functional groups to the total reac-tivity. The large contribution of aldehyde reactivity to totalreactivity at higher temperatures is due to the increased pro-duction of aldehydes from the secondary degradation of otherVOC.
As the production efficiency of Ox remains constant withtemperature (∼ 2 molecules of Ox per molecule of VOC ox-idised, Fig. 4b), the rate of Ox production is controlled bythe oxidation rate of VOCs. Faster oxidation of VOCs withtemperature speeds up the production of peroxy radicals, in-creasing ozone production when peroxy radicals react withNO to produce NO2. The reactivity of VOCs has been linkedto ozone production (e.g. Kleinman, 2005; Sadanaga et al.,2005), and the review of Pusede et al. (2015) acknowledgedthe importance of organic reactivity and radical productionto the ozone–temperature relationship. Also, the modellingstudy of Steiner et al. (2006) noted that the increase in ini-tial oxidation rates of VOCs with temperature leads to in-creased formaldehyde concentrations, and in turn an increaseof ozone as formaldehyde is an important source of HO2 rad-icals.
Our results indicate that increased VOC reactivity dueto faster rate constants for the reaction with OH and thedecomposition rate of peroxy nitrates are the temperature-dependent chemical processes leading to increased produc-tion of Ox with temperature. Out of these two chemical pro-cesses, the increased VOC reactivity with OH with tempera-ture had a larger influence on the increase of Ox productionwith temperature. These results are consistent between eachchemical mechanism and each NOx condition.
3.3 Comparison to observations and 3-D modelsimulations
The final step in our study was to compare how well our ide-alised box model simulations represent the real-world rela-tionship between ozone and temperature. Firstly, we com-pared the box model simulations to the interpolated observa-tions of the maximum daily 8 h mean (MDA8) of ozone fromSchnell et al. (2015) and the meteorological data of the ERA-Interim reanalysis (Dee et al., 2011). Using this data set,Otero et al. (2016) showed that temperature is the main me-teorological driver of ozone production during the summer(JJA) months over many regions of central Europe. A furthertest was to compare the box model simulations to the outputfrom a regional 3-D model as 3-D models include explicitrepresentations of transport and mixing processes which in-fluence ozone production and which are not well representedin our box model. We used the Weather Research and Fore-casting with Chemistry (WRF-Chem) 3-D model set-up over
the European domain to simulate ozone production in theyear 2007 using MOZART-4 chemistry; further details aredescribed in Mar et al. (2016).
Directly comparing the ozone mixing ratios from ouridealised box model simulations to the WRF-Chem outputis difficult due to significant differences in the set-ups ofthe models. For example, WRF-Chem used gas-phase andaerosol chemistry, whereas our box model set-up used onlygas-phase chemistry; also the treatment of photolysis andVOC and NOx emissions differs between our box modeland WRF-Chem. In addition to this, to include the effectsof transport and mixing, the box model includes a sim-ple mixing term representing the entrainment of clean free-tropospheric air into the growing daytime boundary layer.Stagnant atmospheric conditions are characteristed by lowwind speeds slowing the transport of ozone and its precursorsaway from sources and have been correlated with high-ozoneepisodes in the summer over the eastern US (Jacob et al.,1993). Hence, out of the metereological conditions not rep-resented by our box model, stagnation could have the largestinfluence on the increase of ozone with temperature. In orderto investigate the sensitivity of ozone production to mixing,further box model simulations were performed without mix-ing, approximating stagnant conditions.
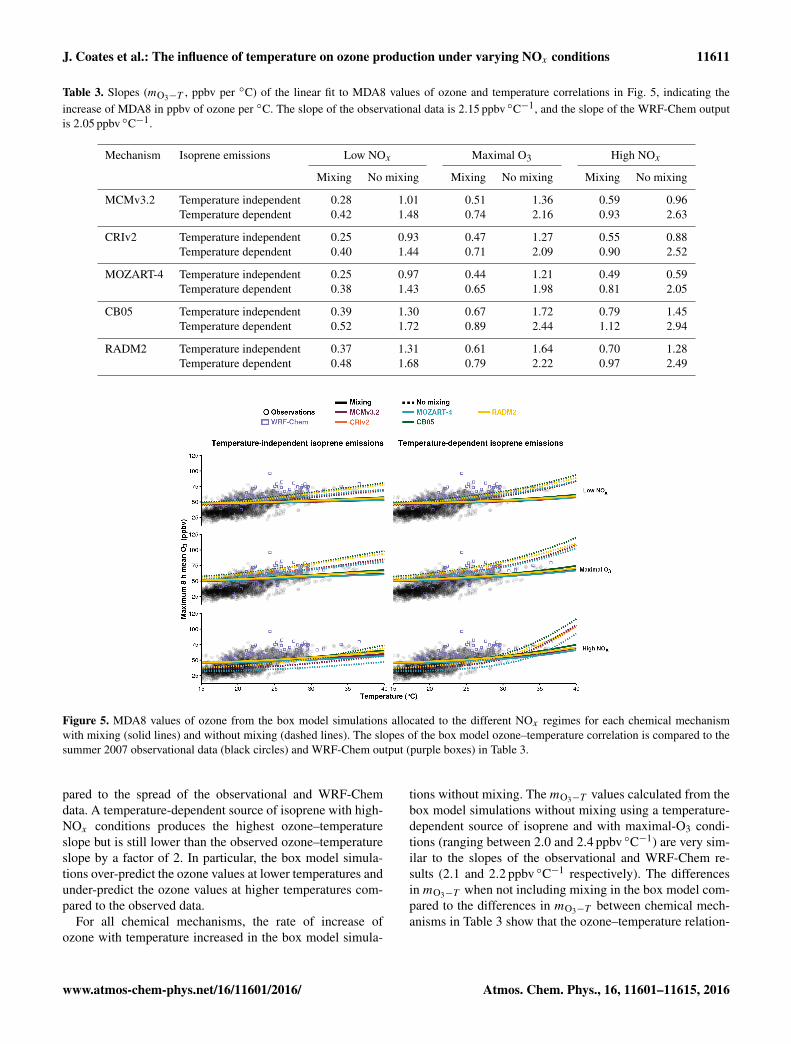
Figure 5 compares the ERA-Interim reanalysis and WRF-Chem output from summer 2007 averaged over central andeastern Germany, where summertime ozone values are drivenby temperature (Otero et al., 2016), to the MDA8 valuesof ozone from the box model simulations for each chemi-cal mechanism with mixing (solid lines) and without mixing(dotted lines). We compare the rate of change of ozone withtemperature (mO3−T ) between the box model, WRF-Chemand ERA-Interim reanalysis data. This metric has been usedto quantify future ozone pollution due to the warmer tem-peratures predicted by climate change (Dawson et al., 2007;Rasmussen et al., 2013) and is discussed further in the reviewof Pusede et al. (2015). mO3−T is calculated as the linearslope of the increase of ozone with temperature in ppbv ofozone per degree Celsius. Polluted areas have larger mO3−T
values than rural areas, corresponding to the high-NOx andlow-NOx conditions simulated in our study. Table 3 sum-marises the calculated slopes of the box model simulationsdisplayed in Fig. 5.
The linear slope of the observational data indicates an in-crease of 2.15 ppbv ozone per degree Celsius; this is compa-rable to the increase of ozone with temperature from otherrecent studies over urban areas: 2.2 ppbv ◦C−1 obtained overthe northeastern US (Rasmussen et al., 2013) and Milan, Italy(2.8 ppbv ◦C−1; Baertsch-Ritter et al., 2004). Despite a highbias in simulated ozone in WRF-Chem, the rate of changeof ozone with temperature from the WRF-Chem simulations(2.05 ppbv ◦C−1) is similar to the rate of change of ozonewith temperature from the observed data (2.15 ppbv ◦C−1).The differences in ozone production between the differentchemical mechanisms with the box model are small com-
Atmos. Chem. Phys., 16, 11601–11615, 2016 www.atmos-chem-phys.net/16/11601/2016/
J. Coates et al.: The influence of temperature on ozone production under varying NOx conditions 11611
Table 3. Slopes (mO3−T , ppbv per ◦C) of the linear fit to MDA8 values of ozone and temperature correlations in Fig. 5, indicating theincrease of MDA8 in ppbv of ozone per ◦C. The slope of the observational data is 2.15 ppbv ◦C−1, and the slope of the WRF-Chem outputis 2.05 ppbv ◦C−1.
Mechanism Isoprene emissions Low NOx Maximal O3 High NOx
Mixing No mixing Mixing No mixing Mixing No mixing
MCMv3.2 Temperature independent 0.28 1.01 0.51 1.36 0.59 0.96Temperature dependent 0.42 1.48 0.74 2.16 0.93 2.63
CRIv2 Temperature independent 0.25 0.93 0.47 1.27 0.55 0.88Temperature dependent 0.40 1.44 0.71 2.09 0.90 2.52
MOZART-4 Temperature independent 0.25 0.97 0.44 1.21 0.49 0.59Temperature dependent 0.38 1.43 0.65 1.98 0.81 2.05
CB05 Temperature independent 0.39 1.30 0.67 1.72 0.79 1.45Temperature dependent 0.52 1.72 0.89 2.44 1.12 2.94
RADM2 Temperature independent 0.37 1.31 0.61 1.64 0.70 1.28Temperature dependent 0.48 1.68 0.79 2.22 0.97 2.49
Figure 5. MDA8 values of ozone from the box model simulations allocated to the different NOx regimes for each chemical mechanismwith mixing (solid lines) and without mixing (dashed lines). The slopes of the box model ozone–temperature correlation is compared to thesummer 2007 observational data (black circles) and WRF-Chem output (purple boxes) in Table 3.
pared to the spread of the observational and WRF-Chemdata. A temperature-dependent source of isoprene with high-NOx conditions produces the highest ozone–temperatureslope but is still lower than the observed ozone–temperatureslope by a factor of 2. In particular, the box model simula-tions over-predict the ozone values at lower temperatures andunder-predict the ozone values at higher temperatures com-pared to the observed data.
For all chemical mechanisms, the rate of increase ofozone with temperature increased in the box model simula-
tions without mixing. The mO3−T values calculated from thebox model simulations without mixing using a temperature-dependent source of isoprene and with maximal-O3 condi-tions (ranging between 2.0 and 2.4 ppbv ◦C−1) are very sim-ilar to the slopes of the observational and WRF-Chem re-sults (2.1 and 2.2 ppbv ◦C−1 respectively). The differencesin mO3−T when not including mixing in the box model com-pared to the differences in mO3−T between chemical mech-anisms in Table 3 show that the ozone–temperature relation-
www.atmos-chem-phys.net/16/11601/2016/ Atmos. Chem. Phys., 16, 11601–11615, 2016

11612 J. Coates et al.: The influence of temperature on ozone production under varying NOx conditions
ship using our box model set-up is more sensitive to mixingthan the choice of chemical mechanism.
Analysis of the Ox budgets, similar to that presented inSect. 3.2, shows an increase in absolute net production ofOx when simulating stagnant conditions compared to simu-lations including mixing (Fig. 4a). Moreover, the Ox budgetsnormalised by the chemical loss rate of VOC for the simula-tions without mixing show no appreciable difference to thesimulations including mixing. This analysis is displayed inthe Supplement and is consistent for each chemical mech-anism and each NOx condition. Thus we conclude that theincreased ozone production seen in the box model simula-tions with reduced mixing is due to enhanced OH reactivityfrom secondary VOC oxidation products.
A slower rate of increase of ozone with temperature withour box model was obtained compared to the rate of increaseof ozone with temperature of observational and 3-D modelsimulations. The reason for this discrepancy was that the boxmodel did not represent stagnation conditions which are rele-vant to real-world conditions. The lack of mixing meant thatsecondary VOC oxidation products were allowed to accu-mulate, leading to further degradation and increased produc-tion of peroxy radicals compared with simulations includingmixing. Thus the chemical processes driving the increase ofozone with temperature determined in Sect. 3.2 (faster VOCoxidation and peroxy nitrate decomposition) are not alteredby stagnant condition but proceed at a faster rate. Thus dur-ing stagnant conditions, stronger reductions in NOx are re-quired to minimise the impact of increased ozone productionat higher temperatures on the urban population.
4 Conclusions
In this study, we determined the effects of temperatureon ozone production using a box model over a rangeof temperatures and NOx conditions with a temperature-independent and temperature-dependent source of isopreneemissions. These simulations were repeated using reducedchemical mechanism schemes (CRIv2, MOZART-4, CB05and RADM2) typically used in 3-D models and compared tothe near-explicit MCMv3.2 chemical mechanism.
Each chemical mechanism produced a non-linear relation-ship of ozone with temperature and NOx with the most ozoneproduced at high temperatures and moderate emissions ofNOx . Conversely, lower NOx levels led to a minimal in-crease of ozone with temperature. Thus air quality in a fu-ture with higher temperatures would benefit from reductionsin NOx emissions. Simulations with high-NOx emissions athigh temperatures led to the largest differences in ozone mix-ing ratios predicted by the different chemical mechanisms;future work is needed to address these inter-mechanism dif-ferences. Our results indicated that CB05 and RADM2 simu-lated more NOx-sensitive chemistry than MCMv3.2, CRIv2and MOZART-4. Thus for the same conditions, CB05 and
RADM2 would simulate a lower increase of ozone withtemperature than MCMv3.2, CRIv2 and MOZART-4, whichcould lead to different mitigation strategies being proposeddepending on the chemical mechanism.
Faster reaction rates at higher temperatures were responsi-ble for a greater absolute increase in ozone than increasedisoprene emissions. In our simulations, ozone productionwas controlled by the increased rate of VOC oxidation withtemperature. The net influence of peroxy nitrates increasedthe net production of Ox per molecule of emitted VOC oxi-dised with temperature. Currently, chemical mechanisms donot represent the temperature dependence of alkyl nitrateformation, which may lead to discrepancies when simulat-ing temperature-dependent ozone production over certain ar-eas, and further work assessing the impact of this missingtemperature-dependent chemical process is required.
The rate of increase of ozone with temperature using ob-servational data over Europe was twice as high as the rateof increase of ozone with temperature when using the boxmodel. This was consistent with our box model set-up notrepresenting stagnant atmospheric conditions that are in-herently included in observational data and models includ-ing meteorology, such as WRF-Chem. In model simulationswithout mixing the rate of increase of ozone with tempera-ture was faster than the simulations including mixing. Thesimulations without mixing and a maximal ozone productionchemical regime led to very similar rates of increase of ozonewith temperature to the observational and WRF-Chem data.Furthermore, the ozone–temperature relationship was moresensitive to mixing than the choice of chemical mechanism.
5 Data availability
The box model data are available from the corre-sponding author. K. A. Mar can be contacted forthe WRF-Chem data. The ERA-Interim data are avail-able from the website: http://apps.ecmwf.int/datasets/data/interim-full-daily/levtype=sfc/.
The Supplement related to this article is available onlineat doi:10.5194/acp-16-11601-2016-supplement.
Author contributions. T. M. Butler and J. Coates designed the ex-periment; J. Coates performed box model simulations and analysis.K. A. Mar and N. Ojha performed WRF-Chem model runs and pro-vided these data. J. Coates prepared the manuscript with commentsfrom all co-authors.
Atmos. Chem. Phys., 16, 11601–11615, 2016 www.atmos-chem-phys.net/16/11601/2016/
J. Coates et al.: The influence of temperature on ozone production under varying NOx conditions 11613
Acknowledgements. The authors would like to thankNoelia Otero Felipe for assistance with the processing of theERA-Interim data.
Edited by: R. CohenReviewed by: two anonymous referees
References
Atkinson, R.: Atmospheric chemistry of VOCs and NOx , Atmos.Environ., 34, 2063–2101, 2000.
Atkinson, R., Aschmann, S. M., and Winer, A. M.: Alkyl nitrateformation from the reaction of a series of branched RO2 radicalswith NO as a function of temperature and pressure, J. Atmos.Chem., 5, 91–102, 1987.
Baertsch-Ritter, N., Keller, J., Dommen, J., and Prevot, A. S. H.:Effects of various meteorological conditions and spatial emis-sionresolutions on the ozone concentration and ROG/NOx lim-itationin the Milan area (I), Atmos. Chem. Phys., 4, 423–438,doi:10.5194/acp-4-423-2004, 2004.
Baklanov, A., Schlünzen, K., Suppan, P., Baldasano, J., Brunner,D., Aksoyoglu, S., Carmichael, G., Douros, J., Flemming, J.,Forkel, R., Galmarini, S., Gauss, M., Grell, G., Hirtl, M., Joffre,S., Jorba, O., Kaas, E., Kaasik, M., Kallos, G., Kong, X., Ko-rsholm, U., Kurganskiy, A., Kushta, J., Lohmann, U., Mahura,A., Manders-Groot, A., Maurizi, A., Moussiopoulos, N., Rao, S.T., Savage, N., Seigneur, C., Sokhi, R. S., Solazzo, E., Solomos,S., Sørensen, B., Tsegas, G., Vignati, E., Vogel, B., and Zhang,Y.: Online coupled regional meteorology chemistry models inEurope: current status and prospects, Atmos. Chem. Phys., 14,317–398, doi:10.5194/acp-14-317-2014, 2014.
Bonn, B., von Schneidemesser, E., Andrich, D., Quedenau, J., Ger-wig, H., Lüdecke, A., Kura, J., Pietsch, A., Ehlers, C., Klemp,D., Kofahl, C., Nothard, R., Kerschbaumer, A., Junkermann, W.,Grote, R., Pohl, T., Weber, K., Lode, B., Schönberger, P., Churk-ina, G., Butler, T. M., and Lawrence, M. G.: BAERLIN2014 –the influence of land surface types on and the horizontal hetero-geneity of air pollutant levels in Berlin, Atmos. Chem. Phys., 16,7785–7811, doi:10.5194/acp-16-7785-2016, 2016.
Borbon, A., Fontaine, H., Veillerot, M., Locoge, N., Galloo, J., andGuillermo, R.: An investigation into the traffic-related fraction ofisoprene at an urban location, Atmos. Environ., 35, 3749–3760,2001.
Butler, T., Lawrence, M., Taraborrelli, D., and Lelieveld, J.: Multi-day ozone production potential of volatile organic compoundscalculated with a tagging approach, Atmos. Environ., 45, 4082–4090, 2011.
Calfapietra, C., Fares, S., Manes, F., Morani, A., Sgrigna, G.,and Loreto, F.: Role of Biogenic Volatile Organic Compounds(BVOC) emitted by urban trees on ozone concentration in cities:A review, Environ. Pollut., 183, 71–80, 2013.
Carter, W. P. L.: Development of a Database for Chemi-cal Mechanism Assignments for Volatile Organic Emis-sions, J. Air Waste Manage. As., 65, 1171–1184,doi:10.1080/10962247.2015.1013646, 2015.
Carter, W. P. L., Winer, A. M., Darnall, K. R., and Pitts Jr., J. N.:Smog chamber studies of temperature effects in photochemicalsmog, Environ. Sci. Technol., 13, 1094–1100, 1979.
Coates, J. and Butler, T. M.: A comparison of chemical mecha-nisms using tagged ozone production potential (TOPP) analysis,Atmos. Chem. Phys., 15, 8795–8808, doi:10.5194/acp-15-8795-2015, 2015.
Dawson, J. P., Adams, P. J., and Pandis, S. N.: Sensitivity of ozoneto summertime climate in the eastern USA: A modeling casestudy, Atmos. Environ., 41, 1494–1511, 2007.
Dee, D. P., Uppala, S. M., Simmons, A. J., Berrisford, P., Poli,P., Kobayashi, S., Andrae, U., Balmaseda, M. A., Balsamo, G.,Bauer, P., Bechtold, P., Beljaars, A. C. M., van de Berg, L., Bid-lot, J., Bormann, N., Delsol, C., Dragani, R., Fuentes, M., Geer,A. J., Haimberger, L., Healy, S. B., Hersbach, H., Hólm, E. V.,Isaksen, L., Kållberg, P., Köhler, M., Matricardi, M., McNally,A. P., Monge-Sanz, B. M., Morcrette, J.-J., Park, B.-K., Peubey,C., de Rosnay, P., Tavolato, C., Thépaut, J.-N., and Vitart, F.: TheERA-Interim reanalysis: configuration and performance of thedata assimilation system, Q. J. Roy. Meteor. Soc., 137, 553–597,2011.
Emmerson, K. M. and Evans, M. J.: Comparison of troposphericgas-phase chemistry schemes for use within global models, At-mos. Chem. Phys., 9, 1831–1845, doi:10.5194/acp-9-1831-2009,2009.
Emmons, L. K., Walters, S., Hess, P. G., Lamarque, J.-F., Pfister,G. G., Fillmore, D., Granier, C., Guenther, A., Kinnison, D.,Laepple, T., Orlando, J., Tie, X., Tyndall, G., Wiedinmyer, C.,Baughcum, S. L., and Kloster, S.: Description and evaluation ofthe Model for Ozone and Related chemical Tracers, version 4(MOZART-4), Geosci. Model Dev., 3, 43–67, doi:10.5194/gmd-3-43-2010, 2010.
Goliff, W. S., Stockwell, W. R., and Lawson, C. V.: The regionalatmospheric chemistry mechanism, version 2, Atmos. Environ.,68, 174–185, 2013.
Guenther, A., Karl, T., Harley, P., Wiedinmyer, C., Palmer, P. I.,and Geron, C.: Estimates of global terrestrial isoprene emissionsusing MEGAN (Model of Emissions of Gases and Aerosols fromNature), Atmos. Chem. Phys., 6, 3181–3210, doi:10.5194/acp-6-3181-2006, 2006.
Guenther, A. B., Jiang, X., Heald, C. L., Sakulyanontvittaya, T.,Duhl, T., Emmons, L. K., and Wang, X.: The Model of Emissionsof Gases and Aerosols from Nature version 2.1 (MEGAN2.1): anextended and updated framework for modeling biogenic emis-sions, Geosci. Model Dev., 5, 1471–1492, doi:10.5194/gmd-5-1471-2012, 2012.
Hatakeyama, S., Akimoto, H., and Washida, N.: Effect of temper-ature on the formation of photochemical ozone in a propene-nitrogen oxide (NOx )-air-irradiation system, Environ. Sci. Tech-nol., 25, 1884–1890, 1991.
Jacob, D. J. and Winner, D. A.: Effect of climate change on air qual-ity, Atmos. Environ., 43, 51–63, 2009.
Jacob, D. J., Logan, J. A., Gardner, G. M., Yevich, R. M., Spi-vakovsky, C. M., Wofsy, S. C., Sillman, S., and Prather, M. J.:Factors regulating ozone over the United States and its exportto the global atmosphere, J. Geophys. Res., 98, 14817–14826,doi:10.1029/98JD01224, 1993.
Jenkin, M., Watson, L., Utembe, S., and Shallcross, D.: A CommonRepresentative Intermediates (CRI) mechanism for VOC degra-dation. Part 1: Gas phase mechanism development, Atmos. Env-iron., 42, 7185–7195, 2008.
www.atmos-chem-phys.net/16/11601/2016/ Atmos. Chem. Phys., 16, 11601–11615, 2016
11614 J. Coates et al.: The influence of temperature on ozone production under varying NOx conditions
Jenkin, M. E., Saunders, S. M., and Pilling, M. J.: The troposphericdegradation of volatile organic compounds: a protocol for mech-anism development, Atmos. Environ., 31, 81–104, 1997.
Jenkin, M. E., Saunders, S. M., Wagner, V., and Pilling, M. J.:Protocol for the development of the Master Chemical Mecha-nism, MCM v3 (Part B): tropospheric degradation of aromaticvolatile organic compounds, Atmos. Chem. Phys., 3, 181–193,doi:10.5194/acp-3-181-2003, 2003.
Karl, T. R. and Trenberth, K. E.: Modern Global Climate Change,Science, 302, 1719–1723, 2003.
Kleinman, L. I.: The dependence of tropospheric ozone productionrate on ozone precursors, Atmos. Environ., 39, 575–586, 2005.
Kuenen, J. J. P., Visschedijk, A. J. H., Jozwicka, M., and Denier vander Gon, H. A. C.: TNO-MACC_II emission inventory; a multi-year (2003–2009) consistent high-resolution European emissioninventory for air quality modelling, Atmos. Chem. Phys., 14,10963–10976, doi:10.5194/acp-14-10963-2014, 2014.
Lourens, A. S. M., Butler, T. M., Beukes, J. P., van Zyl, P. G.,Fourie, G. D., and Lawrence, M. G.: Investigating atmo-spheric photochemistry in the Johennesburg-Pretoria megac-ity using a box model, SAJOG-S. Afr. J. Obstet., 112,doi:10.17159/sajs.2016/2015-0169, 2016.
Mar, K. A., Ojha, N., Pozzer, A., and Butler, T. M.: Ozone air qual-ity simulations with WRF-Chem (v3.5.1) over Europe: Modelevaluation and chemical mechanism comparison, Geosci. ModelDev. Discuss., doi:10.5194/gmd-2016-131, in review, 2016.
Otero, N., Sillmann, J., Schnell, J. L., Rust, H. W., and But-ler, T.: Synoptic and meteorological drivers of extreme ozoneconcentrations over Europe, Environ. Res. Lett., 11, 024005,doi:10.1088/1748-9326/11/2/024005, 2016.
Pouliot, G., van der Gon, H. A. D., Kuenen, J., Zhang, J., Moran,M. D., and Makar, P. A.: Analysis of the emission inventories andmodel-ready emission datasets of Europe and North America forphase 2 of the AQMEII project, Atmos. Environ., 115, 345–360,2015.
Pusede, S. E., Gentner, D. R., Wooldridge, P. J., Browne, E. C.,Rollins, A. W., Min, K.-E., Russell, A. R., Thomas, J., Zhang,L., Brune, W. H., Henry, S. B., DiGangi, J. P., Keutsch, F. N.,Harrold, S. A., Thornton, J. A., Beaver, M. R., St. Clair, J.M., Wennberg, P. O., Sanders, J., Ren, X., VandenBoer, T. C.,Markovic, M. Z., Guha, A., Weber, R., Goldstein, A. H., and Co-hen, R. C.: On the temperature dependence of organic reactivity,nitrogen oxides, ozone production, and the impact of emissioncontrols in San Joaquin Valley, California, Atmos. Chem. Phys.,14, 3373–3395, doi:10.5194/acp-14-3373-2014, 2014.
Pusede, S. E., Steiner, A. L., and Cohen, R. C.: Temperature andRecent Trends in the Chemistry of Continental Surface Ozone,Chem. Rev., 115, 3898–3918, 2015.
Rasmussen, D. J., Hu, J., Mahmud, A., and Kleeman, M. J.: TheOzone–Climate Penalty: Past, Present, and Future, Environ. Sci.Technol., 47, 14258–14266, 2013.
Rickard, A., Young, J., Pilling, M. J., Jenkin, M. E., Pascoe, S.,and Saunders, S. M.: The Master Chemical Mechanism VersionMCM v3.2, available at: http://mcm.leeds.ac.uk/MCMv3.2/, lastaccess: 25 March 2015.
Rubin, J. I., Kean, A. J., Harley, R. A., Millet, D. B., and Gold-stein, A. H.: Temperature dependence of volatile organic com-pound evaporative emissions from motor vehicles, J. Geophys.Res.-Atmos., 111, d03305, doi:10.1029/2005JD006458, 2006.
Sadanaga, Y., Yoshino, A., Kato, S., and Kajii, Y.: Measurements ofOH Reactivity and Photochemical Ozone Production in the Ur-ban Atmosphere, Environ. Sci. Technol., 39, 8847–8852, 2005.
Sander, R., Kerkweg, A., Jöckel, P., and Lelieveld, J.: Technicalnote: The new comprehensive atmospheric chemistry moduleMECCA, Atmos. Chem. Phys., 5, 445–450, doi:10.5194/acp-5-445-2005, 2005.
Saunders, S. M., Jenkin, M. E., Derwent, R. G., and Pilling, M.J.: Protocol for the development of the Master Chemical Mech-anism, MCM v3 (Part A): tropospheric degradation of non-aromatic volatile organic compounds, Atmos. Chem. Phys., 3,161–180, doi:10.5194/acp-3-161-2003, 2003.
Schnell, J. L., Prather, M. J., Josse, B., Naik, V., Horowitz, L.W., Cameron-Smith, P., Bergmann, D., Zeng, G., Plummer, D.A., Sudo, K., Nagashima, T., Shindell, D. T., Faluvegi, G.,and Strode, S. A.: Use of North American and European airquality networks to evaluate global chemistry–climate model-ing of surface ozone, Atmos. Chem. Phys., 15, 10581–10596,doi:10.5194/acp-15-10581-2015, 2015.
Sillman, S.: The use of NOy , H2O2, and HNO3 as indicators forozone-NOx -hydrocarbon sensitivity in urban locations, J. Geo-phys. Res.-Atmos., 100, 14175–14188, 1995.
Sillman, S.: The relation between ozone, NOx and hydrocarbonsin urban and polluted rural environments, Atmos. Environ., 33,1821–1845, 1999.
Sillman, S. and Samson, P. J.: Impact of temperature on oxidantphotochemistry in urban, polluted rural and remote environ-ments, J. Geophys. Res.-Atmos., 100, 11497–11508, 1995.
Simpson, D., Benedictow, A., Berge, H., Bergström, R., Emberson,L. D., Fagerli, H., Flechard, C. R., Hayman, G. D., Gauss, M.,Jonson, J. E., Jenkin, M. E., Nyíri, A., Richter, C., Semeena, V.S., Tsyro, S., Tuovinen, J.-P., Valdebenito, Á., and Wind, P.: TheEMEP MSC-W chemical transport model – technical descrip-tion, Atmos. Chem. Phys., 12, 7825–7865, doi:10.5194/acp-12-7825-2012, 2012.
Solberg, S., Hov, Ø., Søvde, A., Isaksen, I. S. A., Coddeville, P.,De Backer, H., Forster, C., Orsolini, Y., and Uhse, K.: Europeansurface ozone in the extreme summer 2003, J. Geophys. Res.-Atmos., 113, D07307, doi:10.1029/2007JD009098, 2008.
Staffelbach, T., Neftel, A., Blatter, A., Gut, A., Fahrni, M., Stähelin,J., Prévôt, A., Hering, A., Lehning, M., Neininger, B., Bäumle,M., Kok, G. L., Dommen, J., Hutterli, M., and Anklin, M.: Pho-tochemical oxidant formation over southern Switzerland: 1. Re-sults from summer 1994, J. Geophys. Res.-Atmos., 102, 23345–23362, 1997.
Steiner, A. L., Tonse, S., Cohen, R. C., Goldstein, A. H., and Harley,R. A.: Influence of future climate and emissions on regionalair quality in California, J. Geophys. Res.-Atmos., 111, d18303,doi:10.1029/2005JD006935, 2006.
Stockwell, W. R., Middleton, P., Chang, J. S., and Tang, X.: The sec-ond generation regional acid deposition model chemical mecha-nism for regional air quality modeling, J. Geophys. Res.-Atmos.,95, 16343–16367, 1990.
Stockwell, W. R., Kirchner, F., Kuhn, M., and Seefeld, S.: Anew mechanism for regional atmospheric chemistry modeling,J. Geophys. Res.-Atmos., 102, 25847–25879, 1997.
Vautard, R., Honoré, C., Beekmann, M., and Rouil, L.: Simulationof ozone during the August 2003 heat wave and emission controlscenarios, Atmos. Environ., 39, 2957–2967, 2005.
Atmos. Chem. Phys., 16, 11601–11615, 2016 www.atmos-chem-phys.net/16/11601/2016/

J. Coates et al.: The influence of temperature on ozone production under varying NOx conditions 11615
Vogel, B., Riemer, N., Vogel, H., and Fiedler, F.: Findings on NOy
as an indicator for ozone sensitivity, J. Geophys. Res., 104, 3605–3620, 1999.
von Schneidemesser, E., Monks, P. S., Allan, J. D., Bruhwiler, L.,Forster, P., Fowler, D., Lauer, A., Morgan, W. T., Paasonen, P.,Righi, M., Sindelarova, K., and Sutton, M. A.: Chemistry andthe Linkages between Air Quality and Climate Change, Chem.Rev., 115, 3856–3897, doi:10.1021/acs.chemrev.5b00089, 2015.
von Schneidemesser, E., Coates, J., Denier van der Gon, H. A.C., Visschedijk, A. J. H., and Butler, T. M.: Variation of theNMVOC speciation in the solvent sector and the sensitivity ofmodel led tropospheric ozone, Atmos. Environ., 135, 59–72,doi:10.1016/j.atmosenv.2016.03.057, 2016.
Wagner, P. and Kuttler, W.: Biogenic and anthropogenic isoprenein the near-surface urban atmosphere – A case study in Essen,Germany, Sci. Total Environ., 475, 104–115, 2014.
Wang, J., Chew, C., Chang, C.-Y., Liao, W.-C., Lung, S.-C. C.,Chen, W.-N., Lee, P.-J., Lin, P.-H., and Chang, C.-C.: Biogenicisoprene in subtropical urban settings and implications for airquality, Atmos. Environ., 79, 369–379, 2013.
Yarwood, G., Rao, S., Yocke, M., and Whitten, G. Z.: Updates tothe Carbon Bond Chemical Mechanism: CB05, Tech. rep., USEnvironmental Protection Agency, 2005.
www.atmos-chem-phys.net/16/11601/2016/ Atmos. Chem. Phys., 16, 11601–11615, 2016