the influence of the height of shelves and width of aisles
TRANSCRIPT
1
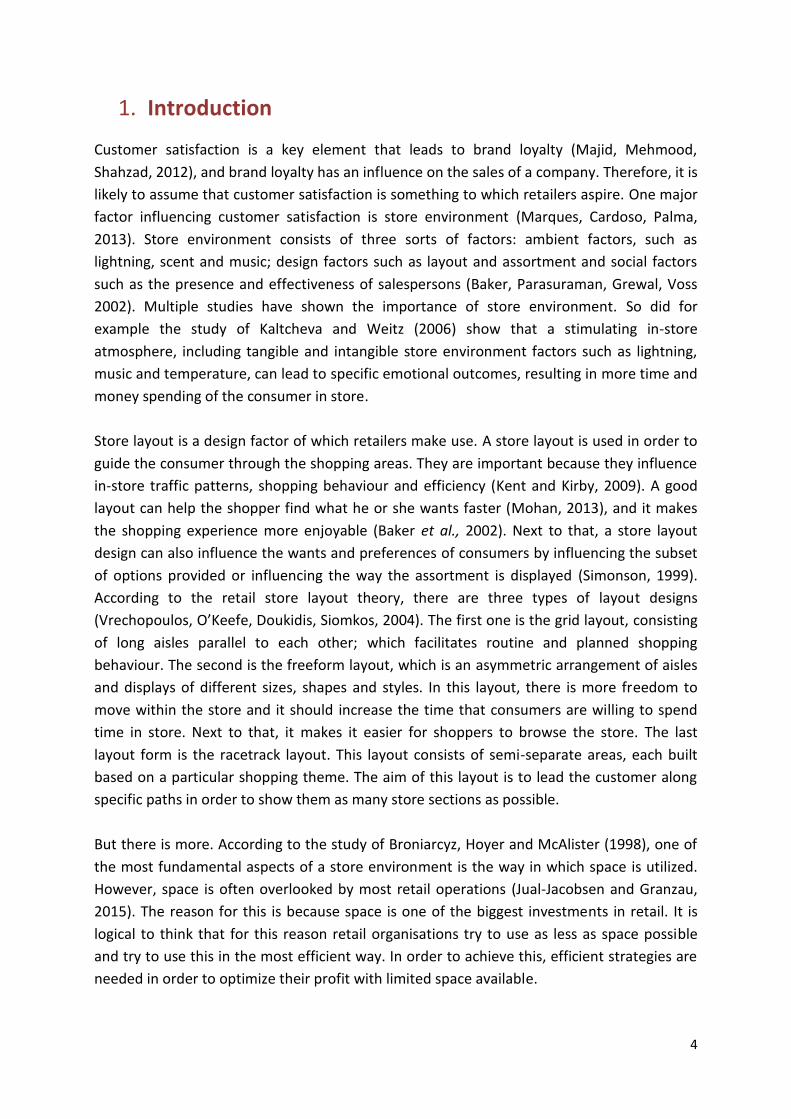
The influence of the height of shelves and width of
aisles on store image and customer satisfaction
Bachelor thesis YSS - 82312 Inke Frickus
960822247060
Supervisor: Ellen van Kleef
Second reader:
Jannette van Beek
Chairgroup: Marketing and Consumer Behaviour
February 2017

2
Abstract
Introduction. Retailers need to build up a positive store image and satisfy their customers in
order to survive in today’s competitive retail environment. This, together with the growing
costs of retail space entails that retailers have to make use of their space in an effective way.
Next to that, they have to take in account store environment factors. Layout form is
investigated multiple times, however, the space of shelves as a whole is not considered
earlier. Therefore, this study investigated the influence of the height of shelves and width of
aisles on store image and customer satisfaction.
Method. Data was gathered by means of an experiment in the form of an online survey. The
variables variety, prestige, pleasure, spatial control, store image and satisfaction were
investigated by means of pictures of a pharmacy store. Participants were randomly assigned
to one of the four conditions. By use of SPSS, the data was analysed.
Results. The results showed that high shelves in combination with narrow aisles resulted in
the least positive effect on store image and satisfaction. Low shelves in combination with
wide aisles and high shelves in combination with wide aisles had the most positive effect on
store image and satisfaction. Variety had no significant effect with the height of shelves and
width of aisles. Prestige had only a significant effect with the height of shelves; low shelves
resulted in a higher prestige. Pleasure was experienced the most in case of low shelves and
wide aisles. Lastly, the most spatial control was experienced in case of wide aisles or low
shelves.
Discussion. Out of the results it was concluded that low shelves in combination with wide
aisles resulted had the most positive effect on store image and customer satisfaction. Next
to that, high shelves in combination with narrow aisles resulted in the least positive effect on
store image and customer satisfaction.
3
Table of contents
1.Introduction……………………………………………………………………………………………………….….………4
1.1.Definition of the problem………………………………………………………….………………..…....5
2. Theoretical background……………………………………………………………………………………….………..7
2.1. Store Environment………………………………………………………………….………………….…....7
2.2. Shopping motives………………………………………………………………………………………….….8
2.3. Space in retail setting…………………………………………………………………………...………….8
2.4. Store image………………………………………………………………………………………............…10
2.4.1. Height of shelves and store image………………………………………………….…12
2.4.2. Width of aisles and store image………………………………………………….…….13
2.5. Customer satisfaction………………………………………………………………………………………14
2.5.1. Height of shelves and customer satisfaction……………………………………..14
2.5.2. Width of aisles and customer satisfaction……………………….………………..15
3. Method……………………………………………………………………………………………………………….………17
3.1. Research design and manipulation………………………………………………………..……..…17
3.2. Participants…………………………………………………………………………………………….………20
3.3. Procedure……………………………………………………………………………………………….….....20
3.4. Measures………………………………………………………………………………………………..….....21
3.4.1. Randomisation and manipulation……………………………………………..........21
3.4.2. Store image……………………………………………………………………………….....…21
3.4.3. Satisfaction…………………………………………………………………………………..….22
3.4.4. Variety…………………………………………………………………………………………..…22
3.4.5. Prestige……………………………………………………………………………………..…....22
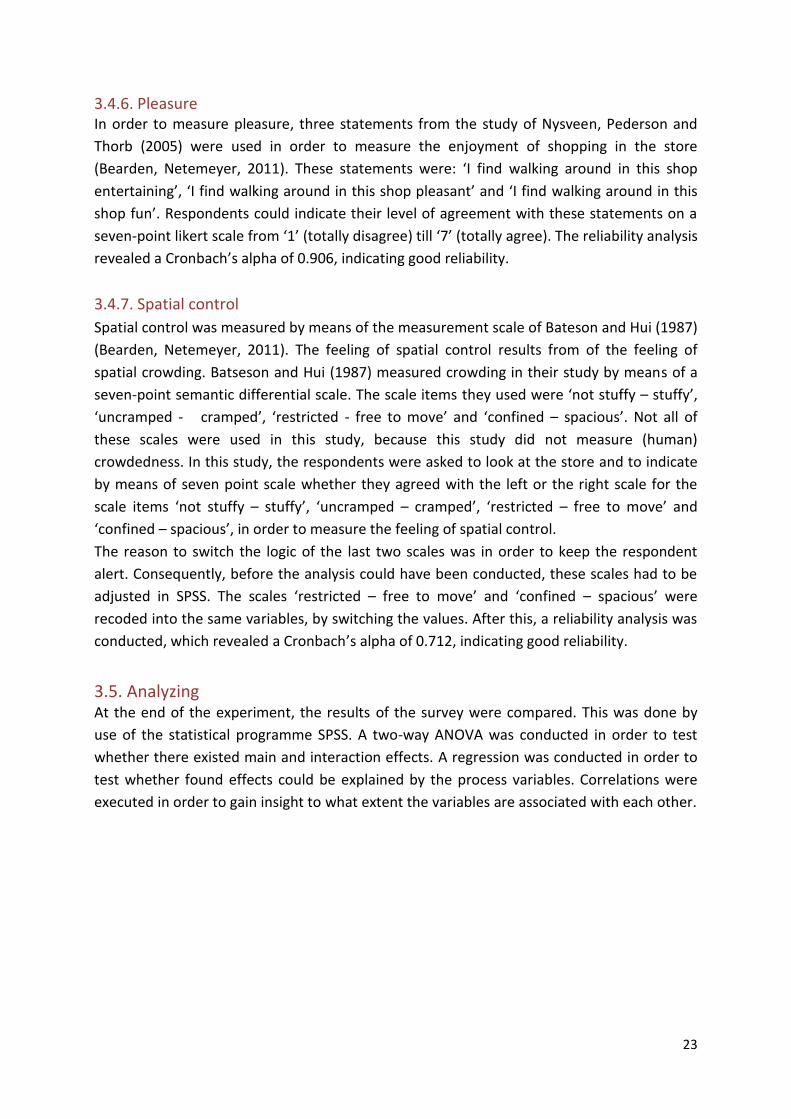
3.4.6. Pleasure……………………………………………………………………………………………23
3.4.7. Spatial control…………………………………………………………………………………..23
3.5. Analyzing………………………………………………………………………………………………………..23
4. Results………………………………………………………………………………………………………………….…….24
4.1. Manipulation and randomisation check………………………………………………………....24
4.2. Store image………………………………………………………………………………………….………...25
4.3. Satisfaction………………………………………………………………………………………………..……25
4.4. Process variables………………………………………………………………………………………..…..26
4.5. Correlations and regression……………………………………………………………………..……..27
5. Discussion……………………………………………………………………………………………………………………30
5.1. Conclusions…………………………………………………………………………………………………....30
5.2. Implications…………………………………………………………………………………………………....31
5.3. Limitations and further research………………………………………………………………….….33
References………………………………………………………………………………………………………………………34
Appendix I…………………………………………………………………………………………………………………….…37
4
1. Introduction
Customer satisfaction is a key element that leads to brand loyalty (Majid, Mehmood,
Shahzad, 2012), and brand loyalty has an influence on the sales of a company. Therefore, it is
likely to assume that customer satisfaction is something to which retailers aspire. One major
factor influencing customer satisfaction is store environment (Marques, Cardoso, Palma,
2013). Store environment consists of three sorts of factors: ambient factors, such as
lightning, scent and music; design factors such as layout and assortment and social factors
such as the presence and effectiveness of salespersons (Baker, Parasuraman, Grewal, Voss
2002). Multiple studies have shown the importance of store environment. So did for
example the study of Kaltcheva and Weitz (2006) show that a stimulating in-store
atmosphere, including tangible and intangible store environment factors such as lightning,
music and temperature, can lead to specific emotional outcomes, resulting in more time and
money spending of the consumer in store.
Store layout is a design factor of which retailers make use. A store layout is used in order to
guide the consumer through the shopping areas. They are important because they influence
in-store traffic patterns, shopping behaviour and efficiency (Kent and Kirby, 2009). A good
layout can help the shopper find what he or she wants faster (Mohan, 2013), and it makes
the shopping experience more enjoyable (Baker et al., 2002). Next to that, a store layout
design can also influence the wants and preferences of consumers by influencing the subset
of options provided or influencing the way the assortment is displayed (Simonson, 1999).
According to the retail store layout theory, there are three types of layout designs
(Vrechopoulos, O’Keefe, Doukidis, Siomkos, 2004). The first one is the grid layout, consisting
of long aisles parallel to each other; which facilitates routine and planned shopping
behaviour. The second is the freeform layout, which is an asymmetric arrangement of aisles
and displays of different sizes, shapes and styles. In this layout, there is more freedom to
move within the store and it should increase the time that consumers are willing to spend
time in store. Next to that, it makes it easier for shoppers to browse the store. The last
layout form is the racetrack layout. This layout consists of semi-separate areas, each built
based on a particular shopping theme. The aim of this layout is to lead the customer along
specific paths in order to show them as many store sections as possible.
But there is more. According to the study of Broniarcyz, Hoyer and McAlister (1998), one of
the most fundamental aspects of a store environment is the way in which space is utilized.
However, space is often overlooked by most retail operations (Jual-Jacobsen and Granzau,
2015). The reason for this is because space is one of the biggest investments in retail. It is
logical to think that for this reason retail organisations try to use as less as space possible
and try to use this in the most efficient way. In order to achieve this, efficient strategies are
needed in order to optimize their profit with limited space available.
5
1.1. Definition of the problem
Out of the literature it can be derived that lots of research has been done about store
environment factors such as music, lightning and layout; and also to shelf-space which is
considered as a fundamental aspect of store environment. However, no research has been
done from another perspective of space and layout, namely the shelves themselves and the
space they occupy. The height of shelves and the width of aisles can provide multiple
combinations of space use. Whereas the width of aisles is discussed in multiple studies, the
combination of aisles and shelves is not investigated earlier in my knowledge. However, this
is crucial for the retail industry, since store layout influences not only in-store traffic
patterns, shopping atmosphere, shopping behaviour and operational efficiency (Lewison,
1994); but also the degree in which the customer is satisfied (Simonson, 1999). Therefore, it
is important that this gap in the literature will be overbridged. This gap can form a problem
for managers, because in the existing high competitive retailing environment with the high
costs of retail space and a high density of shoppers, effective space utilisation is important
for maintaining or increasing profitability (Mehta, Shamra, Swami, 2012).
Considering space use in retail setting entails taking into account consequences for store
environment factors. Crowdedness is a store environment factor which has implications for
retail managers. Mehta et al., (2012) revealed that perceived crowding due to high shopper
density can have effect on the behavioural response of consumers and even satisfaction.
They reasoned that the feeling of crowdedness has an influence on the feeling of perceived
control, and that this in turn has an influence on the pleasure of the shopping experience.
The feeling of control and pleasure during the shopping experience are factors related to
store environment and both influence customer satisfaction.
Besides satisfaction, the retail environment is an important factor that influences the
perception of a customer of a store (Sevilla and Townsed, 2016). It appears that a consumer
uses surrounding cues to evaluate the store when he or she enters. For example, store
attributes are used in order to determine store prestige and overall price level. This was
demonstrated by Buyukkurt (1986), where he asked people to indicate their perceived price
level, given multiple store attributes. The results revealed that shoppers perceive an
expensive-looking interior as a cue for a prestigious store.
This research will be aimed at recreational shoppers. Nowadays, online shopping is
advantageous compared to traditional shopping, in terms of cost-effectiveness,
convenience, accessibility, competitiveness and commodity prices (Zhang, Zhu, Ye, 2016).
Therefore, I assume that shopping is more often a hedonic activity nowadays. Next to that,
these shoppers are more likely to spend more time in-store and to browse the store, which
can lead to an increase in their spending. This makes them an interesting target group.
6
The aim of this research is to expand the literature and to provide managers with
information which they can use to improve the satisfaction of their customers and to
increase their sales. This research will obtain empirical data in order to investigate 1) what
the effect of different heights of shelves and width of aisles have on the store image of
recreational shoppers, and 2) to investigate what effect different heights of shelves and
widths of aisles have on the satisfaction of the shopping trip of recreational shoppers. The
next section provides the theoretical basis for this thesis, where the store environment and
its implications will be discussed. In this section hypotheses will be constructed based on the
literature. In the method section (section 3), the experiment is described. Section 4 describes
the results. Lastly, section 5 concludes and discusses the thesis where the following research
question will be answered:
‘To what extent have the height of shelves and the width of aisles an influence
on the store image and the experienced satisfaction of recreational shoppers?’
7
2. Theoretical Background
In retail settings, design elements are used in order to provide consumers of a satisfying
shopping experience, and to project a favourable store image (Machleit and Eroglu, 2000).
When customers are satisfied, not only they are willing to spend more time in the store, also
the chance that he or she will return enlarges. Marques, Cardoso and Palma (2013)
supported this, by arguing that store environment can play a very important role in
increasing customers’ satisfaction. They argued that currently this is especially the case due
to the difficulty of differentiating products, price, promotion and location for retailers. As a
result of this, retailers try to differentiate themselves through store environment by creating
one which produces beneficial effects on buyers with the aim of increasing the profitability
of the company. Customer satisfaction can be described as satisfying the needs or wants of a
consumer in more better way than competitors (Majid et al., 2012). When the customer is
satisfied, the change of customer retention is bigger. The degree in which a customer is
satisfied not only depends on product quality, but also on other factors such as store
environment. Therefore, in this study customer satisfaction is defined as the customer’s
overall evaluation of the store experience: the experienced satisfaction of the shopping trip.
2.1. Store environment
Store environment consists of ambient factors, design factors and social factors which are
used in order to create a pleasant shopping experience. Kotler (1973) introduced the term
atmospherics, by which he described the conscious planning of space in order to create such
an effect on buyers that the probability of a purchase increases. The layout of a store is thus
one of the store environment factors and is quite important, because for many buyers
convenience is of value. A good layout not only encourages customers to explore products
and move through the store; it also allows easy movement between departments and help
customers finding their products easily (Marques, Cardoso, Palma, 2013).
Whereas a good layout can attract customers to move through the store and buy more
products than planned originally, which leads to an increase in customer satisfaction; a too
complex layout can create customer dissatisfaction (Baker et al., 2002).
Besides for customer satisfaction, design elements are used to project a favourable store
image (Machleit and Eroglu, 2000). When a customer enters the store, he or she uses
surrounding cues to evaluate the store (Sevilla and Townsend, 2016). Multiple researches
demonstrated the influence of store environment on customer satisfaction and store image.
For example the study of Baker et al., (2002), where they demonstrated the influence of a
layout on customer satisfaction. They created a model in where they it was expected that
store environmental dimensions, consisting of social, design and ambient factors, influence
consumers’ perceptions of store choice criteria and that these perceptions affect store
patronage intentions. These store choice criteria consisted of interpersonal service quality

8
perceptions, merchandise quality perceptions and monetary price perceptions. In order to
test their model, they showed 297 students a video tape of a card-and-gift shop which
‘walked’ them through the shop in order to let them experience a store environment with
ambient, design and social factors. After this, they had to fill in a questionnaire. The results
demonstrated linkages among store environment cues, store choice criteria and store
patronage intentions and was the first who examined a store patronage model. For example,
they showed that monetary price perceptions, perceptions of store environment and
merchandise quality perceptions all had a significant effect on store patronage intentions.
2.2. Shopping motives
Consumers go shopping with different motives. Sometimes a shopping trip is goal directed
with a clear end goal, and other times a shopping trip is a recreational activity by which the
fun of shopping is the goal itself and not the purchase of a specific product. This distinction
in shopping motives is between a so called task-oriented shopper and a recreational
shopper. This was argued in a study by Rompay, dijkstra, Verhoeven, Es (2012), where they
indicated some important differences between these two sorts of shoppers. A task-oriented
shopper visits a store just only to obtain a specific product and derives little or even no
satisfaction from the shopping activity itself besides the outcome of the shopping activity.
This shopper has no interest in non-functional aspects of the retail environment. This was
supported by the findings of Kaltcheva and Weitz (2006), where they showed that task-
oriented shoppers can even consider a high-arousal environment as unpleasant and goal-
distracting. The opposite is true for the recreational shopper; a high-arousing store
environment may contribute to the fun of the shopping trip. This can be explained by the
fact that they want provide themselves with enjoyment during the shopping trip, such as
experiencing the pleasure of bargaining and social interaction (Yim, Roo, Sauer, Seo, 2014).
Recreational shoppers place a higher importance on store ambience, less on acquiring a
product and are more likely to continue shopping after they have already bought something
(Eroglu and Machleit, 1990). These activities are often described as ‘browsing’, which implies
‘the in-store examination of a retailer’s merchandise for informational and/or recreational
purposes without an immediate intent to buy’ (Yim, Roo, Sauer, Seo, 2014, p.532).
2.3. Space in retail setting
It is important that retailers pay attention to how they use their space. Crowded retail
environments can reduce shopper satisfaction and can lead to an earlier leave of the store,
so demonstrated O’Guinn, Tanner and Maeng (2015). In this study it was investigated by
means of six studies whether social density influences inferences of social class, and whether
such inferences then moderate the perception of the valuation of other products. By means
of a literature study, they defined territoriality as the attempt to control areas and the
resources located within these areas. The attempt of control was expressed in terms of
power, status and social hierarchy. The fact is that territory size, which indicates a lower
density of any creatures that could be seen as competitors, is related to perceived social
9
status. The more power, the higher your social status and this means larger territories. Think
about it: the big bosses always have the largest offices. Closely related to territory is
distance. Individuals with a high status show greater social distance from others; and low
status individuals show smaller social distance from others. The reason for this is because
the higher status people want to prevent that the lower status individuals gain access to
their valuable resources, and that they do not want to be confused with those of less power.
Based on the literature, they predicted that a lower social density is associated with a higher
social status. Secondly, it was predicted that a lower social density will result in higher
willingness to pay than with higher social density, mediated through social class. In the first
study, they tested whether social density could evoke representations of social class by
means of an experiment. In total, 75 students were randomly assigned to a high-density
condition (36 figures on a white background) or a low-density condition (2 figures on a white
background). The participants were asked to take a look at the picture and try to imagine the
characteristics of the people in the room, before estimating their social class and income.
The results revealed that people perceived the figures in the low-density condition of a
higher social status with a higher income. A weakness of this study was that they could not
rule out the possibility that the inferences of a low social class by the people who had the
high-density condition, was a result of the number of figures in the picture, as opposed to
their density. Therefore, a second study was executed. Here, the size of the room was
altered, so that they could hold the number of figures constant between the conditions. In
total, 21 figures were presented in a small/big room for the high/low density condition
respectively. The same procedure was held as in study 1 and the results were similar. Study 3
examined whether these social class inferences influenced product valuation, and made use
of an intermediate condition for better generalization. Here, participants were asked to take
a look at the picture and to imagine buying a pair of shoes, and to estimate the price of a
pair of shoes from that shop. Also, they were asked to indicate their willingness to pay. It
appeared that people estimated the price of the shoes higher at the least crowded store and
were willing to pay more in a low-density store. Since participants were asked to imagine the
shop; the participants in the higher-density condition could have experienced the shop as
stressful and therefore they were less willing to pay. Therefore, in study 4 the participants
were asked to bid on a product in a store, without imagining the store. The results were
significant with study 3, meaning that people were willing to pay more for a product in a
low-density store than in a high-density store. Study 5 tried to explain this effect, by testing
how social class inferences influence willingness to pay. They wanted to discover
association-disassociation motives between the self and the pictured others. The same
procedure was held as in the other studies; the participants were randomly assigned to one
of the conditions, were asked to take a look at the picture and indicate their willingness to
pay. Now, they also had to report the degree of similarity they felt to the people on the
picture and the degree in which they wanted to be similar to them. The results added to the
previous results that the people wanted to be more similar to those people they perceived
10
of high social states (in the low-density condition). A limitation of these studies was that
other factors in the shop were not manipulated, which could have influenced the answers.
Therefore, study 6 examined the spontaneous nature of the inferences. In another
experiment, the willingness to pay for a pair of shoes was measured, in where social density
was neither explicitly nor implicitly highlighted to the participants. The results demonstrated
this spontaneous nature which established the expectations. This study was the first who
demonstrated the linkages between social density, social class and product valuation.
2.4. Store image
The design of a store layout has an important influence on the creation of a store image, and
store image is an important factor which affects consumer behaviour (Kent, Kirby, 2009).
Store image is an ambiguous concept, because the definition differs across studies.
According to Hsu, Huang and Swanson (2010), store image is formed by four types of store
attributes: merchandise attributes, service attributes, store ambience and marketing
attractiveness. Here it was mentioned that concerning store layout, merchandise attributes
and store ambience play a role in forming a store image. Merchandise attributes involve
product quality, selection of assortment and pricing. Store ambience is related to the visual
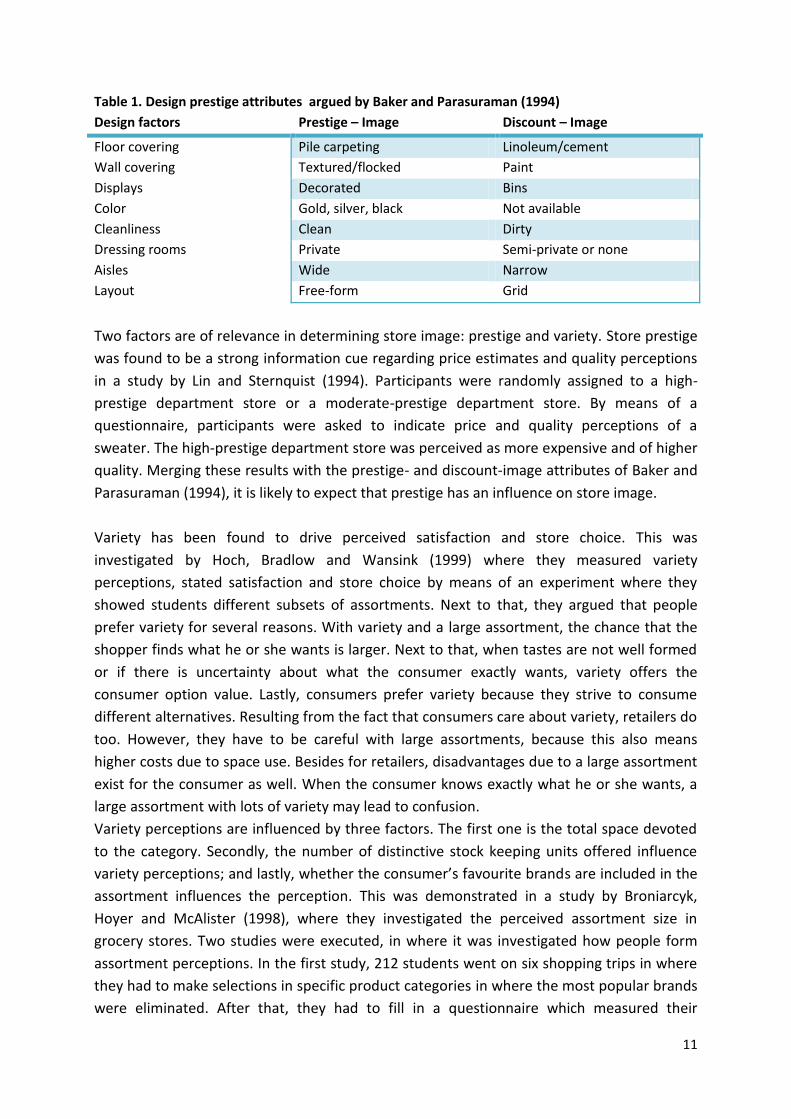
display of merchandise and the ease of mobility within the store. Baker and Parasuraman
(1994) proposed that store environment, merchandise quality and service quality are
antecedents of store image rather than components. Next to that, they proposed that these
factors have an indirect influence on store image, rather than a direct influence, through
merchandise and service quality inferences. The aim of this study was to investigate the
relationship between store environment, merchandise quality, service quality and store
image. In an experiment, ambient, design and social factors were manipulated in a card and
gift shop. These manipulations resulted in prestige-image and discount-image conditions. An
important finding in their study was this relationship between store environment,
merchandise quality, service quality and store image. As expected, their results
demonstrated that these factors are mediators of store image, rather than components. It
was argued that consumers use store environment factors to make inferences. For example,
a store with thick carpeting and fashionable colours are often inferred as a store that sells
high quality products and offers a high quality service (see table 1). Here, store image is
defined as the way the customer (the recreational shopper) perceives the store based on
store attributes.
11
Table 1. Design prestige attributes argued by Baker and Parasuraman (1994)
Design factors Prestige – Image Discount – Image
Floor covering Pile carpeting Linoleum/cement
Wall covering Textured/flocked Paint
Displays Decorated Bins
Color Gold, silver, black Not available
Cleanliness Clean Dirty
Dressing rooms Private Semi-private or none
Aisles Wide Narrow
Layout Free-form Grid
Two factors are of relevance in determining store image: prestige and variety. Store prestige
was found to be a strong information cue regarding price estimates and quality perceptions
in a study by Lin and Sternquist (1994). Participants were randomly assigned to a high-
prestige department store or a moderate-prestige department store. By means of a
questionnaire, participants were asked to indicate price and quality perceptions of a
sweater. The high-prestige department store was perceived as more expensive and of higher
quality. Merging these results with the prestige- and discount-image attributes of Baker and
Parasuraman (1994), it is likely to expect that prestige has an influence on store image.
Variety has been found to drive perceived satisfaction and store choice. This was
investigated by Hoch, Bradlow and Wansink (1999) where they measured variety
perceptions, stated satisfaction and store choice by means of an experiment where they
showed students different subsets of assortments. Next to that, they argued that people
prefer variety for several reasons. With variety and a large assortment, the chance that the
shopper finds what he or she wants is larger. Next to that, when tastes are not well formed
or if there is uncertainty about what the consumer exactly wants, variety offers the
consumer option value. Lastly, consumers prefer variety because they strive to consume
different alternatives. Resulting from the fact that consumers care about variety, retailers do
too. However, they have to be careful with large assortments, because this also means
higher costs due to space use. Besides for retailers, disadvantages due to a large assortment
exist for the consumer as well. When the consumer knows exactly what he or she wants, a
large assortment with lots of variety may lead to confusion.
Variety perceptions are influenced by three factors. The first one is the total space devoted
to the category. Secondly, the number of distinctive stock keeping units offered influence
variety perceptions; and lastly, whether the consumer’s favourite brands are included in the
assortment influences the perception. This was demonstrated in a study by Broniarcyk,
Hoyer and McAlister (1998), where they investigated the perceived assortment size in
grocery stores. Two studies were executed, in where it was investigated how people form
assortment perceptions. In the first study, 212 students went on six shopping trips in where
they had to make selections in specific product categories in where the most popular brands
were eliminated. After that, they had to fill in a questionnaire which measured their
12
assortment perception. In the second study, the least favourite brands were dropped and
the assortment perceptions were measured again. The availability of the favourite product
and the shelf-space devoted to the product were held constant and the findings showed that
these were the factors which made sure that store choice was not affected. The results of
this study took away the fear of retailers that offering a smaller assortment resulted in a
lower perceived assortment size and therefore a decrease in the likelihood of store choice.
They demonstrated that it is possible for retailers to decrease their assortment without
influencing perceived assortment size, as long as they held category space constant and as
only low-preference items were removed. With a smaller assortment, less space is needed
and this influences the costs positively.
Variety and store prestige are related factors. Smith and Burns (1996) demonstrated this by
investigating the use of a power aisle. A power aisle is a dominant aisle in a retail store,
characterized by mass displays of large quantities of a small number of units. The aim of this
aisle is to create the impression that the products are at very low prices. In this study it was
investigated how the power aisle can affect price images of consumers of the products in
that power aisle. Customers in two different grocery stores were asked to indicate their
price perceptions on a ten point scale. The results were in line with their expectations, which
implied that a power aisle affects consumers’ price perceptions. Large quantities of relatively
a low number of items results in low price perceptions, whereas a smaller quantity of more
products resulted in higher price perceptions. Besides this, it was found that a power aisle
results in a lower perceived store prestige, or better said, a discount store. Knowing this, it
would indicate that with a higher variety (and less quantity), the price perceptions are higher
than with a lower variety (and more quantity). Consequently, it is likely to expect that the
perceived store prestige of a store with a low variety would be low, and thus the consumers
would perceive this store as a discount store.
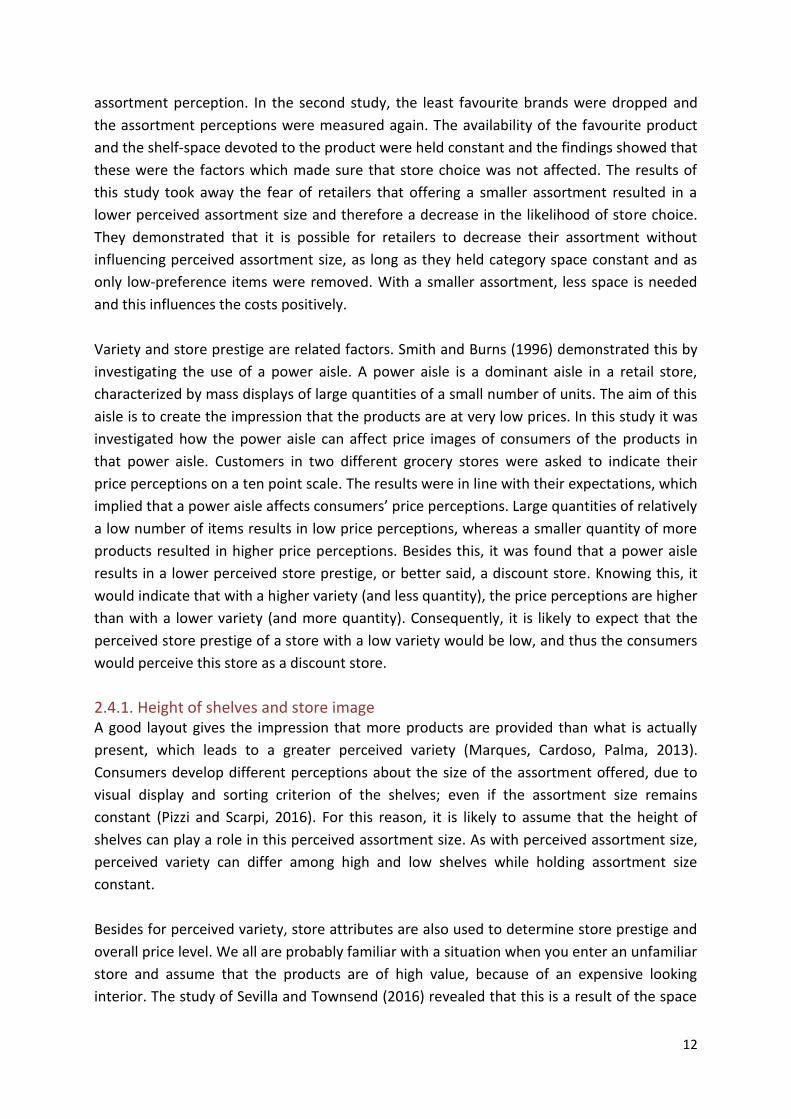
2.4.1. Height of shelves and store image A good layout gives the impression that more products are provided than what is actually
present, which leads to a greater perceived variety (Marques, Cardoso, Palma, 2013).
Consumers develop different perceptions about the size of the assortment offered, due to
visual display and sorting criterion of the shelves; even if the assortment size remains
constant (Pizzi and Scarpi, 2016). For this reason, it is likely to assume that the height of
shelves can play a role in this perceived assortment size. As with perceived assortment size,
perceived variety can differ among high and low shelves while holding assortment size
constant.
Besides for perceived variety, store attributes are also used to determine store prestige and
overall price level. We all are probably familiar with a situation when you enter an unfamiliar
store and assume that the products are of high value, because of an expensive looking
interior. The study of Sevilla and Townsend (2016) revealed that this is a result of the space
13
allocated to the product set, so called the ‘perceived space-to-product ratio’. They
demonstrated that when a retailer allocates more space to the presentation of a set
products, they benefit from positive effects on factors as product valuation, the likelihood of
purchase, overall amount spend and even the perception of the product experience.
Although this study concerned shelf space allocated to product, I expect that the same holds
concerning shelves as a whole.
Referring back to the study of Baker and Parasuraman (1994), where they identified the
characteristics of a prestige-image store environment and a discount-image store
environment (see table 1); there it was argued that an open layout results in a prestige-
image and a grid layout in a discount-image. Therefore it is likely to assume that high
shelves, in combination with a grid layout will result in a lower prestige image (discount); or
in other words, that high shelves have a negative effect on store prestige. Furthermore, I
expect that high shelves will lead to a greater perceived quantity. Smith and Burns (1999)
demonstrated that a high quantity and low variety have a negative effect on store prestige.
Therefore, I expect that low shelves will result in a higher perceived variety and store
prestige. Consequently, I expect that low shelves will have a more positive effect on store
image.
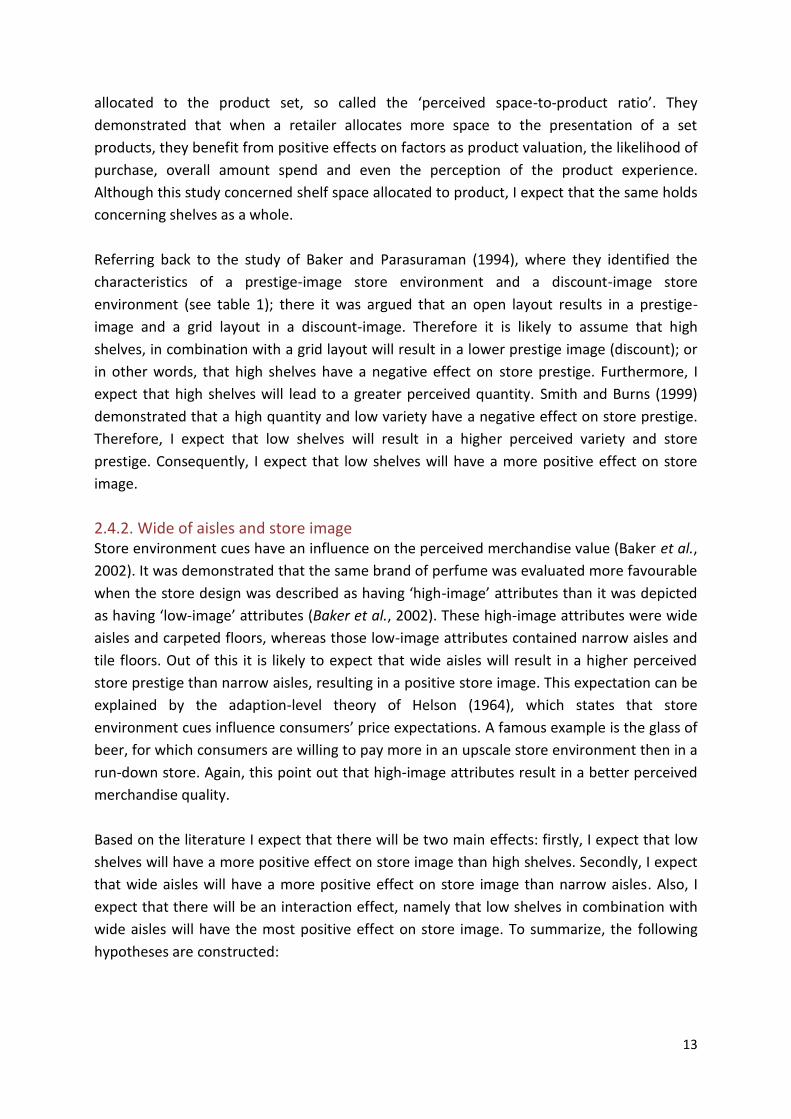
2.4.2. Wide of aisles and store image Store environment cues have an influence on the perceived merchandise value (Baker et al.,
2002). It was demonstrated that the same brand of perfume was evaluated more favourable
when the store design was described as having ‘high-image’ attributes than it was depicted
as having ‘low-image’ attributes (Baker et al., 2002). These high-image attributes were wide
aisles and carpeted floors, whereas those low-image attributes contained narrow aisles and
tile floors. Out of this it is likely to expect that wide aisles will result in a higher perceived
store prestige than narrow aisles, resulting in a positive store image. This expectation can be
explained by the adaption-level theory of Helson (1964), which states that store
environment cues influence consumers’ price expectations. A famous example is the glass of
beer, for which consumers are willing to pay more in an upscale store environment then in a
run-down store. Again, this point out that high-image attributes result in a better perceived
merchandise quality.
Based on the literature I expect that there will be two main effects: firstly, I expect that low
shelves will have a more positive effect on store image than high shelves. Secondly, I expect
that wide aisles will have a more positive effect on store image than narrow aisles. Also, I
expect that there will be an interaction effect, namely that low shelves in combination with
wide aisles will have the most positive effect on store image. To summarize, the following
hypotheses are constructed:
14
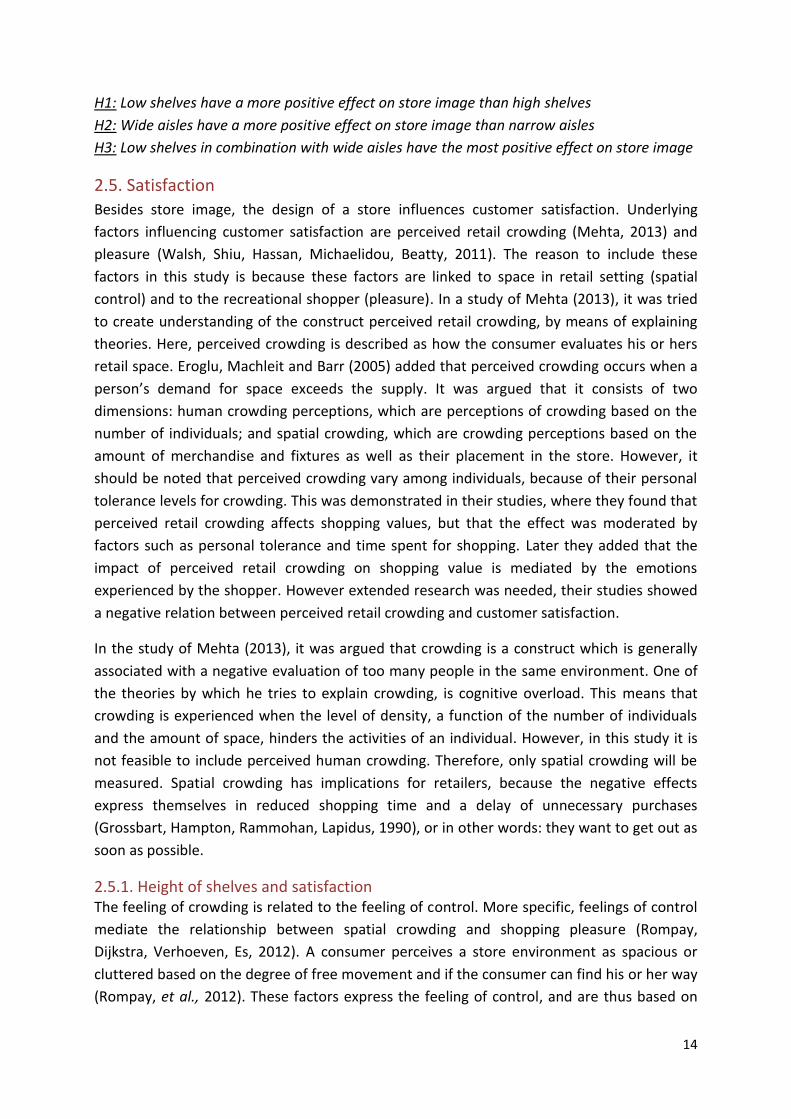
H1: Low shelves have a more positive effect on store image than high shelves
H2: Wide aisles have a more positive effect on store image than narrow aisles
H3: Low shelves in combination with wide aisles have the most positive effect on store image
2.5. Satisfaction
Besides store image, the design of a store influences customer satisfaction. Underlying
factors influencing customer satisfaction are perceived retail crowding (Mehta, 2013) and
pleasure (Walsh, Shiu, Hassan, Michaelidou, Beatty, 2011). The reason to include these
factors in this study is because these factors are linked to space in retail setting (spatial
control) and to the recreational shopper (pleasure). In a study of Mehta (2013), it was tried
to create understanding of the construct perceived retail crowding, by means of explaining
theories. Here, perceived crowding is described as how the consumer evaluates his or hers
retail space. Eroglu, Machleit and Barr (2005) added that perceived crowding occurs when a
person’s demand for space exceeds the supply. It was argued that it consists of two
dimensions: human crowding perceptions, which are perceptions of crowding based on the
number of individuals; and spatial crowding, which are crowding perceptions based on the
amount of merchandise and fixtures as well as their placement in the store. However, it
should be noted that perceived crowding vary among individuals, because of their personal
tolerance levels for crowding. This was demonstrated in their studies, where they found that
perceived retail crowding affects shopping values, but that the effect was moderated by
factors such as personal tolerance and time spent for shopping. Later they added that the
impact of perceived retail crowding on shopping value is mediated by the emotions
experienced by the shopper. However extended research was needed, their studies showed
a negative relation between perceived retail crowding and customer satisfaction.
In the study of Mehta (2013), it was argued that crowding is a construct which is generally
associated with a negative evaluation of too many people in the same environment. One of
the theories by which he tries to explain crowding, is cognitive overload. This means that
crowding is experienced when the level of density, a function of the number of individuals
and the amount of space, hinders the activities of an individual. However, in this study it is
not feasible to include perceived human crowding. Therefore, only spatial crowding will be
measured. Spatial crowding has implications for retailers, because the negative effects
express themselves in reduced shopping time and a delay of unnecessary purchases
(Grossbart, Hampton, Rammohan, Lapidus, 1990), or in other words: they want to get out as
soon as possible.
2.5.1. Height of shelves and satisfaction The feeling of crowding is related to the feeling of control. More specific, feelings of control
mediate the relationship between spatial crowding and shopping pleasure (Rompay,
Dijkstra, Verhoeven, Es, 2012). A consumer perceives a store environment as spacious or
cluttered based on the degree of free movement and if the consumer can find his or her way
(Rompay, et al., 2012). These factors express the feeling of control, and are thus based on
15
their spatial crowding perceptions. Studies have shown that a spacious layout can heighten
pleasure in retail and leisure setting, in contrast to a cluttered layout (Rompay et al., 2012).
Out of this it can be deduced that a spacious layout has a positive effect on the feeling of
control and on the feeling of pleasure. However, Kaltcheva and Weitz (2006) argued that
recreational shoppers have a preference for a high-arousing environment. This was
supported by Rompay et al., (2012), who argued that recreational shoppers benefit from a
high-arousing environment. In this way there is more to see, they can browse the shop and
this makes the shopping trip more fun.
Further, Rompay et al., (2012) argued that recreational shoppers do not care much about
unobstructed movement and overview, and that for this reason store layout should not
affect pleasure. This would indicate that the height of shelves do not affect pleasure. I do not
agree with them at this point. Although they stated that spatial crowding and pleasure are
related, which makes it not unlikely to think that in case the shoppers are neutral about their
spatial crowding perceptions, pleasure is not affected consequently; in my opinion the
pleasure of a recreational shopper is always affected. In the end, deriving pleasure is the
reason why they went on a shopping trip. I expect that the height of shelves have influence
on their pleasure, because whether they perceive a store as spacious or high-arousing can be
influenced by this design factor. For example, when they perceive a store as not arousing at
all, this does not contribute to their ‘shopping goal’ (having fun), and this can negatively
affect their pleasure and perhaps also their satisfaction. A filled room is more likely to be
perceived as high-arousing, in contrary to a spacious room. Therefore, I expect that high
shelves will be perceived as more arousing and more contributing to the satisfaction of their
shopping experience than low shelves.
2.5.2. Width of aisles and satisfaction
Pointing to spatial control, there is more known about the contribution of the width of aisles
to this feeling, in contrary to the height of shelves. Machleit and Eroglu (1990) showed that
perceived crowding, either human as spatial, can influence patronage decisions and also
overall satisfaction of the shopping experience. This is more general, because no distinction
is made between a task-oriented and a recreational shopper. Referring back to the study of
Rompay et al., (2012), where they do distinguish between a task-oriented and recreational
shopper and indicate that the recreational shopper attaches less value to unobstructed
movement and wayfinding; it was argued that the reason for this is because they do not
have a specific route to follow (to reach the desired product). Linking this to aisles, it would
concern that they don’t mind if they were located in a narrow aisle with a bigger chance of
obstacles. More specific, it would not affect their experienced satisfaction. However, the
literature says that crowding is experienced by individuals when the number of people
and/or objects in a limited space restricts or interferes with the activities of those
individuals. In case of a narrow aisle, the density between the shelves is bigger than in case
of a wide aisle and this can lead to a feeling of spatial crowding. When crowding is

16
perceived, this can lead to a decrease in satisfaction. Based on that, I expect that de wide
aisles have a more positive effect on the feeling of satisfaction, due to the feeling of
perceived spatial control. When spatial crowding is experienced, it is likely that the shopper
does not want to spend time in the store and to explore it. It is possible that they experience
a reduced feeling of enjoyment and this has an effect on pleasure. Therefore, I expect that
the wide aisles have a more positive effect on the feeling of satisfaction.
To sum up, I expect two main effects: one which implies that the high shelves have a more
positive effect on the satisfaction of the shopping trip than low shelves, and the other one
which implies that the wide aisles have a more positive effect on the satisfaction of the
shopping trip than narrow aisles. Besides that, I also expect that there is an interaction effect
between these two. This resulted in the following hypotheses:
H4: High shelves have a more positive effect on customer satisfaction than low shelves
H5: Wide aisles have a more positive effect on customer satisfaction than narrow aisles
H6: High shelves in combination with wide aisles have the most positive effect on customer
satisfaction
Figure 1. Conceptual model
17
3. Method
By means of an experiment, the two independent variables were manipulated. The first
manipulation concerned the height of shelves, which were manipulated in a way that the
shelves were high or low. The second manipulation concerned the width of aisles, which
were wide or narrow. By means of these manipulations, its effects on the dependent
variables ‘store image’ and ‘customer satisfaction’ were tested.
3.1 Research design and manipulation
The experiment consisted of a two-by-two design, which indicates that both the
independent variables had two levels. The height of shelves had the two levels: low and
high; and the width of aisles had the two levels: narrow and wide. This resulted in four
layouts:
1. High shelves – narrow aisles
2. High shelves – wide aisles
3. Low shelves – narrow aisles
4. Low shelves – wide aisles
A between-subject design was used, which meant that the participants faced only one of the
four layouts. The reason to choose for a between-subject design instead for a within-subject
design was because of the risk that the participants figured out what the aim of the study
was, and this could have influenced their answers.
The layouts were designed in a virtual programme named Sketch up. In this program, a
standard layout of a grid layout was used as starting point, and from there the heights of the
shelves and the widths of the aisles were manipulated. It was important that there was a
clear difference between the heights and the widths; therefore, the width of the wide aisle
(2.40m) was two times the width of the narrow aisle (1.20m). Consequently, also the height
of the high shelve (3m) was two times the height of the low shelve (1.5m). In this way, there
was a clear difference between the layouts. Pictures of these layout designs were copied and
pasted in the survey. The reason to choose for the grid layout-form was because of the belief
that this layout-form is most ‘neutral’ and illustrates the differences between the
manipulated variables very clear.
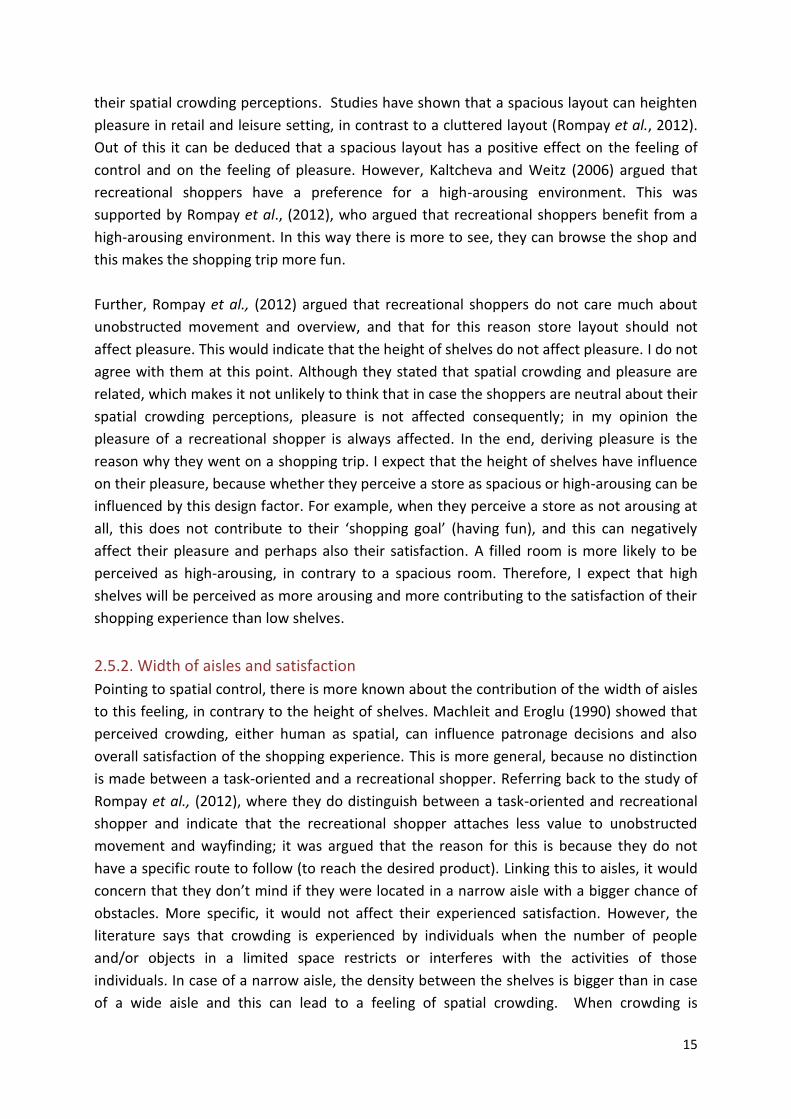
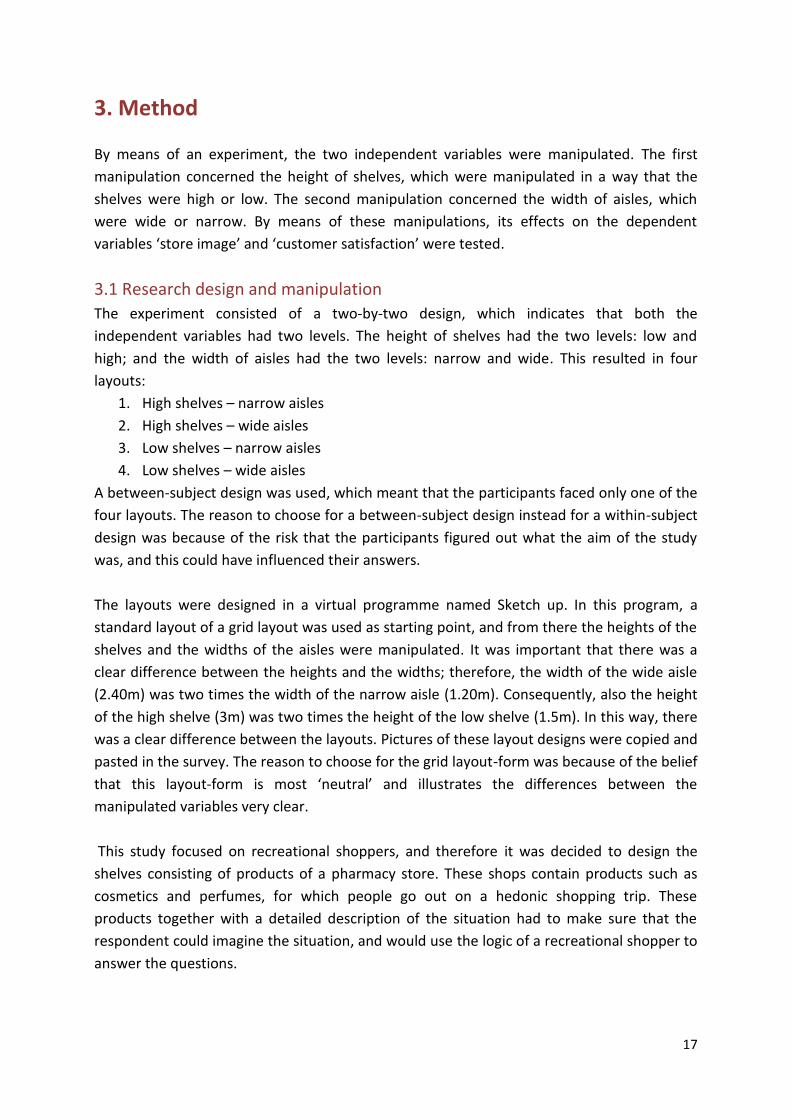
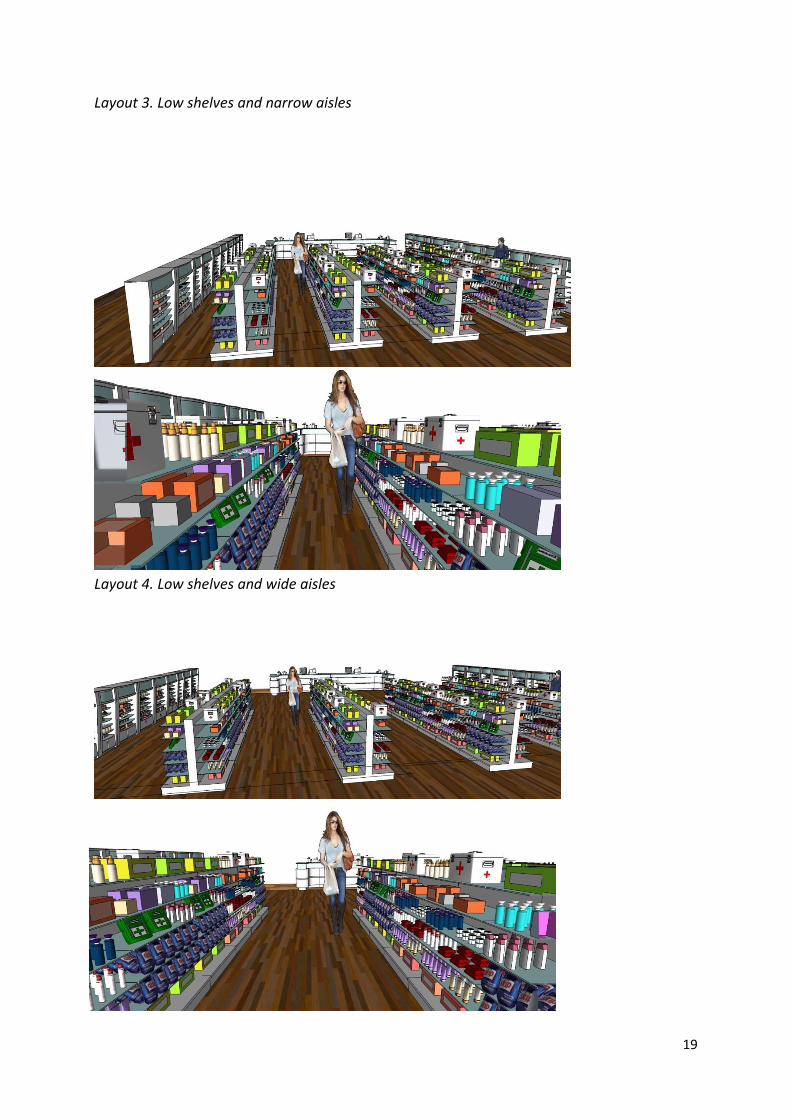
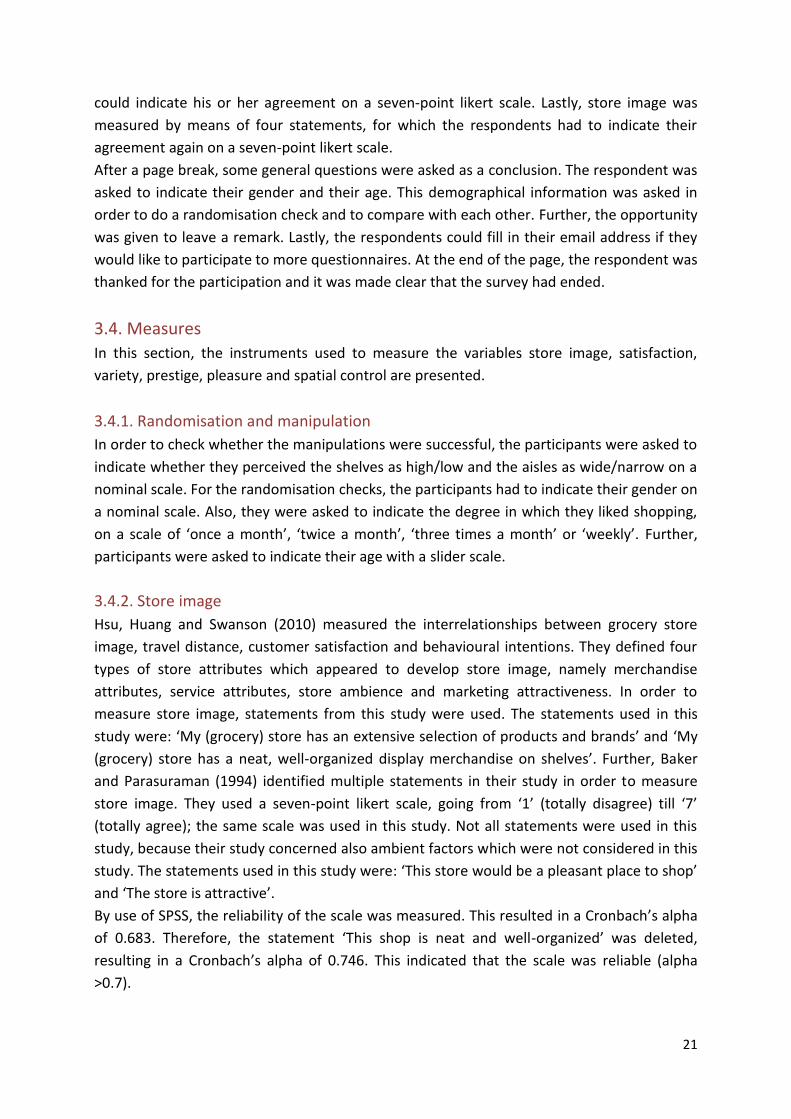
This study focused on recreational shoppers, and therefore it was decided to design the
shelves consisting of products of a pharmacy store. These shops contain products such as
cosmetics and perfumes, for which people go out on a hedonic shopping trip. These
products together with a detailed description of the situation had to make sure that the
respondent could imagine the situation, and would use the logic of a recreational shopper to
answer the questions.

18
Figure 2. Layouts
Layout 1. High shelves and narrow aisles
Layout 2. High shelves and wide aisles
19
Layout 3. Low shelves and narrow aisles
Layout 4. Low shelves and wide aisles

20
3.2. Participants
In total, 233 participants filled in the online questionnaire. Out of this number, 168 finished
the survey. In total, 52 men and 116 women filled in the survey. The age of the respondents
was between the 17 and the 89, with a mean of 23.63 and a standard deviation of 10.33. The
participants were recruited by means of social media, such as Facebook and WhatsApp. They
received a link which they could open to fill in the questionnaire. Also, the survey link was
send to people who were member of an e-mail list.
3.3. Procedure
The data was collected by means of an online questionnaire (see Appendix I). The surveys
were constructed by use of the program Qualtrics, an online program at which surveys can
be designed and spread and which collects the data. The reason to choose for an online
survey was because this method enabled reaching a lot of respondents.
The welcome page had the aim to inform the respondent and ask for consent. It was made
clear that participating was voluntary, that the answers remained anonym and would be
treated confidentially. The respondent was ensured that the answers would only be used for
this research. Also, it was made clear that no advantages (e.g. money, gift cards) or
disadvantages were attached by participating. My e-mail address was added so that the
respondents could contact me if there were any questions or remarks. When the
respondents clicked on the next page, Qualtrics assigned the respondents random evenly to
one of the four conditions by means of the randomizer function. Pictures of one of the four
layouts were shown with a description which should have made clear the situation.
First, questions were asked in order to measure the perceived variety. This was done by
means of a statement with two extremes at the ends, of which the respondent could
indicate their agreement with one of the two extremes on a seven-point scale. Then,
questions concerning the appearance of the store and price perceptions were asked in order
to measure store prestige. Whereas variety was measured by a seven-point scale going from
‘very little variety’ till ‘very much variety’, store prestige was measured by means of a seven-
point scale going from ‘cheap’ till ‘luxurious’ for the appearance and ‘low value’ till ‘high
value’ for the price perception. After a page break, the illustrations of the layout were shown
again. The reason to add a page break was to prevent that the respondent saw too much
questions at one page, which could have resulted in a lowered motivation. This in turn could
have resulted in quitting filling in the survey, or filling in non-reliable answers. Below the
illustrations, questions were asked in order to measure pleasure and spatial control. First,
pleasure was measured by means of three statements for which the respondent could
indicate his or her agreement on a seven-point likert scale. Then, spatial control was
measured by means of four seven point scales, with two extremes at the beginning and the
end. The respondent was asked to indicate their agreement with the left or the right
extreme. Satisfaction was measured by means of three statements of which the respondent
21
could indicate his or her agreement on a seven-point likert scale. Lastly, store image was
measured by means of four statements, for which the respondents had to indicate their
agreement again on a seven-point likert scale.
After a page break, some general questions were asked as a conclusion. The respondent was
asked to indicate their gender and their age. This demographical information was asked in
order to do a randomisation check and to compare with each other. Further, the opportunity
was given to leave a remark. Lastly, the respondents could fill in their email address if they
would like to participate to more questionnaires. At the end of the page, the respondent was
thanked for the participation and it was made clear that the survey had ended.
3.4. Measures
In this section, the instruments used to measure the variables store image, satisfaction,
variety, prestige, pleasure and spatial control are presented.
3.4.1. Randomisation and manipulation
In order to check whether the manipulations were successful, the participants were asked to
indicate whether they perceived the shelves as high/low and the aisles as wide/narrow on a
nominal scale. For the randomisation checks, the participants had to indicate their gender on
a nominal scale. Also, they were asked to indicate the degree in which they liked shopping,
on a scale of ‘once a month’, ‘twice a month’, ‘three times a month’ or ‘weekly’. Further,
participants were asked to indicate their age with a slider scale.
3.4.2. Store image
Hsu, Huang and Swanson (2010) measured the interrelationships between grocery store
image, travel distance, customer satisfaction and behavioural intentions. They defined four
types of store attributes which appeared to develop store image, namely merchandise
attributes, service attributes, store ambience and marketing attractiveness. In order to
measure store image, statements from this study were used. The statements used in this
study were: ‘My (grocery) store has an extensive selection of products and brands’ and ‘My
(grocery) store has a neat, well-organized display merchandise on shelves’. Further, Baker
and Parasuraman (1994) identified multiple statements in their study in order to measure
store image. They used a seven-point likert scale, going from ‘1’ (totally disagree) till ‘7’
(totally agree); the same scale was used in this study. Not all statements were used in this
study, because their study concerned also ambient factors which were not considered in this
study. The statements used in this study were: ‘This store would be a pleasant place to shop’
and ‘The store is attractive’.
By use of SPSS, the reliability of the scale was measured. This resulted in a Cronbach’s alpha
of 0.683. Therefore, the statement ‘This shop is neat and well-organized’ was deleted,
resulting in a Cronbach’s alpha of 0.746. This indicated that the scale was reliable (alpha
>0.7).

22
3.4.3. Satisfaction Whether the respondent would be satisfied about his/her hedonic shopping experience
based on their illustrated combination of height of shelves and width of aisles, was also
measured based on the study of Hsu, Huang, Swanson (2010). In this study, satisfaction was
measured by means of multiple statements. The statements used in this study were: ‘I would
be satisfied with my decision to shop at this store’, ‘My choice to shop at this store would be
a wise one’ and ‘My experience at the store would have been enjoyable’. The respondents
were asked, when looking at the pictures, to indicate their agreement with these statements
on a seven-point likert scale that went from ‘1’ (totally disagree) till ‘7’ (totally agree). The
reliability analysis revealed a Cronbach’s alpha of 0.908, indicating good reliability.
3.4.4. Variety Measuring variety, the respondent was asked to take a look at the shelves which were
illustrated by means of pictures. Hoch, Bradlow and Wansink (1999) investigated the
influence of variety perceptions on satisfaction and store choice. In this study, they asked
177 graduates to judge the extent of variety in an assortment displayed on a computer by
means of a ten-point likers scale going from ‘1’ (very little variety) till ‘10’ (very much
variety). The question which they were asked was: ‘How varied is the store’s assortment of
jinkos?’. In this study, almost the same scale was used, only the question was framed
differently. The question which was asked in this study was: ‘Looking at the picture globally,
do you think that the assortment is varied?’. The reason to frame the question in this way
was to prevent that the respondent would pay serious attention to the products on the
shelves, instead of indicating their overall perception. Next to that, the scale was not a ten-
point likert scale, but a seven-point scale going from ‘1’ (very little variety) till ‘7’ (very much
variety’).
3.4.5. Prestige
Store prestige was measured based on the study of Smith and Burns (1996). In their study,
they measured the effect of a power aisle on consumers’ price image. Price perceptions
were determined based on a ten point scale with ‘1’ representing the lowest price
perceptions and ‘10’ representing the highest price perceptions. However, in this study the
seven-point scale was used more often and therefore it was decided to use it as well for this
variable. In this study, respondents were asked to take a look at the layouts and indicate
their perceived price perception of this store on a scale of ‘1’ (low value) till ‘7’ (high value).
Besides this, an unfulfilled statement was added which had to illustrate the appearance of
the store according to the respondent. The statement was ‘I think the appearance of this
store is …’; and the respondents could complete the statement by means of a seven point
scale going from ‘1’ (cheap) till ‘7’ (luxurious). The reliability analysis revealed a Cronbach’s
alpha of 0.762, indicating good reliability.
23
3.4.6. Pleasure In order to measure pleasure, three statements from the study of Nysveen, Pederson and
Thorb (2005) were used in order to measure the enjoyment of shopping in the store
(Bearden, Netemeyer, 2011). These statements were: ‘I find walking around in this shop
entertaining’, ‘I find walking around in this shop pleasant’ and ‘I find walking around in this
shop fun’. Respondents could indicate their level of agreement with these statements on a
seven-point likert scale from ‘1’ (totally disagree) till ‘7’ (totally agree). The reliability analysis
revealed a Cronbach’s alpha of 0.906, indicating good reliability.
3.4.7. Spatial control
Spatial control was measured by means of the measurement scale of Bateson and Hui (1987)
(Bearden, Netemeyer, 2011). The feeling of spatial control results from of the feeling of
spatial crowding. Batseson and Hui (1987) measured crowding in their study by means of a
seven-point semantic differential scale. The scale items they used were ‘not stuffy – stuffy’,
‘uncramped - cramped’, ‘restricted - free to move’ and ‘confined – spacious’. Not all of
these scales were used in this study, because this study did not measure (human)
crowdedness. In this study, the respondents were asked to look at the store and to indicate
by means of seven point scale whether they agreed with the left or the right scale for the
scale items ‘not stuffy – stuffy’, ‘uncramped – cramped’, ‘restricted – free to move’ and
‘confined – spacious’, in order to measure the feeling of spatial control.
The reason to switch the logic of the last two scales was in order to keep the respondent
alert. Consequently, before the analysis could have been conducted, these scales had to be
adjusted in SPSS. The scales ‘restricted – free to move’ and ‘confined – spacious’ were
recoded into the same variables, by switching the values. After this, a reliability analysis was
conducted, which revealed a Cronbach’s alpha of 0.712, indicating good reliability.
3.5. Analyzing At the end of the experiment, the results of the survey were compared. This was done by
use of the statistical programme SPSS. A two-way ANOVA was conducted in order to test
whether there existed main and interaction effects. A regression was conducted in order to
test whether found effects could be explained by the process variables. Correlations were
executed in order to gain insight to what extent the variables are associated with each other.
24
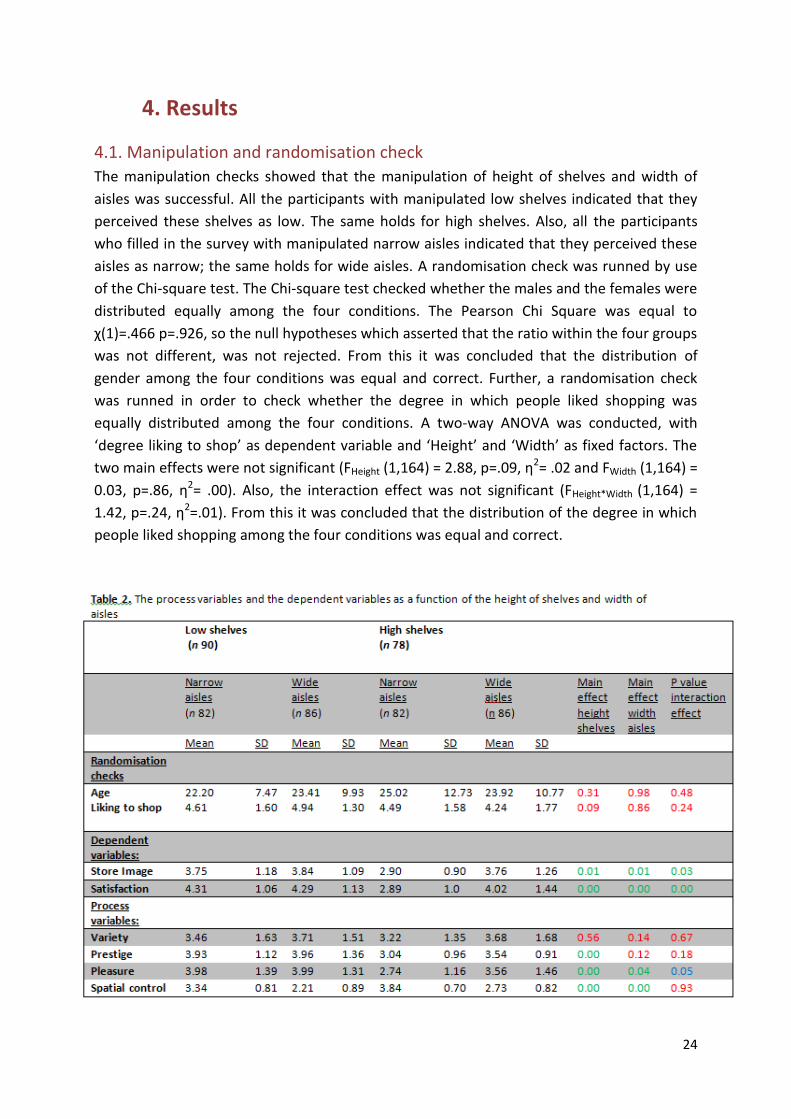
4. Results
4.1. Manipulation and randomisation check
The manipulation checks showed that the manipulation of height of shelves and width of
aisles was successful. All the participants with manipulated low shelves indicated that they
perceived these shelves as low. The same holds for high shelves. Also, all the participants
who filled in the survey with manipulated narrow aisles indicated that they perceived these
aisles as narrow; the same holds for wide aisles. A randomisation check was runned by use
of the Chi-square test. The Chi-square test checked whether the males and the females were
distributed equally among the four conditions. The Pearson Chi Square was equal to
χ(1)=.466 p=.926, so the null hypotheses which asserted that the ratio within the four groups
was not different, was not rejected. From this it was concluded that the distribution of
gender among the four conditions was equal and correct. Further, a randomisation check
was runned in order to check whether the degree in which people liked shopping was
equally distributed among the four conditions. A two-way ANOVA was conducted, with
‘degree liking to shop’ as dependent variable and ‘Height’ and ‘Width’ as fixed factors. The
two main effects were not significant (FHeight (1,164) = 2.88, p=.09, η2= .02 and FWidth (1,164) =
0.03, p=.86, η2= .00). Also, the interaction effect was not significant (FHeight*Width (1,164) =
1.42, p=.24, η2=.01). From this it was concluded that the distribution of the degree in which
people liked shopping among the four conditions was equal and correct.
25
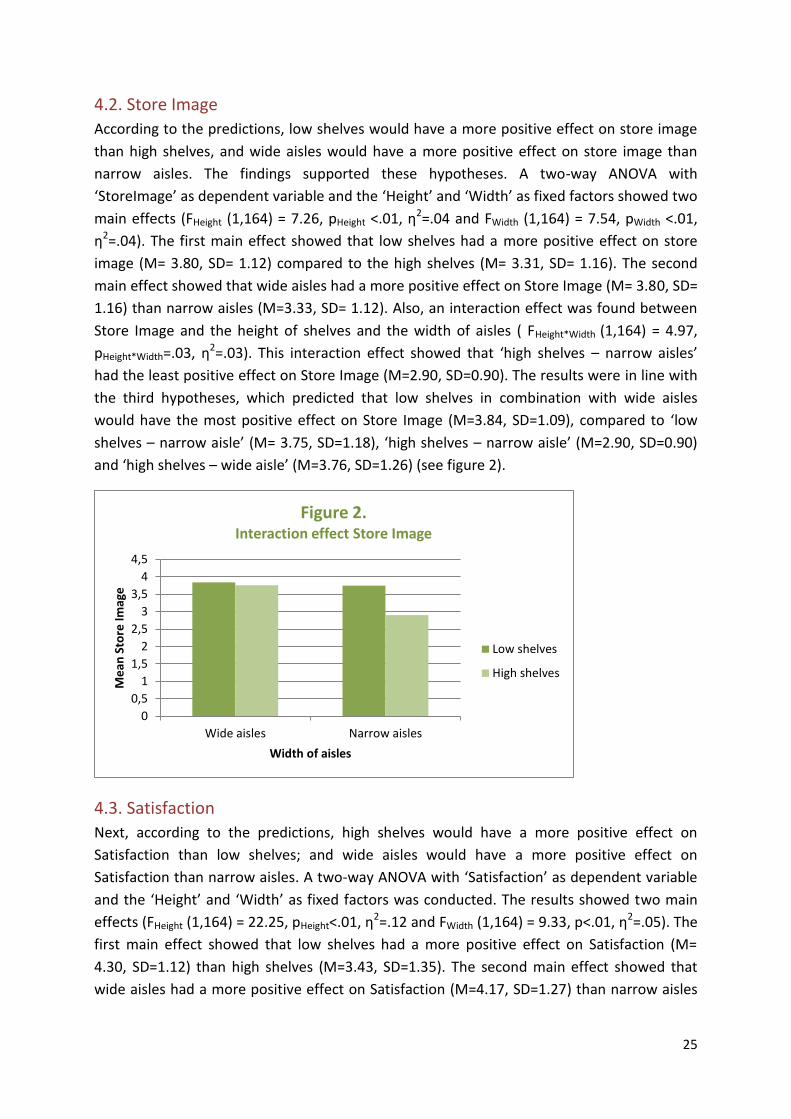
4.2. Store Image
According to the predictions, low shelves would have a more positive effect on store image
than high shelves, and wide aisles would have a more positive effect on store image than
narrow aisles. The findings supported these hypotheses. A two-way ANOVA with
‘StoreImage’ as dependent variable and the ‘Height’ and ‘Width’ as fixed factors showed two
main effects (FHeight (1,164) = 7.26, pHeight <.01, η2=.04 and FWidth (1,164) = 7.54, pWidth <.01,
η2=.04). The first main effect showed that low shelves had a more positive effect on store
image (M= 3.80, SD= 1.12) compared to the high shelves (M= 3.31, SD= 1.16). The second
main effect showed that wide aisles had a more positive effect on Store Image (M= 3.80, SD=
1.16) than narrow aisles (M=3.33, SD= 1.12). Also, an interaction effect was found between
Store Image and the height of shelves and the width of aisles ( FHeight*Width (1,164) = 4.97,
pHeight*Width=.03, η2=.03). This interaction effect showed that ‘high shelves – narrow aisles’
had the least positive effect on Store Image (M=2.90, SD=0.90). The results were in line with
the third hypotheses, which predicted that low shelves in combination with wide aisles
would have the most positive effect on Store Image (M=3.84, SD=1.09), compared to ‘low
shelves – narrow aisle’ (M= 3.75, SD=1.18), ‘high shelves – narrow aisle’ (M=2.90, SD=0.90)
and ‘high shelves – wide aisle’ (M=3.76, SD=1.26) (see figure 2).
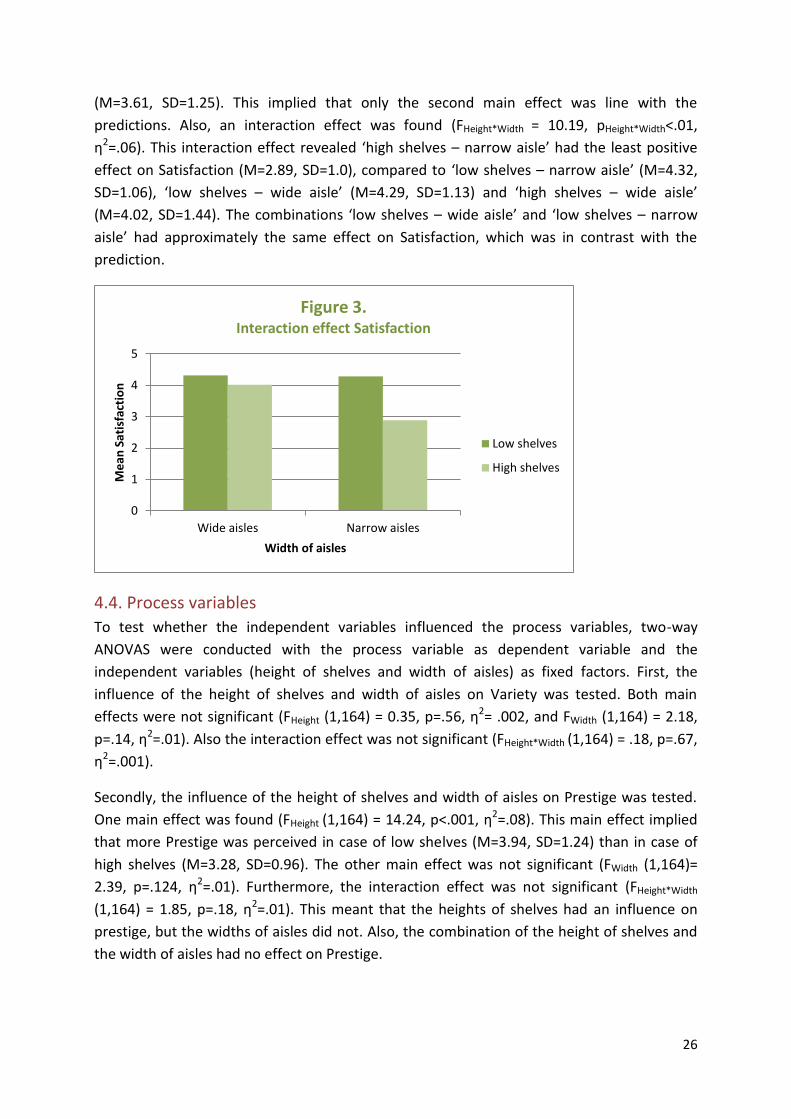
4.3. Satisfaction
Next, according to the predictions, high shelves would have a more positive effect on
Satisfaction than low shelves; and wide aisles would have a more positive effect on
Satisfaction than narrow aisles. A two-way ANOVA with ‘Satisfaction’ as dependent variable
and the ‘Height’ and ‘Width’ as fixed factors was conducted. The results showed two main
effects (FHeight (1,164) = 22.25, pHeight<.01, η2=.12 and FWidth (1,164) = 9.33, p<.01, η2=.05). The
first main effect showed that low shelves had a more positive effect on Satisfaction (M=
4.30, SD=1.12) than high shelves (M=3.43, SD=1.35). The second main effect showed that
wide aisles had a more positive effect on Satisfaction (M=4.17, SD=1.27) than narrow aisles
0
0,5
1
1,5
2
2,5
3
3,5
4
4,5
Wide aisles Narrow aisles
Me
an S
tore
Imag
e
Width of aisles
Figure 2. Interaction effect Store Image
Low shelves
High shelves
26
(M=3.61, SD=1.25). This implied that only the second main effect was line with the
predictions. Also, an interaction effect was found (FHeight*Width = 10.19, pHeight*Width<.01,
η2=.06). This interaction effect revealed ‘high shelves – narrow aisle’ had the least positive
effect on Satisfaction (M=2.89, SD=1.0), compared to ‘low shelves – narrow aisle’ (M=4.32,
SD=1.06), ‘low shelves – wide aisle’ (M=4.29, SD=1.13) and ‘high shelves – wide aisle’
(M=4.02, SD=1.44). The combinations ‘low shelves – wide aisle’ and ‘low shelves – narrow
aisle’ had approximately the same effect on Satisfaction, which was in contrast with the
prediction.
4.4. Process variables
To test whether the independent variables influenced the process variables, two-way
ANOVAS were conducted with the process variable as dependent variable and the
independent variables (height of shelves and width of aisles) as fixed factors. First, the
influence of the height of shelves and width of aisles on Variety was tested. Both main
effects were not significant (FHeight (1,164) = 0.35, p=.56, η2= .002, and FWidth (1,164) = 2.18,
p=.14, η2=.01). Also the interaction effect was not significant (FHeight*Width (1,164) = .18, p=.67,
η2=.001).
Secondly, the influence of the height of shelves and width of aisles on Prestige was tested.
One main effect was found (FHeight (1,164) = 14.24, p<.001, η2=.08). This main effect implied
that more Prestige was perceived in case of low shelves (M=3.94, SD=1.24) than in case of
high shelves (M=3.28, SD=0.96). The other main effect was not significant (FWidth (1,164)=
2.39, p=.124, η2=.01). Furthermore, the interaction effect was not significant (FHeight*Width
(1,164) = 1.85, p=.18, η2=.01). This meant that the heights of shelves had an influence on
prestige, but the widths of aisles did not. Also, the combination of the height of shelves and
the width of aisles had no effect on Prestige.
0
1
2
3
4
5
Wide aisles Narrow aisles
Me
an S
atis
fact
ion
Width of aisles
Figure 3. Interaction effect Satisfaction
Low shelves
High shelves
27
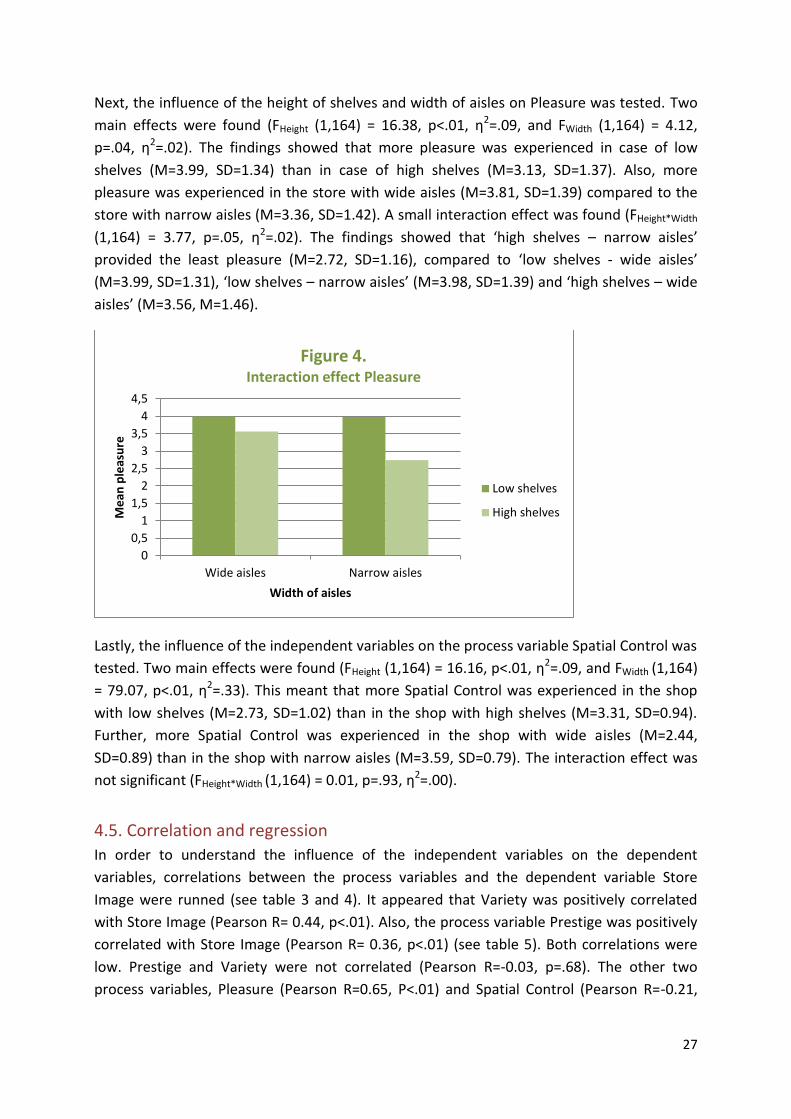
Next, the influence of the height of shelves and width of aisles on Pleasure was tested. Two
main effects were found (FHeight (1,164) = 16.38, p<.01, η2=.09, and FWidth (1,164) = 4.12,
p=.04, η2=.02). The findings showed that more pleasure was experienced in case of low
shelves (M=3.99, SD=1.34) than in case of high shelves (M=3.13, SD=1.37). Also, more
pleasure was experienced in the store with wide aisles (M=3.81, SD=1.39) compared to the
store with narrow aisles (M=3.36, SD=1.42). A small interaction effect was found (FHeight*Width
(1,164) = 3.77, p=.05, η2=.02). The findings showed that ‘high shelves – narrow aisles’
provided the least pleasure (M=2.72, SD=1.16), compared to ‘low shelves - wide aisles’
(M=3.99, SD=1.31), ‘low shelves – narrow aisles’ (M=3.98, SD=1.39) and ‘high shelves – wide
aisles’ (M=3.56, M=1.46).
Lastly, the influence of the independent variables on the process variable Spatial Control was
tested. Two main effects were found (FHeight (1,164) = 16.16, p<.01, η2=.09, and FWidth (1,164)
= 79.07, p<.01, η2=.33). This meant that more Spatial Control was experienced in the shop
with low shelves (M=2.73, SD=1.02) than in the shop with high shelves (M=3.31, SD=0.94).
Further, more Spatial Control was experienced in the shop with wide aisles (M=2.44,
SD=0.89) than in the shop with narrow aisles (M=3.59, SD=0.79). The interaction effect was
not significant (FHeight*Width (1,164) = 0.01, p=.93, η2=.00).
4.5. Correlation and regression
In order to understand the influence of the independent variables on the dependent
variables, correlations between the process variables and the dependent variable Store
Image were runned (see table 3 and 4). It appeared that Variety was positively correlated
with Store Image (Pearson R= 0.44, p<.01). Also, the process variable Prestige was positively
correlated with Store Image (Pearson R= 0.36, p<.01) (see table 5). Both correlations were
low. Prestige and Variety were not correlated (Pearson R=-0.03, p=.68). The other two
process variables, Pleasure (Pearson R=0.65, P<.01) and Spatial Control (Pearson R=-0.21,
0
0,5
1
1,5
2
2,5
3
3,5
4
4,5
Wide aisles Narrow aisles
Me
an p
leas
ure
Width of aisles
Figure 4. Interaction effect Pleasure
Low shelves
High shelves
28
p<.01), had a significant correlation with Store Image. It appeared that Spatial Control had a
negative correlation with Store Image. A regression analysis was runned in order to
determine whether there existed a causal link between Variety, Prestige and Store Image.
The process variables Variety and Prestige both had a positive influence on Store Image
(BVariety= 0.45 and BPrestige= 0.37, p<.05). As table 5 shows, the results showed that Variety and
Prestige explained 32.1% of Store Image.
In order to understand the influence of the independent variables on the dependent variable
Satisfaction, correlations between the process variables and the dependent variable
Satisfaction were runned (see table 3 and 4). It appeared that the correlation between
Pleasure and Satisfaction was average (Pearson R= 0.66, p<.01). The correlation between
Satisfaction and Spatial control was negative (Pearson R= -0.34, p<.01). This indicated that a
high score on Spatial Control (which implied a reduced feeling of control) resulted in a
negative effect on Satisfaction. A significant negative correlation between the process
variables Pleasure and Spatial Control was found (Pearson R= -0.23, p<.01), which implied
that the higher the score on Spatial Control, the more negative the effect on the feeling of
Pleasure (see table 4). The other two process variables, Variety (Pearson R= 0.23, p<.01) and
Prestige (Pearson R=0.36, p<.01), had a significant correlation with Satisfaction. Next, to
determine whether the process variables Pleasure and Spatial Control were predictors of
Satisfaction, another regression analysis with Satisfaction as dependent variable and
Pleasure and Spatial Control as independent variables was runned. The findings showed that
both the process variables Pleasure and Spatial Control were significant predictors of
Satisfaction (BPleasure= 0.62 and BSpatialControl= -0.20, p<.01). The positive Beta value of Pleasure
showed that Pleasure had a positive link with Satisfaction. Concerning Spatial Control, the
Beta value showed a significant negative link, which implied that Spatial Control had a
negative influence on Satisfaction. Further, results revealed that this model explained 47.2%
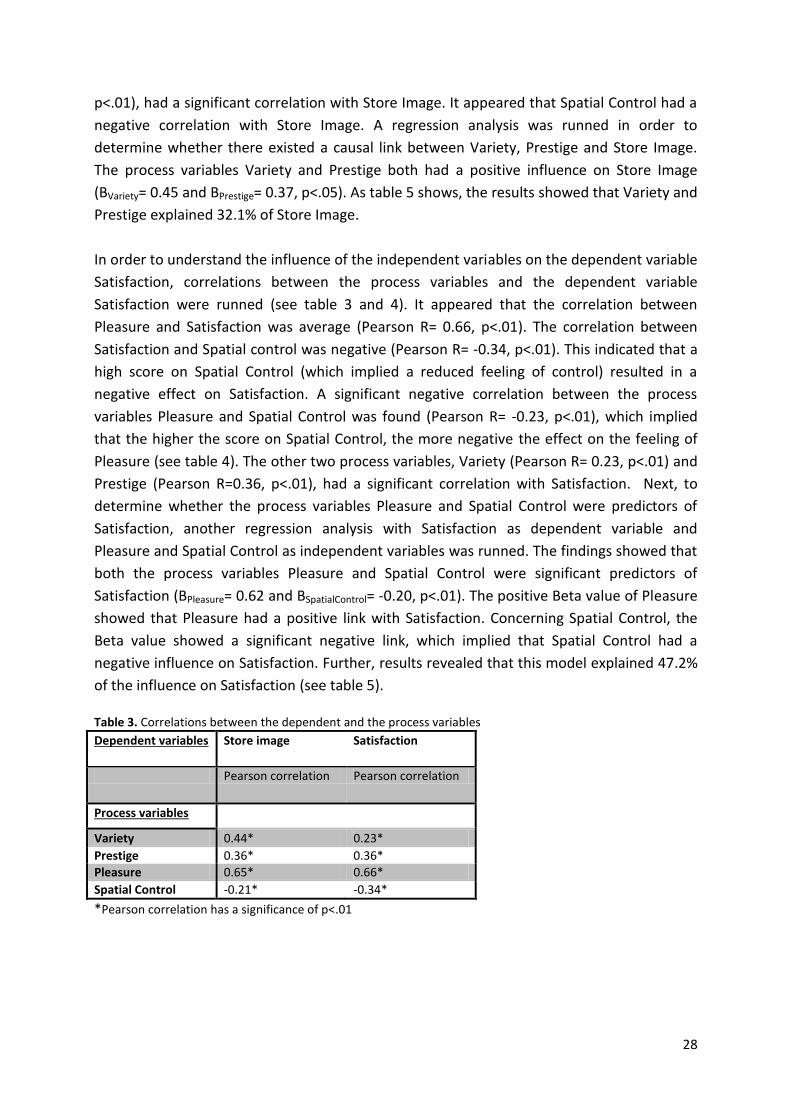
of the influence on Satisfaction (see table 5). Table 3. Correlations between the dependent and the process variables
Dependent variables Store image Satisfaction
Pearson correlation Pearson correlation
Process variables
Variety 0.44* 0.23*
Prestige 0.36* 0.36*
Pleasure 0.65* 0.66*
Spatial Control -0.21* -0.34*
*Pearson correlation has a significance of p<.01
29
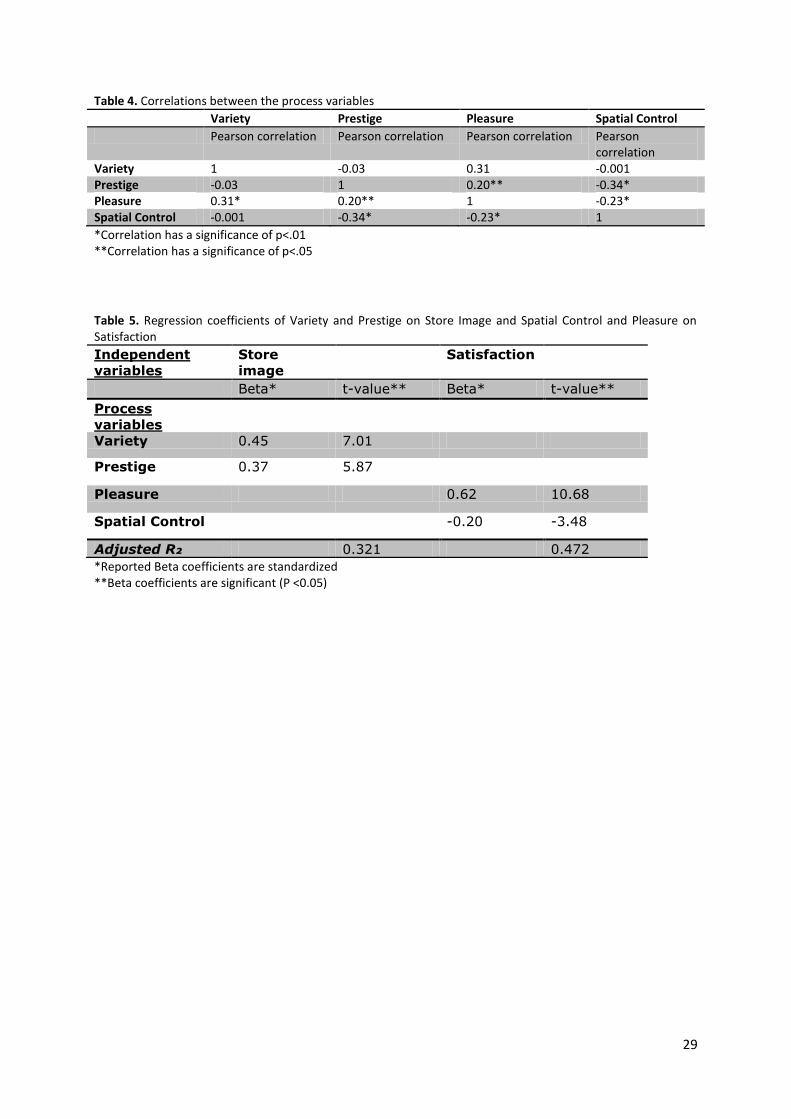
Table 4. Correlations between the process variables
Variety Prestige Pleasure Spatial Control
Pearson correlation Pearson correlation Pearson correlation Pearson correlation
Variety 1 -0.03 0.31 -0.001 Prestige -0.03 1 0.20** -0.34* Pleasure 0.31* 0.20** 1 -0.23* Spatial Control -0.001 -0.34* -0.23* 1
*Correlation has a significance of p<.01 **Correlation has a significance of p<.05
Table 5. Regression coefficients of Variety and Prestige on Store Image and Spatial Control and Pleasure on Satisfaction
Independent
variables
Store
image
Satisfaction
Beta* t-value** Beta* t-value**
Process
variables
Variety 0.45 7.01
Prestige 0.37 5.87
Pleasure 0.62 10.68
Spatial Control -0.20 -3.48
Adjusted R₂ 0.321 0.472
*Reported Beta coefficients are standardized **Beta coefficients are significant (P <0.05)
30
5. Discussion Since retail space is extremely expensive nowadays, retailers have to take in account how
they can use their space in the most optimal way. Designing a store involves considering
store environment factors. Store environment consists of ambient, social and design factors.
These factors are used by consumers by the formation of a store image and they contribute
to the experienced satisfaction of the shopping trip. The contribution of layout to store
image and satisfaction is investigated multiple times, however, only concerning layout form.
In this study, it was questioned to what extent the height of shelves and the width of aisles
contributed to the formation of store image of the consumer, and to the experienced
satisfaction. In order to answer this question, the height of shelves and width of aisles were
manipulated and illustrated in an experiment, which resulted in four different combinations.
This study was aimed at the recreational shopper, because these shoppers visit a physical
shop with a hedonic motive. Therefore, they are crucial customers for retailers.
5.1. Conclusions
Based on the literature it was expected that low shelves and wide aisles would have a
positive effect on store image, mediated by variety and prestige. The findings showed that
‘low shelves – wide aisle’ resulted in the most positive store image, together with ‘low
shelves narrow aisle’ and ‘high shelves – wide aisle’. The biggest effect was ‘high shelves –
narrow aisle’ which resulted in the least positive store image. This effect could not be
explained by variety, and only partly by prestige. Low shelves resulted in a higher prestige,
which had a positive effect on store image. Further, it was expected that high shelves and
wide aisles would have a positive effect on satisfaction, mediated by pleasure and spatial
control. The results revealed that ‘low shelves – narrow aisles’ had the most positive effect
on satisfaction; ‘low shelves – wide aisles’ had approximately the same results. Again, the
biggest effect was that ‘high shelves – narrow aisle’ resulted in the least satisfaction. This
effect was explained by pleasure, which was experienced the most with ‘low shelves – wide
aisles’ and ‘low shelves – narrow aisles’, and least with ‘high shelves – narrow aisle’. Also,
more spatial control was experienced when the shop made use of low shelves or wide aisles.
Low shelves in combination with wide aisles had no effect on the experienced spatial
control. Out of these results, it was concluded high shelves in combination with narrow
aisles is the least favourable option in order to build up a positive store image and to satisfy
the customer. The other three layouts had approximately the same results on store image
and satisfaction. Based on the results of the process variables, it was concluded that low
shelves in combination with wide aisles is the best option in order to create a positive store
image and to enhance the experienced satisfaction.

31
5.1. Implications
The results of this study have multiple theoretical implications. Firstly, this study enhances
the literature by demonstrating that making use of low shelves and wide aisles in a store
results in a positive store image and affects customer satisfaction positively. Next, Baker and
Parasuraman (1994) investigated store environment, where they formed high-prestige
attributes and low-prestige attributes in where wide aisles were considered as high-prestige
attributes. The results of this study did not find supporting findings for considering wide
aisles as high-prestige attributes. This can be due to the time period between the two
studies (1994 and 2017). It could be the case that people are already used to wide aisles, and
do not perceive them as prestige attributes (anymore). Next to that, their study was
executed by means of showing videotapes of a card and gift store, whereas this study was
executed online by means of pictures of a pharmacy shop. This difference in the execution of
the study could have caused the difference in findings. Since my findings demonstrated that
low shelves are perceived as high-prestige attributes by recreational shoppers, this study is
an addition to the study of Baker and Parasuraman (1994). Further, Smith and Burns (1996)
demonstrated the power aisle, where they related variety and prestige. With a higher
variety, the price perceptions would be higher than with a low variety. For that reason, it
was predicted that low shelves resulted in more variety and a higher prestige. However, in
this study variety and prestige were not related. This could be due to the difference in data
gathering. Whereas Smith and Burns measured prestige by customer contact, in where they
asked participants to indicate their price perceptions; this study gathered data by means of
an online survey. Next to that, the results of Smith and Burns could be context-specific. Due
to the fact that this research was not aimed at investigating the power aisle, the context in
where the participants were asked about variety perceptions and prestige differed. Lastly,
variety did not have any relation with satisfaction. This is in contrast with the study of Hoch,
Bradlow and Wansink (1999), where it was demonstrated that variety drives satisfaction.
This contradiction can be due to a misunderstanding of the variety question by the
participants in the study. Due to the short time period of this study, participants were
repeatedly exposed to the same subset of products. Although the participants were asked to
indicate the variety with a global look at the assortment, it could have been the case that
they noticed and indicated low variety.
Concerning prestige, Sevilla and Townsend (2016) found that perceiving products of high
value when you enter a store is the result of the perceived space-to-product-ratio. The more
shelf space you devote for a product, the higher the perceived value of this product. I
expected that the same would be true for shelves as a whole; the more spacious the layout,
the higher the prestige. No effect was found between the width of aisles and prestige.
However, this study demonstrated that low shelves result in a higher perceived prestige.
This indicates that more space in the form of low shelves results in a higher perceived
prestige.
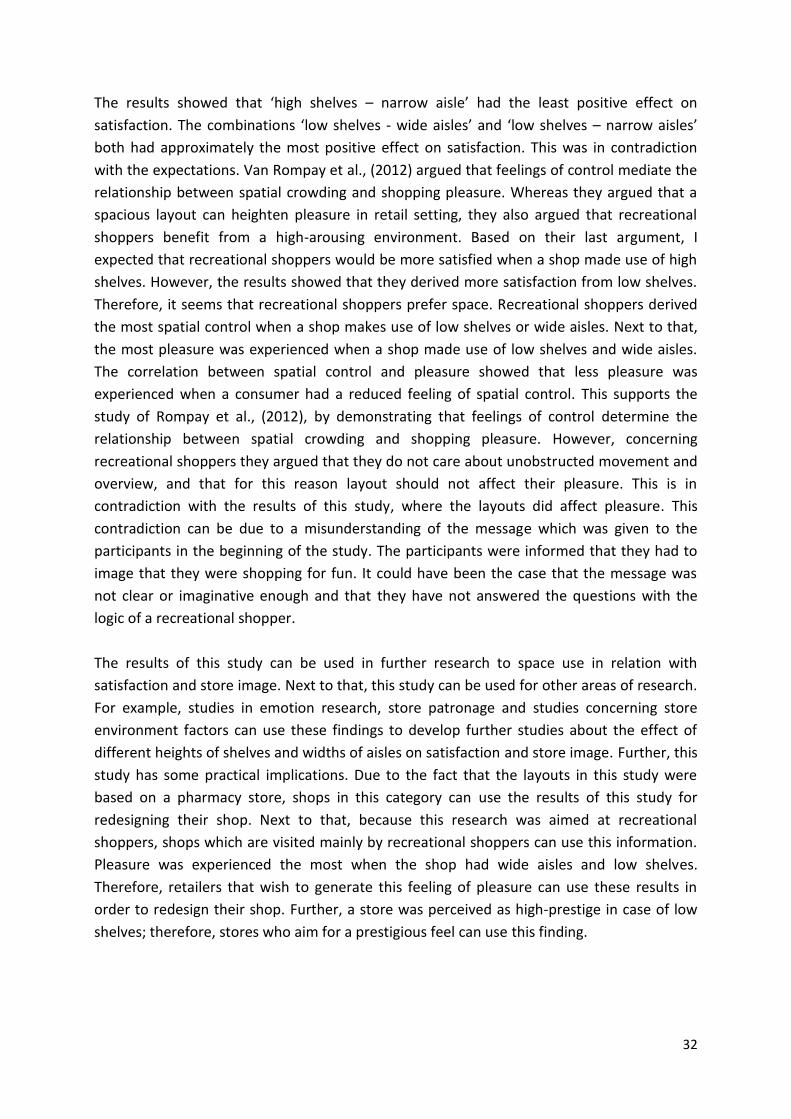
32
The results showed that ‘high shelves – narrow aisle’ had the least positive effect on
satisfaction. The combinations ‘low shelves - wide aisles’ and ‘low shelves – narrow aisles’
both had approximately the most positive effect on satisfaction. This was in contradiction
with the expectations. Van Rompay et al., (2012) argued that feelings of control mediate the
relationship between spatial crowding and shopping pleasure. Whereas they argued that a
spacious layout can heighten pleasure in retail setting, they also argued that recreational
shoppers benefit from a high-arousing environment. Based on their last argument, I
expected that recreational shoppers would be more satisfied when a shop made use of high
shelves. However, the results showed that they derived more satisfaction from low shelves.
Therefore, it seems that recreational shoppers prefer space. Recreational shoppers derived
the most spatial control when a shop makes use of low shelves or wide aisles. Next to that,
the most pleasure was experienced when a shop made use of low shelves and wide aisles.
The correlation between spatial control and pleasure showed that less pleasure was
experienced when a consumer had a reduced feeling of spatial control. This supports the
study of Rompay et al., (2012), by demonstrating that feelings of control determine the
relationship between spatial crowding and shopping pleasure. However, concerning
recreational shoppers they argued that they do not care about unobstructed movement and
overview, and that for this reason layout should not affect their pleasure. This is in
contradiction with the results of this study, where the layouts did affect pleasure. This
contradiction can be due to a misunderstanding of the message which was given to the
participants in the beginning of the study. The participants were informed that they had to
image that they were shopping for fun. It could have been the case that the message was
not clear or imaginative enough and that they have not answered the questions with the
logic of a recreational shopper.
The results of this study can be used in further research to space use in relation with
satisfaction and store image. Next to that, this study can be used for other areas of research.
For example, studies in emotion research, store patronage and studies concerning store
environment factors can use these findings to develop further studies about the effect of
different heights of shelves and widths of aisles on satisfaction and store image. Further, this
study has some practical implications. Due to the fact that the layouts in this study were
based on a pharmacy store, shops in this category can use the results of this study for
redesigning their shop. Next to that, because this research was aimed at recreational
shoppers, shops which are visited mainly by recreational shoppers can use this information.
Pleasure was experienced the most when the shop had wide aisles and low shelves.
Therefore, retailers that wish to generate this feeling of pleasure can use these results in
order to redesign their shop. Further, a store was perceived as high-prestige in case of low
shelves; therefore, stores who aim for a prestigious feel can use this finding.
33
5.2. Limitations and further research
This study could be seen as a starting point in this area, and therefore there are some
limitations. Firstly, the manipulations in this study concerned the width of aisles and the
heights of shelves. Other factors, such as layout form, colour, shelf material and floor
material were not considered. Consequently, this could have influenced the answers of the
participants. So did Baker and Parasuraman (1994) argue in their study that a grid layout and
bright light are low-prestige attributes. A recommendation for further research is to consider
these factors. Further, multiple participants indicated that they did not perceive the
assortment as varied, because they saw a couple of products multiple times. As mentioned
earlier, this could have influenced the answers. A recommendation for further research is to
illustrate different products, in order to make sure that the assortment is varied. Next, quite
lot respondents closed the survey after the first page break, with the result that they had to
be removed from the data. The reason to add a page break was to prevent that people saw
to many questions on one page and would lose their motivation. A recommendation for
further research is to investigate the best option by means of a literature study.
Due to the short time period of this study, it was decided to aim at recreational shoppers.
Therefore, the results cannot be generalized to the task-oriented shopper. This offers an
opportunity for further research. Next to that, the layouts consisted of products of a
pharmacy store. This means that the results cannot be generalized to other sectors, without
further research. Concerning generalization, it could have been the case that the variables
did not explain the effects correctly due to a generalization fault in the literature review.
Results of other studies could have been context specific, with the result that results were
generalized in another way than the researcher meant (Pham, 2013). Next to that, it was not
considered that the acceptance of the hypotheses can be due to other variables, such as
chance (Pham, 2013). As a result, the possibility exists that this may have led to false-positive
results, which cannot be replicated (Pham, 2013). This implies that no effort was made to
replicate the experiment, and that the results were generalized to soon. Therefore, a
recommendation is to replicate this study and to analyse past studies more nuanced.
By means of this study, I hope to open a door for further research in this area. With the
growing competitive retail environment, it is important to keep your customers satisfied and
to build up a positive store image. Besides competitive traditional shops, the power of web
shops is growing with each day and this makes them dangerous. They have the advantage
that providing customers with a fast service and well-looking web design contributes to
building up a positive store image and satisfying their customers. For this reason, it is
important to realize that you have to offer something special. Why should they visit your
shop, instead of shopping on the internet? My advice is to not only satisfy the needs of your
customers, but also to make their shopping trip an experience. You can have it all, but it will
be the experiences that will last.
34
References
Baker, J., Grewal, D., Parasuraman, A. (1994). The influence of store environment on quality
inferences and store image. Journal of the Academy of Marketing Science. Vol. 22(4). P. 328-
339.
Baker, J., Parasuraman, A., Grewal, D., Voss, G.B. (2002). The Influence of Multiple Store
Environment Cues on Perceived Merchandise Value and Patronage Intentions. Jorunal of
Marketing. Vol. 66(2). P. 120-141.
Bearden, W.O., Netemeyer, R.G., (2011). Handbook of marketing scales: multi-item
measures for marketing and consumer behaviour research. USA. Sage Publications.
Broniarczyk, S.M., Hoyer W.D., McAlister, L. (1998). Consumers’ Perceptions of the Assortment Offered in a Grocery Category: The Impact of Item Reduction. Journal of Marketing Research. Vol. 35(2). P. 166–176
Donovan, R.J., Rossiter, J.R., Marcoolyn, G., Nesdale, A. (1994). Store atmosphere and
purchasing behaviour. Journal of Retailing. Vol. 70(3). P. 283-294.
Eroglu, S.A., Machleit, K., Barr, T.F. (2005). Perceived retail crowding and shopping satisfaction: the role of shopping values. Journal of Business Research. V. 58. P. 1146-1153 Grossbart, S., Hampton, R., Rammohan, B., Lapidus, R.S. (1990). Environmental dispositions
and customer response to store atmospherics. Journal of Business Research. Vol. 21(3). P.
225-241
Hoch, S.J., Bradlow, E.T., Wansink, B. (1999). The Variety of an Assortment. Marketing
Science. Vol. 18(4). P. 527-546
Hsu, M., Huang, Y., Swanson, S. (2010). Grocery store image, travel distance, satisfaction and behavioural intentions. International Journal of Retail & Distribution Management. Vol. 38(2). P. 115-132
Jacobsen, J., Granzau, L. (2015). Aisles of life: outline of a customer-centric approach to retailspace management. The International Review of Retail, Distribution and Consumer Research. V. 25. P. 162-180 Kaltcheva, V.D., Weitz, B.A. (2006). When Should a retailer Create an Exciting Store
Environment? Journal of Marketing. V. 70(1). P. 107-118.
Kent, A.M., Kirby, A.E. (2009). The design of the store environment and its implications for retail image. The International Review of Retail, Distribution and Consumer Research. V. 19(4). P. 457-468

35
Lin, L-W., Sternquist, B. (1994). Taiwanese consumers’ perceptions of product information
cues: Country of origin and store prestige. European Journal of Marketing. Vol. 28(1). P. 5
Machleit, K.A., Eroglu, S.A. (2000). Describing and Measuring emotional Response to
ShoppingExperience. Journal of Business Research. Vol. 49(2). P. 101-111
Machleit, K.A., Eroglu, S.A., Mantel, S.P. (2000) Perceived Retail Crowding and Shopping
Satisfaction: What Modifies this Relationship? Journal of Consumer Psychology. Vol. 9(1). P.
29-42.
Majid, M., Bagram, M., Khan, S. (2012). Attaining Customer Loyalty! The Role of Consumer Attitude and Consumer Behavior. International Journal of Retail & Distribution Management. Vol.1 (1). P. 1-8 Marques, S.H., Cardoso, M.M., Palma, A.P. (2013). Environmental factors and satisfaction in
a speciality store. The International Review of Retail, Distribution and Consumer Research.
Vol. 23(4). P. 456-474
Mehta, R. (2013). Understanding perceived retail crowding: A critical review and research
agenda. Journal of Retailing and Consumer Services. Vol. 20(6). P. 642-649
Mehta, R., Sharma, N.K., Swami, S. (2012). The impact of perceived crowding on consumers’ store patronage intentions: role of optimal stimulation level and shopping motivation. Journal of Marketing Management. V.29(7-8). P. 812-835 O’Guinn, T.C., Tanner, R.J., Meang, A. (2015). Turning to space: Social density, social class,
and the value of things in stores. Journal of Consumer Research. Vol. 42(2). P. 196-213.
Pham, M. T. (2013). The seven sins of consumer psychology. Journal of Consumer
Psychology. Vol. 23 (4). P. 411-423.
Sevilla, J., Townsend, C. (2016). The Space-to-Product Ratio Effect: How Interstitial Space Influences Product Aesthetic Appeal, Store Perceptions, and Product Preference. Journal of Marketing Research. Vol. 53(5). P. 665-681 Smith, P., Burns, D.J. (1996). Atmospherics and retail environments: the case of the ‘power
aisle’. International Journal of Retail & Distribution Management. Vol. 24(1). P. 7-14
Van Rompay, T.J.L., Tanja-Dijkstra, K., Verhoeven, J.W.M., van Es, A.F. (2012). On store
design and the consumer motivation: Spatial control and arousal in the retail context.
Environment and Behaviour. Vol. 44(6). P. 800-820
Vrechopoulos, A.P., O’keefe, R.M., Doukidis, G.I., Siomkos, G.J. (2004). Virtual store layout:
an experimental comparison in the context of grocery retail. Journal of Retailing. Vol. 80(1).
P. 13-22.

36
Xu, J., Shen, H., Wyer, R.S. (2012). Does the distance between us matter? Influences of physicalproximity to others on consumer choice. Journal of Consumer Psychology. Vol. 22. P. 418-423
Yim, M., Yoo, S-C., Sauer, P., Seo, P. (2014). Hedonic shopping motivation and co-shopper
influence on utilitarian grocery shopping in superstores. Journal of the Academy of
Marketing Science. Vol. 42(5). P. 528-544
Zhang, D., Zhu, P., Ye, Y. (2016). The effects of E-commerce on the demand for commercial
real estate. Cities. Vol. 51. P. 106-120.
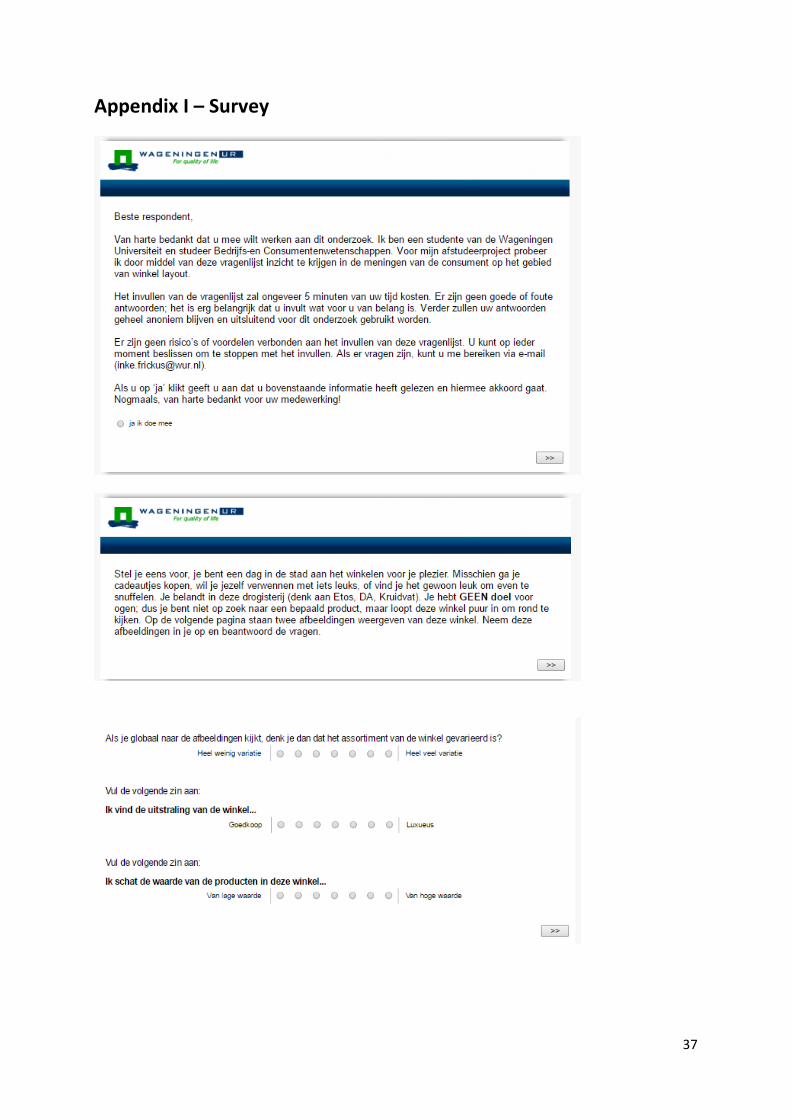
37
Appendix I – Survey
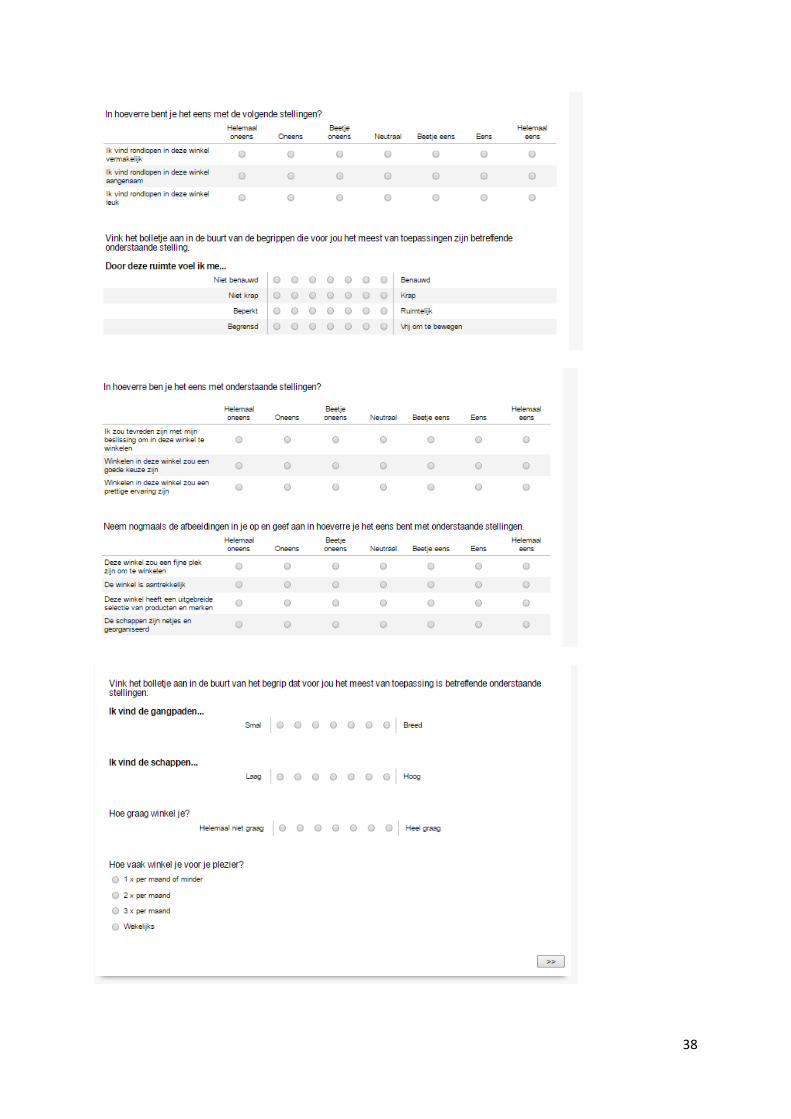
38
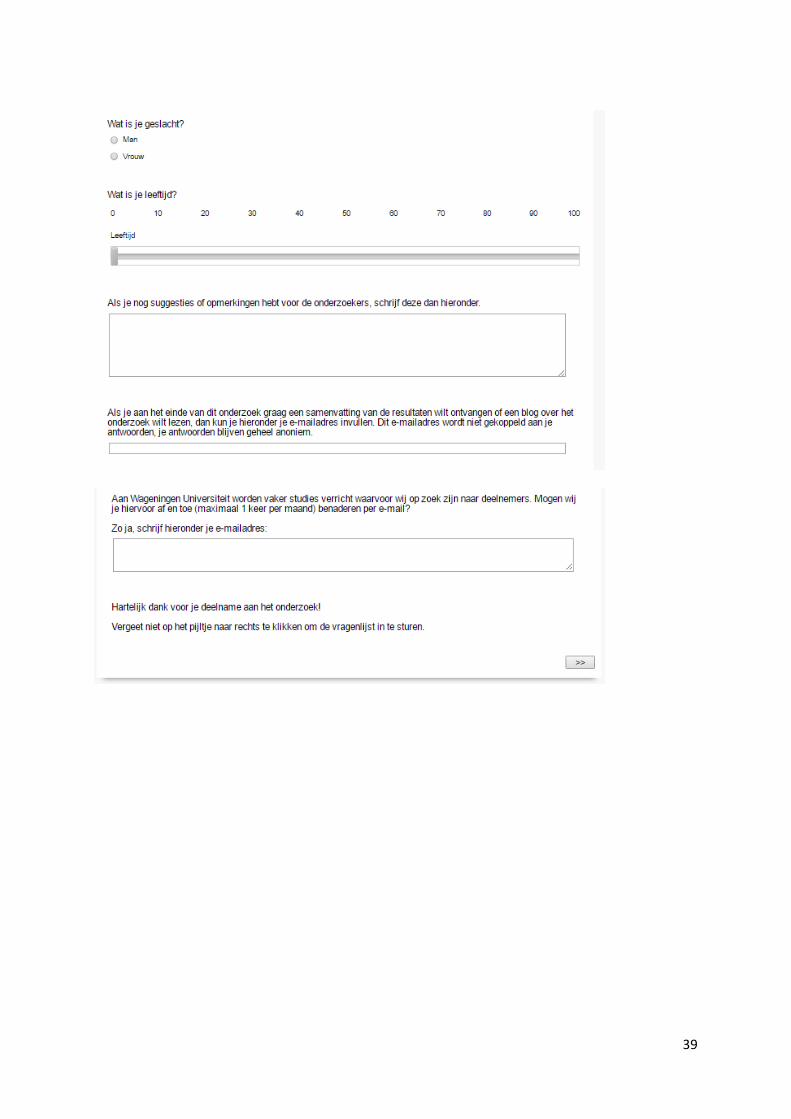
39