the influence of socio-cultural background and ... - rero doc
TRANSCRIPT

The Influence of Socio-Cultural Background and Product Value in
Usability Testing
Andreas Sonderegger a∗
and Juergen Sauera
a
Department of Psychology, University of Fribourg, 1700 Fribourg, Switzerland;
Rue de Faucigny 2, 1700 Fribourg, Switzerland Phone: +41-26-3007630; Fax: +41-26-3009712 Email: [email protected], [email protected]
This article examines the influence of socio-cultural background and product value on different
outcomes of usability tests. A study was conducted in two different socio-cultural regions,
Switzerland and East Germany, which differed in a number of aspects (e.g. economic power, price
sensitivity and culture). Product value (high vs. low) was varied by manipulating the price of the
product. Sixty-four test participants were asked to carry out five typical user tasks in the context of
coffee machine usage, measuring performance, perceived usability, and emotion. The results
showed that in Switzerland, high-value products were rated higher in usability than low-value
products whereas in East Germany, high-value products were evaluated lower in usability. A
similar interaction effect of socio-cultural background and product value was observed for user
emotion. Implications are that the outcomes of usability tests do not allow for a simple transfer
across cultures and that the mediating influence of perceived product value needs to be taken into
consideration.
Keywords: usability testing; culture; product value; coffee machine;
* Corresponding author.
2
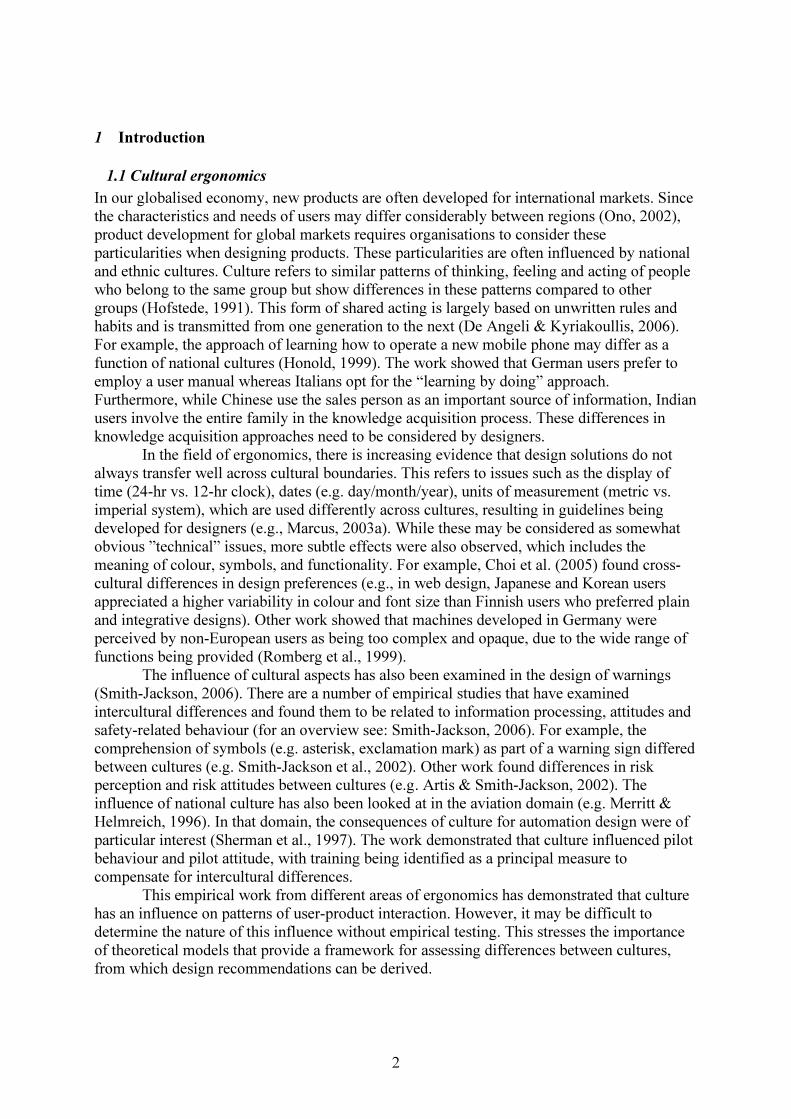
1 Introduction
1.1 Cultural ergonomics
In our globalised economy, new products are often developed for international markets. Since the characteristics and needs of users may differ considerably between regions (Ono, 2002), product development for global markets requires organisations to consider these particularities when designing products. These particularities are often influenced by national and ethnic cultures. Culture refers to similar patterns of thinking, feeling and acting of people who belong to the same group but show differences in these patterns compared to other groups (Hofstede, 1991). This form of shared acting is largely based on unwritten rules and habits and is transmitted from one generation to the next (De Angeli & Kyriakoullis, 2006). For example, the approach of learning how to operate a new mobile phone may differ as a function of national cultures (Honold, 1999). The work showed that German users prefer to employ a user manual whereas Italians opt for the “learning by doing” approach. Furthermore, while Chinese use the sales person as an important source of information, Indian users involve the entire family in the knowledge acquisition process. These differences in knowledge acquisition approaches need to be considered by designers.
In the field of ergonomics, there is increasing evidence that design solutions do not always transfer well across cultural boundaries. This refers to issues such as the display of time (24-hr vs. 12-hr clock), dates (e.g. day/month/year), units of measurement (metric vs. imperial system), which are used differently across cultures, resulting in guidelines being developed for designers (e.g., Marcus, 2003a). While these may be considered as somewhat obvious ”technical” issues, more subtle effects were also observed, which includes the meaning of colour, symbols, and functionality. For example, Choi et al. (2005) found cross-cultural differences in design preferences (e.g., in web design, Japanese and Korean users appreciated a higher variability in colour and font size than Finnish users who preferred plain and integrative designs). Other work showed that machines developed in Germany were perceived by non-European users as being too complex and opaque, due to the wide range of functions being provided (Romberg et al., 1999).
The influence of cultural aspects has also been examined in the design of warnings (Smith-Jackson, 2006). There are a number of empirical studies that have examined intercultural differences and found them to be related to information processing, attitudes and safety-related behaviour (for an overview see: Smith-Jackson, 2006). For example, the comprehension of symbols (e.g. asterisk, exclamation mark) as part of a warning sign differed between cultures (e.g. Smith-Jackson et al., 2002). Other work found differences in risk perception and risk attitudes between cultures (e.g. Artis & Smith-Jackson, 2002). The influence of national culture has also been looked at in the aviation domain (e.g. Merritt & Helmreich, 1996). In that domain, the consequences of culture for automation design were of particular interest (Sherman et al., 1997). The work demonstrated that culture influenced pilot behaviour and pilot attitude, with training being identified as a principal measure to compensate for intercultural differences.
This empirical work from different areas of ergonomics has demonstrated that culture has an influence on patterns of user-product interaction. However, it may be difficult to determine the nature of this influence without empirical testing. This stresses the importance of theoretical models that provide a framework for assessing differences between cultures, from which design recommendations can be derived.

3
Hofstede’s (1991) Framework for Assessing Cultures is probably the best known model of this kind. It describes culture along five dimensions such as power distance, individualism vs. collectivism, masculinity vs. femininity, uncertainty avoidance, and long-term vs. short-term orientation. Hofstede’s model has already been used in the context of ergonomics to provide guidance for designing technical systems that meet culture-specific needs (e.g. Marcus, 2003a; Merritt, 2000; Jordan, 2001). While the Hofstede framework appears to be suitable for addressing cultural issues in ergonomic design, it is limited in addressing the specific research questions posed in the current study for two reasons. First, the work of Hofstede does not include former communist countries (i.e. at the time Eastern European states did not enjoy IBM representations on which his work was based). Second, his framework does not consider socio-economic aspects (e.g. affluence, post-materialistic values), which may play a role in consumer ergonomics. A model that addresses these issues is the Model of Cross-Cultural Variation (Inglehart & Welzel, 2005). It was developed on the basis of a global survey with about 60'000 respondents from 65 cultures, covering religious, social, and political values. The model describes the relationships between economic development and social as well as political change, including the impact of economic development on cultural values. Two value dimensions were identified: (a) wellbeing orientation and (b) type of authority. In the present study, we focused on the first one.
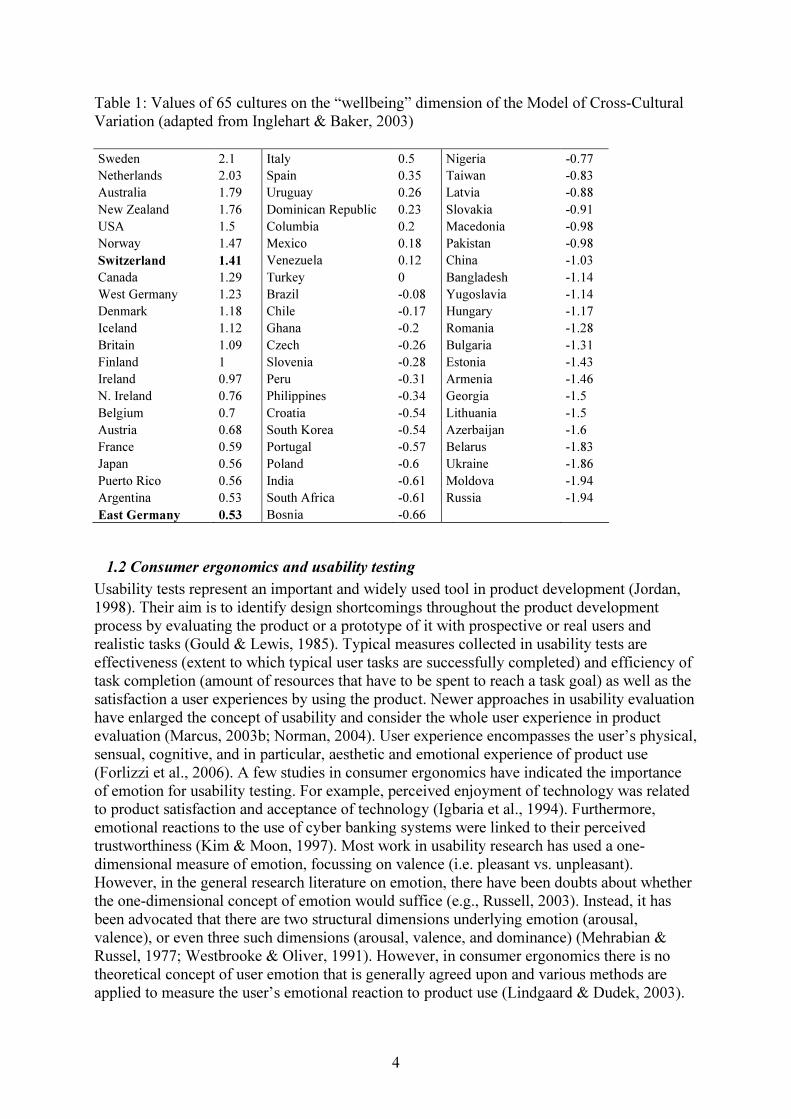
Cultures differ with regard to the importance they attach to ‘wellbeing’ values (i.e. autonomy, post-materialistic values) or to ‘survival’ values (i.e. money, hard labour). This dimension is linked to the transition from industrial to post-industrial societies. Due to higher income in advanced societies, a large part of the population grows up taking survival for granted. This leads to a shift in priorities from economic and physical security toward subjective wellbeing, self-expression and quality of life (Inglehart & Welzel, 2005). Table 1 shows the 65 cultures examined in Inglehart’s work and their position on the wellbeing dimension of the model. Although this model has not yet been used in the context of ergonomics, due to its socio-economic focus, we considered it to be suitable to address our research questions.
Overall, the research in cultural ergonomics shows that the influence of culture in ergonomic design must not be neglected. Furthermore, it has been demonstrated that models are useful to guide the product design process. While the model of Hofstede has already been used to guide the product design process, it may also be helpful to make use of Inglehart’s model in cultural ergonomics, as it focuses on different dimensions, such as the economic context in which a culture is situated. Considering the economic context in which a culture develops is helpful for examining the influence of factors such as perceived product value and their influence on the outcomes of usability testing.
4
Table 1: Values of 65 cultures on the “wellbeing” dimension of the Model of Cross-Cultural Variation (adapted from Inglehart & Baker, 2003) Sweden 2.1 Italy 0.5 Nigeria -0.77
Netherlands 2.03 Spain 0.35 Taiwan -0.83
Australia 1.79 Uruguay 0.26 Latvia -0.88
New Zealand 1.76 Dominican Republic 0.23 Slovakia -0.91
USA 1.5 Columbia 0.2 Macedonia -0.98
Norway 1.47 Mexico 0.18 Pakistan -0.98
Switzerland 1.41 Venezuela 0.12 China -1.03
Canada 1.29 Turkey 0 Bangladesh -1.14
West Germany 1.23 Brazil -0.08 Yugoslavia -1.14
Denmark 1.18 Chile -0.17 Hungary -1.17
Iceland 1.12 Ghana -0.2 Romania -1.28
Britain 1.09 Czech -0.26 Bulgaria -1.31
Finland 1 Slovenia -0.28 Estonia -1.43
Ireland 0.97 Peru -0.31 Armenia -1.46
N. Ireland 0.76 Philippines -0.34 Georgia -1.5
Belgium 0.7 Croatia -0.54 Lithuania -1.5
Austria 0.68 South Korea -0.54 Azerbaijan -1.6
France 0.59 Portugal -0.57 Belarus -1.83
Japan 0.56 Poland -0.6 Ukraine -1.86
Puerto Rico 0.56 India -0.61 Moldova -1.94
Argentina 0.53 South Africa -0.61 Russia -1.94
East Germany 0.53 Bosnia -0.66
1.2 Consumer ergonomics and usability testing
Usability tests represent an important and widely used tool in product development (Jordan, 1998). Their aim is to identify design shortcomings throughout the product development process by evaluating the product or a prototype of it with prospective or real users and realistic tasks (Gould & Lewis, 1985). Typical measures collected in usability tests are effectiveness (extent to which typical user tasks are successfully completed) and efficiency of task completion (amount of resources that have to be spent to reach a task goal) as well as the satisfaction a user experiences by using the product. Newer approaches in usability evaluation have enlarged the concept of usability and consider the whole user experience in product evaluation (Marcus, 2003b; Norman, 2004). User experience encompasses the user’s physical, sensual, cognitive, and in particular, aesthetic and emotional experience of product use (Forlizzi et al., 2006). A few studies in consumer ergonomics have indicated the importance of emotion for usability testing. For example, perceived enjoyment of technology was related to product satisfaction and acceptance of technology (Igbaria et al., 1994). Furthermore, emotional reactions to the use of cyber banking systems were linked to their perceived trustworthiness (Kim & Moon, 1997). Most work in usability research has used a one-dimensional measure of emotion, focussing on valence (i.e. pleasant vs. unpleasant). However, in the general research literature on emotion, there have been doubts about whether the one-dimensional concept of emotion would suffice (e.g., Russell, 2003). Instead, it has been advocated that there are two structural dimensions underlying emotion (arousal, valence), or even three such dimensions (arousal, valence, and dominance) (Mehrabian & Russel, 1977; Westbrooke & Oliver, 1991). However, in consumer ergonomics there is no theoretical concept of user emotion that is generally agreed upon and various methods are applied to measure the user’s emotional reaction to product use (Lindgaard & Dudek, 2003).

5
Given their increased significance in consumer ergonomics, it is important to include measures of user emotion in usability tests (Hassenzahl & Tractinsky, 2006).
The idea of a broader approach to usability by examining user experience has been built upon by Cockton (2004, 2006) who argued that the main goal in product development should be to design product value for users by satisfying their needs. Value represents product characteristics that motivate people to buy, use, or recommend the product. Product value goes beyond usability features since it also includes factors such as product price or breadth of functionality. For example, a mobile phone may be usable (e.g. easy to operate) but may not be appreciated by a user because it is sold at too high a price or it lacks some important functions (e.g. camera, internet access). All these factors have an influence on perceived product value, though they may be perceived very differently by individual users. Price seems to be a particularly important facet of product value (Cockton, 2004). Yet, in the domain of usability testing, no work is known to the authors that has considered the possible influence of product value on test outcomes. In contrast, product value has been extensively examined in the domains of consumer research and marketing. Some of this work is of relevance to the present research question and hence reviewed here briefly.
Various studies have shown that a high price represents an indicator of high product quality, especially if consumers have only limited information about other product characteristics such as quality of workmanship (e.g. Zeithaml, 1988; Olson & Jacoby, 1977). Increasing prices may also be associated with a rise in consumer demand, especially when consumers wish to demonstrate their financial power by buying expensive products that enjoy considerable prestige (Kroeber-Riel & Weinberg, 2008). With respect to emotions, Reinmoeller (2002) argued that a high product price may be an indicator for luxury, which represents a source of pleasure to users. However, the appreciation of luxury is influenced by historical, cultural, economic and individual factors (Reinmoeller, 2002).
Research on consumer behaviour indicates that culture plays an important role for the consumption of high-priced luxury goods (Ger & Belk, 1996; Wiedmann et al., 2007). Although it could be assumed that a primary indicator for the purchase of high-price goods would be the income or the economic power of consumers, it was shown that their cultural background has approximately the same predictive power to explain the purchase of luxury goods (Dubois & Duquesne, 1993). Socio-economic and cultural background however does not only play a role in consumption of luxury goods but in shopping behaviour in general (Arnould & Thompson, 2005; McCracken, 1986). Chinese consumers who were raised in a collectivist society, for example, showed to be more price sensitive and more frugal in their buying behaviour compared to US Americans who were raised in a rather individualistic society (Ackermann & Tellis, 2001). Although the authors only provide assumptions about the cultural origins of such differences in shopping behaviour, the study clearly indicates that differences exist between different consumer groups with regard to their price sensitivity.
The customer’s price sensitivity is an important aspect in consumer and marketing research (Allenby & Rossi, 1999) and has attracted increased interest in the past decade, especially in Europe. The increasing success of hard discounters (e.g. Aldi in Germany) led to a radical change in the retail market (Dawson, 2010). This is mainly due to a change in consumer behaviour for which product pricing has become a key factor in the purchase decision process (Bridges et al., 2007). This process of consumers’ increasing demands for bargain prices has been particularly wide-spread in the German retail market (Bridges et al., 2007). This shift in German consumer behaviour also had consequences for marketing strategies of retail industry. A very successful campaign of a German electro-goods company
contained the slogan “Geiz-ist-geil” (“being stingy is cool”). Striking “a chord with the feeling of a nation” (Bridges et al., 2007, p. 1026), the success of this campaign can be ascribed to the increased price sensitivity of German consumers. Interestingly, the same

6
campaign also was conducted in other European countries (e.g. Spain, Austria, France) but not in Switzerland. This is because Swiss consumers are known to be less price sensitive in their shopping behaviour than their European neighbours (Rouhani, 1998; Wüstenhagen, 1998; Colombo et al., 2006).
These findings indicate that product price may play an important role for product evaluation and consumer behaviour and that this influence may be moderated by specific consumer characteristics (e.g. price sensitivity), which can vary considerably between different consumer groups and national cultures. This implies that product price might also play a role in usability testing, even though it is not clear in what way it will affect outcome measures like user emotion and product evaluation. Against this background, it appears worthwhile examining the possible influence of product price in usability testing.
1.3 The present study
The literature review revealed evidence from several application areas of ergonomics, suggesting an influence of the user’s national culture on how a technical system is perceived and operated. For product value, the literature is scarcer and limited to studies outside the realm of ergonomics. Most of the work reported in the two fields was based on correlational studies, which makes cause-effect relationships difficult to establish. Therefore, an experiment was conducted to examine the influence of socio-cultural background and product value on the relevant outcome variables of a usability test, such as perceived usability, user performance, and emotion. Product value was manipulated by providing test participants with information about the product price. This involved a price label which represented either a high or a low price compared to the actual selling price of the product.
Socio-cultural background was varied by conducting the usability tests in two different regions that differ in their score on the wellbeing dimension, following Inglehart’s model of cross-cultural variation (Inglehart & Welzel, 2005), but also in their price sensitivity. The two socio-culturalregions chosen were East Germany and Switzerland. The model indicated differences between the two regions on the wellbeing dimension (see table 1). Switzerland represents a wellbeing culture, attaining the 7th position of all 65 countries examined in Inglehart’s work. Compared to Switzerland, East Germany scores lower on the wellbeing dimension (22nd position). Although there are a number of countries that score even lower on wellbeing than East Germany, it was considered to be a good match for Switzerland since the product to be tested was available on both markets and the same language was spoken (i.e. requiring no translation).
The difference in wellbeing orientation between the two socio-cultural regions may be due to their respective historical and economic background. Switzerland has developed after World War II to a consumer society with a free market economy based on a direct democratic political system. In contrast, in East Germany a communist government had been in power for 40 years (1949 - 1989), during which consumers experienced an economy of scarcity. This provided them only with a very limited choice of products of low to medium quality, which were sold at fixed prices (Grunert & Beckmann, 1999). Although many years have passed since German reunification, this specific background persists to have an influence on East German culture, values and identity, with marked differences between former East and West Germany prevailing to this date (van Deth, 2001; Arzheimer, in press). These differences have continued to prevail for such a long time because cultural characteristics are generally rather resistant to change (Arzheimer & Klein, 2000). The difference in the political-economic system was paralleled by differences in economic power. In 2007, when the study was conducted, the gross domestic product per capita in Switzerland (€ 40,990; Swiss Federal

7
Statistical Office, 2008) surpassed the one of East Germany by far (€ 21,106; Statistisches Bundesamt Deutschland, 2008).
To test the effects of socio-cultural background and product value, a usability test was conducted with coffee machines. The type of product was chosen for this study because it allowed for a complex user-product dialogue to be examined. For the usability tests, two functionally identical coffee machines were selected, which only differed in their design. Although the difference between the two design alternatives of the coffee machine was not of interest in this study, two designs were chosen to increase generalisability of the findings by reducing the influence of a specific design. In the present study, the main outcome variables of a usability test were measured, including performance, perceived usability, and emotion. For emotion, the more encompassing three-dimensional model was used, including arousal, valence, and dominance.
Based on the literature reviewed, it was predicted that the high-priced product would be rated higher in usability than the low-priced one because a high price would be associated with high quality. A similar effect of price was predicted for emotion since price may be linked to the consumption of luxury goods, which may be a source of positive emotions such as pleasure. Furthermore, it was assumed that there would be a more positive influence of high price on user emotion and perceived usability in Switzerland than in East Germany. This is because Switzerland enjoys a stronger wellbeing orientation, a higher affinity to luxury, and lower price sensitivity resulting in an interaction between price and culture. Since the research literature did not permit to derive a hypothesis for the direction of effects on user performance, performance data were measured on an exploratory basis.
2 Method
2.1 Participants
Sixty-four German-speaking participants, who were recruited from the general public, took part in this study (37.5 % female), 32 were recruited in Fribourg (Switzerland) and 32 in Ilmenau (East Germany). Swiss participants were aged between 18 and 65 years (M = 31.1; SD = 14.9), participants from East Germany were aged between 18 and 71 years (M = 32.0; SD = 14.4).
Participants from the two socio-cultural regions differed neither with regard to the reported experience in using coffee machines (MSwitzerland = 3.5; MEast Germany = 3.8 (t < 1) nor with regard to weekly use of coffee machines (MSwitzerland = 6.3; MEast Germany = 4.3) (t = 1.13; df = 61; p > .05). To measure experience in using coffee machines, a 7-point Likert scale was used (ranging from very experienced to very inexperienced). The item was worded “How do you assess your experience with coffee machines?” Weekly use of coffee machines was measured by the item “How often do you use an automatic coffee machine during one week?” which used an open response format. The ownership of coffee machines was higher in Switzerland than in East Germany (MSwitzerland = 59%; MEast Germany = 38%) but the difference was not significant (Chi2 = 3.1; df = 1; p > .05).
2.2 Experimental design and price fixing procedure
In a 2 x 2 x 2 design, socio-cultural background (Switzerland vs. East Germany), price (high vs. low) and type of coffee machine were used as independent variables. To fix the price in the experimental conditions, the average market price of the coffee machine was calculated by comparing the offers of three coffee machine stores in each socio-cultural region. The low price was determined by subtracting 45% of the market price while 25% were added to the

8
market price for the high price condition. The reason why the percentage chosen for the reduction in price did not equal the one for the increase was due to the results of a pilot study. Interviewing five participants from each region indicated that the market price was considered to be rather high. To obtain a better differentiation of high and low price (and to prevent the groups from rating both price levels as being high), the price reduction was larger in the low-price condition than the price increase in the high-price condition. This corresponds to findings of consumer research that showed that consumers usually have a range of acceptable prices for a product, and for certain consumer groups, it was found that their acceptable price range was below the market price (Tatzel, 2002).
2.3 Measures and instruments
2.3.1 Emotion
The Self-Assessment Manikin (SAM; Bradley & Lang, 1994) was taken to measure the emotional response following the usability test. This instrument measures three independent dimensions of emotions (pleasure-displeasure, degree of arousal, and dominance-submissiveness). Based on the Pleasure-Arousal-Dominance (PAD) Emotional State Model proposed by Mehrabian & Russel (1977), graphic representations of emotion in the form of manikins are used to depict each dimension on a nine-point scale (Bradley & Lang, 1994). For the pleasure-displeasure dimension (valence), the depiction ranges from a smiling manikin to a frowning manikin. For arousal, the depiction ranges from a sleepy manikin with closed eyes to a wide-awake manikin. For dominance, the depiction ranges from a very small manikin showing submissiveness to a very large manikin expressing power. Previous work (Lang, 1985; Morris, 1995) showed that the scores obtained with the non-verbal SAM scales had satisfactory correlations with verbal scales: Pleasure (r = .94), arousal (r = .94), dominance (r = .66).
2.3.2 Subjective usability evaluation
Perceived usability was measured by means of a German translation of the well-established Post-Study System Usability Questionnaire (PSSUQ; Lewis, 1995). The PSSUQ has been widely applied for usability testing in laboratory settings. It comprises the following three subscales: system usefulness, information quality and interface quality. The original questionnaire consists of 19 items. It was slightly modified by removing four items that were irrelevant for the intended application area. Furthermore, items were adapted to the appliance it was used for (e.g., “system” was replaced by “coffee machine”) to improve comprehensibility and user acceptance. In table 2, the remaining 15 items are presented. The statement of each item was evaluated by the participants on a 7-point Likert scale (strongly agree, agree, partly agree, neither agree nor disagree, partly disagree, disagree, strongly disagree). The internal consistency of the overall questionnaire as well as the three subscales was satisfactory (the coefficients are presented in table 2). In addition to the PSSUQ, perceived usability was measured on a one-item scale (‘This coffee machine is usable’), using a 7-point Likert scale (strongly agree, agree, partly agree, neither agree nor disagree, partly disagree, disagree, strongly disagree). The single item scale was presented twice during the testing session (before and after test completion) to capture changes over time. For this purpose, the use of a broader measure of usability that could be completed very quickly appeared to be advantageous to ensure that participant motivation was maintained throughout the testing session. The use of single-item scales in this context is acceptable as previous

9
research has suggested (Tractinsky et al., 2000; Wanous et al., 1997; Christopherson & Konradt, 2010, submitted). Table 2: Modified version of the Post-Study System Usability Questionnaire (PSSUQ) Post Study System Usability Questionnaire (Cronbach’s α = .93)
Subscale “system usefulness” (Cronbach’s α = .90)
Overall, I am satisfied with how easy it is to use this coffee machine.
It was simple to use this coffee machine.
I was able to complete the tasks and scenarios quickly using this coffee machine.
I felt comfortable using this coffee machine.
It was easy to learn to use this coffee machine.
I was able to complete the tasks successfully.
I could effectively complete the tasks using the coffee machine.
I believe I could become productive quickly using this coffee machine.
Subscale “information quality” (Cronbach’s α = .74)
Whenever I made a mistake using the coffee machine, I could recover easily and
quickly.
The information provided by this coffee machine phone was clear.
The organisation of information on the coffee machine’s display was clear.
Subscale “interface quality” (Cronbach’s α = .79)
The interface of this coffee machine was pleasant.
The coffee machine fulfils all the functions I expected.
I liked using the interface of this coffee machine.
Overall satisfaction
Overall, I am satisfied with this coffee machine.
2.3.3 User Performance
Three measures of user performance were recorded. Task completion rate (%) was calculated by dividing the number of successfully completed tasks by the total number of tasks that had to be completed. As a second measure, task completion time (s) was recorded. Furthermore, number of user interactions was measured by counting each user manipulation such as clicks on the touch screen or the use of manual buttons or control dials
2.4 Materials
As a model product for the usability tests, two technically almost identical coffee machines were used. Appliance I (Platinum VisionTM manufactured by GaggiaTM; see figure 1a) has an angular shape with a stainless steel imitation as a front cover. Its average market price was 1800 CHF in Switzerland and € 1080 in East Germany. Appliance II (Talea Touch PlusTM manufactured by SaecoTM; see figure 1b) has a more curved shape using ABS (Acrylonitrile Butadiene Styrene) plastic as main material. The market price of machine II was CHF 1400 in Switzerland and € 760 in East Germany. Both machines were equipped with a monochrome touch screen interface, a control button to move the mug tray up and down and two control dials (one to adjust strength of coffee, one to change between water and steam function). Participants who had already used either coffee machine were not permitted to take part in the study. Two coffee machines were used in the study to reduce specific effects associated with one particular design. This may increase the generalisability of the results, as it allows for a comparison between products.

10
Figure 1: Coffee machines used in the study: (a) ‘Platinum VisionTM’ of GaggiaTM, and (b) ‘Talea Touch PlusTM’ of SaecoTM.
2.5 User Tasks
The participants were asked to complete the following tasks, which all required the operation of the touch screen as well as the additional control elements: (1) to make a coffee, (2) to alter the height of the cup placement area, (3) to adjust the espresso temperature to level ‘middle’, (4) to fill a cup with hot water, and (5) to change the machine settings for water hardness from level ‘1’ to level ‘2’. There was a time limitation for each task (tasks 1-2 had a time limit of 2 min each; tasks 3-5 had a time limit of 4 min each).
2.6 Procedure
The study was conducted in usability laboratories at the University of Fribourg (Switzerland) and at the Technical University of Ilmenau (East Germany). Both laboratories were very similar regarding size (ca. 35m2) and furnishing (two tables and two chairs). The experiments in Switzerland and East Germany were conducted by the same two experimenters. There were no camera and no one-way mirror in the laboratories. Participants were randomly assigned to one of the experimental conditions. After welcoming the participant, the first experimenter (test facilitator) explained that the purpose of the study was to conduct a usability test using a coffee machine with a view to make improvements to the design. Participants were not asked to think about buying the product, they should just evaluate its usability. The coffee machine with the price tag was then presented to the participant for inspection. The participant then rated perceived usability on a one-item scale. The next activity of participants was the completion of the five experimental tasks (see 2.5). During the entire testing procedure, the test facilitator stood next to the participant whereas a second experimenter (observer) sat at a table and took notes. The observer was positioned at an angle of 45° behind the participant to avoid disturbing the participant. Immediately after task completion, the emotional state of the participant was measured with the SAM questionnaire. This was followed by the presentation

11
of the one-item usability scale and the PSSUQ. Then the test facilitator administered the manipulation check, measuring how the price of the coffee machine was perceived (high or low). Finally, participants were given the opportunity to provide feedback to the test facilitator about the coffee machine and the testing procedure in a semi-structured interview.
2.7 Manipulation check
As a manipulation check, the analysis of the data on participants perception of price showed a significant main effect of price (F = 11.52; df = 1, 60; p < .001), indicating that the price was estimated higher in the high price condition than in the low price condition (6.2 vs. 4.8 on the 9-point scale).
3 Results
A first analysis of effects of type of coffee machine revealed no significant results. Therefore the data of the coffee machines were pooled in a subsequent analysis, from which the results are reported.
3.1 User emotion
Pleasure. A critical element of the multi-faceted concept of emotion is its valence described on the pleasure-displeasure dimension. The user ratings of pleasure are presented in figure 2. The data show a significant cross-over interaction between price and socio-cultural background (F = 7.72; df = 1, 60; p < .01). Participants from East Germany reported the most positive emotions in the low price condition whereas Swiss participants rated their most positive emotions in the high price condition. There was no main effect of price on the pleasure dimension (F < 1), showing that the effects of price are rather dependent on the socio-cultural background. Finally, no main effect of socio-cultural background was observed (F < 1).

12
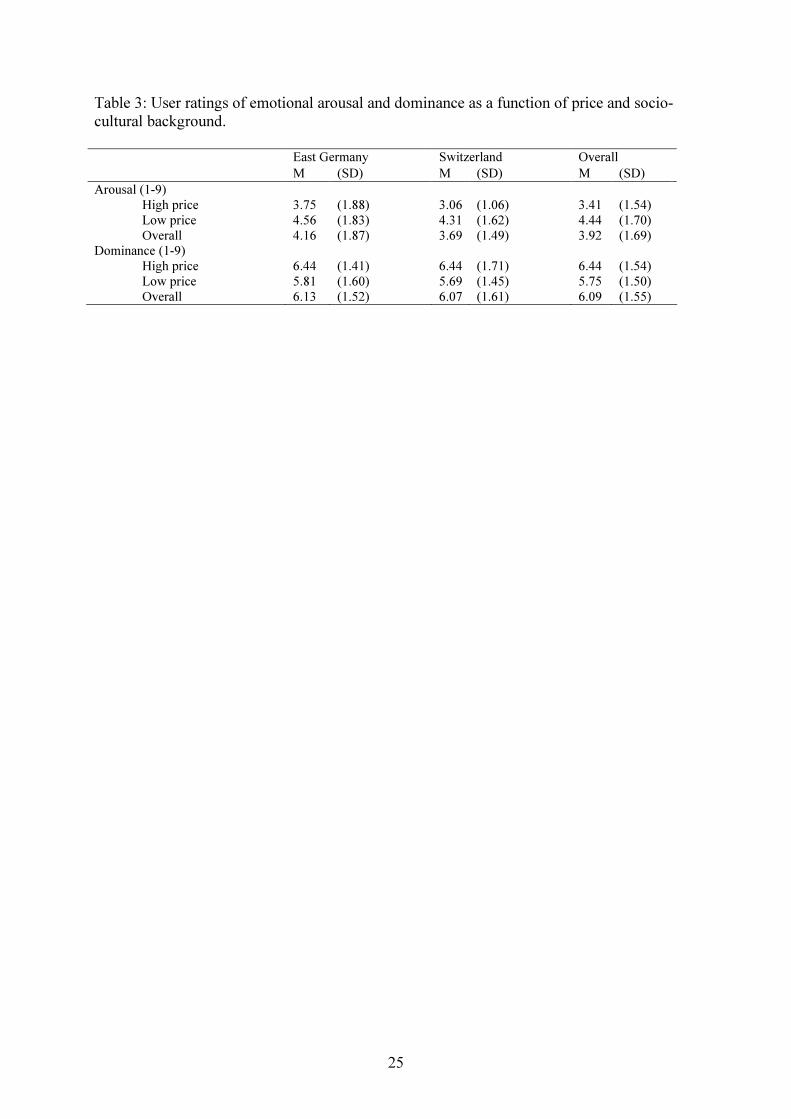
Figure 2: User ratings of pleasure as a function of product price and socio-cultural background. Arousal. The data for arousal, as the second important dimension of emotion, are presented in table 3. The data analysis revealed that participants in the low price condition reported higher arousal than in the high price condition (F = 6.41; df = 1, 60; p < .05). There was no significant difference between the regions (F = 1.32; df = 1, 60; p > .05). Finally, no interaction between price and socio-cultural background was recorded (F < 1).
Dominance. The third dimension of emotion is represented by the dominance factor. As the data in table 3 indicate, no differences between conditions were observed. This was confirmed by the results of the statistical tests, which showed no significant effects for price (F = 3.16; df = 1, 60; p > .05), socio-cultural background (F < 1) and the interaction between the two factors (F < 1). Table 3: User ratings of emotional arousal and dominance as a function of price and socio-cultural background.
East Germany Switzerland Overall M (SD) M (SD) M (SD)
Arousal (1-9)
High price
Low price
Overall
3.75
4.56
4.16
(1.88)
(1.83)
(1.87)
3.06
4.31
3.69
(1.06)
(1.62)
(1.49)
3.41
4.44
3.92
(1.54)
(1.70)
(1.69)
Dominance (1-9)
High price
Low price
Overall
6.44
5.81
6.13
(1.41)
(1.60)
(1.52)
6.44
5.69
6.07
(1.71)
(1.45)
(1.61)
6.44
5.75
6.09
(1.54)
(1.50)
(1.55)

13
3.2 Perceived usability
Product usability was measured in two ways. A 1-item scale was used to measure the concept more broadly (before and after task completion) while the PSSUQ was employed to measure the concept more elaborately (only after task completion). One-item usability scale. The data of the single-item scale are presented in figure 3. The results show usability ratings increased after users had actually gained usage experience with the product (Mbefore = 4.52; Mafter = 5.09). This increase was significant (F = 9.34; df = 1, 60; p < .01). Interestingly, the interaction observed for valence of emotion was also found for perceived usability. As figure 3 shows, there were higher usability ratings in Switzerland for the high priced product than for the low priced product and lower usability ratings in East Germany for the high priced product than for the low priced one. This interaction was significant (F = 5.41; df = 1, 60; p < .05). No significant main effects of price and socio-cultural background were found (both F < 1).
Figure 3: Perceived usability as a function of socio-cultural background and price (measured by a single-item scale). PSSUQ. Overall, the pattern of effects found for the PSSUQ showed some resemblance to the data obtained with the single item scale in some aspects but differed in others. The data for the PSSUQ scale are presented in table 4. Visual inspection of the group means suggests a similar interaction between price and socio-cultural background but analysis of variance failed to confirm the significance of the effect (F = 1.58; df = 1, 60; p > .05). An analysis of the main effects showed the same results as for the single-item measure. Neither price nor socio-cultural background showed a significant effect (both F < 1). A separate analysis of the three subscales (system usefulness, information quality, interface quality) showed the same pattern as the overall scale. Therefore, detailed data of the subscales are not reported here.

14
Table 4: Usability ratings (1-7) for the post-study system usability questionnaire as a function of socio-cultural background and price.
East Germany Switzerland Overall
M (SD) M (SD) M (SD)
High price
Low price
Overall
4.87
5.22
5.04
(1.12)
(1.02)
(1.07)
5.31
5.10
5.19
(0.90)
(0.85)
(0.87)
5.09
5.14
(1.02)
(0.92)
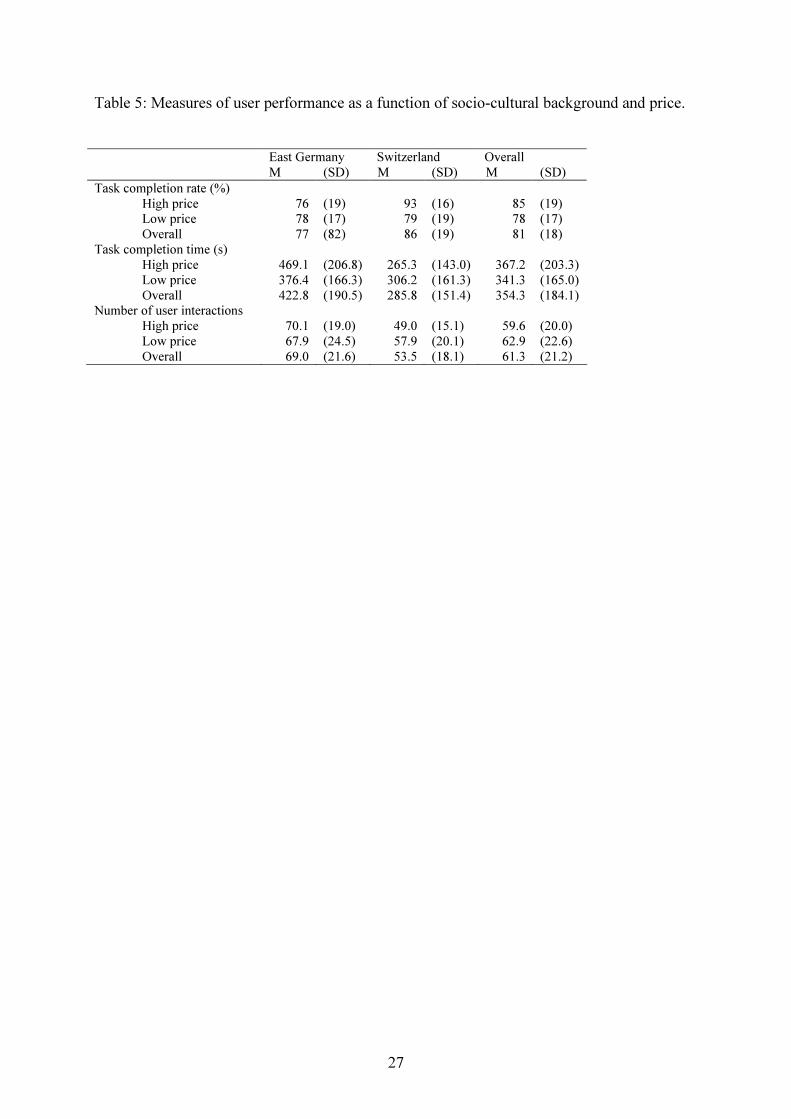
3.3 User performance
The data of different user performance measures are presented in table 5. Task completion rate. The analysis of the data revealed a significant main effect of socio-cultural background on task completion rate (F = 4.10; df = 1, 60; p < .05), with users from East Germany being less successful in task completion than users from Switzerland. The main effect of price in task completion rate was not significant (F < 1), nor was the interaction between price and socio-cultural background for task completion rate (F = 2.09; df = 1, 60; p > .05).
Task completion time. The analysis revealed a main effect of socio-cultural background on this measure (F = 10.28; df = 1, 60; p < .01), with users from East Germany requiring more time to complete the tasks than users from Switzerland. Price showed no influence on task completion time (F < 1) and the interaction between socio-cultural background and price was not significant (F = 2.45; df = 1, 60; p > .05).
Number of user interactions. Considering the impact of price and socio-cultural background on the number of user interactions, a significant main effect of socio-cultural background was found (F = 9.74; df = 1, 60; p < .01). The effect occurred because users from East Germany needed more steps to finish the tasks than users from Switzerland. No significant main effect of price (F < 1) and no significant interaction between price and culture (F = 1.25; df = 1, 60; p > .05) were found. Table 5: Measures of user performance as a function of socio-cultural background and price.
East Germany Switzerland Overall
M (SD) M (SD) M (SD)
Task completion rate (%)
High price
Low price
Overall
76
78
77
(19)
(17)
(82)
93
79
86
(16)
(19)
(19)
85
78
81
(19)
(17)
(18)
Task completion time (s)
High price
Low price
Overall
469.1
376.4
422.8
(206.8)
(166.3)
(190.5)
265.3
306.2
285.8
(143.0)
(161.3)
(151.4)
367.2
341.3
354.3
(203.3)
(165.0)
(184.1)
Number of user interactions
High price
Low price
Overall
70.1
67.9
69.0
(19.0)
(24.5)
(21.6)
49.0
57.9
53.5
(15.1)
(20.1)
(18.1)
59.6
62.9
61.3
(20.0)
(22.6)
(21.2)

15
4 Discussion
The central goal of this study has been to determine how the results of usability tests are influenced by the socio-cultural background of test participants and how this influence is moderated by product value. An important finding was that the way price affected the valence of emotion was dependent on the socio-cultural context. The high-price product triggered more positive emotion in Switzerland than a low-price product whereas the reverse pattern was observed in East Germany. A high product price may be associated with a luxurious product and hence evoke positive emotions (Reinmoeller, 2002). Since Swiss consumers have a strong luxury orientation and are not very price sensitive (Rouhani, 1998), this may be the reason why Swiss users reported more positive emotions after usage of the high-priced product. In contrast, in East Germany a low-priced product may have corresponded more strongly to the needs of East German consumers because they are considered as rather frugal and price sensitive (Wiedmann, 2004). The pattern found in East Germany corresponds to findings from other work (Xia et al., 2004; Wirtz & Kimes, 2007), which showed that low prices elicited positive consumer emotions (positive price experience) whereas high prices were linked to negative emotions (negative price experience). This may be explained by the concept of price fairness which is based on equity theory (Adams, 1965) and which predicts the experience of negative emotions as a consequence of the perception of an unfair price (Xia et al., 2004). The price of the more expensive product may have been evaluated by consumers from East Germany as unfair, which triggered negative emotions. Theory of cognitive dissonance may be used as further possible explanation for such cultural differences (Festinger, 1957). Since in cultures with a higher price sensitivity and with more restricted financial means, a more negative evaluation of the less affordable product may occur (paralleled by a more positive evaluation of the inexpensive product) in order to prevent the emergence of cognitive dissonance.
Interestingly, there were differences in the pattern of effects found for the three dimensions of emotion, confirming the independence of the factors valence, arousal and dominance according to the Emotional State Model (ESM; Mehrabian & Russel, 1977). Emotional arousal was found to be different from valence of emotion because test participants from both socio-cultural regions reported higher emotional arousal when operating the less expensive product. Although this corroborates assumptions of the theoretical model, it does not provide any explanation about the reason for the differing effects. Unfortunately, no research is known to the authors that address the influence of price on different emotional dimensions. Therefore, only somewhat speculative assumptions can be provided. The difference in effects found between valence and arousal may be explained by the Schachter-Singer theory of emotion. It proposes that the emotional response to experienced arousal depends on an individual appraisal process (Schachter & Singer, 1962). This suggests the valence of the increased arousal as an interpretative process may be culture-dependent, while arousal as a first reaction to a stimulus may represent an effect shared across cultures. In contrast to valence and arousal, dominance as the third dimension of emotion did not show any significant effect. Generally, this dimension may be less sensitive than the other two. This is reflected in the literature on emotion, which affords the third dimension a lesser role (Lang et al., 1997), but also in the psychometric properties of the questionnaire. For example, the SAM applied in this study seems to be a very valid instrument for valence and arousal (with correlations with the Mehrabian and Russel’s scale of .94 for both dimensions) while dominance had a correlation of only .66 with the respective scale (Lang, 1985).
Results on user behaviour indicated a better performance of participants from Switzerland compared to those from East Germany. This pattern of results was observed for all three performance parameters measured, suggesting better scores for Swiss users for both main aspects of performance, that is, speed and accuracy. The socio-cultural effects may be

16
due to differences in technical competence or internal pacing. Since the research literature did not provide any indications for effects of socio-cultural background on performance, a discussion of the possible mechanism behind the observed effects would be too speculative and is therefore not pursued. However, future research may wish to address this question since previous work examining methodological issues in usability testing showed that performance is influenced by many environmental factors including observer presence, product aesthetics, and testing location (Sonderegger & Sauer, 2009; Sonderegger & Sauer, 2010; Sauer & Sonderegger, 2011).
It is acknowledged that while the differences found between the two regions are of great importance, the explanation of these differences is difficult and, admittedly, somewhat speculative. We used both, the wellbeing dimension of Inglehart’s model as well as findings from consumer research to describe differences between the two regions. This suggested that Switzerland and East Germany differ in a number of ways, mainly as a result of the differences in economic power and the past political-economic system outlined in the introduction. These differences may also have an impact on some factors from the Hofstede (1991) framework. Although the work of Hofstede does not provide separate data for East and West Germany, it is very plausible that such differences between the two regional cultures exist (even though they might be less pronounced than shortly after reunification). For example, data from Poland as a neighbouring former communist country shows higher scores for power distance, uncertainty avoidance and collectivism than Switzerland, Germany and other Western European countries (Hofstede, 2011). Due to a shared history of Poland and East Germany with regard to their political-economic system, one may expect that this shared history would have had an influence on dimensions such as power distance, individualism and uncertainty avoidance in a similar way, resulting in comparable differences between East Germany and Switzerland. These differences may also have a bearing on the outcomes of usability tests (e.g., higher power distance may result in a less critical rating of the product when presented by the presumably powerful test facilitator, higher uncertainty avoidance may lead to less negative usability ratings when the product appears to have ambiguous functions). It is acknowledged that the data base on cultural differences between the two cultural regions is patchy and does not allow for a firm conclusion to be drawn. However, it would be safe to conclude that socio-cultural background was an important aspect that should be considered in usability testing.
It is noteworthy that the two regions compared were relatively similar with regard to geographical distance, religious roots, and linguistic code (i.e. European, Christian, and German-speaking countries). It is remarkable that even by comparing two relatively similar regions, we were able to find considerable culture-based differences in the influence of product value on usability evaluation. In typical product design processes for the global market, national cultures are involved that differ much more strongly on cultural dimensions than the two regions compared. For example, Sweden and Russia as nearly neighbouring countries differ very strongly on the wellbeing dimension (see Table 1), coming first and last in the ranking. This would lead us to expect even stronger effects than observed in the present study. This suggests that culture-specific usability testing is of paramount importance in usability practice but there is also a clear need to carry out more systematic research to be able to give better recommendations for product designers and usability practitioners.
The current work has several implications for usability practice and future research. First, there is a need to examine the interaction between several factors of influence in usability research by using multi-factorial research designs rather than examining the effects of single factors. The conclusions from our piece of research would have been very different if we had used socio-cultural background and product value as independent variables in two separate studies with one-factorial designs. Second, product price may represent another

17
example of a hidden influencing factor that has an undesirable effect on the test outcomes even though this factor is unrelated to the concept of usability from a theoretical perspective. A very prominent example of such an influencing factor is product aesthetics. Although aesthetics is conceptually distinct from usability, a number of empirical studies show that it affects perceived usability (e.g., Tractinsky et al. 2000) and a smaller amount of work shows that it may even influence user performance (e.g., Moshagen et al., 2009). Third, there appears to be an interesting relationship between perceived usability and emotion, with both outcome measures being affected by experimental conditions in a very similar manner. Previous work that included measures of emotion has revealed a similar positive association with perceived usability (e.g., Tractinsky et al., 2000; Sonderegger & Sauer, 2010). This suggests that emotions may play an important role in usability evaluation, though the precise nature of that role is still unclear (e.g., moderator or mediator). Future research may therefore wish to address the interplay of objective usability characteristics, emotion and perceived usability. Acknowledgement
We are very grateful to Nicole Aebischer and Carola Binder for their support in completing this study.
5 References
Ackerman, D. & Tellis, G., 2001. Can culture affect prices? A cross-cultural study of
shopping and retail prices. J. Retail. 77, 57-82. Allenby, G. M. & Rossi, P. E., 1999. Marketing models of consumer heterogeneity. J.
Econom. 89, 57-78. Arnould, E. J. & Thompson, C. J., 2005. Consumer Culture Theory (CCT): Twenty Years of
Research. J. Consum. Research. 31, 868 - 882. Artis, S. & Smith-Jackson, T.L., 2002. Cross-cultural differences in risk perception.
Proceedings of the XVI Annual International Occupational Ergonomics and Safety Conference, June 10-12 2002, Toronto, Canada.
Arzheimer, K., (in press). Europa als Wertegemeinschaft? Ost und West im Spiegel des
Schwartz Value Inventory, in: Keil S.I. & van Deth J.W. (Eds.): Deutschlands Metamorphosen. Einheit und Differenzen in europäischer Perspektive. Nomos: Baden-Baden.
Arzheimer, K. & Klein, M., 2000. Gesellschaftspolitische Wertorientierungen und
Staatszielvorstellungen im Ost-West-Vergleich, in: Falter, J.W., Gabriel, O.W. & Rattinger, H. (Eds.). Wirklich ein Volk? Die politischen Orientierungen von Ost- und Westdeutschen im Vergleich. Opladen: Leske + Budrich, pp. 363-402.
Bagwell, K. & Riordan, M.H., 1991. High and declining prices signal product quality. Amer.
Econ. Review. 81, 224-239.

18
Bradley, M.M. & Lang, P.J., 1994. Measuring emotion: the self-assessment manikin and the semantic differential. J. of Behav. Ther. and Exp. Psychiatry. 25, 49-59.
Bridges, K., Melewar, T. & Otubanjo, B. O., 2007. “Geiz-ist-geil” strategy: a three-company
study. Manag. Decis. 45, 1023-1037. Cialdini, R. B., 1993. Influence: Science and Practice, third ed. Harper Collins, New York. Choi, B., Lee, I., Kim, J., & Jeon, Y., 2005. A qualitative cross-national study of cultural
influences on mobile data service design. Proceedings of the 2005 SIGCHI Conference on Human Factors in Computing Systems, 661-670.
Christopherson, T. & Konradt, U., 2010. Reliability, validity and sensitivity of a single-item measure of online store usability, submitted for publication.
Cockton, G., 2004. From quality in use to value in the world. Proceedings of the 2004
Conference on Human Factors in Computing Systems, CHI, April 24 - 29 2004. ACM, New York, NY, USA, 1287-1290.
Cockton, G., 2006. Designing worth is worth designing. Proceedings of the 4th Nordic
Conference on Human-Computer Interaction: Changing Roles, CHI, April 24-27 2006. ACM, New York, NY, USA, 165-174.
Colombo, F., Zurn, P. & Oxley, H., 2006. OECD reviews of health systems: Switzerland.
OECD Publishing, Paris. Dawson, J. 2010. Retail Trends in Europe, in: Krafft, M. & Mantrala, M.K. (Eds.), Retailing
in the 21st Century. Springer, Berlin, pp. 63-82. De Angeli, A. & Kyriakoullis, L., 2006. Globalisation vs. localisation in e-commerce:
Cultural- aware interaction design. Proceedings of the working conference on advanced visual interfaces. ACM, New York, 250-253.
Dubois, B. & Duquesne, P., 1993. The market for luxury goods: Income versus culture. Eur.
Jour. Mark. 27, 35-44. Festinger, L., 1957. A Theory of Cognitive Dissonance. Stanford University Press, Stanford. Forlizzi, J. & Battarbee, K., 2004. Understanding experience in interactive systems.
Proceedings of the 2004 conference on Designing Interactive Systems (DIS 04): processes, practices, methods, and techniques. ACM, New York, 261-268.
Ger, G., 1996. Cross-cultural differences in materialism. J. Econ. Psychol. 17, 55-77. Gould, J.D. & Lewis, C, (1985). Designing for Usability: Key Principles and What Designers
Think. Communications of the ACM, 28(3), 300-311. Grunert, K.G. & Beckmann S.C., 1999. Means-End Chains and Laddering: An Inventory of
Problems and an Agenda for Research, in: Reynolds, T.J. & Olson, J.C. (Eds).

19
Understanding Consumer Decision Making. Lawrence Erlbaum Associates, London, pp. 63-90.
Hassenzahl, M. & Tractinsky, N., 2006. User experience - a research agenda. Behav. Inf.
Technol. 25, 91-97. Hekkert, P., 2006. Design aesthetics: Principles of pleasure in product design. Psychol. Sci.
48, 157-172. Hofstede, G., 1991. Cultures and Organizations: Software of the Mind. McGraw, London. Hofstede, G., 2011. National cultural dimensions - Poland. [on-line] Available :
http://www.geert-hofstede.com/hofstede_poland.shtml [2011, December 11]. Honold, P., 1999. Learning how to use a cellular phone: Comparison between German and
Chinese users. Technical Communication: J. Soc. Tech. Comm. 46, 196-205. Igbaria,M., Schiffman, S.J. & Wieckowski, T.J., 1994. The respective roles of perceived
usefulness and perceived fun in the acceptance of microcomputer technology. Behav. Inf. Technol. 13, 349–61.
Inglehart, R. & Welzel, C., 2005. Modernization, Cultural Change, and Democracy: The
Human Development Sequence. Cambridge University Press, Cambridge. Inglehart, R. & Baker, W.E., 2003. Modernization, Cultural Change and the Persistence of
Traditional Values, in Dahl, R.A., Shapiro, I, & Cheibub, J.A., (Eds). The Democracy Sourcebook. MIT Press, Boston, pp. 168-180.
Jordan, P.W., 2001. National Cultures and Design, in Baumann, K. & Thomas, B., (Eds).
User Interface Design of Electronic Appliances. Taylor & Francis, Bristol, pp. 329-342,
Jordan, P.W., 1998. Human factors for pleasure in product use. Appl. Ergon. 29, 25-33. Kim, J., & Moon, J.Y., 1997. Emotional usability of customer interfaces: focusing on cyber
banking system interfaces. In: CHI '97 extended abstracts on Human factors in computing systems: Looking to the future. Atlanta: ACM, 283-284.
Kroeber-Riel, W. & Weinberg, P., 2008. Konsumentenverhalten, 8th ed. Vahlen; München. Lang, P.J., 1985. The Cognitive Psychophysiology of Emotion: Anxiety and the Anxiety
Disorders. Lawrence Erlbaum, Hillsdale. Lang, P. J., Bradley, M. M. & Cuthbert, B. N., 1995. International affective picture system
(IAPS): Instruction manual and affective ratings. Technical Report A-6, The Center for Research in Psychophysiology, University of Florida.
Lewis, J.R., 1995. IBM Computer usability satisfaction questionnaires: Psychometrics
evaluation and instruction for use. Int. J. Hum. Comput. Interact. 7, 57-78.

20
Lindgaard, G. & Dudek, C., 2003. What is the evasive beast we call user satisfaction? Interact. Comput., 15, 429-452.
Marcus A., 2003a. Global and Intercultural User-Interface Design, in J.A. Jacko & A. Sears,
(Eds). Handbook of Human-Computer Interaction. Lawrence Erlbaum Associates, Upper Saddle River, pp. 441-463.
Marcus, A., 2003b. The emotion commotion. Interactions 10, 28-34. McCracken, G., 1986. Culture and consumption: A theoretical account of the structure and
movement of the cultural meaning of consumer goods. J. Consum. Res. 13, 71-84. Mehrabian, A. & Russel, J.A., 1977. Evidence for a three-factor theory of emotions. J. Res.
Pers. 11, 273-294. Merritt, A., 2000. Culture in the cockpit: Do Hofstede’s Dimensions replicate? J. Cross Cult.
31, 283-301. Merritt, A. & Helmreich, R., 1996. Human factors on the flight Deck: The influence of
national culture. J. Cross Cult. Psychol. 27, 175-24. Morris, J.D., 1995. Observations: SAM: The Self-Assessment Manikin – An Efficient Cross-
Cultural Measurement of Emotional Response. J. Advert. Res. 35, 63-68. Moshagen, M., Musch, J. & Go, A. S., 2009. A blessing, not a curse: Experimental evidence
for beneficial effects of visual aesthetics on performance. October. 52, 1311-1320. Nielsen, J. & Levy, J., 1994. Measuring usability: Preference vs. performance.
Communications ACM. 37, 66-75 Norman, D.A., 2004. Emotional Design: Why We Love (or Hate) Everyday Things. Basic
Books, New York. Olson, J.C., & Jacoby, J., 1977. Price as an Informational Cue: Effects on Product
Evaluations, in: A.G. Woodside, J.N. Sheth & P.D. Bennett, (Eds). Consumer and Industrial Buying Behavior. Elsevier North-Holland, New York, pp. 267-286.
Ono, M.M., 2002. Emergent strategies for designing new products facing cultural diversity,
within the globalisation context. Paper presented at the 2nd Conference on Innovative Research in Management, Stockholm.
Reinmoeller, P., 2002. Emergence of Pleasure: Communities of Interest and New Luxury
Products, in: Green, W.S & Jordan, P.W (Eds). Pleasure with Products: Beyond Usability. Taylor & Francis, London, pp 125-134.
Romberg, M., Röse, K. & Zühlke, D., 1999. Global demands of non-European markets for the
design of user-interfaces. MMI-Interaktiv, 1, [online], Retrieved from: http://www.journaldatabase.org/articles/95720/Global_Demands_of_noneuro.html. Accessed on February 15, 2009.

21
Rouhani, S., 1993. Analyse und Interpretation von Preisstrategien des schweizerischen Lebensmittelhandels am Beispiel von Bioprodukten. IWA Discussion Paper, University of St. Gallen.
Russell, J.A., 2003. Core affect and the psychological construction of emotion. Psychol Rev.
110, 145-172. Sauer J. & Sonderegger A. (2011). Methodological issues in product evaluation: the influence
of testing environment and task scenario. Applied Ergonomics, 42, 487-494. Schachter, S. & Singer, J. E., 1962. Cognitive, social, and physiological determinants of
emotional state. Psychol Rev. 69, 379-399. Sherman, P.J, Helmreich, R.L. & Merritt, A.C., 1997. National culture and flight deck
automation: Results of a multination survey. Int. J Aviat. Psychol. 7, 311-329. Smith-Jackson, T.L., 2006. Culture and Warnings, in: Wogalter, M.S, (Ed). Handbook of
warnings. Lawrence Erlbaum Associates, New Jersey, pp. 363-371. Smith-Jackson, T.L., Essuman-Johnson A. & Leonard, S.D. 2003. Comparison of USA and
Ghanaian interpretations of prohibition and “to-do” symbols. International Society for Occupational Ergonomics and Safety.
Sonderegger, A. & Sauer, J., 2009. The influence of laboratory setup in usability tests: effects on user performance, subjective ratings and physiological measures. Ergonomics. 52, 1350 - 1361.
Sonderegger, A. & Sauer J., 2010. The influence of design aesthetics in usability testing: effects on user performance and perceived usability. Appl. Ergon. 41, 403–410.
Statistisches Bundesamt Deutschland, 2008. Indicators for Germany by Bundesland [online],
Retrieved from: http://www.vgrdl.de/Arbeitskreis_VGR/ergebnisse.asp?lang=en-GB Accessed on February 15 2009.
Swiss Federal Statistical Office, 2008. GDP per Inhabitant [online]. Available from:
http://www.news.admin.ch/message/index.html?lang=en&msg-id=20942. Accessed on February 15, 2009.
Tatzel, M., 2002. “Money worlds” and well-being: An integration of money dispositions,
materialism and price-related behavior. J. Econ. Psychol. 23, 103-126. Thorndike, E.L., 1920. A constant error in psychological rating. J. Appl. Psychol. 4, 25-29. Tractinsky, N., Katz, A.S. & Ikar, D., 2000. What is beautiful is usable. Interact. Comp. 13,
127-145. Van Deth, J.W., 2001. Wertewandel im internationalen Vergleich, ein deutscher Sonderweg?
Aus Politik und Zeitgeschichte, 29, 23-30.

22
Vinchur, A.J., Schippmann, J.S., Switzer, F.S. & Roth, P.L. 1998. A meta-analytic review of predictors of job performance for salespeople. J. Appl. Psychol. 83, 586-597.
Wanous J.P., Reichers A.E. & Hudy M., 1997. Overall job satisfaction: how good are single-
item measures? J. Appl. Psychol., 82, 247-52. Westbrook, R. A. & Oliver, R. L., 1991. The Dimensionality of Consumption Emotion
Patterns and Consumer Satisfaction. J. Consum. Res. 18, 84-91. Wiedmann, K.-P., 2004. Fundierung des Marketing, first ed. Deutscher Universitätsverlag,
Wiesbaden. Wiedmann, K.-P., Hennigs, N. & Siebels, A., 2007. Measuring consumers’ luxury value
perception: A cross-cultural framework. Acad. Mark. Sci. Rev. 11, 1-21. Wirtz, J. & Kimes S.E., 2007. The moderating role of familiarity in fairness perceptions of
revenue management pricing. J. Serv. Res. 9, 229-240. Wüstenhagen, R., 1998. Pricing Strategies on the Way to Ecological Mass Markets.
Proceedings of the Seventh Greening of Industry Network Conference, Rome, November 15-18 1998.
Xia, L., Monroe, K.B. & Cox, J.L., 2004. The price is unfair! A conceptual framework of
price fairness perceptions. J. Mark. 68, 1-15. Zeithaml, V.A., 1988. Consumer perceptions of price, quality, and value: a means-end model
and synthesis of evidence. J. Mark. 52, 2-22.

23
Table 1: Values of 65 cultures on the “wellbeing” dimension of the Model of Cross-Cultural Variation (adapted from Inglehart & Baker, 2003) Sweden 2.1 Italy 0.5 Nigeria -0.77
Netherlands 2.03 Spain 0.35 Taiwan -0.83
Australia 1.79 Uruguay 0.26 Latvia -0.88
New Zealand 1.76 Dominican Republic 0.23 Slovakia -0.91
USA 1.5 Columbia 0.2 Macedonia -0.98
Norway 1.47 Mexico 0.18 Pakistan -0.98
Switzerland 1.41 Venezuela 0.12 China -1.03
Canada 1.29 Turkey 0 Bangladesh -1.14
West Germany 1.23 Brazil -0.08 Yugoslavia -1.14
Denmark 1.18 Chile -0.17 Hungary -1.17
Iceland 1.12 Ghana -0.2 Romania -1.28
Britain 1.09 Czech -0.26 Bulgaria -1.31
Finland 1 Slovenia -0.28 Estonia -1.43
Ireland 0.97 Peru -0.31 Armenia -1.46
N. Ireland 0.76 Philippines -0.34 Georgia -1.5
Belgium 0.7 Croatia -0.54 Lithuania -1.5
Austria 0.68 South Korea -0.54 Azerbaijan -1.6
France 0.59 Portugal -0.57 Belarus -1.83
Japan 0.56 Poland -0.6 Ukraine -1.86
Puerto Rico 0.56 India -0.61 Moldova -1.94
Argentina 0.53 South Africa -0.61 Russia -1.94
East Germany 0.53 Bosnia -0.66

24
Table 2: Modified version of the Post-Study System Usability Questionnaire (PSSUQ) Post Study System Usability Questionnaire (Cronbach’s α = .93)
Subscale “system usefulness” (Cronbach’s α = .90)
Overall, I am satisfied with how easy it is to use this coffee machine.
It was simple to use this coffee machine.
I was able to complete the tasks and scenarios quickly using this coffee machine.
I felt comfortable using this coffee machine.
It was easy to learn to use this coffee machine.
I was able to complete the tasks successfully.
I could effectively complete the tasks using the coffee machine.
I believe I could become productive quickly using this coffee machine.
Subscale “information quality” (Cronbach’s α = .74)
Whenever I made a mistake using the coffee machine, I could recover easily and
quickly.
The information provided by this coffee machine phone was clear.
The organisation of information on the coffee machine’s display was clear.
Subscale “interface quality” (Cronbach’s α = .79)
The interface of this coffee machine was pleasant.
The coffee machine fulfils all the functions I expected.
I liked using the interface of this coffee machine.
Overall satisfaction
Overall, I am satisfied with this coffee machine.
25
Table 3: User ratings of emotional arousal and dominance as a function of price and socio-cultural background.
East Germany Switzerland Overall M (SD) M (SD) M (SD)
Arousal (1-9)
High price
Low price
Overall
3.75
4.56
4.16
(1.88)
(1.83)
(1.87)
3.06
4.31
3.69
(1.06)
(1.62)
(1.49)
3.41
4.44
3.92
(1.54)
(1.70)
(1.69)
Dominance (1-9)
High price
Low price
Overall
6.44
5.81
6.13
(1.41)
(1.60)
(1.52)
6.44
5.69
6.07
(1.71)
(1.45)
(1.61)
6.44
5.75
6.09
(1.54)
(1.50)
(1.55)

26
Table 4: Usability ratings (1-7) for the post-study system usability questionnaire as a function of socio-cultural background and price.
East Germany Switzerland Overall
M (SD) M (SD) M (SD)
High price
Low price
Overall
4.87
5.22
5.04
(1.12)
(1.02)
(1.07)
5.31
5.10
5.19
(0.90)
(0.85)
(0.87)
5.09
5.14
(1.02)
(0.92)
27
Table 5: Measures of user performance as a function of socio-cultural background and price. East Germany Switzerland Overall
M (SD) M (SD) M (SD)
Task completion rate (%)
High price
Low price
Overall
76
78
77
(19)
(17)
(82)
93
79
86
(16)
(19)
(19)
85
78
81
(19)
(17)
(18)
Task completion time (s)
High price
Low price
Overall
469.1
376.4
422.8
(206.8)
(166.3)
(190.5)
265.3
306.2
285.8
(143.0)
(161.3)
(151.4)
367.2
341.3
354.3
(203.3)
(165.0)
(184.1)
Number of user interactions
High price
Low price
Overall
70.1
67.9
69.0
(19.0)
(24.5)
(21.6)
49.0
57.9
53.5
(15.1)
(20.1)
(18.1)
59.6
62.9
61.3
(20.0)
(22.6)
(21.2)