the influence of product quality, product...
TRANSCRIPT

THE INFLUENCE OF PRODUCT QUALITY, PRODUCT
AVAILABILITY, BRAND IMAGE AND BRAND TRUST
TOWARD PURCHASE DECISION
(CASE STUDY OF TOLAK ANGIN LIQUID)
UNDERGRADUATE THESIS
Submitted to Faculty of Economics and Business
For Acquiring Bachelor Degree of Economics
By :
Agnes Kartika Vidya Puspita
1113081100014
MANAGEMENT DEPARTMENT
INTERNATIONAL CLASS PROGRAM
FACULTY OF ECONOMIC AND BUSINESS
SYARIF HIDAYATULLAH STATE ISLAMIC UNIVERSITY JAKARTA
1439 H/2018

i
THE INFLUENCE OF PRODUCT QUALITY, PRODUCT
AVAILABILITY, BRAND IMAGE AND BRAND TRUST
TOWARD PURCHASE DECISION :
(Case Study of Tolak Angin Liquid)
Undergraduated thesis
Submitted to Faculty of Economics and Business in Partial Requirement for
Acquiring Bachelor Degree of Economics
Submitted by :
Agnes Kartika Vidya Puspita
(1113081100014)
Under supervision of
Leis Suzanawaty, SE., Msi
ID : 19720809 2005 1 2 004
DEPARTMENT OF MANAGEMENT
INTERNATIONAL CLASS PROGRAM
FACULTY OF ECONOMIC AND BUSINESS
SYARIF HIDAYATULLAH STATE ISLAMIC UNIVERSITY JAKARTA
14 H/2018M

ii

iii

iv

v
CURRICULUM VITAE
I. PERSONAL INFORMATION
1. Name : Agnes Kartika Vidya Puspita
2. Place, Date of Birth : Jakarta, June 27th
1995
3. Address : Komplek TNI – AL Sukamanah Jonggol
RT 01/RW 02
4. Phone Number : 0821-2392-3798
5. Email : [email protected]
6. Religion : Islam
7. Gender : Female
8. Nation : Indonesia
II. FORMAL EDUCATION
1. 1999 – 2001 : TK Hang Tuah 09 Jakarta Utara
2. 2001 – 2002 : SDN Kelapa Gading 07 Jakarta Utara
3. 2002 – 2007 : SDN Sukamaju 04 Jonggol
4. 2007 – 2010 : SMPN 02 Jonggol
5. 2010 – 2013 : SMK Farmasi Bhakti Kencana Bogor
6. 2013 – 2018 : State Islamic University Syarif Hidayatullah
Jakarta, Faculty of Economics and Business,
Major in International Management (Marketing)

vi
III. NON FORMAL EDUCATION
1. Taking English Courses at “LATANZA Einstitute” in 2014 - 2015
2. Participated in a National Seminar “Mewujudkan Lembaga
Keuangan Mikro Yang Berdaya Saing Dalam Menghadapai MEA
(Masyarakat Ekonomi Asean) 2015”
IV. ORGANIZATIONAL EXPERIENCE
1. Became the leader of field work practice (Praktek Kerja Lapangan)
at Hosana Bekasi Hospital in 2010
2. Join the selection of vocal group (Paduan Suara Mahasiswa) UIN
Jakarta in 2013
3. Became secretary of KKN (Kuliah Kerja Nyata) OTISTA in 2016
V. WORK EXPERIENCE
1. Field work practice (Praktek Kerja Lapangan) at Hosana Bekasi
Hospital in 2010

vii
ABSTRACT
This study aimed to analyze the influence of product quality, product
availability, brand image and brand trust toward purchase decision (study case of
Tolak Angin Liquid). The data collection in this study uses convenience sampling
with 150 respondents buyer of Tolak Angin Liquid. Data was analyzed using
multiple linear regression. The results of this data showed that : (1) product
quality has significantly influence to purchase decision of Tolak Angin Liquid. (2)
product availability has significantly influence to purchase decision of Tolak
Angin Liquid. (3) brand image has significantly influence to purchase decision of
Tolak Angin Liquid. (4) brand trust has significantly influence to purchase
decision of Tolak Angin Liquid. (5) product quality, product availability, brand
image and brand trust have significantly influence to purchase decision of Tolak
Angin Liquid.
Keywords : product quality, product availability, brand image, brand trust and
purchase decision.

viii
ABSTRAK
Penelitian ini bertujuan untuk menganalisis pengaruh kualitas produk,
ketersediaan produk, citra merek dan kepercayaan merek terhadap keputusan
pembelian obat Tolak Angin Cair. Data penelitian yang diperoleh menggunakan
convenience sampling dengan 150 responden pembeli obat Tolak Angin Cair.
Data telah diolah menggunakan uji regresi linier berganda. Hasil data
menunjukkan bahwa : (1) kualitas produk memiliki pengaruh yang signifikan
terhadap keputusan pembelian Tolak Angin Cair. (2) ketersediaan produk
memiliki pengaruh yang signifikan terhadap keputusan pembelian Tolak Angin
Cair. (3) citra merek memiliki pengaruh yang signifikan terhadap keputusan
pembelian Tolak Angin Cair. (4) kepercayaan merek memiliki pengaruh yang
signifikan terhadap keputusan pembelian Tolak Angin Cair. (5) kualitas produk,
ketersediaan produk, citra merek dan kepercayaan merek memiliki pengaruh yang
signifikan terhadap keputusan pembelian Tolak Angin Cair.
Kata kunci : kualitas produk, ketersediaan produk, citra merek, kepercayaan
merek, keputusan pembelian.
ix
FOREWORD
Assalamua’laikum warahmatullahi wabarakatuh
Alhamdulillahirobbila’lamin, thanks to my almighty God Allah
Subhanahu Wataa’la for all his gift, blessing, forgiveness and protection that he
gave to me. Then, I can complete this thesis in order to obtain bachelor degree of
Economic in State Islamic University Syarif Hidayatullah Jakarta.
While writing this thesis, I realized that the knowledge and lessons that i
get in campus are most valuable and beneficial for me in the future. Beside that, I
want to extend the gratitude for every recommendation and support from all of
the faculty supervisors. Because of that, I can finished this thesis on time. Then,
here I wanna give thanks to the people who have helped me in the preparation of
thesis :
1. Prof. Dede Rosyada, MA as Rector of State Islamic University Syarif
Hidayatullah Jakarta (UIN Syarif Hidayatullah Jakarta).
2. Dr. M. Arief Mufraini, Lc., M.Si as Dean of Faculty of Economics and
Business of State Islamic University Syarif Hidayatullah Jakarta. (UIN
Syarif Hidayatullah Jakarta).
3. Cut Erika Ananda Fatimah, SE., MBA as my academic counselor.
Thank you for supporting me and reminding me to finished my thesis
and also to fullfill the partial academic transcript in every semester.
x
4. Leis Suzanawaty, SE., Msi as my thesis supervisor. Thank you for all
of the patients, supports, motivation and recommendation that she gave
to me during finishing this thesis. Maybe, I cannot finish this thesis
without her. Thank you.
5. Titi Dewi Warninda, SE, M.Si as a Head of Management Studies
Program of Faculty Economics and Business State Islamic University
Syarif Hidayatullah Jakarta. (UIN Syarif Hidayatullah Jakarta).
6. Ela Patriana, MM as Secretary of Management Studies Program of
Faculty Economics and Business State Islamic University Syarif
Hidayatullah Jakarta. (UIN Syarif Hidayatullah Jakarta).
7. Bonix, S.Far, Apt as Academic Staff of Faculty Economics and
Business State Islamic University Syarif Hidayatullah Jakarta. (UIN
Syarif Hidayatullah Jakarta). Thank you for the help.
8. All of the Lecturers and Employees of Faculty Economics and
Business State Islamic University Syarif Hidayatullah Jakarta. (UIN
Syarif Hidayatullah Jakarta). Thank you to teach me all of the subject
about Economic and Business.
Without them, author cannot finish this thesis on time. Thank You.
Jakarta, August 2018
Agnes Kartika Vidya Puspita

xi
SPECIAL THANKS
Assalamua’laikum warahmatullahi wabarakatuh
This thesis I dedicate to :
1. Thank you so much for my momma Vitta R and my daddy Yahya P A
who always support me, pray for me, teach me, listen for all of my
complaints and always be by my side when my hopes are falling down and
feels like want to give up.
2. My little sister, Bunga Indah A S who always be by my side, supporting
me and helping me. Love you, I hope you can get the best score in UN and
move on to the next chapter of your life get onto High School.
3. My little brother, Tata Bangsa P V who always be by my side, supporting
me, helping me, leans on me, asks me for help and go back forth in my
rooms when i feel bored. Love you, I hope you can get the best score and
ranks in your Elementary School.
4. My niece Icha, who accompanying me to find some books and hear my
compliments thought about anything. Thank you.
5. My best friends : Anastasia I, Teguh Prillisia P D, Finna W, Dwiffan R
and Ega Y. Thank you for accompanying me, talked to me, give the good
advice, beside me when sad or happy moments for many years while in
Pharmacy Vocational High School until now. Thank you very much, love
ya!
6. My best classmates MNJ IP 13 : Azmie, Siti Nurma, Sahila Denis,
Anindya, Ira. Ida, Rizqo Iqo, Naufal, Nugroho, Rendy, Ahmad, Wendi,
xii
Majid, Enggar, Dani, Arijul and also Alm. Fathur. Thank you for stay with
me, accompanying me, teach me when i’m confused in some lessons,
patient when i’m in hard situation to talk much and treat me while I was
sick in the dormitory. A little bit so sad as the last population, but hope we
are succes together. Love ya MNJ IP 13, thank you very much and see you
again.
7. Senior of International Program : thank you for your help and your
support. Especially Sister Eva and Nadila who have been disturbed by me
when i have a lot of questions while do this thesis research.
8. My best KKN 230 OTISTA : Indah, Lulu, Sarah, Ayu, Nurul, Sakha, Irvan
Wepe, Irfan, Wahyudi dan Muchtar. Thank you for spending the time
together, make a moment within a month in Buaran Jati, make an
succesfull event and help each other until the KKN program is finished.
See you again and thank you very much.
9. My new friends Suci and Iqbal. Thank you for your help when i asked
some questions and the support.
10. My Elementary School friends : Elis M. Fadillah. Amazing, coincidentally
meet when we just passing by at the campus road.
11. My Junior of Marketing Program : Adinda, Anita, Bang Oji Fachrurozie
thank you for your cooperate, support and help when we do the marketing
research from INDOPED about Himalaya Herbal together. Thank you, I
passed the subject and get the good score.

xiii
LIST OF CONTAINTS
APPROVAL THESIS SHEET...........................................................................i
APPROVAL COMPREHENSIVE SHEET......................................................ii
APPROVAL THESIS EXAM SHEET.............................................................iii
SHEET STATEMENT AUTHENCITY SCIENTIFIC WORKS..................iv
CURRICULUM VITAE.....................................................................................v
ABSTRACT.......................................................................................................vii
ABSTRAK.........................................................................................................viii
FOREWORD.......................................................................................................ix
SPECIAL THANKS...........................................................................................xi
LIST OF CONTAINTS....................................................................................xii
LIST OF FIGURE..........................................................................................xviii
LIST OF TABLE..............................................................................................xix
LIST OF ATTACHMENT..............................................................................xxi
CHAPTER I INTRODUCTION
A. Research Background...................................................................................1
B. Problem Formulation..................................................................................12
C. Purpose of Research....................................................................................13
D. Benefit of Research.....................................................................................13
CHAPTER II LITERATURE REVIEW
A. Theoritical Basis.........................................................................................15
1. Product..................................................................................................15
a. Definition of Product......................................................................15
b. Core Benefits of Product................................................................15

xiv
2. Product Quality.....................................................................................16
a. Definition of Product Quality.........................................................16
b. Indicators of Product Quality..........................................................16
3. Product Availability..............................................................................17
a. Definition of Product Availability..................................................17
b. Dimensions of Product Availability...............................................18
4. Brand.....................................................................................................19
a. Understanding of Brand..................................................................19
b. Function of Brand...........................................................................19
5. Brand Image..........................................................................................19
a. Definition of Brand Image..............................................................19
b. Indicator of Brand Image................................................................20
6. Brand Trust...........................................................................................23
a. Definition of Brand Trust...............................................................23
b. Indicators of Brand Trust................................................................23
7. Purchase Decision.................................................................................23
a. Understanding of Purchase Decision..............................................23
b. Component of Purchase Decision...................................................24
B. Previous Research.......................................................................................26
C. Relationship Among Variables...................................................................30
D. Conceptual Framework...............................................................................34
E. Hypothesis..................................................................................................36

xv
CHAPTER III RESEARCH METHODOLOGY
A. Scope of Research.......................................................................................38
1. Locations of Research...........................................................................38
2. Time of Research..................................................................................38
3. Variables of Research...........................................................................38
B. Determine of Sample Method.....................................................................38
1. Population.............................................................................................38
2. Sample Technique.................................................................................39
C. Data of Collection Methods........................................................................40
1. Primary Data.........................................................................................40
2. Secondary Data.....................................................................................42
D. Data Analysis Method................................................................................42
1. Validity and Reliability.........................................................................43
a. Validity Test...................................................................................43
b. Reliability Test................................................................................43
2. Classic Assumptions.............................................................................44
a. Normality Test................................................................................44
b. Multicollinearity Test.....................................................................46
c. Heteroscedasticity Test...................................................................47
3. Hypothesis Test.....................................................................................49
a. Partial Test (T-test).........................................................................49
b. Simultaneously Test (F-test)...........................................................51
xvi
4. Multiple Linier Regression...................................................................52
5. Coefficient Determination (R2).............................................................54
E. Research of Operational Variable...............................................................55
CHAPTER IV ANALYSIS AND DESCRIPTIONS
A. Overview of Research Objects...................................................................60
1. History of Sidomuncul Development...................................................60
2. Form of Business Entities.....................................................................60
3. History of Sidomuncul Development Abroad......................................61
4. Vission and Mission of Sidomuncul.....................................................61
a. Vission............................................................................................61
b. Mission............................................................................................62
B. Descriptive Results of the Respondent.......................................................62
1. Respondent based on Gender................................................................63
2. Respondent based on Place to Bought Medicine..................................63
3. Respondent based on Age.....................................................................64
4. Respondent based on Occupation.........................................................65
5. Respondent based on Income...............................................................66
C. Results of Validity Test and Reliability Test..............................................67
1. Validity Test.........................................................................................67
2. Reliability Test......................................................................................70
D. Results of Descriptive Analysis..................................................................72
1. Product Quality.....................................................................................72
2. Product Availability..............................................................................75

xvii
3. Brand Image..........................................................................................76
4. Brand Trust...........................................................................................78
5. Purchase Decision.................................................................................79
E. Classic Assumption.....................................................................................82
1. Normality Test......................................................................................82
2. Multicollinearity Test...........................................................................84
3. Heteroscedasticity Test.........................................................................85
F. Hypothesis Test...........................................................................................87
1. Partially Test (t-test).............................................................................87
2. Simultaneously Test (F-test).................................................................94
G. Multiple Linier Regression.........................................................................96
H. Coefficient Determination..........................................................................97
CHAPTER V CONCLUSION AND RECOMMENDATION
A. Conclusion................................................................................................100
B. Recomendation.........................................................................................102
REFERENCES...............................................................................................xxiii

xviii
LIST OF FIGURE
Number Description Page
1.1 The Profile of Traditional Medicine
which Qualified in 2010-2014.....................................................2
2.1 Conceptual Framework..............................................................35
4.1 Normal P – Plot of Purchase Decision.......................................82
4.2 Histogram of Purchase Decision................................................83
4.3 One Sample Kolomogorov – Smirnov Test
of Purchase Decision..................................................................83
4.4 Tolerance and FIV Value...........................................................84
4.5 Scatterplot...................................................................................85
4.6 Glejser Test................................................................................86
4.7 t – Test........................................................................................87
4.8 F – Test.......................................................................................94
4.9 Multiple Linier Regression.........................................................96
4.10 Coefficient Determination (R2)..................................................97

xix
LIST OF TABLE
Number Description Page
1.1 Sidomuncul Product Sales Segment.............................................6
1.2 TOP Brand Index in the Category
of "Masuk Angin” Medicine........................................................8
2.1 Previous Research......................................................................26
3.1 Likert Scale................................................................................42
3.2 Df of t – Table............................................................................50
3.3 Df of F – Table...........................................................................52
3.4 Operational Variable...................................................................56
4.1 Results of the Respondent Based on Gender.............................63
4.2 Results of the Respondent based on Place.................................63
4.3 Results of the Respondent Based on Age...................................64
4.4 Results of the Respondent Based on Occupation.......................65
4.5 Results of the Respondent Based on Income.............................66
4.6 Try Out Result of : Validity Test (Product Quality)..................67
4.7 Try Out Result of : Validity Test (Product Availability)...........68
4.8 Try Out Result of : Validity Test (Brand Image).......................69
4.9 Try Out Result of : Validity Test (Brand Trust).........................69
4.10 Try Out Result of : Validity Test (Purchase Decision)..............70
4.11 Try Out Result of : Reliability Test............................................71

xx
4.12 The Statement Results of the Respondent about Product
Quality........................................................................................72
4.13 The Statement Results of the Respondent about Product
Availability.................................................................................75
4.14 The Statement Results of the Respondent about Brand
Image..........................................................................................76
4.15 The Statement Results of the Respondent about Brand
Trust............................................................................................78
4.16 The Statement Results of the Respondent about Purchase
Decision......................................................................................79

xxi
LIST OF ATTACHMENT
Description Page
Attachment I Research Questionairre Sheet
in English Language...................................................xxxv
Attachment II Research Questionairre Sheet
in Indonesian Language..............................................xlvii
Attachment III The Questionairre Results for
Validity & Reliability Data.............................................lx
Attachment IV The Questionairre Results for Research Data...............lxv
Attachment V The Results of Validity and Reliability Test.............lxxxv
Attachment VI The Results of Normality Test.................................lxxxix
Attachment VII The Results of Multicollinearity Test.............................xc
Attachment VIII The Results of Heteroscedasticity Test.........................xci
Attachment IX The Results of Multiple Linier Regression Test..........xcii

1
CHAPTER I
INTRODUCTION
A. Research Background
Indonesia is a tropical country that has a greatest potential of plant
and for some generations had been used as a traditional medicine. With
that potential of plants, Indonesia has a prospect to develop herbal or
traditional medicine in order to get benefit of health and industrial
targeting product both domestic and international markets.
The presence of trend back to nature has an impact to the society
and they realized that using a natural product is good for health. Society
more understand about the benefits of using the traditional medicine, there
are : the cheaper of price, convenience and easy to get the product and
having a minimum side effect. (Murdopo,2014).
In fact, the producer of traditional herbal medicine Indonesia must
take an effort to increase the research, improving the capasities of
technology, improving the quality assurance and improving the safety and
efficacy as a traditional medicine product.
According to Sparringa (2014:6) the group of traditional medicine
in Indonesia is divided into three, there are : Jamu (Empirical Based
Herbal Medicine), Obat Herbal Terstandar (Scientific Based Herbal
Medicine) and Fitofarmaka (Clinical Based Herbal Medicine). Whereby
for each group, are not allowed containing the chemicals and required of

2
supporting evidence such as: empirical evidence, proof and non-clinical or
clinical evidence.
In 2014, Food and Drug Monitoring Agency (BPOM) has
succesfully improving the effectiveness supervision of traditional
medicine. This is indicated in increasing of traditional medicine which
now is safe, beneficial and meet the condition (qualify).
The graph in above is the result of laboratory testing of 13.030
samples of traditional medicine. In 2014 which showed that the traditional
medicine are safe, beneficial and meet the condition (qualify) amounted to
76,74%, or increase of 2,93% compared in year 2010 which amounted to
73,81%. (Sparringa,2015:24).
As a part of a company that produce traditional medicine, PT.
Industri Jamu and Pharmaceutical Sidomuncul Tbk. Also improve it’s
quality to be a top priority both in Indonesia and the world. In addition,
Sidomuncul want to provide benefits and efficacy of its products. As well
Figure 1.1 Profile of Traditional Medicine That Have A Qualify
years of 2010-2014

3
as doing some research done by cooperating with research institutes and
universities.
Besides that, product quality should also be determined by how
customers view the product. From a marketing perspectives, quality means
a product availability to satisfy a customer needs or requirements. This
definition focuses on the customer and how the customer thinks a product
will fit some purpose. (Perreault and Mc Carthy,1999:243).
As the development distribution of all the Sidomuncul product. PT
Muncul Mekar doing the activities to implement the information
technology that had been integrated. This matter will going to do in order
to accomplished the reporting system of sales and marketing can reach to
the city of remote areas and the district easily, fastest and support the
availability of product in each region. Also can help to make a decision
making in quickly to make a progress in the company.
On the other hand the products need to be available in the right
place at the right time. It means that the product availability in the firm
needs to recruit the appropiate intermediaries such as wholesalers,
retailers, agent and so forth to ensure that the product can be found in the
place the customer expects to find it. (Blythe,2009:4).
Moreover, the image product of Tolak Angin which is very famous
from the past until now is the slogan. The image slogan becomes the
positioning statement of Tolak Angin as a pioneer of modern herbal
medicine. This product from PT Sidomuncul which originally in the form

4
of herbs powder which has a bitter taste and issued a sharp herbal aroma
makes some consumers do not want to try this product, they feel less
comfortable with it. If this happens, the growth potential of the powdered
herbs market of the Tolak Angin product is reduced. To that end, a new
innovation made from the product Tolak Angin from before made in the
form of herbs powder, then the new innovation is to make in the form of
Liquid Tolak Angin. With this innovation is expected to change the
perception of the people who mostly do not like the taste of herbs are bitter
and less delicious and the smell of herbal medicine that sting can be
changed and well received by consumers and the public. It is finally
proven until now, that this innovation is able to lift the image of traditional
herbalist Tolak Angin, now can be processed or processed using a very
modern processing.
However, the image is what consumers see of the brand and how
they consequently perceive and mentally integrate all messages. It is the
associations network in the mind of consumer. Understanding how a
global brand is perceived requires in-depth consumer research in many
countries to understand all the situations in which the brand is used. The
first visible aspect of a brand is the product itself. Therefore, analyzing and
selecting the right product market combination is essential in defining your
brand position. Also, we need to representing the brand in the mind of the
consumer or we called it as a brand image. (Mooij,2010:275-278).

5
Furthermore the government has also made serious efforts to
increase the level of consumer trust in various domestic herbal medicine
products. Food and Drug Monitoring Agency (BPOM) has also performed
its supervisory role strictly, thereby increasing consumer trust in products
that have undergone the BPOM testing process including the product of
the Tolak Angin.
Likewise, trust in marketing is regarded as one of the key
ingredients or lubricants required to encourage smooth business
relationships (Nguyen, 2002) in Glynn,2009:142. As the firm’s belief that
another company will perform actions that will result in positives
outcomes for the firm, as well as not take unexpected actions that would
result in negative outcomes for the firm. (Anderson & Narus, 1990:45) in
Glynn,2009:142.
Thus, the perspective of decision-making describes a consumer
performing about the specific steps at the time of purchase. The specific
steps include : problem identification, searching, alternative evaluation,
selecting and post-acquisition evaluation. The root of the approach, such
as : cognitive experience, psychological factors as well as other economic
factors. (Mowen and Minor, 2002:11).
In the midst of challenging economic conditions Jamu (Empirical
Based Herbal Medicine) and Herbal Medicines industry, is one of the
industry that hold out the crisis, it is because the local raw material get
support that is not affected by the economic conditions. Jamu (Empirical

6
Based Herbal Medicine) and Herbal Medicine Industry in 2015 still
recorded that the growth is about 3% to 4%. The government is aware that
the Jamu (Empirical Based Herbal Medicine) and Herbal Medicines
industry is a potential sector to be developed as one of the drivers of
industry growth and the national economy. Therefore, the government
continues to strive to create a conducive business climate, so that the
industrial world remains excited to invest in Indonesia, and has a high
competitiveness. The government is concerned to make the Jamu, Herbal
and Cosmetic industries to host their own country. (Sidomuncul Annual
Report, 2015:78).
Based on the Sidomuncul Performance Highlight, the increase in
net profit sales in 2016 from Rp. 22.2 trillion by 2015. (Sidomuncul
Annual Report, 2016: 2). Then, for the Company's net sales contributed by
the sales of Herbs and Supplements segment, Food and Beverage segment
and Pharmaceutical segment. (Sidomuncul Annual Report, 2015:3).
As for the sales growth in the three segments, will be explained in
the table below :
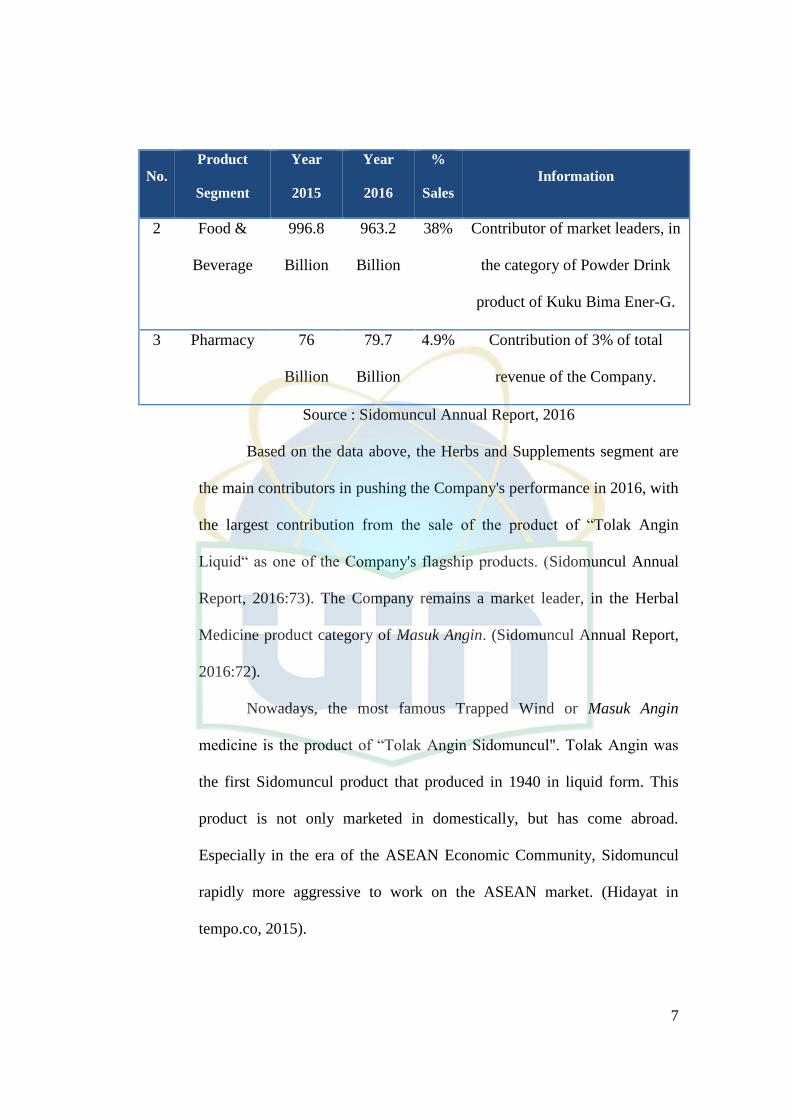
Table 1.1 Sidomuncul Product Sales Segment
No.
Product
Segment
Year
2015
Year
2016
%
Sales
Information
1 Herbal
Medicine &
Suplements
1.14
Trillion
1.52
Trillion
59% Contributor of market leaders, in
the category of Herbal Medicine
products of Tolak Angin Liquid.
7
No.
Product
Segment
Year
2015
Year
2016
%
Sales
Information
2 Food &
Beverage
996.8
Billion
963.2
Billion
38% Contributor of market leaders, in
the category of Powder Drink
product of Kuku Bima Ener-G.
3 Pharmacy 76
Billion
79.7
Billion
4.9% Contribution of 3% of total
revenue of the Company.
Source : Sidomuncul Annual Report, 2016
Based on the data above, the Herbs and Supplements segment are
the main contributors in pushing the Company's performance in 2016, with
the largest contribution from the sale of the product of “Tolak Angin
Liquid“ as one of the Company's flagship products. (Sidomuncul Annual
Report, 2016:73). The Company remains a market leader, in the Herbal
Medicine product category of Masuk Angin. (Sidomuncul Annual Report,
2016:72).
Nowadays, the most famous Trapped Wind or Masuk Angin
medicine is the product of “Tolak Angin Sidomuncul". Tolak Angin was
the first Sidomuncul product that produced in 1940 in liquid form. This
product is not only marketed in domestically, but has come abroad.
Especially in the era of the ASEAN Economic Community, Sidomuncul
rapidly more aggressive to work on the ASEAN market. (Hidayat in
tempo.co, 2015).

8
In addition, in the face of company competition especially in the
field of Masuk Angin or Common Cold Herbs Medicine. Tolak Angin
Liquid from PT Sidomuncul has an ability, has an influence for improving
the company business strategy and also has expand it’s market to the
International market.
Based on the data in below, from Table 1.2 Top Brand Index in the
Category of Masuk Angin or Common Cold Medicine it can be seen that
Tolak Angin Liquid Sidomuncul is occupies or get the first position as a
TOP brand. Meanwhile, the other brands from the same category occupy
the second position filled by the Antangin brand, the third position from
the Bintangin brand and the fourth position from the Air Mancur brand.
Table 1.2 TOP Brand Index in the Category of Masuk Angin or
Common Cold Medicine
Year 2015 Year 2016
Brand TBI TOP Brand TBI TOP
Tolak Angin
Sidomuncul
54.4 % TOP Tolak Angin
Sidomuncul
60.0% TOP
Antangin 42.3% TOP Antangin 37.4% TOP
Bintangin 0.9%
Air Mancur 0.9%
Source : www.topbrand-award.com
Based on the data in above, it is better for the Antangin, Bintangin
and also Air Mancur to be able to implement the strategies that have been

9
carried out and achieved from Tolak Angin Sidomuncul by do the
benchmarking. Benchmarking is a process of systematic analysis and
comparison of one company’s performance measured against another’s (in
the industry leaders) in order to improve business performance.
(Masterson and Pickton,2012:253). Also, according to Render and Heizer
(2001:99-100) benchmarking is a method used to improve performance by
referring to other parties. In an ideal situation one or more organizations
will be found whose operations are similar to those of an organization,
then compare the performance of the organization with the performance of
other organizations. Then, the benchmarking strategy in Tolak Angin
Liquid based on the independent variable are : first, based on the variable
of product quality is conduct the certification testing through : Good
Manufacturing Practice for Medicine (CPOB), Good Manufacturing
Practice for Traditional Medicine (CPOTB) and also International
Standard Organization (ISO) and conduct the scientific research testing by
cooperating through the reputable institution and universities.
(www.sidomuncul.id/tolakangin). Second, based on the variable of
product availability is using an integrated system of Information and
Technology and also an operational system among working units. As for
distribution and sales, including: SAP Module / Function for Sales &
Distribution (SD) and also DCRS for sales monitoring. (Sidomuncul
Annual Report,2016:116). Third, based on the variable of brand image is
build a strong image by focusing products through: slogans or unique

10
jargon as an images of the herbs or Jamu that can be accepted,
remembered and integrated by the consumers through the feelings and the
thoughts, such as “Orang Pintar Minum Tolak Angin”. (Susanto,2016:74).
Fourth, based on the variable of brand trust is conduct the product
standardization tests, regarding the categories of medicine product sold,
such as: categories of Standardized Herbal Medicines (Obat Herbal
Terstandar), Herbal Medicine (Jamu) or Phytopharmaca (Fitofarmaka)
which were safe to consume, and also factories that were standardized
GMP (Good Manufacturing Products) by BPOM (Food and Drug
Monitoring Agency) that had standard compliance.
(www.sidomuncul.id/tolakangin). Based on the strategy of Tolak Angin
Liquid in above, the Antangin, Bintangin and Air Mancur brand can
improve their company's performance by following and applying that
strategy.
This research is conducted, in Jonggol area which is one of
subdistrict in Bogor Regency area. Bogor known as Kota Hujan has a high
rainfall of about 3,000 millimeters - 4,000 millimeters per year. (Rahmat
in CNN Indonesia.com, 2017). In District Jonggol, has two kinds of
seasons: the dry season and the rainy season. During 2015 the average
rainfall in Jonggol sub-district is 498 mm with an average range of 65 -
1344 cm. This shows that, the rainy season is less than the dry season in
2015. (Sarwono,2016:1). Generally, in the transition season, the frequency
of people affected by the disease, such as: colds, flu, cough, fever, Masuk

11
Angin or Common Cold, flatulence and also nausea, is relatively
increased. Because when the transition coming usually signed by the high
frequency of storms, heavy rains with rumblings and strong winds. (Ilahi
et.,al 2012).
For that reason, there will likely be many people, who make
purchasing decisions to buy Masuk Angin, such as Tolak Angin. Where
this Tolak Angin has the appropriate benefits for treating diseases such as:
relieves symptoms of Masuk Angin, nausea, flatulence, headache, dry
throat and body fever.
Furthermore, the existence of this research is become the reference
of bencmarking strategy to build marketing product and brand such as
product quality, product availability, brand image and brand trust like
variable in this research. Also, to help the other Empirical Based Herbal
Medicine or Jamu entrepreneurs developing their business and to be able
to implement the strategy. Then, Empirical Based Herbal Medicine or
Jamu formerly associated as an outdated product, but now become the
target product of many people, able to coexist with other pharmaceutical
products and become a market leader in the field (Agung,2013:145-146).
One of them such as, Tolak Angin Liquid from PT. Sidomuncul like in
this research.
From the background above, the author took some of several
variables relating the background research to investigate the product
quality (X1), product availability (X2), brand image (X3) and brand trust

12
(X4) toward purchase decision (Y). Based on the description in above, the
author makes a research with the tittle :
“THE INFLUENCE OF PRODUCT QUALITY, PRODUCT
AVAILABILITY, BRAND IMAGE AND BRAND TRUST TOWARD
PURCHASE DECISION” (CASE STUDY OF TOLAK ANGIN
LIQUID)
B. Problem Formulation
Based on the background described above, so the formulations of the
problem that will be explained in this research are :
1. Do the product quality have significant influence toward purchase
decision of Tolak Angin Liquid ?
2. Do the product availability have significant influence toward purchase
decision of Tolak Angin Liquid ?
3. Do the brand image have significant influence toward purchase
decision of Tolak Angin Liquid ?
4. Do the brand trust have significant influence toward purchase decision
of Tolak Angin Liquid ?
5. Do the product quality, product availability, brand image and brand
trust have significant influence toward purchase decision of Tolak
Angin Liquid ?

13
C. Purpose of Research
The purposes of this research are :
1. To analyze the influence of product quality toward purchase decision
of Tolak Angin Liquid.
2. To analyze the influence of product availability toward purchase
decision of Tolak Angin Liquid.
3. To analyze the influence of brand image toward purchase decision of
Tolak Angin Liquid.
4. To analyze the influence of brand trust toward purchase decision of
Tolak Angin Liquid.
5. To analyze the influence of product quality, product availability,
brand image and brand trust toward purchase decision of Tolak Angin
Liquid simultaneously.
D. Benefit of Research
Based on the data, the reseacher hope that the results of this research
has benefits for all parties, while the benefit is including :
1. For the author, this research can improve the author’s knowledge and
the topic can be used in business areas. This research can also be done
in order to graduate as a Bachelor of Economics of State Islamic
University Syarif Hidayatullah Jakarta.
2. For the company, this research can be used to improve the business
company as a benchmark and about how the brand and product can be

14
influencer, because the results are based from when the customer
about to purchase some product.
3. For Islamic State University Syarif Hidayatullah Jakarta (UIN), this
research can also be used for the other students in order to help them
to finish their thesis.
4. For the reader and the another research, this research can be
understood, easy to read and easy to implement the methods, the
structure and also the theory.

15
CHAPTER II
LITERATURE REVIEW
A. Theoritical Basis
1. Product
a. Definition of Product
According to Lamb et al., (2009:274) product is everything
both favorable and unfavorable that a person receives in an
exchanges.
According to Kotler (2012) product is anything that can be
offered to a market to satisfy a want or need, including physical
goods, services, experiences, events, person, places, properties,
organizations, information and ideas.
According to Kerin et al., (2004:210) product is a good,
services or idea consisting of a bundle of tangible and intangible
attributes that satisfies consumers and is received in exchange for
money or some other unit of value. Tangible attributes include
physical characteristics such as color or sweetness and intangible
product those aspects that can’t be touched.
b. Core Benefit of Product
Core benefits or the core product is the minimum benefits a
product should confer. In this case an example, medicine is meant
to cure an illness. Marketing managers have to keep focused on the
basic problems to be solved, such as : understand them well,

16
address them precisely and directly and place these solutions at the
core of their product. (Masterson and Pickton,2011:205).
2. Product Quality
a. Definition of Product Quality
According to Zeithaml and Bitner (1988) product quality
are defined as customer value over the exeeded or product feature
or throughly serving.
According to Mowen and Minor (2002:90) product quality
are defined as comprehensive evaluation of customer over goods
and services beneficience.
b. Indicators of Product Quality
According to Garvin (1996) in Arif (2016:183) there are eight
dimension of product quality :
1) Performances
Performance is the suitability with main function of the
product itself or characteristics operation of the product.
2) Features
Feature is the unique characteristics of the product which
distinguished from the other products.
3) Reliability
Reliability is the possibility of a product that can work
satisfactorily at a certain times and conditions.
(Garvin,1984:92).

17
4) Conformance
Conformance is the characteristics of design product met the
standard.
5) Durability
Durability is about the endurance life of a product.
6) Serviceability
Serviceability is about the ease of getting component of the
product.
7) Aesthetics
Aesthetics is something to do with the taste and the smell of a
product (Garvin,1984:92).
8) Perception
Perception is a consumer fanaticism with brand a particular
product because of the image of the product itself.
3. Product Availability
a. Definition of Product Availability
According to Swink (2010:263) product availability is the
capacity to have inventory present when and where it is desired by
a customer.
According to Bermen and Evans (2004) product availability
is marketing activities which do by company fluently utilized and
easier to forwarding of product.

18
b. Dimension of Product Availability
According to Saragih (2013:216) dimension of product
availability divided into two, there are on shelf availability and out
of stock. Here below, to be explained about the definition :
1) On – Shelf Availability (OSA)
According to Kamath (2016:85) on shelf availability (OSA)
is once of important metric that every retailer’s performance
is measured. OSA is defined as availability of product for
sale to a shopper, in the place he expects it and at the time he
wants to buy it. It is impacted by a host of different factors,
all along the supply chain.
2) Out of Stock (OOS)
According to Kamath (2016:85) out of stock (OOS), also
known as Stockout. It is a situation where the retailer does
not physically possess a particular product category, on its
shelf, to sell to the customer. It can be estimated from store
inventory data. According to Hawkins et.al (2001:617)
stockouts is about the store being temporarily out of a
particular brand, obviously affect a consumer’s purchase
decision. The customer then must decide whether to buy the
same brand at another store or switch the product.

19
4. Brand
a. Understanding of Brand
According to the American Marketing Association (AMA) in
Keller (2008) brand is a name, term, sign, symbol, design or
combination of them intended to identify the goods and services of
one seller or group of sellers and to differentiate them from those
competition.
According to Schiffman and Kanuk (2010) a positive brand
image will enable marketing program can be liked and be able to
produce unique associations to the brand that always exist in
customer retention.
b. Functions of Brand
According to Ambadar et al.,(2007:4) brand has two functions,
there are :
1. Brand provide identifications of a product, so that the
consumers can recognized the different trademarks with other
products.
2. Brand can help to attract the prospectives buyer.
5. Brand Image
a. Definitions of Brand Image
According to Masterson and Pickton (2011:418) brand
image is about the target market’s perception of the brand. Brand
personalities and identities only exist in order to create an image.

20
This is what people really think of the brand and in ideal world it
would match the brand personality as this is the image the brand
team wanted people to have.
b. Indicators of Brand Image
According to Shimp (2003:10) in Rizan et al.,(2015:460)
dimension of brand image is divided into three, there are :
attributes, benefits and overall evaluation. Here below, to be
explained about the definition :
1. Attributes are aspects of the advertised brand. Advertised
brands are the things that consist of non-product related, such
as : price, packaging, usage imagery and user imagery. Price
refers to the relative price of consumers for categorizing
brands into different price segments such as : low, medium and
high price segments. (Aaker 1991) in Zickermann,2014:41.
Packaging refers to the wrapper or cover a product. A package
of a product consist of aesthetics and functional aspects.
Aesthetics aspects related to the, such as : package size, shape,
materials, color, text and graphics. Functions aspects related to
the, such as : easy to hold, easy to open and squeezable. In here
i used the aesthetics aspect that consist of package shape and
color of the product. (Keller 1998) in Zickermann,2014:41.
Usage imagery refers to the associations in terms of where and
which situations the brand is used. This can be depend on the

21
time (day/night, summer/winter etc), the locations
(inside/outside), type of activity (formal/informal) or other
circumstances. (Keller 1993) in Zickermann,2014:42). User
imagery focusing on who uses the brand. This approach takes
the form of hiring celebrity spokespeople to represent the value
of the brand. (Tybout,2010:124).
2. Benefits divided into three parts, those are : functional,
experience and symbolic. Functional benefits are the outcomes
of functions performed by a product. (Verma,2002:217).
Experiental benefits is the pleasure derived from using the
product. (Chitale, 2013:206). Symbolic benefits is the desires
for self expression fulfilled. (Lantos,2015:120).
3. Overall evaluation is about the attitude toward the brand, also
has a strong, favorable and somewhat unique associations.
(Shimp and Andrews,2013:36). Attitude can be both positive
and negative depending on the object of the attitude.
(Wright,2006:264). According to Peter and Olson (2010:128)
attitude as a person’s overall evaluation of a concept.
Consumer can have quite distinct attitudes toward variations
of the same general concept. For instances, Rich has a
moderately positive attitude toward fast-food in general, but he
has a highly favorable attitude toward one product form
(hamburger restaurants). However, his attitude toward Mc

22
Donald’s a spesific brand of hamburger restaurant, is only
slightly favorable (he likes Burger King better). Finally, his
attitude toward a particular model, the Mc Donald’s on the
corner of Grant and Main is somewhat negative (he had
unpleasant meal there). (Peter and Olson,2010:130).
According to Peter and Olson (2010:143) consumers’ attitudes
toward an object often are not good predictors of their spesific
behaviors regrading that object. Because, favorable attitudes
toward these products can be expressed in many different
behaviors, it is difficult to predict which specific behavior will
be performed. As an example : consider three consumers who
have generally favorable attitudes toward Porsches but do not
own one. Behavior from the first consumer are reads ads and
test reports about Porsches. Behavior from the second
consumer are goes to showrooms to look at Porcshes. Then,
the third consumer are just daydreams about owning a
Porsches. In sum, having a generally favorable or unfavorable
attitude toward a product does not mean the consumer will
perform every possible favorable or unfavorable behavior
regarding that product. (Peter and Olson,2010:145).

23
6. Brand Trust
a. Definition of Brand Trust
According to Simamora (2003:92) trust is descriptive
thinking of a person about something. Trust can be knowledge and
opinions, trust also will create an image of a product and brand.
b. Indicators of Brand Trust
According to Reast (2005:9) in Wilujeng et al., (2014:6)
dimension of brand trust divided into two, there are credibility and
performance satisfaction. Here below, to be explained about the
definition :
1) Credibility
Credibility is building a trust to the people that will believe
about the products offered are beneficial, because the people
desperately need the products that have been sold.
(Lasmadiarta,2010:11).
2) Performance Satisfaction
Performance satisfaction is reflects customer expectations of
the brand and its products that have been met.
7. Purchase Decision
a. Understanding of Purchase Decision
According to Mullins et al., (2008:98) consumer decision
making is essentially a problem solving process. Most customer,
whether individual consumers or organizational buyers, go through

24
similar mental processes in deciding which products and brands to
buy.
b. Components of Purchase Decision
Sellers need to structure the overall buying decision to help
consumers make informed decisions about their purchases.
According to Sunyoto (2013:85) every purchase decision has a
structure of seven, the component is:
1) Decisions about the type of product
Consumers can take the decision to buy a product. The
company should focus its attention on people who are
interested in buying a product and other alternatives they are
considering.
2) Decisions about product form
This decision related to size, quality, appearance and so on.
The company must conduct marketing research to know
consumer preferences about the product concerned in order to
maximize its brand appeal.
3) Decisions about the brand
Consumers should make decisions about which brand to buy.
Each brand has its own distinction. The company need to
know how consumers choose a brand.

25
4) Decisions about the seller
Consumers should make decisions on where the product will
be purchased. The producers, wholesalers and retailers should
know how the consumers choose the sellers.
5) Decisions on the number of products
Consumers can make decisions about how many products to
buy at a time. The company must prepare many different
products according to the wishes of the buyers.
6) Decision about the time of purchase
Consumers can make decisions about when to make a
purchase. The company should know the factors that
influence consumer decisions in determining the time of
purchase.
7) Decision on how to pay
Consumers should make informed decisions about the
method or manner of payment of the product to be purchased.
The decision will affect the decision about the seller and the
amount of the purchase. The company should know the
buyer's desire for the payment method.

26
B. Previous Research
The previous research on this topic are as follows :
Table 2.1 Previous Research
No Research Title Variable Methodology Conclusion
1. Fatlahah,
2013
Pengaruh
Kualitas
Produk dan
Citra Merek
terhadap
Keputusan
Pembelian Es
Krim Wall’s
Magnum
Product
quality,
brand image
and
purchase
decision
Multiple
Linier
Regression,
and there are
108 total of
respondent
from resident
of Griya
Mapan
Rungkut,
Surabaya.
The results of
this research
showed that the
product quality
and brand
image give
contribution of
influenced on
purchase
decision.

27
No Research Title Variable Methodology Conclusion
2. Saragih,
2013
Pengaruh
Kualitas
Produk,
Ketersediaan
Produk dan
Gaya Hidup
terhadap
Keputusan
Pembelian
Produk Lulur
Mandi
Sumber Ayu
di Jakarta
Product
quality,
product
availability,
lifestyle and
purchase
decision
Descriptive
Quantitative
of Multiple
Linier
Regression,
and there are
100 total
population of
respondent.
The results of
this research
showed that the
purchase
decision was
influenced by
product quality,
product
availability and
life style.

28
No Research Title Variable Methodology Conclusion
3. Indrawati,
2015
Pengaruh
Citra Merek
dan Gaya
Hidup
Hedonis
Terhadap
Keputusan
Pembelian
Jilbab Zoya
Brand
image,
hedonistic
lifestyle and
purchase
decision
Multiple
Linier
Regression
and there are
212 total
population of
respondents.
The result of
this research
showed that
brand image
and hedonistic
lifestyle
affected on the
purchase
decision.

29
No Research Title Variable Methodology Conclusion
4. Wilujeng
and
Edwar,
2014
Pengaruh
Brand
Awareness
dan Brand
Trust
Terhadap
Keputusan
Produk
Oriflame
Brand
awareness,
brand trust
and
purchase
decision
Multiple
Linier
Regression
and there are
107 total
population of
respondents.
The result of
this research
showed that the
brand
awareness and
brand trust have
simultaneously
affect on
purchase
decision.

30
C. Relationship Among Variables
1. Relationship of Product Quality toward Purchase Decision
According to Kotler and Armstrong (2008) the better result of
product quality, can make an opportunity for the consumers
decided to make a purchase decision. The results of this research
shows that the positive of product quality in Tolak Angin Liquid
can make an influence toward purchase decision. Then, a good
judgements of product quality that appropiate with the level of
consumer need and wants, will encourage the consumer to make a
purchase decision. This explains that the results of consumer
experience in using the product, will get the judgements results
from the consumer toward the product. If the product can satisfy
the consumer, then the consumer will provide a positive
judgements of the product. With that assesments, then the
consumer will still want to buy the product. (Weenas,2013:616). In
a journal research conducted by Fatlahah (2013) entitled
“Pengaruh Kualitas Produk dan Citra Merek terhadap Keputusan
Pembelian Es Krim Wall’s Magnum” has proven that the product
quality give contribution of influenced toward purchase decision.
31
2. Relationship of Product Availability toward Purchase Decision
According to Siahaya (2015:101) the availability of
products occurs due to market demand that increases beyond
estimates. If a product has a high level of substituability and
therefore a high stockout cost, inventory levels must be adequate to
provide high levels of availability and vice versa. If the demand for
a product is low, the decision might be made to minimize inventory
levels to maintain some minimally acceptable level of availability.
(Coyle et al.,2012). In a journal research conducted by Saragih
(2013) entitled “Pengaruh Kualitas Produk, Ketersediaan Produk
dan Gaya Hidup terhadap Keputusan Pembelian Produk Lulur
Mandi Sumber Ayu di Jakarta“ has proven that the product
availability give contribution of influenced on purchase decision.

32
3. Relationship of Brand Image toward Purchase Decision
According to Rangkuti (2004) in Sangadji and Sopiah
(2013:337) defines the brand image as a set of brand associations
formed in the minds of consumers. In other words, brand image is
a set of memories that exist in the minds of consumers about a
brand, whether it is a positive or negative. According to Sangadji
and Sopiah (2013:338) a positive brand image, will provides the
benefits for producers, in order to be known by the consumers. In
other words, the consumers will decided the choices to buy a
product that has a good image. Likewise, if the brand image has a
negative image, then the consumers tend to consider more further
when will buy the product. In a journal research conducted by
Indrawati (2015) entitled “Pengaruh Citra Merek dan Gaya Hidup
Hedonis Terhadap Keputusan Pembelian Jilbab Zoya“ has proven
that the brand image have an affect on purchase decision of hijab
Zoya on community hijabers in Surabaya.
33
4. Relationship of Brand Trust toward Purchase Decision
According to Trista et.,al (2013) the trust grows from the
belief in a person's positive judgment toward of a brand, product,
company and others. If the consumers believe that there is a
positive value, then the consumers will likely use or decide to
make a purchase of the products. In a journal research conducted
by Wilujeng and Edwar (2014) entitled “Pengaruh Brand
Awareness dan Brand Trust Terhadap Keputusan Produk
Oriflame“ has proven that the brand trust have simultaneously
affect toward purchase decision of consumer Oriflame brand
cosmetic products.

34
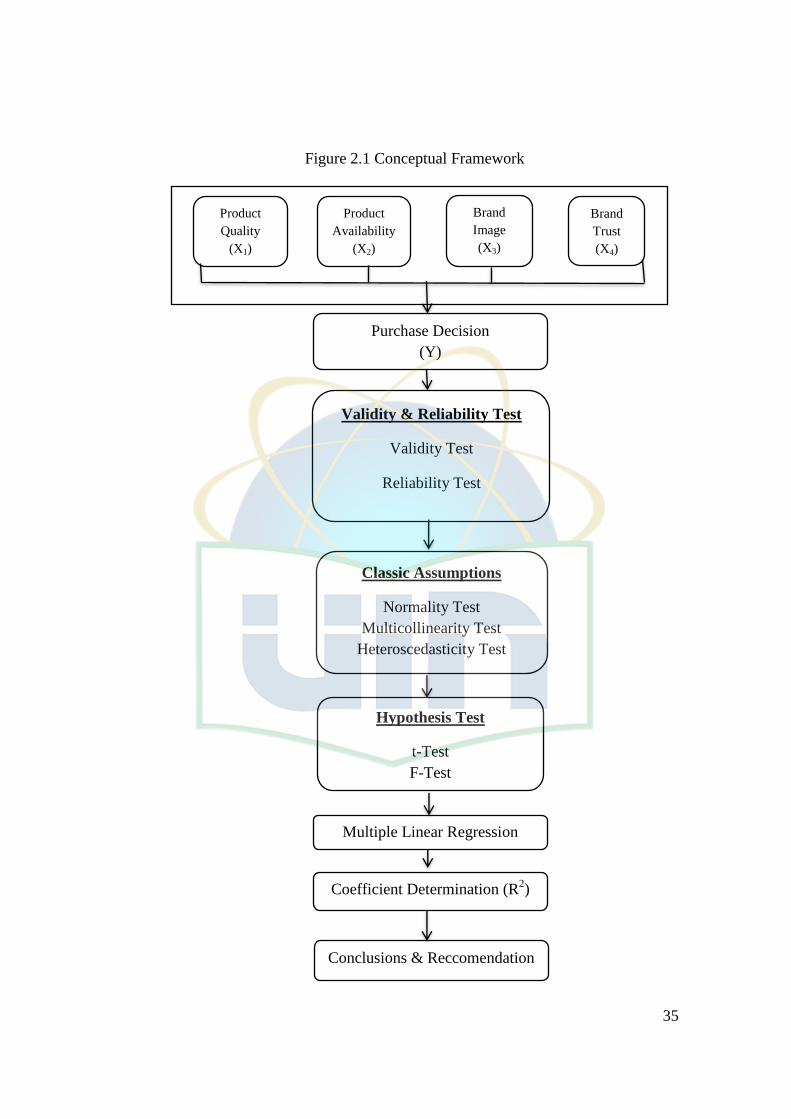
D. Conceptual Framework
According to Miles and Huberman (1994:18) in Hartman defined
conceptual framework as a visual or written product, one that “explains,
either graphically or in narrative form, the main things to be studied the
key factors, concepts or variable and the presumed relationships among
them”.
In this conceptual framework, there are four variable x include
product quality (X1), product availability (X2), brand image (X3) and brand
trust (X4). Then, one variable y include purchase decision (Y) that
influence the purchase decision of a product. Here in the next page the
explanation :
35
Figure 2.1 Conceptual Framework
Purchase Decision
(Y)
Product
Quality
(X1)
Product
Availability
(X2)
Brand
Image
(X3)
Brand
Trust
(X4)
Coefficient Determination (R2)
Validity & Reliability Test
Validity Test
Reliability Test
Classic Assumptions
Normality Test
Multicollinearity Test
Heteroscedasticity Test
Hypothesis Test
t-Test
F-Test
Conclusions & Reccomendation
Multiple Linear Regression

36
E. Hypothesis
According to Lind et al.,(2008:293) hypothesis testing is a procedure
based on sample evidence and probability theory to determine whether the
hypothesis is a reasonable statement. Based on the conceptual framework,
the previous research and the research objectives. The hypothesis of this
research is :
1. The Influence of Variabel Product Quality toward Purchase
Decision
H01 : β1 = 0 : product quality does not have a significant
influence toward purchase decision
Ha1 : β1 ≠ 0 : product quality has significant influence toward
purchase decision
2. The Influence of Variabel Product Availability toward Purchase
Decision
H02 : β2 = 0 : product availability does not have a significant
influence toward purchase decision
Ha2 : β2 ≠ 0 : product availability has significant influence
toward purchase decision
3. The Influence of Variabel Brand Image toward Purchase
Decision
H03 : β3 = 0 : brand image does not have a significant influence
toward purchase decision

37
Ha3 : β3 ≠ 0 : brand image has significant influence toward
purchase decision
4. The Influence of Variabel Brand Trust toward Purchase
Decision
H04 : β4 = 0 : brand trust does not have a significant influence
toward purchase decision
Ha4 : β4 ≠ 0 : brand trust has significant influence toward
purchase decision
5. The Influence of Variable Product Quality, Product Availability,
Brand Image and Brand Trust toward Purchase Decision
H05 : β1234 = 0 : product quality, product availability, brand image
and brand trust do not have significant influence toward purchase
decision
Ha5 : β1234 ≠ 0 : product quality, product availability, brand image
and brand trust have significant influence toward purchase decision
38
CHAPTER III
RESEARCH METHODOLOGY
A. Scope of Research
1. Location of Research
The location and the object to be examined are the people who
purchase Tolak Angin Liquid that located in Navy Resident, Jonggol.
2. Time of Research
The time research will be done during May until November
2018.
3. Variables of Research
In this study used two variables, there are : independent variable
in this research include product quality given symbol (X1), product
availability given symbol (X2), brand image given symbol (X3) and
brand trust given symbol (X4). Then, dependent variable in this
research is purchase decision given symbol (Y).
B. Determine of Sample Method
1. Population
According to Cooper and Schindler (2006:402) population is the
total collection of element about which we wish to make some
inferences.

39
According to Zulganef (2008:113) population is a group of
people, events or things that are interesting to study which has been
restricted by the researchers themselves.
In this research, population that will be used is the buyer who
bought Tolak Angin Liquid in Jonggol.
2. Sample Technique
According to Cooper and Schindler (2006:717) sample is a
group of cases, participants, events or records consisting of a portion
of the target population and carefully selected to represent that
population.
According to Cooper and Schindler (2006:717) sampling is the
process of selecting some elements from a population to represent that
population.
The sampling technique used by the author, in conducting this
thesis research is convenience sampling.
According to Cooper and Schindler (2006:707) convenience
sampling are non probability sampling where researchers use any
readily available individuals as participants. According to Hermawan
(2009:156) convenience sampling is getting information quickly,
cheaply and easily. The procedure is to simply contact sampling units,
which are easy to find. Such as: students in one class, pilgrims places
of worship, colleagues, neighbors, shop visitors and others.

40
According to Supriyanto (2009:123) 30 research subjects, is the
boundary between small samples with the large samples. For < 30 can
be regarded as a small sample, while > 30 is said to be a large sample.
The larger of the sample research, will get the better results obtained.
This is because, in a large samples will reflect the population pictures,
which is more real.
According to Arikunto in Supriyanto (2009:123) if the number
of subject in population only include 100 to 150 people and in the
research using a questionnaire, then it should be taken entirely.
According to Malhotra (2006:321) in Mardalena et.,al
(2018:104) stated that 150 people of sample is enough to fullfill the
population of the research more than 10.000 people. Then, according
to the criteria in above so the sample research used is 150.
C. Data of Collection Method
To get some data required in the preparation of this thesis, the
authors use primary data and secondary data. In below, will be explain the
data collection method used in the research:
1. Primary Data
According to Sujarweni (2014:73) primary data is data which
obtainable from the respondent through questionnaire, focus group,
panel data and the results of interview from the researchers with the
informant.

41
The researchers have obtained the primary data through the
questionairre and used the likert scale of measuring the data. The
questionairres directly distributed to the buyers of Tolak Angin Liquid
in Navy Resident, Jonggol.
According to Cooper and Schindler (2006:716) questionairre is
an instrument delivered to the participant via personal such as
intercept and phone or via non personal such as computer delivered
and mail delivered, means that is completed by the participant.
According to Umar (2011:49) questionnaire is a data collection by
giving or distributing a list of questions or statements to the
respondent. Also, providing a response to the list of questions. The
questionnaire was using the likert scale in some tables, so it will be
making it easier for respondents to understand some of the alternative
answers. In addition, there is also information from the purpose of
research and there is a description of how to filling the questionnaire
of each variable studied. Questions of the questionnaire are based on
operational indicators of variables that have been adapted to this
research object.
According to Cooper and Schindler (2006:712) likert scale is a
variation of summated rating scale, this scale ask a rater to agree or
disagree with statements that express either favorable or unfavorable
attitudes toward the object. The strength of attitude is reflected in the
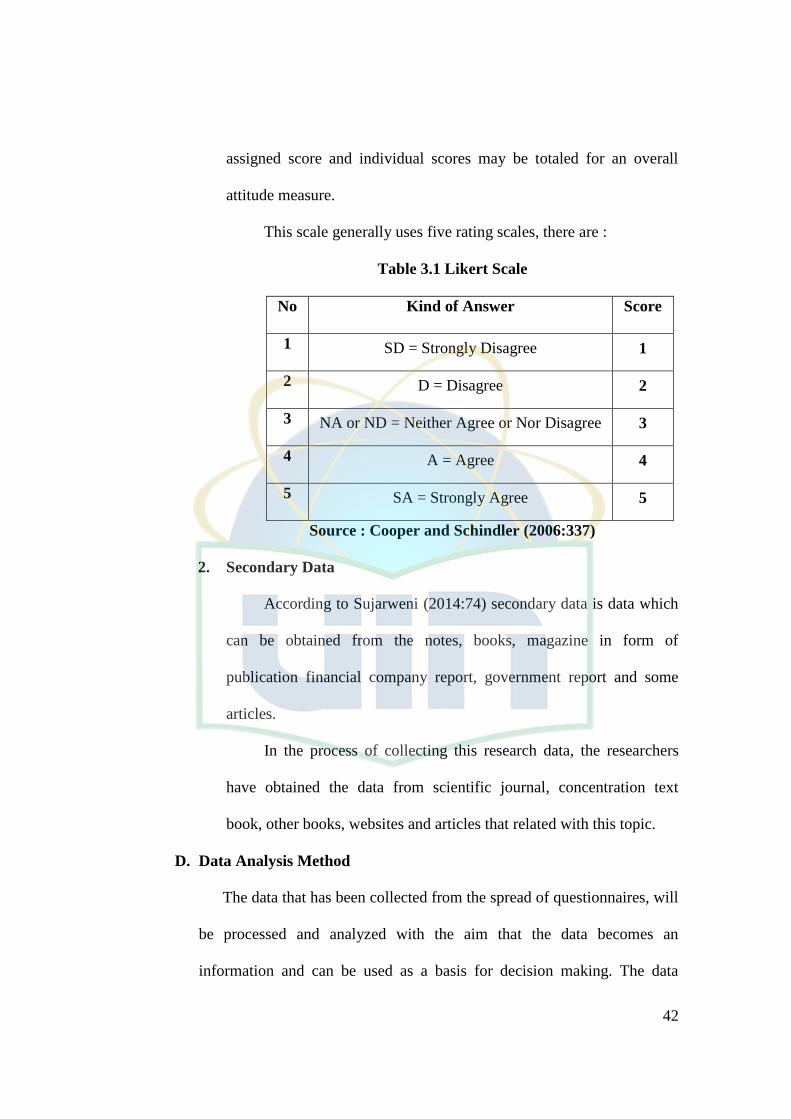
42
assigned score and individual scores may be totaled for an overall
attitude measure.
This scale generally uses five rating scales, there are :
Table 3.1 Likert Scale
No Kind of Answer Score
1 SD = Strongly Disagree 1
2 D = Disagree 2
3 NA or ND = Neither Agree or Nor Disagree 3
4 A = Agree 4
5 SA = Strongly Agree 5
Source : Cooper and Schindler (2006:337)
2. Secondary Data
According to Sujarweni (2014:74) secondary data is data which
can be obtained from the notes, books, magazine in form of
publication financial company report, government report and some
articles.
In the process of collecting this research data, the researchers
have obtained the data from scientific journal, concentration text
book, other books, websites and articles that related with this topic.
D. Data Analysis Method
The data that has been collected from the spread of questionnaires, will
be processed and analyzed with the aim that the data becomes an
information and can be used as a basis for decision making. The data

43
analysis done by using SPSS (Statistical Product and Service Solutions)
version 2.0 software.
1. Validity and Reliability Test
a. Validity Test
According to Cooper and Schindler (2006:720) validity is a
characteristics of measurement concerned with the extent that a
test measures what the researchers actually wishes to measure and
that a differences found with a measurement tool reflect true
differences among participants drawn from a population.
According to Ghozali (2013:52) validity test is used to
determine whether or not a questionairre is valid. A questionairre
is said to be valid, if the question on the questionaire is able to
reveal something that will be measured by the questionairre.
According to Ghozali (2013:53) the requirements of validity
test is by comparing the value of r arithmetics with the value of r
table, calculated the df (degree of freedom) = n – 2, with alpha
(α) = 0.05 and if r count is > r table and have a positive value,
then the item of questions or indicator is declared to be valid.
b. Reliability Test
According to Cooper and Schindler (2006:716) reliability test
is a characteristics of measurement concerned with accuracy,
precision and consistency, a necessary but not sufficient condition
for validity or if the measure is not reliable it cannot be valid.

44
According to Ghozali (2013:47) reliability test is a tool to
measure a questionairre, and there is an indicator of a variable or
construct. A questionairre is said to be reliable, if the answer of a
certain person toward the statement is consistent or stable over the
time.
According to Ghozali (2013:48) the requirements of
reliability test is by one shot or measuring the correlation between
the statements of responses and calculated the cronbach alpha (α)
= 0.07 statistical test. Then a variabel is said to be reliable, if the
cronbach alpha is > 0.70.
2. Classic Assumption
A good regression model must meet the classical assumptions. The
fulfillment of this classical assumption, has a purpose that in doing the
regression model did not find any statistical problems and the resulting
regression model can meet the statistical standards. So, the parameters
can be obtained logical and reasonable. (Gani et al., 2015: 123).
There are three basic assumption, that researchers used for this
thesis:
a. Normality Test
According to Hamdi et, al (2014:114) normality test is one
part of the data analysis requirements or the classical assumption
test which is mean before doing a real analysis, the data research

45
should be tested have a normal distribution. Normality test is aims
to test whether the data research carried out has a normal
distribution or not. Basic decision making in the normality test
that is if the significance value > 0.05 then the data is normally
distributed. Conversely, if the significance value < 0.05 then the
data is not normally distributed.
According to Ghozali (2013:154) normality test is aim to test
whether in the regression model, there are an intruder or residual
variable that has a normal distribution. In the t test and F test
assumed that the residual score follow the normal distribution.
According to Ghozali (2013:154) here in below, there are two
ways about how to take a decision and measure about the
normality test :
1) Graph Analysis
Graph analysis consist of P – Plot and Histogram. First,
the requirements of normal P – Plot is : if the data spread
around a diagonal line or histogram, then it shows that the
patterns have a normal distribution and meet the
normality assumptions. Second, the requirements of
histogram is : if the data give the distribution pattern
which skewness is pointed to the right. Then, it shows
that the data have a normal distribution and meet the
normality assumptions. (Ghozali,2013:156).

46
2) Statistical Analysis
Statistical analysis consist of Kolmogorov Smirnov (K-S)
of Non – Parametric Test. The requirements of One
Sample Kolmogorov-Smirnov (K-S) Test is : if the data
have a significant probability or Asym. Sig. (2-tailed)
value is > 0.05 then H0 accepted and data can be normally
distributed. Then, if the data have a significant probability
or Asym. Sig. (2-tailed) value is < 0.05 then H0 rejected
and data can not be normally distributed.
(Arifin,2017:122).
b. Multicollinearity Test
According to Ghozali (2013:103) multicollinearity aims to
test whether the regression model found there is a correlation
between independent variables. A good regression model should
not be correlated between independent variables. If independent
variables are correlated, these variables are not orthogonal. The
orthogonal variable is an independent variable whose correlation
value among fellow independent equals zero. Then, to know the
value of multicolinearity can be seen from the value of tolerance
and the opponent VIF (Variance Inflation Factor). Both of these
measures show each independent variable which is explained by
other independent variables. In a simple way, every independent
variable becomes a dependent variable and is re-created against

47
other independent variables. Tolerance measures the variability of
selected independent variables that are not explained by other
independent variables. Thus, a low tolerance value equals a high
VIF value because (VIF = 1 / Tolerance). The common cutoff
value used to indicate the presence of multicolinearity is the
tolerance value ≤ 0.1 or equal to the VIF value ≥ 10. Thus, if the
VIF value <10 and tolerance value > 0.1 then the regression
model is free from multicolinearity.
c. Heteroscedasticity Test
According to Umar (2011:179) heteroscedasticity was
performed to find out whether in a regression model the variance
inequality of the residue of an observation to another observation
occurred.
According to Ghozali (2013:134) heteroscedasticity test is
aim to test whether in the regression model there is a variance
inequality, from one observation to another. A good regression
model, which is homoscedasticity or does not occur
heteroscedasticity.
According to Ghozali (2013:134) to detect the
heteroscedasticity in the variable is by looking the graphic plot
between the predicted value of the dependent variable ZPRED
and its residual ZRESID. Then, see whether or not there is a
particular pattern on the scatterplot graph between SRESID and

48
ZPRED. Where the Y axis, is the Y predicted, and the X axis is
the residual (Y prediction - Y actually) that has been studentized.
According to Ghozali (2013:134) to measure the
heteroscedasticity test is used graph analysis such as : Scatterplot
and Glejser Test.
1) Scatterplot
According to Ghozali (2013:134) the requirement of
scatterplot: if there is a particular pattern and regular basis
such as forming of the wavy, wide and narrows, then
indicated that there had been heteroscedasticity. If there is
no clear pattern as well as the spots spread under and
below the 0 rate on the Y axis, then indicated that there is
no heteroscedasticity.
2) Glejser Test
According to Ghozali (2013:137) the requirements of
glejser test : if the independent variable is statistically
significant affect the dependent variable of absolute
value, then this indicates that there is a heteroscedasticity.
Next, if there are not any independent variable is
statistically significant affect the dependent variable of
absolute value, then this indicates that there is no
heteroscedasticity. In addition, the significance level >

49
0.05 it can be concluded that the regression model does
not contain any heteroscedasiticity.
3. Hypothesis Test
According to Bajpai (2009:308) hypothesis testing is a well
defined procedure which help to decide objectively whether to accept
or reject the hypothesis based on the information available from the
sample.
a. Partially Test (t-test)
According to Widarjono (2010:25) t test is used to prove
whether the independent variable individually influences the
dependent variable.
In this research two tailed test will be used as the hypothesis
of t-test. Because, two tailed test is contain the rejection region on
both the tails of the sampling distribution of a test statistic. This
means will reject the null hypothesis if the computed sample
statistic is significantly higher than or lower than the
hypothesized population parameter (considering both the tails,
right as well as left). (Bajpai,2009:311).
According to Widarjono (2010:26) the step procedure in
doing the t test are :

50
First, making the null hypothesis (Ho) and alternative hypothesis
(Ha) for two tailed test, as follows :
Ho : β1 = 0
Ha : β1 ≠ 0
Second, looking for a critical t value from the Df of t-table
distribution, counted the Df and choose the alpha (α). Then,
counted the Df with the formula : Df = n-k-1 and choose the
(95%) two tailed test alpha (α) = 0.025 from the (90%) one tailed
test (α) 0.05/2 = 0.025. (Arifin,2017:162). Where Df = Degree of
Freedom, n = total of sample, k = total of independent variable.
(Rangkuti, 2011:146). Then, looked at the results on the table
below :
Table 3.2
Df of t – Table
df1
1 tailed (90%)
0.05
2 tailed (95%)
0.025
df2
144
145
146
1.6555
1.6554
1.6554
1.9766
1.9765
1.9763
Source : Ghozali (2013:464)

51
Third, comparing the value of t arithmetics and the value of t
critical with the decision to accept or reject the null hypothesis
(Ho), as follows :
If the value of t arithmetic > value of t critical (table), then Ho
rejected or Ha accepted
If the value of t arithmetic < value of t critical (table), then Ho
accepted or Ha rejected
b. Simultaneously Test (F-test)
According to Widarjono (2010:22) F test is used to evaluate
the effect of all the independent variables toward the dependent
variables.
According to Widarjono (2010:23) the step procedure in
doing the F test are :
First, making the null hypothesis (Ho) and alternative hypothesis
(Ha), as follows :
Ho : β1 = β2 = ... = βk = 0
Ha : β1 ≠ β2 ≠ ... ≠ βk ≠ 0
Second, looking for a critical F value from the Df of F-table
distribution, counted the Df, choose the alpha (α) and choose the
total of independent variable (k). Then, counted the Df with the
formula : Df = n-k-1 and choose the (95%) two tailed test alpha
(α) = 0.025 from the (90%) one tailed test (α) 0.05/2 = 0.025.
(Arifin,2017:162). Where Df = Degree of Freedom, n = total of

52
sample, k = total of independent variable. (Rangkuti, 2011:146).
Then, looked at the results on the table below :
Table 3.3
Df of F - Table
Source : Kurniawan (2008:24)
Third, comparing the value of F arithmetics and the value of F
critical with the decision to accept or reject the null hypothesis
(Ho), as follows :
If the value of F arithmetic > value of F critical (table),
then Ho rejected it means that all together the independent
variables affect the dependent variable.
If the value of F arithmetic < value of F critical (table),
then Ho accepted it means that all together the independent
variables do not affect the dependent variable.
4. Multiple Linier Regression
According to Arifin (2017:156) in multiple linear regression,
there are one dependent variable and two or more independent
variables. Multiple linear regression is widely used, because many
df1 3 4 5
df2
145
2.667
2.434
2.276

53
variables that need to be analyzed. In addition to the more relevant use,
the analysis is necessary to know the direction of the relationship
(positive or negative) between the independent variables with the
dependent variable.
Methods of analysis to be used by the researchers is multiple
linier regression. In here, the researchers want to know that the
purchase of medicine by consumers, will have an effect directly or
indirectly about the factors of product quality, product availability,
brand image and brand trust on purchasing decisions.
According to Gani et al., (2015:145) the regression model that is
formed is:
Y = α + β1X1 + β2X2 + β3X3 + β4X4 + ε
Where :
Y = Purchase Decision
X1 = Product Quality
X2 = Product Availability
X3 = Brand Image
X4 = Brand Trust
α = Constants
β1, β2, = The regression coefficient
β, β4 of each variable
ε = Error term

54
5. Coefficient Determination (R2)
According to Gani et al., (2009:142) the coefficient of
determination (R2) for multiple regression is a number that specifies
the proportion (percentage), about the variation of the dependent
variable values (Y), which is determined by the variation of the values
of all variables independent (X).
According to Ghozali (2013:95) the coefficient of determination
measures how far the ability of the model, in explaining the variation
of the dependent variable. The coefficient of determination is between
0 and 1. A value that close to 1, have a meaning that independent
variables provide almost all the information needed, to predict the
dependent variables.
According to Gujarati (1995:208) and Kuncoro (2003:221) in
Ferdinand (2013:243) the Adjusted R Square (R2) will increase or
decrease when an independent variables are added to the model. In
general, if an additional of the independent variable is a good
predictor it causes the variance of value and the Adjusted R Square
(R2) value will increase. Preferably, if an additional new variables is
not a good predictor it means the variance of value and the Adjusted R
Square (R2) value will decrease.

55
E. Research Operational Variable
According to Zulganef (2008:84) operationalization of variables is
an activity or process that the researchers do to reduce the level of
abstraction concept, and then the concept can be measured.
This research has two of variables, there are : independent variable
and dependent variable. In below will be explained the details :
1. Independent Variable (X)
According to Sujarweni (2014:86) independent variable is the
variable that influences or causes the change or the incidence of the
dependent variable. Independent variables in this research are :
a. Product Quality (X1)
b. Product Availability (X2)
c. Brand Image (X3)
d. Brand Trust (X4)
2. Dependent Variable (Y)
According to Sujarweni (2014:86) dependent variable is an
influenced or effect variable, because of the independent variables.
Dependent variable in this research is :
e. Purchase Decision (Y)

56
Table 3.4 Operational Variable
Variabel Dimension Indicator Scale
Product Quality
(X1)
(Garvin, 1996 in Arif,
2016) and
(Garvin,1984)
Performances
1. Suitability with main
function of the
product
Likert
Features
2. The unique
characteristics of the
product which
distinguished from the
other products
Likert
Reliability
3. Possibility of a
product working
satisfactorily
Likert
Conformance
4. The characteristics of
design product met
the standard
Likert
Durability
5. The endurance life of
a product
Likert
Serviceability
6. Ease in obtaining
components of a
product
Likert
Aesthetics
7. Taste of a product
8. Smell of a product
Likert

57
Variabel Dimension Indicator Scale
Perceptions
9. Consumer fanaticism
about the brand of a
particular product
because of the
product image
Likert
Product Availability
(X2)
(Kamath, 2016) and
(Hawkins et.al, 2001)
On Shelf
Availability
10. Product available for
sale to a shopper
Likert
Out Of Stock
(Stockout)
11. The store being
temporarily out of a
particular brand
(Reverse Coding)
Likert
Brand Image
(X3)
(Shimp,2003),
(Aaker (1991) in
Zickerman,2014),
(Keller (1998) in
Zickermann 2014),
(Keller (1993) in
Zickerman,2014),
Attributes
12. Price
13. Packaging
14. User
15. Usage Imagery
Likert
Benefits
16. Functional benefits
17. Experience benefits
18. Simbolic benefits
Likert

58
Variabel Dimension Indicator Scale
(Tybout,2010),
(Verma,2002),
(Chitale,2013)
(Lantos,2015)
(Shimp and
Andrews,2013)
Overall
Evaluation
19. Attitude towards
favorability of the
brand
20. Attitude towards
unfavorability of the
brand
(Reverse Coding)
Likert
Brand Trust
(X4)
(Reast,2005)
and
(Lasmadiarta,2010)
Credibility
21. Build a trust of
product benefits
Likert
Performance
Satisfaction
22. Customer
expectations of the
brand and its products
have been met
Likert
Purchase Decision
(Y)
(Sunyoto, 2013)
Type of
Product
23. Consumers can take
the decision to buy a
product.
Likert
Product Form
24. Size of product
25. Quality of product
26. Appearance of
product
Likert

59
Variabel Dimension Indicator Scale
The Brand 27. What brand to buy Likert
The Seller 28. Where to buy the
product
Likert
Amount of
Product
29. How many product to
buy at a time
Likert
Time of
Purchase
30. When to make a
purchase
Likert
Payment of
Product
31. Method payment of
purchase the product
in cash
Likert
60
CHAPTER IV
ANALYSIS AND DESCRIPTIONS
A. Overview of Research Objects
1. History of Sidomuncul Development
The beginning of the Company’s traditional herbal medicine
industry was started in 1940 as a home industry managed by Mrs.
Rahmat Sulistio in Yogyakarta, who was assisted by three employees.
The high demand or more practical packaging of traditional herbal
medicines encouraged her to produce traditional herbal medicines in a
more practical form (powder). In line with the Company’s progress,
the processing of traditional herbal medicines was moved from
Yogyakarta to Semarang. (Sidomuncul Annual Report,2013:20).
In 1951, a small company was established under the name Sido
Muncul which has the meaning of “ Dream Comes True” with its first
factory located at Jl. Mlaten Trenggulun, Semarang. (Sidomuncul
Annual Report,2016:15).
2. Form of Business Entities
In 1970, a limited partnership was established under the name
CV Industri Jamu & Farmasi Sido Muncul. Subsequently, in 1975, the
business form of this traditional herbal medicine industry was changed
into the Limited Liability Partnership under the name PT Industri Jamu
& Farmasi Sido Muncul, in which all businesses and assets of CV

61
Industri Jamu & Farmasi Sido Muncul were incorporated into and
continued by the limited liability company. (Sidomuncul Annual
report,2016:15).
3. History of Sidomuncul Development Abroad
The Company’s marketing strategy does not only focus on
domestic, but also international market. The strategic objective is to
introduce safe, cheap and back to nature herbal products to the
international consumers. (Sidomuncul Annual Report,2016:93).
Beside that, the product must give good quality, and popular in
order to be sold in the domestic market, then it can be brought abroad.
For product Tolak Angin from PT. Sidomuncul itself can be exported
to several continents such as Asia, Europe, America and the Middle
East. That's because there are already some exporters who know or
realize the presence of products Tolak Angin from PT. Sidomuncul.
Most of them usually ask to export Sidomuncul products to their
overseas stores or some buy their own, then sell them to their stores,
which are abroad. (According to Arini in SWA.co.id,2014).
4. Vission and Mission of Sidomuncul
a. Vission
To become a leading herbal medicine, health food and drinks, and
herbal ingredient processing company which can benefit the
community and environment.

62
b. Mission
1) To develop rational, safe and honest herbal-based products
based on research.
2) To continuously develop research in herbal medicines.
3) To assist and encourage the government, education institutions,
and medical sector to play a more important rolein research and
development of herbal medicines and medication.
4) To increase community awareness of them importance of
maintaining health through healthy living pattern, use of natural
substances, and naturopathy medication.
5) To implement intensive corporate social responsibility (CSR).
6) To manage an environmental-oriented company.
7) To become a world class herbal medicine company.
B. Descriptive Results of the Respondent
The respondent in this research were the customer who ever
consume and buy the product of Tolak Angin Liquid. The total
respondents is about 150 people, in a directly through the questionairrre.
Data results of the respondent are based on the gender, place to bought,
age, occupation and income.
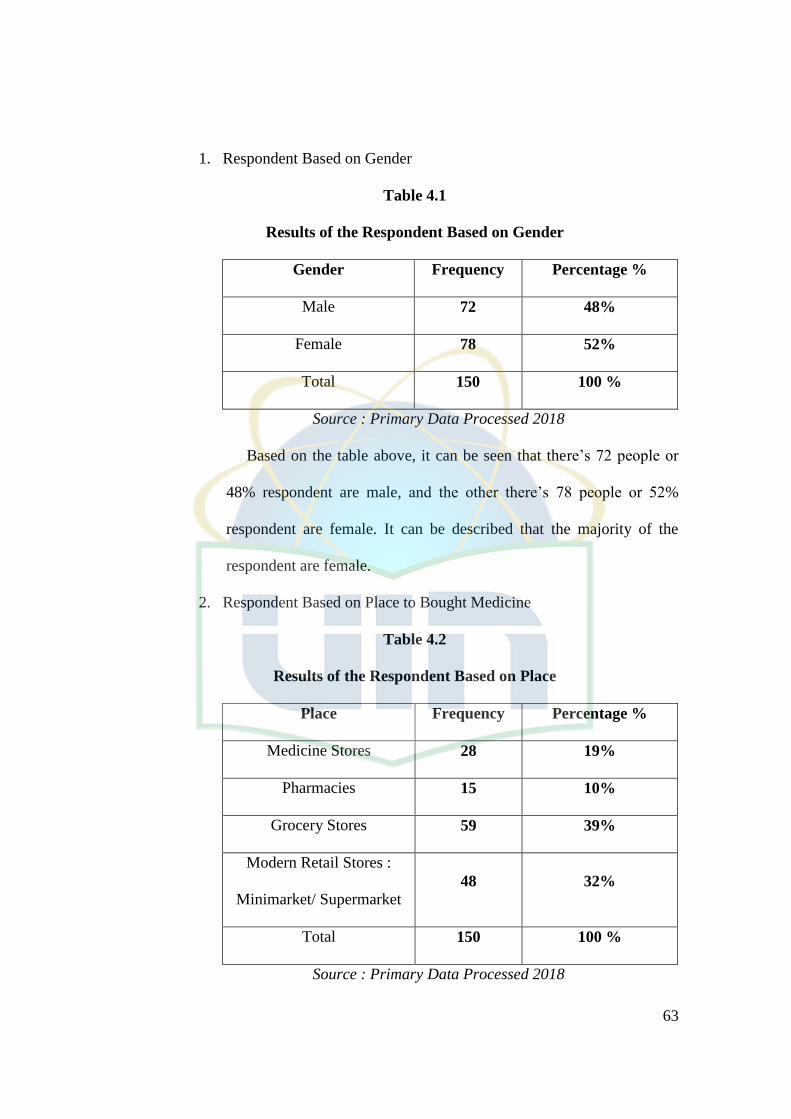
63
1. Respondent Based on Gender
Table 4.1
Results of the Respondent Based on Gender
Gender Frequency Percentage %
Male 72 48%
Female 78 52%
Total 150 100 %
Source : Primary Data Processed 2018
Based on the table above, it can be seen that there’s 72 people or
48% respondent are male, and the other there’s 78 people or 52%
respondent are female. It can be described that the majority of the
respondent are female.
2. Respondent Based on Place to Bought Medicine
Table 4.2
Results of the Respondent Based on Place
Place Frequency Percentage %
Medicine Stores 28 19%
Pharmacies 15 10%
Grocery Stores 59 39%
Modern Retail Stores :
Minimarket/ Supermarket 48 32%
Total 150 100 %
Source : Primary Data Processed 2018

64
Based on the table above, it can be known that 150 respondent ever
bought Tolak Angin Liquid consist of : 28 people or 19% respondent
are bought in Medicine Stores, 15 people or 10% respondent are
bought in Pharmacies, 59 people or 39% respondent are bought in
Grocery Stores and 48 people or 32% respondent are bought in
Modern Retail Stores : Minimarket/Supermarket. It can be described
that the majority of the respondent are bought the Tolak Angin Liquid
in the Grocery Stores.
3. Respondent Based on Age
Table 4.3
Results of the Respondent Based on Age
Age Frequency Percentage %
< 20 years old 25 17%
20 – 35 years old 34 23%
36 – 50 years old 79 52%
> 50 years old 12 8%
Total 150 100 %
Source : Primary Data Processed 2018
Based on the table above, it can be known that 150 respondent ever
bought Tolak Angin Liquid consist of : 25 people or 17% respondent
are attain the age of < 20 years old, 34 people or 23% respondent are
attain the age of 20 – 35 years old, 79 people or 52% respondent are
attain the age of 36 – 50 years old and 12 people or 8% respondent are

65
attain the age of > 50 years old. It can be described that the majority
of the respondent are attain the age of 36 – 50 years old.
4. Respondent Based on Occupation
Table 4.4
Results of the Respondent Based on Occupation
Occupation Frequency Percentage %
Students 42 28%
Employee 25 17%
Government Civil Worker 51 34%
Entrepreneur 12 8%
Others 20 13%
Total 150 100 %
Source : Primary Data Processed 2018
Based on the table above, it can be known that 150 respondent ever
bought Tolak Angin Liquid consist of : 42 people or 28% respondent
are metier as a students, 25 people or 17% respondent are metier as a
employee, 51 people or 34% respondent are metier as a government
civil worker, 12 people or 8% respondent are metier as an
entrepreneur and 20 people or 13% respondent are metier the others. It
can be described that the majority of the respondent are metier as a
government civil worker..

66
5. Respondent based on Income
Table 4.5
Results of the respondent based on income
Occupation Frequency Percentage %
< Rp. 1.000.000 43 29%
Rp. 1.000.000 –
Rp. 1.500.000 14 9%
> Rp. 1.500.000 –
Rp. 2.000.000 15 10%
> Rp. 2.000.000 78 52%
Total 150 100 %
Source : Primary Data Processed 2018
Based on the table above, it can be known that 150 respondent ever
bought Tolak Angin Liquid consist of : 43 people or 29% respondent
have earned < Rp. 1.000.000, 14 people or 9% respondent have earned
Rp. 1.000.000 – Rp. 1.500.000, 15 people or 10% respondent have
earned > Rp. 1.500.000 – Rp. 2.000.000 and 78 people or 52%
respondent have earned > Rp. 2.000.000. It can be described that the
majority of the respondent have earned > Rp. 2.000.000.

67
C. Result of Validity Test and Reliability Test
1. Validity Test
The valid questionairre data was obtained from direct
questionairres which distributed to the people living in Navy Resident,
Jonggol who had bought and consumed Tolak Angin Liquid.
Based on the requirements for validation test, things are done by :
calculated the df (degree of freedom) = n – 2, with cronbach alpha (α)
= 0.05% and compare with the r table with the r arithmetics. In this
research, the results are obtained from df = 30 – 2 = 28. Then, on r
table it appears that the cronbach alpha (α) = 0.05 % with the df = 28
obtained a value of r arithmetics is 0.361. So, the ratio of r value to
table with r arithmetics is if r arithmetics 0.361 > r table and have a
positive value, then the item of questionairre is declared to be valid.
Here in below, is the results of calculations for validity test :
Table 4.6
Try Out Results of : Validity Test
Product Quality (X1)
No Item of Statement r Arithmetics r Table Results
1 Product Quality 0.450 0.361 VALID
2 Product Quality 0.465 0.361 VALID
3 Product Quality 0.652 0.361 VALID
4 Product Quality 0.787 0.361 VALID
5 Product Quality 0.770 0.361 VALID

68
Product Quality (X1)
No Item of Statement r Arithmetics r Table Results
6 Product Quality 0.676 0.361 VALID
7 Product Quality 0.512 0.361 VALID
8 Product Quality 0.523 0.361 VALID
9 Product Quality 0.387 0.361 VALID
Source : Primary Data Output SPSS 20
Based on the table above, the seven item statement of product
quality it can be seen that all of the results are valid, because the total
item of correlation are more than 0.361.
Table 4.7
Try Out Results of : Validity Test
Product Availability (X2)
No Item of Statement r Arithmetics r Table Results
10 Product Availability 0.749 0.361 VALID
11 Product Availability 0.860 0.361 VALID
Source : Primary Data Output SPSS 20
Based on the table above, the one item statement of product
availability it can be seen that all of the results are valid, because the
total item of correlation are more than 0.361.

69
Table 4.8
Try Out Results of : Validity Test
Brand Image (X3)
No Item of Statement r Arithmetics r Table Results
12 Brand Image 0.454 0.361 VALID
13 Brand Image 0.579 0.361 VALID
14 Brand Image 0.705 0.361 VALID
15 Brand Image 0.787 0.361 VALID
16 Brand Image 0.766 0.361 VALID
17 Brand Image 0.420 0.361 VALID
18 Brand Image 0.460 0.361 VALID
19 Brand Image 0.696 0.361 VALID
20 Brand Image 0.566 0.361 VALID
Source : Primary Data Output SPSS 20
Based on the table above, the seven item statement of brand image
it can be seen that all of the results are valid, because the total item of
correlation are more than 0.361.
Table 4.9
Try Out Results of : Validity Test
Brand Trust (X4)
No Item of Statement r Arithmetics r Table Results
21 Brand Trust 0.698 0.361 VALID
22 Brand Trust 0.696 0.361 VALID
Source : Primary Data Output SPSS 20

70
Based on the table above, the two item statement of brand trust it
can be seen that all of the results are valid, because the total item of
correlation are more than 0.361.
Table 4.10
Try Out Results of : Validity Test
Purchase Decision (Y1)
No Item of Statement r Arithmetics r Table Results
23 Purchase Decision 0.493 0.361 VALID
24 Purchase Decision 0.802 0.361 VALID
25 Purchase Decision 0.721 0.361 VALID
26 Purchase Decision 0.662 0.361 VALID
27 Purchase Decision 0.699 0.361 VALID
28 Purchase Decision 0.860 0.361 VALID
29 Purchase Decision 0.617 0.361 VALID
30 Purchase Decision 0.568 0.361 VALID
31 Purchase Decision 0.572 0.361 VALID
Source : Primary Data Output SPSS 20
Based on the table above, the nine item statement of product
quality it can be seen that all of the results are valid, because the total
item of correlation are more than 0.361.
2. Reliability Test
According to Ghozali (2013:47) reliability test is a tool to measure
a questionairre and there is an indicator of a variable.

71
Variable of a questionairre is said to be reliable if the value of
cronbach alpha (α) is > 0.70. (Ghozali,2013:48). Here in below, is the
results of calculations for reliability test :
Table 4.11
Try Out Results of : Reliability Test
No Variabel Cronbach
Alpha
(α)
N
of
Items
Results
1 Product Quality
(X1)
0.837 9 RELIABLE
2 Product Availability
(X2)
0.919 2 RELIABLE
3 Brand Image
(X3)
0.852 9 RELIABLE
4 Brand Trust
(X4)
0.937 2 RELIABLE
5 Purchase Decision
(Y1)
0.892 9 RELIABLE
Source : Primary Data Output SPSS 20
Based on the table above, all of the variable such as product
quality, product availability, brand image, brand trust and purchase
decision are reliable because the cronbach alpha is > 0.70.

72
D. Results of Descriptive Analysis
Here, in below the author will give an explanation about the people
opinions towards 31 the questionairre statement and also the percentages
from the 150 respondents.
1. Product Quality (X1)
Variable X1 in this research can be measured by the 9 statements
that distributed to the 150 respondents. Here is the opinions results:
Table 4.12
The Statement Results of The Respondent
about Product Quality
No Statements SD D NA/ND A SA
1 Tolak Angin Liquid has
the main function to
help overcome the
symptoms of Masuk
Angin, such as :
nausea, bloating, body
fever, dizziness,
abdominal pain and dry
throat.
0% 0% 0% 39% 61%
2 Tolak Angin Liquid
product has a sugar free
variant.
0% 0% 0% 53% 47%

73
No Statements SD D NA/ND A SA
3 Tolak Angin Liquid
proved to cure the
trapped wind (Masuk
Angin), nausea and
bloating.
0% 0% 0% 44% 56%
4 Tolak Angin Liquid has
a design product that
meet the standard of
BPOM.
0% 0% 0% 49% 51%
5 The feasibility of Tolak
Angin Liquid product
to be consumed, can be
known through the
expiry date.
0% 0% 0% 44% 56%
6 Tolak Angin Liquid is
easy to get in Medicine
Stores, Pharmacies,
Grocery Stores &
Modern Retail Stores.
0% 0% 0% 35% 65%

74
No Statements SD D NA/ND A SA
7 Tolak Angin Liquid has
a mint flavor which the
most favorite.
0% 1% 0% 48% 51%
8 Tolak Angin Liquid has
a distinctive odor
aromatic.
0% 0% 0% 43% 57%
9 Tolak Angin Liquid has
a strong perception in
the minds of consumers
that only smart people
who can drink the
Tolak Angin medicine.
0% 5% 0% 54% 41%
TOTAL 0% 6% 0% 409% 485%
Based on the data above, in product quality variable can be
seen that majority of the respondent have an answer “SA” and the
results is 485%. Then, items statements that get the positive value
is statement number 6 from the total result is 65%.

75
2. Product Availability (X2)
Variable X2 in this research can be measured by the 2 statements
that distributed to the 150 respondents. Here is the opinions results:
Table 4.13
The Statement Results of The Respondent
about Product Availability
No Statements SD D NA/ND A SA
1 Tolak Angin Liquid are
available at the right
place and at the right
time to be purchased.
0% 3% 0% 39% 58%
2 Tolak Angin brand
temporarily is
unavailable in the
stores.
(reverse coding)
0% 1% 0% 41% 58%
TOTAL 0% 4% 0% 80% 116%
Based on the data above, in product availability variable
can be seen that majority of the respondent have an answer “SA”
and the results is 116%. Then, items statements that get the
positive value is all statements from the total result is 58%.

76
3. Brand Image (X3)
Variable X3 in this research can be measured by the 9 statements
that distributed to the 150 respondents. Here is the opinions results:
Table 4.14
The Statement Results of The Respondent about Brand
Image
No Statements SD D NA/ND A SA
1 Tolak Angin Liquid
has a high price.
0% 2% 0% 67% 31%
2 Tolak Angin Liquid
has a yellow
rectangular
packaging.
0% 0% 0% 47% 53%
3 Tolak Angin Liquid
consumed by the
public, celebrities and
academic leaders.
0% 0% 0% 45% 55%
4 Tolak Angin Liquid
can be drunk during
the rainy season.
0% 0% 0% 41% 59%
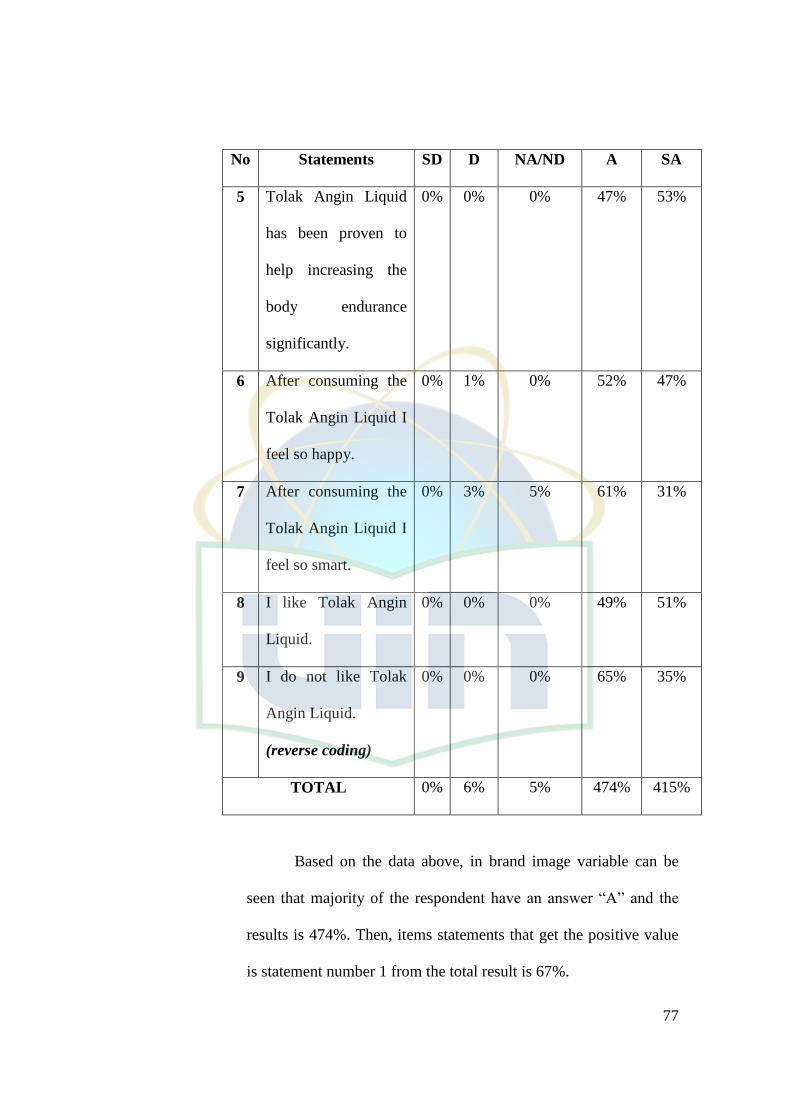
77
No Statements SD D NA/ND A SA
5 Tolak Angin Liquid
has been proven to
help increasing the
body endurance
significantly.
0% 0% 0% 47% 53%
6 After consuming the
Tolak Angin Liquid I
feel so happy.
0% 1% 0% 52% 47%
7 After consuming the
Tolak Angin Liquid I
feel so smart.
0% 3% 5% 61% 31%
8 I like Tolak Angin
Liquid.
0% 0% 0% 49% 51%
9 I do not like Tolak
Angin Liquid.
(reverse coding)
0% 0% 0% 65% 35%
TOTAL 0% 6% 5% 474% 415%
Based on the data above, in brand image variable can be
seen that majority of the respondent have an answer “A” and the
results is 474%. Then, items statements that get the positive value
is statement number 1 from the total result is 67%.

78
4. Brand Trust (X4)
Variable X4 in this research can be measured by the 2 statements
that distributed to the 150 respondents. Here is the opinions results:
Table 4.15
The Statement Results of The Respondent
about Brand Trust
No Statements SD D NA/ND A SA
1 I get the benefit after
drinking Tolak Angin
Liquid.
0% 2% 0% 41% 57%
2 Tolak Angin Liquid has
a good quality product
as expected.
0% 1% 0% 44% 55%
TOTAL 0% 3% 0% 85% 112%
Based on the data above, in brand trust variable can be seen
that majority of the respondent have an answer “SA” and the
results is 112%. Then, items statements that get the positive value
is statement number 1 from the total result is 57%.

79
5. Purchase Decision (Y)
Variable Y in this research can be measured by the 9 statements
that distributed to the 150 respondents. Here is the opinions results:
Table 4.16
The Statement Results of The Respondent
about Purchase Decision
No Statements SD D NA/ND A SA
1 Types of Tolak Angin
product that I bought was
Tolak Angin Liquid.
0% 3% 0% 54% 43%
2 Tolak Angin Liquid has a
customized size.
0% 0% 0% 57% 43%
3 Tolak Angin Liquid has a
pharmaceutical standard
quality.
0% 1% 0% 50% 49%
4 Images of traditional
medicinal herbs and red
and white flags dominate
the product display of the
Tolak Angin Liquid.
0% 0% 0% 48% 52%

80
No Statements SD D NA/ND A SA
5 Brand of trapped wind
(Masuk Angin) medicine
that I always bought when
I have trapped wind
(Masuk Angin) is Tolak
Angin Sidomuncul.
0% 0% 0% 56% 44%
6 Tolak Angin Liquid can be
purchased at Medicine
Stores, Pharmacies,
Grocery Stores and
Modern Retail Stores.
0% 0% 1% 50% 49%
7 When I have trapped wind
(Masuk Angin) usually I
bought trapped wind
(Masuk Angin) medicine
from Tolak Angin
Sidomuncul brand more
than one sachet.
0% 2% 1% 52% 45%
8 I will buy Tolak Angin
Liquid when I am sick and
when I want to travel.
0% 1% 0% 49% 50%

81
No Statements SD D NA/ND A SA
9 Payment method that I
used when bought trapped
wind (Masuk Angin)
medicine from Tolak
Angin Sidomuncul brand is
by cash.
0% 0% 0% 46% 54%
TOTAL 0% 7% 2% 462% 429%
Based on the data above, in purchase decision variable can
be seen that majority of the respondent have an answer “A” and the
results is 462%. Then, items statements that get the positive value
is statement number 2 from the total result is 57%.

82
E. Classic Assumptions
1. Normality Test
According to Ghozali (2013:154) to measure the normality test is
used graph analysis such as : P – Plot, Histogram and also statistics
analysis such as : One Sample Kolmogorov – Smirnov.
Figure 4.1
Normal P – Plot of Purchase Decision
Source : Primary Data Output SPSS 20
Based on the figure above, it shows that the data is spread around
the diagonal line. It means that the data have a normal distribution and
the regression model is meet the normality assumptions.

83
Figure 4.2
Histogram of Purchase Decision
Source : Primary Data Output SPSS 20
Based on the figure above, it shows that the histogram graph give
the distribution pattern which skewness is pointed to the right. It means
that the data have a normal distribution and the regression model is
meet the normality assumptions.
Figure 4.3
One Sample Kolmogorov – Smirnov Test of Purchase Decision
Source : Primary Data Output SPSS 20

84
Based on the figure above, it shows that the significant probability
or Asymp. Sig. 2-tailed is 0.108 > 0.05. It means that the data is > 0.05,
then H0 accepted. So, the results is the data have a normal distribution
and meet the assumptions sig. 2-tailed of normality test.
2. Multicollinearity Test
According to Ghozali (2013:103) to know the value of
multicolinearity can be seen from the value of tolerance and the VIF.
Figure 4.4
Tolerance and VIF Value
Source : Primary Data Output SPSS 20
According to Ghozali (2013:103) if the VIF value < 10 and
tolerance value > 0.1 then the regression model is free from
multicolinearity. Based on the figure above, the value such as product
quality have a tolerance 0.920 and vif 1.087, product availability have
a tolerance 0.914 and vif 1.094, brand image have a tolerance 0.922
and vif 1.084 and brand trust have a tolerance 0.886 and vif 1.129. It
means that the value of variables can be used in this reseach, because
there is no indication about the existence of multicollinearity between
dependent variable and other independent variable.

85
3. Heteroscedasticity Test
According to Ghozali (2013:133) to measure the heteroscedasticity
test is used graph analysis such as : Scatterplot and Glejser Test.
Figure 4.5
Scatterplot
Source : Primary Data Output SPSS 20
Based on the figure above, it can be seen that the data cannot be
distributed regulary and didn’t formed a some pattern and spread
around in above and below with the zero number in Y axis. It means
that the data, didn’t have an indication about the existence of
heteroscedasticity.

86
Figure 4.6
Glejser Test
Source : Primary Data Output SPSS 20
Based on the figure above, all of the independent variables have a
significant value > 0.05. It consist of product quality have a significant
value 0.504, product availability 0.419, brand image 0.781 and brand
trust 0.557. It means that the value of variables can be used in this
research and there is no indication about the existence of
heteroscedasticity.

87
F. Hypothesis Test
1. Partially Test (t – test)
Figure 4.7
t-Test
Source : Primary Data Output SPSS 20
Based on the figure above, the author can described the t-test with
the step :
a. The Influence of Product Quality (X1) toward the Purchase
Decision (Y)
First, based on the null hypothesis (Ho) and alternative
hypothesis (Ha) :
Ho : β1 = 0 Product Quality does not have a significant
influence toward the purchase decision
Ha : β1 ≠ 0 Product Quality has significant influence toward
the purchase decision
Second, based on the DF of t-table research : the Df = n-k-1 =
195 and alpha (α) two tailed test 0.025 (95%) = 1.9722.
Third, based on the decision to accept or reject the null
hypothesis (Ho) : it can be seen from the Figure 4.7 t-test in above,

88
that the value of t arithmetic (X1) 2.134 > the value of t critical (t-
table) 1.972, then Ho rejected and Ha accepted. It means that the
product quality significantly has an influence toward purchase
decision.
The previous research in this variable, is supported and has
been done by Fatlahah (2013) with entitled “Pengaruh Kualitas
Produk dan Citra Merek terhadap Keputusan Pembelian Es Krim
Wall’s Magnum” stated that more higher the product quality is,
then more higher the purchase decision of Wall’s Magnum Ice
Cream in the Resident of Griya Mapan, Rungkut Surabaya.
Kotler and Armstrong (2008) stated that the better result of
product quality, can make an opportunity for the consumers
decided to make a purchase decision. The results of this research
shows that the positive of product quality in Tolak Angin Liquid
can make an influence toward purchase decision. Then, a good
judgements of product quality that appropiate with the level of
consumer need and wants, will encourage the consumer to make a
purchase decision. This explains that the results of consumer
experience in using the product, will get the judgements results
from the consumer toward the product. If the product can satisfy
the consumer, then the consumer will provide a positive
judgements of the product. With that assesments, then the
consumer will still want to buy the product. (Weenas,2013:616).

89
b. The Influence of Product Availability (X2) toward the Purchase
Decision (Y)
First, based on the null hypothesis (Ho) and alternative
hypothesis (Ha) :
Ho : β2 = 0 Product Availability does not have a significant
influence toward the purchase decision
Ha : β2 ≠ 0 Product Availability has significant influence
toward the purchase decision
Second, based on the DF of t-table research : the Df = n-k-1 =
195 and alpha (α) two tailed test 0.025 (95%) = 1.9722.
Third, based on the decision to accept or reject the null
hypothesis (Ho) : it can be seen from the Figure 4.7 t-test in above,
that the value of t arithmetic (X2) 1.994 > the value of t critical (t-
table) 1.972, then Ho rejected and Ha accepted. It means that the
product availability significantly has an influence toward purchase
decision.
The previous research in this variable, is supported and has
been done by Saragih (2013) with entitled “Pengaruh Kualitas
Produk, Ketersediaan Produk dan Gaya Hidup terhadap
Keputusan Pembelian Produk Lulur Mandi Sumber Ayu di
Jakarta“ stated that the product availability give contribution of
influenced on purchase decision.

90
Siahaya (2015:101) stated that the availability of products
occurs due to market demand that increases beyond estimates.
Then, if a product has a high level of substituability and therefore a
high stockout cost, inventory levels must be adequate to provide
high levels of availability and vice versa. (Coyle et al.,2012). The
results of this research shows that the positive of product
availability in Tolak Angin Liquid can make an influence toward
purchase decision. Then, according to the research of Elen et.,al
(2013) stated that product availability has a positive influence
toward the purchase decision of Cigaro product.
c. The Influence of Brand Image (X3) toward the Purchase
Decision (Y)
First, based on the null hypothesis (Ho) and alternative
hypothesis (Ha) :
Ho : β3 = 0 Brand Image does not have a significant influence
toward the purchase decision
Ha : β3 ≠ 0 Brand Image has significant influence toward the
purchase decision
Second, based on the DF of t-table research : the Df = n-k-1 =
195 and alpha (α) two tailed test 0.025 (95%) = 1.9722.
Third, based on the decision to accept or reject the null
hypothesis (Ho) : it can be seen from the Figure 4.7 t-test in above,
that the value of t arithmetic (X3) 2.795 > the value of t critical (t-

91
table) 1.972, then Ho rejected and Ha accepted. It means that the
brand image significantly has an influence toward purchase
decision.
The previous research in this variable, is supported and has
been done by Indrawati (2015) with entitled “Pengaruh Citra
Merek dan Gaya Hidup Hedonis Terhadap Keputusan Pembelian
Jilbab Zoya“ stated that the brand image has a significance and
positive influence toward purchase decision Zoya hijab in
Surabaya.
Sangadji and Sopiah (2013:338) stated that a positive brand
image, will provides the benefits for producers, in order to be
known by the consumers. In other words, the consumers will
decided the choices to buy a product that has a good image. The
results of this research shows that the positive of brand image in
Tolak Angin Liquid can make an influence toward purchase
decision. Then, according to the research of Kiswalini and
Nurchaya (2014) stated that brand image has a positive influence
toward the purchase decision of Honda Vario Motorcycle in
Denpasar City. It means that if the image of the product is good,
then the consumer will make a purchase toward that product.

92
d. The Influence of Brand Trust (X4) toward the Purchase
Decision (Y)
First, based on the null hypothesis (Ho) and alternative
hypothesis (Ha) :
Ho : β4 = 0 Brand Trust does not have a significant influence
toward the purchase decision
Ha : β4 ≠ 0 Brand Trust has significant influence toward the
purchase decision
Second, based on the DF of t-table research : the Df = n-k-1 =
195 and alpha (α) two tailed test 0.025 (95%) = 1.9722.
Third, based on the decision to accept or reject the null
hypothesis (Ho) : it can be seen from the Figure 4.7 t-test in above,
that the value of t arithmetic (X4) 2.186 > the value of t critical (t-
table) 1.972, then Ho rejected and Ha accepted. It means that the
brand trust significantly has an influence toward purchase decision.
The previous research in this variable, is supported and has
been done by Wilujeng and Edwar (2014) with entitled “Pengaruh
Brand Awareness dan Brand Trust Terhadap Keputusan Produk
Oriflame“ stated that brand trust have simultaneously affect on
purchase decision of consumer Oriflame brand cosmetic products.
Trista et.,al (2013) stated that the trust grows from the belief in
a person's positive judgment toward of a brand, product, company
and others. If the consumers believe that there is a positive value,

93
then the consumers will likely use or decide to make purchases of
the products. The results of this research shows that the positive of
brand trust in Tolak Angin Liquid can make an influence toward
purchase decision. Then, according to the research of Adiwidjaja
and Tarigan (2017) stated that brand trust has a positive and
significant effect toward purchase decision. This indicated, that
increasing the consumer of brand trust toward Converse shoes will
increasing the consumer's tendency to make a purchasing toward
Converse shoes.
e. The Dominant Variable
The dominant variable is the independent variables that have a
greatest influence toward the dependent variables. The dominant
variables can be seen from the partially test (t-test), from the value
of t arithmetics that have a greatest value or influence. Based on
the results from this research, the dominant variable is variable of
brand trust (X4). Because, the value of t arithmetic (X4) 2.186 > the
value of t critical (t-table) 1.972, then Ho rejected and Ha accepted.
It can be found that Tolak Angin Liquid has credibility to build a
trust of product benefits, such as get the benefit after drinking
Tolak Angin Liquid and also has performance satisfaction to met
the expectations of the product and brand, such as Tolak Angin
Liquid has a good quality product as expected.

94
2. Simultaneously Test (F – test)
Figure 4.8
F-Test (ANOVA Table)
Source : Primary Data Output SPSS 20
Based on the figure above, the author can described the F-test with
the step :
a. The Influence of Product Quality (X1), Product Availability
(X2), Brand Image (X3) and Brand Trust (X4) toward the
Purchase Decision (Y).
First, based on the null hypothesis (Ho) and alternative
hypothesis (Ha) :
Ho : β1 = β2 = β3 = β4 = 0 Product Quality, Product
Availability, Brand Image and Brand Trust do not have a
significant influence toward the purchase decision
Ha : β1 ≠ β2 ≠ β3 ≠ β4 ≠ 0 Product Quality, Product
Availability, Brand Image and Brand Trust have a significant
influence toward the purchase decision
Second, based on the DF of t-table research : the Df = n-k-1 =
145, alpha (α) two tailed test 0.025 (95%) = 2.434 and the total
independent in this research is 4.

95
Third, based on the decision to accept or reject the null
hypothesis (H0) : it can be seen from the Figure 4.8 F-test in above,
that the value of F arithmetic 9.206 > the value of F critical (t-
table) 2.434, then H0 rejected. It means that the product quality
(X1), product availability (X2), brand image (X3) and brand trust
(X4) significantly have an influence toward purchase decision (Y).

96
G. Multiple Linier Regression
Figure 4.9
Multiple Linier Regression
Source : Primary Data Output SPSS 20
Based on the figure above, the data from the multiple linear regression
can be formed as :
Y = α + β1X1 + β2X2 + β3X3 + β4X4 + ε
Source : (Gani et al., 2015:145)
Y = 11.844 + 0.189 X1 + 0.530 X2 + 0.244 X3 + 0.663 X4
So, the conclusion are variable of brand trust (X4) and product
availability (X2) has the greatest and positive influence toward purchase
decision. It can be seen from the coefficient variable value of brand trust
β4X4 is 0.663 and the coefficient variable value of product availability β2X2
is 0.530.

97
H. Coefficient Determination (R2)
Coefficient Determination (R2) is about to measured how far the
ability in the model can explain the variant of the dependent variable. The
small value of R2 it means, the ability of independent variables in
explaining the variant of dependent variables is limited. (Puspitasari and
Santoso, 2013:7). According to Cohen in Wuensch (2009:2) the size effect
from R2
value is : first, if 0.12 or below indicated have the low value
effect size, second, if between 0.13 to 0.25 indicated have the medium
value effect size and third, if 0.26 or above indicated have the high value
effect size.
Besides that, according to Gujarati (1995:208) and Kuncoro
(2003:221) in Ferdinand (2013:243) the Adjusted R Square (R2) will
increase or decrease when an independent variables are added to the
model. In general, if an additional of the independent variable is a good
predictor it causes the variance of value and the Adjusted R Square (R2)
value will increase. Preferably, if an additional new variables is not a good
predictor it means the variance of value and the Adjusted R Square (R2)
value will decrease.

98
Figure 4.10
Coefficient Determination (R2)
Source : Primary Data Output SPSS 20
Based on the results of data processing using SPSS 20 Software, it can
be seen on the figure in above that the data interpretation are:
1. Based on the results, the R value is 0.450 or 45%. It showed that the
correlation of 45% have the strong enough influence between the
dependent variable with the independent variable. Then, according to
Rachmayanti and Ady (2018:38) the R value of 0.419 or 41,9% have
the strong enough correlation toward the purchase decision.
2. Based on the results, the R Square value is 0.203 or 20,3%. It showed
that the correlation have the medium effect in influencing between the
dependent variable with the independent variable. Then, according to
Cohen in Wuensch (2009:2) the size effect from R2
value is if between
0.13 to 0.25 indicated have the medium value effect size.
3. Based on the results, the Adjusted R Square (R2) value is 0.181 or
18.1%. It showed that the influence of independent variable such as
product quality (X1), product availability (X2), brand image (X3) and
brand trust (X4) toward dependent variable such as purchase decision
(Y) only be able to explained the variant value is 18.1% then, have

99
the lowest value. Also, the remaining is 81.9% (100%-18.1%)
explained by the other factors except the variables studied in this
research.

100
CHAPTER V
CONCLUSION AND RECOMMENDATION
A. Conclusion
This research have a purpose to know the influence of product
quality, product availability, brand image and brand trust toward purchase
decision. The total of respondent is 150 people that bought Tolak Angin
Liquid.
Based on the data that have been collected and measured toward the
problems with the method of multiple linier regression, so it can have a
conclusion such as :
1. The Influence Variable of Product Quality toward Purchase
Decision
Based on the partially test, product quality significantly has an
influence toward purchase decision.
2. The Influence Variable of Product Availability toward Purchase
Decision
Based on the partially test, product availability significantly has an
influence toward purchase decision.

101
3. The Influence Variable of Brand Image toward Purchase
Decision
Based on the partially test, brand image significantly has an
influence toward purchase decision.
4. The Influence Variable of Brand Trust toward Purchase
Decision
Based on the partially test, brand trust significantly has an influence
toward purchase decision.
5. The Influence of Simultaneously between Variable of Product
Quality, Product Availability, Brand Image and Brand Trust
toward Purchase Decision
Based on the simultaneously test, product quality, product
availability, brand image and brand trust significantly have an
influence toward purchase decision.

102
B. Recomendation
Based on this research, the author wants to give some recomendation
that will be explain in below :
1. For Company
Based on the research of partially test (t-test), the value of t
arithmetics of product quality (X1) is 2.134, product availability (X2)
is 1.994, brand image (X3) is 2.795 and brand trust is 2.186.
It means, that independent variable of product availability (X2) has
the lowest and small influence among the other independent variable
toward the dependent variable of purchase decisision (Y).
a. Product Availability
According to Schroeder (2007:189) distribution channel is
the route from the producer forward through the distributors to
the customer. The most important thing in availability is a stock.
When the product is out of stock or known as a stockout, the
consumers will make different choice and decision to buy the
product. So, to avoid the stockout must know about how to
reduce the runs out or depleted inventory. To reduce the runs out
of the product is to use an RFID system as applied by Walmart.
Walmart has asked its main suppliers to place RFID labels on all
products sent to certain distribution centers. So, the location of
items that can be tracked is more precise and also the suppliers
know exactly where their items are within 30 minutes when the

103
goods move from one part of the shop to another. In addition,
sales can increase because the system can make the product
always available when it is needed and when the consumer
wants to buy it. (Laudon and Laudon,2007:348). RFID (Radio
Frequency Identification Technology) is a wireless
communication technology that enables users to uniquely
identify tagged objects or people. (Hunt et al.,2007:11). To
prevent the possibility of out of stock or stockout due to
uncertainty of demand or supplies is to do an inventory or
safety stock. Inventory are needed to : anticipate fluctuations or
uncertainty of demand and to anticipate delay in refiling orders
(Gaspersz,1998:367). Besides that, the inventory also fulfilling
orders from consumers quickly and on time, the motive of
guarding especially seasonal-related supplies and also pressing
the cost of goods per unit of goods. Generally, companies often
purchase goods in large enough quantities in order to get cheap
prices. (Sugiono,47).
Furthermore, in side of product availability the company
must give an opportunity for SME’s (Small Medium
Entrepreneurship) to become the direct distributor, from every
purchase of Tolak Angin Liquid product in a certain amount.
According to Sudaryono (2016:221) direct distributor is a
distribution that is done directly without going through the

104
intermediaries. Because of that matter, this can be expected to
maintaining the supply of Tolak Angin Liquid product from the
upstreams to the downstreams. Then, can accelerated the
distribution of Tolak Angin Liquid product to the hands of the
consumers (end-user).
2. For Next Researchers
Based on the results of this research, the next researchers have
to :
a. To conduct the research in other place
b. To conduct the research in other criteria and form of “Masuk
Angin” Medicine or Commoon Cold Medicine.
c. To use the other method or model to get the better analysis
results
d. To used the large sample in order to get the best and clearly
results as an output of the research.
e. To used the different variables to get the best and higher results
f. To used the different indicators to get the best results

xxiii
REFERENCES
Books
Agung, A.M. Lilik. “CEO Wisdom Vol 1”, PT. Elex Media Komputindo, 2013.
Ambadar, Jackie, Miranty Abidin and Yanti Isa. “Mengelola Merek”, 2007.
Arifin, Johar. “SPSS 24 Untuk Penelitian dan Skripsi”. 1th
Edition, PT. Elex
Media Computindo. 2017.
Arif, Muhammad. “Bahan Ajar Rancangan Teknik Industri”, Deepublish. 2016.
Bajpai, Naval. “Business Statistics”, Pearson Education India. 2009.
Bermen, Barry and Joel Evans. “Retail Management”. Prentice Hall, 2004.
Blythe, J. “Key Concepts in Marketing”.Sage Publications, 2009.
Chitale, A.K. and Ravi Gupta. “Product Policy and Brand Management”, 2nd
Edition, PHI Learning, 2013.
Cooper, R. Donald and Pamela S. Schindler. “Business Research Methods”, 9th
Edition, Mc Graw Hill, 2006.
Coyle, John J., C. John Langley, Robert A. Novack and Brian Gibson. “Supply
Chain Management : A Logistics Perspective”, 9th
Edition, Cengage
Learning, 2012.
Ferdinand, Augusty. “Metode Penelitian Manajemen : Pedoman Penelitian Untuk
Penulisan Skripsi, Tesis dan Disertasi Ilmu Manajemen”, 4th
Edition,
Badan Penerbit Universitas Diponegoro, 2013.
Gani, Irwan and Siti Amalia. “Alat Analisis Data : Aplikasi Statistik untuk
Penelitian Bidang Ekonomi dan Sosial“, 1st Edition, Andi Yogyakarta,
2015.
Gaspersz, Vincent. “Production Plan & Inventory Control”, Gramedia Pustaka
Utama, 1998.
Ghozali, Imam H. “Aplikasi Analisis Multivariete Dengan Program IBM SPSS
23”, 7th
Edition, Badan Penerbit Universitas Diponegoro, 2013.
Glynn, Mark S. “Business to Business Brand Management : Theory, Research &
Executive Case Study Exercises”, Illustrated Edition, Emerald Group
Publishing, 2009.
Hamdi, Asep Saepul and E. Bahruddin. “Metode Penelitian Kuantitatif : Aplikasi
dalam Pendidikam”, Deepublish, 2014.

xxiv
Hartman, Philipp. “New Business Creation : Systems for Institutionalized Radical
Innovation Management”, Illustrated Edition, Springer, 2014.
Haryadi, Adi. “Kiat Membuat Promosi Penjualan secara Efektif dan Terencana”,
PT Elex Media Komputindo, 1st Edition, Jakarta, 2005.
Hawkins, Del I, Best Roger J and Coney Kenneth A. “Consumer Behavior :
Building Marketing Strategy”, 8th
Edition, Mc Graw Hill, 2001.
Hermawan, Asep. “Penelitian Bisnis Paradigma Kuantitatif”, Grasindo, 2009.
Hermawan, Asep and Husna Leila Yusran.“Penelitian Bisnis Pendekatan
Kuantitatif”, Kencana, 2017.
Hunt, Daniel V., Albert Puglia and Mike Puglia. “RFID : A Guide to Radio
Frequency Identification”, John Wiley & Sons, 2007.
Kamath, Narasimha. “Handbook of Research on Strategic Supply Chain
Management in the Retail Industry : Advances in Logistics, Operations
and Management Science”, IGI Global, 2016.
Kerin, Roger A., Steven W. Hartley and William Rudelius. “Marketing the Core”.
Mc Graw Hill, 2004.
Kotler, Philip and Armstrong, G.. “Prinsip-Prinsip Pemasaran”. Vol. 1, 12th
Edition, Erlangga, Jakarta, 2008.
Kotler, Philip and Armstrong, G. “Principles of Marketing”. 12th
Edition, New
Jersey: Pearson-Prentice Hall, 2008.
Kotler, Philip and Kevin Lane Keller.”Marketing Management”. 14th
Edition,
2012.
Kuncoro, Mudrajad. “Metode Riset untuk Bisnis & Ekonomi : Bagaimana
Meneliti & Menulis Tesis”. 3th
Edition, Erlangga, 2009.
Lamb, Charles W., Joseph F. Hair, Jr., Carl M. Daniel. “Essential of Marketing”.
6th
Edition. South-Western Cengage Learning, 2009.
Lantos, Geoffrey Paul. “Consumer Behaviour in Action : Real-life Applications
for Marketing”. Routledge, 2015.
Lasmadiarta, Made. “Facebook Marketing Revolution”. PT. Elex Media
Komputindo, 2010.
Laudon Kenneth C. And Laudon Jane P. “Sistem Informasi Manajemen”. 10th
Edition”. Salemba Empat, Jakarta, 2007.
Levine, David M., David F. Stephan, Timothy C. Krehbiel and Mark L. Berenson.
“Statistics for Managers : Using Microsoft Excel”. 5th
Edition, Pearson
Prentice Hall, 2008.

xxv
Lind, Douglas A., Robert D. Mason and William G. Marchal. “Basic Statistics for
Business and Economics”. 6th
Edition, McGraw – Hill Higher, New York,
2008.
Masterson, Rosalind and David Pickton. “Marketing an Introduction”. 2nd
Edition. SAGE Publication, 2011.
Mooij, Marieke de. “Global Marketing and Advertising: Understanding Cultural
Paradoxes”. SAGE Publication, 2010.
Mowen, John and Michael Minor. “Perilaku Konsumen”. Vol. 2, 5th
Edition. 55,
Jakarta, Erlangga. 2002.
Mowen, John and Michael Minor. “Perilaku Konsumen”. Vol. 1, 5th
Edition. 11,
Jakarta, Erlangga. 2002.
Mullins, John W., Orville C. Walker, Jr., Harper W. boyd, Jr. “Marketing
Management : A Strategic Decision Making Approach”. 6th
Edition. Mc
Graw Hill, 2008.
Perreault, William D and E. Jerome Mc Carthy. “Basic Marketing:A Global
Managerial Approach”. 13th
Edition, Mc-Graw Hill, 1999.
Peter, J Paul and Olson Jerry C. “Consumer Behavior & Marketing Strategy”. 9th
Edition, Mc-Graw Hill, 2010.
Rangkuti, Freddy. “Dongkrak Penjualan Melalui Strategy & Competeitive
Positioning”. Gramedia Pustaka Utama, 2011.
Render, Barry, JR. Ralph M. Stair and Michael E. Hanna. “Quantitative Analysis
For Management”, 11th
Edition, Pearson Prentice-Hall, 2012.
Render, Barry and Heizer Jerry. “Prinsi-Prinsip Manajemen Operasi”, 1th
Edition, Salemba Empat, Jakarta, 2001.
Sangadji, Etta Mamang and Sopiah. “Perilaku Konsumen Pendekatan Praktis
Disertai : Himpunan Jurnal Penelitian”. 1st
Edition, CV. ANDI OFFSET,
Yogyakarta, 2013.
Sekaran, Uma. “Metodologi Penelitian untuk Bisnis”. 4th
Edition, Penerbit
Salemba Empat, Book II, 2006.
Sudaryono. “Manajemen Pemasaran Teori dan Implementasi”. 1st
Edition, CV.
ANDI OFFSET, Yogyakarta, 2016.
Sugiono, Arief. “Manajemen Keuangan : Untuk Praktisi Keuangan”,
Grasindo___.
Suliyanto. “Metode Riset Bisnis”. 2nd
Edition, Penerbit Andi, Book II, 2009.

xxvi
Schiffman, L.G., and Kanuk, L.L. “Consumer Behavior”. New Jersey : Pearson-
Prentice Hall, 2010.
Schroeder, Roger G. “Operations Management : Contemporary Concepts &
Cases”. 3rd
Edition, Mc Graw – Hill, 2007.
Shimp, Terence A., and Andrews, J. Craig. “Advertising, Promotion, and Other
Aspects of Integrated Marketing Comunications”. Cengage Learning,
2013.
Shimp, Terence A. “Periklanan dan Promosi Aspek Tambahan Komunikasi
Pemasaran Terpadu”. 5th
Edition, Erlangga, 2003.
Siahaya, Willem. “Sukses Supply Chain Management Akses Demand Chain
Management”. 1st Edition. IN-MEDIA – Anggota IKAPI, 2015
Simamora, Bilson. “Memenangkan Pasar dengan Pemasaran Efektif dan
Profitable”. 2nd
Edition. PT Gramedia Pustaka Utama, 2003.
Sujarweni, V. Wiratna. “Metodologi Penelitian : Lengkap, Praktis dan Mudah
Dipahami”. 1st Edition, PT. Pustaka Baru, 2014.
Sunyoto, Danang. “Teori, Kuesioner & Analisis Data Untuk Pemasaran dan
Perilaku Konsumen”. Graha Ilmu, 2013.
Supriyanto. “Metodologi Riset Bisnis”. 1st Edition, PT. Indeks Jakarta, 2009.
Swink, Morgan. “Managing Operations Across the Supply Chains”. Mc-Graw
Hill Educations, 2010.
Tybout, Alice M and Bobby J. Calder. “Kellog on Marketing”. 2nd
Edition, John
Wiley & Sons, 2010.
Umar, Husein. “Metode Penelitian untuk Skripsi dan Tesis Bisnis”, 2nd
Edition,
Rajawali Press, 2011.
Verma, Harsh V. “Brand Management : Text and Cases”, Illustration Edition,
Excel Books India, 2006.
Widarjono, Agus. ”Analisis Statistika Multivariat Terapan”, 1st Edition, UPP
STIM YKPN, 2010.
Wright, Ray. “Consumer Behavior”, Illustration Edition, Cengage Learning
EMEA,2006.
Yusuf, A. Muri. “Metode Penelitian Kuantitatif, Kualitatif & Penelitian
Gabungan”. Prenada Media, 2016.
Zeithaml, Valerie A. and Marry Jo Bitner. “Service Marketing: Integating
Customer Focus Across The Firm”. Irwin Mc Graw Hill, 1999.

xxvii
Zickermann, Peter. “Co-Branding : Fit Factors between Partner Brands”.
Diplom.de, 2014.
Zulganef. “Metode Penelitian Sosial dan Bisnis”, 1st Edition, Graha Ilmu, 2008.
Journals
Adiwidjaja, Adrian Junio and Tarigan Zeplin Jiwa Husada (2017). Pengaruh
Brand Image dan Brand Trust Terhadap Keputusan Pembelian Sepatu
Converse.
Elen, Tan, et. al. (2013). Analisis Atribut Produk, Kesesuaian Harga dan
Ketersediaan Produk terhadap Keputusan Pembelian Produk Cigaro.
Fatlahah, Aniek (2013). Pengaruh Kualitas Produk dan Citra Merek Terhadap
Keputusan Pembelian Es Krim Wall’s Magnum.
Garvin, David A (1984). What Does “Product Quality” Really Mean ?.
Indrawati, Devi (2015). Pengaruh Citra Merek dan Gaya Hidup Hedonis terhadap
Keputusan Pembelian Jilbab Zoya.
Kiswalini, Annis and Nurcahya, I Ketut (2014). Pengaruh Celebrity Endorser,
Brand Image dan Kepercayaan Konsumen Terhadap Keputusan
Pembelian.
Manorek, Sutria Langling. (2016). The Influence of Brand Image, Advertising,
Perceived Price Toward Consumer Purchase Intention (Case Study :
Samsung Smartrphone).
Mardalena, Novi Tria, et. al. (2018). Pengaruh Kesadaran Merek, Kepercayaan
Merek dan Keunggulan Produk Terhadap Minat Beli Produk Luxuri
Fashion Brand Dengan Gender Sebagai Variabel Moderating Pada
Pemasaran Media Sosial di Kota Banda Aceh.
Pratiwi, Detha Misgi, (2015). The Influence of Brand Image, Brand Trust and
Customer Satisfaction on Brand Loyalty (Case of Samsung Smartphone.
Puspitasari, Fitria and Santoso, Suryono Budi (2013). Analisis Pengaruh Kualitas
Layanan Inti dan Kualitas Layanan Peripheral Terhadap Kepuasan
Nasabah.
Reast, John D. (2005). Brand Trust and Brand Extension Acceptance : The
Relationship. Journal of Product & Brand Management.
Rizan, Mohamad, et. al. (2015). Pengaruh Citra Merek dan Kualitas Produk
Terhadap keputusan Pembelian (Studi Banding Konsumen Indomie dan
Mie Sedap).

xxviii
Saragih, Charles Victor B. (2013). Pengaruh Kualitas Produk, Ketersediaan
Produk dan Gaya Hidup terhadap Keputusan Pembelian Produk Lulur
Mandi Sumber Ayu di Jakarta.
Susanto, Agus. (2016). Pembangunan Citra Merek Melalui Pesan Iklan : Studi
Kasus Tolak Angin, Antangin JRG dan Bintang Toedjoe Masuk Angin.
Trautrims, Alexander, et. al. (2009). Optimizing On-Shelf Availability For
Customer Service And Profit. Journal of Business Logistics.
Trista, Nadia Lona, et. al. (2013). Pengaruh Citra Merek dan Kepercayaan Merek
Terhadap Keputusan Toyota Avanza di Kota Semarang.
Wilujeng, Sri Raharyu and Edwar, Muhammad. (2014). Pengaruh Brand
Awareness dan Brand Trust Terhadap Keputusan Pembelian Produk
Oriflame.
Weenas, Jackson R.S. (2013). Kualitas Produk, Harga, Promosi dan Kualitas
Pelayanan Pengaruhnya Terhadap Keputusan Pembelian Spring Bed
Comforta.
Articles and Website
Arini, Nimas Novi Dwi. “Kisah Tolak Angin Menembus Pasar Global”. August
13, 2014. https://swa.co.id/swa/trends/marketing/kisah-tolak-angin-
menembus-pasar-global.
This data are accessed on Monday, January 14, 2018 at 09:00 am.
https://bisnis.tempo.co/amp/703782/antangin-vs-tolak-angin-panasnya-perang-
obat-masuk-angin.
This data are accessed on Thursday, September 14, 2017 at 10:08 pm.
http://sidomuncul.com/mainsite/wp-content/uploads/2016/04/AR-Sido-Muncul-
2015.pdf.
This data are accessed on Thursday, September 14, 2017 at 11:38 pm.
http://sidomuncul.id/allmedia/files/SIDOMUNCUL20170425025759783-1.pdf.
This data are accessed on Wednesday, September 13, 2017 at 01:52 am.
http://sidomuncul.id/allmedia/files/SIDOMUNCUL20170501215825708-1.pdf.
This data are accessed on Wednesday, September 13, 2017 at 01:01 am.
Illahi, Kurnia and Hutami, Roro Putri. “Fenomena Pancaroba”. October 19,
2017. http://nasional.sindonews.com/read/657337/19/fenomena-
pancaroba-1341486491.
This data are accessed on Monday, January 14, 2018 at 09:00 am.

xxix
Kurniawan, Deny. “Tabel Distribusi”. May 24, 2018.
http://ineddeniwordpress.com.
This data are accesed on Thursday, May 24, 2018 at 10.00 am.
Murdopo. "Warta Ekspor Obat Tradisional." DJPEN, September 2014, 2nd
Edition.
This data are accessed on Monday, January 14, 2018 at 09:00 am.
Rahardjo, Mulyo. “Antangin vs Tolak Angin Panasnya Perang Obat Masuk
Angin”. September 14, 2017. http://bisnis.tempo.co/read/703782/antangin-
vs-tolak-angin-panasnya-perang-obat-masuk-angin.
This data are accessed on Thursday, September 14, 2017 at 10:50 pm.
Rahmat, Arby. “Bertamu ke Kota Hujan “Buitenzorg” Bogor “. September 14,
2017. http://www.cnnindonesia.com/gaya-hidup/20170325165240-269-
202746/bertamu-ke-kota-hujan-buitenzorg-bogor/.
This data are accessed on Thursday, September 14, 2017 at 10:50 pm.
Sarwono, “Statistik Daerah Kecamatan Jonggol Kabupaten Bogor Tahun 2016”.
http://bogorkab.bps.go.id.
This data are accessed on May 24, 2018 at 10.00 am.
Sparringa, Roy A. “Laporan Kinerja Badan POM Tahun 2014”. 2015, 24.
This data are accessed on May 24, 2018 at 09.00 am.
Sparringa, Roy A. “Peraturan Kepala BPOM RI Nomor 13 Tahun 2014”. Kepala
BPOM RI, 2014, 6.
This data are accessed on May 24, 2018 at 09.00 am.
Wuensch, Karl. 2009. “Cohen’s Conventions for Small, Medium and Large
Effects”. http://core.ecu.edu/psyc/wuenschk/docs30/EffectSizeConventions.pdf.
This data are accessed on Monday, September 10, 2018 at 08.00 am.
www.sidomuncul.com/tolak-angin.
This data are accessed on Monday, April 10, 2017 at 3:30 pm.
www.sidomuncul.com/about.
This data are accessed on Monday, April 10, 2017 at 3:35 pm.
www.sidomuncul.id/tolakangin
This data are accessed on Sunday, August 09, 2018 at 23:35 pm.
www.tolakangin.co.id.
This data are accessed on Tuesday, October 24, 2017 at 23:43 pm.
www.topbrand-award.com.
This data are accessed on Wednesday, September 13, 2017 at 01:01 am.

ATTACHMENT

xxxv
Attachment I : Research Questionnaire Sheet in English Language
RESEARCH QUESTIONNAIRE SHEET
From : Respondent
In the Place
Assalamualaikum Warrahmatullahi Wabarakatuh
THE INFLUENCE OF PRODUCT QUALITY, PRODUCT
AVAILABILITY, BRAND IMAGE AND BRAND TRUST TOWARD
PURCHASE DECISION :
(CASE STUDY OF TOLAK ANGIN LIQUID)
Nama :
Agnes Kartika Vidya Puspita
1113081100014
INTERNATIONAL MANAGEMENT
FACULTY OF ECONOMICS AND BUSINESS
STATE ISLAMIC UNIVERSITY SYARIF HIDAYATULLAH JAKARTA
2018

xxxvi
In order to complete the strata one program (S-1) as the final project of the
study in Faculty of Economics and Business, International Management
Departement, 10th
Semester, State Islamic University Syarif Hidayatullah Jakarta.
This requires the information to support my research with the title “The Influence
of Product Quality, Product Availability, Brand Image and Brand Trust Toward
Purchase Decision (Case Study of Tolak Angin Liquid)”.
Then, in relation to that it requested the willingness to Mr / Mrs / Brother /
Sister to participate in this research by filling out the questionnaire attached. Your
willingness is needed to determine the success of this research.
In accordance with the ethics of conducting this research, the data I obtain
shall be kept confidential and used for the research only. I hope that you can
returned this questionairre after fulfilling all the requirements from the attached
questionairre.
Thus, the request letter for filling out this questionnaire was made. Also, I
would like to thank you for the availability of Mr / Mrs / Brother / Sister for
having taken the time to filling out this questionnaire.
Best Regards,
Agnes Kartika Vidya Puspita

xxxvii
SCREENING QUESTIONS
Before completing the identity of the respondent, please be willing to Mr / Mrs /
Brother / Sister to first answer the questions below by circling the letters that
become your answer.
1. Have you ever purchased and consumed the Tolak Angin Liquid Product ?
a. Yes
b. No
If your answer is Yes, please proceed to the next question.
If your answer is No, please stop to reply and just get here.
Thank you for your participations.
2. Do you buy the Tolak Angin Liquid product in Jonggol ?
a. Yes
b. No
If your answer is Yes, please proceed to the next question.
If your answer is No, please stop to reply and just get here
Thank you for your participations.
3. Where do you buy the Tolak Angin Liquid products ?
a. Medicine Store
b. Pharmacies
c. Grocery Store
d. Modern Retail Store

xxxviii
IDENTITY OF THE RESPONDENT
1. Name :
2. Gender* : a. Male
b. Female
3. Ages* : a. < 20 years old
b. 20 – 35 years old
c. 36 – 50 years old
d. > 50 years old
4. Occupation* : a. Students / College Students
b. Employees
c. Government Civil Worker
d. Entrepreneur
e. Others
5. Incomes* : a. < Rp. 1.000.000
b. Rp. 1.000.000 – Rp. 1.500.000
c. > Rp. 1.500.000 – Rp. 2.000.000
d. > Rp. 2.000.000
(*circling the letters that become your answer)

xxxix
INSTRUCTIONS FOR FILLING OUT THE QUESTIONNAIRE
Please answer the following statement in accordance with the assessment
of Mr / Mrs / Brother / Sister on “The Influence of Product Quality, Product
Availability, Brand Image and Brand Trust Toward Purchase Decision (Case
Study of Tolak Angin Liquid)”.
Choose one (1) answer from the five alternatives (5) appropriate answer
by ticking ( ) on one of the available answer fields.
Explanation :
SD (Strongly Disagree) = 1
D (Disagree) = 2
ND/NA (Neither Disagree or = 3
Neither Agree)
A (Agree) = 4
SA (Strongly Agree) = 5
Choice of Answer SD D ND/NA A SA
Score 1 2 3 4 5

xl
Product Quality
No Statements SD D ND/NA A SA
1 Tolak Angin Liquid has the main function to
help overcome the symptoms of Masuk
Angin, such as : nausea, bloating, fever,
dizziness, abdominal pain and dry throat.
2 Tolak Angin Liquid product has a sugar free
variant.
3 Tolak Angin Liquid proved to cure the
trapped wind (Masuk Angin), nausea and
bloating.
4 Tolak Angin Liquid has a design product that
meet the standard of BPOM.
5 The feasibility of Tolak Angin Liquid
product to be consumed, can be known
through the expiry date.
6 Tolak Angin Liquid is easy to get in
Medicine Stores, Pharmacies, Grocery Stores
& Modern Retail Stores.
7 Tolak Angin Liquid has a mint flavor which
the most favorite.

xli
No Statements SD D ND/NA A SA
8 Tolak Angin Liquid has a distinctive odor
aromatic.
9 Tolak Angin Liquid has a strong perception
in the minds of consumers that only smart
people who can drink the Tolak Angin
medicine.

xlii
Product Availability
No Statements SD D ND/NA A SA
10 Tolak Angin Liquid are available at the
right place and at the right time to be
purchased.
11 Tolak Angin brand temporarily is
unavailable in the stores.
(reverse coding)

xliii
Brand Image
No Statements SD D ND/NA A SA
12 Tolak Angin Liquid has a high price.
13 Tolak Angin Liquid has a yellow
rectangular packaging.
14 Tolak Angin Liquid consumed by the
public, celebrities and academic leaders.
15 Tolak Angin Liquid can be drunk during
the rainy season.
16 Tolak Angin Liquid has been proven to
help increasing the body endurance
significantly.
17 After consuming the Tolak Angin Liquid
I feel so happy.
18 After consuming the Tolak Angin Liquid
I feel so smart.
19 I like Tolak Angin Liquid.
20 I do not like Tolak Angin Liquid.
(reverse coding)

xliv
Brand Trust
No Statements SD D ND/NA A SA
21 I get the benefit after drinking Tolak Angin
Liquid.
22 Tolak Angin Liquid has a good quality
product as expected.

xlv
Purchase Decision
No Statements SD D ND/NA A SA
23 Types of Tolak Angin product that I bought
was Tolak Angin Liquid.
24 Tolak Angin Liquid has a customized size.
25 Tolak Angin Liquid has a pharmaceutical
standard quality.
26 Images of traditional medicinal herbs and
red and white flags dominate the product
display of the Tolak Angin Liquid.
27 Brand of trapped wind (Masuk Angin)
medicine that I always bought when I have
trapped wind (Masuk Angin) is Tolak
Angin Sidomuncul.
28 Tolak Angin Liquid can be purchased at
Medicine Stores, Pharmacies, Grocery
Stores and Modern Retail Stores.
29 When I have trapped wind (Masuk Angin)
usually I bought trapped wind (Masuk
Angin) medicine from Tolak Angin
Sidomuncul brand more than one sachet.

xlvi
No Statements SD D ND/NA A SA
30 I will buy Tolak Angin Liquid when I am
sick and when I want to travel.
31 Payment method that I used when bought
trapped wind (Masuk Angin) medicine
from Tolak Angin Sidomuncul brand is by
cash.

xlvii
Attachment II : Research Questionnaire Sheet in Indonesian Language
LEMBAR KUESIONER PENELITIAN
Kepada Yth : Responden
Di-Tempat
Assalamualaikum Warrahmatullahi Wabarakatuh
PENGARUH KUALITAS PRODUK, KETERSEDIAAN PRODUK, CITRA
MEREK DAN KEPERCAYAAN MEREK TERHADAP KEPUTUSAN
PEMBELIAN :
(STUDI KASUS TOLAK ANGIN CAIR)
Nama :
Agnes Kartika Vidya Puspita
1113081100014
MANAJEMEN INTERNASIONAL
FAKULTAS EKONOMI DAN BISNIS
UNIVERSITAS ISLAM NEGERI SYARIF HIDAYATULLAH JAKARTA
2018

xlviii
Dalam rangka menyelesaikan Program Strata Satu (S-1) sebagai tugas
akhir studi Fakultas Ekonomi dan Bisnis, Jurusan Manajemen Internasional,
Semester 10, Universitas Islam Negeri Syarif Hidayatullah Jakarta. Dengan ini
memerlukan informasi untuk mendukung penelitian yang saya lakukan dengan
judul “Pengaruh Kualitas Produk, Ketersediaan Produk, Citra Merek dan
Kepercayaan Merek Terhadap Keputusan Pembelian (Studi Kasus Tolak Angin
Cair)”.
Dengan itu dimohon untuk kesediaan Bapak/Ibu/Saudara/I agar
berpartisipasi dalam penelitian ini dengan cara mengisi kuesioner yang terlampir.
Kesediaan Bapak/Ibu/Saudara/I sangat dibutuhkan untuk menentukan
keberhasilan atas penelitian yang dilakukan ini.
Sesuai dengan etika dalam melakukan penelitian, data yang saya peroleh
akan dijaga kerahasiaannya dan digunakan semata-mata hanya untuk kepentingan
penelitian. Saya berharap agar Bapak/Ibu/Saudara/I dapat mengembalikan
kuesioner ini setelah memenuhi semua yang dibutuhkan dari kuesioner yang
terlampir.
Demikianlah surat permohonan pengisian kuesioner ini dibuat. Selain itu,
saya ingin mengucapkan terima kasih atas ketersediaan Bapak/Ibu/Saudara/I
karena telah meluangkan waktu untuk mengisi kuesioner tersebut.
Hormat Saya,
Agnes Kartika Vidya Puspita

xlix
PERTANYAAN SCREENING
Sebelum melengkapi identitas responden, mohon kesediaan
Bapak/Ibu/Saudara/I untuk terlebih dahulu menjawab pertanyaan dibawah ini
dengan cara melingkari huruf yang menjadi jawaban anda.
1. Apakah anda pernah membeli dan mengkonsumsi produk Tolak Angin
Cair ?
c. Ya
d. Tidak
Jika jawaban anda Ya, silahkan melanjutkan ke pertanyaan selanjutnya.
Jika jawaban anda Tidak, silahkan berhenti menjawab dan cukup sampai
disini.
Terima Kasih atas partisipasinya.
2. Apakah anda membeli produk Tolak Angin Cair di Jonggol ?
c. Ya
d. Tidak
Jika jawaban anda Ya, silahkan melanjutkan ke pertanyaan selanjutnya.
Jika jawaban anda Tidak, silahkan berhenti menjawab dan cukup sampai
disini.
Terima Kasih atas partisipasinya.

l
3. Dimanakah anda membeli produk Tolak Angin Cair ?
e. Toko Obat
f. Apotik
g. Toko Kelontong (Warung)
h. Toko Retail Modern (Minimarket / Supermarket)

li
IDENTITAS RESPONDEN
1. Nama :
2. Jenis Kelamin* : a. Pria
b. Wanita
3. Umur* : a. < 20 tahun
b. 20 – 35 tahun
c. 36 – 50 tahun
d. > 50 tahun
4. Pekerjaan* : a. Pelajar / Mahasiswa
b. Karyawan
c. PNS
d. Wirausaha
e. Lain-lain
5. Pendapatan perbulan* : a. < Rp. 1.000.000
b. Rp. 1.000.000 – Rp. 1.500.000
c. > Rp. 1.500.000 – Rp. 2.000.000
d. > Rp. 2.000.000
(*lingkari huruf yang menjadi jawaban anda)

lii
PETUNJUK PENGISIAN KUESIONER
Jawablah pernyataan dibawah ini sesuai dengan penilaian saudara/saudari
mengenai “Pengaruh Kualitas Produk, Ketersediaan Produk, Citra Merek dan
Kepercayaan Merek Terhadap Keputusan Pembelian (Studi Kasus Tolak Angin
Cair)”.
Pilihlah salah satu (1) jawaban dari lima alternatif (5) jawaban yang
sesuai dengan memberi tanda ceklis ( ) pada salah satu kolom jawaban yang
tersedia.
Keterangan :
STS (Sangat Tidak Setuju) = 1
TS (Tidak Setuju) = 2
N (Bisa Setuju atau = 3
Bisa Tidak Setuju)
S (Setuju) = 4
SS (Sangat Setuju) = 5
Pilihan Jawaban STS TS N S SS
Nilai 1 2 3 4 5

liii
Kualitas Produk
No Pernyataan STS TS N S SS
1 Tolak Angin Cair memiliki fungsi utama untuk
membantu mengatasi masuk angin yang ditandai
dengan gejala seperti mual, kembung, badan
meriang, pusing, sakit perut dan tenggorokan
kering.
2 Produk Tolak Angin Cair memiliki varian Bebas
Gula.
3 Tolak Angin Cair terbukti ampuh untuk
menyembuhkan Masuk Angin, mual dan
kembung.
4 Tolak Angin Cair memiliki desain produk yang
sesuai dengan standard BPOM.
5 Kelayakan produk Tolak Angin Cair untuk
dikonsumsi dapat diketahui melalui tanggal
kadaluarsa.
6 Tolak Angin Cair mudah didapatkan di toko obat,
apotik, toko kelontong seperti warung dan toko
retail, seperti minimarket dan supermarket.
7 Tolak Angin Cair memiliki rasa mint yang paling
banyak diminati.

liv
No Pernyataan STS TS N S SS
8 Tolak Angin Cair memiliki bau khas aromatik
yang menyengat.
9 Tolak Angin Cair memiliki persepsi yang kuat di
benak konsumen bahwa hanya orang pintar saja
yang bisa meminum obat Tolak Angin.
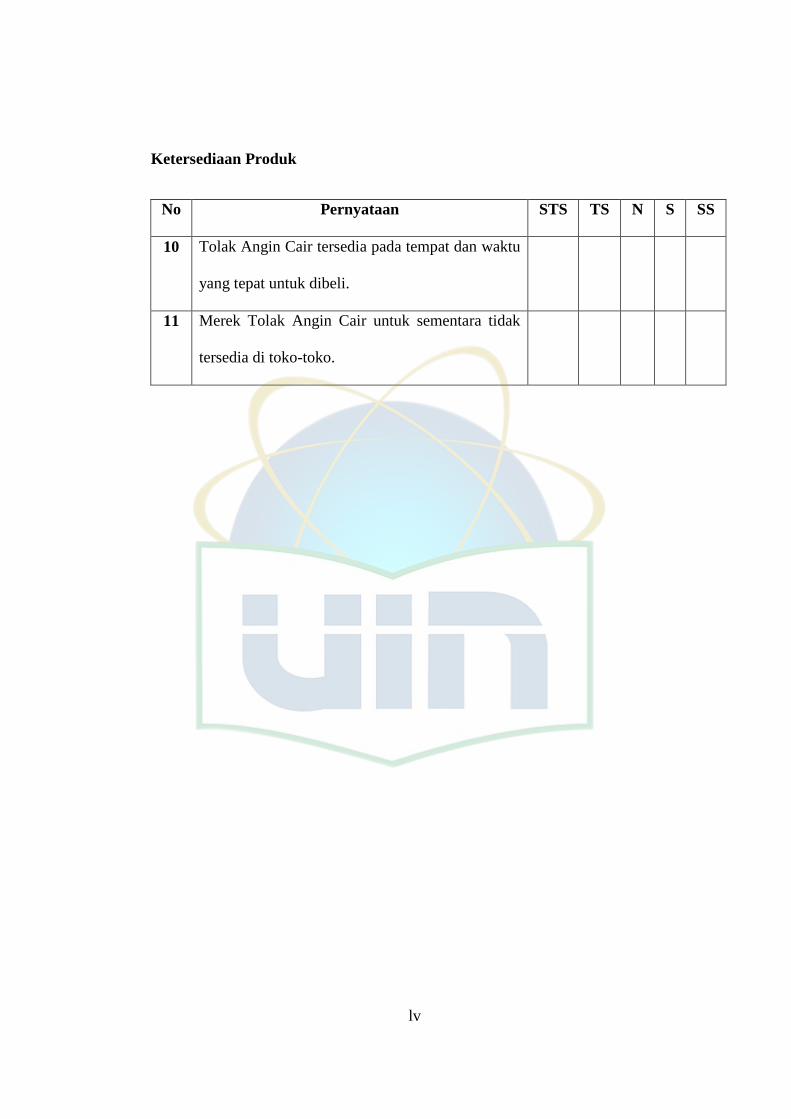
lv
Ketersediaan Produk
No Pernyataan STS TS N S SS
10 Tolak Angin Cair tersedia pada tempat dan waktu
yang tepat untuk dibeli.
11 Merek Tolak Angin Cair untuk sementara tidak
tersedia di toko-toko.

lvi
Citra Merek
No Pernyataan STS TS N S SS
12 Tolak Angin Cair memiliki harga yang mahal.
13 Tolak Angin Cair memiliki kemasan berwarna
kuning yang berbentuk persegi panjang.
14 Tolak Angin Cair dikonsumsi oleh kalangan
masyarakat, selebritis dan tokoh akademis.
15 Tolak Angin Cair bisa diminum saat musim
hujan.
16 Tolak Angin Cair telah terbukti membantu
meningkatkan daya tahan tubuh secara
signifikan.
17 Setelah mengkonsumsi Tolak Angin Cair saya
merasa senang.
18 Setelah mengkonsumsi Tolak Angin Cair saya
merasa pintar.
19 Saya menyukai Tolak Angin Cair.
20 Saya tidak menyukai Tolak Angin Cair.

lvii
Kepercayaan Merek
No Pernyataan STS TS N S SS
21 Saya mendapatkan manfaat setelah minum Tolak
Angin Cair.
22 Tolak Angin Cair memiliki kualitas produk yang
baik sesuai dengan yang diharapkan.

lviii
Keputusan Pembelian
No Pernyataan STS TS N S SS
23 Jenis produk Tolak Angin yang saya beli
adalah Tolak Angin Cair.
24 Tolak Angin Cair memiliki ukuran yang
sudah disesuaikan.
25 Tolak Angin Cair memiliki mutu berstandar
farmasi.
26 Gambar bahan rempah obat tradisional dan
bendera merah putih mendominasi tampilan
kemasan produk Tolak Angin Cair.
27 Merek obat Masuk Angin yang selalu saya
beli saat sedang sakit Masuk Angin adalah
Tolak Angin Cair.
28 Tolak Angin Cair dapat dibeli di (Toko Obat,
Apotik, Toko Kelontong, seperti warung dan
Toko Retail Modern, seperti Minimarket dan
Supermarket).
29 Saat sedang Masuk Angin biasanya saya
membeli obat Masuk Angin dari merek Tolak
Angin Cair lebih dari satu sachet.

lix
No Pernyataan STS TS N S SS
30 Tolak Angin Cair akan saya beli ketika
sedang sakit dan saat ingin melakukan
perjalanan.
31 Metode pembayaran yang saya gunakan saat
membeli obat Masuk Angin merek Tolak
Angin Cair adalah dengan uang cash.

lx
Attachment III : The Questionairre Results for Validity & Reliability Data
QUESTIONAIRRE RESULTS FOR VALIDITY & RELIABILITY DATA
No Variable of Product Quality (X1)
Total S1 S2 S3 S4 S5 S6 S7 S8 S9
1 4 4 4 4 4 4 4 4 4 36
2 5 5 5 5 5 5 5 5 5 45
3 4 4 4 4 4 4 4 2 4 34
4 5 5 5 5 5 5 5 4 5 44
5 4 4 4 4 5 5 5 5 5 41
6 5 4 4 4 4 4 4 4 5 38
7 5 4 5 5 5 5 4 4 5 42
8 5 4 5 5 5 5 4 4 5 42
9 4 5 4 4 4 4 4 4 4 37
10 5 5 5 5 5 5 5 5 5 45
11 5 4 5 4 4 5 4 2 5 38
12 5 4 5 4 4 5 4 2 5 38
13 5 5 5 5 5 5 5 5 5 45
14 5 5 5 5 5 5 5 5 5 45
15 5 5 5 5 5 5 5 5 5 45
16 4 4 4 4 4 4 4 4 5 37
17 5 5 5 4 4 5 5 5 5 43
18 4 4 5 5 5 5 5 4 5 42
19 5 5 5 5 5 5 4 4 4 42
20 4 5 5 5 5 5 5 5 5 44
21 5 5 5 5 4 5 5 4 5 43
22 4 4 4 4 4 5 5 3 5 38
23 5 5 5 4 5 5 5 5 5 44
24 5 5 5 5 5 5 5 5 5 45
25 5 5 5 5 5 5 5 5 5 45
26 5 4 4 5 5 5 5 5 4 42
27 5 4 5 5 5 5 4 4 5 42
28 5 5 5 5 5 5 4 4 5 43
29 5 5 5 5 5 5 5 3 5 43
30 5 4 5 5 5 5 4 5 5 43
Total 142 136 142 139 140 145 137 125 145 1251

lxi
No Variable of Product Availability (X2)
Total S10 S11
1 4 4 8
2 5 5 10
3 4 4 8
4 5 5 10
5 5 5 10
6 4 4 8
7 5 5 10
8 5 5 10
9 4 4 8
10 5 5 10
11 4 4 8
12 4 4 8
13 5 5 10
14 5 5 10
15 4 4 8
16 4 4 8
17 4 4 8
18 5 5 10
19 4 5 9
20 5 5 10
21 5 5 10
22 5 4 9
23 5 5 10
24 5 5 10
25 5 5 10
26 5 5 10
27 5 5 10
28 5 5 10
29 5 5 10
30 5 5 10
Total
140 140 280

lxii
No Variable of Brand Image (X3)
Total S12 S13 S14 S15 S16 S17 S18 S19 S20
1 4 4 4 4 4 4 4 4 4 36
2 5 5 5 5 5 5 5 5 5 45
3 4 4 2 4 4 4 4 4 4 34
4 2 4 3 5 5 5 4 4 4 36
5 4 4 4 5 4 4 5 4 4 38
6 4 4 4 4 4 4 4 5 4 37
7 4 4 4 5 4 4 4 4 4 37
8 4 4 4 5 4 4 4 4 4 37
9 4 5 3 4 3 5 5 3 5 37
10 5 5 5 5 5 5 5 5 5 45
11 5 4 4 4 4 4 5 4 4 38
12 5 4 4 4 4 5 4 4 4 38
13 5 5 5 5 5 5 5 5 5 45
14 5 5 5 5 5 5 5 5 4 44
15 3 5 5 4 4 5 3 5 4 38
16 3 4 4 4 4 3 4 4 4 34
17 5 4 4 4 4 4 4 4 4 37
18 5 5 5 5 5 5 5 5 5 45
19 4 4 4 5 4 4 4 5 5 39
20 5 5 5 5 5 5 5 5 5 45
21 4 5 5 5 5 4 5 5 4 42
22 4 4 4 4 3 4 2 4 4 33
23 4 4 4 5 4 4 4 5 5 39
24 5 5 5 5 5 5 5 5 5 45
25 5 5 5 5 5 5 4 5 5 44
26 5 4 4 5 4 4 4 5 5 40
27 5 5 5 5 5 4 4 5 5 43
28 5 5 5 4 4 5 4 5 5 42
29 5 4 5 5 4 3 5 5 4 40
30 5 4 4 5 5 5 5 4 5 42
Total
132 133 129 139 130 132 130 136 134 1195

lxiii
No Variable of Brand Trust (X4)
Total S21 S22
1 4 4 8
2 4 4 8
3 4 4 8
4 4 4 8
5 4 4 8
6 5 5 10
7 4 4 8
8 4 4 8
9 4 3 7
10 5 5 10
11 4 4 8
12 4 4 8
13 5 5 10
14 5 5 10
15 4 4 8
16 4 4 8
17 4 4 8
18 5 5 10
19 4 5 9
20 5 5 10
21 5 5 10
22 4 4 8
23 5 5 10
24 5 5 10
25 5 5 10
26 5 5 10
27 5 5 10
28 5 5 10
29 5 5 10
30 5 5 10
Total
135 135 270

lxiv
No Variable of Purchase Decision (Y)
Total S23 S24 S25 S26 S27 S28 S29 S30 S31
1 4 4 4 4 4 4 4 4 4 36
2 5 5 5 5 5 5 4 5 5 44
3 4 4 4 4 4 4 4 4 4 36
4 5 5 5 5 5 5 5 5 5 45
5 5 5 5 5 4 5 5 4 5 43
6 5 4 4 4 4 4 4 4 4 37
7 5 5 4 4 5 5 4 5 5 42
8 5 5 4 4 5 5 4 5 5 42
9 4 4 4 4 4 4 3 4 5 36
10 5 5 5 5 5 5 5 5 5 45
11 5 4 4 4 5 4 4 5 5 40
12 5 4 4 5 4 4 4 5 5 40
13 5 5 5 5 5 5 5 5 5 45
14 5 5 5 5 5 5 5 5 5 45
15 4 4 4 4 4 4 4 4 4 36
16 4 4 4 4 4 4 4 4 4 36
17 2 4 5 5 4 4 5 4 5 38
18 5 5 5 4 5 5 5 5 5 44
19 4 4 5 5 5 5 5 4 4 41
20 5 5 5 5 5 5 5 5 5 45
21 5 5 4 5 5 5 5 5 4 43
22 4 4 4 4 4 4 4 4 4 36
23 5 5 5 4 5 5 3 4 5 41
24 5 5 5 5 4 5 5 5 5 44
25 5 5 5 5 5 5 5 5 5 45
26 5 5 5 5 5 5 5 5 5 45
27 5 5 5 5 5 5 5 5 5 45
28 5 5 5 5 5 5 5 4 5 44
29 5 5 5 5 5 5 5 4 5 44
30 4 4 4 5 5 5 5 4 5 41
Total
139 138 137 138 139 140 135 136 142 1244

lxv
Attachment IV : The Questionairre Results for Research Data
QUESTIONAIRRE RESULTS FOR RESEARCH DATA
No Variable of Product Quality (X1)
Total S1 S2 S3 S4 S5 S6 S7 S8 S9
1 5 5 5 5 5 5 5 5 5 45
2 5 5 5 5 5 5 5 5 5 45
3 5 5 5 5 5 5 5 5 5 45
4 5 5 5 5 5 5 5 5 5 45
5 5 5 5 5 5 5 5 5 5 45
6 5 5 5 5 5 5 5 5 5 45
7 5 5 5 5 5 5 5 5 5 45
8 5 5 5 5 5 5 4 5 5 44
9 4 4 5 4 4 4 5 5 5 40
10 5 5 5 5 5 5 5 4 4 43
11 5 4 5 5 5 5 5 4 4 42
12 5 4 5 5 4 5 5 5 4 42
13 5 4 4 4 5 5 5 5 4 41
14 5 4 5 4 5 5 5 5 2 40
15 5 4 5 4 5 4 4 4 4 39
16 5 5 4 5 4 5 4 4 4 40
17 5 4 5 5 5 5 5 5 5 44
18 5 4 5 4 5 5 5 5 4 42
19 4 4 5 5 5 5 4 5 5 42
20 5 5 4 5 5 5 4 5 4 42
21 5 5 5 5 5 5 4 4 4 42
22 5 5 5 5 5 5 5 5 5 45
23 5 4 5 4 4 4 4 5 5 40
24 5 4 5 4 4 4 4 4 5 39
25 4 4 4 4 5 5 4 5 4 39
26 4 5 5 5 4 5 4 5 4 41
27 4 5 4 5 4 5 4 5 4 40
28 4 5 5 5 4 4 4 4 5 40
29 5 5 5 5 5 5 5 4 5 44
30 4 5 5 4 5 5 4 4 4 40
31 5 5 4 5 4 4 4 4 5 40
32 5 4 4 4 4 5 5 5 5 41
33 4 4 4 5 5 5 4 5 4 40

lxvi
No Variable of Product Quality (X1)
Total S1 S2 S3 S4 S5 S6 S7 S8 S9
34 5 5 4 4 4 4 5 5 4 40
35 5 5 5 5 4 4 4 5 5 42
36 4 4 4 5 4 4 4 5 4 38
37 5 5 4 4 4 5 5 5 5 42
38 4 5 4 4 5 5 4 5 4 40
39 4 4 4 4 4 4 4 4 4 36
40 4 4 4 4 4 4 4 4 4 36
41 5 4 4 4 4 4 4 4 5 38
42 5 5 4 4 4 5 5 4 4 40
43 5 4 4 4 5 5 4 4 4 39
44 4 4 4 4 4 4 4 4 4 36
45 5 5 4 4 4 4 4 4 4 38
46 5 5 4 5 4 5 4 4 5 41
47 5 5 5 4 5 5 4 4 4 41
48 4 4 4 4 5 5 4 4 4 38
49 4 4 5 4 5 5 4 4 4 39
50 4 4 4 4 4 5 5 5 2 37
51 5 5 5 5 5 5 5 5 5 45
52 5 5 5 5 5 5 5 5 5 45
53 5 5 5 5 5 5 4 5 5 44
54 4 4 5 4 4 4 5 5 5 40
55 5 5 5 5 5 5 5 4 4 43
56 5 4 5 5 5 5 5 4 4 42
57 5 4 5 5 4 5 5 5 4 42
58 5 4 4 4 5 5 5 5 4 41
59 5 4 5 4 5 5 5 5 5 43
60 5 5 5 5 5 5 5 5 5 45
61 4 4 4 5 5 5 4 5 4 40
62 5 5 4 4 4 4 5 5 4 40
63 5 5 5 5 4 4 4 5 5 42
64 4 4 4 5 4 4 4 5 4 38
65 5 5 4 4 4 5 5 5 5 42
66 4 5 4 4 5 5 4 5 4 40
67 4 4 4 4 4 4 4 4 4 36
68 4 4 4 4 4 4 4 4 4 36
69 5 4 4 4 4 4 4 4 5 38
70 5 5 4 4 4 5 5 4 4 40
71 5 5 5 5 5 5 5 5 5 45
72 5 5 5 5 5 5 5 5 5 45
73 5 5 5 5 5 5 5 5 5 45
74 5 5 5 5 5 5 5 5 5 45
75 5 5 5 5 5 5 5 5 5 45

lxvii
No Variable of Product Quality (X1) Total
S1 S2 S3 S4 S5 S6 S7 S8 S9
76 5 5 5 5 5 5 5 5 5 45
77 5 5 5 5 5 5 5 5 5 45
78 5 5 5 5 5 5 4 5 5 44
79 4 4 5 4 4 4 5 5 5 40
80 5 5 5 5 5 5 5 4 4 43
81 5 4 5 5 5 5 5 4 4 42
82 5 4 5 5 4 5 5 5 4 42
83 5 4 4 4 5 5 5 5 4 41
84 5 4 5 4 5 5 5 5 5 43
85 5 4 5 4 5 4 2 4 4 37
86 5 5 4 5 4 5 4 4 4 40
87 5 4 5 5 5 5 5 5 5 44
88 5 4 5 4 5 5 5 5 4 42
89 4 4 5 5 5 5 4 5 5 42
90 5 5 4 5 5 5 4 5 4 42
91 4 4 4 4 4 4 4 4 4 36
92 5 5 5 5 4 4 5 5 4 42
93 4 4 5 5 5 5 5 5 5 43
94 4 4 5 5 5 5 5 5 2 40
95 4 4 4 4 4 4 4 4 4 36
96 5 5 5 4 4 4 4 4 4 39
97 5 5 5 4 4 4 4 5 5 41
98 5 5 5 5 5 5 5 5 5 45
99 4 4 4 4 4 4 4 4 4 36
100 4 4 4 4 5 5 5 5 4 40
101 4 4 4 4 4 4 4 4 2 34
102 4 4 4 4 5 5 5 5 5 41
103 4 4 5 5 5 5 5 4 4 41
104 4 4 4 5 5 4 4 4 4 38
105 5 5 5 5 5 5 5 5 5 45
106 5 5 5 5 5 5 5 5 5 45
107 4 4 4 4 4 4 4 4 4 36
108 5 5 5 5 5 5 5 4 4 43
109 5 5 5 4 4 4 4 4 4 39
110 4 5 5 5 5 5 5 4 4 42
111 4 4 4 4 4 4 4 4 2 34
112 5 5 5 5 5 5 4 4 4 42
113 4 4 4 4 5 5 5 5 5 41
114 4 4 5 5 5 5 4 4 4 40
115 4 4 4 4 4 4 4 4 4 36
116 5 5 4 4 4 4 5 5 5 41
117 4 4 4 4 4 4 4 4 4 36

lxviii
No Variable of Product Quality (X1) Total
S1 S2 S3 S4 S5 S6 S7 S8 S9
118 5 5 5 5 5 5 4 4 4 42
119 4 4 4 4 5 5 5 5 2 38
120 4 4 4 4 4 4 4 4 4 36
121 5 5 5 5 5 5 5 5 5 45
122 5 5 5 5 5 5 5 5 5 45
123 5 5 5 5 5 5 5 5 5 45
124 5 5 5 5 5 5 5 5 5 45
125 5 5 5 5 5 5 5 5 5 45
126 4 4 4 4 4 4 4 4 4 36
127 4 4 4 4 4 4 4 4 4 36
128 4 4 4 4 4 4 4 4 4 36
129 4 4 5 4 4 4 5 5 5 40
130 5 5 5 5 5 5 5 4 4 43
131 5 4 5 5 5 5 5 4 4 42
132 5 4 5 5 4 5 5 5 4 42
133 5 4 4 4 5 5 5 5 4 41
134 5 4 5 4 5 5 5 5 5 43
135 5 4 5 4 5 4 4 4 4 39
136 5 5 4 5 4 5 4 4 4 40
137 4 4 4 4 4 4 4 4 4 36
138 4 4 4 4 4 4 4 4 4 36
139 4 4 5 5 5 5 4 5 5 42
140 5 5 4 5 5 5 4 5 4 42
141 4 4 4 4 4 4 4 4 2 34
142 4 4 4 4 4 5 5 5 5 40
143 4 4 5 5 5 5 5 5 4 42
144 5 5 4 4 4 4 4 4 4 38
145 4 4 4 4 4 4 4 4 4 36
146 4 4 4 4 4 4 4 4 4 36
147 4 4 4 4 4 4 4 4 4 36
148 4 4 4 4 4 4 4 4 4 36
149 5 5 5 4 4 4 4 5 5 41
150 4 4 4 4 4 5 5 5 5 40
Total 692 670 684 676 684 698 675 686 648 6113

lxix
No Variable of Product Availability (X2)
Total S10 S11
1 5 5 10
2 5 5 10
3 5 5 10
4 5 5 10
5 5 5 10
6 4 4 8
7 5 5 10
8 5 5 10
9 5 5 10
10 2 5 7
11 5 5 10
12 5 5 10
13 4 4 8
14 5 5 10
15 4 4 8
16 4 4 8
17 4 4 8
18 4 5 9
19 5 4 9
20 5 5 10
21 4 4 8
22 4 5 9
23 4 5 9
24 5 4 9
25 5 2 7
26 4 4 8
27 4 4 8
28 4 4 8
29 4 4 8
30 4 4 8
31 4 4 8
32 4 5 9
33 5 5 10
34 5 5 10
35 4 4 8
36 4 4 8
37 5 5 10
38 5 4 9

lxx
No Variable of Product Availability (X2)
Total S10 S11
39 5 5 10
40 5 5 10
41 5 5 10
42 4 4 8
43 4 4 8
44 4 4 8
45 5 4 9
46 5 4 9
47 4 4 8
48 4 4 8
49 5 5 10
50 4 4 8
51 4 4 8
52 5 5 10
53 5 5 10
54 5 5 10
55 5 5 10
56 5 5 10
57 5 5 10
58 5 5 10
59 5 5 10
60 4 4 8
61 5 5 10
62 5 5 10
63 4 4 8
64 4 4 8
65 5 5 10
66 5 4 9
67 5 5 10
68 5 5 10
69 5 5 10
70 4 4 8
71 5 5 10
72 5 5 10
73 5 5 10
74 5 5 10
75 5 5 10
76 4 4 8
77 5 5 10
78 5 5 10
79 5 5 10
80 2 5 7

lxxi
No Variable of Product Availability (X2)
Total S10 S11
81 5 5 10
82 5 5 10
83 4 4 8
84 5 5 10
85 4 4 8
86 4 4 8
87 4 4 8
88 4 5 9
89 5 4 9
90 5 5 10
91 4 4 8
92 4 4 8
93 4 4 8
94 4 5 9
95 4 4 8
96 4 5 9
97 5 5 10
98 5 5 10
99 4 4 8
100 5 4 9
101 5 5 10
102 5 5 10
103 4 4 8
104 4 4 8
105 4 4 8
106 2 5 7
107 5 5 10
108 5 4 9
109 5 4 9
110 5 4 9
111 4 4 8
112 4 4 8
113 4 4 8
114 4 5 9
115 4 4 8
116 4 4 8
117 4 4 8
118 4 5 9
119 5 5 10
120 5 5 10
121 5 5 10
122 5 5 10

lxxii
No Variable of Product Availability (X2)
Total S10 S11
123 5 5 10
124 5 5 10
125 5 5 10
126 2 4 6
127 5 5 10
128 5 5 10
129 5 5 10
130 5 5 10
131 5 5 10
132 5 5 10
133 2 4 6
134 5 5 10
135 5 5 10
136 5 5 10
137 4 4 8
138 4 5 9
139 5 4 9
140 5 5 10
141 4 5 9
142 5 4 9
143 5 5 10
144 5 5 10
145 5 5 10
146 4 4 8
147 4 4 8
148 5 5 10
149 5 5 10
150 5 5 10
Total 677 685 6098

lxxiii
No Variable of Brand Image (X3)
Total S12 S13 S14 S15 S16 S17 S18 S19 S20
1 5 5 5 5 5 5 5 5 5 45
2 5 5 5 5 5 5 5 5 4 44
3 5 5 5 5 5 5 5 5 5 45
4 5 5 5 5 5 5 5 5 5 45
5 4 5 5 5 5 5 5 5 5 44
6 4 5 5 4 4 4 2 5 5 38
7 4 5 5 5 5 4 4 4 4 40
8 4 5 5 5 5 5 5 5 5 44
9 5 4 5 5 5 5 4 5 5 43
10 5 5 5 5 5 5 4 5 4 43
11 4 4 5 5 4 4 3 4 4 37
12 4 5 4 4 5 4 4 5 4 39
13 4 5 5 5 4 4 4 4 5 40
14 5 5 5 5 5 5 5 5 5 45
15 5 5 5 5 5 5 5 5 5 45
16 4 4 4 4 4 4 4 5 4 37
17 4 4 4 5 5 4 4 4 4 38
18 5 5 4 5 4 4 5 5 4 41
19 4 5 5 4 5 4 4 4 4 39
20 4 4 4 4 4 4 4 4 4 36
21 4 5 5 5 5 4 4 4 4 40
22 4 5 4 5 5 4 4 5 4 40
23 4 4 4 5 4 4 3 4 4 36
24 5 4 5 4 4 5 5 5 5 42
25 5 5 4 5 5 4 4 5 4 41
26 5 4 4 4 4 4 4 4 4 37
27 4 5 4 4 4 4 4 4 5 38
28 5 4 4 5 4 4 5 4 4 39
29 4 4 4 5 4 5 4 4 5 39
30 4 4 4 4 4 5 4 4 4 37
31 4 4 4 4 4 5 4 5 4 38
32 5 5 4 4 5 4 4 4 5 40
33 4 5 5 5 5 5 4 4 4 41
34 4 4 4 4 4 4 4 4 4 36
35 4 5 5 5 4 4 4 5 4 40
36 5 4 5 4 4 4 5 4 4 39
37 4 5 5 5 5 5 5 4 4 42
38 4 4 4 4 4 5 4 5 4 38

lxxiv
No Variable of Brand Image (X3)
Total S12 S13 S14 S15 S16 S17 S18 S19 S20
39 4 5 5 5 5 5 4 5 4 42
40 4 4 5 5 5 5 4 5 4 41
41 4 4 4 5 4 4 4 4 4 37
42 5 4 4 4 4 5 4 5 4 39
43 4 5 5 4 4 4 4 4 4 38
44 4 4 5 5 5 5 5 5 5 43
45 4 5 4 4 4 5 4 4 4 38
46 4 4 5 4 5 4 4 4 4 38
47 4 5 5 5 5 5 4 4 4 41
48 4 5 4 5 5 5 4 5 4 41
49 5 5 5 5 5 5 5 5 5 45
50 4 5 4 4 4 5 4 5 4 39
51 4 5 5 4 4 4 2 5 5 38
52 4 5 5 5 5 4 4 4 4 40
53 4 5 5 5 5 5 5 5 5 44
54 5 4 5 5 5 5 4 5 5 43
55 5 5 5 5 5 5 4 5 4 43
56 4 4 5 5 4 4 3 4 4 37
57 4 5 4 4 5 4 4 5 4 39
58 4 5 5 5 4 4 4 4 5 40
59 5 5 5 5 5 5 5 5 5 45
60 5 5 5 5 5 5 5 5 5 45
61 4 5 5 5 5 5 4 4 4 41
62 4 4 4 4 4 4 4 4 4 36
63 4 5 5 5 4 4 4 5 4 40
64 5 4 5 4 4 4 5 4 4 39
65 4 5 5 5 5 5 3 4 4 40
66 4 4 4 4 4 5 4 5 4 38
67 4 5 5 5 5 5 4 5 4 42
68 4 4 5 5 5 5 4 5 4 41
69 4 4 4 5 4 4 4 4 4 37
70 5 4 4 4 4 5 4 5 4 39
71 5 5 5 5 5 5 5 5 5 45
72 5 5 5 5 5 5 5 5 4 44
73 5 5 5 5 5 5 5 5 5 45
74 4 5 5 5 5 5 3 5 5 42
75 4 5 5 5 5 5 5 5 5 44
76 4 5 5 4 4 4 2 5 5 38
77 2 5 5 5 5 4 4 4 4 38
78 4 5 5 5 5 5 2 5 5 41
79 2 4 5 5 5 5 4 5 5 40
80 5 5 5 5 5 5 5 5 5 45
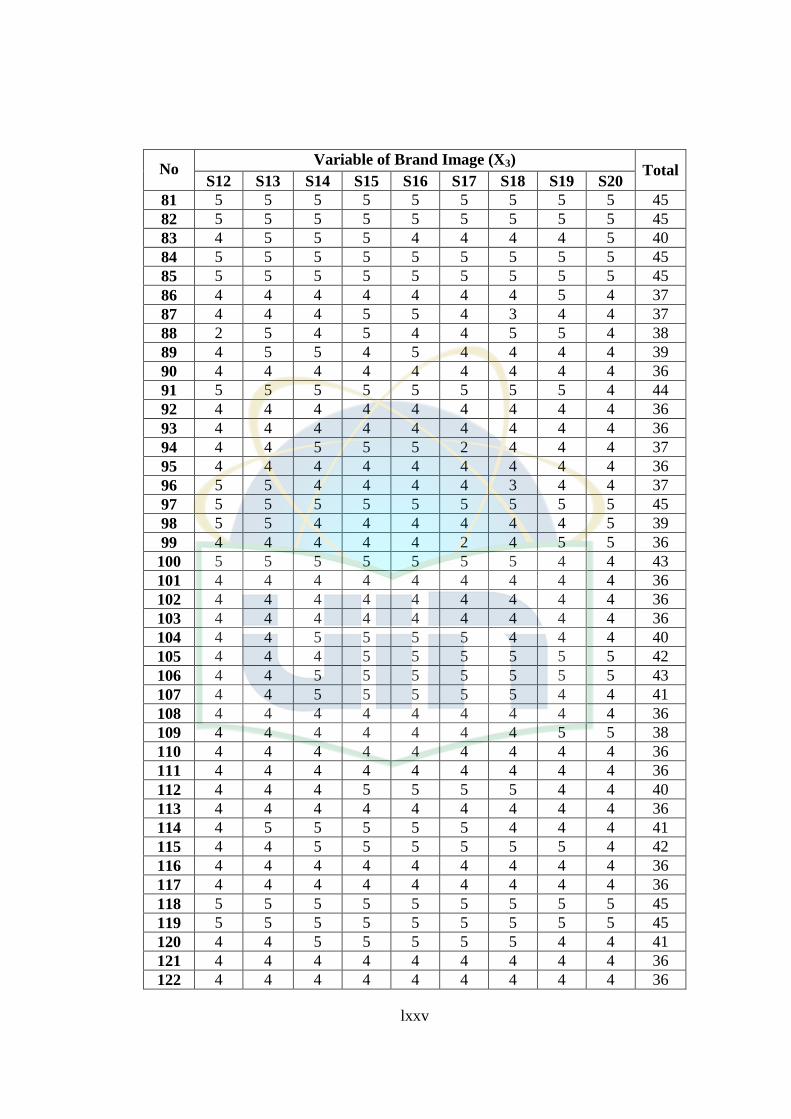
lxxv
No Variable of Brand Image (X3)
Total S12 S13 S14 S15 S16 S17 S18 S19 S20
81 5 5 5 5 5 5 5 5 5 45
82 5 5 5 5 5 5 5 5 5 45
83 4 5 5 5 4 4 4 4 5 40
84 5 5 5 5 5 5 5 5 5 45
85 5 5 5 5 5 5 5 5 5 45
86 4 4 4 4 4 4 4 5 4 37
87 4 4 4 5 5 4 3 4 4 37
88 2 5 4 5 4 4 5 5 4 38
89 4 5 5 4 5 4 4 4 4 39
90 4 4 4 4 4 4 4 4 4 36
91 5 5 5 5 5 5 5 5 4 44
92 4 4 4 4 4 4 4 4 4 36
93 4 4 4 4 4 4 4 4 4 36
94 4 4 5 5 5 2 4 4 4 37
95 4 4 4 4 4 4 4 4 4 36
96 5 5 4 4 4 4 3 4 4 37
97 5 5 5 5 5 5 5 5 5 45
98 5 5 4 4 4 4 4 4 5 39
99 4 4 4 4 4 2 4 5 5 36
100 5 5 5 5 5 5 5 4 4 43
101 4 4 4 4 4 4 4 4 4 36
102 4 4 4 4 4 4 4 4 4 36
103 4 4 4 4 4 4 4 4 4 36
104 4 4 5 5 5 5 4 4 4 40
105 4 4 4 5 5 5 5 5 5 42
106 4 4 5 5 5 5 5 5 5 43
107 4 4 5 5 5 5 5 4 4 41
108 4 4 4 4 4 4 4 4 4 36
109 4 4 4 4 4 4 4 5 5 38
110 4 4 4 4 4 4 4 4 4 36
111 4 4 4 4 4 4 4 4 4 36
112 4 4 4 5 5 5 5 4 4 40
113 4 4 4 4 4 4 4 4 4 36
114 4 5 5 5 5 5 4 4 4 41
115 4 4 5 5 5 5 5 5 4 42
116 4 4 4 4 4 4 4 4 4 36
117 4 4 4 4 4 4 4 4 4 36
118 5 5 5 5 5 5 5 5 5 45
119 5 5 5 5 5 5 5 5 5 45
120 4 4 5 5 5 5 5 4 4 41
121 4 4 4 4 4 4 4 4 4 36
122 4 4 4 4 4 4 4 4 4 36

lxxvi
No Variable of Brand Image (X3)
Total S12 S13 S14 S15 S16 S17 S18 S19 S20
123 4 4 4 4 4 4 4 4 4 36
124 5 5 5 5 5 5 5 5 5 45
125 4 5 5 5 5 5 5 5 5 44
126 4 5 5 4 4 4 2 5 5 38
127 4 5 5 5 5 4 4 4 4 40
128 4 5 5 5 5 5 5 5 5 44
129 5 4 5 5 5 5 4 5 5 43
130 5 5 5 5 5 5 4 5 4 43
131 4 4 5 5 4 4 4 4 4 38
132 4 5 4 4 5 4 4 5 4 39
133 4 5 5 5 4 4 4 4 5 40
134 4 4 4 4 4 4 4 4 4 36
135 5 5 5 5 5 5 5 5 5 45
136 4 4 4 4 4 4 4 5 4 37
137 4 4 4 5 5 4 4 4 4 38
138 5 5 4 5 4 4 5 5 4 41
139 4 5 5 4 5 4 4 4 4 39
140 4 4 4 4 4 4 4 4 4 36
141 5 5 5 5 4 4 4 4 4 40
142 5 5 4 4 4 4 4 5 5 40
143 4 4 4 4 4 4 4 4 4 36
144 4 4 4 4 4 4 4 4 4 36
145 4 4 4 4 4 4 4 4 4 36
146 4 4 4 4 4 4 4 4 4 36
147 4 4 4 4 5 5 5 5 4 40
148 4 5 5 5 5 5 4 4 4 41
149 4 4 4 4 4 4 4 4 4 36
150 5 4 4 4 4 4 4 5 5 39
Total 640 680 684 688 679 666 629 676 652 6113

lxxvii
No Variable of Brand Trust (X4)
Total S21 S22
1 5 5 10
2 5 5 10
3 5 5 10
4 5 5 10
5 4 5 9
6 4 5 9
7 5 5 10
8 5 5 10
9 5 5 10
10 5 5 10
11 5 4 9
12 5 4 9
13 5 4 9
14 5 5 10
15 4 4 8
16 4 4 8
17 5 5 10
18 4 4 8
19 5 5 10
20 5 4 9
21 5 5 10
22 5 5 10
23 4 4 8
24 4 4 8
25 5 5 10
26 5 5 10
27 5 5 10
28 4 5 9
29 4 5 9
30 4 4 8
31 5 2 7
32 5 4 9
33 5 5 10
34 4 4 8
35 5 4 9
36 4 4 8
37 5 5 10
38 5 5 10

lxxviii
No Variable of Brand Trust (X4)
Total S21 S22
39 4 4 8
40 4 4 8
41 4 4 8
42 4 4 8
43 5 5 10
44 5 5 10
45 5 5 10
46 5 5 10
47 4 4 8
48 4 4 8
49 4 4 8
50 4 4 8
51 4 5 9
52 5 5 10
53 5 5 10
54 5 5 10
55 5 5 10
56 5 4 9
57 5 4 9
58 5 4 9
59 5 5 10
60 4 4 8
61 5 5 10
62 4 4 8
63 5 4 9
64 4 4 8
65 5 5 10
66 5 5 10
67 4 4 8
68 4 4 8
69 4 4 8
70 4 4 8
71 5 5 10
72 5 5 10
73 5 5 10
74 5 4 9
75 4 5 9
76 4 5 9
77 5 5 10
78 5 5 10
79 5 5 10
80 5 5 10

lxxix
No Variable of Brand Trust (X4)
Total S21 S22
81 5 4 9
82 5 4 9
83 5 4 9
84 5 5 10
85 4 4 8
86 4 4 8
87 2 5 7
88 4 4 8
89 5 5 10
90 5 4 9
91 4 4 8
92 4 4 8
93 5 4 9
94 4 5 9
95 4 5 9
96 4 4 8
97 5 5 10
98 5 5 10
99 5 5 10
100 4 5 9
101 5 5 10
102 5 5 10
103 4 5 9
104 5 4 9
105 4 5 9
106 4 4 8
107 4 4 8
108 4 4 8
109 4 5 9
110 4 4 8
111 4 4 8
112 4 4 8
113 2 5 7
114 5 5 10
115 5 5 10
116 4 4 8
117 4 4 8
118 5 4 9
119 5 5 10
120 5 5 10
121 5 5 10
122 5 5 10

lxxx
No Variable of Brand Trust (X4)
Total S21 S22
123 5 5 10
124 5 5 10
125 4 5 9
126 4 5 9
127 5 5 10
128 5 5 10
129 5 5 10
130 2 5 7
131 5 4 9
132 5 4 9
133 5 4 9
134 5 5 10
135 4 4 8
136 4 4 8
137 5 5 10
138 4 4 8
139 5 5 10
140 5 4 9
141 4 4 8
142 4 4 8
143 4 5 9
144 5 4 9
145 4 5 9
146 5 5 10
147 5 5 10
148 5 5 10
149 4 4 8
150 4 4 8
Total 680 680 6069

lxxxi
No Variable of Purchase Decision (Y)
Total S23 S24 S25 S26 S27 S28 S29 S30 S31
1 5 5 5 5 5 5 5 5 5 45
2 5 5 5 5 5 5 5 5 5 45
3 5 5 5 5 5 5 5 5 5 45
4 5 5 5 5 5 5 5 5 5 45
5 5 5 5 5 5 5 5 5 5 45
6 4 5 5 5 4 5 5 5 5 43
7 5 5 5 5 5 5 4 4 5 43
8 5 5 5 5 5 5 5 5 5 45
9 5 5 5 5 5 5 5 5 5 45
10 5 5 5 5 5 5 5 5 5 45
11 4 4 4 4 4 4 4 4 4 36
12 4 4 4 4 4 4 4 4 4 36
13 4 4 4 4 4 4 2 4 4 34
14 5 5 5 5 5 5 5 5 5 45
15 4 5 4 4 4 4 4 5 4 38
16 2 4 5 5 4 4 4 4 5 37
17 4 4 5 4 4 4 4 5 4 38
18 5 4 5 5 4 5 4 5 5 42
19 5 4 5 5 4 5 5 4 4 41
20 4 4 5 4 4 4 4 4 5 38
21 5 4 4 5 4 5 5 4 5 41
22 4 4 4 5 5 4 4 5 5 40
23 4 4 4 4 4 5 5 5 4 39
24 4 4 4 4 5 5 5 5 4 40
25 4 4 5 5 5 5 4 4 4 40
26 4 4 4 4 4 4 4 4 4 36
27 4 4 4 4 4 4 4 5 5 38
28 4 4 5 4 4 4 4 4 4 37
29 4 4 4 4 5 4 5 4 4 38
30 4 4 4 4 4 5 5 5 5 40
31 4 4 4 4 4 4 4 5 5 38
32 2 4 4 4 5 4 4 4 5 36
33 4 4 5 5 5 5 5 4 5 42
34 4 4 4 4 5 5 5 5 5 41
35 4 4 4 4 4 4 4 4 4 36
36 4 4 4 4 4 4 4 4 4 36
37 5 5 4 5 5 5 5 5 5 44
38 5 5 4 5 4 5 5 5 5 43

lxxxii
No Variable of Purchase Decision (Y)
Total S23 S24 S25 S26 S27 S28 S29 S30 S31
39 4 4 4 5 4 4 5 5 5 40
40 4 4 4 5 4 4 5 5 5 40
41 4 4 4 4 4 4 4 5 5 38
42 4 4 4 4 4 4 4 4 4 36
43 4 4 4 4 5 5 4 4 5 39
44 4 4 4 4 5 4 4 4 4 37
45 4 4 4 4 4 4 5 5 5 39
46 4 4 5 5 5 5 5 5 5 43
47 4 5 5 5 5 5 5 4 4 42
48 4 4 4 4 4 4 4 4 4 36
49 4 4 4 4 4 4 4 4 4 36
50 4 4 4 4 4 4 4 4 4 36
51 4 5 5 5 4 5 5 5 5 43
52 5 5 5 5 5 5 4 2 5 41
53 5 5 5 5 5 5 5 5 5 45
54 5 5 5 5 5 5 5 5 5 45
55 5 5 5 5 5 5 5 5 5 45
56 4 4 4 4 4 4 4 4 4 36
57 4 4 4 4 4 4 4 4 4 36
58 4 4 4 4 4 4 4 4 4 36
59 5 5 5 5 5 5 5 5 5 45
60 4 5 4 4 4 4 4 5 4 38
61 4 4 5 5 5 5 2 4 5 39
62 4 4 4 4 5 5 5 5 5 41
63 4 4 4 4 4 4 4 4 4 36
64 4 4 4 4 4 4 4 4 4 36
65 2 5 4 5 5 5 5 5 5 41
66 5 5 4 5 4 5 5 5 5 43
67 4 4 4 5 4 4 5 5 5 40
68 4 4 4 5 4 4 5 5 5 40
69 4 4 4 4 4 4 4 5 5 38
70 4 4 4 4 4 4 4 4 4 36
71 5 5 5 5 5 5 5 5 5 45
72 5 5 5 5 5 5 5 5 5 45
73 5 5 5 5 5 5 5 5 5 45
74 4 4 4 4 4 4 4 4 4 36
75 4 4 4 4 4 4 4 4 4 36
76 4 5 5 5 4 5 5 5 5 43
77 5 5 5 5 5 5 4 4 5 43
78 5 5 5 5 5 5 5 5 5 45
79 4 4 4 4 4 4 4 4 4 36
80 4 4 4 4 4 4 4 4 4 36

lxxxiii
No Variable of Purchase Decision (Y)
Total S23 S24 S25 S26 S27 S28 S29 S30 S31
81 5 5 5 5 5 5 5 4 4 43
82 5 5 5 5 5 5 5 5 5 45
83 5 4 5 5 5 5 3 4 5 41
84 5 5 5 5 5 5 5 5 5 45
85 4 5 4 4 4 4 4 5 4 38
86 5 4 5 5 4 4 4 4 5 40
87 4 4 5 4 4 4 4 5 4 38
88 5 4 5 5 4 5 4 5 5 42
89 5 4 5 5 4 5 5 4 4 41
90 4 4 5 4 4 4 4 4 5 38
91 4 4 4 4 5 5 4 4 4 38
92 4 5 5 5 5 5 5 5 5 44
93 4 4 4 4 4 4 4 4 5 37
94 4 4 4 4 4 4 4 4 4 36
95 4 4 4 4 4 3 5 5 5 38
96 5 5 4 4 4 4 4 4 4 38
97 4 4 4 4 4 4 4 4 4 36
98 4 4 4 4 4 4 4 4 4 36
99 4 4 4 4 5 5 5 5 5 41
100 4 4 4 4 4 4 4 4 4 36
101 4 4 5 5 5 5 5 5 4 42
102 4 5 4 4 4 4 4 4 4 37
103 4 4 4 4 4 4 4 4 4 36
104 5 5 5 5 5 5 5 5 5 45
105 5 5 5 5 5 5 5 5 5 45
106 5 5 5 5 5 5 4 4 4 42
107 5 5 5 5 5 5 5 5 4 44
108 5 5 5 5 4 4 4 4 4 40
109 5 5 4 4 4 4 4 4 5 39
110 5 4 4 4 4 4 4 4 4 37
111 5 5 5 5 5 5 5 5 5 45
112 5 5 5 5 5 5 5 5 5 45
113 4 4 4 4 4 4 4 4 4 36
114 4 4 4 4 4 4 4 4 4 36
115 4 4 4 4 5 5 5 5 4 40
116 2 4 4 4 4 4 4 4 4 34
117 5 5 5 5 5 4 4 4 4 41
118 5 5 5 5 4 4 4 4 4 40
119 4 4 4 4 4 4 4 4 4 36
120 5 5 4 4 4 4 4 5 5 40
121 5 5 5 5 5 5 5 5 5 45
122 5 5 5 5 5 5 5 5 5 45

lxxxiv
No Variable of Purchase Decision (Y)
Total S23 S24 S25 S26 S27 S28 S29 S30 S31
123 5 5 5 5 5 5 5 5 5 45
124 5 5 5 5 5 5 5 5 5 45
125 5 5 5 5 5 5 5 5 5 45
126 4 5 5 5 4 5 5 5 5 43
127 5 5 5 5 5 5 4 4 5 43
128 5 5 5 5 5 5 5 5 5 45
129 5 5 5 5 5 5 5 5 5 45
130 5 5 5 5 5 5 5 5 5 45
131 4 4 4 4 4 4 4 4 4 36
132 4 4 4 4 4 4 4 4 4 36
133 4 4 4 4 4 4 2 4 4 34
134 5 5 5 5 5 5 5 5 5 45
135 4 5 4 4 4 4 4 5 4 38
136 2 4 5 5 4 4 4 4 5 37
137 4 4 5 4 4 4 4 5 4 38
138 5 4 5 5 4 5 4 5 5 42
139 5 4 5 5 4 5 5 4 4 41
140 4 4 5 4 4 4 4 4 5 38
141 5 5 5 5 5 4 4 4 4 41
142 5 5 5 4 4 4 4 4 4 39
143 4 5 5 5 5 4 4 4 4 40
144 4 4 4 4 4 4 4 4 4 36
145 4 4 4 4 4 4 4 4 4 36
146 4 4 2 4 4 4 4 4 4 34
147 5 4 4 5 5 5 5 5 4 42
148 5 4 4 5 5 4 4 4 4 39
149 5 4 4 5 5 5 5 5 5 43
150 5 5 4 4 4 4 4 4 5 39
Total 654 664 671 678 666 672 660 673 681 6073

lxxxv
Attachment V : The Results of Validity and Reliability Test
THE RESULTS OF VALIDITY TEST
Product Quality (X1)
Product Availability (X2)
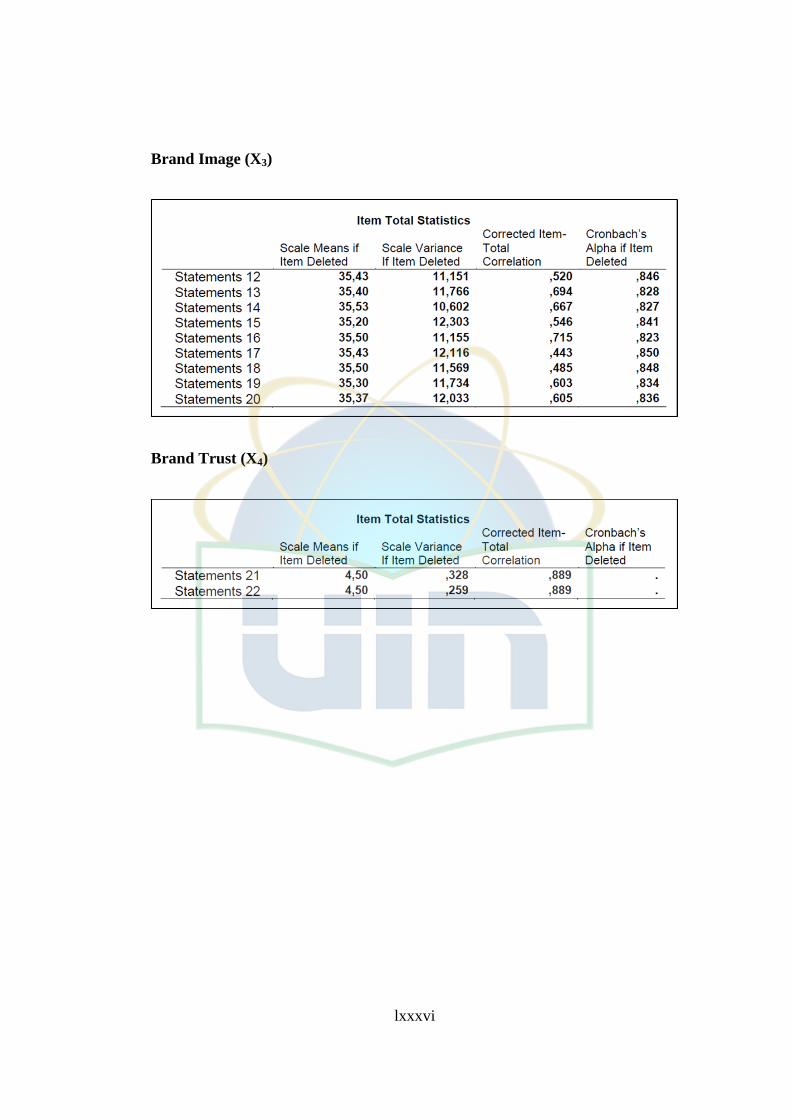
lxxxvi
Brand Image (X3)
Brand Trust (X4)

lxxxvii
Purchase Decision (Y)
THE RESULTS OF RELIABILITY TEST
Product Quality (X1)
Product Availbility (X2)

lxxxviii
Brand Image (X3)
Brand Trust (X4)
Purchase Decision (Y)

lxxxix
Attachment VI : The Results of Normality Test
THE RESULTS OF NORMALITY TEST

xc
Attachment VII : The Results of Multicollinearity Test
THE RESULTS OF MULTICOLLINEARITY TEST

xci
Attachment VIII : The Results of Heteroscedasticity Test
THE RESULTS OF HETEROSCEDASTICITY TEST

xcii
Attachment IX : The Results of Multiple Linier Regression Test
THE RESULTS OF MULTIPLE LINIER REGRESSION TEST

xciii