the influence of personal and cultural factors …
TRANSCRIPT

THE INFLUENCE OF PERSONAL AND CULTURAL
FACTORS TOWARD CONSUMER PURCHASE
DECISION
(Case Study of Starbucks in South Jakarta)
By
Ibtihal Alfa Adrian
014201300076
A thesis presented to the
Faculty of Business President University in partial fulfillment of the requirements for
Bachelor Degree in Business Major of Management
February 2017

i
i

ii
ii

iii
iii

iv
ABSTRACT
The purpose of this research is to analyse the influence of personal and cultural factors toward consumer purchase decision of Starbucks in South Jakarta. Those factors are important for company because it would influence consumer purchase decision. This research use quantitative analysis with has four independent variables (lifestyle, economic condition, social class and culture) and one dependent variable (consumer purchase decision). The analysis method that is used in this research is multiple linear regression. The result show, there are significant influence of lifestyle, economic condition and culture toward consumer purchase decision. There is simultaneous significant influence of lifestyle, economic condition, social class and culture toward consumer purchase decision with adjusted R square is 50.6%, and the rest is 49.4% influence by other factors.
Keywords: Personal Factor, Cultural Factor, Lifestyle, Economic Condition, Social Class, Culture, Consumer Purchase Decision.

v
ACKNOWLEDGEMENT
This is the happiest moment after struggling with my undergraduate thesis and
finishing my study at President University. I still remember three years ago, Mom
and Dad accompany me to President University and moving in to dormitory and
time goes so fast directly.
Through this opportunity, I would like to show my gratitude to
1. My Parents, Mom and Dad. I don’t know how to describe my gratitude to
both of you in words, but I am so glad and proud to have parents like mom
and dad. You are the best parents in the world. Thanks for everything,
thanks for your unlimited support and care. I love you so much.
2. My Brother, Thank you for your love and support during this thesis period.
3. My Uncles, Aunties, and Cousins thank you for helping me during the
thesis period.
4. My Thesis Adviser, Mr. Purwanto, ST, MM, Thank you so much for your
guidance, attention, patience, and kindness. I’m so proud to have you as
my thesis adviser, thanks for being my thesis adviser.
5. My friends International Business 2013, I cant explain one by one but all
of you always support and help me to finish this thesis all the time. A lot
of memories can part of the management students in the President
University.
6. My best partner in this university Ezzie Mayangsari Sukandar, you are
very care and always support me since first time in university until
defense. And her friends is Shania Dwi Rantika and Mega Fatiyah.
7. The last one is for all batch 2013. Time goes so fast with all memories.

vi
TABLE OF CONTENTS
PANEL OF EXAMINERS APPROVAL SHEET………......................................i
SKRIPSI ADVISOR RECOMMENDATION LETTER......................................ii
DECLARATION ORIGINALITY.........................................................................iii
ABSTRACT..............................................................................................................iv
ACKNOWLEDGEMENT........................................................................................v
TABLE OF CONTENTS.........................................................................................vi
LIST OF TABLES...................................................................................................ix
LIST OF FIGURES..................................................................................................x
CHAPTER I INTRODUCTION..............................................................................1
1.1 Background of the Study..............................................................................1
1.2 Problem Identification..................................................................................4
1.3 Statement of Problem...................................................................................4
1.4 Research Objective.......................................................................................5
1.5 Significance of the Study..............................................................................5
1.6 Limitation.....................................................................................................6
1.7 Organization of Study...................................................................................6
CHAPTER II LITERATURE REVIEW................................................................8
2.1 Consumer Purchase Decision.......................................................................8
2.1.1 Characteristics Affecting Consumer Purchase Decision................11
2.2 Previous Research......................................................................................17
2.3 Research Gaps............................................................................................18
2.4 Theoretical Framework..............................................................................19

vii
2.5 Hypothesis..................................................................................................20
CHAPTER III METHODOLOGY........................................................................22
3.1 Research Method........................................................................................22
3.2 Operational Definition Variables...............................................................23
3.3 Research Framework..................................................................................24
3.4 Research Instrument...................................................................................25
3.5 Sampling Design..........................................................................................26
3.5.1 Population.......................................................................................26
3.5.2 Margin of Error...............................................................................26
3.5.3 Sample............................................................................................26
3.5.4 Sampling Technique.......................................................................27
3.5.5 Data Collection Method.................................................................27
3.6 Reliability and Validity Test........................................................................27
3.6.1 Reliability Test...............................................................................27
3.6.2 Validity Test...................................................................................29
3.7 Descriptive Statistics Analysis.....................................................................30
3.7.1 Mean...............................................................................................30
3.7.2 Standard Deviation.........................................................................30
3.7.3 Maximum and Minimum................................................................31
3.8 Classic Assumption Test..............................................................................31
3.9 Multiple Regression Analysis......................................................................32
3.10 Hypothesis Test..........................................................................................33
3.10.1 T-Test...............................................................................................33
3.10.2 F-Test...............................................................................................34
3.10.3 The coefficient of determination (R²)..............................................35
CHAPTER IV ANALYSIS AND INTERPRETATION…………………….....36
4.1 Company Profile..........................................................................................36
4.2 Data Result Analysis....................................................................................37
4.3 Pre Test Analysis.........................................................................................37
4.3.1 Validity Test...................................................................................37
4.3.2 Reliability Test...............................................................................40

viii
4.4 Respondent Profiles.....................................................................................41
4.3.1 Gender...................................................................................41
4.3.2 Age........................................................................................42
4.3.3 Student Allowance per Per Month........................................43
4.5 Descriptive Statistics....................................................................................44
4.6 Classic Assumptions Test ...........................................................................45
4.6.1 Normality Test ...............................................................................45
4.6.2 Heteroscedascity Test ....................................................................47
4.6.3 Multicollinearity Test ....................................................................47
4.6.4 Autocorrelation Test ......................................................................48
4.7 Multiple Regression Analysis .....................................................................49
4.8 Hypothesis Test............................................................................................51
4.8.1 T-Test.............................................................................................51
4.8.2 F-Test .............................................................................................52
4.9 Coefficient of Determination (R²) ...............................................................52
4.10 Interpretation Result...................................................................................53
CHAPTER V CONCLUSIONS AND RECOMMENDATIONS……………....57
5.1 Conclusions..................................................................................................57
5.2 Recommendations........................................................................................58
REFERENCES........................................................................................................60
APPENDICES .........................................................................................................65
APPENDIX 1 – Data Collection Pre Test.........................................................65
APPENDIX 2 – Reliability and Validity Test...................................................68
APPENDIX 3 – Questionnaire..........................................................................75
APPENDIX 4 – Data Collection for 100 Respondents.....................................83
APPENDIX 5 – Output SPSS 23.0....................................................................90
APPENDIX 6- Turnitin……………………………………………………….94

ix
List of Tables
Table 3.1 Operational Definitions.........................................................................23
Table 4.1 Result of Validity Test ..........................................................................38
Table 4.2 Result of Reliability Test ......................................................................41
Table 4.3 Descriptive Statistic...............................................................................44
Table 4.4 Multicollinearity Test............................................................................48
Table 4.5 Dubin Watson Result.............................................................................49
Table 4.6 Multiple Linear Regression ..................................................................49
Table 4.7 Significance Table.................................................................................50
Table 4.8 F-Test Result ANOVA..........................................................................52
Table 4.9 Coefficient of Determination Result ....................................................53

x
List of Figures
Figure 1.1 Total Outlets Starbucks..........................................................................3
Figure 2.1 Consumer Purchase Decision Process...................................................8
Figure 2.2 Characteristics Affecting Consumer Purchase Decision......................11
Figure 2.3 Theoretical Framework........................................................................20
Figure 3.1 Research Framework............................................................................23
Figure 4.1 Gender .................................................................................................41
Figure 4.2 Age ......................................................................................................42
Figure 4.3 Student Allowance per Month ............................................................43
Figure 4.4 Histogram.............................................................................................45
Figure 4.5 P- Plot Graph........................................................................................46
Figure 4.6 Heteroscedascity..................................................................................47

1
CHAPTER I
INTRODUCTION
1.1 Research Background
In this era, coffee shop has become a habit of Indonesian people. Not only
drinking coffee, but the coffee shop itself is usually the destination to perform or
do certain activities, such as meeting with clients or for group study among
students (Setyaningsih, 2007). This is also supported by the widespread of coffee
shop is also not far from the influence of the big city that presents a lot of pleasure
seekers and became a favorite hangout for middle and upper class people
(Herlyana, 2012).
In Indonesia, coffee lovers comes from different age. From teenagers to adults and
even seniors, it is countless for them, coffee is a daily consumption and is part of
their daily food and drink. Coffee has now become part of the lifestyle, especially
for them who lives in big. Moreover, with the increasing number of specialty
coffee cafes and innovation in the manufacture of coffee, thus giving more and
more coffee drinkers in the world.
Coffee shop is not just a simple hangout place. Now the entertainment also can be
obtained. From live music to a place for discussion and gathering. Coffee shops
are really easy to be found, around campus, offices, or shopping centers,
especially in large cities. Based on studies conducted by Nielsen (2012) in nine
major cities in Indonesia coffee shop visitor numbers increased by nearly 3 times
in the last 3 years from 1.2 million people ranging from 10 years old and over in
2011 to 3.5 million in 2013. The biggest consumers are from Jakarta (64%), and
Starbucks selected as the most preferred (32%), then the coffee bean (21%). The
most total outlets Starbucks in Jakarta located in South Jakarta (Starbucks.co.id,
2016).
Starbucks is the coffee shop that spread from office buildings, around streets,
malls until located in the Universities area. Since the first time Starbucks entered

2
Indonesia, Indonesian people would rather spend for their money for the franchise
outlets rather than western lifestyle (Xavier, 2012). Starbucks Coffee is a brand
that originated from the United States. Starbucks Coffee is known as a place for
chilling and a place to socialize in an urban society. Starbucks Coffee was first
founded in 1971 in Seattle, USA. The company was found by three persons; Jeny
Baldwin, Zey Siegel and Bowker Goredon. In 1982, Howard Schultz joined in,
since then Starbucks Coffee has been a reseller of local coffee beans that are quite
famous and respected by people around Seattle. Not only as a coffee shop, but
Starbucks opened their branches in places that are strategic such as airports, malls
and hotels.
Above is a global history of Starbucks Coffee. While in Indonesia, PT. Sari
Coffee Indonesia is the sole holder of the right to introduce and market Starbucks
Coffee in Indonesia. PT. Sari Coffee Indonesia is a subsidiary of PT. Mitra Adi
Perkasa. On May 17, 2002, Starbucks Coffee opened its first store in Indonesia.
The shop is located in Plaza Indonesia, Central Jakarta. Since then, the market
development Starbucks Coffee in Indonesia drove rapidly.
Starbucks Coffee customers come not merely want to drink coffee, but because
there is a touch of emotion that were presented outlets. Whether it's a sense of
pride, prestige, or warmth. One of the strategy from Starbucks Coffee Indonesia is
how they can attract new customers but still making the old customers stays
longer to enjoy the coffees that are offered in their shop. They came up with
installing Wi-Fi in the café, with this kind of facility consumers can still continue
their tasks or business activities while enjoying Starbucks Coffee.
Based on the data, Indonesia is on the top 10th position of the number outlets in
third quarter of 2016.

3
Figure 1.1 Total Outlets Starbucks
(Source: adapted from Knoema, 2016)
Consumers have the position as one of the competitive strength through their
bargaining power. The bargaining power of consumers is very important because
they have needs and desires. To fulfil their needs, they are also the one who have
the purchasing power (time and money), deciding their choices and make a
purchase decision. According to Prasetijo, Ristiyanti & Lhalauw, J. (2005)
companies that fail to understand the needs, desires, tastes and consumer buying
decision process will fail in marketing and sales. Companies that have a
competitive advantage may affect customers or prospects (potential customers) to
a steady drop in its product selection.
Consumers decision is the one of the process from the consumer after
reconsidering a few things before deciding to purchase the product. The decision
making process begins with needs. In fulfilling this requirement, it needs to be
evaluated to obtain the best alternative of consumer perception. Consumers need
information that the quantity and importance level depending on the needs of
consumers and situations.

4
1.2 Problem Identification
Generally, people who consume Starbucks products are office workers, because
the price of the product is quite high. But, along with the development of more
advanced age and modern students, they switch to a more fun place to do their
tasks, so the task is not conducted in a boring place. Starbucks became the most
common destination in Jakarta, it has become the place for meeting with the
friends or colleagues, and hanging out for the students in Jakarta.
Researcher interested to adopt the description to the research about the influence
of personal and cultural factors toward consumer purchasing decisions Starbucks
Coffee in South Jakarta. Researcher choose Starbucks as a place of research,
because Starbucks Coffee functioned as a coffee shop that sells various types of
coffee and snacks with diverse variants, and demand a lot of consumers and use
for many function and needs, especially the students. University students also
have more free time than school children. As already explained above, we often
see the Starbucks Coffee visitors are mostly the most exclusive people.
Different consumers have different characteristics that influence their purchasing
decision. Social factors, personal factors, cultural factors and psychological
factors are characteristics that influence consumer purchase decision (Kotler &
Armstrong, 2012). Particularly in this research, the researcher is going to explore
the role of personal (including lifestyle and economic condition) and cultural
(including social class and culture) in order to know how they would influence to
the consumer purchase decision of Starbucks in South Jakarta.
1.3 Statement of Problem
According to this research, there are personal and cultural factors that influence
consumer purchase decision. Researcher intends to solve the problem as follows:
1. Is there any significant influence of lifestyle toward consumer Purchase
Decision?

5
2. Is there any significant influence of economic condition toward consumer
Purchase Decision?
3. Is there any significant influence of social class toward consumer Purchase
Decision?
4. Is there any significant influence of culture toward consumer Purchase
Decision?
5. Is there any simultaneous significant influence of lifestyle, economic
condition, social class and culture toward consumer purchase decision?
1.4 Research Objective
The research objective of the study as follow:
1. To find out the significant influence of Lifestyle toward consumer
Purchasing Decision.
2. To find out the significant influence of Economic Condition toward
consumer Purchasing Decision.
3. To find out the significant influence of Social Class toward consumer
Purchasing Decision.
4. To find out the significant influence of Culture toward consumer
Purchasing Decision.
5. To find out the simultaneous significant influence of lifestyle, economic
condition, social class and culture toward consumer purchasing decision.
1.5 Significance of Study
This research hopefully can expand for the knowledge, information, and
suggestion, for:
1. For company: This research would identify the factors listed above for
influence consumer behavior for Starbucks, which is beneficial to achieve the
goals of the company for the future.

6
2. For researcher: It is an opportunity to apply the theories and knowledge
materials while study in university, to do the research into the following issues.
3. For future researcher: For the reference materials that will help them to
provide information conducting research in the future.
4. For university: Increase literature and study in field of personal and cultural
factors towards consumer purchase decision.
1.6 Limitation
1. This research only focus on personal and cultural factors that influence
consumer purchase decision in Starbucks
2. The respondent of this research only students who consume Starbucks in South
Jakarta.
1.7 Organization of Study
CHAPTER 1: INTRODUCTION
This chapter will consist of the research, including problem identification,
research objective, significant study, research limitation and organization of study.
CHAPTER 2: LITERATURE REVIEW
This chapter will explain about the theories of each variable, including dependent
and independent variables use in this research, show previous research and
research gap that research finds, research framework and finally, it is the
hypothesis.
CHAPTER 3: RESEARCH METHODOLOGY
This chapter will begin with the theoretical framework and explain hypothesis
development, operational definition of each variable, research instrument and
sampling of the research. The most important of this part is introduce the

7
hypothesis test, multiple linier regression, classical assumption test and some
other methods data collection and analysis.
CHAPTER 4 RESULT AND DISCUSSION
The chapter will explain data analysis from the result and interpretation. Through
SPSS 23.0 to obtain and explain the final result.
CHAPTER 5 CONCLUSION AND RECOMMENDATION
This chapter will conclude whole of research in conclusion and recommendation.
Summarize from the previous chapter. And provide recommendation for future
researcher, researcher hope that the recommendation useful for other research.

8
CHAPTER II
LITERATURE REVIEW
This chapter will explain about the theories of each variable, including dependent
and independent variables use in this research, show previous research and
research gap that research finds, research framework and finally, it is the
hypothesis.
2.1 Consumer Purchase decision
Consumers are individuals that buy the products for the personal consumption
(Kotler & Armstrong, 2012). The activities those consumers undertake when
obtaining, consuming and disposing of products is known as consumer behavior.
Consumer behavior involves studying how people buy, what they buy, and why
they buy. The consumer behavior model suggested that when consumer wanted to
make purchase decision, they will pass through the process through need
recognition, information search, evaluation alternatives, purchase decision and
post purchase behavior. At last, the consumer will choose product to consume
from various choice in market.
Figure 2.1 Consumer Purchase Decision Process
(Source: Kotler and Armstrong, 2012)

9
Kotler and Armstrong (2012) suggest that consumer pass through all five stages in
every purchase. Figure 2.1 is recommended because it shows all the consideration
that arise when consumer faces new and complex situation.
According to Kotler and Armstrong (2012), the first stage of buyer decision
process, in which the consumer recognition a problem. Need recognition is the
result of a discrepancy between desired state and an actual state that is sufficient
to arouse and activate the decision process (See, 2001). Based on Hawkins, Best
and Coney (2004), an actual state is the way an individual perceives his or her
feelings and situation to be at the present time. A desire state is the way an
individual want to feel or be at the present time. On the other hand, the need can
be triggered by the internal stimuli when the normal person needs (Hunger, thirst)
raises to level high enough to become a drive. (Kotler et.al, 2009) A need can also
be triggered by external stimuli (information about product from friends).
The next stage is information search. Kotler and Armstrong (2012) define the
information search stage as the stage of buyer decision process in which the
consumer is aroused to search more information, consumer may simply have
heightened attention or may go into active information research. Consumer can
obtain information from any several sources. These include personal sources
(family, friends, neighbors), commercial sources (advertising, sales people,
websites), public sources (mass media, internet search) and experiential sources
(examining, using the product).
During and after the time that consumer gathers information about various
alternative solutions to recognized problem. The consumer evaluates the
alternatives and select the course of action that seem most likely to solve the
problem (Hawkins & Mothersbaugh, 2010). That is evaluation of alternatives, the
third steps of consumer decision process. According to Kotler and Armstrong
(2012) alternatives evaluation is the stage in which the consumer uses information
to evaluate alternatives brand in the choice set. The consumer arrives at attitude
toward different brands through some evaluation procedures. How consumers

10
goes about evaluating purchase alternatives depends on the individual consumer
and specific buying situation.
The fourth step is purchase. In this step, consumer has decided which brand to
purchase. Based on Kotler and Armstrong concept (2012), there are two factors
that could come between purchase decision and purchase intention. The first
factor is attitudes of others. For example, when person give advices to his or her
friend to buy low prices of coffee shop, then his or her friend would reduce the
chances to buy more expensive coffee shop. The second factor is unexpected
situational factors. The consumer may from purchase intention based on factors
such as expected income, expected price, and expected product benefit. However,
unexpected event may change the purchase intention. For example, economy
might take a turn the worse.
The last step of consumer decision process is the post purchase evaluation.
According to Kotler and Armstrong (2012), post purchase evaluation is the stage
of buyer decision process in which consumer take further action after purchase,
based on satisfaction or dissatisfaction. McDaniel et.al (2006) stated that when
people recognize inconsistency between their value or opinion and their behavior,
they tend to feel an inner tension called cognitive dissonance. There are many
ways to reduce the dissonance both for the consumer and the marketers. The
consumer can justify decision, seek for new information, avoid contradictory
information, or return product. The marketers can send post purchase thank you or
letter, display product superiority in ads, or offer guarantees.
On the other hand, before consumer purchase decision comes to its process, there
are some factors that could influence consumer purchase decision process.
According Kotler and Armstrong (2012), there are four factors that could affect
the consumer purchase decision which classified into personal factors and cultural
factors. Those factors are lifestyle, economic condition, social class and culture.

11
2.1.1 Characteristic Affecting Consumer Purchase Decision
According to Kotler and Armstrong (2012), consumer purchase decision is very
much influence by cultural, social, personal and psychological factors. Below al
four main factors will be presented shortly, but the main focus will be set on the
personal and cultural factors because they include the most relevant discussion for
this research. The factors presented in the personal and cultural part are: lifestyle,
economic condition, social class and culture.
Figure 2.2 Characteristics Affecting Consumer Purchase Decision
(Source: Kotler and Armstrong, 2012)
2.1.1.1 Cultural Factors
Cultural factors exert the broadest and deepest influence on consumer purchase
decision. We will look at the role played by the culture, subculture and social
class.
2.1.1.1.1 Culture
Culture can come from family, habits, groups and the pattern of behavior from
environment of their staying (Kotler, 2012). Culture is the character of the entire
people since they have it from their around environment and can be transfer from
this generation to the next generation (Lamb, Hair, & Daniel, 2011). Culture is the
principal determining factor of desire and behavior someone (Simamora, 2008). In

12
this way, much of what we do is shared behavior, passed along from one member
of society to another. This research use culture as independent variable to analyze
influence consumer purchase decision of Starbucks.
2.1.1.1.2 Subculture
Under culture there are smaller groups of people or subculture, that share the same
value system based on common life experience and situations. These groups
include nationalities, religions, racial groups, and geographic regions (Palani &
Sohrabi, 2013).
2.1.1.1.3 Social Class
For every people has the social class, determine by the common values, interest
and behavior (Simamora, 2008). At one point, we can be classifying people has
the social class if support from the income, but social class determine by
background of their education qualification, resource they have and what is their
profession and other variables (Shah, 2010). Social class are society members
have values, interest and same behavior. This research use social class as
independent variable to analyse influence consumer purchase decision of
starbucks.
2.1.1.2 Personal Factors
Consumer decision is influence by personal factors such as lifestyle, economic
condition, age and life cycle, occupation, personality and self concept.
2.1.1.2.1 Age and Life Cycle Stage
People change the products they buy over their lifetimes (Yakup & Jablonks,
2012). Consume has different need in what they want in classification of age.
People also can change of their taste of the products. Life stage changes usually
result from demographics and life changing events marriage, having children,
purchasing home, divorce, children going to college, changes in personal income,
moving out of the house and retirement (Kotler and Armstrong, 2012). Marketers

13
often define their target market in terms of life cycle stage and develop
appropriate products and marketing plans (Yakup & Jablonks, 2012).
2.1.1.2.2 Occupation
Occupation refers doing of work in the activities and consumer can effect of
bought product or service (Kotler & Armstrong, 2012). Marketers try to identify
the occupational groups that have an above average interest in their products or
service. A company can even specialize in making products needed by given
occupational group.
2.1.1.2.3 Economic Situation
Economic situation has significant influence toward consumer purchase decision
which people who has high economical level has great purchasing power. People
who have high economic level mean that its people have many alternatives to
choose and get good quality of product without seeking the price.
The condition of buying tendency of an individual is directly proportional to
his/her income per month (Guide,2013). If economic indicators point to a
recession, marketers can take steps to re-price their products.
Consumer economic situation has great influence on his/her buying behavior. If
the income or savings customers high then he/she will purchase more expensive
for the products. Beside that, person with the low income or savings will purchase
the inexpensive products (Shah, 2010). So, this research use economic condition
as independent variable to analyze the influence of consumer purchase decision of
starbucks.
2.1.1.2.4 Lifestyle
Lifestyle is a way to segment people into groups based on three things: opinions,
attitudes, activities (Sodhganga, 2012). Lifestyle means the ways groups pattern
life of consumers spend time and money. Marketers exploit this desire to move
into a better lifestyle by showcasing people who are better off than the intended

14
target market in their ads, and also means for consumer to spend their time and
money in their daily activities. The pattern of a persons life can be show in their
activity, interests and opinions of the person. People who come of culture, social
class, and the same work may have a different lifestyle treat them in acquisition,
use and disposition of goods and service because it makes also pattern life of
people.
According to Wang, Tina, Yinyin (2010) lifestyle becomes popular concept and
marketers use it very commonly to build relationship of their product with the
target consumers daily life because consumer often choose product because they
are associated with certain lifestyle.
In this research, lifestyle is one of independent variable that influence of personal
and cultural factors toward consumer purchase decision.
2.1.1.2.5 Personality and Self Concept
Personality is usually describe in terms of traits such as self confidence,
dominance, sociability, adaptability, and aggressiveness. Personality can be useful
in analysing consumer behavior for certain product (Kotler and Armstrong, 2012).
2.1.1.3 Social Factors
The important social factors are: reference groups, family, role and status.
(Perreau, 2010.) It can be influence consumer to selecting of the products.
2.1.1.3.1 References Group and Family
During the decision making process, consumers tend to always influence by the
social group, which is people. Depending on various factors, consumers might
listen and believe in different social groups (Lay-Yee, Kok-Siew, & Yin-Fah,
2013).
Reference group is an actual or imaginary individual or group conceived of
having significant relevant upon an individual evaluations, aspiration or behavior

15
(Mohan, 2014). People often are influence by reference groups to which they do
not belong. On the other hand, word of mouth influence can have a powerful
impact on consumer buying behavior (Kotler and Armstrong, 2012). The personal
words and recommendation of trusted friends, associates, and others consumers
tend to be more credible than those coming from commercial sources, such as
advertisement or sales people. Most word of mouth influence happens naturally,
consumers start chatting about product they feel strong about one way or the other.
Within reference groups, people who exert influence on others because of specific
skills, knowledge, personality and other characteristics are known to be opinion
leader (Shah, 2010).
In accordance with references groups, family is a special primary group.
According to Commuri and Gentry (2000), family as consuming and decision
making unit central phenomenon in marketing and consumer behavior. Indeed,
family is the most important consumption buying organization in society, it has
been researched extensively (Kotler and Armstrong, 2012). For many consumers,
family is the most important social institution that strongly influence buyer
behavior, values, attitudes and self concept. Family is always responsible toward
children for socialization process in passing down cultural norms and values
(Kotler et al, 2009).
2.1.1.3.2 Roles and Status
Every individual in the society does have different roles and status depending
upon the position and relation that he or she holds in different group and
organization. Based on Kotler and Armstrong (2012), a role consist of the
activities people are expected to perform according to the people around them.
Each role carries status reflecting the general esteem and social position given to it
by society. People usually choose product appropriate to their roles and status.
2.1.1.4 Psychological Factors
A person purchasing choice are influence by four factors psychological factors:
motivation, perception, learning, and beliefs and attitudes.

16
2.1.1.4.1 Motivation
A motive is need that is sufficiently pressing to direct the person to seek
satisfaction (Kotler and Armstrong, 2012). Motivation is process that starts when
customers has needs that he or she wants to satisfy. This is satisfied through the
purchase the products. A person can be motivated to buy products for convenience,
style, for prestige, self pride, or being at par with others.
2.1.1.4.2 Perception
According Kotler and Armstrong (2012), perception is the process by which
people select, organize, and interpret information to form a meaningful picture of
the world. In other words, perception determines what people see and feel. People
can form different perceptions of the same stimulus because of three perceptual
processes (Kotler and Armstrong, 2012).
1. Selective attention: our eyes and minds seek out and notice only
information that interest us.
2. Selective distortion: we screen out or modify ideas, messages and
information that conflict with previously learned attitudes and beliefs.
3. Selective retention: we remember only what we want to remember.
2.1.1.4.3 Learning
Learning is about knowledge and experience. Consumer learning by the past
purchase experience that will be implemented to the future purchase (Kardes et al,
2011). Learning refers to the process by which consumers change their behavior
after they gain information or experience product. Basically, people seek the
information and knowledge that support is it as required or not. Before decide to
purchase the product, even people who has been consume the product he don’t
buy the crummy product.

17
2.1.1.4.4 Belief and Attitudes
According to Kotler and Armstrong (2012), belief is descriptive thought that a
person has about something. Belief may be based on real knowledge, opinion, or
faith and may or may not carry an emotional charge. Belief are not action oriented,
it is possible to have a belief without really caring what its like. Based on Kotler
and Armstrong (2012), attitude describe person relatively consistent evaluation,
feelings and tendencies toward an object or idea. Attitudes put people into frame
of mind of linking or dislike things, of moving forward of away from them.
2.2 Previous Research
Compare for the other research, in this study survey most basic for the main
influence factors. Through the data collection and analysis can compare the factor
can influence in consumer purchasing decision is the largest. And make the
corresponding policies to solve the problems. In previous research above it show
the result from the other researcher, it shows different result also. Here is
summary:
1. Shabrina (2009). Title: Influence personal factors toward purchasing decision in
Starbucks Coffee Shop: A study on Starbucks Sun Plaza Medan. This research
using quantitative method and this research survey on personal factor in
purchasing decision, the variables are age, occupation, lifestyle, economic
condition and self personal. The final result are occupation, lifestyle and economic
condition has significant influence toward purchasing decision. But, age and self
personal is not significant influence in purchasing decision.
2. Ufi (2014). Title: Pengaruh Budaya, Kelas Sosial, Kelompok Referensi,
Keluarga dan Psikologis Terhadap Pengambilan Keputusan Pembelian
Rengginang Lorjuk (Studi Kasus Pada Konsumen Rengginang Lorjuk Tiga
Merpati Sumenep Madura). This study aims to determine the effect of consumer
behavior factors consisting of cultural, social class, reference groups, family and
psychological in the purchasing decision Rengginang Lorjuk. This independent

18
variable are culture, social class, reference groups, family, psychological and
purchasing decisions as dependent variable. The result is culture, social class,
reference groups, family, psychological has significant influence toward purchase
decision.
3.Yakup (2014). Title: The Influence of Cultural Factors on Consumer Buying
Behaviors and an Application in Turkey. This research has the variable culture,
sub culture and social class. The result is survey respondents belief, culture and
tradition the most important factor around 60%.
4.Valentina (2015) Title: Pengaruh Faktor Budaya dan Faktor Pribadi Terhadap
Keputusan Pembelian Batik (Studi pada Mahasiswa Universitas Kanjuruhan
Malang). This variable in this research culture, social class, subculture, lifestyle,
economic condition, age, personality and occupation. The dependent variables
is purchase decision. The result of this research is personal and cultural factor
has simultaneous significant influence toward purchase decision.
2.3 Research Gaps
Compare with researcher above, in the different research has different result about
factors influence on consumer purchasing decision. The next contents include
summary above researcher with study gaps as follow:
1. Shabrina (2009). Title: Influence Personal Factors toward purchasing decision
in Starbucks Coffee Shop: A study on Starbucks Sun Plaza Medan. The different
variables are age, occupation and self personal. The final result is lifestyle and
economic condition have significant influence toward purchasing decision. The
research place and sample is different, in Starbucks Sun Plaza Medan city.
2. Ufi (2014). Title: Pengaruh Budaya, Kelas Sosial, Kelompok Referensi,
Keluarga dan Psikologis Terhadap Pengambilan Keputusan Pembelian
Rengginang Lorjuk (Studi Kasus Pada Konsumen Rengginang Lorjuk Tiga
Merpati Sumenep Madura). The different variables is reference group, family and
psychological. Final result different with this research, the result show that

19
cultural, social class, reference group, family and psychological has significant
influence toward purchase decision. Because of different research has different
place, timing and respondent so can get different result also.
3. Yukup (2014). Title: The Influence of Cultural Factors on Consumer Buying
Behaviors and an Application in Turkey. In This research, using demographic
characteristic of respondents for consumer buying behavior. Compare two
research, there is one different variable is subculture.
4. Valentina (2015) Title: Pengaruh Faktor Budaya dan Faktor Pribadi Terhadap
Keputusan Pembelian Batik (Studi pada Mahasiswa Universitas Kanjuruhan
Malang). Different variable is subculture, age, personality and occupation. Final
result all the variables has significant influence toward purchase decision. The
research place and sample different, In student Kanjuruhan University, Malang.
Collect data in different period.
2.4 Theoretical Framework
Consumer purchase decision is very much influence by cultural, social, personal
and psychological factors (Kotler and Armstrong, 2012). Researcher want to
implemented the theory on Starbucks. In theory there are independent variables,
which are Lifestyle (X1), Economic condition (X2), Social class (X3) and Culture
(X4). Consumer purchase decision is dependent variable.

20
H1
H2
H3
H4
H5
Figure 2.3: Theoretical Framework
Source: adapted from Kotler & Armstrong, 2012
2.5 Hypothesis
Hypothesis is a tentative, yet testable statement, which predict what the researcher
expect to find in conducting research and derived from the theory on which
conceptual model is based on (Sekaran & Bougie, 2013). Based on previous
theoretical framework researcher has formulated some hypothesis which will be
tested in this research. Those hypotheses are:
Hypothesis 1: There is significant influence of lifestyle towards consumer
purchasing decision.
Hypothesis 2: There is significant influence of economic condition towards
consumer purchasing decision.
Lifestyle (X1)
Economic condition (X2)
Social class (X3)
Culture (X4)
Consumer Purchase Decision (Y)

21
Hypothesis 3: There is significant influence of social class towards consumer
purchasing decision.
Hypothesis 4: There is significant influence of culture towards consumer
purchasing decision.
Hypothesis 5: There is simultaneous significant influence of lifestyle, economic
condition, social class and culture towards consumer purchasing
decision.

22
CHAPTER III
METHODOLOGY
This chapter researcher will show some main contents, these contents significant
for whole study. First part of this chapter is research method, operational
definition variables, Research framework, research instrument, sampling design.
Sampling will discuss population, sample size and margin of error, then validity
and reliability test, descriptive statistics, hypothesis testing and multiple linier
regressions.
3.1 Research Method
Research is systematic process, which include data collection, analysis and
explain the whole process of data. Survey in order to improve people
understanding of a particular phenomenon (Bhattacherjee, 2012).
Quantitative method involves smaller numbers of respondents, quantitative main
focus on this data, dealing with numbers and measures all of variables, using
result of data analysis to explain particular phenomenon. Best use to answer how
and why questions. Qualitative data is subjective whereas quantitative collection
of data through numerical (Bryman & Bell, 2010).
Quantitative method using scientific tool for measuring and testing, researcher can
use mathematical and statistical methods, random collection data of respondents,
through measurement analysis data and deal with data and get the result. As
stated by Castellan (2010), quantitative method adopts deductive process by
starting with the theory to develop hypothesis to explain relationship between
each variable which will be tested in this research. Since the data in quantitative
method will be in form of number and statistics, thus result of this method will be
objective.

23
3.2 Operational Definition Variables Table 3.1 Operational Definitions
Variable Operational
definition Indicators Measurement
Dependent Variable
Consumer
Purchasin
g Decision
Consumer purchase
decision as the
preferences set up by
customers for brands
in the chosen (Kotler
& Armstrong, 2012)
Need recognition
Likert scale
Information
search
Evaluation
alternate
purchase
Post purchase
Independent Variables
Lifestyle
The pattern of a
person's life can be
show in their activity,
interests and opinions
of the person
(Sodhganga, 2012)
Activity
Likert scale
Interest
Opinion
Spend time
Pattern life
Economic
condition
The condition of
buying tendency of an
individual is directly
Income Likert scale
Savings

24
proportional to his/her
income per month
(Guide, 2013)
Price
Power purchase
Economic level
Social
class
Social class are society
members have values,
interest and same
behavior (Simamora,
2008)
Values
Likert scale
Interest
Wealth
Prestige
Behavior
Culture
Culture there are many
smaller group affect
from family, close
friend, neighbor and
work group (Kotler,
2012)
Family
Likert scale
Close friend
Desire
Work group
Behavior people
Source: Constructed by researcher
3.3 Research Framework
In this research, researcher make the process from the beginning until conclusion
and recommendation.

25
Source: Constructed by researcher
That is the flow of process in this research. In this research, researcher using the
SPSS 23.0 for analyzing the data and using the multiple regression analysis. To
conduct the research, researcher set prepare some of the question related the
research topic and collect answer from the related respondents.
3.4 Research Instrument
In this research using questionnaire for collecting the data. Data collection
through a structured questionnaire given to the respondents that are designed to
obtain specific information (Malhotra, 2009). Survey aims to obtain information
such as preferences, attitudes or opinions expressed by the respondents who
answered the questions. Quantitative method can help to measure consumer
behavior (Bryman & Bell, 2010). The survey was conducted in order to obtain
primary data. Original directly from the source, while the primary data is the
original data collected by the researchers to answer the research problems in
particular (Oei, 2010).
In the questionnaire, researcher use likert scale to the questioner. Likert scale is
most frequency to rating the scale (Cooper & Schindler, 2006). The range is from
1 is Strongly disagree, 2 is disagree, 3 is neutral, 4 is agree and 5 is Strongly agree.
Objective of the study
Problem statement
Literature review
Construct questionnaire
Pre test: validity and reliability test
Collecting data
Interpretation Data
Conclusion and recommendation

26
3.5 Sampling Design
In this section, researcher will explain the sampling design consist of size
population, sample, and margin of error.
3.5.1 Population
The things critical for research is we have to know number of question populace
of purchaser Starbucks South Jakarta. It can similarly imply number of amount of
the things or cases which are the subject of our exploration. Population implies the
entire social occasion of people, events, and things of premium that the scientist
wishes to examine (Sekaran & Bougie, 2013).
3.5.2 Margin of error
Margin of error is percentage of allowance for no precision and confidence and
error that occurs due to use of sample instead of the population (Sekaran &
Bougie, 2010). This research, using margin of error 0,05. It means means level of
error 5% with 95% confidence level.
3.5.3 Sample
Sample is part of a number characteristic of the population (Sugiyono, 2007). In
this research, because the population size is not known, in determining size of
sample using the formula (Sugiarto, 2004):
n = Z!²x"
e²
= 97
Where :

27
n = sample size
Z = Value 0.05 (1.96)
α = 5% (95% confidence limits specified) then Z = 1.96
e = margin of error
So, the minimum respondent for the sample is 97 respondents. But, the number of
samples taken from this population is 100 samples. According to (Hair, 2006)
good minimum number of samples was 50 and preferably 100 to the most
research.
3.5.4 Sampling technique
In this research using a nonprobability sampling method. Which is not all member
population have the opportunity to be selected as sample. The sampling method
using purposive sampling. Using a purposive sampling technique which is sample
are subjectively to meet the specific criteria researcher. The criteria of the
respondent in this research is university student from 17 years old until the 23
years old consume Starbucks in the south Jakarta.
3.5.5 Data Collection Method
In this examination, scientist was utilizing the essential information and auxiliary
information for gathering the information. Essential information are unique
information gathered by scientists to answer inquire about particularly. Then again,
essential information gather Questionnaire, interview and survey (Sodhganga,
2012). In this exploration, analyst gathering optional information book and article.
3.6 Reliability and Validity Test
3.6.1 Reliability test
Reliability refers to the extent to which a scale produces consistent results if
repeated measurements are made. Reliability is first requirement of good

28
instrument. Therefore, reliability can be defined as the extent to which measures
are free from random error. According to Ghozali (2011) reliability measurements
can be done in 2 ways:
1. Measure or measurements repeated: here someone will be given the same
questions at different times, and then see if he remains consistent with the
answers.
2. One shot or one-time measurement: here measurement only once and then
the results were compared with another question or measure the
correlation between answers to questions. SPSS provides facilities to
measure the reliability with statistical uni Cronbach alpha (α). A construct
or variable is Cronbach reliable if the value of alpha > 0.60 (Malholtra,
2009).
So, in this research to look at reliability, use Cronbach alpha to measure reliability
for each variable. The Cronbach alpha calculated using this formula.
Where,
k = number of items
r = average correlation between any two items
α = reliability of the average or sum

29
Source: Andale, 2012
To test the reliability should be using the Cronbach’s alpha indicators to know
that is reliable or not.
3.6.2 Validity test
Validity test is used to check correlation of each variable toward every
independent factor (Gravetter & Forzano, 2011). Validity of the questions can be
seen in the results of SPSS output. Question can be declared valid, if the value of
r-count ≥ r-table. R-table value obtained by df (degree of freedom) = n-2. This
research spread 30 questionnaires to respondents for pre testing validity test. Df
(n-2) is 0.36. if r value >0.361 the question is valid, but If r value < 0.361 the
question is not valid the result contrast the R critical value by seeing pearson
product moment coefficient correlation (df) table (Priyatno, 2009). This formula
to determine the validity.
Source: Andale, 2012
Cronbach's alpha Internal consistency
α ≥ 0.9 Excellent
0.8 ≤ α < 0.9 Good
0.7 ≤ α < 0.8 Acceptable
0.6 ≤ α < 0.7 Questionable
0.5 ≤ α < 0.6 Poor
α < 0.5 Unacceptable

30
3.7 Descriptive Statistics Analysis
Descriptive statistics will calculation each variable in mean, standard deviation.
But, it cannot to use for conclusion (Sugiyono, 2013).
3.7.1 Mean
Mean is average from all the data. First calculation is sum all the data values (x)
and sum of the value divided by total of numbers (n)
Source: (Levine, Stephan, Krehbiel & Berenson, 2008)
Where,
xxx =Mean
∑= Summation
X= Represent score
n = Number of score
3.7.2 Standard Deviation
Using standard deviation for measure how spread out number, and for calculating
sample of quantity analysis in each variable in this study (Ghozali, 2011).
Source: (Levine, Stephan, Krehbiel & Berenson, 2008)
Where,

31
s = sample standard deviation
N = number of scores in a sample
N-1 = degrees of freedom or Bessel's correction
x = value of a sample
x bar = mean or average of the sample
3.7.3 Maximum and Minimum
Maximum and minimum are the value maximum and minimum data in the sample
(Schwert, 2010).
3.8 Classic Assumption Test
1. Normality test
Normality test use to know sample and data distribution and normal
distribution is use to detect analyze set of data if in accordance with
standard normal distribution mathematical model and graphics, it use in
statistical process (Elliot & Woodward, 2007). Typicality Tests performed
utilizing the test graph Histogram and P-P plots to test the relapse
demonstrate residuals.
2. Multicollinearity test
Multicollinearity test used to show the presence of straight connections
between free factor (Autonomous) in the relapse demonstrate. On the off
chance that the free factor, it can be splendidly, connected with impeccable
multicollinearity. Multicollinearity happens when the coefficient of
connection between needy factors is greeter than 0.60. In multicollinearity,
scientist can utilize estimation of resilience or VIF (Priyatno, 2008) And
multicollinearity happens when the VIF (Value Inflation Factor) esteem is
more than 10 and resistance values less than 0.1

32
3. Heteroscedasticity test
Heteroscedsticity test is the of the test need to be done by researcher to
know wheatear there is any similarity of residual variance from one
variable to others variable. If heteroscedscity exist in regression model,
variance and standard of error will tend increase as t value will not get
lower that the actual t value. The consequences are t-test and F –test will
inaccurate and fail to reject null hypothesis (Levine, Stephan, Krehbiel &
Berenson, 2008). Analysis of heteroscedasticity assumption SPSS output
through the scatterplot graph between Z prediction (ZPRED) for the
independent variable (X axis = Y outcome prediction), and residual value
(SRESID) is the dependent variable (Y-axis = Y predicted - Y rill).
4. Autocorrelation test.
Autocorrelation test can be used for test variable data in different coupling
time whether or not have correlation. Durbin Watson significant table will
be utilized as parameter to measure autocorrelation of data. There is no
autocorrelation if value of durbin Watson is from 1.715 to 2.22848
(Ghozali, 2011).
3.9 Multiple Regression Analysis
Multiple regression model is a kind of practical extension of simple regression.
Researcher will use multiple regression formula to assist and support the results
between dependent variable and four independent variables. The equation as
follows:
Y= $%+ $1X1 + $2X2 + $3X3 + $4X4 + &
Source: (Levine, Stephan, Krehbiel & Berenson, 2008)
Where:
Y= Dependent variable (Consumer Purchase Decision)

33
β(= Intercept/Constant
β1 - β4= Regression Coefficient
X1= Lifestyle
X2= Economic Condition
X3= Social Class
X4= Culture
)= random of error
3.10 Hypothesis Test
3.10.1 T-Test
T test used to test the partial coefficient of the free variable to the variable bound
by the hypothesis put forward. T test basically shows how much influence a single
dependent variable. The probability is smaller than 0.05, then the result means that
there are significant independent variables individually influence on the dependent
variable (Ghozali, 2011).
In T- test, researcher check level significant t (P-value). Level significance is 0.05.
If t test value greater than 0.05, Ho is accepted, if less than 0.05, Ho is rejected.
1. Ho1:β1 = 0, if significant T> 0.05, Accept Ho1
There is not significant influence of lifestyle toward consumer purchase decision
in Starbucks South Jakarta.
Ha1: +1 ≠ 0, if significant T <0.05, reject Ho1
There is a significant influence of lifestyle toward consumer purchase decision in
Starbucks South Jakarta.

34
2. Ho2:β2 = 0, if significant T> 0.05, Accept Ho2
There is not significant influence of economic condition toward consumer
purchase decision in Starbucks South Jakarta.
Ha2: +2 ≠ 0, if significant T <0.05, reject Ho2
There is a significant influence of economic condition toward consumer purchase
decision in Starbucks South Jakarta.
3. Ho3:β3 = 0, if significant T> 0.05, Accept Ho3
There is not significant influence of social class toward consumer purchase
decision in Starbucks South Jakarta.
Ha3: +3 ≠ 0, if significant T <0.05, reject Ho3
There is a significant influence of social class toward consumer purchase decision
in Starbucks South Jakarta.
4. Ho4:+4 = 0, if significant T> 0.05, Accept Ho4
There is not significant influence of culture toward consumer purchase decision in
Starbucks South Jakarta.
Ha4: β4 ≠ 0, if significant T <0.05, reject Ho4
There is a significant influence of culture toward consumer purchase decision in
Starbucks South Jakarta.
3.10.2 F-Test
F test also used to determine the influence of lifestyle, economic condition, social
class, culture together toward consumer purchase decision. If F value > F table,
Ho rejected and Ha accepted. Oppositely, if F value < F table, then Ho accepted
and Ha rejected.

35
The Level significance is ! = 0.05 in this research, if F test is higher than level
significance 0.05, Ho is accepted. If F test less than level significant 0.05, Ho is
rejected.
Ho: +1 = +2= +3 = +4 = 0 or significant F> !, accept Ho
Ha: At least there is one +. ≠ 0 if significant F< !, Reject Ho
3.10.3 The coefficient of determination (R²)
Essentially measures how much the ability of the model to explain the variations
dependent variable. The coefficient of determination is between 0 and 1. The
closer to 1 value is it indicate that the independent variable provide almost all
information needed to predict dependent variable (Currell & Dowman, 2009).
In this research, adjuster R² will be used. hen dealing with multiple regression
model, some statistician suggests using adjusted R² to reflect both number
independent variable in model and sample size (Levine, Stephan, Krehbiel &
Berenson, 2008).
Source: (Levine, Stephan, Krehbiel & Berenson, 2008)
Where: R= multiple regression coefficient
k= the number of coefficient in regression equation
n= number of sample
This study implemented adjusted R2 to find out how much dependent variable will
influence by independent variable (Ghozali, 2011). As supported by Gujarati
(2004) adjusted R2 is better measure than R2 since adjusted R2 will only increase if
the absolute t-value of added variable is greater than one, unlike the R2 which has
non decreasing function if independent variable has added.

36
CHAPTER IV
ANALYSIS AND INTERPRETATION
This chapter explain data analysis and show result on the research objective from
before chapter. Data collection from respondents fill questionnaire and analysis by
SPSS 23.0. Through result can be explain relationship between independent
variables and dependent variable.
4.1 Company Profile
Starbucks corporation is the American coffee company. Starbucks first operation
in Seattle, Washington in, 1971. Starbucks mainly products include hot and cold
drinks, not only coffee it has tea, juices and Frappuccino beverages. The
uniqueness of products Starbucks is they have the special drink but, not publish in
their board menu. Starbucks already separate their location more than 50 countries
in the world.
To expand their business market, Starbucks open their market in Indonesia.
Started operation in May 17, 2002. First opening outlet in Plaza Indonesia, central
Jakarta. Starbucks Coffee Indonesia is managed by PT Sari Coffee Indonesia,
which is one of the subsidiaries of PT Mitra Adiperkasa, Tbk (MAP). Anthony
Cottan is Director of PT Sari Coffee Indonesia (Starbucks Indonesia).
The Starbucks logo as follow:

37
Vision: To establish Starbucks as the premier purveyor of the finest coffee in the
world while maintaining our uncompromising principles while we grow.
Mission: To inspire and nurture the human spirit one person, one cup, and one
neighborhood at the time.
4.2 Data Result Analysis
The data result analysis influence personal and cultural factors toward purchasing
decision in Starbucks South Jakarta. The Questionnaire consists of 3 parts. Part I
consist of general description of respondent profile, Part II consist of instruction
of questionnaire filling, Part III contains the statement for respondents of personal
and cultural factors in consumer purchase decision. The data for the questionnaire
has been tasted for the reliability and validity testing. The details are below:
4.3 Pre-test Analysis
4.3.1 Validity test
According rules of validity test, the statement will valid if result r computation > r
table, if r computation < r table statement will invalid. By 30 respondents for
validity test by using SPSS 23.0 for analysis. And below is the result for the
validity test.

38
Table 4.1 Result of validity test
Variables Statements r table Corrected
item- Total
correlation
Status
LS1 Going to Starbucks is my main
choice to focus on doing my
work
0.316 .729 Valid
LS2 I visit Starbucks to end my day or just to kill times
0.316 .620 Valid
LS3 People patterns can be reflected
on how they spent their time or
money
0.316 .405 Valid
LS4 I repurchase Starbucks because
they have more interesting aspect
than other coffee shop
0.316 .589 Valid
LS5 In my opinion, purchasing
Starbucks made me feel classier
0.316 .522 Valid
EC1 The prices on Starbucks are
affordable and I can still save
some.
0.316 .765 Valid
EC2 My current financial doesn’t
hold me back to purchase
Starbucks
0.316 .662 Valid
EC3 The income differences make the
urge to purchase needs to be
adapted
0.316 .494 Valid

39
EC4 Price will not be a problem if the
service, ambience, and qualities
are excellent
0.316 .584 Valid
EC5 I would pay higher price than the
average, to purchase Starbucks
as the best coffee shop in
Indonesia
0.316 .436 Valid
SC1 I chose Starbucks as a prestige
brand that fit into my student
status
0.316 .653 Valid
SC2 I feel more higher than other
people, Starbucks is my go to
coffee shop
0.316 .744 Valid
SC3 Most Starbucks customers has the same characteristic as me.
0.316 .651 Valid
SC4 Starbucks became the most
prestige meeting point between
friends, colleagues, or clients.
0.316 .542 Valid
SC5 Starbucks are meant for middle-
upper social class
0.316 .533 Valid
C1 I purchase Starbucks because
there is family experience before
it.
0.316 .648 Valid
C2 I will buy a product even though
it is expensive as long it is
recommended by my close friend
0.316 .752 Valid
C3 My friends affected me to buy 0.316 .438 Valid

40
Starbucks
C4 Family recommendations made
me buy Starbucks
0.316 .704 Valid
C5 Curiosity and habits made me
purchase Starbucks
0.316 .393 Valid
PD1 My motivation to go to
Starbucks is to buy their
signature taste drinks and food
0.316 .651 Valid
PD2 I received Starbucks drinks
information from my close
friends
0.316 .366 Invalid
PD3 Their signature taste made me
consider to purchase Starbucks
0.316 .672 Valid
PD4 I considerate to buy Starbucks
brand because it’s already a
usual thing
0.316 .773 Valid
PD5 I will always choose Starbucks
drinks even though they increase
the price.
0.316 .752 Valid
Source: SPSS 23.0
4.3.2 Reliability test
Based on Cronbach Alpha standard from chapter III, researcher use SPSS 23.0 to
test the reliability. The result of reliability test can be shown as follow:

41
Table 4.2 Result of reliability test
Variable Cronbach’s Alpha Remarks
Lifestyle 0.714 Reliable
Economic Condition 0.724 Reliable
Social Class 0.743 Reliable
Culture 0.725 Reliable
Purchase Decision 0.750 Reliable
Source: SPSS 23.0
4.4 Respondent Profile
In this research, researcher took respondent demographic as required to analyzing
composition of respondent will provide the overview of respondent student who
consumer Starbucks in South Jakarta. The data or respondent include gender, age,
major, income per month. The details information will explain briefly below:
4.4.1 Gender
Figure 4.1: Respondent profile: Gender
Source: Primary data
36%64%
Respondent profile: gender
Male
Female

42
As it shown it figure 4.1 about respondent profile male is 36% with 36 respondent
and female is 64% with 64 respondents. The dominant respondent is female.
4.4.2 Age
Figure 4.2: Respondent profile: Age
Source: Primary data
As it is shown in figure 4.2 about respondent profiles of age in this research.
Group age 17-19 years old is 24% is 24 respondents from 100. Group age of 20 –
22 years old is 55% is 55 respondents and >23 years old is 21% is 21 respondents.
The dominate the respondent profiles in this research is 20-22 years old from 100
respondents.
24%
55%
21%
Respondent profile: Age
17-1920-22>23

43
4.4.3 Student allowances per month
Figure 4.3 Respondent profile: Student allowance per month
Source: Primary Data
It shown in figure 4.5 about the respondent profiles of student allowance. 12
respondents (12%) answered less Rp 500,000; 19 respondents (19%) allowance
were around Rp 500,001 – 1,000,000; 22 respondents (22%) answered around Rp
1,000,001 – 1,500,000 of their allowance per month; 18 respondents (18%)
around Rp. 1,500,001– 2,000,000 per month; 29 respondents (29%) more Rp
2,000,000. Therefore, students who have allowance more Rp. 2,000,000 were the
majority in student allowance category of respondent profiles.
12%
19%
22%18%
29%
Student allowances per month
<Rp500,000
Rp500,001- 1,000,000
Rp1,000,001- 1,500,000
Rp1,500,001- 2,000,000
>2,000,000

44
4.5 Descriptive Statistic
Table 4.3 Descriptive statistics
N Minimum Maximum Mean Std.
Deviation
TLS 100 1.00 5.00 3.242 1.125
TEC 100 1.00 5.00 3.236 1.0624
TSC 100 1.00 5.00 3.25 0.9812
TC 100 1.00 5.00 3.022 1.1034
TPD 100 1.00 5.00 3.26 1.047
Valid N (listwise) 100
Source: SPSS 23.0
There are four independent variables and one dependent variable which have
mean and standard deviation result.
1. Lifestyle: The table 4.3 shows that lifestyle have mean 3.242 means that
the consumers are agree with the statement in the questionnaire.
2. Economic condition: The table 4.3 shows that economic condition have
mean 3.236, means that the consumers are agree with the statement in the
questionnaire.
3. Social class: The table 4.3 shows that social class have mean 3.25, means
that the consumers are agree with the statement in the questionnaire.
4. Culture: The table 4.3 shows that culture have mean 3.022, means that the
consumers are agree with the statement in the questionnaire.

45
5. Purchase decision: The table 4.3 shows that purchase decision have mean
3.26, means that the consumers are agree with the statement in the
questionnaire.
4.6 Classic Assumption Test
In this research, researcher using multiple regression for analyzing the data. Here
the explanation normality testing, heteroscedascity testing, multicollinearity and
autocorrelation:
4.6.1 Normality Test
Normality test is the first test for data set is normal distribution or not. Normality
test use independent variable (X) and dependent variable (Y) in regression
equation.
Researcher use histogram and P- plot are shown in Figure 4.5 and 4.6.
Figure 4.4: Histogram
Source: SPSS 23.0
According to Moore & McCabe (2010) the histogram data will show normal
distribution if curve make the bell shape. If bar chart curve is deviated to the right

46
or left, the data are not normal. The good data should have distribution pattern. In
histogram above about regression standardized residual, the curve has a bell shape
which means that the data in this research has normal distribution.
Figure 4.5: Normality test: P- P Plot graph
Source: SPSS 23.0
See from the figure 4.5 researcher see the point follow the direction of diagonal
line. The data fulfill requirement of normality assumption. The normality of data
distribution can be determining by from residual value that normally distributed.
In the figure, standardized spread around diagonal line. The result show that is
normal distribution.

47
4.6.2 Heteroscedascity Test
Figure 4.6: Heteroscedascity Test: Scatter Plot Graph
Source: SPSS 23.0
In heteroscedascity test it can see from the pattern of scatterplot, normal
distribution when point spread not coverage only in a one point. Based on the
result show it indicate there is no heteroscedascity problem. There is no specific
pattern occurs in scatterplot. Then, the data in this research are normal distributed.
4.6.3 Multicollinearity test
Multicollinearity is linier correlation among independent variable strong in
multiple regression (Mahendra, 2011). VIF measure how much variance estimate
coefficient increase over the case of no correlation among x variable.
Multicollinearity occurs when the VIF (Variance Inflation Factor) value is more
than 10 and tolerance values < 0.1. The result of multicollinearity can be seen
below:

48
Table 4.4 Multicollinearity test
Coefficientsa
Model
Collinearity Statistics
Tolerance VIF
Lifestyle 0.546 1.832
Economic Condition 0.698 1.432
Social Class 0.515 1.941
Culture 0.702 1.425
Source: SPSS 23.0
The result of table 4.4 show tolerance value of lifestyle is 0.546, economic
condition is 0.698, social class is 0.515 and culture is 0.702. This variable show
tolerance more than 0.1 and less than 1. There are no multicollinearity problem.
On the other hand, result of VIF lifestyle is 1.832, economic condition is 1.432,
social class is 1.941 and culture is 1.425. These variables VIF between 0.1 and 10.
Multicollinearity problem not occurring.
4.6.4 Autocorrelation test
Autocorrelation examined by durbin Watson and check the correlation between
variable. Can be free autocorrelation when value the Durbin Watson between
1.715- 2.22848 (Ghozali, 2011). Using durbin Watson test is conductive find
research error in regression model.

49
Table 4.5 Durbin Watson result
Model Durbin Watson
1 2.177
Source: SPSS 23.0
Based on the data result, the research is no autocorrelation, the values is 2.177,
between 1.715 and 2.22848.
1.715 < 2.177 < 2.22848 = no autocorrelation
4.7 Multiple Regression Analysis
Use multiple regression analysis to determine influence independent variable
(lifestyle, economic condition, social class, culture) and dependent variable
(purchase decision) by the SPSS program. Here is the result.
Table 4.6: Multiple Linier Regression Result of Coefficients
Model
Unstandardized Coefficients
Standardized Coefficients t Sig.
B Std. Error Beta
1 (Constant)
TLS
TEC
TSC
TC
3.933 1.278 3.078 .003
0.349 0.079 0.425 4.441 .000
0.262 0.076 0.293 3.468 .001
-0.020 0.094 -0.021 -0.218 .828
0.155 0.065 0.201 2.380 .019
Source: SPSS 23.0

50
In this research, researcher choose Beta values of multiple regression as analysis
and for the measure relationship. The multiple regression line for more
independent variables.
Table 4.7 Significance Table
Independent Variables Significance Value Standard Value 0.05
Lifestyle 0.000 Significant
Economic Condition 0.001 Significant
Social Class 0.828 No significant
Culture 0.019 Significant
Source: SPSS 23.0
According to the table 4.7 significance table result, there are three independent
variables have impact on dependent variables. The details are lifestyle as X1,
economic condition as X2, social class as X3, culture as X4, purchase decision as
Y. So, X1, X2 and X4 has influence toward consumer purchase decision. So,
multiple regression line model as follows:
Y= 0.425 X1 + 0.293 X2 + 0.201 X4 + &
Based on the multiple regression line lifestyle has influence 0.425 toward
consumer purchase decision. If, lifestyle increase or decrease one point and other
variable are constant.
Multiple linier regression provide result of economic condition has influence
0.293 toward consumer purchase decision. It means, if economic condition
increase or decrease one point and others variable are constant.

51
Through multiple linier regression line model show culture has influence 0.201
toward consumer purchase decision. In other words, if culture increase or decrease
one point and others variable are constant.
4.8 Hypothesis Test
4.8.1 T-Test
T test is for measure significant independent variable toward dependent variable
(Ghozali, 2011). This is through t (p-value) compare with significance level 0.05,
if t value less 0.05, each independent variable is significant influence on
dependent variable. But, if t (p-value) more than 0.05, each independent variable
is not significant.
T- test analysis by following on the table 4.7. The researcher analysis of each
independent variable is below:
1. Lifestyle: t (p-value) lifestyle is 0.000, less than 0.05. it means lifestyle has
significant influence toward consumer purchase decision in Starbucks South
Jakarta.
2. Economic condition: t (p-value) economic condition is 0.001, less than 0.05. It
means economic condition has significant influence toward consumer purchase
decision in Starbucks South Jakarta.
3. Social class: t (p-value) social class is 0.828, more than 0.05. It means social
class has no significant influence toward consumer purchase decision in Starbucks
South Jakarta.
4. Culture: t (p-value) culture is 0.019, less than 0.05. It means culture has
significant influence toward consumer purchase decision in Starbucks South
Jakarta.

52
4.8.2 F-Test
F-test used to measure the all independent variables whether they have significant
influence on dependent variable. Researcher should to compare with significant
level 0.05
Table 4.8 F-Test result ANOVAa
Model Sum of Squares df Mean Square F Sig.
1 Regression 505.732 4 126.433 26.357 .000b
Residual 455.708 95 4.797
Total 961.440 99
Source: SPSS 23.0
The result show that F test value is 26.357 with significance 0,000. The F table
value on f table with df1= 4 and df2= 95, then F table value is 2.47. F value > F
table (26.357 > 2.47). So, Ho rejected and Ha accepted. Also significance level is
0.000 (<0.05). It means there is simultaneous significant influence of lifestyle,
economic condition, social class and culture toward consumer purchase decision.
4.9 Coefficient of Determination Analysis (R²)
Coefficient of determination use for know the percentage of change between
dependent variable by independent variables. It shows linear correlation usually
between 0 and 1. Regardless higher or lower, it always between 0 and 1. It can
never be negative value. Coefficient determination consider as good when the
value is closer to one, which indicates strong capabilities to influence dependent
variable (Currell & Dowman, 2009).
Based on result before, this research has three independent variables are
significant influence on dependent variables. Which are lifestyle, economic

53
condition and culture has influence toward consumer purchase decision in
Starbucks South Jakarta.
Table 4.9 Coefficient of Determination Result
Model R R Square Adjusted R
Square Std. Error of the Estimate
1 .725a .526 .506 2.190
Source SPSS 23.0
The value of coefficient determination (R²) is 0.506 means that 50.6% changed in
dependent variable (Consumer purchase decision) which it will be influence by
independent variable (lifestyle, economic condition, social class and culture). And
the rest is 49.4% are influence by other factors not in this research.
4.10 Interpretation Result
1. H1: The lifestyle influence consumer purchase decision in Starbucks South
Jakarta.
Based on result T-test and significance value, can conclude lifestyle has
significant influence toward consumer purchase decision. From significance table,
p value lifestyle is 0.000 less than 0.05, Ha accepted and Ho is rejected. Indicated,
there is significant influence toward consumer purchase decision.
Support previous research from Shabrina (2009) show in investigating research
that lifestyle is the significant influence on Purchase decision. This is because
consumers who drink and eat in the Starbucks that they just want to fill their spare
time and consumers are not ignored or neglected although the prices of drinks and
food in Starbucks expensive essential consumers heart glad because of their free
time filled good. Comparing to this result show lifestyle has significant influence
on consumer purchase decision in Starbucks South Jakarta. Because of in this era
already make the pattern for student lifestyle is more increasing.

54
2. H2: Economic condition influence consumer purchase decision in Starbucks
South Jakarta.
Based on result T-test and significance level, can conclude economic condition
has significant influence toward consumer purchase decision. From significance
table, p value economic condition is 0.001 less than 0.05, Ha accepted and Ho is
rejected. Indicated, there is significant influence toward consumer purchase
decision.
This finding also support by Shabrina (2009), it stated economic condition also
has significant influence toward purchase decision. Due to, drinking and eating in
Starbucks was more from the middle to the top and because of frequent consumers
of drinking and eating at Starbucks using by the consumers in order to support
their activities. Person has high income will purchase expensive products, the
other side person will low income will purchase inexpensive products (Shah,
2010). This research investigate in Jakarta for the Starbucks, shows the consumers
has high income and economic condition can influence consumer to purchase.
This indicator consumer Starbucks in Jakarta pay their money to get the benefit
back while purchase higher. Support in their economic in the Jakarta can do the
purchase in Starbucks.
3. H3: Social class influence consumer purchase decision in Starbucks South
Jakarta.
Based on result T-test and significance level, can conclude social class is not
significant influence toward consumer purchase decision. From significance table,
p value social class is 0.828 more than 0.05, Ha rejected and Ho accepted.
Indicated, there is no significant influence toward consumer purchase decision.
This is because, social class not determine only by income, but from education,
occupation can determine people has social class.
Abraham (2011) examined all of members social class have share common values
and have ways for thinking, speaking and behaving. r, and these characteristics are
different from other social class members. social classes are determined not by

55
according only one variable, the others like activities, living area (Douglas, 2002).
Comparing to this result social class has not significant influence on consumer
purchase decision in Starbucks south Jakarta. In every research can get different
result. Indicate, if consumer still have more income but their social class would be
different in each consumer. This result research is different, social class can
influence on consumer purchase decision in other result as a truth.
4. H4: Culture influence consumer purchase decision in Starbucks South
Jakarta.
Based on result T-test and significance level, can conclude culture is significant
influence toward consumer purchase decision. From significance table, p values
are 0.019 less than than 0.05, Ha accepted and Ho is rejected. Indicated, there is
significant influence toward consumer purchase decision. This finding also
support by Ufi (2014) which culture has significant influence on consumer
purchase decision. The majority of survey respondent culture is more important
factor around 60% (Yakup, 2014) Normally, consumers right now for their needs
is more high. Culture indicates family, friends and neighbor is the important factor
can influence people to selecting the coffee brand (Tanja, 2015)
Culture can come from family, habits, groups and the pattern of behavior from
environment of their staying. From the analysis, this research investigates in the
south Jakarta for the Starbucks. Normally, each peoples in south jakarta already
know the Starbucks. This globalization era, the western brand comes faster and
starbucks as the American coffee company needed for the consumers in the south
Jakarta.
5. H5: Lifestyle, economic condition, social class and culture influence
consumer purchase decision in Starbucks South Jakarta.
From the F- test result, p Value (significance) is 0.00, it means less than 0.05, so
that is significance. For the result is all independent variables (lifestyle, economic
condition, social class and culture) have simultaneous significant influence toward
dependent variable (purchase decision).

56
The findings also support by Valentina (2015) lifestyle, economic condition,
social class and culture has significant influence toward purchase decision. This
research come up with Starbucks is also used as a place of inspiration in
conducting discovery. Starbucks is also used as a place to spend leisure time, a
place to expand the network of places to try the food and new drinks for Starbucks
often exclude food and drinks are new, and can be used as a place of solitude to be
more concentration in completing the task for provided a special room so that
consumers decide to buy drinks and food on Starbucks. Final result is lifestyle and
economic condition have the significant influence on consumer purchase decision
in Starbucks South Jakarta.

57
CHAPTER V
CONCLUSION AND RECOMMENDATION
5.1 Conclusion
In this research, researcher summarize all the independent variables of lifestyle,
economic condition, social class and culture influence consumer purchase
decision in Starbucks South Jakarta. After conducting the discussion and analysis
in previous chapter in order to achieve research objective, the result obtained are:
1. Lifestyle has significant influence toward consumer purchase decision. Which
indicate in significant value is 0.000 less than 0.05. Lifestyle can reflect to make
the pattern of purchase decision. Lifestyle refers way of person lives in a society
and expressed by things in her/her surroundings. It determines by customers
interest, opinions, activities and shapes his whole pattern of interacting. Consumer
needs more consumptive, as the result lifestyle indicators for making the
consumer pattern, lifestyle determine to the consumer needs in order their support
for the daily activities.
2. Economic condition has significant influence toward consumer purchase
decision, indicate in significant value is 0.001 less than 0.05. The economic
condition of consumer will purchase more product, support with their power of
income. Consumer in the south Jakarta has the high income to purchase the
Starbucks. The economic determine for the has the higher income in the Jakarta,
consumer well spend to purchase Starbucks in South Jakarta.
3. Social class has no significant influence toward consumer purchase decision,
indicate with significant value is 0.828 more than 0.05. Common values
determined for the social class of consumers, support with what they used to go
and where they go to collage. Consumer have the common value and behavior
they can consume the Starbucks. Social class not determine only by income, but
from education, occupation can determine people has social class. In this result

58
social class not significant influence, but for the other research or future result can
be different.
4. Culture has significant influence toward consumer purchase decision, indicate
with significant value is 0.019 less than 0.05. From the analysis, this research
investigates in the south Jakarta for the Starbucks. Normally, each peoples already
know and hear the Starbucks. This globalization era, the western brand comes
faster and starbucks as the American coffee company needed for the consumers in
the south Jakarta.
5. Lifestyle, economic condition, social class and culture has significant
simultaneous influence toward consumer purchase decision. In addition, F test
result, F p-value (significant) is 0.00 less than 0.05 level of significant. The result
means all independent variable has significant simultaneous influence toward
dependent variable.
5.2 Recommendation
After examination and analysis of the research findings, the researcher would like
to suggest several recommendations. There is some recommendation from
researcher from this research, the result is:
For Starbucks Indonesia:
1. Should maintain for leading position. The competition for coffee shop industry
in Jakarta is increase. So company can pay attention to maintain for their
ambience and facility also. Starbucks also to maintain the facility to makes the
consumer Starbucks feels comfortable to support all of activities in the Jakarta
city. The consumer to purchase in the Starbucks Because Starbucks can the choice
option place with modern way of life for the student as the lifestyle for hangout in
the coffee shop, not only for the employee.
2. The price of the products is considering consumer to purchase. Since there are a
lot of coffee shop place in Jakarta, and sell the product with the competitive price.

59
Or below the Starbucks. Starbucks need to maintain the signature taste of the
beverages, make the others can not duplicate about the taste.
3. In today market, coffee shop as the place not only for consuming coffee or tea.
Everyone can be visiting there, so company need to pay attention to sending more
to all consumer the package of promotion.
For future researcher:
1. From the result, we can see the lifestyle, economic condition and culture are
influence toward consumer purchase decision. Future researcher can increase the
independent variable from others factors of consumer behavior such as social and
psychological factors and same variables from personal and cultural factors. There
was complex because there are many factors of consumer behavior because
different case has different independent factor. In order, to make sure the accuracy
of data may future researcher have increase sources of data in primary and
secondary data.
2. Future researcher should to take wider population and for the higher sample
sizes. By extending the respondent not only to students, but can expand as the
sample of working people, housewives so that power can be enlarged
generalization of research result.

60
REFERENCES
Journals
Abraham, K. (2011). A study On Consumer Behavior. International Journal of Enterprise Computing and Business Systems ISSN (Online) : 2230-8849
Bryman, A., & Bell, E. (2010). Business research methods (3rd ed), New York: Oxford University Press.
Castellan, C. M. (2010). Quantitative and Qualitative Research: A view for clarity. International Journal of Education, 2, 1-14.
Commuri, S., & Gentry, J. W. (2000). Opportunities for Family Research in Marketing. Academy of Marketing Science Review, 8, 1-34.
Douglas. A. (2002). Toward a Theory of Consumer Choice as Socio- historically Shaped Practical Experience: The Fits-Like-a-Glove (FLAG) Framework,” Journal of Consumer Research, 28 (March), 515–32.
Elliot, A., & Woodward, W. (2007). Statistical analysis quick reference guidebook with SPSS example. London: Sage Publications.
Ghozali, I. (2005). Aplikasi Analisis Multivariate dengan Program SPSS. Semarang: BP UNDIP.
Gujarati, D.N. (2004). Basic Econometrics. USA: McGraw Hill.
Herliyana, E. (2012). Fenomena Coffee Shop Sebagai Gejala Gaya Hidup Baru Kaum Muda. Vol. 13, No. 1, Juni 2012
Idris, I., Yajid, M. S. A., & Khatibi, A. (2009). Personal and Psychological Factors-Does it Impact the Choice of Advertising Medium? Journal of Social Sciences 5(2): 104-111, 2009 ISSN 1549-3652
Khuong, M. N., & Duyen, H. T. M. (2016). Personal Factors Affecting Consumer Purchase Decision towards Men Skin Care Products — A Study in Ho Chi Minh City, Vietnam. International Journal of Trade, Economics and Finance, Vol. 7, No. 2, April 2016
Lay-Yee, K. L., Kok-Siew, H., & Yin-Fah, B. C. (2013). Factors Affecting Smartphone Purchase Decision Among Malaysian Generation Y. International Journal of Asian Social Science, 3(12),2426-2440.

61
Lin, L. Y. & Shih, H. Y. (2012). The Relationship of University Student’s Lifestyle, Money Attitude, Personal Value and their Purchase Decision. International Journal of Research in Management ISSN 2249-5908 Issue2, Vol. 1 (January-2012)
Mahendra, A. N. (2011). Validity, Reliability and Classical Assumption. Yogyakarta.
Mohan, A. (2014). Consumer Behavior Toward Smartphone Industry in Indian Market. India.
Palani, S., & Sohrabi, S. (2013). Consumer Attitude and Behavior When Selecting a Holiday Destination. Finland.
Perreau, F. (2010). The 4 Factors Influencing Consumer Behavior. Journal article
Rani, P. (2014). Factor Influencing Consumer Behaviour. Int.J.Curr.Res.Aca.Rev.2014; 2(9): 52-61
See, H. C. (2001). The Nature of Problem Recognition and Search in the Extended Health Care Decision. Journal of Service Marketing 15, No. 6, 454-79.
Setyaningsih. (2007). Analisis Faktor Faktor Yang Mempengaruhi Ekuitas Merk Untuk Meningkatkan Pembelian Ulang, studi kasus kedai kopi dome di Surabaya. JURNAL STUDI MANAJEMEN & ORGANISASI Volume 4, Nomor 2, Juli, Tahun 2007, Halaman 30.
Shah, A. (2010). Factor Influencing Consumer Behavior. 277.
Silaban, D. P., Saerang, D. P. E., Rumokoy, F. S (2014). Analyzing the Personal Factors Influencing Purchasing Decision of Samsung Smart Phone in Manado. Journal EMBA Vol.2 No.1 Maret 2014, ISSN 2303-1174 pp. 124-132
Sodhganga. (2012). Consumer Behavior.
Stenly Winata & David. (2006). Analisis Pengaruh Situasi Pembelian dan Gaya Hidup Terhadap Keputusan Pembelian Celana Jeans di Matahari Department Store Surabaya: studi kasus matahari Plaza Tunjungan. Petra University Journal
Suharto (2016). Pengaruh Budaya Terhadap Keputusan Pembelian Menggunakan Variabel Sosial dan Pribadi Sebagai Mediasi Produk Air Minum Kemasan. ISSN CETAK 1978 – 6573 / ISSN ONLINE 2477 – 300X DERIVATIF Vol. 10 No. 1, April 2016.

62
Sunastiko. (2013). Hubungan Antara Citra Diri (Self Image) dengan Perilaku Konsumtif Dalam Pembelian Produk Kosmetik Pada Mahasiswi Fakultas Hukum Universitas Diponegoro Semarang, (online), (http://download.portalgaruda.org).
Susanto, A. B., Lapian, J., & Tumbuan, A. (2016). Influence of Cultural, Social, Personal, and Psychological on Consumer Purchase Decision: A case study in tonasa cement product in Manado. Volume 16 No. 01 YEAR 2016
Taşdemir, A (2014). A Theoretical Approach to the Influence of Social Class on Consumer Behavior. American International Journal of Social Science Vol. 3, No. 3; May 2014
Thangasamy, E. & Patikar , G. (2014). Factors Influencing Consumer Buying Behaviour: A Case Study Global Journal of Management and Business Research: E Marketing Volume 14 Issue 5 Version 1.0 Year 2014
Yakup, D., & Jablonsk, S. (2012). Integrated Approach to Factors Affecting Consumers Purchase Behavior in Poland and Empirical Study. Global Journal of Management and Business Research, 12(15), 2249-4588.
Yakup, D., Mücahit, C., & Reyhan, O. (2011). The Impact of Cultural Factors on the Consumer Buying Behaviors Examined through an Impirical Study. International Journal of Business and Social Science Vol. 2 No. 5; March 2011
Wang, Tina, Yinyin. (2010). Consumer Behavior Characteristic in Fast Fashion. Journal of theseus.
Books
Bhattacherjee, A. (2012). Social Science Research: Principles, Methods, and Practices, 2nd Edition.
Cooper & Schindler. (2006). Business Research method 9th edition.
Currell & Dowman. (2009). Essential Mathematics and Statistics for Science. 2nd Edition.
Ghozali, I. (2011). Aplikasi analisis multivariate dengan program SPSS Edisi 5. Semarang: Semarang Badan Penerbit Universitas Diponegoro.
Gravetter & Forzano. (2011). Research Methods for Behavioral Science.

63
Hair, J.F., Anderson, R.E., Tatham, R.L. and Black, W.C. (2006). Multivariate Data-Analysis, 6th ed., Prentice-Hall: London
Hawkins, D. I., & Mothersbaugh, D. L. (2010). Consumer Behavior: Building Marketing Strategy 11th edition. New York: McGraw-Hill/Irwin.
Hawkins, D. I., Best, R. J., & Coney, K. A. (2004). Consumer Behavior: Building Marketing Strategy 9th edition. New York: McGraw-Hill/Irwin.
Oei, I. (2010). Riset Sumber Daya Manusia, Cetakan Keempat. PT. Gramedia Pustaka Utama. Jakarta.
Kanuk & Schiffman. (2007). Consumer Behavior. New Jersey: Practice hall
Lamb, C.W., Hair, J. F., & McDaniel, C. (2011). Essential of Marketing (7th edition).
Levine, M. D., Stephan, F. D., Krehbiel, C. T., & Berenson. L. M. (2008). Statistics for Manager Using Microsoft Excel. Fifth Edition.
Malhotra, N. K. (2009). Marketing Research. An Applied orientation. In N. K. Malhotra, Marketing Research: An Applied orientation. New Jersey: Pearson.
McCabe, Craig & Moore. (2010). Introduction to the Practice of Statistics
McDaniel, C., Lamb, C. W., & Hair, J. F. (2006). Introduction to Marketing (8th ed.) Thompson.
Kardes, F., Cronley. M., & Cline, M. (2011). Consumer Behavior. 2nd Edition.
Kotler, P., & Amstrong. (2008). Principle of Marketing. Pearson Education. South Asia
Kotler, P., Armstrong, G., Hoon, A.S., Tiong, T.C., & Hon-Ming, Y.O. (2009). Principles of Marketing. A Global Perspective. Singapore: Pearson Education.
Kotler, P., & Armstrong. (2012). Principles of Marketing. 14th Edition. New Jersey: Pearson Education.
Prasetijo, Ristiyanti & Lhalauw, J. (2005). Perilaku Konsumen. Yogyakarta.
Schiffman & Kanuk. 2008. Perilaku Konsumen. Edisi ketujuh. Jakarta : PT Indeks.

64
Sekaran, U. & Bougie, R. (2013). Research Methods for Business, 6th Edition
Simamora, B. (2008). Panduan Riset Perilaku Konsumen. Gramedia Pustaka Utama.
Sugiarto, S. D., Sunaryanto, L.T., Oetomo, D.S. (2004). Teknik Sampling , penerbit PT Gramedia Pustaka Utama, Jakarta.
Sugiyono. (2007). Metode Penelitian Bisnis (Business Research Methods). Bandung: Alfabeta.
Sugiyono (2013). Metode Penelitian. Bandung: Alfabeta.
Yuswohadi. (2012). Consumer 3000: Revolusi Konsumern Kelas Menengah di Indonesia.
Websites
Andale. (2012). Correlation Coefficients, Definitions, Pearson’s Correlation Coefficient. www. Statisticshowto.com/what-is-the-pearson-correlation-coefficient/
Baker, L. S. (2006). Multiple Regression Theory. hspm.sph.sc.edu/Courses/J716/pdf
Eiimuniversity (2014). Consumer Behavior. Eiimuniversity.ac.id
Guide, M. S. (2013). What is Consumer Behavior www.managementstudyguide.com
Priyatno, D. (2009). R table. Retrieved 11 17, 2014, from rufiismada.files: https://rufiismada.files.wordpress.com/2012/10/r_table_pearsonx.pdf
Schwert, G. W. (2010). Descriptive Statistics & Test. Retrieved December 19, 2015, User’s Guide I: http://schwert.ssb.rochester.edu/a425/EV71.pdf
Shuttleworth, M. (2008). Research Hypothesis. Retrieved 10 30, 2014, from explorable: https://explorable.com/research-hypothesis
Xavier, J. (2012). https://www.merdeka.com/uang/pengelola-Starbucks-indonesia-
tahun-ini-raup-rp-54-triliun.htm

65
Appendices
Appendix 1- Data Collection Pre-test
No
LS1
LS2
LS3
LS4
LS5
TLS
EC1
EC2
EC3
EC4
EC5
TEC
SC1
SC2
SC3
SC4
SC5
TSC
1 3 2 4 5 4 18 3 2 4 5 3 17 3 4 4 4 4 19
2 2 2 4 3 4 15 4 4 5 2 2 17 3 4 4 3 4 18
3 4 4 4 2 3 17 4 4 5 4 3 20 4 4 5 4 4 21
4 3 3 3 4 2 15 3 4 3 4 3 17 4 3 2 4 3 16
5 4 3 2 4 4 17 4 4 4 5 2 19 4 4 2 4 2 16
6 2 2 4 2 2 12 3 3 3 4 2 15 3 1 2 3 1 10
7 2 1 1 2 3 9 2 4 4 4 3 17 2 2 3 4 3 14
8 4 3 4 5 2 18 4 5 5 4 3 21 2 3 3 4 3 15
9 4 4 2 3 4 17 4 3 4 2 4 17 3 4 2 4 3 16
10 4 3 1 3 2 13 4 3 3 4 3 17 4 2 4 3 4 17
11 3 2 3 3 3 14 2 4 4 4 3 17 3 3 3 3 4 16
12 5 3 4 4 2 18 3 4 4 5 2 18 2 3 3 5 2 15
13 4 4 4 5 4 21 3 4 3 4 3 17 4 3 4 4 2 17
14 4 3 5 3 1 16 5 5 5 4 2 21 4 4 3 1 5 17
15 5 4 5 4 3 21 4 4 5 3 3 19 3 3 3 3 3 15
16 1 1 5 3 1 11 3 4 4 5 3 19 3 3 3 4 1 14
17 4 1 4 5 1 15 3 3 4 2 2 14 3 4 3 3 3 16
18 1 4 5 4 1 15 4 4 5 4 3 20 4 3 4 5 3 19
19 3 4 2 3 3 15 3 3 5 4 3 18 3 4 3 4 3 17
20 4 2 5 3 4 18 1 1 5 4 3 14 4 2 1 4 5 16
21 1 1 4 2 4 12 4 4 5 1 3 17 3 3 3 3 4 16
22 3 2 4 5 4 18 1 2 3 1 2 9 3 2 3 3 2 13
23 3 4 5 4 5 21 3 3 4 4 4 18 4 4 5 5 4 22
24 1 1 5 4 1 12 4 4 5 5 1 19 1 1 2 5 5 14
25 3 3 3 3 2 14 3 3 4 2 1 13 2 2 2 4 3 13

66
26 2 2 2 3 2 11 3 3 2 5 1 14 2 2 4 3 2 13
27 3 3 4 4 2 16 3 3 4 4 3 17 3 3 4 4 3 17
28 1 3 2 3 2 11 3 3 3 4 3 16 2 2 2 1 1 8
29 3 2 3 4 2 14 3 4 4 2 2 15 2 3 4 3 4 16
30 1 2 4 3 1 11 1 3 4 1 1 10 1 1 2 1 3 8
No C1 C2 C3 C4 C5 TC PD1 PD2 PD3 PD4 PD5 TPD
1 3 3 4 3 2 15 3 4 3 4 3 17
2 4 3 4 4 4 19 3 4 3 3 2 15
3 2 4 4 2 4 16 4 4 4 3 4 19
4 4 4 4 4 3 19 3 4 4 4 3 18
5 4 4 4 5 4 21 4 4 5 4 5 22
6 4 3 2 3 3 15 3 2 3 3 3 14
7 2 3 3 4 3 15 4 4 3 4 4 19
8 4 4 4 4 5 21 5 4 5 5 4 23
9 4 4 3 3 4 18 4 4 3 3 2 16
10 3 2 1 3 2 11 3 1 4 4 2 14
11 2 3 2 1 3 11 2 4 3 2 3 14
12 3 3 2 3 4 15 3 2 4 4 4 17
13 2 3 3 2 4 14 4 2 4 4 3 17
14 2 2 2 2 5 13 4 1 4 4 3 16
15 3 3 4 3 3 16 3 3 4 3 1 14
16 1 1 5 4 5 16 5 3 1 3 4 16
17 1 1 5 1 4 12 4 1 4 4 3 16
18 1 1 3 1 3 9 3 1 3 2 1 10
19 3 2 3 3 3 14 4 3 4 3 3 17
20 2 2 4 2 4 14 2 5 2 2 2 13
21 1 2 2 4 3 12 3 4 5 2 3 17
22 5 4 1 4 3 17 3 2 2 1 1 9

67
23 2 4 3 4 5 18 3 3 4 4 3 17
24 1 3 4 3 2 13 1 2 1 2 3 9
25 2 1 2 2 2 9 3 3 2 2 2 12
26 2 2 3 4 2 13 4 3 3 2 2 14
27 2 2 2 3 3 12 4 3 4 3 3 17
28 4 4 3 3 1 15 2 4 3 2 3 14
29 3 2 2 2 3 12 4 2 4 3 3 16
30 5 3 4 4 2 18 2 4 4 2 1 13

68
Appendix 2 Reliability and Validity Test
Reliability test
Reliability of Lifestyle (X1)
Reliability statistics
Cronbach’s Alpha
Cronbach’s Alpha Based
on Standardized
Items
N of Items
0.714 0.719 6
Reliability of Economic Condition (X2)
Reliability statistics
Cronbach’s Alpha
Cronbach’s Alpha Based
on Standardized
Items
N of Items
0.724 0.741 6
Reliability of Social Class (X3)
Reliability statistics
Cronbach’s Alpha
Cronbach’s Alpha Based
on Standardized
Items
N of Items
0.743 0.777 6

69
Reliability of Culture (X4)
Reliability statistics
Cronbach’s Alpha
Cronbach’s Alpha Based
on Standardized
Items
N of Items
0.725 0.735 6
Reliability of Consumer Purchase Decision (Y)
Reliability statistics
Cronbach’s Alpha
Cronbach’s Alpha Based
on Standardized
Items
N of Items
0.750 0.795 6

70
Validity test
Validity of Lifestyle(X1)
Correlations
LS1 LS2 LS3 LS4 LS5 TLS
LS1 Pearson Correlation 1 .477** -.030 .341 .275 .729**
Sig. (2-tailed) .008 .877 .065 .141 .000
N 30 30 30 30 30 30
LS2 Pearson Correlation .477** 1 -.033 .142 .229 .620**
Sig. (2-tailed) .008 .864 .455 .224 .000
N 30 30 30 30 30 30
LS3 Pearson Correlation -.030 -.033 1 .286 -.099 .405*
Sig. (2-tailed) .877 .864 .126 .601 .027
N 30 30 30 30 30 30
LS4 Pearson Correlation .341 .142 .286 1 .031 .589**
Sig. (2-tailed) .065 .455 .126 .871 .001
N 30 30 30 30 30 30
LS5 Pearson Correlation .275 .229 -.099 .031 1 .522**
Sig. (2-tailed) .141 .224 .601 .871 .003
N 30 30 30 30 30 30
TLS Pearson Correlation .729** .620** .405* .589** .522** 1
Sig. (2-tailed) .000 .000 .027 .001 .003
N 30 30 30 30 30 30
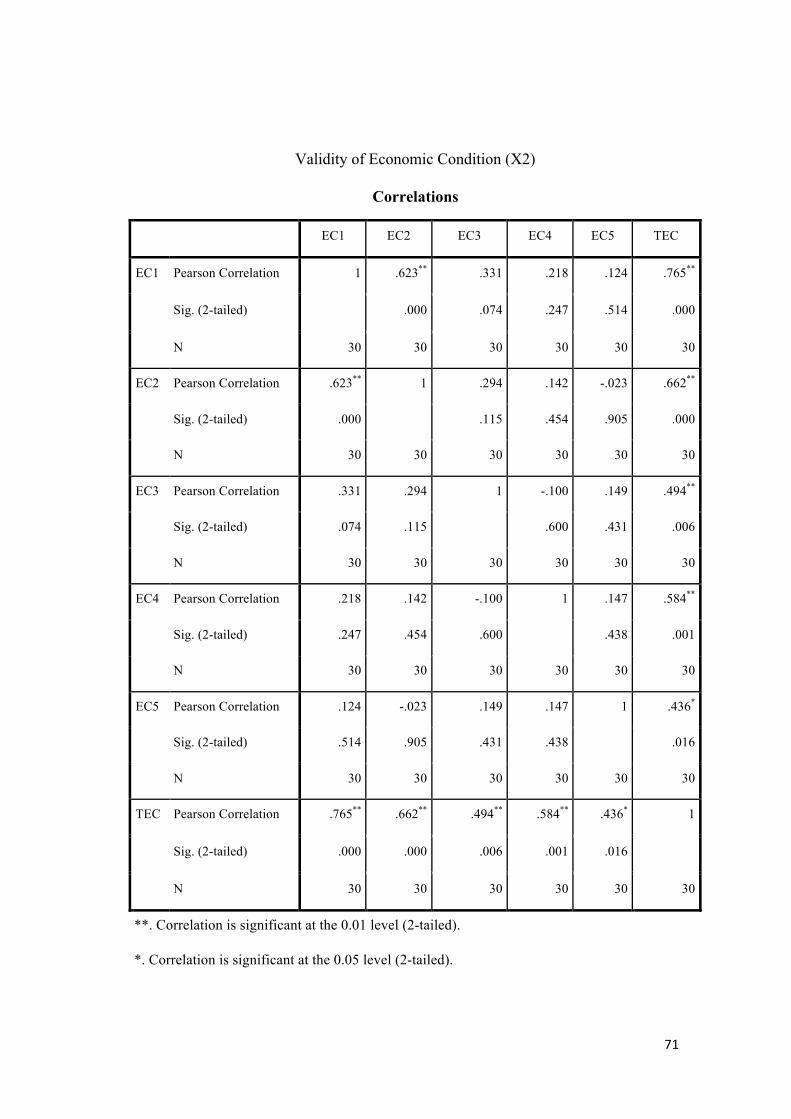
71
Validity of Economic Condition (X2)
Correlations
EC1 EC2 EC3 EC4 EC5 TEC
EC1 Pearson Correlation 1 .623** .331 .218 .124 .765**
Sig. (2-tailed) .000 .074 .247 .514 .000
N 30 30 30 30 30 30
EC2 Pearson Correlation .623** 1 .294 .142 -.023 .662**
Sig. (2-tailed) .000 .115 .454 .905 .000
N 30 30 30 30 30 30
EC3 Pearson Correlation .331 .294 1 -.100 .149 .494**
Sig. (2-tailed) .074 .115 .600 .431 .006
N 30 30 30 30 30 30
EC4 Pearson Correlation .218 .142 -.100 1 .147 .584**
Sig. (2-tailed) .247 .454 .600 .438 .001
N 30 30 30 30 30 30
EC5 Pearson Correlation .124 -.023 .149 .147 1 .436*
Sig. (2-tailed) .514 .905 .431 .438 .016
N 30 30 30 30 30 30
TEC Pearson Correlation .765** .662** .494** .584** .436* 1
Sig. (2-tailed) .000 .000 .006 .001 .016
N 30 30 30 30 30 30
**. Correlation is significant at the 0.01 level (2-tailed).
*. Correlation is significant at the 0.05 level (2-tailed).

72
Validity of Social Class (X3)
Correlations
SC1 SC2 SC3 SC4 SC5 TSC
SC1 Pearson Correlation 1 .536** .277 .177 .142 .653**
Sig. (2-tailed) .002 .139 .350 .454 .000
N 30 30 30 30 30 30
SC2 Pearson Correlation .536** 1 .443* .198 .202 .744**
Sig. (2-tailed) .002 .014 .295 .285 .000
N 30 30 30 30 30 30
SC3 Pearson Correlation .277 .443* 1 .196 .150 .651**
Sig. (2-tailed) .139 .014 .298 .429 .000
N 30 30 30 30 30 30
SC4 Pearson Correlation .177 .198 .196 1 .071 .542**
Sig. (2-tailed) .350 .295 .298 .708 .002
N 30 30 30 30 30 30
SC5 Pearson Correlation .142 .202 .150 .071 1 .533**
Sig. (2-tailed) .454 .285 .429 .708 .002
N 30 30 30 30 30 30
TSC Pearson Correlation .653** .744** .651** .542** .533** 1
Sig. (2-tailed) .000 .000 .000 .002 .002
N 30 30 30 30 30 30
**. Correlation is significant at the 0.01 level (2-tailed).
*. Correlation is significant at the 0.05 level (2-tailed).

73
Validity of Culture (X4)
Correlations
C1 C2 C3 C4 C5 TC
C1 Pearson Correlation 1 .636** -.116 .462* -.153 .648**
Sig. (2-tailed) .000 .541 .010 .421 .000
N 30 30 30 30 30 30
C2 Pearson Correlation .636** 1 .048 .453* .069 .752**
Sig. (2-tailed) .000 .800 .012 .717 .000
N 30 30 30 30 30 30
C3 Pearson Correlation -.116 .048 1 .122 .258 .438*
Sig. (2-tailed) .541 .800 .522 .169 .016
N 30 30 30 30 30 30
C4 Pearson Correlation .462* .453* .122 1 .031 .704**
Sig. (2-tailed) .010 .012 .522 .870 .000
N 30 30 30 30 30 30
C5 Pearson Correlation -.153 .069 .258 .031 1 .393*
Sig. (2-tailed) .421 .717 .169 .870 .032
N 30 30 30 30 30 30
TC Pearson Correlation .648** .752** .438* .704** .393* 1
Sig. (2-tailed) .000 .000 .016 .000 .032
N 30 30 30 30 30 30
**. Correlation is significant at the 0.01 level (2-tailed).
*. Correlation is significant at the 0.05 level (2-tailed).

74
Validity of Consumer Purchase Decision (Y)
Correlations
PD1 PD2 PD3 PD4 PD5 TPD
PD1 Pearson Correlation 1 -.099 .341 .535** .416* .651**
Sig. (2-tailed) .604 .065 .002 .022 .000
N 30 30 30 30 30 30
PD2 Pearson Correlation -.099 1 .029 -.094 .180 .366*
Sig. (2-tailed) .604 .879 .622 .342 .047
N 30 30 30 30 30 30
PD3 Pearson Correlation .341 .029 1 .538** .258 .672**
Sig. (2-tailed) .065 .879 .002 .169 .000
N 30 30 30 30 30 30
PD4 Pearson Correlation .535** -.094 .538** 1 .577** .773**
Sig. (2-tailed) .002 .622 .002 .001 .000
N 30 30 30 30 30 30
PD5 Pearson Correlation .416* .180 .258 .577** 1 .752**
Sig. (2-tailed) .022 .342 .169 .001 .000
N 30 30 30 30 30 30
TPD Pearson Correlation .651** .366* .672** .773** .752** 1
Sig. (2-tailed) .000 .047 .000 .000 .000
N 30 30 30 30 30 30
**. Correlation is significant at the 0.01 level (2-tailed).
*. Correlation is significant at the 0.05 level (2-tailed).

75
Appendix 3 Questionnaire (In English)
The Influence of Personal and Cultural Factor Toward Consumer Purchase
Decision in Starbucks South Jakarta
--------------------------------------------------------------------------
Part I
--------------------------------------------------------------------------
In this section, you are asked to fill your profile, please cross (X) or circle the statement below.
Respondent Profile
Gender a. Male b. Female
Age a. 17- 19 years old b. 20 – 22 years old c. >23 years old
Income per month (Allowance) a. < Rp 500,000 b. Rp 500,001- 1,000,000 c. Rp 1,000,001- 1,500,000 d. Rp 1,500,001- 2,000,000 e. > 2,000,000
--------------------------------------------------------------------------
Part II
--------------------------------------------------------------------------
Instruction for filling
In this section, you are asked to give an opinion on how much the following
statement in lifestyle, economic condition, social class, culture and purchase
decision. Please rate the following statement according to Strongly Disagree (SD),

76
Disagree (D), Neutral(N), Agree (A) and Strongly Agree (SA) and give the check
(√) for your answer.
Choose 1 if you are Strongly Disagree (SD) with the statement, choose 2 if you
are Disagree (D) with the statement, choose 3 if you are Neutral (N) with the
statement, Choose 4 if you are Agree (A) with the statement, Choose 5 if you are
Strongly Agree (SA) with the statement.
Lifestyle (X1)
No Questions 1 2 3 4 5
1 Going to Starbucks is my main choice to focus on doing my work
2 I visit Starbucks to end my day or just to kill times
3 People patterns can be reflected on how they spent their time or money
4 I repurchase Starbucks because they have more interesting aspect than other coffee shop
5 In my opinion, purchasing Starbucks made me feel classier
Economic condition (X2)
No Questions 1 2 3 4 5
1 The prices on Starbucks are affordable and I can still save some.
2 My current financial doesn’t hold me back to purchase Starbucks
3 The income differences make the urge to purchase needs to be adapted

77
4 Price will not be a problem if the service, ambience, and qualities are excellent
5 I would pay higher price than the average, to purchase Starbucks as the best coffee shop in Indonesia
Social class (X3)
No Questions 1 2 3 4 5
1 I chose Starbucks as a prestige brand that fit into my student status
2 I feel more higher than other people, Starbucks is my go to coffee shop
3 Most Starbucks customers has the same characteristic as me.
4 Starbucks became the most prestige meeting point for met with friends.
5 Starbucks are meant for middle-upper social class

78
Culture (X4)
No Questions 1 2 3 4 5
1 I purchase Starbucks because there is family experience before it.
2 I will buy a product even though it is expensive as long it is recommended by my close friend
3 My friends affected me to buy Starbucks
4 Family recommendations made me buy Starbucks
5 Curiosity and habits made me purchase Starbucks
Consumer purchase decision (Y)
No Questions 1 2 3 4 5
1 My motivation to go to Starbucks is to buy their signature taste drinks and food
2 I received Starbucks drinks information from my close friends
3 Their signature taste made me consider to purchase Starbucks
4 I considerate to buy Starbucks brand because it’s already a usual thing
5 I will always choose Starbucks drinks even though they increase the price.

79
Questionnaire (In Bahasa)
Pengaruh Faktor Pribadi dan Budaya Terhadap Keputusan Pembeian
Konsumen Starbucks di Jakarta Selatan
--------------------------------------------------------------------------
Bagian I
--------------------------------------------------------------------------
Pada bagian ini, dimohon untuk memberi silang (X) atau melingkari beberapa pernyataan dibawah ini.
Data responden
Jenis kelamin a. Laki-lakib. Perempuan
Usia a. 17-19tahunb. 20–22tahun
c. >23 tahun
Uang saku per bulan a. <Rp500,000b. Rp500,001-1,000,000c. Rp1,000,001-1,500,000d. Rp1,500,001-2,000,000e. >2,000,000
--------------------------------------------------------------------------
Bagian II
--------------------------------------------------------------------------
Pada bagian ini, Anda akan diminta untuk memberikan pendapat atas beberapa
pernyataan dalam gaya hidup, kondisi ekonomi, kelas sosial, budaya dan
keputusan pembelian. Silakan menilai pernyataan berikut sesuai dengan Sangat
Tidak Setuju,

80
Tidak Setuju, Netral , Setuju dan Sangat Setuju. Dengan memberikan cek (√)
untuk jawaban Anda.
Pilih 1 jika Anda Sangat Tidak Setuju dengan pernyataan, pilih 2 jika Anda tidak
setuju dengan pernyataan, pilih 3 jika Anda Netral dengan pernyataan, pilih 4 jika
Anda Setuju dengan pernyataan, Pilih 5 jika Anda Sangat Setuju dengan
pernyataan itu.
Gaya Hidup (X1)
No Pernyataan 1 2 3 4 5
1 Datang ke starbucks menjadi sebuah pilihan bagi saya saat ingin kosentrasi mengerjakan tugas kuliah
2 Saya mengungjungi starbucks untuk menutup selutuh aktivitas/menghabiskan waktu yang ada di hari itu
3 Pola kehidupan seseorang tercermin dari cara menghabiskan waktu dan membelanjakan uangnya
4 Saya melakukan pembelian ulang ke starbucks karena memiliki ketertarikan dibandikan kedai kopi lain
5 Menurut saya, membeli starbucks membuat saya lebih jadi berkelas
Kondisi ekonomi (X2)
No Pernyataan 1 2 3 4 5
1 Harga starbucks sesuai dengan keuangan saya saat ini, bahkan masih cukup untuk menabung
2 Sesuai keuangan saya sekarang ini, tidak menghalangi untuk melakukan pembelian starbucks

81
3 Pendapatan yang berbeda beda membuat kebutuhan untuk membeli harus disesuaikan
4 Harga tidak akan menjadi pertimbangan bila memberikan pelayanan, suasana dan kualitas yang baik
5 Saya akan membayar lebih mahal dibandingkan harga rata rata, untuk dapat membeli starbucks sebagai kedai kopi terbaik di indonesia
Kelas sosial (X3)
No Pernyataan 1 2 3 4 5
1 Saya menjatuhkan pilihan starbucks yang memiliki merek prestise karena sesuai dengan status saya sebagai mahasiswa
2 Saya merasa kesejahteraan lebih tinggi di bandingkan orang lain, starbucks adalah pilihan yang tepat
3 Kebanyakan pelanggan starbucks memiliki karakteristik yang sama dengan diri saya sebagai mahasiswa
4 Starbucks menjadi sebuah meeting point yang prestise ketika bertemu dengan teman
5 Starbucks diperuntukan untuk kelas social menengah ke atas

82
Budaya (X4)
No Pernyataan 1 2 3 4 5
1 Saya membeli starbucks karena adanya pengalaman dari anggota keluarga sebelumnya
2 Saya membeli produk meskipun mahal selama produk tersebut direkomendasikan oleh teman terdekat saya
3 Teman perkumpulan mempengaruhi saya untuk memutuskan membeli starbucks
4 Rekomendasi dari keluarga membuat yakin membeli starbucks
5 Rasa keinginan yang mendasar dan kebiasaan membuat untuk membeli starbucks
Keputusan pembelian konsumen (Y)
No Questions 1 2 3 4 5
1 Motivasi saya berkunjung ke starbucks karena ingin membeli minuman dengan rasa khas
2 Saya memperoleh informasi tentang produk minuman starbucks melalui teman dekat saya
3 Rasa minuman yang khas menjadi pertimbangan membeli starbucks
4 Saya memutuskan membeli starbucks karena menjadi kebiasaan bagi saya
5 Saya akan tetap memilih starbucks apabila mengalami kenaikan harga

83
Appendix 4 Data Collection for 100 Respondents
(Lifestyle, Economic Condition and Social Class Variables)
LS1
LS2
LS3
LS4
LS5
TLS
EC1
EC2
EC3
EC4
EC5
TEC
SC1
SC2
SC3
SC4
SC4
TSC
3 2 4 3 3 15 4 4 5 4 3 20 4 3 4 3 4 18
1 3 2 3 2 11 3 3 3 4 3 16 2 2 2 2 1 9
3 2 3 3 2 13 1 1 3 3 2 10 2 3 2 3 5 15
2 2 4 1 2 11 3 3 3 4 3 16 2 3 2 4 4 15
1 2 5 1 1 10 2 2 2 3 2 11 1 1 1 2 1 6
3 2 4 3 4 16 3 4 4 4 3 18 3 4 4 4 4 19
5 5 5 4 4 23 5 5 3 5 5 23 5 5 5 4 4 23
4 4 5 5 5 23 4 5 5 5 5 24 4 5 5 4 3 21
4 2 2 4 2 14 4 4 5 3 3 19 3 2 3 4 3 15
3 3 4 4 2 16 3 3 4 4 3 17 3 3 3 4 4 17
4 4 4 4 3 19 4 4 4 3 3 18 4 3 4 4 4 19
4 4 4 5 4 21 4 4 5 4 3 20 4 3 4 4 4 19
3 4 4 3 3 17 4 4 4 3 3 18 4 4 5 4 4 21
4 5 5 5 4 23 4 4 5 4 5 22 4 3 4 4 4 19
4 4 4 5 4 21 3 3 4 3 3 16 3 3 4 4 3 17
3 5 5 3 2 18 4 4 3 4 3 18 3 3 3 4 3 16
4 3 4 4 4 19 3 3 4 3 3 16 4 4 5 5 4 22
3 5 4 3 3 18 4 4 3 3 3 17 3 3 4 4 3 17
4 5 5 4 4 22 3 3 4 3 3 16 4 3 4 4 3 18
4 4 5 4 3 20 3 3 3 4 3 16 4 4 4 4 3 19
3 4 3 4 3 17 4 4 3 4 4 19 4 3 4 4 4 19
3 4 4 4 3 18 4 4 3 3 3 17 4 3 4 3 3 17
3 4 5 5 4 21 2 3 5 1 4 15 4 3 5 4 2 18
3 2 3 4 2 14 4 4 4 3 1 16 3 3 4 2 3 15
3 3 4 3 1 14 3 3 4 4 3 17 3 2 3 2 2 12
2 3 2 3 2 12 3 4 3 4 3 17 3 3 3 4 2 15

84
3 4 5 3 2 17 4 4 4 4 3 19 3 2 3 4 2 14
3 4 4 3 2 16 4 4 4 4 3 19 3 2 3 4 2 14
4 4 5 4 4 21 4 4 3 3 3 17 4 4 4 4 3 19
4 4 4 4 5 21 4 4 3 3 4 18 4 3 4 4 4 19
5 3 5 4 2 19 2 3 4 2 2 13 2 2 2 4 3 13
3 3 1 5 3 15 5 3 1 5 3 17 3 3 3 3 1 13
5 4 4 5 3 21 4 3 5 4 3 19 3 1 3 4 3 14
2 1 4 3 1 11 3 3 5 5 1 17 3 3 3 3 4 16
1 1 5 3 1 11 1 1 5 1 1 9 2 2 2 4 1 11
4 4 3 4 4 19 4 4 3 5 3 19 3 3 4 4 3 17
3 2 1 3 5 14 3 2 1 2 3 11 2 3 2 3 2 12
4 2 1 5 3 15 3 4 5 4 1 17 4 4 4 5 3 20
3 4 4 4 3 18 4 4 4 4 3 19 3 2 4 4 4 17
3 2 2 3 2 12 4 4 4 4 3 19 2 2 2 3 4 13
2 2 1 3 1 9 4 4 5 5 1 19 3 2 2 3 3 13
4 2 5 5 4 20 4 4 5 4 3 20 3 4 4 4 4 19
4 4 5 4 4 21 1 1 4 1 1 8 4 4 4 4 3 19
3 3 3 4 2 15 4 4 4 3 3 18 4 3 3 3 3 16
4 5 5 4 3 21 3 4 2 4 3 16 3 2 3 4 3 15
3 4 2 3 2 14 2 3 4 4 3 16 3 2 3 4 3 15
4 4 5 4 4 21 4 4 5 4 4 21 4 4 4 4 3 19
3 4 2 2 2 13 5 4 2 2 3 16 3 2 4 3 2 14
4 4 5 4 3 20 2 2 3 3 3 13 3 3 4 4 4 18
4 4 5 4 3 20 2 2 3 3 3 13 3 3 4 4 4 18
1 3 5 3 3 15 1 3 3 3 2 12 5 4 3 3 5 20
1 4 4 3 5 17 1 3 3 1 3 11 3 3 3 5 3 17
2 3 5 3 3 16 3 4 3 5 4 19 3 4 5 4 4 20
2 3 5 4 1 15 1 3 5 4 3 16 3 4 5 5 5 22
2 1 3 4 2 12 3 2 2 3 2 12 2 3 3 3 2 13
3 3 4 4 5 19 3 3 3 4 4 17 4 4 4 5 4 21
2 2 3 2 2 11 2 2 1 2 2 9 2 2 4 2 2 12

85
5 5 3 4 3 20 4 5 5 5 3 22 3 2 3 5 3 16
5 1 5 3 1 15 1 2 5 3 1 12 3 1 3 5 5 17
5 3 3 3 1 15 1 3 4 3 1 12 1 1 3 3 5 13
2 3 3 3 4 15 2 2 4 2 3 13 3 1 4 4 2 14
4 3 4 3 3 17 2 2 4 4 3 15 3 4 4 5 3 19
3 4 3 4 2 16 4 3 5 5 4 21 4 4 3 5 3 19
1 2 4 1 2 10 1 1 2 2 1 7 2 1 2 1 4 10
3 3 4 5 3 18 4 3 5 4 3 19 1 3 4 5 4 17
2 4 5 4 4 19 3 2 4 5 4 18 2 4 4 5 3 18
1 1 4 1 2 9 2 2 4 3 1 12 2 2 1 2 3 10
2 5 4 4 2 17 3 4 4 5 3 19 4 4 3 5 4 20
5 4 5 5 3 22 5 3 5 3 4 20 5 2 3 4 4 18
4 4 5 5 4 22 5 4 4 5 2 20 4 4 2 5 4 19
1 3 4 2 1 11 3 3 5 4 3 18 2 1 3 4 2 12
1 1 3 2 1 8 1 1 3 4 2 11 2 2 3 3 4 14
1 1 4 1 3 10 1 3 4 5 2 15 1 2 1 2 4 10
2 5 4 5 2 18 4 3 5 4 3 19 3 1 3 3 4 14
3 4 3 3 2 15 3 3 4 4 3 17 3 3 4 5 4 19
3 2 4 2 4 15 1 2 5 5 1 14 1 2 3 4 4 14
1 1 4 2 2 10 2 3 4 4 1 14 3 2 4 4 5 18
2 4 3 4 3 16 4 3 4 3 2 16 3 1 3 4 3 14
1 3 4 3 1 12 2 3 5 1 1 12 1 3 4 5 5 18
4 3 5 5 4 21 2 3 4 5 4 18 4 4 4 5 5 22
2 1 4 4 4 15 3 2 5 2 1 13 3 2 4 5 4 18
3 3 4 2 2 14 3 3 2 3 3 14 2 2 2 3 3 12
4 5 4 5 5 23 5 4 4 4 5 22 5 4 4 3 4 20
2 1 5 2 1 11 3 1 5 4 2 15 4 4 3 4 2 17
3 4 5 2 2 16 4 4 5 5 3 21 3 4 4 4 2 17
2 1 5 2 5 15 1 1 3 1 2 8 2 2 2 5 5 16
3 4 4 3 3 17 2 2 5 3 3 15 3 3 4 4 2 16
3 1 3 4 1 12 1 1 5 3 5 15 1 3 3 4 3 14

86
2 3 4 3 3 15 1 2 4 3 1 11 1 1 1 3 4 10
2 2 4 4 2 14 2 4 4 3 2 15 2 2 2 4 3 13
3 4 4 4 2 17 2 2 4 3 3 14 2 4 2 4 4 16
3 4 5 3 3 18 3 3 4 4 3 17 3 3 4 4 2 16
3 4 4 3 3 17 2 2 5 3 3 15 3 3 4 4 2 16
3 4 5 3 3 18 3 3 4 4 3 17 3 3 4 5 2 17
1 2 4 3 3 13 4 4 3 3 1 15 2 2 2 3 4 13
3 2 3 2 3 13 3 3 4 5 4 19 4 3 4 5 2 18
3 4 5 5 3 20 2 4 5 5 3 19 3 3 3 5 5 19
1 1 4 4 3 13 3 4 4 4 3 18 3 4 5 4 2 18
5 1 3 3 1 13 1 3 5 3 1 13 1 1 1 3 5 11
5 5 5 3 3 21 5 3 3 5 1 17 3 3 5 3 5 19
(Culture and Consumer Purchase Decision Variables)
C1 C2 C3 C4 C5 TC PD1 PD2 PD3 PD4 PD5 TPD
4 3 4 4 4 19 3 3 4 3 4 17
4 4 3 3 1 15 2 3 3 2 3 13
3 4 3 4 4 18 3 3 3 2 1 12
2 3 2 3 2 12 4 3 4 2 2 15
5 1 1 2 1 10 2 3 1 1 1 8
3 3 4 3 3 16 3 3 3 3 3 15
3 5 5 5 5 23 4 3 5 5 5 22
4 5 5 5 5 24 2 3 2 3 5 15
3 3 3 3 4 16 4 3 4 3 5 19
3 3 5 5 4 20 4 1 4 3 4 16
3 4 3 2 4 16 4 2 4 3 3 16
4 4 5 5 4 22 4 3 4 4 4 19
4 3 3 3 4 17 3 3 2 3 11
4 4 5 5 5 23 4 3 4 3 3 17

87
4 3 3 3 4 17 3 3 4 5 4 19
3 3 3 4 5 18 4 5 4 4 4 21
5 3 4 4 4 20 4 4 4 3 4 19
4 5 4 4 4 21 5 2 5 5 4 21
4 4 4 3 4 19 3 3 4 4 4 18
4 4 4 3 4 19 4 3 4 4 3 18
4 4 4 4 5 21 4 3 4 5 4 20
4 4 3 4 5 20 3 1 4 4 4 16
1 1 2 2 4 10 4 1 4 4 4 17
4 3 4 4 2 17 4 1 4 3 4 16
2 2 2 3 4 13 4 4 3 2 3 16
2 2 2 3 3 12 3 4 3 2 3 15
1 2 2 1 2 8 3 4 3 4 4 18
1 1 2 1 2 7 3 3 3 3 5 17
4 4 4 4 5 21 4 3 4 4 3 18
4 4 4 3 2 17 4 3 5 5 4 21
2 2 2 3 2 11 3 3 3 2 3 14
3 3 3 3 4 16 5 3 3 5 5 21
2 3 3 3 3 14 4 3 3 3 3 16
1 1 2 1 2 7 4 3 3 2 1 13
1 1 2 1 4 9 2 3 2 1 1 9
4 2 2 3 3 14 4 2 4 4 3 17
5 4 2 3 2 16 2 1 2 3 5 13
2 2 4 3 5 16 5 1 5 5 4 20
2 2 3 2 3 12 4 2 4 3 3 16
4 3 2 2 4 15 4 2 4 4 3 17
5 2 3 3 3 16 4 5 4 2 2 17
2 3 4 2 3 14 4 3 4 4 4 19
2 2 2 1 2 9 3 3 4 3 4 17
2 2 2 2 3 11 2 3 2 3 2 12
1 2 2 2 3 10 3 3 4 4 4 18

88
1 2 3 1 3 10 3 3 3 2 2 13
3 3 4 3 4 17 4 3 4 4 4 19
4 3 2 3 2 14 2 3 2 4 4 15
4 3 2 3 3 15 3 4 4 3 3 17
4 3 2 3 3 15 3 4 4 3 2 16
4 3 3 4 4 18 4 2 4 2 2 14
3 1 3 3 3 13 4 4 3 3 3 17
4 1 4 4 5 18 4 2 5 4 3 18
4 5 4 3 5 21 5 3 4 1 2 15
3 2 2 2 2 11 3 3 1 2 2 11
2 3 3 2 3 13 4 3 3 3 3 16
2 2 1 2 2 9 2 3 2 2 3 12
3 3 3 3 5 17 5 3 5 5 4 22
5 1 1 1 5 13 3 3 3 1 1 11
3 3 3 1 3 13 1 4 1 3 3 12
2 1 2 3 4 12 3 3 3 2 4 15
2 4 3 4 4 17 4 3 4 3 3 17
3 4 3 4 5 19 4 3 4 2 4 17
3 2 4 2 3 14 3 3 4 3 2 15
2 1 3 1 3 10 4 3 5 4 3 19
2 4 3 4 5 18 3 2 5 3 2 15
3 4 3 4 5 19 4 3 3 1 2 13
2 4 2 1 2 11 2 3 2 4 3 14
5 3 4 4 3 19 5 3 3 4 3 18
5 4 4 3 4 20 5 3 4 5 3 20
3 2 1 1 2 9 3 3 3 1 2 12
3 4 3 4 4 18 4 3 3 1 1 12
1 2 1 4 3 11 2 3 2 1 3 11
1 1 2 3 4 11 4 3 4 3 3 17
3 4 3 2 3 15 5 2 4 4 2 17
3 3 2 2 4 14 4 2 4 1 2 13

89
1 1 4 1 3 10 3 2 2 2 1 10
1 2 4 2 3 12 3 3 4 3 4 17
1 1 1 1 3 7 3 2 1 3 1 10
4 4 5 3 5 21 4 2 4 4 5 19
2 2 4 2 3 13 4 2 2 1 2 11
2 2 4 2 3 13 3 2 2 2 3 12
4 4 4 5 5 22 4 2 4 5 5 20
4 3 4 4 3 18 4 3 3 5 4 19
2 4 2 4 4 16 4 3 4 3 3 17
3 4 3 3 2 15 2 3 3 4 2 14
3 1 2 3 3 12 4 3 4 1 3 15
3 3 3 2 4 15 1 3 3 2 1 10
2 3 2 3 5 15 2 4 3 4 3 16
4 3 2 2 1 12 4 4 2 2 3 15
2 2 3 4 5 16 4 1 4 4 3 16
4 3 3 2 5 17 5 1 4 3 2 15
3 1 2 3 3 12 4 3 4 2 3 16
4 3 3 1 4 15 5 3 4 3 2 17
1 1 2 3 4 11 4 3 3 3 2 15
3 3 4 3 3 16 3 3 3 2 4 15
4 4 5 5 5 23 4 3 5 3 4 19
3 2 3 3 4 15 4 3 4 3 3 17
3 3 3 1 3 13 1 3 1 3 3 11
3 3 4 3 4 17 3 5 3 5 5 21

90
Appendix 5 Output SPSS 23.0
Descriptive statistics
N Minimum Maximum Mean Std. Deviation
TLS 100 1.00 5.00 3.242 1.125
TEC 100 1.00 5.00 3.236 1.0624
TSC 100 1.00 5.00 3.25 0.9812
TC 100 1.00 5.00 3.022 1.1034
TPD 100 1.00 5.00 3.26 1.047
Valid N (listwise) 100
Regression
Variables Entered/Removeda
Model Variables Entered
Variables Removed Method
1 TC, TEC, TLS, TSCb
. Enter
a. Dependent Variable: TPD
b. All requested variables entered.
Model Summaryb
Model R R Square Adjusted R
Square Std. Error of the
Estimate Durbin-Watson
1 .725a .526 .506 2.190 2.177
a. Predictors: (Constant), TC, TEC, TLS, TSC

91
b. Dependent Variable: TPD
ANOVAa
Model Sum of Squares df Mean Square F Sig.
1 Regression 505.732 4 126.433 26.357 .000b
Residual 455.708 95 4.797
Total 961.440 99
a. Dependent Variable: TPD
b. Predictors: (Constant), TC, TEC, TLS, TSC
Coefficientsa
Model Unstandardized
Coefficients
Standardized
Coefficients
t Sig. Collinearity Statistics
B Std.
Error
Beta Tolerance VIF
1 (Constant) 3.933 1.278 3.078 .003
TLS .349 .079 .425 4.441 .000 .546 1.832
TEC .262 .076 .293 3.468 .001 .698 1.432
TSC -.020 .094 -.021 -.218 .828 .515 1.941
TC .155 .065 .201 2.380 .019 .702 1.425
a. Dependent Variable: TPD

92
Collinearity Diagnosticsa
Model Dimension Eigenvalue Condition
Index
Variance Proportions
(Constant) TLS TEC TSC TC
1 1 4.897 1.000 .00 .00 .00 .00 .00
2 .038 11.322 .06 .05 .05 .01 .95
3 .028 13.300 .24 .50 .23 .05 .00
4 .023 14.681 .54 .02 .71 .04 .00
5 .015 18.196 .16 .44 .01 .90 .04
a. Dependent Variable: TPD

93

94
APPENDIX 6 Turnitin
Turnitin Originality Report
Skripsi by Ibtihal Alfa
From SKRIPSI 2016 (MANAGEMENT 2013)
• Processed on 30-Jan-2017 10:15 WIB
• ID: 764086944
• Word Count: 8997
Similarity Index
7%
Similarity by Source
Internet Sources:
7%
Publications:
2%
Student Papers:
N/A
sources:
1 1% match (Internet from 13-Oct-2014)
http://repository.uinjkt.ac.id/dspace/bitstream/123456789/23927/1/THESIS%20DIAH%2
0NUR%20PERTIWI.pdf
2 1% match (Internet from 17-Dec-2016)
http://dspace.nwu.ac.za/bitstream/handle/10394/11193/Mokgoto_HL.pdf?isAllowed=y&s
equence=1

95
3< 1% match (Internet from 10-Jan-2016)
http://lookingforfree.blogspot.com/2011_09_01_archive.html
4< 1% match (Internet from 14-Jul-2015)
http://www.iicies.org/files/Proceeding-IICIES-2013.pdf
5< 1% match (Internet from 15-Aug-2016)
http://chemistry.about.com/od/mathsciencefundamentals/ss/Standard-Deviation-
Equations.htm?globeResourc=
6< 1% match (Internet from 15-Jun-2014)
http://prezi.com/od5xiodpaw6x/copy-of-starbucks/
7< 1% match (publications)
Chung Leng, Kooi, and Abu Bakar Abdul Hamid. "A Study on the Factors Affecting
Consumers Adoption Toward Environmentally Friendly Car - Hybrid Car", Advanced
Materials Research, 2013.
8< 1% match (Internet from 28-Apr-2014)
http://kau.diva-portal.org/smash/get/diva2:232419/FULLTEXT01.pdf
9< 1% match (Internet from 25-Nov-2015)
http://kb.psu.ac.th/psukb/bitstream/2010/8775/1/363448.pdf
10< 1% match (Internet from 07-Aug-2014)
http://wbiworldconpro.com/uploads/malaysia-conference-2013/management/473-
Tahir.pdf
11< 1% match (Internet from 11-Jan-2017)
http://journals.univ-danubius.ro/index.php/oeconomica/article/view/2719/2568
12< 1% match (Internet from 01-May-2016)
http://eprints.utar.edu.my/1020/1/BA-2013-1007351-1.pdf

96
13< 1% match (Internet from 24-Aug-2015)
http://csc.hcmiu.edu.vn:8080/dspace/bitstream/handle/123456789/971/022001155%20-
%20Anh,%20Ong%20Thi%20Phuong.pdf?sequence=1(Accessed:
14< 1% match (Internet from 18-May-2013)
http://www.e-l-e.net.cn/teacher/read/gouwu/201108/55980.htm
15< 1% match (Internet from 19-Apr-2016)
https://lra.le.ac.uk/bitstream/2381/4616/1/275496.pdf
16< 1% match (Internet from 22-Apr-2016)
http://orca.cf.ac.uk/54730/1/U585119.pdf
17< 1% match (Internet from 17-Jun-2016)
http://port.sas.ac.uk/mod/book/tool/print/index.php?id=1520
18< 1% match (Internet from 05-Feb-2015)
http://realof.com/factors-affecting-consumer-behavior.html
19< 1% match (Internet from 08-Mar-2015)
http://pt.slideshare.net/FaisalWali/at-business-management-review-december-edition-
2012
20< 1% match (Internet from 06-Nov-2002)
http://www.osc.edu/education/webed/Projects/model_and_statistics/overview.shtml
21< 1% match (Internet from 29-May-2015)
http://theseus.fi/handle/10024/15358
22< 1% match (Internet from 24-May-2016)
http://eprints.utar.edu.my/1387/1/BF-2014-1103382.pdf
23< 1% match (Internet from 26-Feb-2016)

97
https://hci.sbg.ac.at/wp-content/uploads/2015/05/MastersThesisStollnberger.pdf
24< 1% match (Internet from 19-Jan-2015)
http://www.indiana.edu/~educy520/sec5982/week_3/measure_rel_val_rsm.pdf
25< 1% match (Internet from 16-May-2014)
http://eprints.utm.my/19990/1/ajbm4.pdf
26< 1% match (Internet from 10-Jan-2017)
http://scholar.unand.ac.id/12420/2/Bab%201%20%28Pendahuluan%29.pdf
27< 1% match (Internet from 23-Feb-2014)
http://iosrjournals.org/iosr-jhss/papers/Vol18-issue3/L01838391.pdf?id=7363
28< 1% match (Internet from 07-Sep-2016)
http://repository.unhas.ac.id/handle/123456789/10168
29< 1% match (Internet from 19-May-2015)
http://www.slideshare.net/NabilIdzhar/project-paper-43012925
30< 1% match (Internet from 14-Jun-2016)
http://www.essay.uk.com/essays/business/thesis-evaluate-the-prospects-and-operational-
impediments-of-sadharan-bima-corporation/
31< 1% match (Internet from 10-Mar-2016)
http://eprints.port.ac.uk/8492/1/N.A._Mahamed_Ismail_PhD_May_2012.pdf
32< 1% match (Internet from 27-Oct-2013)
http://lnu.diva-portal.org/smash/get/diva2:420926/FULLTEXT01.pdf
33< 1% match (Internet from 25-Apr-2003)
http://www.icbemp.gov/science/eddleman.pdf