the influence of national culture on accounting and finance
TRANSCRIPT

The Influence of National Culture on Accounting
and Finance
A THESIS SUBMITTED TO
BY
SUPUN MEKHALA CHANDRASENA
SUPERVISED BY
DR. RANADEVA JAYASEKERA
FOR THE DEGREE OF DOCTOR OF PHILOSOPHY Ph.D
TRINITY BUSINESS SCHOOL
TRINITY COLLEGE DUBLIN
THE UNIVERSITY OF DUBLIN
2021

ii
Declaration
I declare that this thesis has not been submitted as an exercise for a degree at this or any other university and it is entirely my own work. I agree to deposit this thesis in the University’s open access institutional repository or allow the Library to do so on my behalf, subject to Irish Copyright Legislation and Trinity College Library conditions of use and acknowledgement. I consent to the examiner retaining a copy of the thesis beyond the examining period, should they so wish (EU GDPR May 2018). Signed: …………………………. Date: ……12 Nov 2020………..

iii
Summary
This thesis, empirically analyses the role of cultural aspects in accounting and finance disciplines from diverse
perspectives. It is made up of three distinct research papers. The first paper (chapter 4) primarily investigates
the impact of sociocultural factors in underpinning early accounting thought in an ancient civilization (Ceylon-
presently known as Sri Lanka). The next two papers maintain cultural aspects in the limelight but shift the
focus to the modern corporate world. Precisely, the second paper (chapter 5) examines the role of Chief
Executive Officer’s (CEO) cultural values in the firm leverage decision. The third paper (chapter 6) extends the
work of chapter 5 and proposes that a firm does not associate with only a single culture, which has been the
conventional research focus, but that firms operate with a multiplicity of cultures. Therefore chapter 6
empirically analyses the impact of cultural differences among the CEO, board of directors and stakeholders
in a firm, on determining its idiosyncratic risk. Therefore, this thesis emphasizes the impact of culture on
various accounting and finance aspects from a context ranging from antiquity to modern times. Another
notable feature is that chapters 5 and 6 of this thesis, transcend the previous common focus of firm
nationality based on country of origin and study cultural influences on corporate decision-making at a
granular level, i.e. by examining the cultural values of the key players in a firm (e.g. the CEO, board of
directors, stakeholders). Overall, it contributes to the existing literature on the impact of culture in
Accounting and Finance outcomes.
Chapter 4 goes back in time to the 1st-2nd centuries A.D. in ancient Ceylon (presently Sri Lanka) and employs
content analysis method to study the English translations of 122 lithic and other inscriptions during the period
from 1st century A.D. to the 16th century A.D. The study refers to an array of accounting and non-accounting
practices in the ancient days and finds the existence of well-articulated forms of ‘kingship accounting’ and
‘Buddhist temple accounting’ practices that were engraved in rock walls or formations in ancient Ceylon.
Furthermore this paper sheds light on the existence of cultural, socio-economic, political and technological
infrastructure that underpinned the early accounting system, with special reference to the sociocultural
landscape in ancient Ceylon that was largely governed by Buddhist philosophies. The study reveals that
sociocultural factors exerted a dual impact, i.e. direct and indirect, on early accounting thought. The
sociocultural factors that compelled accounting practices to be undertaken in ancient Buddhist monasteries
signifies the direct impact, whilst the indirect impact encompasses the role of Buddhist cultural values in
shaping the ancient political, technological (literacy, numerical technology and coinage) and economic
landscape, which in turn underpinned early accounting thought. This study is unique as it brings to the fore,
the influence of socio-cultural factors that prevailed during the ancient era, in ensuring the continuation of
early accounting practices. Following a thorough literature review in a Ceylonese context, the researcher
believes that this is among the first attempts to do so.
Chapter 5 (and subsequently chapter 6) focuses on cultural implications in a modern corporate setting.
Chapter 5, in particular, focuses on the influence of CEO’s cultural values on the firm leverage decision. It is
well-known that debt can mitigate agency problems between managers and stockholders, by minimizing free

iv
cash-flows. However, the implicit factors that might motivate a manager to voluntarily choose debt discipline
is barely researched. Chapter 5, therefore, focuses on managerial traits conditioned by national culture and
their impact on firm leverage decision. This study is novel as it transcends the previous conventional emphasis
on a firms’ nationality on the leverage decision by focusing on the CEO’s cultural origin and proposes that
national cultural values of CEOs distort their perception of costs and benefits of debt. In addition to testing
the association between CEO culture and firm leverage, the model is extended to closely examine the same,
given three scenarios, i.e. when the existing firm leverage is low, moderate and high. By scrutinizing a sample
of 594 CEOs, originating from 14 different nationalities, serving 317 Fortune 500 firms in the U.S., during 2000
to 2015 and by employing quantile panel regression with instrumental variables, the study reveals that high
mastery CEOs, unknowingly, are in the pursuit of a target capital structure whilst highly embedded CEOs
choose to borrow, irrespective of the current firm leverage. Apparently, high mastery CEOs make capital
structure decisions that are more in the interest of shareholders, while the capital structure decisions of
highly embedded CEOs might be detrimental to the firm. A direct link between cultural values and leverage,
has been detected and confirmed via an analysis of a major exogenous intervention (global financial crisis
2007/08) to the system. By using a sample of non-US CEOs, the study reveals that cultural values are portable.
Results remain robust to alternative specifications and procedures to mitigate endogeneity concerns.
Academically the findings of this paper open up new paradigms that need to be considered in the area of
agency conflicts and monitoring costs.
Chapter 6 extends the previous work in Chapter 5 and proposes that a firm does not associate with just a
single culture but operates with a multiplicity of cultures. Owing to the recent public pressure to increase
diversity on boards, firms increasingly employ foreign nationals as board of directors and/or CEOs. As the
employees, investors and other stakeholders are mostly local, how would they interact with a foreign CEO
and/or board of directors? More importantly how would this interaction among a multiplicity of cultures
affect the firm idiosyncratic risk? Whilst the cultural impact on firm outcomes has remained in the spotlight
for the last decade or so, the interaction of a multiplicity of cultures within a firm and its impact on corporate
outcomes is rarely studied. The study initially employs Feasible Generalized Least Squares Method (FGLS) and
then the Dynamic Panel System Generalized Method of Momentum (DPS-GMM) to analyse a sample of 1,190
firms from 12 European countries, over 14 years from 2005 to 2018. The findings reveal that the cultural
distance between the CEO and stakeholders, on firm risk, appear to remain positive and strongly significant,
regardless of endogeneity correction and various other robustness tests, inferring that the greater cultural
distances and the resulting disarray of preferences of CEOs and stakeholder groups may result with CEOs
making unpredictable decisions, ultimately increasing performance volatility. CEO – board cultural distance
evinces a negative association, which proves statistically significant in most of the endogeneity corrected
regression models, implying that a greater distance between the CEO and the board of directors is beneficial
to a company as the board will play a more independent and active role in preventing the management from
participating in value destroying risky ventures and making strategic decisions single-handedly. Within-board
cultural distances generate mixed results. Moreover, to allow for the asymmetries between cultural distances
and firm risk, quantile panel regression is employed. Whilst the first two cultural spheres reinforce the
previous findings, within-board cultural distances appear to reduce stock performance volatility, in firms with

v
moderate idiosyncratic risks, where the same is amplified in least volatile and most volatile firms, implying
that the extra social and human capital that would be brought in to the firm by culturally diverse directors,
would help to position the firm better in terms of managing risks, only in moderately uncertain environments.
The results of this study remain robust to alternative specifications and endogeneity concerns. To the best of
my knowledge, this paper is among the first, to investigate the co-existence of a multiplicity of cultures within
a firm and its impact on firm performance volatility.
Overall, the objective of this doctoral thesis is to improve the existing knowledge on the subtle and
understated influences of cultural differences and resulting human behaviour on business outcomes.

vi
Dedication
To my dad in heaven

vii
Acknowledgements
The world is a marvellous place with wonderful people, who strives to grow and help others grow. What
makes it even better is to have people who care, share and be there when needed. It was a great honour to
have been selected as a scholar. Yet, this thesis - the final product of my PhD journey, required a lot of
guidance, assistance, supervision and enormous support from numerous people and I’m extremely privileged
to have got this right throughout my journey.
Without going any further, I take this opportunity to thank Dr. Ranadeva Jayasekera, my academic supervisor
for his tremendous support throughout my PhD journey. It was a great pleasure and a privilege to study and
work under his guidance. His vision and motivation have deeply inspired me. He gave courage, strength and
above all, confidence, for me to face any challenge. Ranadeva enabled me to build up a profound research
and teaching portfolio and introduced me to the exciting world of academia! I am ever so grateful to you Sir!
Thank you for understanding and believing in me, before I did. I hope that one day I can be an excellent
supervisor as you are.
Further, I would like to take this opportunity to thank the continued support and assistance so generously
extended to me by Dr. Joseph McDonagh, throughout my PhD journey. Moreover, I would also like to convey
my heartfelt gratitude to the Dean of Trinity Business School (TBS)-Dr. Andrew Burke, Dr. Richard Keegan and
Dr. Martin Fellenz, for their support throughout my time at TBS. I have been fortunate enough to start my
academic career as an Assistant Professor at the Queen’s University Belfast and I can never forget the words
of encouragement and the support extended to me in every possible way by Professor Ciaran Connolly –
Head of the Accounting Team, Dr. Martin Kelly, Dr. Danielle McConville and all my colleagues at the Queen’s
Management School.
If not for my parents, I would not have ever dreamt of a doctorate. I have no words to express the gratitude
that arises deep within my heart. It’s my dad who planted the seed PhD in my mind. He taught me to strive
for excellence. Daddy - I would like to worship and thank you from the bottom of my heart. Although you are
no more with us, I know that you are looking at your little girl from above and showering your blessings. I
hope I have made you proud! Not forgetting my beloved mom - she was behind all these. There were times,
when I struggled to believe in myself, but she believed in me. She never allowed me to give up. She stood by
me in both sorrow and happiness. Thanks for everything mom - It’s crystal clear that you owe the credit.
Without your blessings, this achievement would never have been possible. I would also like to thank my two
brothers and their families - though miles apart, but always close to heart, extended their thoughtful wishes,
giving me hope.
My husband Manju, stood by me through thick and thin, facing all the difficulties, giving me courage. You
were both mom and dad to my daughter. Thank you, Manju Aiya, for teaching me the value of patience. I
know how much you must have struggled during the last 4 years, helping me to achieve my dream. Patiently
you watched me succeeding. Your love and understanding gave me strength and confidence. Not only the

viii
credit, my doctorate I offer you, with all my heart! Thank you, my baby girl, Suvee, for putting up with me,
being sat in a corner, playing by herself with her one and only companion, her dolly. I love you to the moon
and back!
I have always been blessed with an amazing circle of friends. I can never forget Aunty Ramani who deserves
my deepest gratitude, who helped me through hard times and mostly for preparing delicious meals for me,
while I was busy working. Thilini and Nilanga- I owe both of you a big thank you, for babysitting my daughter.
The world is wonderful when there are people like you. How can I ever forget Sandun? What a great person
you are! When my computer crashed, just four weeks before the thesis submission, you came to my rescue.
Thanks Ravi and Deeni, for being true friends. I’m ever so grateful to Dr. Brian Dempsey, for his unconditional
support, guidance and advice, especially during the final stages of thesis submission. You relieved a lot of
stress off me, just by being a true friend. Thanks Brian – Much appreciated! Not forgetting Dr. Deepak Saxena
and Benjamin Lynch for their thoughtful advice and the true willingness to help any time. Thank you, my
dearest friends, at the TBS PhD office, in particular Xiaolu Sun, Dr. Pearlean Chadha, Munawar Malik, Kadek
Ade Sawitri, Soeren Sinz, Marjan Zhaf, Xuan Kou, June and all my colleagues for the memories, and making
my PhD journey a memorable one.
Thank you - to everyone who strives to grow and help others grow.

Table of Contents
ix
Table of Contents
List of Tables ................................................................................................................................ xiv
List of Figures ................................................................................................................................ xv
Chapter 1: Introduction ............................................................................................................ 1
1.1 Background and motivation ........................................................................................... 1
1.2 Research questions and Contributions ........................................................................... 2
1.2.1 Early Accounting Thought in Ancient Ceylon and the Prominent Role of Sociocultural
Environment .................................................................................................................. 3
1.2.2 CEO’s Cultural Values and Firms’ Leverage Decisions ................................................... 4
1.2.3 The Clash of Cultures and Its Effect on Firm Performance Volatility ............................ 7
1.3 Aims and objectives ........................................................................................................ 9
1.4 Structure ......................................................................................................................... 9
1.5 Publications from the Thesis ........................................................................................ 10
Chapter 2: Literature Review .................................................................................................. 11
2.1 Introduction .................................................................................................................. 11
2.2 The Meaning of Culture ................................................................................................ 11
2.2.1 Definitions of Culture .................................................................................................. 11
2.2.2 Layers of Culture .......................................................................................................... 13
2.2.3 Formation, Persistence and Evolution of Culture ....................................................... 14
2.2.4 Measurement of Culture ............................................................................................. 16
2.3 How Does Culture Influence Business? ........................................................................ 19
2.3.1 Cultural Influence via National Institutions ................................................................. 21
2.3.2 Cultural Influence via Beliefs and Values of Individual Agents.................................... 22
2.3.3 The Impact of Culture Examined at Individual, Firm and National Levels ................... 23
2.3.4 Epidemiological Approach ........................................................................................... 25
2.3.5 The Impact of Culture on Business and Naissance of Cultural Finance ....................... 26
2.3.6 The Impact of Culture on Accounting Practices .......................................................... 28
2.4 Research in National Culture, Finance and Accounting: A Bibliometric Perspective ... 29
2.4.1 Culture and Finance: A Bibliometric Perspective on the Research Domain ................ 29
2.4.2 Culture and Accounting: A Bibliometric Perspective on the Research Domain .......... 33
2.5 Conclusion .................................................................................................................... 34
Chapter 3: Research Philosophy ............................................................................................. 35
3.1 Introduction .................................................................................................................. 35
3.2 What is research? ......................................................................................................... 35
3.3 The nature of reality – ontological position ................................................................. 36

Table of Contents
x
3.4 What constitutes acceptable knowledge? – The Epistemological Position .................. 36
3.5 The Most Common Data Collection Techniques used by the Two Main Viewpoints of
Research ...................................................................................................................................... 37
3.6 Pragmatism as a Research Philosophy .......................................................................... 37
3.7 Conclusion ..................................................................................................................... 37
Chapter 4: Early Accounting Thought in Ancient Ceylon and the Prominent Role of Sociocultural
Environment ........................................................................................................ 39
4.1 Introduction .................................................................................................................. 39
4.2 Review of literature ...................................................................................................... 41
4.2.1 Significance and Challenges of Accounting History Research...................................... 41
4.2.2 An overview of Literature on Accounting in Antiquity ................................................ 43
4.2.3 Research Contribution ................................................................................................. 47
4.2.4 Ancient Ceylon (Sri Lanka): A brief profile ................................................................... 47
4.3 Methodology ................................................................................................................. 49
4.3.1 Introduction ................................................................................................................. 49
4.3.2 Research Method ......................................................................................................... 51
4.3.3 Data-making Process .................................................................................................... 57
4.4 Findings and discussion ................................................................................................. 61
4.4.1 Preliminary Findings ..................................................................................................... 61
4.4.2 Early Accounting Thought and Practices ...................................................................... 68
4.4.2.1 Kingship Accounting in Ancient Ceylon ........................................................... 68
4.4.2.2 Buddhist Temple Accounting in Ancient Ceylon.............................................. 80
4.4.3 Control Environment .................................................................................................... 83
4.4.3.1 Political Environment - Feudalism and the Need for Establishing
Accountability towards Kingship ..................................................................... 84
4.4.3.2 Economic Environment .................................................................................... 85
4.4.3.3 Technological Influences ................................................................................. 89
4.4.4 Sociocultural Influences ............................................................................................... 92
4.5 Conclusion ................................................................................................................... 100
Chapter 5: CEO’s Cultural Values and Firms’ Leverage Decisions ............................................ 102
5.1 Introduction ................................................................................................................ 102
5.2 Overview of Literature ................................................................................................ 106
5.2.1 Equity or Debt? .......................................................................................................... 106
5.2.2 Theories of Capital structure ..................................................................................... 107
5.2.2.1 Modigliani and Miller (M&M) Propositions ................................................... 107
5.2.2.2 The Trade-off Theory of Capital Structure ..................................................... 108
5.2.2.3 The Pecking Order Theory ............................................................................. 115

Table of Contents
xi
5.2.2.4 Market Timing Theory ................................................................................... 118
5.2.3 Determinants of Capital Structure ............................................................................ 118
5.2.3.1 Firm and industry related determinants of capital structure ....................... 118
5.2.3.2 Behavioural Biases and Traits of Managers as Determinants of Capital
Structure ........................................................................................................ 127
5.2.3.3 Observable Managerial Characteristics as Determinants of Capital Structure ...
.................................................................................................................... 129
5.2.3.4 Cultural Background as a Determinant of Capital Structure ......................... 132
5.2.4 Research Contribution ............................................................................................... 133
5.3 Conceptual Framework and Hypothesis Development .............................................. 134
5.3.1 The association of mastery and leverage .................................................................. 135
5.3.2 The association of embeddedness and leverage ...................................................... 137
5.3.3 The portability of mastery and embeddedness to a foreign context ........................ 139
5.4 Sample and Key Variable Construction ...................................................................... 139
5.4.1 Sample Overview ....................................................................................................... 139
5.4.2 Key Variables Construction ........................................................................................ 141
5.5 Empirical Specification and Preliminary Observations ............................................... 143
5.5.1 Model Specification ................................................................................................... 143
5.5.1.1 Quantile Panel Regression with Instrumental Variables ............................... 144
5.5.1.2 Accounting for CEO-Firm Matching Problem and Endogeneity Concerns .... 147
5.5.2 Preliminary Observations .......................................................................................... 148
5.6 Main Empirical Results and Discussion....................................................................... 153
5.6.1 The Association of Mastery and Leverage ................................................................. 153
5.6.2 The Association of Embeddedness and Leverage ..................................................... 159
5.6.3 Other Determinants .................................................................................................. 161
5.7 Robustness Tests ........................................................................................................ 161
5.7.1 Addressing endogeneity concerns ............................................................................ 161
5.7.2 Regressing with alternative debt ratios ..................................................................... 169
5.8 The Effect of the Global Financial Crisis in 2008 ........................................................ 180
5.9 The portability of mastery and embeddedness to a foreign context ......................... 184
5.10 Implications of the Research ...................................................................................... 187
5.11 Conclusion .................................................................................................................. 187
Chapter 6: The Clash of Cultures and Its Effect on Firm Performance Volatility ...................... 191
6.1 Introduction ................................................................................................................ 191
6.2 Literature Review ....................................................................................................... 196
6.2.1 Introduction ............................................................................................................... 196
6.2.2 Board Dynamics ......................................................................................................... 196

Table of Contents
xii
6.2.1.1 Different Perspectives on the Roles of Board of Directors ............................ 196
6.2.1.2 Previous Research on the Effectiveness of Board of Directors on Firm
Outcomes ....................................................................................................... 201
6.2.3 Cultural Distance ........................................................................................................ 219
6.2.3.1 Theoretical Perspectives of Cultural Distance ............................................... 220
6.2.3.2 The Measurement of Cultural Distance ......................................................... 221
6.2.3.3 Criticisms of Cultural Distance Construct ...................................................... 225
6.2.3.4 Cultural Distance – Some Previous Literature – From International Business to
International Finance ..................................................................................... 229
6.2.3.5 Cultural Distances within a Firm .................................................................... 231
6.2.4 Research Contribution ............................................................................................... 232
6.3 Hypothesis Development ............................................................................................ 232
6.3.1 Sphere 1 - Cultural distance between the CEO and board of directors ..................... 233
6.3.2 Sphere 2 - Cultural distance between the CEO and stakeholders ............................. 236
6.3.3 Sphere 3 - Cultural distances among board of directors ........................................... 238
6.4 Data and Variable Construction .................................................................................. 240
6.4.1 Sample Overview ....................................................................................................... 240
6.4.2 Key Variables Construction ........................................................................................ 243
6.5 Methodology ............................................................................................................... 251
6.5.1 Model Specification ................................................................................................... 251
6.5.2 Preliminary Tests ........................................................................................................ 251
6.6 Findings ....................................................................................................................... 263
6.6.1 Preliminary Findings ................................................................................................... 263
6.6.2 Feasible Generalized Least Squares (FGLS) Regressions ............................................ 266
6.6.3 Alternative Dependent Variables ............................................................................... 270
6.6.4 Employing Quantile Panel Regression ....................................................................... 277
6.7 Robustness Tests ......................................................................................................... 281
6.7.1 Addressing Possible Endogeneity Issues .................................................................... 281
6.7.2 Employing alternative cultural frameworks to measure cultural distances .............. 289
6.7.3 Employing an alternative measure of cultural distance ............................................ 292
6.7.4 Within-board Cultural Distances and Other Forms of Boardroom Diversity ............. 294
6.7.5 Diverse opinions versus agency problems within culturally distant boards .............. 299
6.7.6 Addressing Sample Selection Bias .............................................................................. 302
6.8 Implications ................................................................................................................. 306
6.9 Conclusion ................................................................................................................... 307
Chapter 7: Conclusion and Future Research .......................................................................... 310
7.1 Summary of Results .................................................................................................... 310

Table of Contents
xiii
7.2 Future Research .......................................................................................................... 313
Appendices ......................................................................................................................... 315
Appendix A: The List of Inscriptions Referenced (Based on Chronological Order) ........... 315
Appendix B: Chapter 5 - Variable Definition...................................................................... 328
Appendix C: Chapter 6 -Variable Definition ...................................................................... 332
Appendix D: Sample Breakdown of Nationalities and Gender .......................................... 335
Bibliography ........................................................................................................................ 339

List of Tables
xiv
List of Tables
Table 4.1: Coding Categories and Sub-categories used in the Study ......................................................... 60
Table 4.2: Results of the Coding Process ................................................................................................... 67
Table 5.1: Pairwise Correlation Matrix and Variance Inflation Factors ................................................... 149
Table 5.2: Panel Unit Root Tests .............................................................................................................. 151
Table 5.3: Summary Statistics .................................................................................................................. 152
Table 5.4: CEOs’ culture and firm leverage .............................................................................................. 154
Table 5.5: Robustness Tests (Total Sample) -Controlling for socioeconomic development, legal
environment and the quality of financial institutions of CEO’s country of origin ................... 163
Table 5.6: Robustness Tests (Total Sample) -CEO mastery and alternative measures of leverage as the
dependent variable ................................................................................................................. 170
Table 5.7: Robustness Tests (Total Sample) -CEO embeddedness and alternative measures of leverage as
the dependent variable ........................................................................................................... 174
Table 5.8: Difference-in-Difference Test: The Effect of the Global Financial Crisis in 2008 .................... 183
Table 5.9: CEOs’ culture and firm leverage in the sample of non-US CEOs (IV dynamic panel regression
(System GMM and quantile) ................................................................................................... 186
Table 6.1: Sample Constituents ............................................................................................................... 242
Table 6.2: Pairwise Correlations between Distance Variables Calculated Based on alternative Cultural
Frameworks ............................................................................................................................. 245
Table 6.3: Pairwise Correlation Matrix and Variance Inflation Factors among Main Independent Variables
................................................................................................................................................. 252
Table 6.4: Panel Unit Root Tests .............................................................................................................. 257
Table 6.5: Summary Statistics .................................................................................................................. 264
Table 6.6: Cultural Distance Measures and Monthly Return Volatility of Stocks .................................... 266
Table 6.7: Cultural Distance Measures and Quarterly Return Volatility of Stocks................................... 271
Table 6.8: Cultural Distance Measures and Accounting Performance ..................................................... 274
Table 6.9: Cultural Distance Measures and Corporate Value .................................................................. 276
Table 6.10: Cultural Distance Measures and Monthly Return Volatility of Stocks Using Quantile Panel
Regression ............................................................................................................................... 279
Table 6.11: Robustness Tests – Dynamic Panel System GMM Regressions ............................................... 287
Table 6.12: Robustness Tests – Alternative Cultural Frameworks ............................................................. 290
Table 6.13: Robustness Tests –Alternative Cultural Distance Measures ................................................... 293
Table 6.14: Robustness Tests – Within-board Cultural Distances and Other Forms of Boardroom Diversity
................................................................................................................................................. 297
Table 6.15: Robustness Tests – Diverse opinions versus agency problems within culturally distant boards
................................................................................................................................................. 300
Table 6.16: Heckman Two Stage (Maximum Likelihood) ........................................................................... 304

List of Figures
xv
List of Figures
Figure 2.1: A model of Culture .................................................................................................................... 13
Figure 2.2: Economics of Institutions .......................................................................................................... 20
Figure 2.3: The Impact Chain of Culture ...................................................................................................... 23
Figure 2.4: National culture – channels of influence on economic outcomes ............................................ 25
Figure 2.5: The sources of the 100 most influential papers on national culture and finance ..................... 30
Figure 2.6: A Temporal Distribution of the 100 most influential papers on national culture and finance . 31
Figure 2.7: Most frequent keywords by the 100 most influential papers on national culture and finance 32
Figure 2.8: A keyword co-occurrence map on national culture and Finance research – Scopus Database 33
Figure 2.9: A keyword co-occurrence map on national culture and Accounting research – Scopus
Database .................................................................................................................................... 34
Figure 4.1: The Content Analysis Research Process .................................................................................... 57
Figure 4.2: Spatial Distribution of Inscriptions ............................................................................................ 63
Figure 4.3: Distribution of Inscriptions by King ........................................................................................... 64
Figure 4.4: Inscriptions Analyzed by Purpose .............................................................................................. 65
Figure 4.5: Temporal Distribution of Inscriptions ....................................................................................... 66
Figure 4.6: A Framework for the Study on Accounting Practices in Ancient Ceylon and the Control
Environment, with special reference to Sociocultural Factors.................................................. 84
Figure 5.1: Total stock of loans and debt securities issued by non-financial corporations, as a percent of
GDP, in the 10 largest world economies as at 2018 ................................................................ 102
Figure 5.2: Identified Gap in the Existing Empirical Research ................................................................... 134
Figure 5.3a: Conceptual Foundation: The Association between CEO Mastery and the Firm Leverage
Decision – Channels of Influence ............................................................................................ 136
Figure 5.3b: Conceptual Foundation: The Association between CEO Embeddedness and the Firm Leverage
Decision – Channels of Influence ............................................................................................ 138
Figure 5.4: The Effect of Mastery on Firm Leverage at each Quantile ...................................................... 157
Figure 5.5: The Effect of Embeddedness on Firm Leverage at each Quantile ........................................... 159
Figure 5.6: A Graphical Presentation of the Difference in Difference Model ........................................... 181
Figure 6.1: An illustration of the differences in cultural values (e.g. among Spain, U.S.A and China) ...... 192
Figure 6.2 The Role of Board of Directors – Various Theoretical Perspectives ........................................ 201
Figure 6.3: An Illustration of triangle inequality........................................................................................ 223
Figure 6.4: Conceptual Foundation: Cultural Distance between the CEO and Board of Directors and its
Association with Firm Performance Volatility– Channels of Influence ................................... 235
Figure 6.5: Conceptual Foundation: Cultural Distance between the CEO and Firm Stakeholders and its
Association with Firm Performance Volatility– Channels of Influence ................................... 237
Figure 6.6: Conceptual Foundation: Cultural Distance among the Board of Directors and its Association
with Firm Performance Volatility– Channels of Influence ....................................................... 239


Chapter 1: Introduction
1
Chapter 1: Introduction
1.1 Background and motivation
“Culture is like gravity: you do not experience it until you jump six feet into the air!”
(Trompenaars, 1993, p.5).
This thesis is about cultural differences and how they affect various accounting and financial outcomes. Ever
since I left my motherland, Sri Lanka (SL), to pursue my higher education and my accounting career in the UK,
I was fascinated to experience cultural differences among the two countries. Let me start my discussion with
a brief example. Immediately after my bachelor’s graduation, I joined the Credit Team of an international
bank operating in SL. I worked enthusiastically and within just 6 months of joining, I completed a Sri Lankan
Rupees 300 million loan project that had been pending for years. The newly appointed country-manager who
was a foreign national, had just introduced a new performance-related-pay scheme and I was among the first
to be rewarded, in recognition of my achievement. Never would I have thought that this move would cost
the country manager his job in SL. The intense upheaval of the staff union in the SL office, forced the head-
office to transfer the country-manager to a different country. Some years later, I was employed in an
Accounting firm in the UK. Pay-for-performance was a normal practice there. Little did I know the difference
between collectivist vs individualistic1 cultures back then or about the role of cultural differences in managing
and organizing, until I came across the book “Riding the waves of culture” by Fons Trompenaars (1993).
In his book Trompenaars attempts to dispel the notion of “one best way” in managing and organizing,
especially across cultural borders. Some argue that internationalization leads to a common culture
worldwide, and that many products such as McDonald’s and Coca Cola, as examples of tastes / markets and
hence cultures becoming similar everywhere. Yet, one shouldn’t forget that they would involve different
meanings in different cultures. For example, dining at McDonald’s is a fast and an inexpensive meal in London
whereas it is a show of status in Colombo, SL.
What does this imply to the Finance discipline? First, it implies that the “one best way” approach can be a
management fallacy (Trompenaars, 1993, p. 5) and that different countries/ cultures may have different
responses to the same financial issue. For instance, while firms in Anglo Saxon countries, such as the US and
the UK, reach out to stock markets to raise additional capital, in continental Europe (e.g. France, Germany)
and Japan, financial systems are dominated by banks and insurance companies2. Precisely, the ratio of bank
assets to GDP in the US in 1997 is only 53%, which is a mere one-third of the 152% ratio in Germany.
Contrariwise, the ratio of equity market capitalization to GDP in the US is 82%, which is more than three times
1 relates to the integration of individuals into primary groups (Hofstede, 2011) 2 Refer the original paper by Kwok & Tadesse (2006) for more information. The statistics indicated in their paper have been borrowed from Barth, Nolle, and Rice (1997).

Chapter 1: Introduction
2
the German ratio of 24% (Kwok & Tadesse , 2006). Kwok & Tadesse (2006) find that if the market participants
in a particular country are highly sensitive towards uncertainty and low in risk tolerance, such countries are
more likely to have bank-based financial systems, ceteris paribus. This may suggest that the traditional finance
theories we learn in class may not be universal.
Second, it also implies that individuals are not always perfectly rational and that the costs and benefits of a
given alternative would be perceived and weighed differently by different individuals, or in other words,
managers can portray biases when making decisions. Although behavioural finance theorists argue that the
behavioural biases of managers are universal, this thesis illustrates that people of the same culture share
certain behavioural biases among them (Breuer & Quinten, 2009).
Nevertheless, the prior research on the impact of cultural aspects in business, mainly focused on the
nationality of the firm, based on its country of origin (e.g. a sample of US firms against Chinese firms etc.).
However, Chapter 5 and Chapter 6 of this thesis go beyond the previous conventional emphasis on a firms’
nationality (macrocosmic effect), as it would only suffice if both the CEO and the firm originate from the same
national culture. However, given the rise in international migration owing to economic globalisation and the
intense public pressure to increase workplace diversity, this assumption may not always hold true. Therefore,
this study moves beyond the macrocosmic effect to one of microcosmic impact i.e., the impact of the cultural
values of the decision maker. Besides, all corporate decisions are made by individuals. Hambrick & Mason
(1984), introduce an upper echelons perspective that states that “organisational outcomes, both strategies
and effectiveness – are viewed as reflections of the values and cognitive bases of powerful actors in the
organisation” (p.193). The underlying argument here is that top executives matter in shaping organisational
outcomes. Therefore this thesis places special emphasis on managerial traits that are presumed to be
conditioned by their national cultural background, as culture is believed to be the software of the mind
(Hofstede, 1991).
1.2 Research questions and Contributions
“A fish only discovers its need for water when it is no longer in it. Our own culture is like
water to a fish. It sustains us. We live and breathe through it” (Trompenaars, 1993, p.
21).
Culture plays a central role, not only in business outcomes, but also in ensuring human existence and survival.
Although the impact of culture on business has drawn academic attention since recently, this phenomenon
does not seem to be new. Thus, I was inspired to investigate the role of cultural factors in shaping human
beliefs and activities from an ancient context. Hence the first paper (chapter 4) of this thesis investigates the
impact of sociocultural factors in underpinning early accounting thought and practices in ancient Ceylon,
presently Sri Lanka - a tiny island in the South Asia. The next two papers, whilst maintaining cultural aspects
in the limelight, shift the focus to the contemporary times in the Western corporate world.

Chapter 1: Introduction
3
Specifically, the second paper (chapter 5) examines the role of CEO culture in the firm leverage decision in US
firms. Finally, the third paper (chapter 6) explores a larger European market and argues that a multiplicity of
cultures can exist within a single firm, rather than a single culture and analyses their impact on determining
firm idiosyncratic risk. Hence this thesis highlights the impact of culture on various accounting and finance
aspects from a context reigning from antiquity to modern times, in the East and West. Overall, this thesis,
which is made up of three distinct research papers, empirically analyses the role of cultural aspects in
accounting and finance disciplines from diverse perspectives, while attempting to position the same within a
theoretical framework.
Another remarkable feature is that chapters 5 and 6 of this thesis, transcend the previous conventional focus
of firm nationality based on its country of origin and study corporate decision-making at a granular level, i.e.
by examining the cultural values of the key players in the firm (e.g. the CEO, board of directors, stakeholders).
This thesis contributes to the existing literature on the impact of culture in Accounting and Finance outcomes
in general. Each paper has its own unique contributions. Thus a summary of the three research questions,
findings, contributions and their implications are discussed below.
1.2.1 Early Accounting Thought in Ancient Ceylon and the Prominent Role of Sociocultural Environment
This study (chapter 4) focuses on the early accounting thought and practices that existed in ancient Ceylon
(presently Sri Lanka), along with the macro-environmental factors that underpinned the same, with special
reference to sociocultural factors. The chapter has dual objectives:
1. It examines ancient accounting thought and practices, or more precisely, the existence of well-
articulated forms of ‘kingship accounting’ and ‘Buddhist temple accounting’ practices that were
carved in lithic or other inscriptions, thousands of years ago.
2. It focuses on the control environment (i.e. political, economic, technological and sociocultural
factors) that supported or underpinned the early accounting thought and practices, while
placing special emphasis on sociocultural factors that are largely inspired by Buddhism.
The study predominantly employs primary sources, and relies on 122 lithic and other inscriptions that date
back to the period from 1st century A.D. to the 16th century A.D., during the reigns of approximately 32 kings
and over 7 different administrative capitals or kingdoms in ancient Ceylon. Content Analysis is used to study
the inscriptions. Similar to the work of Ezzamel (1997) on ancient Egypt, this study recognises accounting as
a means of counting, measuring and valuing objects (i.e. as a means to quantify or value human activities); to
ascertain modes of reciprocity and as an instrument for adjudicating economic and social claims. Also, the
study explores the role of accounting as a tool in making human performances visible, or in other words, in
accomplishing notions of accountability practices, both relating to the kingship and Buddhist monasteries.
The study reveals dispersed, yet invaluable evidence, regarding the existence of various types of taxes, state
expenditure, two royal treasuries and the accounting profession, which is classified as the notions of kingship
accounting in this study. It identifies that ancient accounting practices have occurred mainly in the kingship,

Chapter 1: Introduction
4
to keep track of king’s wealth. On the other hand, the study also discovers epigraphic evidence relating to
Buddhist monasteries that encompasses explicit instructions on maintaining proper records on inflows and
outflows of resources, calculating the balance of income - left after expenses and retaining them as non-
transferable goods, preparing periodic accounting records and reading out the records loud, in an assembly
of monks and other lay officials. This encapsulates the system of Buddhist temple accounting, in the context
of this research.
Furthermore, the study ascertains abundant epigraphic evidence that illustrates the role of the political,
economic and technological factors (literacy, numerical technology and coinage) in underpinning early
accounting thought, whilst emphasizing the prominent role of sociocultural factors, which were largely
shaped by Buddhist philosophies. Ever since the introduction of Buddhism in Ceylon in the 3rd century B.C.,
the Buddhist ideologies were deeply rooted in the value system of ancient Ceylon. Consequently,
sociocultural dynamics appear to have exerted a dual impact; direct and indirect, on early accounting thought
and practices. The sociocultural factors that compelled accounting practices to be undertaken in ancient
Buddhist monasteries signifies the direct impact, whilst the role of Buddhist cultural values in shaping the
ancient political, technological and economic landscape, which in turn underpinned the early accounting
thought denotes the indirect impact.
This paper makes several distinctive contributions. First, it extends the current literature on accounting
history and practices pertaining to ancient kingdoms and civilizations, to a South Asian context. Despite the
existence of an age-old Indian treatise on Accounting, viz. “Arthasāstra” (circa 300-184 BC) by Kautilya
(Mattessich, 1998), there has been very limited attempt to study ancient accounting practices in the region.
More importantly, the scope of this study differs from the limited prior work carried out from a Sri Lankan
context. The present study operates with a broader focus as it defines accounting practices as a means of
quantifying or valuing human activities, to ascertain modes of reciprocity and as a tool in making human
performances visible. Furthermore, the study adopts a coherent and a holistic research approach to study
ancient accounting practices and highlights the political, economic and technological infrastructure that
underpinned these. Finally and most importantly, the study is unique as it brings to the fore, the influence of
socio-cultural factors that prevailed during the ancient era and to the best of my knowledge, this is the first
study to do so. This research study is significant as according to prior research, history contributes to
contemporary research in policymaking and practice and in standard setting. Studies on history inform us
about how we have reached a consensus on certain issues at present
1.2.2 CEO’s Cultural Values and Firms’ Leverage Decisions
Chapter 5 focuses on cultural implications in a modern corporate setting. It investigates the role of the CEO’s
national cultural values in determining the firm leverage. Precisely, the empirical analysis of this chapter has
several goals:
1. The study examines whether the cultural upbringing of a CEO is an inevitable factor, when analysing
the determinants of a firm’s leverage decision.

Chapter 1: Introduction
5
2. The association between CEO culture and firm leverage is intensively studied to investigate whether
CEO cultural values have a heterogeneous effect on the leverage decision of firms at varying debt
levels, i.e. when existing leverage is low, moderate and high.
3. The study further analyses the financing decisions of highly cultural-biased CEOs, when they are
exposed to a major exogenous intervention to the system, the global financial crisis in 2007/08,
seeking confirmation of a direct link between cultural values and leverage changes.
4. The study applies the epidemiological approach as described by Fernández (2011) and examines a
sub-sample of foreign CEOs to observe whether they reflect their own national culture when making
the leverage decision, although they are employed in US companies, which would imply that cultural
values are portable.
Although the cultural influence on leverage decisions has been examined in some recent studies, the focus
of this body of research has remained on the country of origin-based firm nationality, as opposed to that of
the decision makers. For instance, Li et al. (2011, p.497) in their seminal paper “National culture and capital
structure decisions: evidence from foreign joint ventures in China”, accentuate that “an interesting area for
future research, when more detailed data become available is to examine whether managers’ decision making
reflects their corporate culture or their own national culture”. This inspired my study.
Hence, based on prior research, this paper places emphasis on the CEO as the ultimate decision-making
authority. Therefore, it examines the role of the CEO’s cultural values on the firm leverage decision. Precisely,
this research underlines the interaction between CEO culture and traditional capital structure theories, in
particular the trade-off theory. A model is developed to test the association between national cultural values
of CEOs and debt level of a firm, whilst controlling for well-known firm/ industry related variables and
personal characteristics of CEOs. The results help to capture and distinguish CEO behaviour guided by cultural
values, when all other personal, firm-related and industry dynamics are held constant. Furthermore,
following previous research, Schwartz (2004) cultural dimensions are employed with the two broad
dimensions of cultural values, embeddedness (the opposite of autonomy) and mastery (the opposite of
harmony and egalitarian commitment), to explore the variations between national cultures.
By studying a sample of 594 CEOs, originating from 14 different nationalities, serving 317 Fortune 500 firms
in the United States of America, during 2000 to 2015, the study finds that, ceteris paribus, the cultural values
of CEOs exert a statistically significant impact on a firm’s leverage decision. CEOs with higher mastery and
embeddedness cultural traits increase debt levels, when the existing leverage of a company is low. Debt is
well-known to mitigate manager-shareholder agency conflicts in a firm (Jensen, 1986; Jensen & Meckling,
1976). However, given that the financing decision is in the hands of the manager, why would he/she
voluntarily choose debt discipline? Apparently, the costs and benefits of debt are perceived differently by
CEOs with different cultural biases. For instance, high mastery CEOs value control and would exacerbate

Chapter 1: Introduction
6
agency costs of equity, thereby choosing higher debt that is enabled by the existing low leverage of the firm.
In contrary, at higher existing debt levels, high mastery CEOs, who are concerned about personal success
would exacerbate financial distress costs caused by excessive leverage and would reduce borrowing. This
implies that high mastery CEOs, unknowingly, are in pursuit of a target capital structure, as they trade-off
between their value of control and the need for personal success. On the other hand, highly embedded CEOs
increase borrowing, irrespective of the current level of firm debt, as they are keen on debt monitoring.
Increasing borrowing when current leverage is high, can be risky. However, bearing in mind that the sample
consists of the largest corporations in the US, it can be assumed that these firms have a significant debt
capacity. Conversely, there may be other factors (such as behavioural biases) at play.
Nevertheless, a direct link between cultural values and leverage has been detected and confirmed via an
analysis of a major exogenous intervention (global financial crisis 2007/08) to the system. Further as an
industry shock compels the CEO to make decisions to navigate the firm through a changing industry
environment, the resulting decisions are likely to be unstructured and non-routine and CEO characteristics
play a major role in how CEOs respond, alleviating CEO-firm matching concerns.
Finally, by scrutinizing a sub-sample of non-US CEOs operating in Fortune 500 firms in the US, the study also
concludes that cultural values are portable. Results remain robust to alternative specifications of the
dependent variable and endogeneity concerns caused by both omitted variable bias and simultaneous
causality.
The present study extends the work of Chui et al. (2002) and Li et al. (2011) but distinguishes the same from
previous research, mainly in two ways. First, the study goes beyond the previous conventional emphasis on
a firms’ nationality on the leverage decision (macrocosmic effect), as it would only suffice if both the CEO and
the firm originate from the same national culture. However, this assumption may not always hold true.
Therefore, this study moves beyond the macrocosmic effect to one of microcosmic impact i.e., CEOs’ cultural
values in the leverage decision process. Second, the study also moves one step beyond and examines the
association more closely. The heterogeneous effect of culture on leverage is investigated by categorising the
existing leverage in firms and examining three scenarios, viz. when current leverage is at lowest, highest and
at the median. How would the financing decision be influenced by a non-rational CEO who is guided by their
cultural values, in each scenario? The empirical analysis indicates that firm’s current degree of leverage
significantly matters, when examining the association between CEO culture and firm leverage. It also
contributes to the existing literature on the impact of culture on corporate outcomes and precisely, to the
strand of literature that investigates immigrants and their descendants to identify the effect of culture on
corporate outcomes. The study finally concludes that high mastery CEOs make capital structure decisions that
are more in the interest of shareholders, while the capital structure decisions of highly embedded CEOs can
be detrimental to the firm. Academically the findings of this paper open up new paradigms that need to be
considered in the area of agency conflicts and monitoring costs.

Chapter 1: Introduction
7
1.2.3 The Clash of Cultures and Its Effect on Firm Performance Volatility
Chapter 6 extends the work of the previous chapter and proposes that a firm does not associate with just a
single culture, but operates with a multiplicity of cultures. Hence the study considers not only the CEO culture
but the cultural backgrounds of several key players within an organization, i.e. the CEO, board and
stakeholders. This study brings the differences in values, beliefs, attitudes, and perceptions of key players in
a firm, to the fore and focuses on its impact on the firm idiosyncratic risk. As prior research establishes the
CEO as the most powerful actor in an organization, with the ultimate authority of decision making, the
differences of national cultures are calculated among cultural spheres, such as (i) the CEO and the dominant
culture of the board and (ii) the CEO and stakeholders (proxied by the country in which the head-office of the
firm is located). Owing to the important role played by the board of directors in terms of monitoring, advising
and resource provision, (iii) cultural distances among board of directors is also considered. To operationalize
the relative difference in culture among the key players, the Kogut and Singh (1988) index, a variant of the
Euclidean distance index, is employed with Hofstede’s cultural dimensions (1980). To operationalize the firm
idiosyncratic risk, performance volatility, calculated in terms of stock performance (variability of monthly /
quarterly stock returns), accounting performance (variability of annual accounting return on assets) and
corporate value (variability of annual Tobin’s Q ratio) is employed. The econometric model controls for CEO
characteristics, board attributes and firm / industry characteristics that are well known to affect firm
idiosyncratic risk.
This paper has several research objectives that are stated below:
1. The study investigates whether the cultural differences between the key players within a firm (i.e.
the CEO, board and stakeholders) have an impact on the firm idiosyncratic risk.
2. The association between cultural distances and firm performance volatility is closely observed to
investigate whether cultural distances among the key players have a heterogeneous effect on the
firm risk at varying levels of existing volatility. Put differently, the study categorises the sample firms
as least volatile, most volatile and moderately volatile and examines how cultural distances between
the above players affect performance variability, in each of these three groups.
By scrutinizing a sample of 1,190 firms from 12 European countries, over 14 years from 2005 to 2018, the
study finds that, the CEO - board cultural distance lowers firm performance volatility, assessed in terms of
stock, accounting and market value measures, implying that a greater distance between the CEO and the
board of directors is beneficial to a company as the board will play a more independent and active role in
preventing the management from engaging in value destroying risky ventures and making strategic decisions
single-handedly. Conversely, a greater distance between the CEO and stakeholders increases firm
performance volatility, inferring that the greater cultural distances and the resulting disarray of preferences
of CEOs and stakeholder groups may result with CEOs making unpredictable decisions, ultimately increasing
performance volatility. Stakeholders seem to prefer leaders with greater cultural affinity. McPherson, Smith-

Chapter 1: Introduction
8
Lovin and Cook (2001) support this, in their study on the homophily principle, where they posit that
homophily in race and ethnicity creates the strongest divide among individuals.
Furthermore, considering the possible heterogeneous nature of the in-sample volatility levels, the study
categorises the firms as least volatile, most volatile and moderately volatile. How would the cultural distances
between the CEO, board and stakeholders affect the performance variability, in each of these three groups?
To address this problem, the study employs quantile panel regressions. Whilst the first two cultural spheres
reinforce the previous findings among all three groups, within-board cultural distances appear to reduce
stock performance volatility, in firms with moderate idiosyncratic risks, where the same is amplified in least
volatile and most volatile firms. This implies that the extra social and human capital that would be brought in
to the firm by culturally diverse directors (as per the resource dependence view), would help to position the
firm better in terms of managing risks, only in moderately uncertain environments. Such benefits appear to
add little value and the costs of cultural distances seem to outperform the benefits in least and most volatile
firms. Moreover, the empirical analysis indicates that the degree of existing performance volatility of a firm
significantly matters, when examining the association between cultural distances and firm performance
variability. As this study models the directional heterogeneous effect across firms over the entire distribution
of the performance volatility spectrum, this paper appears to be the first to propose a complete
characterisation of tail behaviour of cultural distance attributes across the entire performance volatility
spectrum.
Moreover, considering the fact that CEO and board characteristics may not be exogenous variables (Hermalin
& Weisbach, 2003), the study develops a dynamic model that controls for reverse causality and, for cultural
distances and risk being influenced by unobservable firm factors. Endogeneity corrected association between
CEO-Board / within-board cultural distances and firm risk, remains negative, but statistically non-significant.
The effect of cultural distance between CEO-stakeholders and performance volatility remains positive and
significant. Results of this sphere remain robust to a battery of tests performed, such as employing an
alternative measure of cultural distance (Standardized Euclidean Index) and using alternative cultural
frameworks (Schwartz, GLOBE). In addition to CEO and stakeholders, CEO – board cultural distances too
reveal a negative and a statistically significant association with firm risk, when alternative cultural distance
measures and cultural frameworks are used.
To examine the reasons behind the statistical non-significance of within-board cultural distances, some
formal tests are conducted. Firstly, the study introduces additional boardroom diversity variables which were
previously excluded from the model, such as director gender and age as ‘variety’ (measured by Blau’s Index)
and director education, tenure and network size as ‘disparity’ (measured by coefficient of variation) as
suggested by Harrison and Klein (2007), as omitting relevant independent variables from the model may
underestimate the strength of the effect of the main regressor. Nevertheless, whilst director gender and
education diversity appear to be statistically significant in lowering firm risk, within-board cultural distances
remain negative but statistically non-significant. On the other hand, CEO power proves to be an important
variable in the relationship between within-board cultural distances and performance volatility. Yet, the

Chapter 1: Introduction
9
econometric model of this study controls for the same. Could this be the reason, for within-board cultural
distances to appear non-significant? Therefore, secondly, to rule out this possibility, the econometric model
is extended by adding an interaction term between surplus cash (to proxy for the degree of agency problems,
as CEO power can be immense for boards that are likely to experience severe free cash problems) and within-
board cultural distance. The results suggest that within-board cultural distances apparently create boardroom
conflicts, which would make the CEO more powerful, thereby aggravating agency problems and ultimately
decreasing volatility, which was not captured before as CEO power was controlled for in the econometric
model.
Despite being a hot topic among practitioner circles, pressure groups and academic communities, this study
unveils a different facet of ‘workplace diversity’. Workplace diversity predominantly considers diversity in
terms of ethnicity (or gender etc.). However diversity and cultural distances are distinct from each other, as
the former would only consider the proportion of minority executives out of the total, while cultural distances
consider how different they can be from each other based on their values, beliefs, attitudes and perceptions.
The focus of the present study rests upon the latter and examines a relatively broader concept. Differences
in values, opinions, perceptions can sometimes be valuable to a firm, as it introduces varied perspectives to
a problem. On the other hand, difference in opinions and views can lead to lack of trust, miscommunications,
misunderstandings, and conflicts. How would this phenomenon affect the firm idiosyncratic risk? This
problem, to the best of my knowledge, has not been researched before and is the focus of the present study.
Moreover, this study directly contributes to the growing literature on cultural effects on corporate outcomes.
Yet, it adopts a novel approach and underlines the existence of a multiplicity of cultures within a single firm.
This phenomenon has been hardly researched. Academically, the findings of this paper open up new
paradigms that need to be considered in corporate recruitment, risk management and investment policies.
1.3 Aims and objectives
This thesis is a comprehensive study on the role of national culture on various accounting and finance issues,
in varying contexts, from antiquity to a contemporary period. Each distinctive paper has its own, more
specific, research objectives, which are stated above. Overall, the objective of this doctoral thesis is to
improve the existing knowledge on the subtle and understated influences of cultural differences and resulting
human behaviour on business outcomes. In doing so, every attempt has been taken to reduce researcher
biases at all phases of the research, as much as possible.
1.4 Structure
Chapter 1 sets the stage by introducing the background, motivation, contributions, aims and objectives.
Chapter 2 reviews prior literature and introduces the concept of national culture and its effect on business
outcomes.
Chapter 3 discusses the philosophical stance adopted by the researcher, in carrying out this thesis.

Chapter 1: Introduction
10
The next three chapters (4, 5 and 6) present the 3 distinctive research papers including the research
questions, their findings, research contributions and implications, preceded by an overview of literature
specifically discussing the theoretical frameworks and prior empirical work carried out with respect to each
research question, which are summarized below.
Chapter 4 explores the early accounting thought and practices in ancient Ceylon and the role of the control
environment in underpinning the same, with special reference to sociocultural factors.
Chapter 5 investigates the role of the CEO’s national cultural values in determining firm leverage.
Chapter 6 examines the impact of cultural differences of key players within a firm in determining firm
idiosyncratic risk.
Chapter 7 concludes and summarizes the contributions and key findings of the thesis and discusses possible
avenues for further research.
1.5 Publications from the Thesis
A paper related to Chapter 4 of this thesis was presented at the following conference:
The British Accounting & Finance Association (BAFA) – Accounting History workshop held on 14th
December 2018, in Aston University Birmingham, UK.
The main findings of chapter 5 are currently in the review stage of the Journal of World Business (ABS4) as:
Chandrasena S.M., Jayasekara R., Mishra T, Uddin G.S., CEO’s Cultural Origin and Firms’ Leverage
Decisions
Significant parts of Chapter 5 were presented at various conferences:
46th Academy of International Business (AIB) - UK & Ireland Chapter Conference, held in April 2019
at the University of Sussex, UK.
o This paper was nominated for the “Best paper Award”.
The INFINITI Conference on International Finance, held in June 2019, at the University of Glasgow,
UK.
Emerging Topics in Financial Economics - Third Symposium at the Division of Economics at the
Linköping University, Sweden, March 2020 - The conference was unfortunately postponed due to
the Covid-19 pandemic.
Preliminary findings of chapter 6 were accepted to be presented at the following conference:
47th Academy of International Business (AIB) - UK & Ireland Chapter Conference, April 2020. - The
conference was unfortunately postponed due to the Covid-19 pandemic.

Chapter 2: Literature Review
11
Chapter 2: Literature Review
2.1 Introduction
This chapter commences with an introduction to culture. The next section focuses on the possible channels
through which culture can influence business outcomes. While some scholars argue that culture influences
the economic behaviour through institutions, others posit that cultural upbringing, may affect the
perceptions, preferences, attitudes and behaviours of individual decision makers and as a result may affect
the utilities of financial choices at individual, firm and national levels. Thus a discussion on the
“epidemiological approach”, which would help to distinguish between the two channels through which
culture exerts its influence is discussed in the next section. The chapter then elaborates on prior research
that investigates the impact of culture on finance and accounting outcomes. The chapter concludes with a
bibliometric analysis that is undertaken to systematically analyse the prior literature on the impact of culture
on the two domains; finance and accounting, and reveals interesting findings.
2.2 The Meaning of Culture
This section presents some definitions of culture, layers or levels at which culture can be operationalised,
followed by a section on how cultural values are formed and evolved. This section concludes with a
description on several frameworks (Hofstede, Schwartz, GLOBE etc.) that are extensively used to measure
cultural variation among nations.
2.2.1 Definitions of Culture
What exactly is meant by culture? Culture is often referred to as a vague and a “fuzzy” term. Geert Hofstede,
a well-renowned researcher in culture, defines culture as:
the “collective programming of mind that distinguishes the members of one group or
category of people from others” (1984, p.82).
Hofstede further elaborates that culture is reflected in the values; for instance, what they consider to be
“good” and “evil”, “safe” and “dangerous” and “beautiful” and “ugly (Hofstede & Minkov, 2010, p.9). These
values are “man-made, confirmed by others, conventionalized and passed on for younger people or
newcomers to learn” (Trompenaars, 1993).
On the other hand, Schwartz has defined the term “culture” more recently, as:
“the rich complex of meanings, beliefs, practices, symbols, norms, and values prevalent
among people in a society” (2006, p.138).
Guiso et al. (2006), in their ground-breaking article “Does Culture Affect Economic Outcomes?” define culture
as:

Chapter 2: Literature Review
12
“those customary beliefs and values that ethnic, religious and social groups transmit fairly
unchanged from generation to generation” (p.23).
All of the above definitions, in fact, emphasize culture as the beliefs and value systems that prevail among a
group of people. However interestingly, Trompenaars (1993) argues that the existence of mutual beliefs or
the shared values of people is not the first thing that comes to our mind, when we think about culture.
Instead, an individual will first experience the “less esoteric” and “more concrete factors” of culture, such as
the language, food, buildings, shrines, art, fashions, markets, houses and so on (p.22). Such factors are
referred to as the explicit culture (Trompenaars, 1993). The author identifies two other layers of culture,
which he refers to as the ‘middle layer’, which contains norms and values and the ‘core’ that is made out of
assumptions about existence. Norms can be formal (written) laws or informal social control and a shared
sense of what is “right” and what is “wrong”, whereas “right and wrong” or “good and bad” are defined by
values. Nevertheless, why would different groups of people, consciously or subconsciously, have different
definitions of right and wrong or good and bad? The answer to this question, deals with the basic assumptions
of different groups of people, regarding the core of human existence. Trompenaars (1993, p.24) explicates
this with an example. He suggests that civilizations have been historically, and are presently, fighting with
nature. For instance, Swiss with mountains and avalanches, Dutch with rising water, Central Americans and
Africans with droughts etc. Nonetheless, these groups have organized themselves to deal with their
environments in the most effective manner, under available resources, so that such persistent problems are
eventually solved automatically. Thus Trompenaars (1993, p.24) posits that a certain culture “is nothing more
than the way in which groups have organized themselves over the years to solve the problems and challenges
presented to them”. This fundamental relationship between the environment and the community, defines
the core meaning of life. This model of culture, proposed by Trompenaars (1993) is depicted in Figure 2.1.

Chapter 2: Literature Review
13
Basic Assumptions
- implicit
Norms and Values
Artefacts and products -
explicit
Figure 2.1: A model of Culture
Source: Trompenaars (1993, p.23)
Finally, Trompenaars (1993, p.5) states that “culture is like gravity: you do not experience it until you jump
six feet into the air”. He explicates that a local manager in a multinational company may not directly object
to a centrally developed performance appraisal system or the implementation of a new organizational
structure (such as a matrix structure), especially if confrontation or disagreement is considered impolite in
the manager’s culture. Instead, in practice, “beneath the surface, the silent forces of culture operate a
destructive process, biting at the roots of centrally developed methods which do not “fit” locally”
(Trompenaars, 1993, p.5).
Thus, in light of the above discussion, culture can be defined as a man-made and conventionalized set of
intrinsic values and beliefs of a society that distinguish members of one group from another and which are
transmitted from one generation to the next and reflected to the outer world via observable symbols, such
as food, language, buildings and so on. Further, despite its obscure nature, failure to identify the effect of
culture, especially in a business context (as in the previous example), may have a detrimental effect on the
ultimate outcome.
2.2.2 Layers of Culture
Almost all previous work on the impact of culture has employed country as the basic unit of analysis. Does it
imply that country and culture are the same? In reality, national boundaries may not always coincide with
culturally homogeneous societies (J. B. E. M. Steenkamp, 2001). In other words, the shared practices in a
society may not be widely and deeply shared among all its members. In his influential piece of research in
2001, Shenkar refers to this concern as the “assumption of spatial homogeneity”. This concern prompts the
birth of the sub domain “intra-cultural variation” that was pioneered by Au (1997, 1999, 2000; Au and

Chapter 2: Literature Review
14
Cheung, 2004). Gelfand along with 44 other authors (2011) introduce the concept of tight - loose cultures,
where tight cultures foster strong norms within a country with low tolerance of deviant behaviour and loose
cultures operate in the opposite way. Intra-cultural variation was subsequently subject to several empirical
works, such as Beugelsdijk et al. (2014); Haj Youssef & Christodoulou(2018); Tung (2008) etc.
In such a situation, how can culture be conceptualized at national level? If some meaningful degree of within-
country commonality and between-country differences in culture exists, a culture can still be validly
conceptualized at the national level (J. B. E. M. Steenkamp, 2001). In fact, Hofstede (1991, p.12) contends
that “nations are the source of a considerable amount of common mental programming of their citizens” due
to analogies in the history, language, legal, political and educational environment, inter alia. This viewpoint
has been maintained by many others, such as Schwartz (1994) and House, Hanges, Javidan, Dorfman, & Gupta
(2004) etc. and empirically supported by a number of prior scholars in the research domain of cultural impact
on business. In fact, Schwartz & Ros (1995) contend that across a sample of thirteen countries, “nation”
accounted for three times more variance in the ratings on the items used to measure national culture than
any within national variable examined, such as gender, education and age and marital status. In addition,
previous studies that have investigated the effect of culture conceptualized at country level have generated
fascinating insights. If significant within country commonality and between-country differences in culture do
not exist, such findings would be hard, if not impossible to achieve.
In addition to the national and intra-national (micro-culture) levels as explained above, culture can be
operationalized via another layer. Steenkamp (2001) identifies a third level of culture, known as the meta-
culture. Meta culture encompasses pan-regional or global level [or supra-national level as referred to by
Beugelsdijk, Kostova, & Roth (2017)]. Nevertheless, it is important to note that these layers are not
necessarily mutually exclusive. The focus of the present study lies with national culture.
2.2.3 Formation, Persistence and Evolution of Culture
According to Giavazzi, Petkov and Schiantarelli (2014), culturally transmitted preferences are determined
early in life. They assert that cultural values and beliefs are formed and nurtured via vertical and horizontal
transmission. Within a family, parents play a major role in shaping the preferences, values and beliefs of their
children. In other words, parents pass on certain traits to their children, with the intention of making it
comfortable for their children to function in the social environment. This is referred to as “vertical
transmission”, which starts from a very tender age of the child. However, when the children are exposed to
the society, they become the subject of social imitation and learning external to the family. This, which may
happen later than the vertical transmission, is referred to as “horizontal transmission”.
Giavazzi, Petkov and Schiantarelli (2014) assert that the above vertical and horizontal transmission of culture
implies that there are two models of cultural transmissions at work, viz. “vertical”, just like the genetic
inheritance, which is more conservative and slow in evolution and “horizontal”, which is relatively faster in
evolution or may even result in a rapid change, if the cultural characteristics are attractive to the receiver.

Chapter 2: Literature Review
15
Nevertheless, the persistence of culture has been subject to incessant debate. Guiso, Sapienza, & Zingales
(2006, 2008, 2016); Hofstede (2001); Schwartz (2004); Schwartz, Bardi, & Bianchi (2000) among others, assert
that cultural value orientations associated with nationality are relatively stable. In fact some researchers such
as Kohn & Schooler (1983) and Putnam (1993) claim that elements of culture persist over hundreds of years.
On the other hand, the researchers representing the opposing school of thought, argue that cultural attitudes
respond to changes in technology, institutions, economic incentives and opportunities and as a result would
rapidly adjust its preferences. For instance Gruber & Hungerman (2008) reveal that when the opportunity
costs of religious participation increase, church attendance and donations drop sharply. Furthermore Alesina
& Fuchs-Schündeln (2007); Di Tella, Galiani, & Schargrodsky (2007); and Giuliano & Spilimbergo (2013) among
others, too support the view that cultural attitudes adopt quickly to environmental changes.
Giavazzi, Petkov and Schiantarelli (2014) present a more holistic view on this phenomenon and assert that
the degree of convergence is heterogeneous among various cultural traits, “culture-specific” and that it
depends on the time since the original immigration of the ancestors. These three aspects are explained
below.
Firstly, they narrate that some attitudes and aspects of culture converge faster than others and detail how
this can be observed for attitudes that have a higher probability of generating a higher transaction gain from
assimilation, such as those “attitudes towards cooperation (such as the trustworthiness, helpfulness and
fairness of others)” (p.6). Attitudes towards sexual morality and abortion and politics and the duties of
government are the slowest to converge followed by religious attitudes, whilst the attitudes towards gender
roles reflect an intermediate pace. Second, Giavazzi, Petkov and Schiantarelli (2014) explicate that cultures
that represent strong family ties and a higher degree of difficulty in learning English indicate a negative
relationship with the rate of convergence. Finally, the authors explain that the degree of convergence is also
positively correlated with the time since the original immigration of the ancestors, so that the attitudes of
immigrants and the second generation immigrants still closely resemble those of their home countries and
would remain different to the prevailing set of norms of the host country (USA in their case). This aspect is
further discussed in section 2.3.4 – Epidemiological approach.
Berry et al. (1989) extended this line of thought and develop a comprehensive model on acculturation. Firstly
they focus on the 2 polar opposites of acculturation responses, i.e. whether a person wants to maintain their
own cultural identity (cultural maintenance) or whether a person wants to embrace the national culture of
the host country (contact and participation). Based on the answers to these 2 questions, they develop 4
strategies of acculturation viz. integration (both maintenance and participation), assimilation (participation
while rejecting one’s own original cultural background), separation (maintenance while rejecting the national
culture of the host country) and marginalization (rejection of both cultures).
On the other hand, Glazer & Moynihan (1963) contribute to this argument by stating that although migrated
ethnic groups undergo change in host cultures, they do not rapidly assimilate to the new culture. Instead the
authors conclude on the prolonged persistence of ethnicity of the migrated groups. This supports the view of

Chapter 2: Literature Review
16
cultural values being deeply rooted and slow-moving. This school of thought is further reinforced by the
recent empirical work carried out by Fernandez & Fogli (2009); Giavazzi et al. (2014) and Nguyen et al. (2018).
2.2.4 Measurement of Culture
Culture, the “fuzzy, difficult to define construct” (Triandis et al., 1986), is even more difficult to measure.
Hofstede (1980, 2001), Schwartz (1992, 1994, 2006), World Values Survey (1981-2014) by Professor Ronald
Inglehart and Global Leadership and Organisational Behaviour Effectiveness (GLOBE) framework (House et
al., 2004) are some of the frameworks that exist in order to explain the variations of culture among nations.
Among these, Hofstede’s monumental work is accepted as the most influential one to date (Karolyi, 2016;
Kirkman et al., 2006; S. H. Schwartz, 1994; Sivakumar & Nakata, 2001). Chapter 6 of this study employs
Hofstede’s cultural framework to operationalize the cross-cultural differences and distances between key
players in an organization, such the CEO, board of directors and stakeholders.
Hofstede’s (1980) research involved a large multinational corporation and was carried out in 2 phases, with
mainly two (2) underlying objectives; “to develop a commonly acceptable, well-defined and empirically based
terminology to describe cultures and to use systematically collected data about a large number of
cultures.”(Hofstede, 1984, p.77). The first phase was conducted between 1967 and 1969 and included all
employees, from unskilled to research scientists. The resulting data consisted of 116,000 questionnaires
across over 40 countries. The survey was repeated during 1971-1973, with the same group of respondents.
Interestingly the study revealed that employee values indicated remarkable and very stable differences
between countries and that these differences were statistically significant. According to Hofstede (1984 p.78),
these values “reflect differences in mental programming and national character”. Subsequently the research
was supplemented by data from ten (10) other countries, some of which were included in three (3) multi-
country regions (i.e. Arab countries and East and West Africa), increasing the number of countries to fifty
(50).
Based on a country-level factor analysis derived via an extremely well-matched subsets from each country’s
population, four (4) different “dimensions” were identified to describe national cultures and these are known
as “individualism vs collectivism”, “large or small power distance”, “strong or weak uncertainty avoidance”
and “masculinity vs femininity”, for which an index value (between 0 and 100) was attributed. Hofstede’s
research identified that the aforementioned fifty (50) cultures differed mainly along these four dimensions.
Later Hofstede & Bond (1988) developed a fifth dimension; “Confucian dynamism” (or “long-term vs short-
term orientation) based on their research in the Far East. Subsequently a new sixth dimension, “indulgence
vs restraint” originally discovered by Minkov (2007) was added (Hofstede et al., 2010), by using data from the
World Values Survey. The six dimensions are briefly described below (Hofstede, 2011):
1. Power Distance – relates to the different solutions to the basic problem of human inequality.
2. Uncertainty Avoidance – relates to the level of stress in a society in the face of an unknown future.
3. Individualism vs collectivism – relates to the integration of individuals into primary groups.
4. Masculinity vs femininity – relates to the division of emotional roles between women and men.

Chapter 2: Literature Review
17
5. Long-term vs short-term orientation – relates to the choice of focus for people’s efforts: the future
or the present and past.
6. Indulgence vs restraint – relates to the gratification vs control of basic human desires related to
enjoying life.
Although Hofstede’s instrumental work has the greatest influence on subsequent research, when compared
to other cross-cultural frameworks, it has also been the subject of considerable debate (Sivakumar & Nakata,
2001). For instance, some researchers contend that culture cannot be quantified, let alone summarised into
six dimensions. Further many critics oppose the use of one large multi-national corporation to conduct the
study. Finally, some theorists believe that culture is malleable and that it is also heterogeneous within a given
country (Sivakumar & Nakata, 2001).
Furthermore, Schwartz, among few others, presented six conceptual and methodological issues in deriving
Hofstede’s culture level dimensions. Schwartz points out that the initial four dimensions may not necessarily
be exhaustive and expresses his concern over the fact that the research is restricted to only forty nations. He
points out that the inclusion of different samples of nations may result in different cultural dimensions, unless
Hofstede’s original sample is representative of the full heterogeneity of cultures that prevail in the world
(Schwartz, 1994). These two limitations have been noted by Hofstede himself. In addition, the likelihood of
the dataset being outdated, value measures not having cross-culturally equivalent meanings at the individual
and culture-level, the possibility of the value items being unequal in meaning across cultures are also criticized
by Schwartz (1994). Similar methodological weaknesses are identified by (Steenkamp, 2001; McSweeney,
2002; Ng, Lee and Soutar, 2007; Ailon, 2008).
Henceforth by studying 87 samples (comprising 38 school teachers, 35 university students, 12 general adults
samples and 2 adolescents samples) that were drawn from an initial sample of 41 cultural groups in 38
nations, during the period 1988-1994, Schwartz arrives at two culture-level dimensions, that are broadly
defined, consisting of opposing values as (1) Autonomy vs Conservatism (later known as embeddedness) and
(2) Hierarchy and Mastery vs Egalitarian Commitment and Harmony with nature. Chapter 5 of this thesis
employs Schwartz’s cultural dimensions to measure cross-cultural differences and employs the two
aforementioned opposing values, embeddedness and mastery.
Schwartz identified three basic problems that all societies encounter in regulating human activity in order to
survive. These problems are: (1) “defining the boundaries between the person and the group and the optimal
relations between them”; (2) “ensuring coordination among people to produce goods and services in ways
that preserve the social fabric”; (3) “regulating the utilization of human and natural resources” (Schwartz,
2008 p.10). Based on the societal values that underlie the alternative societal responses to these questions a
set of dimensions may be used to compare cultures. These dimensions are described below:

Chapter 2: Literature Review
18
1. Autonomy Vs. Embeddedness
This associates with the first basic societal problem explained above and poses the question “to what extent
should people be treated as autonomous vs embedded in their groups?” Cultures high in autonomy
encourage their people to express their own views, preferences and ideas and find meaning in their own
uniqueness. Autonomy is twofold; intellectual autonomy that supports individuals to pursue their own
intellectual directions independently and affective autonomy that incites affectively positive personal
experiences. On the other hand, cultures high in embeddedness “treat people as entities embedded in the
collectivity”. These individuals respect in-group social relationships participate in its shared way of life and
strive towards its shared goals. Values such as maintaining status quo and restraining actions that might
disrupt in-group solidarity or the traditional order are held important.
2. Egalitarianism vs Hierarchy
The aforementioned second basic societal difficulty translates into the question “how can human
interdependencies be managed in a way that elicits coordinated, productive activity rather than disruptive
behaviour or withholding of effort?” (Schwartz, 2008, p.11). Highly egalitarian cultures are of the belief that
people should recognize one another as moral equals who share basic interests of human beings. On the
contrary, hierarchical cultures prefer hierarchical systems of assigned roles to assure responsible and
productive behaviour. Hierarchical societies foster unequal distribution of power, roles and resources.
3. Harmony vs Mastery
The third and final basic societal problem above translates into the question “to what extent should
individuals and groups control and change their social and natural environment vs. leaving it undisturbed and
unchanged?” (Schwartz, 2008, p.11). Cultures high in harmony accept, preserve and appreciate the way
things are and avoid change and conflict in the social and natural world. In contrast high mastery cultures
stimulate active self-assertion by individuals in order to direct, master and change the social and natural
environment, in order to attain personal or group goals.
A particular country (if included in Schwartz’s research) is given a score (between -1 to +7) for the seven
cultural dimensions described above (Schwartz, 2008). As at 2008, Schwartz’s research included scores for
80 countries that have been derived by using data, collected over the period 1988-2007.
An alternative framework to measure cross-cultural differences is the Global Leadership and Organizational
Behaviour Effectiveness (GLOBE) study that was conceived by Robert J. House in 1991. This was a major study
that involved a total of approximately 17,000 middle managers from 951 organisations in three industries, in
sixty two national cultures over at least three phases. This framework developed nine cultural dimensions,
where each one is conceptualized in two ways; practices (or “as is”) and values (or “should be”) (Grove, 2005).
These nine cultural dimensions, as defined by Grove (2005, p.3-10) are described in brief below:
1. Performance Orientation – the degree to which a community encourages, appreciates and rewards
high standards, innovation and performance improvement”.

Chapter 2: Literature Review
19
2. Uncertainty avoidance – to what extent a society, organization, or group depends on social norms,
rules, and procedures to minimize the unpredictability of future events.
3. In group collectivism - to what extent individuals convey pride, loyalty, and cohesiveness in their
families or organizations.
4. Power distance – to what extent a community accepts and favours authority, power differences, and
status privileges.
5. Gender egalitarianism - to what extent gender inequality is minimized in a society.
6. Humane orientation – to what extent the society or an organisation encourages, appreciates and
rewards individuals for being fair, friendly, generous, altruistic, caring, and kind to other.
7. Institutional collectivism - to what extent the collective distribution of resources and collective
action are encouraged, appreciated and rewarded in an organizational and/or societal setting.
8. Future orientation - to what extent a collectivity encourages, appreciates and rewards future-
oriented actions such as planning and delaying gratification.
9. Assertiveness - the extent to which an individual is assertive, confrontational, and aggressive in
his/her relationships with others.
In addition to that of Hofstede, chapter 6 in this thesis, employs the Schwartz and GLOBE frameworks, to
operationalize cross-cultural distances for improved robustness.
Alternative frameworks, such as the Trompenaars (1993) and the World Values Survey (WVS) founded by two
scholars at the Tilburg University in 1981, also exist in order to measure cross-cultural disparities. The WVS
has already had six waves of surveys since 1981 involving nearly one hundred countries3. However almost all
of these cultural frameworks are subject to common criticisms such as culture being assumed as equivalent
to country, possible heterogeneity of culture within a given country, malleability of culture over the years,
over-simplification of the concept of culture and the representativeness of the sample. The more recently
developed dimensions, such as the GLOBE framework and the WVS have adopted various measures, such as
emphasizing on societal clusters rather than nations (as in GLOBE) and by repeatedly collecting data through
several waves (as in WVS) in order to address some of these issues.
2.3 How Does Culture Influence Business?
The Nobel Prize Laureate, Oliver E. Williamson developed the widely cited and well-grounded model of social
analysis, known as the economic institutions model, in 2000. As indicated in figure 2.2, the model has four
levels, and the solid arrows represent the constraints that are imposed by the higher level on the level
immediately below. The dashed arrows to the opposite side that connect the lower level with the higher,
symbolize the loops of feedback.
3 WVS seventh wave (from 2017-2021) is currently underway.

Chapter 2: Literature Review
20
Figure 2.2: Economics of Institutions
Source: Williamson (2000, p. 597)
Level 1 is the social embeddedness level that demonstrates the prevailing norms, customs, religion, mores
and traditions of a society. They characterize an informal set of rules and is usually taken as given by
economists. Further, it is emphasized that institutions at this level change very slowly “on the order of
centuries or millennia” (Williamson, 2000 p.596). This narration closely exemplifies the characteristics of
culture (Breuer & Quinten, 2009; Nadler & Breuer, 2019).
On the other hand Level 2 of the above model depicts the institutional environment and, according to
Williamson (2000), the structures operating in this level are partially a product of evolutionary processes.
Level 2 symbolizes formal rules that are enforced by constitutions, laws and property rights. Jensen &
Meckling (1976) define property rights as the rights which are possessed by human beings. Nevertheless, in
Frequency
Level (years) Purpose
Embeddedness:
informal often noncalculative;
institutions, spontaneous
customs, (caveat: see discussion
traditions, norms in the original paper)
religion
Institutional
environment: Get the
formal rules of institutional
L2 the game - esp. 10 to 102 environment right.
property (polity, 1st order
judiciary, economizing.
bureaucracy)
Governance:
play of the game Get the
- esp. contract governance
aligning governance structures right.
structures with 2nd order
transactions) economizing
Resource Get the
allocation and marginal
L4 employment continuous conditions right.
(prices and quantities; 3rd order
incentive alignment) economizing
L1: social theory
L2: economics of property rights/ positive political theory
L3: transaction cost economics
L4: neoclassical economics / agency theory
L1
L3
102 to 103
1 to 10

Chapter 2: Literature Review
21
very broad terms, the design instruments at this level consist of the executive, legislative, judicial,
bureaucratic functions of the government and the distribution of power across diverse levels of government.
Cumulative change of a progressive kind in this level is extremely difficult to be instigated apart from
occasional collapses that may arise due to massive discontent (civil wars), breakdowns, as in the case of
Eastern Europe and the former Soviet Union, military coup or a financial crisis.
A salient feature to note at this point is the role played by “norms, customs, religion, mores and traditions of
a society” that closely resemble the elements of culture, on moulding the formal rules, namely “constitutions,
laws and property rights” of a country.
Nevertheless, Level 3 signifies the institutions of governance and is called the “play of the game” where “rules
of the game” is depicted in Level 2. The focus of analysis in this level is the governance of contractual relations,
which is an effort to create order which would alleviate conflict and realise mutual gains. Ultimately such
contractual agreements would result in specific incentive alignments for the individual behaviour, depicted
in Level 4.
What does this imply for my research? In a nutshell, this model implies that culture influences the economic
behaviour through institutions! Culture is exhibited in the formal institutions of a society, such as a specific
financial system, which ultimately affects the economic behaviour (Breuer & Quinten, 2009). In fact, North
(1990) holds the same view, when he proclaims that, informal constraints, which originate from culture, exert
a pervasive influence on the economic character of a country in the long run.
2.3.1 Cultural Influence via National Institutions
A prime example of culture’s influence on formal rules is presented by Stulz & Williamson (2003) borrowed
from the book “English Law and French Law” by R. David (1980). According to the author, French Law and the
English Law have differing approaches to the law of contract. The French law of contract is heavily influenced
by the principle of morality emphasized by the Canon Law4, which stresses that “it is a sin for a person not to
fulfil his promises”. However in contrary, the English law views a contract between two parties from a
different perspective, and would assure that “the promisee, who has furnished consideration for the promise,
should not suffer any damage as a consequence of the breach”, irrespective of whether the promise was
enforced or not (Stulz & Williamson, 2003 p.319).
An alternative scenario of culture’s influence on economic behaviour through institutions is supported below.
It is well known that economic growth largely depends on factors such as the development of capital markets
and firms’ ability to access external finance, among many others. Such factors are significantly influenced by
the degree to which investors are protected from expropriation by the government, managers or controlling
shareholders. In the awakening of globalization, the competition for investments is not only more intense but
4 Ecclesiastical law, especially in the Roman Catholic Church that is laid down by papal pronouncements.
Chapter 2: Literature Review
22
also global. Hence countries with poor protection of investor rights tend to lose out to other countries with
better investor protection.
The key question here is “why does investor protection differ among countries?” In their influential work,
Stulz & Williamson (2003) proclaim that the culture of a country, proxied by its principal religion explains the
cross-sectional variation of creditor rights, more than the country’s natural openness to international trade,
language, per capita income or the legal origin. They further affirm that Protestant countries foster better
creditor protection than Catholic countries, by empirically testing a large sample of countries including
Australia and forty eight other countries from, Asia, Europe, Africa, North America and South America.
However, openness to trade mitigates the influence of religion on creditor rights, thus Catholic countries,
where the international trade sector is significant, are deemed to have better protection of creditor rights.
2.3.2 Cultural Influence via Beliefs and Values of Individual Agents
Nevertheless, the above justification provides evidence that culture affects economic behaviour, by
influencing national institutions. However, this is not the only channel through which culture can affect
economic behaviour. Cultural factors, possessing their own intrinsic beliefs and values, can affect the
perceptions, preferences, attitudes and behaviours of individual decision makers and as a result may affect
the utilities of financial choices at individual, firm and national levels (Aggarwal et al., 2016).
On the other hand, financial decision making primarily involves choosing between several alternatives. These
alternatives inevitably entail trade-offs. Different cultures, which are an arrangement of diverse customary
beliefs, values and preferences, would give different weightings to the benefits and costs presented by each
alternative. Thus, individuals from different cultural backgrounds would demonstrate different choices
among alternatives.
For instance, financial managers can employ two alternative means of financing the operations and growth
of the firm, i.e. through debt and/or equity. Debt financing brings about several benefits such as the tax
deductibility of interest payments, retention of ownership and control and sending positive debt signals
about the financial health of the firm. However, debt finance is also packaged with the deadweight cost of
bankruptcy. On the other hand, equity finance does not obligate the firm to repay its fund providers and does
not pose bankruptcy risks. However, dilution of control and negative debt signalling are part and parcel of
equity funding. According to Li, Griffin, Yue, & Zhao (2011), cultural values would affect the way an individual
perceives and weighs the benefits and costs associated with both debt and equity financing and hence would
affect the capital structure decision.
Last but not least, if the definitions of culture, indicated in section 2.2.1 are revisited, it could be observed
that “values” are an integral part of a certain culture. Values are defined in the Oxford Dictionary as “the
principles or standards of behaviour or one’s judgement of what is important in life”. Thus, different cultures
can be distinguished based on their respective value systems. However as values are abstract and general,
they occupy the so-called “concept” level of culture that involves “the empirically non-observable mental
processes” (Breuer & Quinten, 2009, p.3). Non-observable values become visible through specific behaviours.

Chapter 2: Literature Review
23
Extending the previous example of capital structure choice, the perception and weighting of the costs and
benefits associated with debt vs equity financing is a mental process that takes place in the financial
manager’s mind. However, this non-observable cognitive process becomes observable through his or her
action of issuing more debt or equity. This remains the focus of Chapter 5, of this thesis.
Breuer & Quinten (2009) have developed a hierarchical impact chain, with the intention of ranking the
interaction of these forces within a cultural framework that is depicted in figure 2.3.
Figure 2.3: The Impact Chain of Culture
Culture
Values
Attitudes
Behaviour
Source: Breuer & Quinten (2009, p.26)
Figure 2.3 illustrates that values are the cultural core, which in turn determines attitudes that would
ultimately guide the behaviour. Values are different to attitudes as values are more abstract and general than
attitudes. In this essence, the same value can be applied in different situations, whereas attitudes are related
to specific situations. Values, so closely held by an individual, would determine his or her attitudes in a certain
situation and would be noticeable through his/her behaviour and can be captured empirically.
2.3.3 The Impact of Culture Examined at Individual, Firm and National Levels
Out of the above two channels of influence of culture, many previous works have captured the latter. For
example, Guiso et al., (2008) explored whether trust can be used as a tool that explains the difference in stock

Chapter 2: Literature Review
24
market participation across individuals and countries. They define trust as “the subjective probability,
individuals attribute to the possibility of being cheated” (p.2557) and further explain that the subjective
probability can be based on both objective characteristics of the financial system, such as the quality of
investor protection and laws, and its enforcement and the subjective characteristics of the person trusting.
According to the authors, trust, more or less, varies with educational background, religious upbringing and
so forth.
The study further explains that trust as an explanator, plays a major role when potential investors are
unfamiliar with the stock market and has no information about it. However, a salient finding is that, this effect
still doesn’t diminish even when they are familiar with the stock market. Thus by employing Dutch and Italian
households, Guiso et al., (2008) affirm that difference in levels of trust, across individuals and countries, does
explain why some individuals invest in stock more than the others.
Similarly Guiso, Sapienza, & Zingales (2013) find that strategic defaults of mortgage5 increases with wealth,
albeit at a decreasing rate, and further finds evidence that this relationship is driven by both pecuniary and
nonpecuniary factors such as the views of individuals about fairness and morality. People who believe it is
immoral to default are less willing to default on their mortgages.
Last but not least, along similar lines, Grinblatt & Keloharju (2001) studied ninety seven (97) Finnish firms and
documents that investors prefer to hold, buy or sell the stocks of firms if the firm is located in close proximity
to the investor, shares the same language as the investor’s native tongue and if the CEO of the firm is from
the same cultural background.
Studies by Grinblatt & Keloharju(2001) and Guiso et al. (2008, 2013), explained above, investigate the effect
of national culture on financial decision making at individual level, which is also the focus of this thesis.
However, as indicated above, the national culture can also affect financial decisions at firm and national levels
(Aggarwal et al., 2016).
For instance, the work of Giannetti & Yafeh (2012) evinces the effect of national culture on financial decisions
at firm level. They highlight that a higher cultural distance between contracting parties would lead to
increased tensions during negotiations, leading to higher contracting costs which would ultimately result in
small loans at higher interest rate. In addition, Ahern, Daminelli, & Fracassi (2015) reveal that a higher cultural
distance, in terms of varying levels of trust, hierarchy and individualism leads to an increase in post-merger
integration costs that results in a low volume of cross border mergers and combined announcement returns.
On the other hand, Kwok & Tadesse (2006) provide strong evidence for the impact of culture at a national
level. After controlling for variables such as legal environment, the level of economic and institutional
5 Strategic default of mortgages is explained as the phenomenon where homeowners choose to walk away from their houses, when their home equity is negative, even if they can afford to pay their mortgages. Negative home equity occurs when the value of the property falls below the outstanding balance of the mortgage used to purchase that property (Guiso, Sapienza, & Zingales, 2013).

Chapter 2: Literature Review
25
development, macro-economic conditions and political conditions, they affirm that the cross-country
differences in terms of their configuration of financial systems, can be explained to a large extent by the
national cultural differences. For instance, in Anglo Saxon countries, such as the US and UK, the financial
system is dominated by stock markets, whereas in Japan and continental Europe, bank-based systems
dominate the financial system. The authors conjecture that such variations can be explained to a greater
extent by the differences of sensitivity towards the risk and uncertainty of investors. As bank based systems
foster superior risk-reduction capabilities in smoothing intertemporal risk, they may be preferred by countries
that have a strong uncertainty avoidant culture. Contrarily, market based systems will be preferred by
countries that are more risk-tolerant, with the expectation of receiving a higher future return. Aggarwal &
Goodell (2009) arrive at similar conclusions in their study of national preferences for financial intermediation.
In summary, culture affects the economic and therefore financial outcomes via two channels; viz. indirectly,
through its influence on institutions, and directly, by operating as a mental framework that governs the
perceptions and preferences of individuals, thereby altering an individual’s behaviour. Moreover, its impact
on economic outcomes can be captured at individual, firm and national levels. This relationship is illustrated
in figure 2.4
Figure 2.4: National culture – channels of influence on economic outcomes
2.3.4 Epidemiological Approach
The above figure portrays the alternative channels through which culture can impact on corporate outcomes.
Nevertheless, how can the two channels be distinguished from one another? One way to tackle this, is by
utilizing the difference in the “portability” of culture, relative to economic and institutional conditions
(Fernández & Fogli, 2009). This is described as the “epidemiological approach” by Fernández (2011). When
individuals emigrate, they carry with them some aspects of their culture and transmit them inter-
generationally, whilst living in the economic and formal institutional environment of the host country. This is
the central premise of the epidemiological approach which attempts to identify “the effect of culture through
National
culture
Economic outcomes
Individual level
Firm level
National level
via national institutions
altering individual behaviour via beliefs and values of individual agents
dir
ect
im
pa
ct
ind
ire
ct
imp
act

Chapter 2: Literature Review
26
the variation in economic outcomes of individuals who share the same economic and institutional
environment, but whose social beliefs are potentially different” (p.11). Thus focusing on immigrants or their
descendants helps to isolate some aspects of culture (Fernández & Fogli, 2009). A substantial amount of
recent research that generate persuasive evidence on culture’s impact on economic outcomes has resulted
from the epidemiological approach (Fernández, 2011).
As stated above, the epidemiological approach mostly focuses on immigrants or their descendants. Guiso,
Sapienza, & Zingales (2004) narrates how, for instance, the immigrants from southern, low-trust regions in
Italy tend to carry their mistrust with them to their new locations. Similarly studies such as Antecol, (2000);
Blau (1992); Carroll, Rhee, & Rhee, (1994) employ immigrants to explore the portability. On the other hand,
in a non-corporate setting, Fisman & Miguel (2007) focus on United Nations diplomats and infer that
diplomats representing high corruption countries accumulate more unpaid parking violations in Manhattan.
Miguel, Saiegh, & Satyanath (2011) studied international soccer players in the European professional leagues
and conclude that a player from a country with a history of civil conflict has a higher propensity of behaving
violently on the field, measured by yellow/red cards. The subjects of all these studies are first-generation
immigrants or foreigners.
Nevertheless to explore the same phenomenon of cultural portability, another set of researchers (Fernández
& Fogli, 2009; Giuliano, 2007; Liu, 2016; Nguyen et al., 2018; Pan et al., 2017) have employed descendants of
immigrants. According to Fernández (2011), studying outcomes for first-generation immigrants as opposed
to their descendants, would involve confounding difficulties such as the inability of first-generation
immigrants to speak the host country language and the prevalence of ties with non-immigrating family
members. In contrary, Fernández and Fogli, (2009) argue that the strength of cultural effects on economic
outcomes may be diluted when studied through the descendants of immigrants, due to acculturation of
migrant groups (see section 2.2.3 for a full discussion). Chapters 5 and 6 of this study examine the cultural
values of CEOs, board of directors and stakeholders and employ an epidemiological approach to understand
the effect of national culture on finance. To prevent the dilution of culture, only the first-generation
immigrants that are currently operating in the USA (chapter 5) and in Europe (chapter 6) are considered, in
this study.
2.3.5 The Impact of Culture on Business and Naissance of Cultural Finance
The impact of culture has been explored on various business practices and remained in the limelight for a
considerable period of time. For instance the impact of national culture has been explored on management
and leadership (House et al., 2004; Licht, 2001; Newman & Nollen, 1996), on organizational design (Harrison,
McKinnon, Panchapakesan, & Leung, 1994; Hofstede, Neuijen, Ohayv, & Sanders, 1990), on compensation
practices (Bryan, Nash, & Patel, 2015; Schuler & Rogovsky, 1998; Tosi & Greckhamer, 2004), marketing and
consumer behaviour (Aaker & Williams, 1998; Jain, 1989; Merrilees, McKenzie, & Miller, 2007; Mitra &
Golder, 2002; Nakata & Sivakumar, 1996; Ryans & Donnelly, 1969; Tse, Lee, Vertinsky, & Wehrung, 1988).
Furthermore the effect of culture on economic development and entrepreneurship (Guiso, Sapienza, &
Zingales, 2006; Tabellini, 2010; Wennekers, Thurik, Van Stel, & Noorderhaven, 2007) and production

Chapter 2: Literature Review
27
decisions (Flynn & Saladin, 2006; Halkos & Tzeremes, 2011; Naor, Linderman, & Schroeder, 2010; Ribbink &
Grimm, 2014) have also been investigated.
Nevertheless the impact of culture on financial outcomes has only received academic attention recently
(Aggarwal et al., 2016; Karolyi, 2016). Previous research on the influence of culture, on capital structure
decisions (Chui et al., 2002; K. Li et al., 2011; Sekely & Collins, 1988; Stonehill & Stitzel, 1969), financing
environment (Breuer & Salzmann, 2012; Kwok & Tadesse, 2006; Malul & Shoham, 2008; Stulz & Williamson,
2003), cash holding and financial planning (Bae et al., 2012; K. Chang & Noorbakhsh, 2009; Desender et al.,
2011; Fidrmuc & Jacob, 2010; Ramírez & Tadesse, 2009; Shao et al., 2013), cross-border acquisition
performance (Chakrabarti et al., 2009; Morosini et al., 1998; Y. Weber et al., 1996), contracting arrangements
(Giannetti & Yafeh, 2012), national stock market characteristics (de Jong & Semenov, 2006; Guiso et al., 2008;
Pirouz, 2012), international asset allocation (Aggarwal et al., 2012; Beugelsdijk & Frijns, 2010; Chui, A.C.W.,
Titman, S., Wei, 2010; Griffin et al., 2003; Grinblatt & Keloharju, 2001; Siegel et al., 2011), asset management
(Beckmann et al., 2008) and insurance (Chui & Kwok, 2008), have largely contributed towards developing
this strand of literature.
These studies on cultural impact on financial decisions has given birth to the novel research domain “cultural
finance”. Nadler & Breuer (2019) defines cultural finance as a “rather young and less known research field”
that attempts to explain financial behaviour by cultural values. Classical finance mysteries, such as the “capital
structure puzzle”, “ dividend puzzle” or even the “equity home bias puzzle” may be rearticulated and
readdressed along the lines of cultural finance.
Cultural Finance and Behavioural Finance
The domain of behavioural finance is already quite popular and well established among finance researchers.
Various parallels can be drawn between cultural finance and behavioural finance, but the analogy is mainly
in terms of their underlying tenet, that strictly rejects the neoclassical “economic man” which serves as the
foundation for most of classical finance theories. Primarily both research fields uphold the principles of
“bounded rationality” pioneered by the Nobel Laureate Herbert A. Simon, which explains that when an
individual is making a decision, his/her rationality is bounded by “human cognitive constraints, such as
limited computational ability and selective memory and perception” (Kaufman, 1999 p.135).
However, the similarity ends there. Behavioural finance assumes the behavioural biases of managers to be
universal whereas cultural finance postulates the divergent behavioural patterns and irrationalities between
countries (Breuer & Quinten, 2009). This implies that people of the same culture will share certain
behavioural biases among them. For instance recent studies have explored how well-known behavioural
biases such as loss aversion (Fan & Xiao, 2006; Ji et al., 2008), overconfidence, optimism, self-attribution
(Antonczyk & Salzmann, 2014; Chui, A.C.W., Titman, S., Wei, 2010),framing (Levinson & Peng, 2007) and
herding behaviour (C. H. Chang & Lin, 2015) etc. are shown to be comparatively higher among certain
cultures.

Chapter 2: Literature Review
28
The influence of culture is not restricted to business and finance. Prior research shows that national culture
exerts its influence also on accounting practices, and the next sub-section discusses the impact of culture on
accounting in more detail.
2.3.6 The Impact of Culture on Accounting Practices
The impact of culture on varying areas and issues of accounting has been validated by prior research and
some of them are discussed below.
Gray (1988) postulates some important hypotheses relating to building a theory of cultural impact on the
development of accounting systems. He identifies four accounting value dimensions, which are
‘professionalism versus statutory control’, ‘uniformity vs flexibility’, ‘conservatism vs optimism’, and ‘secrecy
vs transparency’, and investigates the impact of cultural dimensions, proposed by Hofstede (1980, 1983), on
the aforesaid accounting values. He hypothesizes that the accounting system of a particular country will be
considered as high in uniformity, conservatism, and secrecy, if that particular country is ranked low in
individualism. However, if the individualism score is high in a given country, the degree of professionalism in
the accounting system too is considered to be high. On the other hand, the higher a country ranks in terms
of uncertainty avoidance, then it is more likely to be ranked high in terms of uniformity, conservatism, and
secrecy but low in professionalism.
By studying 159 Taiwanese managers, working in 18 Japanese, Taiwanese and US firms, operating in Taiwan,
Chow et al., (1999) conclude that national culture significantly affects firms’ design of and employees’
preference for management controls.
On the other hand Desender et al. (2011) analyzed a large sample consisting of 8,616 non-financial firms,
during 1990-1999, across 31 countries and posit that countries high in individualism (as per Hofsetede’s
framework) and egalitarianism (as per Schwartz’s framework) have lower levels of corporate earnings
management practices. Doupnik (2008) too examines the effect of national cuture on earnings management
in general, but two different types of earnings management in particular, which are earnings smoothing and
earnings discretion. The author finds that, even after controlling for investor protection and other legal
institutional factors, Hofstede’s cultural dimensions of uncertanty avoidance and individualism significantly
affect earnings management.
Last but not least, Frucot & Shearon (1991) portray that cultural differences may result in different responses
for participative budgeting, by studying the responses of 83 managers working in 21 different companies in
Mexico city.
Chapter 4 of this thesis investigates the impact of culture on accounting practices. However, the focus of this
chapter is somewhat different, as it looks at the early accounting thought and practices in an ancient
civilization. The study investigates how the sociocultural environment that was largely inspired by Buddhism,
exerted a dual impact (direct and indirect) in underpinning early accounting practices. Direct impact entails
the underlying reasons for the adoption of accounting practices in Buddhist monasteries. Indirect impact is

Chapter 2: Literature Review
29
the sociocultural influence exerted on the political, economic and technological (literacy, numerical
technology and so on) landscape in the ancient civilization, which in turn stimulated the ancient accounting
practices. Prior literature, exclusively examining accounting practices in archaic economies are discussed in
Chapter 4, while the present chapter intends to provide an overview of the cultural impact on business,
finance and accounting areas, in general.
The rest of the section underlines a bibliometric perspective on prior research pertaining to national culture
that have been conducted in the domains of accounting and finance.
2.4 Research in National Culture, Finance and Accounting: A Bibliometric
Perspective
This section examines the research landscape on the impact of national culture on accounting and finance
fields in particular, based on a bibliometric perspective. The steps that have been involved in developing a
structured framework for presenting a comprehensive literature survey on the cultural impact on Finance
and Accounting research domains are discussed below.
2.4.1 Culture and Finance: A Bibliometric Perspective on the Research Domain
The relevant literature was searched in Google Scholar 6 initially, using “Publish or Perish” 7 computer
software, which can search and retrieve academic literature and analyse academic citations. Keywords such
as “culture”, “national culture” and “finance” were searched. The search was restricted to cover only journal
articles that were published from 1990 onwards. Moreover Figure 2.5 illustrates the sources of the 52 most
influential articles. The remaining 48 articles have been published in 48 different journals and thus are
omitted from the visualization below, for brevity.
6 https://scholar.google.com/ 7 Harzing, A.W. (2007) Publish or Perish, available from https://harzing.com/resources/publish-or-perish

Chapter 2: Literature Review
30
Figure 2.5: The sources of the 100 most influential papers on national culture and finance
The above illustration indicates that the most influential papers have predominantly been published in the
‘Journal of International Business Studies’ (ABS 4*8) and in ‘Journal of Corporate Finance’ (ABS 48), with 7
papers each.
Figure 2.6 denotes a temporal distribution of the most influential work on this research domain. The figure
portrays an exponential growth of research after the year 2010.
8 As per Chartered Association of Business Schools (CABS) – Academic Journal Guide 2018.
0 2 4 6 8
Academy of Management Journal
American Economic Review
Journal of World Business
Strategic management journal
Journal of Behavioral and…
Journal of financial Economics
Management accounting research
Journal of Banking & Finance
Research in International Business…
Journal of international business…
Number of articles (from 1990 onwards)
Aca
de
mic
Jo
urn
al

Chapter 2: Literature Review
31
Figure 2.6: A Temporal Distribution of the 100 most influential papers on national culture and
finance
A keyword analysis software is used9 to analyse the most frequently used keywords, by the top 100 research
papers. The output is denoted in figure 2.7.
9 https://www.wordclouds.com/
0
1
2
3
4
5
6
7
8
9
10
1985 1990 1995 2000 2005 2010 2015 2020 2025
No
. of
Art
icle
s
Year

Chapter 2: Literature Review
32
Figure 2.7: Most frequent keywords by the 100 most influential papers on national culture and
finance
The word size of the above figure depends on its relative weightage. Thus, it indicates that the 100 most cited
papers from 1990 onwards have placed emphasis on topics such as capital structure, mergers and acquisitions
(M&A), risk taking, corporate cash holding and so on.
For robustness, a thorough literature search was carried out in the Scopus database10. An array of keywords,
such as “national culture”, “culture”, “trust”, “religion” was used together with the umbrella term “finance”.
Then the resultant output was refined by year (1980 onwards) subject area (Economics, Econometrics and
Finance), document type (article), source type (journal) and language (English). The final sample includes 220
articles and VOSviewer software11 is used to visualize the following bibliometric networks.
A keyword co-occurrence map is generated based on the chosen bibliometric data, which is depicted in figure
2.8:
10 https://www.scopus.com/search/form.uri?display=basic&zone=header&origin= 11 van Eck N. J., Waltman L. (2010) ‘Software Survey: VOSviewer (version 1.6.15), a Computer Program for Bibliometric Mapping’, Scientometrics , 84/2: 523–38

Chapter 2: Literature Review
33
Figure 2.8: A keyword co-occurrence map on national culture and Finance research – Scopus
Database
The above network map indicates the most frequent themes in the literature on national culture and finance.
It reveals the network link between areas such as national culture, trust, religion, individualism and risk
aversion with finance topics such as financial markets, stock markets, financial systems, financial crisis,
banking, Islamic finance, venture capital, behavioural finance and so on.
The keywords analysis depicted in figure 2.7, portrays that ‘capital structure’ has been a popular theme
among the top 100 most-cited papers from 1990 onwards. However, the network map generated from the
Scopus database, which contains a larger sample of articles, does not indicate this. This suggests couple of
things; firstly this implies that the impact of national culture on capital structure is fairly a recent research
theme (post 1990); secondly, this suggests that the work on culture and capital structure are highly influential
in the discipline. On a different note, prior studies on national culture and capital structure have generated
conflicting results (as discussed in section 5.2.3.4) and hence is the focus of Chapter 5 of this thesis. It fills an
important gap in literature, by transcending the previous conventional emphasis on a firms’ nationality and
by focusing on the role of the CEO’s cultural origin in the firm leverage decision. Chapter 6 moves beyond the
conventional emphasis on the impact of a single culture and investigates the effect of a multiplicity of cultures
that exist within a firm, on its performance volatility
2.4.2 Culture and Accounting: A Bibliometric Perspective on the Research Domain
A literature search on the interplay of national culture and accounting topics was carried out in the Scopus
database. An array of keywords, such as “national culture”, “culture”, “trust”, “religion” was used together
with the umbrella term “accounting”. The resultant output was refined by year (1980 onwards) subject area
(Business, Management and Accounting), document type (article), source type (journal) and language
(English). The final sample includes 819 articles and VOSviewer software is used to visualize the following
keyword co-occurrence map (figure 2.9).

Chapter 2: Literature Review
34
Figure 2.9: A keyword co-occurrence map on national culture and Accounting research – Scopus
Database
Figure 2.9 portrays the interplay of national culture and related areas with accounting topics such as
management accounting, control, international accounting, International Financial Reporting Standards
(IFRS), earnings management, fraud, balanced scorecard, auditing/ audit quality, accountability, accounting
systems, intellectual capital and so on.
2.5 Conclusion
This chapter provides an introduction to culture and discuss the possible channels through which culture can
influence business outcomes. To distinguish between the two channels through which culture exerts its
influence, the epidemiological approach can be used, as in Chapter 5 and 6 of this thesis. The chapter
elaborates on prior research that investigates the impact of culture on finance and accounting outcomes. It
concludes with a bibliometric analysis that is undertaken to systematically analyse the prior literature on the
impact of culture on the two domains; finance and accounting, and reveals interesting findings.

Chapter 3: Research Philosophy
35
Chapter 3: Research Philosophy
3.1 Introduction
This section commences with definitions of research and most importantly how the process of developing
new knowledge can be affected by the researcher’s philosophical assumptions. The two major ways of
thinking about research philosophy, i.e. the ontological and the epistemological stances, along with the most
common data collection techniques are discussed under the two main and extreme viewpoints of research,
viz. the positivist approach and the interpretivist approach. Finally, the researcher argues that in reality the
choice between one position and the other may be somewhat arbitrary and unrealistic and identifies that the
research question is the imperative factor in determining the ontological and epistemological stance. Hence
a pragmatist philosophical view is adopted in the present study.
3.2 What is research?
Research is important in our daily lives and Saunders et al. (2007, p.4) suggest that “the results of research
are all around us”. Yet, they argue that the everyday use of the term, does not capture the true meaning of
research. Therefore, prior to a formal introduction of the term, a reverse definition, is indicated below, to
provide a better understanding of the same. The reverse definition characterizes research by ‘what it is not’,
rather than explaining ‘what it is’. For instance, Walliman (2001) argues that mere acts of collecting
information without a clear purpose or reordering of facts without proper interpretation do not describe
research. Further they explain that the term ‘research’ should not be used as a means of selling an idea or to
get it accepted among the target audience, be it academic or practitioners.
Saunders et al. (2007, p.5) define research as “something that people undertake in order to find out things in
a systematic way, thereby increasing their knowledge”. They identify the two phrases “systematic way” and
“to find out things” as two very important elements of the definition. The former suggests that the research
should be based on logical relationships, rather than mere beliefs. The present study maintains a systematic
approach to research by clarifying the methods that are used to collect data, by justifying why the results
obtained are meaningful and by explicitly stating any limitations that are associated with the process. ‘Finding
out things’, according to Saunders et al. (2007), implies two things. Firstly, this means that there can be an
array of purposes of a research, such as (but not restricted to) describing, understanding, analysing, criticizing
of a particular phenomenon. Secondly, it also means that the researcher has a clear purpose of what he/she
needs to find out, such as the answer to a particular question.
Nevertheless, the process of developing new knowledge via research, is affected by the researcher’s
philosophical assumptions. In other words, throughout this study, the researcher makes assumptions about
the nature of reality, regarding what constitutes acceptable knowledge and the role of values in research.

Chapter 3: Research Philosophy
36
This chapter explicitly discusses these assumptions and how they have affected this particular research
process.
3.3 The nature of reality – ontological position
This entails the assumptions of the researcher about how the world operates. Positivists believe that an
objective reality exists, which is driven by “immutable natural laws and mechanisms” (Guba & Lincoln, 1994,
p.109). In other words, positivists assume that, in reality, social entities exist independent of social actors,
whilst interpretivists believe that they are socially constructed, i.e. created from the perceptions and
consequent actions of social actors (Saunders et al., 2009).
3.4 What constitutes acceptable knowledge? – The Epistemological
Position
This concerns the researcher’s view on what signifies acceptable knowledge in a particular field of study. A
researcher can be interested in facts, such as the resources required in a manufacturing process (a positivist
approach), whereas another researcher is concerned about the attitudes of the workers towards their
supervisor in the same manufacturing process (an interpretivist approach).
Positivists believe that “only (those) phenomena that you can observe will lead to the production of credible
data” (Saunders et al., 2009, p.113) and in that sense agree with the notion of observable social reality.
Further, in the pursuit of new knowledge, positivists will develop hypotheses based on existing theory, which
leads to further development of theory, upon subsequent testing of the same. Positivists believe that they
are external to the process of data collection, cannot alter the substance of the data collected and can carry
out the research, in a value-fee way, as much as possible (Saunders et al., 2009). This implies that the
researcher can study the object “without influencing it or being influenced by it” (Guba and Lincoln, 1994,
p.110). Moreover, positivists generally believe that they are capable of replicating their highly structured
methodology and generalizing the output of the research (Saunders et al., 2009). Adopting well-structured
testing procedures along with a battery of robustness checks signifies internal validity, which ascertains
whether valid conclusions are drawn from the research, whereas generalizability of the results obtained
under positivist paradigm entails external validity (Ryan et al., 2002).Generalizability measures how well the
results obtained from a sample can be extended to make inferences about the entire population of data.
Interpretivists, on the other hand, oppose the notion of law-like generalizations proposed by positivists and
advocate that researchers should consider the differences between humans, as social actors. They mostly
emphasize on the details of a certain situation and the reality behind such details and derive subjective
meanings and social phenomena (Saunders et al., 2009).

Chapter 3: Research Philosophy
37
3.5 The Most Common Data Collection Techniques used by the Two
Main Viewpoints of Research
Mostly quantitative techniques are adopted to analyse highly structured and large samples, by positivists.
Qualitative techniques may also be used. In contrary, interpretivists, work on small samples but carry out in-
depth investigations, mostly via qualitative techniques.
The ontological and the epistemological stance of a researcher together with the choice of method
encompasses the research paradigm. Guba and Lincoln (1994, p.105) define the research paradigm as “the
basic belief system or worldview that guides the investigator, not only in choices of method, but in
ontologically and epistemologically fundamental ways”.
3.6 Pragmatism as a Research Philosophy
The above discussion frames the debate on ontology and epistemology in terms of a choice between two
extreme research philosophies, i.e. positivism and interpretivism. However, in reality the choice between one
position and the other may be somewhat arbitrary and unrealistic. Therefore, pragmatism, as a research
philosophy argues that the research question is the imperative factor in determining the ontological and
epistemological stance of the researcher, and that a particular philosophical assumption (be it positivism or
interpretivism) may be more appropriate than the other for answering particular research questions
(Saunders et al., 2009). Furthermore Tashakkori & Teddlie (1998) in their book on “Mixed Methodology –
Combining Qualitative and Quantitative Approaches)” posit that “at some point the knower and the known
must be interactive, while at others, one may more easily stand apart from what one is studying” (p.26).
The researcher adopts a pragmatist philosophy in the present study and believes that the research question
is the most important determinant of the ontological and epistemological standpoints. Thus the Research
questions addressed in chapter 5 (“can CEO’s national culture influence the firm leverage decision?”) and
chapter 6 (“can the existence of a multiplicity of cultures within a firm affect firm performance volatility?”)
adopts a positivist approach, as they entail working with an ‘observable social reality’, without influencing it
or being influenced by it. Furthermore, under this paradigm, the main objective of empirical research is to
understand the relationship among few variables, so that the impact of certain independent variables on the
dependent variable can be objectively measured and the output generalized. On the other hand, the research
question addressed in Chapter 4 (“the prominent role of sociocultural factors, in underpinning early
accounting thought and practices in ancient Ceylon”) indicates an interpretivist philosophy.
3.7 Conclusion
In essence, this section describes what research is and most importantly how the process of developing new
knowledge can be affected by the researcher’s philosophical assumptions. The two major ways of thinking
about the research philosophy, i.e. the ontological and the epistemological stances, along with the most

Chapter 3: Research Philosophy
38
common data collection techniques are discussed under the two main and opposing viewpoints of research,
viz. the positivist approach and the interpretivist approach. Finally, the researcher argues that in reality the
choice between one position and the other may be somewhat arbitrary and unrealistic and identifies that the
research question is the crucial factor in determining the ontological and epistemological stance. Hence a
pragmatist philosophical view is adopted in the present study.

Chapter 4: Early Accounting Thought in Ancient Ceylon and the Prominent Role of Sociocultural Environment
39
Chapter 4: Early Accounting Thought in Ancient
Ceylon and the Prominent Role of Sociocultural
Environment
4.1 Introduction
Beyond a thousand years
Somewhere in the far away East
People had carved on stones
Their earnings, taxes, expenses
Lying long under the earth
Quadrant pillars and slabs
Saved and secured imprints
Survived like gold and gems
(Kumarasinghe, 2011, p.132)
This paper seeks to explore the historical accounting practices that existed millennials ago, which were
engraved in rock walls or formations in Ancient Ceylon (presently Sri Lanka), a small Indian Ocean island close
to the Indian sub-continent. Given that the main emphasis of the paper is on historical accounting practices,
it is worth setting out what ‘history’ signifies. Previts (1984, p.13) posits that “history deals with man’s
reaction to the state of his environment, both the natural environment and the social environment, as
determined by the actions of preceding generations as well as by those of contemporaries”. He further affirms
that studies on history provides a clear linkage between what ‘was’ (the historical state) to what ‘is’ (the
positive state) to what ‘ought to be’ (the normative state) (p.13). This is significant, in his point of view, as
understanding concepts from such a ‘was-is-ought’ perspective, helps to recognize history as a cultural
product, acquired within the full context of a political, economic, social and temporal backgrounds.
In line with the above argument, the present study operates with dual objectives. First, this study examines
ancient accounting thought and practices, or more precisely, the existence of well-articulated forms of
‘kingship accounting’ and ‘Buddhist temple accounting’ practices that were carved in lithic or other
inscriptions, thousands of years ago. Accounting practices that are implicated in the governing and the
administering of royal power, in pursuance of maintaining order and structure, is referred to as a form of
kingship accounting system, in the context of this study. Buddhist temple accounting entails keeping proper
records of monastic resources and fulfilling notions of accountability requirements, to support relations with
the rulers and people. Secondly, the study focuses on the control environment (i.e. political, economic,
technological and sociocultural factors) that supported or underpinned the early accounting thought and
practices, while placing special emphasis on sociocultural factors that were largely inspired by Buddhism.

Chapter 4: Early Accounting Thought in Ancient Ceylon and the Prominent Role of Sociocultural Environment
40
Similar to the work of Ezzamel (1997) on ancient Egypt, this study recognises accounting as a means of
counting, measuring and valuing objects (i.e. as a means to quantify or value human activities); to ascertain
modes of reciprocity and as an instrument for adjudicating economic and social claims. Also, the study
explores the role of accounting as a tool in making human performances visible, or in other words, in
accomplishing notions of accountability practices, both relating to the kingship and Buddhist monasteries.
By analysing the content of the English translations of 122 lithic and other inscriptions that date back to the
period from 1st century A.D. to the 16th century A.D., during the reigns of approximately 32 kings and over 7
different administrative capitals or kingdoms in ancient Ceylon, this study, unearth dispersed, yet invaluable
evidence, regarding the existence of various types of taxes, state expenditure, two royal treasuries and the
accounting profession, which is classified as the notions of kingship accounting in this study. The study
identifies that ancient accounting practices have occurred mainly in the kingship, to keep track of king’s
wealth. On the other hand, the study also ascertains epigraphic evidence relating to Buddhist monasteries
that encompasses explicit instructions on maintaining proper records on inflows and outflows of resources,
calculating the balance of income - left after expenses and retaining them as non-transferable goods,
preparing periodic accounting records and reading out the records loud, in an assembly of monks and other
lay officials. This encapsulates the system of Buddhist temple accounting, in the research context.
On the other hand, the study on the control environment too provides important leads. The political
landscape in ancient Ceylon signified feudal characteristics and decentralized administration (i.e. officers
representing the crown and village administration respectively) that warranted the maintenance of proper
records on land, collection of taxes and imposts etc. to fulfil accountability requirements. Economic activities
entailed agriculture (where the subjects were required to pay imposts or a share of the harvest to the king),
trade and the existence of activities resembling the practice of banking. These endeavours demanded
activities relating to land measurement and grain measurement, which evince the existence of some
numerical technology that existed. The epigraphic evidence on primitive banks in particular, unearth that the
ancients were aware of the two concepts “capital” and “interest. Moreover, epigraphic evidence also reveals
the existence of literacy, the use of numerical technology and coinage, which may have underpinned the early
accounting practices beyond doubt.
Finally, ever since the introduction of Buddhism in Ceylon in the 3rd century B.C., the Buddhist philosophies
were deeply rooted in the value system of ancient Ceylon. Consequently, sociocultural dynamics appear to
have exerted a dual impact; direct and indirect, on early accounting thought and practices. The sociocultural
factors that compelled accounting practices to be undertaken in ancient Buddhist monasteries signifies the
direct impact, whilst the role of Buddhist cultural values in shaping the ancient political, technological
(literacy, numerical technology and coinage) and economic landscape, which in turn underpinned the early
accounting thought denotes the indirect impact.
This paper intends to make several contributions. First, it extends the current literature on accounting history
and practices pertaining to ancient kingdoms and civilizations, and in particular the work by Carmona &
Ezzamel (2007), Ezzamel (1997), Ezzamel & Hoskin (2002), Mattessich (1989), Nissen et al. (1993), Schmandt-

Chapter 4: Early Accounting Thought in Ancient Ceylon and the Prominent Role of Sociocultural Environment
41
Besserat (1992) and Jones (2009). With a specific reference to evidence from Asia and the Indian
subcontinent, despite the existence of an age-old Indian treatise viz. “Arthasāstra” (circa 300-184 BC) by
Kautilya (Mattessich, 1998) that explores on economic policy, statecraft and military strategy, there has been
very limited attempt to study ancient accounting practices in the region. Although this study acknowledges
the previous research work carried out in the context of Ceylon, by few authors such as Liyanarachchi (2009,
2015) and Kumarasinghe and Samkin (2018), the focus of the present study remains distinct. For instance,
Kumarasinghe and Samkin (2018) examined how Ceylonese kings used stone inscriptions as impression
management techniques in order to present a favourable impression about themselves to their subjects and
thus remain different from the present research. Although Liyanarachchi (2009, 2015) has also looked at early
accounting and auditing practices (evidenced by recordkeeping and reading them out loud in periodic
assemblies) in ancient Ceylon, his focus has been restricted to accounting practices, as a tool for fulfilling
accountability requirements in, Buddhist monasteries.
Distinctively therefore, the focus of the present study differs from this prior work as it attempts to examine
early accounting practices relating to both the kingship and Buddhist temples and fosters a broader view of
accounting that embraces the same as a technology of counting and valuing objects, quantifying human
activities and as a tool in accomplishing notions of accountability practices. In addition, the present study also
attempts to embed the accounting practices within the larger political, economic, technological and
sociocultural context of ancient Ceylon, whilst placing special emphasis on sociocultural factors that are
largely inspired by Buddhism, by highlighting its direct and indirect impact. Following a thorough literature
review in a Ceylonese context, the researcher believes that this is the first attempt to do so.
4.2 Review of literature
This section opens with a discussion on the significance and challenges of accounting history research,
followed by an overview of literature on accounting in antiquity. The analysis of prior literature reveals areas
that are under-researched, which have motivated the current study. Therefore the next section discusses on
how the present study attempts to fill this void. Finally a section is included to describe the research site
(ancient Ceylon, presently Sri Lanka).
4.2.1 Significance and Challenges of Accounting History Research
This study focuses on the early accounting thought and practices that existed in ancient Ceylon, along with
the macro-environmental factors that underpinned the same, with special reference to sociocultural factors.
Although some scholars view the examination of accounting practices in archaic economies, as a futile
exertion that has no bearing to the present, Haskin (1904, as cited in Previts, Parker and Coffman, 1990) posit
that the study of accounting history provides a better understanding of the present, in order to predict or
control the future. Previts, Parker and Coffman(1990, p.3) assert that:
“History supports contemporary research in policy-making and practice and in standard
setting. It acquaints accountants with the individuals, ideas, experiments, and lessons that

Chapter 4: Early Accounting Thought in Ancient Ceylon and the Prominent Role of Sociocultural Environment
42
constitute our heritage. It informs us about how we have reached a particular present-day
convention. Accounting history also encourages the thoughtful scholar to consider the
interdisciplinary view of accounting and its environmental context.”
Previts, Parker and Coffman (1990) further explain that history research can either be narrative or
interpretational. Narrative work involves describing items of fact, whereas interpretational work evaluates
relationships and provides interpretations, as similar in social sciences. However these two definitional views
may not be mutually exclusive as even pure narratives contain explanation and strive for prediction in some
way, as the more rigorous forms of science (Previts, Parker and Coffman, 1990).
Despite its significance, historical research, be it narrative or interpretational, can be conditional (Previts,
Parker and Coffman, 1990). For instance, the great historian Pieter Geyl stated that “history is indeed an
argument without end” (quoted from Previts, Parker and Coffman, 1990, p.8). Thus, a historical inquiry may
be incomplete due to the absence of facts that may have occurred either due to intentional of inadvertent
actions. He further argues that when historians fail to agree on a certain interpretation, they may be showing
their unique personal knowledge or experience in the subject, implying the possible subjectivity of history
research.
On the other hand, Previts, Parker and Coffman (1990) assert that there may be more than one true history
for a given subject and that “only God could write a history that would be complete from all points of view at
one point in time” (p.9). Further, interpretational work on history, in particular, is under duress as history
may not expose the cause of an event as a certainty. It can only illustrate probable factors that affected an
event. The study in hand, explores the ancient accounting practices and attempts to contextualize the same
within the socio-economic setting that prevailed, with special reference to sociocultural factors. Although the
researcher believes that such factors would have stimulated early accounting thought, the definite causes
behind the same are indeterminate.
However, Carmona and Ezzamel (2007), on the other hand, point out that “context-embeddedness of such
remote societies” would result in inducing the biases of “presentmindedness” of the researcher. According
to Previts and Bricker (1994), presentmindedness is the practice of interpreting the past based on our own
modern ideas and intentions.
Carmona and Ezzamel (2007), precisely, identify the following difficulties in conducting research in ancient
civilizations:
1. Inadequacy of confirmed evidence and the existence of dispersed and incomplete records.
2. Difficulty in translating and understanding dead languages. The extent to which the translated
meaning reflects the true meaning of the original message may never be known.
3. Comprehension of extinct religious and social beliefs can be difficult.
4. Interpretation of remote societal and political institutions will be problematic.

Chapter 4: Early Accounting Thought in Ancient Ceylon and the Prominent Role of Sociocultural Environment
43
Due to the above difficulties, the authors suggest that there are only two options; either to restrain from
researching on the antiquity altogether or to establish carefully as possible accounts of the history. Although
the present study is also subject to all the above challenges in interpreting epigraphic evidence, it attempts
to cautiously establish possible accounts of the history, whilst minimising researcher biases as much as
possible.
However, in line with Ezzamel (1997), the researcher wishes to emphasise the following words of caution.
First, the evidence examined in this study may be preliminary in nature and such evidence are neither
idiosyncratic nor related to unique chapters in the history of ancient Ceylon. For instance, similar evidence
regarding early accounting thought is found in Mesopotamia around 8000 B.C. (Ezzamel and Hoskin, 2002),
in China, particularly during the Chou dynasty, during 1122 B.C. – 256 B.C.(Gao & Handley-Schachler, 2003),
in India around 300 B.C. (Mattessich, 1998) and in ancient Bali around 1-1500 A.D. (Budiasih, 2016) and so
on. Yet, the researcher attempts to restrain from drawing grand generalisations. Second, the study
predominantly relies on ancient lithic and other inscriptions that have been translated to English from various
ancient languages. In spite of the scrupulous work of the archaeologists, the degree to which the translated
meaning reveals the true meaning of the original message, is a question that will never be answered
conclusively. Third, it is not the intention of the researcher to extend modern notions of accounting practices
to the ancient world. Yet, the occasional use of modern terminology in this study to describe ancient
Ceylonese accounting practices, is inevitable in many cases, but the researcher accepts that it is clearly
problematic. Finally, as Jones (2009) underlines, the accounting practices discussed here in the context of the
royal treasury and the religious monasteries, may not form part of a fully-fledged system but arose from the
“collection and assemblage of many diverse elements”. Thus as Miller and Napier (1993) affirms, this study
intends to contribute to our knowledge of “the piecemeal fashion in which various calculative technologies
have been invented and assembled”. On the other hand, the emphasis of this study is placed on
understanding accounting thought and practices that occurred at certain periods of ancient Ceylonese
history, rather than establishing an evolutionary link with modern accounting practices. Finally, the
researcher does not view macro-environmental factors, such as the political, economic, technological or
sociocultural landscape as determinants of early accounting practices in ancient Ceylon. Instead the
researcher merely attempts to contextualize the early accounting thought, in a broader socio-economic
setting.
4.2.2 An overview of Literature on Accounting in Antiquity
In discussing accounting research in antiquity, the study of Ezzamel & Hoskin (2002) is noteworthy since they
revisit a period even before the Early Bronze Age. They draw evidence from Mesopotamia and Ancient Egypt
and explore the relationship between accounting, writing and money. In summary, they affirm that writing
was developed as a supplement to accounting and that money materialized as a “double supplement” to
both accounting and writing, with accounting itself being a supplement of previous ways of numbering and
valuing, making accounting a part of a play of supplements (Ezzamel & Hoskin, 2002, p. 333).
Chapter 4: Early Accounting Thought in Ancient Ceylon and the Prominent Role of Sociocultural Environment
44
Precisely, Ezzamel and Hoskin (2002) evince that the earliest known stage of accounting development, covers
a period before the invention of writing. This form of accounting is called “token accounting”, which was used
to denote and record objects in relation to the move from hunter-gathering to agriculture, around 8000 B.C.
and then with the establishment of earliest cities and states, around 4500 B.C. and with the invention of the
cuneiform (wedge-shaped) writing system. Mesopotamian evidence, indeed, reveals that cuneiform writing
around 3100 B.C. was a supplement of earlier token accounting system. The clay tokens that took the shape
of simple geometrical forms, first appeared in 8000 B.C. They were predominantly used for stewardship
purposes pertaining to identifying and securing a surplus for maintenance of the farming system over time,
but not for trade or exchange, at that point of time. However the authors assert that the clay tokens always
operated as linguistic-numerical signs, or put differently, “each token both named and counted a specific
quantity of a particular designated item (e.g. one jar of oil)” (Ezzamel and Hoskin, 2002, p.341). However, the
clay tokens later amplified in number and in complexity.
Ezzamel (1997) draws evidence for the functioning of accounting, relating to control and accountability, in
ancient Egypt from the New Kingdom (1552 B.C. – 1069 B.C.). Precisely, he focuses on the practices of
accounting that were used as a means of monitoring the flow of inputs and outputs and in the construction
of inventory lists in a bakery, which belonged to the Palace of Seti I (1303-1290 B.C.). The bakery accounts
were established exclusively based on physical measures that (i) helped to aggregate the quantities of output
(breads) of differing weights; (ii) enabled to calculate the allowed losses in the production process (baking);
(iii) provided differences in quality of the products (breads) that can be calculated and (iv) enabled the
matching of inputs (ingriedients) and outputs (bread). According to Ezzamel (1997), accounting records were
not only maintained for taxation purposes but also to satisfy an Egyptian ‘obsession’ with bureaucratic details
as recognized by Egyptologists. The political and economic institutions in ancient Egypt were coordinated by
a powerful bureaucracy, in which accounting had played a major role (Ezzamel, 1997).
Carmona and Ezzamel (2007) review previous literature on recordkeeping practices in Mesopotamia and
ancient Egypt, with special reference to processes of ancient accountability. They assert that accounting
practices that prevailed in both ancient civilizations portray remarkable levels of details and were far from
being rudimentary. In general, accountability processes had operated in different settings, i.e. in the public
domain and in the private domain. In the public sphere, accounting practices were involved in estimating and
collecting of taxes, work on royal projects in royal workshops and manufactories, and in temples. The private
sphere, conversely, used accounting and accountability for “semi-barter exchange, stewardship, the
household and the will of the dead” (Carmona and Ezzamel, 2007, p.196). The emphasis of their paper is on
the role of accounting, as the technology of calculation, valuation and reporting, in fostering accountability.
In addition, Ellis (1974) studied the taxation system in the old Babylonian period, which spans during the first
300 or so years in the 2nd millennium B.C. and provides evidence for the existence of imposts on mainly
commercial and agricultural spheres. Commercial imposts include activities that resemble contemporary
customs duties and value-added taxes.

Chapter 4: Early Accounting Thought in Ancient Ceylon and the Prominent Role of Sociocultural Environment
45
In a European context, Jones (2009) highlighted several major elements of the English Exchequer accounting
system, which was documented about 900 years ago. He conceptualizes the main elements of the exchequer
system as an (p.262) “accountability process (the idea), which was operationalized through a complex literary
and numerical technology”. Exchequer accounting thus dealt with the recording of tax funds and other public
funds which are due for a royal treasury. According to Edwards, Coombs, & Greener (2002), the English
Exchequer accounting system formed the basis of what is commonly known as the charge and discharge
accounting system, which dominated the accounting system in the UK Government until 1830. This
accounting system precedes the double-entry system of book-keeping and was the governing accounting
system throughout the Middle Ages12 (Jones, 2009).
With the advent of these historical studies on accounting practices, there has been increased attention to
notions of accountability embedded in the development of quantification and the recording of transactions
and events pertaining. The first notable exercise of accountability arose as a result of the feudal relationship
between the sovereign and the different individuals in charge of maintaining king’s property, and collecting
taxes and duties on king’s behalf (Jones, 2009). Carmona & Ezzamel (2007) propose three levels of
accountability, as hierarchical, horizontal and self. Hierarchical accountability involves superior and
subordinates, which is similar to the proposition of Jones (2009), where the superior is the Monarch
representing the king and the subordinate is the sheriff, or king’s representative in a particular shire. However
Carmona & Ezzamel (2007) solicits two more levels of accountability; horizontal (between two individuals,
outside of the formal power structures) and self (emphasizing notions of morality and identity). In the context
of the present study, the researcher draws epigraphic evidence to illustrate the hierarchical and horizontal
forms of accountability.
Jones (2009) investigated three eras; viz. Mesopotamian including Egypt, Roman and Middle Age, to identify
overarching similarities, which would have induced the use of accountability-based systems. According to the
author, the states were territorially centralized in all above eras and the main emphasis was on agriculture
rather than industry or trade. Furthermore, the main focus of the accounting system was to enforce control
and foster accountability rather than profitability. Finally, all three states shared common structural
conditions in which they had an autocratic ruler (a king, emperor or the monarch) leading a hierarchical
society with defined elites. In an attempt to contextualize the exchequer accounting system, Jones (2010)
identify feudalism, coinage, technological infrastructure (viz. literary and numerical skills) and logistical
infrastructure (viz. the existence of an effective communication and transportation network) as supporting
12 The Exchequer accounting system has used a complex and sophisticated literary and numerical technology. Haskins (1912) also reports that actual calculations were carried out involving counters and a version of the abacus. The records were written down on parchment by scribes (cited in Jones, 2009) . In addition, Jones (2009) also ascertains several main characteristics of the English Exchequer system. Firstly, the English Exchequer system involved written records. Secondly it emphasized on personal accountability. Also, it required the conduct of regular periodic meetings; a rendering of an account and an audit

Chapter 4: Early Accounting Thought in Ancient Ceylon and the Prominent Role of Sociocultural Environment
46
macro-environmental factors. While this literature does highlight the existence of a fairly numerate and
complex system of accounting practices to control and monitor performance and ensure revenue flows from
taxation in ancient and medieval settings, there has been less emphasis on how these practices are recorded
and communicated to a wider constituency. In effect, the information contained in the accounting documents
and inscriptions remained relatively ‘private’. In contrast, the study in hand reveals a rather more ‘public’
form of feudal accounting through the use of rock inscriptions.
On a different note, Gao and Handley-Schachler (2003) investigate how traditional Chinese culture, which
was strongly inspired by Confucianism, Feng Shui and Buddhism, influenced the accounting history in ancient
China. According to the authors, the accounting information in ancient China was predominantly used to keep
track of emperor’s wealth and not for maximizing economic efficiency. Furthermore, as Confucianist ethics
oppose Chinese accounting from measuring and disclosing profits and loss, cost measurement and profit
calculations are rarely found in ancient Chinese accounting records.
From a South Asian context, only a handful of research focuses on accounting practices in antiquity. For
instance, Kumarasinghe and Samkin (2018) analyse how rock inscriptions were used as impression
management techniques, by ancient Ceylonese kings to reflect a favourable impression about themselves, to
their subjects. They use a meaning-oriented content analysis approach and conclude that impression
management strategies used by kings in ancient Ceylon were a lot similar to those used by modern
charismatic leaders, although the way strategies were implemented differs, as the former used intimidation
whereas the latter mostly use exemplification.
Moreover, Liyanarachchi (2009), focuses on Ceylon, and portrays the accounting and auditing practices that
prevailed in Buddhist monasteries, by drawing evidence from ancient inscriptions established during the
period from 815 to 1017 A.D. Based on epigraphic evidence, the author illustrates that Buddhist monasteries
kept proper records on their “income” and expenses and they annually read these statements aloud in an
assembly of monks, primarily to maintain the reputation of a monastery and its members and to safeguard
the goodwill among the monks, the king and the subjects (Gregory A. Liyanarachchi, 2009).
Liyanarachchi (2015) extends his previous work in 2009 and explores the role of the seven antecedents of
double-entry bookkeeping, introduced by Littleton (1927), in supporting the development of previously
identified Buddhist temple accounting that prevailed in ancient Ceylon. Based on epigraphic evidence and
other corroborating historical records, Liyanarachchi (2015) illustrates how the seven antecedents, viz. the
art of writing, numerals and arithmetic, private property, money, capital, commerce and credit, may have
underpinned the development of this simple recordkeeping exercise that did not involve double-entry
bookkeeping. Despite the existence of all seven antecedents, there is no evidence to conclude on the
existence of double-entry bookkeeping in ancient Ceylon. Thus Liyanarachchi (2015) concludes that
“recordkeeping methods are context-specific and antecedents may not necessarily lead to the double-entry
bookkeeping method” (p.100).

Chapter 4: Early Accounting Thought in Ancient Ceylon and the Prominent Role of Sociocultural Environment
47
4.2.3 Research Contribution
The present study makes several distinctive contributions. First, it extends the current literature on
accounting history and practices pertaining to ancient kingdoms and civilizations, and in particular the work
by Carmona & Ezzamel (2007), Ezzamel (1997), Ezzamel & Hoskin (2002), Mattessich (1989), Nissen et al.
(1993), Schmandt-Besserat (1992) and Jones (2009) to a south Asian context.
More importantly, the scope of this study differs from the limited prior work carried out from a Sri Lankan
context. Although Liyanarachchi (2009, 2015) has also looked at early accounting and auditing practices in
ancient Ceylon, his focus has been restricted to accounting practices, as a tool for fulfilling accountability
requirements in, Buddhist monasteries
The present study, however, operates with a broader focus. It defines, accounting practices as a means of
quantifying or valuing human activities, to ascertain modes of reciprocity and as a tool in making human
performances visible. Therefore, the emphasis was not limited to Buddhist monasteries, but extended to
include other institutions, such as the kingship. Furthermore, the study adopts a coherent and a holistic
research approach to study the ancient accounting practices and highlights the political, economic and
technological infrastructure that underpinned the same. Finally but most importantly, the study is unique as
it brings to the fore, the influence of socio-cultural factors that prevailed during the ancient era. Following a
thorough literature review in a Ceylonese context, the researcher believes that this is the first attempt to do
so.
4.2.4 Ancient Ceylon (Sri Lanka): A brief profile
Sri Lanka is an island country situated in South Asia, with an area of approximately 65,610 km2. It is located
in the Indian Ocean to the southwest of the Bay of Bengal and to the southeast of the Arabian
Sea. Mahavamsa, is one of the prominent chronicles of Si Lanka, which was written by a monk called
Mahanama in Pali language in the 5th or 6th century A.D. (Codrington, 1924; Geiger, 1912). According to
Mahavamsa Sri Lankan history traditionally starts in circa 6th century B.C. upon the arrival of the Indian prince
“Vijaya” and his 700 followers (Geiger, 1912). Prince Vijaya became the first king of the country and ever
since, the island was ruled by approximately 186 kings (Paranavitana, 1933). The country remained free from
any significant European influence until the 16th Century, when the Portuguese managed to mainly occupy
the coastal parts of the island in 1505. The dynastic history ended in 1815, when Sri Lanka became part of the
British Empire.
Why Ceylon?
As Ceylon was geographically situated in a strategic location of the renowned maritime Silk Road, it was
known to be a popular trade hub. International trade thrived during the 6th century A.D. and Ceylon
developed as a centre of navigational and commercial activity in the Eastern world (Jayawardana, 1964).
Therefore it can be reasonably assumed that some form of calculative practices and modes of reciprocity
were adopted in ancient Ceylon, and was one of the main reasons for being chosen for this study.

Chapter 4: Early Accounting Thought in Ancient Ceylon and the Prominent Role of Sociocultural Environment
48
Furthermore, Ceylon has a documented history which spans over 2000 years13 and amongst many artefacts,
Ceylon’s history has been documented through the use of rock inscriptions. Thus the availability of rich first-
hand sources of information, facilitated the researcher to conduct the research confidently and reliably.
Moreover, this also implies that the art of writing had existed in ancient Ceylon centuries ago. Art of writing
is an important supplement of accounting practices and the existence of the same reinforces the empirical
findings on the presence of accounting practices in the antiquity. Last but not least, the convenience in
accessing the data, as the researcher is originally from Sri Lanka, was another factor in choosing the particular
research site.
Buddhism and Sociocultural Background in Ancient Ceylon
Ever since the arrival of Buddhism in Ceylon in the 3rd century B.C., it received royal patronage at all times.
Since then, government administration, architecture, language and literature, social conventions and
customs and most importantly people’s thinking were inspired by Buddha’s teachings (Liyanarachchi, 2009).
The Buddhist philosophies were deeply rooted in the value system of ancient Ceylon. Prior to understanding
how Buddhism played a primary role in shaping the value and belief system of inhabitants in Sri Lanka, it
would be beneficial to understand some basic tenets of Buddhism.
The teachings of Buddha are mainly clustered around several concepts such as Karma (one’s volitional actions
and their consequences), Samsāra (cycle of death and rebirth, governed by one’s Karma) and of an ultimate
liberation from Karma and Samsara, which is called Nirvana.
Ever since the teachings of Buddha were introduced in Ceylon, merit (pin) and demerit or sin (pav) became
the guiding principle of a person’s life. Good deed or good “karma” will result in merit and will result in good
consequences and good rebirth whilst wrong-doing or bad “Karma” will result in negative consequences and
bad rebirth (Gombrich, 2012). Gombrich (2012) further explains that karma refers to actions driven by
intention. It is a universal law and is self-governing. It operates by itself, without any divine force. “Like any
natural law, it applies in the same way to everyone and does not discriminate on the basis of power, social
status or caste” (Liyanarachchi, 2008, p.124). Thus, people restrained themselves from committing a sin. The
concept of merit and demerit (pin-pav) or “karma” acted as tools of self-regulation in society.
Buddhism realizes that the mundane life entails endless desires and eventual suffering. An individual’s
volitional actions result with accumulating Karma, either good or bad, and results with one’s endless
wandering of life, known as the Samsāra, the cycle of death and rebirth. This realization is explained in the
four noble truths of Buddhism, the essence of Buddha’s teachings. The four noble truths consist of
understanding the truth of suffering, the cause of suffering (i.e. endless desires and attachments), cessation
of suffering (letting go of desires) and the path that leads to renouncement of desires and cessation of
suffering. The final noble truth, or the path that leads to the end of suffering is known as the noble eightfold
13 Mahavamsa, one of the prominent chronicles of Si Lanka, documents Ceylonese history from 6th century B.C. (Codrington, 1924; Geiger, 1912).

Chapter 4: Early Accounting Thought in Ancient Ceylon and the Prominent Role of Sociocultural Environment
49
path. In essence, the noble eight-fold path explains how the vicious cycle of death and rebirth can be broken
in order to attain the supreme bliss of Nirvāna (Gao & Handley-Schachler, 2003).
Upon its introduction, Buddhism was widely accepted by the general masses in ancient Ceylon. The concept
of merit and demerit (pin-pav) was deeply rooted in the value system. As Karma is not confined to one’s
present life, people refrained from committing a sin, in the fear that the consequences of engaging in morally
bad actions will affect both their present life and future lives.
Gao and Handley-Schachler (2003) distinguish Buddhist sociocultural values from Western societies in
general, as follows:
1. Buddhism teaches that people’s endless desires are the root cause of suffering. Thus Buddhist
teachings promote giving-up or abandoning desires. This can be different from the Western culture
that values personal success and materialistic achievements.
2. Similarly, the religious arena in the West was an important constituent in early economic, commerce
and finance activities. In contrast, Buddhist monks, especially in the ancient era, were restrained in
engaging in commercial activities. Buddhist monks are a group of people who have abandoned their
homes and families, in the pursuit of Nirvāna. They follow a frugal lifestyle and abstain from sensual
pleasures in order to pursue spiritual goals.
3. Whilst the Western societies place great emphasis on written laws and contracts to protect
individuals and society, the concept of merit and demerit or “karma” largely acted as tools of self-
regulation in the ancient society.
One prime purpose of this research is to examine how these distinctive sociocultural values underpinned the
early accounting thought in ancient Ceylon.
4.3 Methodology
4.3.1 Introduction
In the context of this study, archival method is used for collecting data. The study predominantly employs
primary sources, viz. pre-historic slab, pillar and rock and other inscriptions, searched, discovered, recorded
and translated by the researchers at the Department of Archaeology of Sri Lanka. Earliest works in this field
were carried out by few eminent figures such as Muller (1883), Wickremasinghe (1912), Paranavitana (1933)
and Codrington (1924). The content of these inscriptions was later re-analysed in order to re-interpret certain
aspects and arranged into chronological order by subsequent historians.
Precisely, the epigraphic material employed in this study, dates back to the period of 1st century A.D. during
the reign of King Kutakanna, who was the 30th king in the royal lineage of Ceylon (Paranavitana, 1933).
Paranavitana (1933, p.4-47) includes a chronological table of Ceylon Kings, where 186 kings have been listed
over 13 kingdoms. This study relies on 122 inscriptions over the time period from the 1st century A.D. to the
16th century, during the reigns of approximately 32 kings and over 7 different administrative capitals or

Chapter 4: Early Accounting Thought in Ancient Ceylon and the Prominent Role of Sociocultural Environment
50
kingdoms. In addition to the inscriptions, several other historical records were also used mainly for two
reasons: firstly, to check the accuracy of details and translations provided in inscriptions and secondly to
gather independent corroborating evidence about the socio-political and economic environment that
prevailed during the aforementioned time period.
Moreover, as mentioned above, the island was free from any significant European influence until 1505 A.D.
when the Portuguese finally succeeded in gaining a foothold on the island. The lion’s share of the inscriptions
that are being analysed in this study belongs to a period well before the involvement of the Portuguese. Thus
it can be presumed that the accounting practices employed in ancient Ceylon was free from significant
European influence. However as postulated by Liyanarachchi (2009), the same may have been influenced via
the religious and social connections the island fostered with India.
What are inscriptions?
Ancient lithic and other inscriptions form the basis of the empirical material of this study. Inscriptions were
used as one of the means of mass media by the inhabitants of ancient Ceylon. The most common form was
to carve on rock surfaces but other mediums such as clay, paper, wood and metals such as gold, silver, copper
have also been used (Epigraphy and Numismatics Division, 2019). Inscriptions can be found written in Early
Brahmi, Late Brahmi, Transitional Brahmi, Mediaeval Sinhala and Modern Sinhala. A handful of inscriptions
are found written in Tamil, Chinese, Arabic, Persian, Sanskrit and Pali. These inscriptions are located in many
parts of the island, mainly near age-old temples, tanks, ports and other prime locations many years ago. They
are now preserved and maintained by the Department of Archaeology in Sri Lanka and are available to be
witnessed to date. Section 4.4.1 –figure 4.2 provides a map of Sri Lanka that indicates the spatial distribution
of the inscriptions used in this study and a figure with the periods they typically relate to.
Significance of Inscriptions
The data used in this paper is unique in its nature. Inscriptions are a reliable source of information that were
engraved during the reign of ancient kings. They are not modified in any way, and thus contain original
information that provide glimpses into the ancient world. Furthermore they provide invaluable information
with less biases, about the great antiquity, than books or other secondary sources do on history. This is due
to several reasons. The first reason is related to ancient inscriptions being qualified as a primary source of
information. According to Lune and Berg (2017, p.161) primary sources “involve the oral or written testimony
of eyewitnesses”. Books or other publications on history, on the other hand, are secondary sources of
information, which are “oral or written testimony of people not immediately present at the time of a given
event” (Lune and Berg, 2017, p.161). They are created in pursuing a specific research question or an area of
research interest. Therefore, secondary sources may, at times, contain biases, as authors may have
interpreted primary data, based on their individual views and standpoints.

Chapter 4: Early Accounting Thought in Ancient Ceylon and the Prominent Role of Sociocultural Environment
51
Second, collecting data via a primary source such as inscriptions, is an unobtrusive research strategy. Lune
and Berg (2017) elucidates that a research is unobtrusive, when data collection is “independent of the
processes that produced it”14 (p.146).
Third, the study of ancient inscriptions, as stated above, provides a glimpse into the ancient world and offers
a broad understanding of the political, economic and religious conditions that existed in the kingdom. Finally,
from a Sri Lankan context, many inscriptions that are used in this study were carved on rock and other
surfaces nearly 2,000 years ago, mainly near temples and other important places as mentioned above.
Besides, a period of about 100 years has already lapsed since they have been translated. Although
inscriptions themselves provide valuable economic, social and political information about the early
civilization in Ceylon, only a handful of attempts have been made so far to analyse the data from an
accounting perspective.
4.3.2 Research Method
This study employs a manual content analysis approach to analyse the ancient rock inscriptions, in order to
explore the accounting practices that existed in ancient Ceylon along with the sociocultural, technological,
economic and political factors that underpinned the functioning of kingship accounting practices, with special
reference to sociocultural influences.
Content analysis, in simple terms, is a research technique that systematically analyses, codes and interprets
texts or other material, in order to make replicable and valid inferences of data.
Some Definitions of Content Analysis
Steenkamp and Northcott (2007, p.12) define content analysis as a “systematic method of categorizing and
analysing the content of texts”. On the other hand (Krippendorff, 1989, p.403) provides a more goal-oriented
definition of content analysis, where he contends content analysis as “a research technique for making
replicable and valid inferences from data to their context”.
Thus by looking at the definitions above, it can be implied that content analysis, is simply, the systematic
analysis of a certain content, in order to make valid inferences from data to their contexts in a research study.
But then again, what exactly is the “content”? Content can be anything produced by people for various
14 Unobtrusive research mostly involves the study of social artefacts of the period in concern that were first created for some other reason prior to being examined as data for research. These social artefacts are “produced in a particular time and place, which therefore contain glimpses into that world” (textbook, year, p.161). The textbook (year) further explicates that all unobtrusive strategies involve studying human traces that are either intentionally or inadvertently left behind and that these traces provide more coherent and reliable information about human lives during the period in concern. In the context of this study, inscriptions are an ideal example for social artifacts, and the study of the same enables the researcher to adopt an unobtrusive research strategy.

Chapter 4: Early Accounting Thought in Ancient Ceylon and the Prominent Role of Sociocultural Environment
52
reasons. However, they may not be originally intended for research purposes. Such material or “content” is
referred to as social artefacts (Lune & Berg, 2017).
Krippendorff (2004) emphasizes that content analysis may not be restricted to written material and affirms
that “content analysis has evolved into a repertoire of methods of research that promise to yield inferences
from all kinds of verbal, pictorial, symbolic and communication data” (p.17). Abeysekera and Guthrie (2005)
incorporate this fact when developing a more detailed task-oriented definition that imparts content analysis
as a method that “involves codifying qualitative and quantitative information into predefined categories so
that a pattern can be derived in presenting and reporting that information” (p.154). Moreover content
analysis also provides a platform to examine processes that take place over a long period of time that may
expose trends in a society (Lune & Berg, 2017).
The research in hand employs lithic and other inscriptions in ancient Ceylon for the purpose of this research.
These inscriptions, as explained above, were used as a means of mass media in the ancient days. Whilst they
provide invaluable information on the socio-political and economic circumstances that prevailed during the
period in concern, they were not originally meant for research purposes. Therefore, it can be stated that this
study uses social artefacts for the purpose of this research.
Categories of content analysis
Content analysis researchers, over the years, have used a variety of research techniques under the umbrella
term of content analysis. These various techniques can be categorized under the following headings, as
presented by Janis (1943/1965) (cited in Krippendorff, 2004). Krippendorff (2004) exemplifies the various
categories of content analysis, based on a document that presents about Germany
Pragmatical content analysis – This involves all those procedures that classify signs according to their
probable causes or effects. For example this may involve counting the number of instances that
something is said, which would generate favourable attitudes towards Germany in a given audience.
Semantical content analysis – This involves classifying signs according to their meanings. For
example, the researcher can count the number of times, Germany is referred to, regardless of the
particular words that may be used to make the reference.
There are three types of semantical content analysis, Designations Analysis, Attribution Analysis and
Assertions Analysis. Out of these, designations analysis – is a subject matter analysis, as it provides
the number of times certain objects (persons, things, groups or concepts) are referred to (e.g.:
references to German foreign policy).
Sign-vehicle analysis – This category involves classifying content according to the psychophysical
properties of the signs. For example, counting the number of times a word appears.
The approach of this study is to classify content in the inscriptions, according to their meanings. Therefore, it
can be classified as a semantical content analysis. Furthermore, the preliminary analysis of the research
determines the frequency with which certain concepts are referred to. Therefore, the present study can be
considered to undertake a designations semantical content analysis.

Chapter 4: Early Accounting Thought in Ancient Ceylon and the Prominent Role of Sociocultural Environment
53
Sources of data of Content Analysis
As implied by the above definitions of content analysis, the most obvious source of data for the analysis would
be in the form of texts, “to which meanings are conventionally attributed: verbal discourse, written
documents and visual representations” (Krippendorff, 1989, p.404). The most prominent source has been the
mass media and most content analyses have been conducted based on newspapers, magazines, radio
broadcasts, books, films etc. (Krippendorff, 1989). However he asserts that a content analysis technique can
be equally applied to less public data sources such as personal letters, witness accounts in courts, answers to
open-ended interview questions and computer conferences and so on. Krippendorff (1989) also suggests that
content analysis can also be adopted to analyse data that provides meaning, only to small groups of experts,
such as motifs on an ancient pottery, speech disturbances, dreams etc.
In accounting research, content analysis is predominantly used to analyse the narrative sections of annual
reports, such as the chairman’s message, president’s statement and/or the operating and financial review (N.
Steenkamp & Northcott, 2007). The research in hand, is among the few studies that use ancient lithic
inscriptions as a source for data analysis, which were used as a means of mass media by the ancient Ceylonese
kings.
Qualitative and Quantitative Content Analysis
Whilst some scholars argue that content analysis is a qualitative research technique, others argue that it is
more a quantitative approach. Hsieh and Shannon (2005), in particular, affirm that content analysis is a
qualitative technique that involves three distinct yet overlapping approaches; conventional, directed and
summative. As all three approaches associate with interpreting meanings from various material, they adhere
to the naturalistic paradigm in research (Hsieh & Shannon, 2005).
As per Hsieh and Shannon (2005) and Lune and Berg (2017) conventional content analysis entails coding
categories that have been derived inductively from the raw data itself, what some scholars might refer to as
a grounded theoretical approach. Directed content analysis, on the contrary, uses more analytic codes and
categories that are derived from existing theories and explanations, pertaining to the research problem.
Finally, summative content analysis combines two main tasks; firstly, the researcher counts the words or
phrases in the raw data and then secondly incorporates the latent meanings in the data. Latent meanings will
be discussed in a later section.
In contrary, Lune and Berg (2017) suggests that content analysis is not purely qualitative, as it also entails a
quantitative component. They argue that content analysis is different from the narrative analysis, where the
latter is more a qualitative textual approach. Content analysis may be limited to counts of textual elements
and thereby evince quantitative characteristics whilst implying a more reductive and a more positivistic

Chapter 4: Early Accounting Thought in Ancient Ceylon and the Prominent Role of Sociocultural Environment
54
approach (Lune and Berg, 2017). Content analysis method differs from the thematic analysis, largely due to
the same reason15.
Nevertheless, both pure quantitative and qualitative descriptions of content analysis have been criticized by
prior scholars. Labelling content analysis as a qualitative approach may not be appropriate, as once the data
is coded, it can be presented quantitatively (N. Steenkamp, 2007). On the other hand, a quantitative label
may also be unsuitable, as it implies, as explained above, a more reductive view. Krippendorff (2004),
therefore, contends that quantitative and qualitative approaches are no longer opposing views but
complimentary. Both are imperative for the content analysis technique. In fact, content analysis technique
requires reading of texts in the beginning, which is inherently qualitative and later, some characteristics of
the texts will be converted into numbers, showing quantitative characteristics.
The study in hand adopts a conventional content analysis largely due to the nature of its research question
and due to the limited availability of prior explanations or theoretical frameworks supporting the research
context. Precisely, despite a comprehensive literature search, the researcher identified only a handful of
studies that use rock inscriptions in ancient Ceylon for accounting purposes. Secondly, even from this limited
number, only one study explicitly states the method used as content analysis. Thirdly, this particular paper,
by Kumarasinghe and Samkin (2018), is different from the scope of the present study. Therefore the coding
categories for the purpose of the present study have been mainly derived inductively from the raw data itself,
whilst a list of pre-defined classifying rules, “to assist in categorizing, coding and recording data” (p. 10) was
developed based on the prior work of Kumarasinghe and Samkin (2018). More details on the pre-defined
classifying rules and coding categories will be discussed later under section 4.3.3-Data-making process.
Furthermore, the content analysis approach in the present study is also summative in nature as firstly, the
words or phrases in the raw data are counted and then secondly their latent meanings are incorporated.
Finally, the content analysis technique adopted in this study is described as both a quantitative and a
qualitative assessment. It is quantitative, because the coded data are initially presented quantitatively as
frequencies. On the other hand, it is qualitative, as the researcher first reads all inscriptions and draws
inferences about the meanings and messages conveyed through texts in the ancient rock inscriptions, in
search of accounting practices and a supporting macro-environment, in ancient Ceylon.
Manifest versus Latent Content Analysis
Another useful distinction, in the adoption of content analysis, is between the manifest content and latent
content. Steenkamp and Northcott (2007) distinguish between the two as form oriented (manifest content)
15 Thematic and narrative analyses are two distinct qualitative methods, in terms of their “definitions, aims, philosophical backgrounds, data gathering and analytical procedures” (Andrews, 2019, p.2). Yet the two can be used in a study in a complimentary fashion. For instance, a thematic analysis can be used to identify, analyse and report patterns (themes), to least describe data in rich detail. A narrative analysis method can then be used to examine the reasons for the recurrence of such themes.

Chapter 4: Early Accounting Thought in Ancient Ceylon and the Prominent Role of Sociocultural Environment
55
and meaning oriented (latent content). These are not mutually exclusive, and in general, are used in
conjunction by the researchers. Lune and Berg (2017) distinguishes between the two as follows:
In practice, a researcher usually starts with focusing on the manifest content. It entails investigating the
content that is physically present and countable. On the other hand, latent content requires the analysis to
be extended, in order to interpret the underlying symbolism in the physical data. Thus it is apparent that
manifest content restrains its focus on the visible content or the surface structure whilst latent content digs
deeper to find the deep structural meaning (subtext). A researcher needs to emphasize on both manifest and
latent meanings of a content, but by reporting only the manifest content by way of frequencies and patterns
does not reveal the true nature of the data and variables and are not findings in themselves. The utility of the
technique lies in its analysis of latent content. Thus content analysis allows the researcher to go behind the
text to understand any hidden meanings and to make valid inferences about hidden or underlying meanings16.
The present study initially focuses on the manifest content. Then the analysis is extended to understand the
latent content. The process adopted is discussed under Data-making process in section 4.3.3.
Various Uses of Content Analysis
Content analysis has been used in various disciplines, including sociology, criminology, psychology, education,
business, journalism, art and political science (Lune and Berg, 2017). Content analysis has increasingly been
used in the field of Accounting, in particular, to unearth useful insights into accounting practices. In the
Accounting discipline, content analysis is mostly used, but not restricted to, studies concerning impression
management (M. Smith & Taffler, 2000; Stanton et al., 2004) nature of corporate social reporting (R. Gray et
al., 1995) and intellectual capital reporting (Abeysekera & Guthrie, 2004, 2005; April et al., 2003; Brennan,
2001). Content analysis is also used in accounting history research (Neimark, 1983; Previts et al., 1990b).
However the only evidence of the use of content analysis to analyse rock inscriptions in ancient Ceylon from
an accounting perspective is illustrated by the study of Kumarasinghe and Samkin (2018).
Advantages of Content Analysis
According to Krippendorff (1989) owing to its systematic treatment of data, content analysis technique is
capable of assisting the researchers to draw inferences that “go beyond the unaided understanding of a text”
16 Although this is counted as a strength, the need for inference making can pose practical challenges to the researcher. Steenkamp and Northcott (2007) explain several challenges. First, content analysis data are a result of the researcher’s chosen procedures, in order to answer particular research questions. Thus the data is “made, rather than discovered, by the researcher” (Steenkamp and Northcott, 2007, p. 13). Krippendorff (2004, p.81) posits that “data are always the products of chosen procedures and are always geared toward particular ends.” Second, although the value of content analysis lies in its ability to interpret the latent meanings of the data, the interpretation can be done in different ways. Therefore, researchers need to explicitly mention how they act to “make” and interpret the research data from the text. Finally, the meaning of a text is “inherently bound and determined by its context” (Steenkamp and Northcott, 2007, p. 13), thus the meaning of the text should be always interpreted relative to its context.

Chapter 4: Early Accounting Thought in Ancient Ceylon and the Prominent Role of Sociocultural Environment
56
(Krippendorff, 1989, p.404). Put differently, it helps the researchers to go behind the texts that are presented,
to make sound conjectures about hidden and possibly unintended meanings and messages (R. P. Weber,
1990). Therefore in the field of social sciences, where meanings and interpretations are pivotal in
understanding social phenomena (N. Steenkamp & Northcott, 2007), content analysis is acclaimed as
“possibly one of the most important research techniques in the social sciences” (Krippendorff, 1989, p.403;
2004, p. xviii).
He explains several uses of the content analysis technique, which are summarized below:
First, ordinary readers can be biased or change their perspective, as they read through a greater extent of
material. However, the content analysis technique ensures that all units of analysis receive equal attention.
Furthermore, the content analysis process is an objective process and thus it doesn’t matter who performs
the analysis.
Second, content analysis technique allows researchers to determine their own context for investigation, “thus
opening the door to a rich repertoire of social-scientific constructs by which texts may become meaningful in
ways that a culture may not be aware of” (Krippendorff, 1989, p.404).
Krippendorff (1989) states that the above two features together assist the researchers using content analysis,
to provide aggregate accounts of inferences from large volumes of data that uncover patterns, trends and
differences that are obscure to the untrained individual.
In addition, Carney (1972, as cited in Steenkamp, 2007), explains that the experience of content analysis
broadens the range of enquiries that can be probed by a researcher. Secondly, the researcher can be more
logical with minimal biases when making inferences. Finally, content analysis provides confidence over data,
or “sureness of facts” as presented by (Steenkamp, 2007, p.61) as content analysis fosters an investigative
frame of mind.
The study in hand also benefits from some of the advantages discussed above. For instance, the definitions
of content analysis enable the researchers to apply both qualitative and quantitative operations in making
inferences about the meanings of information communicated through the ancient rock inscriptions. The
researcher of this study operated with an investigative frame of mind, thus the results of this investigation
bestow “sureness of facts” about the presence of accounting practices and the underpinning of macro-
environmental factors, in ancient Ceylon.
Disadvantages of Content Analysis
One of the greatest challenges in content analysis is to find appropriate unobtrusive content pertinent to the
particular research question (Lune and Berg, 2017). This issue becomes more serious when the following
aspect is considered. For instance, Lune and Berg (2017) elucidate that due to the unobtrusive nature, the
researchers have to restrict their studies on material that, others have decided, were worth preserving.

Chapter 4: Early Accounting Thought in Ancient Ceylon and the Prominent Role of Sociocultural Environment
57
The research in hand relies on ancient rock inscriptions that are discovered, preserved and translated by the
researchers at the Department of Archaeology of Sri Lanka. A large number of the discovered inscriptions
are translated (about 85% as per Kumarasinghe and Samkin, 2018). Yet, a number of inscriptions may have
been damaged or may not have been translated due to various reasons, thus provide no useful meaning for
the purpose of this research. However, the research question in hand examines accounting practices that
prevailed in ancient Ceylon along with macro-environmental influences during that period and the sample of
rock inscriptions employed in the study offers abundant evidence to validate this.
Furthermore, the content analysis technique is often incapable of establishing a causal relationship between
variables (Lune and Berg, 2017). Thus both the researchers and the audiences should overcome the
temptation to derive such relationships, “unless the data collection has been particularly designed around
this relationship” (Lune and Berg, 2017, p.200) such as in the case of interviews.
4.3.3 Data-making Process
Krippendorff (1989, p.406) lays out a formal procedure that contains six steps, which is summarized in figure
4.1 below:
Figure 4.1: The Content Analysis Research Process
Source: Krippendorff (1989, p. 406)
This section discusses how the steps involved in the figure are applied in the present study.
Research Design
This is a conceptual phase, where the researchers should clearly define the research context, what they desire
to know and what are unable to be observed directly. The present study explores the early accounting
thought and practices that prevailed in Ceylon, during ancient times and the macro-environmental factors
that underpinned the same, with special reference to the role of culture. The study is predominantly based
on inscriptions that were used as a means of mass media by the Ceylonese kings. Most of the inscriptions are
royal edicts, while some are edicts by high dignitaries of the state. A negligible number of inscriptions were
Chapter 4: Early Accounting Thought in Ancient Ceylon and the Prominent Role of Sociocultural Environment
58
issued by private individuals or Buddhist monks. Nevertheless, all inscriptions provide first-hand information
on the political, economic, and sociocultural conditions that prevailed in ancient Ceylon.
A large number of inscriptions reveal the prevalence of accounting practices in monasteries and the
recordkeeping practices that prevailed in the royal household. Despite the epigraphic evidence on bazaars,
merchants and trade-guilds, detailed evidence pertaining to recordkeeping practices among merchants is not
available in the form of inscriptions. The possible reasons for the unavailability of such records can either be
because the affairs of merchants were not considered to have high social significance or the records were
destroyed after agreements were fulfilled (Gregory A. Liyanarachchi, 2009; Rahula, 1956).
Unitizing
During this phase, the researchers should define and identify the units of analysis, in the available data.
Unitizing effectively can be carried out at three levels, i.e. as sampling units, recording units and context units.
The sampling unit used in the study is inscriptions. Recording units are the things to be counted. However,
the present study adopts a semantic content analysis approach, thus the number and the type of words are
given less emphasis. Instead the researcher is more interested in what each inscription discloses and what
the content signifies with regard to the accounting practices and the socio-political or economic conditions
that prevailed. Finally, the context unit, most of the time is the entire inscription, as the inscription had to be
read entirely in order to comprehend the context. Several other historical records were also used to gather
independent corroborating evidence about the socio-political and economic environment that prevailed
during the aforementioned time period.
Sampling
Various sampling techniques are available to a researcher using content analysis as a research method, which
are random sampling, systematic sampling, stratified sampling, varying probability sampling, cluster
sampling, snowball sampling, convenience sampling and relevance sampling (Krippendorff, 2004). All these
sampling techniques, apart from relevance sampling, categorize texts according to their sources, time
periods, situations and so on, which can be done without considerable reading or analysis of the sampled
texts. However, relevance sampling, on the other hand, “aims at selecting all textual units that contribute to
answering given research questions” (Krippendorff, 2004, p. 119). Thus, the resulting sample is explained by
the research problem. Relevance sampling, therefore, is also known as purposive sampling17 (Krippendorff,
2004).
17 Relevance sampling is different from other sampling techniques in several ways. For instance, although random sampling infers that the researcher is clueless about the population of interest, this is highly unlikely in the context of content analysis. Cluster sampling recognizes that the universe of texts is split into large clusters and uses this knowledge. Snowball sampling assumes that the universe of texts is organized as a network. However, in relevance sampling, the researcher carries on only after actually studying the texts to be analyzed (even if only superficially), often in a multistage process (Krippendorff, 2004).

Chapter 4: Early Accounting Thought in Ancient Ceylon and the Prominent Role of Sociocultural Environment
59
The study in hand uses relevance sampling as the sampling technique. The researcher initiated by reading
related research work carried out in the same research site, based on ancient inscriptions[e.g. Liyanarachchi
(2009, 2015), Kumarasinghe and Samkin (2018)]. These studies emphasize on king’s charity and the collection
of taxes, rent and fines. Also, while reading other corroborating historical records, the researcher was able to
gain knowledge on several inscriptions that indicate the existence of certain types of taxes such as customs
taxes, police taxes, toll dues, water taxes in the ancient times. The researcher noted down the names of these
inscriptions and purchased the publications that contains the English translations of the said inscriptions from
the Department of Archaeology Sri Lanka. Mainly two publications, written by Paranavitana (1933) and
Ranawella (2004) contained all of the above selected inscriptions, which totals to 118 inscriptions.
Furthermore 5 other very relevant inscriptions were obtained from two other sources. All these translated
inscriptions were used for the purpose of this study, as all of them address certain elements of the given
research question. One inscription was excluded as the translators could not assign it to the reign of any
ancient Ceylonese king or to estimate its age based on palaeographic grounds. Thus finally, the study in hand
examines 122 inscriptions over the time period from the 1st century A.D. to the 16th century A.D., representing
the reigns of 32 kings over 7 different administrative capitals, or kingdoms, viz. Anuradhapura, Polonnaruwa,
Sigiriya (located in the North Central Province) Dambadeniya, Kurunegala (in the North Western Province)
Rayigama and Kotte (in the Western Province). Appendix A indicates the list of inscriptions used in this study.
Coding
This step involves describing the recording units and/or arranging them with respect to the categories of the
selected analytical constructs. Coding was done manually, by the researcher. Initially a list of pre-defined
classifying rules, related to the study in hand, was adopted, based on the prior work of Kumarasinghe and
Samkin (2018), in order to categorise data. These rules consist of identifying the following for each inscription:
The purpose of the inscription
time period
location of the inscription
The reigning king
Inscriptions with no time related information are excluded from the research sample18.
Coding categories and subcategories for the purpose of the present study have been mainly derived
inductively from the raw data. In addition, coding categories developed by Kumarasinghe and Samkin (2018)
were also referred to and some of these categories were slightly modified to fit into the present context and
used in the present study. For instance, the categories such as taxes/ rent/ fines, wages, expenses and
18 One such inscription discovered from the North Central Province, written on an oblong copper plaque, was excluded from the sample, as its translators could not assign it to the reign of any ancient Ceylonese king or to estimate its age based on paleographic grounds.

Chapter 4: Early Accounting Thought in Ancient Ceylon and the Prominent Role of Sociocultural Environment
60
administration and control were used in the present study with minor modifications, wherever necessary. All
categories and subcategories used in the study are indicated in table 4.1 below:
Table 4.1: Coding Categories and Sub-categories used in the Study
Kingship Accounting Temple Accounting
Taxes /rent / fines Temple administration
Wages Recordkeeping
Expenses
Treasury
Accounting profession
Administrative Decentralization Numerical Technology
Royal officers Land measurement
Village administration Grain and other measurement
Economic Activities King’s Piety
Agricultural officers King’s meritorious activities
Agricultural crops
Merchants
Prototype banks
Religious and Cultural Controls
Carvings of a dog and a crow “should this command be infringed by any,
they shall take upon themselves the sins
committed by a killer of cows at Mahavoti”
“will be born as crows and dogs, or as
village-pigs or the beasts of the hell”
“tormented by the fire of anguish called
remorse….”
Violators “shall take (upon themselves) the
sins committed by (all) the inhabitants of
the land”
“may they enter (..) hell…”
“may they not be able to see Mayittri
Buddha”
However as explained above, the present study adopts a semantic content analysis approach, thus the
number and the type of words are given less emphasis. Instead the researcher is more interested in what
each inscription details on above categories and what the content signifies with regard to the socio-political
or economic conditions that prevailed.

Chapter 4: Early Accounting Thought in Ancient Ceylon and the Prominent Role of Sociocultural Environment
61
Drawing inferences
This, according to Krippendorff (1989), is the most important step in the process and involves understanding
how the above coded data are related to the accounting practices and the underpinning support
infrastructure that prevailed in ancient Ceylon19. The study in hand makes inferences about the message
itself, i.e. the meanings conveyed through the texts. Further, how the message was presented, or precisely,
the fonts of the texts, styles, sizes and colours of the fonts were ignored. Inferences made out of the data are
detailed in section 4.4 – findings and discussion.
Validation
Inferences are validated based on prior research carried out in an international context and the limited
research carried out from a Sri Lankan context, in the findings and discussion section.
4.4 Findings and discussion
This section is organized under several headings. The first subsection presents preliminary findings and the
results of the coding process. The next subsection draws epigraphic evidence and discusses the latent content
pertaining to early accounting thought that were apparent in royal administrations and in Buddhist
monasteries, by means of recording, counting, valuing, quantifying objects / human activities and as a tool in
accomplishing notions of accountability practices. This is followed by a section that emphasizes on the control
environment, i.e. the political, economic environments and technological factors that underpinned
accounting thought. The last subsection underlines the role of sociocultural dynamics in influencing
accounting practices.
4.4.1 Preliminary Findings
This section focuses on the preliminary findings derived by the content analysis approach. The data for this
study is dependent upon 122 inscriptions. Apart from three inscriptions, the rest of them are lithic in nature20.
Figure 4.2 below portrays a spatial distribution of inscriptions. The contemporary Sri Lanka is divided into 9
major administrative provinces. Figure 4.2 indicates that inscriptions have been found from all of these
provinces. However, a majority of the inscriptions (71 out of a total of 122, approximately 58%) were located
19 Weber (1990) posits that inferences can be made about the sender of the message, the message itself or the audience of the message. If the inferences are made about the sender or the audience of the message, it is considered in the area of impression management. The present study does not intend to make inferences about the sender of the audience of any particular message, thus falls beyond the scope of impression management, although the sender or the audience of the message would be referred to time to time. 20 The three non-lithic inscriptions: Indikatusaya Copper plaques, Oruvala Sannasa and the Palkumbura Sannasa are written in oblong copper plates. Indikatusaya Copper plaque does not depict a royal edict; but a Buddhist text written in Sanskrit where the author is unknown. The other two inscriptions, Oruvala Sannasa and the Palkumbura Sannasa communicate an edict by the king, gifting land to two royal chaplains and a Buddhist monk respectively.

Chapter 4: Early Accounting Thought in Ancient Ceylon and the Prominent Role of Sociocultural Environment
62
from the North Central Province of the country. North Central province held the first administrative capital
of ancient Ceylon, i.e. the city of Anurādhapura, which lasted for approximately 1,300 years, accommodating
over 100 kings (Geiger, 1912). This was the longest period held by any administrative capital in ancient Ceylon.
Furthermore, this province is currently not densely populated, thus the preservation of most of the rock
inscriptions in their original historical sites have been relatively less complicated. These reasons justify the
placement of a majority of inscriptions in the North Central Province. In addition, one sample inscription has
been discovered in the boundary of the Northern Province and the North Central Province and two in the
boundary of North Western and North Central Province.

Chapter 4: Early Accounting Thought in Ancient Ceylon and the Prominent Role of Sociocultural Environment
63
Figure 4.2: Spatial Distribution of Inscriptions
Northern Province Central Province
North Central Province Sabaragamuwa Province
North Western Province Western Province
Eastern Province Uva Province
Southern Province
1
2

Chapter 4: Early Accounting Thought in Ancient Ceylon and the Prominent Role of Sociocultural Environment
64
The inscriptions were then categorized under the reign of different kings in figure 4.3.
Figure 4.3: Distribution of Inscriptions by King
The 122 inscriptions in the sample represents the reigns of 32 kings over 7 different administrative capitals,
or kingdoms, viz. Anuradhapura, Polonnaruwa, Sigiriya (located in the North Central Province) Dambadeniya,
Kurunegala (in the North Western Province) Rayigama and Kotte (in the Western Province). Figure 4.3 depicts
the number of inscriptions that have been identified under the reign of different kings. The highest number
of inscriptions represent the reign of King Dappula IV (924-935 A.D.) with 34 records. 19 inscriptions represent
the reigns of 19 different kings and is shown under the label “others” for brevity. The historians who have
translated the above inscriptions to English, have failed to clearly determine the reigns of 12 inscriptions
above, and is shown under the heading “inconclusive”.
The sample inscriptions were then categorized based on their purpose. After scrutinizing the 122 inscriptions
in the sample, 9 common themes were identified by the researcher, which are:
Administration of a village
Administration of justice
King’s charitable acts
Charitable acts by other individuals
Immunity grants
Gifts from the king for faithful royal service
Sets of ecclesiastical regulations agreed upon by the common consent of monks
Prototype banks
Other
Figure 4.4 below illustrates the distribution of analysed records, related to the different themes stated
above.
0 5 10 15 20 25 30 35
KING DAPPULA IV
OTHERS
KING UDAYA IV
KING MAHINDA IV
INCONCLUSIVE
KING SENA III
KING GAJABAHU I
KING UDAYA III
KING MAHADATHIKA MAHANAGA
KING SUBHA
KING SENA I
KING KASSAPA IV
KING DAPPULA V
34
19
18
13
12
6
3
3
2
2
2
2
2

Chapter 4: Early Accounting Thought in Ancient Ceylon and the Prominent Role of Sociocultural Environment
65
Figure 4.4: Inscriptions Analyzed by Purpose
It is evident from the above figure that the highest number of inscriptions in the sample are royal edicts by
the king that grant immunities, over certain land that are gifted to Buddhist temples, monasteries or even to
crown officials for their faithful service. The entrance to such lands, by revenue officers or other officials
representing the royal household, to collect taxes, rent or fines, is prohibited by the king. Such immunity
provisions even forbid the arrest of a person who enters the village after committing a murder. The murderer
could only be arrested outside the boundaries of the immune village (Rahula, 1956; Ranawella, 2004).
Eight inscriptions, were classified as “other” as they do not fall under any of the other broader themes and
contain two inscriptions with Buddhist texts written in Sanskrit and Pali languages; two inscriptions by King
Nissamkha Malla (1187-1196 A.D.) on maxims on politics and a homily to the inhabitants of a certain region,
not to be perfidious and disloyal; an inscription that records a monastery taking a certain quantity of paddy
from each sack, brought into the city; an inscription that relates to the social caste system that prevailed and
an inscription that records a pious wish of an individual to be the future Buddha;.
2%
12%
12%
13%
44%
3%6%
2% 6%
Administration of a village
Administration of justice
King’s charitable acts
Charitable acts by otherindividuals
Immunity grants
Gifts from the king for faithfulroyal service

Chapter 4: Early Accounting Thought in Ancient Ceylon and the Prominent Role of Sociocultural Environment
66
Figure 4.5: Temporal Distribution of Inscriptions
Figure 4.5 above, indicates that a majority of inscriptions represent the period from the 9th to 11th century.
Furthermore a bulk of the inscriptions from this period record immunity grants. Inscriptions during the 1st to
3rd centuries mostly record charitable acts made by the king and other individuals.
The table 4.2 below illustrates the results of the coding process. Seven categories, together with the
subcategories are indicated in the table. The number of inscriptions that documents each subcategory is
indicated in front. The below table illustrates that “taxes/rent/fines” is the most common theme among the
sample inscriptions, closely followed by the inscriptions on “royal officers”, with 70 and 57 inscriptions
respectively.
0
10
20
30
40
50
60
70
80
1 2 3 4 5 6 7 8 9 10 11 12 13 14 15 16
No
. of
Insc
rip
tio
ns
Century
Immunity grants
Charitable acts by otherindividuals
King’s charitable acts
Administration of justice
Administration of a village

Chapter 4: Early Accounting Thought in Ancient Ceylon and the Prominent Role of Sociocultural Environment
67
Table 4.2: Results of the Coding Process
Kingship Accounting Temple Accounting
Taxes /rent / fines 70 Temple administration 4
Wages 1 Recordkeeping 4
Expenses 2
Treasury 52
Accounting profession 3
Administrative Decentralization Numerical Technology
Royal officers 57 Land measurement 17
Village administration 19 Grain and other
measurement
5
Economic Activities King’s Piety
Agricultural officers 8 King’s meritorious
activities
14
Agricultural crops 16
Merchants 1
Prototype banks 3
Religious and Cultural Controls
Carvings of a dog and a
crow 54
“should this command
be infringed by any,
they shall take upon
themselves the sins
committed by a killer of
cows at Mahavoti”
7
“will be born as crows
and dogs, or as village-
pigs or the beasts of the
hell”
1
“tormented by the fire
of anguish called
remorse….”
1
Violators “shall take
(upon themselves) the
sins committed by (all)
the inhabitants of the
land”
4 “may they enter (..)
hell…” 1
“may they not be able to
see Mayittri Buddha” 1

Chapter 4: Early Accounting Thought in Ancient Ceylon and the Prominent Role of Sociocultural Environment
68
The next few sections comprehensively illustrate how the content of the inscriptions have been deciphered
to identify the aforementioned meanings.
4.4.2 Early Accounting Thought and Practices
Findings indicate the prevalence of kingship accounting practices and Buddhist Temple Accounting, in the
antiquity and are discussed below.
4.4.2.1 Kingship Accounting in Ancient Ceylon
This section focuses on kingship accounting practices that prevailed in ancient Ceylon, by emphasizing the
major elements identified by Jones (2009), which were evident in the English Exchequer accounting system.
The evidence pertaining to kingship accounting practices in Ceylon runs back to the Dark Ages (1st or 2nd
century A.D.) as substantiated by prehistoric epigraphs. The section discusses epigraphic evidence relating to
state revenue, state expenditure, the existence of two royal treasuries and the accounting profession.
However, importantly, similar to the English system as noted by Jones (2009), it is noteworthy to state that
there is no sufficient evidence to conclude on the existence of a fully-fledged system at any given period.
Instead, epigraphic evidence depicts the presence of many diverse kingship accounting practices during
different eras.
State Revenue - The existence of a sophisticated tax system
A glut of ancient inscriptions portray that the state revenue in ancient Ceylon was predominantly constituted
by the income generated through imposts (taxes) and other inflows such as fines and rent. A majority of the
ancient inscriptions illustrate the existence of a wide variety of taxes or imposts in the early society. Some of
them are discussed below.
Customs Tax
As Ceylon was located in a strategic location of the maritime “Silk Road”, it was a popular hub for trade
between the West and the East (Jayawardana, 1964). The island had many important ports around the
country and epigraphic evidence portrays that activities which resemble contemporary customs tax had
existed.
(i) Godavāya Rock Inscription
The earliest inscription which substantiates this claim is the rock inscription, which was found in Godawāya,
now a small fishing village in the seacoast in Hambanthota District, in the Southern part of the island. The
inscription contains two lines, where the first line is 6 feet and the second one is 1 foot 8 inches in length
(Paranavitana, 1983). The letters engraved are of varying heights, from 2 ½ inches to 6 inches. This inscription
dates back to the 1st or 2nd century, in which the king orders to grant the customs duties, collected at the port
to the nearby temple (Paranavitana, 1983). Paranavitana (1983) identifies the king as Gajabāhu I. The
particular inscription translated to English, reads as follows:

Chapter 4: Early Accounting Thought in Ancient Ceylon and the Prominent Role of Sociocultural Environment
69
“Success! The customs duties of the port of Godapavata, King Gāmani Abhaya granted to the
vihāra”. (Paranavitana, 1983, p.101)
Although the record indicates a donation made by the king to a religious institute (vihāra) in the locality, it
evinces the existence of a tax system at the port, which resembles contemporary customs tax activities.
(ii) Mannar Kacceri Pilar Inscription
This inscription is currently preserved at the Mannar Kacceri, in the Mannar District in the Northern Province
of the island. Paranavitana (1933) states that its original location is believed to be the site of one of the ancient
seaports of the island, known as Mahātittha.
Paranavitana (1933) provides the dimensions of the pillar inscription as 7.5 inches by 8 inches by 5 feet and
6 inches in height. He further describes that all the four sides of the pillar are inscribed, containing twenty-
seven lines of writing and a figure of a monk’s fan.
The inscription is dated “on the 10th day of the dark fortnight of the month of Mädindina (March-April) in the
twelfth year of King Siri Sangabo” (Paranavitana, 1933, p. 102) which is identified as the throne name of the
King Kassapa IV (circa 890 A.D. – 907 A.D.). The inscription details the immunities granted to three villages in
the northern coast that belong to a nearby meditation centre. The immunities granted are mostly in the form
of tax exemptions. An extract of the inscription that is translated to English points out that:
“Officers in charge of Mahaputu (i.e. Mahātittha) shall not enter.” (Paranavitana, 1933, p.105)
Paranavitana (1933) identifies “officers in charge of Mahaputu or Mahātittha” as some special officers in
charge of the important seaport of Mahātittha who were involved in collecting taxes from ports from ships
and other vessels, again, which is similar to present day customs tax.
Taxes over Land Consumption
Paranavitana (1933) explains that Mēlvāram is referred to the state share of the produce of the land, in South
India and posits that the term “melātsi”, “melātti”, “melāci” or “melācci” that appears in almost all
inscriptions in ancient Ceylon that promulgates immunities granted over certain villages or land, has a similar
meaning. He further elucidates that this word translates to “certain dues paid to the king or some other feudal
lord in recognition of his proprietorship over the land” (p.111). Some inscriptions that register the grant of
certain immunities, contain the word “melātsi” (or any of the above stated variants of the term) followed by
the word “noganna”, which means that the melātsi tax should not be levied.
(i) Kumbukvāva pillar inscription
This inscription is located in the Anuradhapura District – North Central Province of the island and dates back
to the first half of the 10th century, under the rule of King Dappula IV (circa 924-935 A.D.). It contains an
immunity grant in respect of a land that was granted to a prince named Kitti. The pillar measures 4 feet and
8 inches by 1 foot square (Ranawella, 2004).

Chapter 4: Early Accounting Thought in Ancient Ceylon and the Prominent Role of Sociocultural Environment
70
An extract of the inscription translated to English, recites as follows:
“… we have granted these immunities in respect of this village to the effect that the Mangiva,
Pegiva and Melātsi tax collectors attached to the royal household shall not enter this village..”
(Ranawella, 2004)
As explained above, the inscription prohibits the entry of Melātsi tax collectors to this particular village.
Further the terms, “mangiva –pegiva” or “magiva-pegiva” or “mangdiv – piyadiv”, although are appearing in
various forms in many inscriptions, is often used in the context of granting immunities, where the entry of
mangiva - pegiva officers are often prohibited to a village enjoying certain immunities. Therefore
Paranavitana (1933) suggests that mangiva –pegiva too are royal officers collecting various dues.
(ii) Velmilla Slab Inscription
The Velmilla slab inscription that was found in the Kalutara District, Western Province of the island reveals
interesting information in terms of taxes over land consumption. The inscription belongs to the reign of King
Sena III (circa 938 – 946 A.D.) during the 10th century. As per Ranawella (2004), “the stone is of irregular
dimensions…” with its “obverse face measuring 15 ¼ inches in breadth at the top and 16 ¼ inches towards
the base, whilst the corresponding measurements of the reverse face are 15 inches and 14 ½ inches
respectively. The thickness of the slab on its right side is 4 ½ inches towards the top and 7 inches at the base
and, on the left side, the thickness of 7 ½ inches at the top gradually diminishes to 6 ½ inches at the base”
(p.151). The stone is engraved in all four sides and the subject matter was to record the grant of certain
immunities, in respect of a rent payable land, that is assigned to an individual. An extract of the English
translation reads as follows:
“…. also the officials attached to the royal household shall not enter this land and collect ……,
but they shall collect them by being outside the boundaries of this land…….. Having enacted
the above regulations (we further ordered) that after having paid one hundred and fifty
kalandas of gold as Päl-mila to the Treasury, (he) shall collect as dues two hundred and fifty
kalandas of gold annually from the two harvests.” (Ranawella, 2004, p.156-157)
Ranawella (2004) is of the opinion that the Päl-mila described in the inscription could be a rent or a tax
collected from the dwellers of huts, as the term “Päl” is refereed to huts, even in contemporary Sinhala
language.
(iii) Thūpārāma slab inscription
On the other hand, the Thūpārāma slab inscription that belongs to King Gajabahu I, which dates back to as
far as the second century, not only reveals the disbursement of the king’s share of the harvest but also the
water rates, in ancient Ceylon. Paranavitana (1933) states that the inscription measures 6 feet 4 inches by 2
feet 10 inches, with seven lines of writing that uses Brāhmī alphabet. The inscription translates as: follows:

Chapter 4: Early Accounting Thought in Ancient Ceylon and the Prominent Role of Sociocultural Environment
71
“Hail! The great king Gamini Abaya, son of the great king Tisa and grandson of the great king
Vahaba, having poured water from the golden vase into the hand (of the donee), gave to the
community of monks at the Ratanaaraba monastery, the water rates (dakapati) and the royal
dues (bojaka-pati) of the Gonagiri-utavi, (situated) within the city, that they might enjoy the
four requisities. Na…. the accountant of the city gave in exchange the water rates of the
Nakaravavi (tank)”. (Paranavitana, 1933, p.116)
Based on etymological considerations and the context in which the word is used, Paranavitana (1933)
identifies the word “bojaka-pati” as the king’s share. The inscription also talks about “water rates” (dakapati)
and an “accountant”, which will be discussed over the next few sections.
Imposts on Irrigation
The Rajarata Kingdom (modern day North-Central Province in Sri Lanka), which is known to be the first
kingdom of the island (Paranavitana, 1933), was situated in the dry zone of the country and its inhabitants
were completely reliant on irrigation for their main livelihood; agriculture. Therefore, they have constructed
irrigation works since ancient times, and various forms of imposts levied on irrigation systems was one of
the main sources of income to the crown.
Abeywardana, Bebermeier and Schütt (2018) identify various forms of imposts that were collected over
irrigation in ancient times, viz. king’s income from tanks, the revenue of the lands irrigated by tanks, water
tax/revenues from tanks, dues from the dams of canals, share of the fish caught in the channels, revenue
from the tract of fields of tanks/canals and so on. These terms, some which have overlapping meanings, have
been used simultaneoulsy in various inscriptions. Some inscriptions that exemplify these forms of taxes are
indicated below:
(i) Minvila Rock Inscription
The inscription belongs to the 2nd century and Paranavitana (1983) identifies, though not conclusively, King
Gajabahu I as the ruling king during this period. The English translation of the inscription, which was found in
the Polonnaruwa District – North Central Province of the Island, reads as follows:
“Success! The great King Gāmani Abhaya, the conqueror in battle, granted the revenue from
the village at the royal channel to the Maniyagiya Monastery” (Paranavitana, 1983, p.102).
(ii) Mōlāhitiyavelēgala Inscription No. 1
This inscription was found in Polonnaruwa District, in the North Central Province of the island and is identified
as established by King Bhātika Abhaya (circa 38-66 A.D.). The translation of the inscription is as follows:
“Hail! King Abhaya, eldest son of King Kutakana and grandson of the great King Devanapiya Tisa, dedicated
with the golden vase (i.e. having poured water into the hands of the donee with a golden vase), the canal of

Chapter 4: Early Accounting Thought in Ancient Ceylon and the Prominent Role of Sociocultural Environment
72
Gana..taka21 in the Ataragaga (country) to the monks (residing) in the Pilipavata Monastery” (Paranavitana,
1933, p. 154)
(iii) Mōlāhitiyavelēgala Inscription No. 2
This inscription is identified as belonging to the reign of King Mahādāthika - Mahānāga (circa 67-79
A.D.), younger brother of King Bhātika Abhaya, who was identified with the previous inscription. The
current inscription was also found in the Polonnaruwa District, North Central province of the country.
The translation of the inscription reads as follows:
“The great King Nāka (P. Nāga) gave to the community” (Paranavitana, 1933, p.155)
(iv) Pahala Kayinattama Rock Inscription
This inscription too was found in the North Central Province of the island and is believed to be
established during the reign of King Subha (circa 118-124 A.D.). The translation of the same reads as
follows:
“Hail! King Sabha gave to the congregation of monks at the Ekdorayaya monastery”
(Paranavitana, 1933, p.162)
The first inscription out of the above four, explicitly mentions that the revenue from a particular canal is
offered to a monastery that is in the locality. Although the last two inscriptions do not specify the object of the
grant, as the inscriptions are situated in the embankment of two different tanks, it is obvious that the grant
was the tank or more specifically, the revenue from the tank (Paranavitana, 1933).
In addition, the Thūpārāma slab inscription, as explained above, indicates that water rates (dakapati) are
bestowed to the community of monks at the Ratanaaraba monastery. All these inscriptions validate the
existence of a system of taxation and imposts over the consumption of water in the ancient Ceylon.
Police Tax, Toll Dues and Various Other Taxes
In addition to the above, a more sophisticated means of imposing taxes was depicted in the Badulla
(Horabora) pillar inscription. This inscription which belonged to the 10th century A.D. during the reign of King
Udaya IV (circa 946-954 A.D.), reveals detailed information on local administration, administration of justice
and the economic conditions of ancient Ceylon. It is a royal edict issued by the king concerning the
administration of a bazaar. Ranawella (2004) states that, it is 9 feet and 7 inches tall, with the writing covering
all 4 sides of the pillar. Few extracts of the inscription, translated to English, state the following:
21 The name of the canal is partly obliterated (Paranavitana, 1933)

Chapter 4: Early Accounting Thought in Ancient Ceylon and the Prominent Role of Sociocultural Environment
73
“(…) Rat-daga shall not be exacted while being in the village. (……..) One’s own share (of
produce) accrued from religious endowments among the allotments of leased holdings shall
be taken only after paying the rent due to be paid to the religious establishment concerned in
accordance with the former custom; other than this practice, nothing contrary to custom shall
be done. (….) Toll dues shall not be levied on goods which are transported through the village
unless they are sold within. In the case of selling undeclared goods, double toll dues shall be
levied without causing disturbances. (……….) Goods that are liable to toll dues shall not be sold
by being at unauthorized places. (…..) After having procured the minor taxes, Alūmada and
river-tax from Māvutiya, they shall be remitted (to the Treasury).” (Ranawella, 2004, p.172)
This inscription refers to several categories of taxes, dues or imposts which existed such as rat-daga or rat-
daha, kusalān-kuli, sutvat, sin-kiravu, and ho-kara. These early Sinhalese terms are translated to English, by
Ranawella (2004) as follows:
Rat-daga or rat-daha is translated as a police tax, which is payable to a local chieftain or a powerful official in
return for protecting life and property in a particular area. Ranawella explains that this is very similar to that
of pādikaval kuli imposed by village councils in South India, during the 10th and 11th centuries. The kusalān-
kuli denotes some kind of dues exacted from lands endowed to religious institutions. In addition, toll dues
levied on various roads, and seemingly located at the boundaries of a village, are referred as sutvat. Sin-kiravu
is explained as other minor taxes and ho-kara is a river tax (Ranawella, 2004). Ranawella (2004) further
explains that the river tax is also referred to in the Kautilya’s Arthasāstra, an Indian treatise which was
assumed to be studied and consulted by Ceylonese kings (Paranavitana, 1933).
State Expenditure
The sample inscriptions mostly reveal the sources of state revenue in ancient Ceylon. However, the current
section discusses on possible state expenditure during ancient times. Based on historical records, during the
kingdom of Kandy (1419 – 1815 A.D.) and during the early stages of the British colonial rule, management of
services was mostly based on a compulsory labour system (Abeywardana et al., 2018; Abhayawardhana,
2009; Wickramasinghe & Hopper, 2005), which was known as “rājakāriya” (Abhayawardhana, 2009;
Abeywardana, Bebermeier and Schutt, 2018). The ownership of all land in the country was vested with the
crown, thus the subjects had to recompense the king for consuming the land (Abhayawardhana, 2009).
However, during the early periods, the labour may not have been always free as evinced by several lithic
inscriptions. Several inscriptions in the sample and other historical records shown below, hint about what
would have been state expenditure in the ancient times.
State Expenditure on Warfare
Ancient societies may have been less complicated in terms of the fiscal policy. Yet maintenance of a large
army was crucial for ancient societies, in order to protect their own territory from invaders and to capture
other territories of opponents. Thus, royalty was required to recruit troops, train and equip them with arms

Chapter 4: Early Accounting Thought in Ancient Ceylon and the Prominent Role of Sociocultural Environment
74
and to provide them means of support. The case was no different, even in ancient Ceylon, as portrayed by
following historical evidence:
First, although the island was free from European conquests until the 16th Century, the great chronicle
Mahavamsa explicates that the island was subject to invasions from India, several times. For example, one
such instance was the Cōla (or Chōla) invasion22 that happened during the reign of King Udaya IV (circa 946-
954 A.D.)(Geiger, 1912). Second, ancient Ceylonese kings, every so often, faced rebellion, and Mahavamsa
portrays a situation where King Mahinda IV had to face a minor upheaval in the country, which he successfully
suppressed (Geiger, 1912). Third, during certain time periods, the island was ruled by several regional kings,
not a single ruler. Thus regional kings, often declared wars between each other, to subjugate other regions
and finally to acquire the power of the entire country. The Rambäva slab inscription evinces an occasion
where King Mahinda IV had conquered the Province of Ruhuna (Sourthern Province in contemporary Sri
Lanka), which, translated to English, states:
“ (…) (The great King Sirisañgbo Abhā) built a golden image of the Buddha, which is equal to
that of his own size, at Bulatulā-vehera in the Province of Ruhuna that he had conquered by
his valour (..)” ( Ranawella, 2004, p.229)
Sirisañgbo Abhā is identified as the throne name of King Mahinda IV (Ranawella, 2004). In light of the above,
it can be assumed beyond reasonable doubt that the ancient Ceylonese kings too always maintained large
troops to safeguard their territories.
Interestingly, some historical evidence reveal that these troops provided a paid service to the crown. For
instance, Ranawella (2004) elucidates an event that occurred during the reign of King Mahinda V (circa 982
– 1029), who was considered to have a weak character. During this period, as the peasantry refused to pay
their mandatory taxes, the king was unable to pay his army. Thus, the army mutinied and in his 10th regnal
year, the king fled to Ruhuna (Southern Province), to escape their wrath and spend 26 years, administering
only that part of the island.
State Expenditure on Irrigation
The traditional Ceylonese society was built upon three major pillars, viz. an agricultural economy, feudalism
and a Sinhalese-Buddhist ideology (Kepferer, 1987 cited in Wickramasinghe and Hopper, 2005). The ancient
Rajarata Kingdom (modern day North-Central Province in Sri Lanka), which is known to be the first distinct
kingdom and the longest held administrative centre of the island (Paranavitana, 1933), was situated in the
dry zone of the country, where the mean annual precipitation is about 1750 mm, concentrated within a few
months of the year, and with a noticeable dry period during the summer months of the year (Abeywardana,
22 Cholas were one of the longest ruling dynasties in southern India, of which the reign began in the 9th Century. However the Chola kingdom, in the state Andra was thriving even during the 2nd century but the medieval period is believed to be the era of absolute power and development of the Chola dynasty (Chandwani, 2019).

Chapter 4: Early Accounting Thought in Ancient Ceylon and the Prominent Role of Sociocultural Environment
75
Bebermeier and Schutt, 2018). Hence the dwellers of the dry zone were completely reliant on irrigation for
their main livelihood, agriculture. Thus from ancient times, the inhabitants of the island constructed
irrigation works and according to Gunawardana (1971), the dry-zone water harvesting and management
system of the Rajarata Kingdom is one of the oldest recorded systems in the world. Importantly, some
historical records depict that payments had been done for labour in constructing irrigation works.
For instance, the Vihāregala Rock Inscription that was found in the North Central Province, measures about
7 feet by 2 feet 5 inches (Paranavitana, 1933). Paranavitana (1933) further says that the inscription belongs
to King Subha (circa 118-124 A.D.) also known as King Saba, which contains four lines written in Brāhmi
alphabet of the 1st and 2nd centuries A.D. The English translation of the inscription states the following:
“Hail! King Saba constructed the Sabbath-hall at the Ekadorika Monastery; and, having bought
the Upaladonika tank for five hundred (pieces of money) and having removed the silt by
(spending another) five hundred, gave the same to the confraternity of monks” (Paranavitana,
1933, p.165)
The inscription does not provide information about the seller of the tank to King Subha. Furthermore, it does
not reveal what the unit of money was. However, it explicitly states that the King had to spend five hundred
on a certain unit of money, to remove the silt, inferring that labour was paid for, during this ancient period.
In addition, Ätākada pillar inscription found in the Anuradhapura District (North-Central Province), belonging
to the first half of the 10th century under the reign of King Udaya III discusses about the officials in charge of
the five Departments of Works. Ranawella (2004) posits that Abhidānappadīpīkā23 has recorded these five
types of workers as tacchaka (carpenters), tantavāya (weavers), rajaka (dyers or washermen), nahāpita
(barbers) and cammakāra (tanners). Hence the reference to officials in charge of the five Departments of
Works in the Ätākada pillar inscription, implies that the labour in ancient Ceylon was systematically
administered and organized under five departments headed by Royal Officials. However the inscriptions in
the sample do not provide any evidence of such labour being paid.
King’s Expenditure on Pious Activities
Historical chronicles and ancient inscriptions provide abundant evidence to fathom information about the
patronage of kings for Buddhism. Upon the arrival of Buddhism to Sri Lanka, it received royal patronage at all
times by the ruling king. This section mainly emphasizes on a few lithic inscriptions that reveal kings’
meritorious activities, which would have undoubtedly consumed a substantial amount of resources from the
state treasury.
23 The ancient manuscript Abhidānappadīpīkā or Dictionary of the Pali Language was written by Moggallana Thero and published by Henry Herbert in 1865

Chapter 4: Early Accounting Thought in Ancient Ceylon and the Prominent Role of Sociocultural Environment
76
Inscriptions on the Stone Canoe within the Citadel, Anuradhapura
Three inscriptions have been found in a site with ancient ruins in the Anuradhapura citadel (North-Central
Province) that, based on palaeography, is believed to belong to the 10th century. The English translations of
two of them are depicted below:
(i) Inscription No. 1
“We, all of us who receive rations at this Mahāpāli, have given our shares of rice for the new
works being carried on at the stūpa of the Jētavana monastery. Those who violate this shall
take (upon themselves) the sins committed by (all) the inhabitants of the land. (They also) shall
incur the sins committed by a killer of goats at Mahavutu (Mahātittha)” (Paranavitana, 1933,
p. 133)
(ii) Inscription No. 2
“To this Mahāpāli shall be taken at the rate of one pata (Sanskrit prastha) of paddy from each
sack brought into the city; the kuli being not levied” (Paranavitana, 1933, p. 133).
Both these inscriptions record a place called Mahāpāli, which Paranavitana (1933) identifies as a refectory
or a kitchen. Based on historic evidence, Paranavitana (1933) discusses that a large kitchen had existed by
the side of the king’s palace, in which 8000 monks were provided with food on a daily basis. He further
stresses that this charitable practice was established by the king ever since Buddhism was introduced to the
island and his successors have passed on the tradition from one generation to another. Thus it can be
reasonably assumed that this endeavour consumed a substantial amount of resources in the state treasury.24
In support of this argument, two more inscriptions that record the meritorious acts carried out by the ruling
king are explained below:
(iii) Rambäva slab inscription
This inscription belongs to the period of the pious King Mahinda IV in the 10th century and was found in the
Anuradapura District (North-Central Province). Although the purpose of the edict was to record the grant of
24 Paranavitana (1933) finds the first inscription interesting, as usually, a large majority of the Ceylonese ancient records, documents gifts or donations made by the laity for the clergy. However the above first inscription records a donation in kind, made by the monks to one of their shrines, or put differently an act of altruism by the monks. Paranavitana (1933) believes that this inscription may have been established after the reign of King Mahinda IV (as the period preceding King Mahinda IV is not warranted based on paleographic grounds) for two reasons: First, King Mahinda IV is widely held as a pious king, thus he wouldn’t have allowed such an act on the part of the monks (Paranavitana, 1933). Second, Paranavitana (1933), based on historical evidence, points out that the Jētavana monastery, an expensive exertion that were initiated during the reign of King Mahinda IV, was not continued by his weak successors mainly due to the unavailability of funds.

Chapter 4: Early Accounting Thought in Ancient Ceylon and the Prominent Role of Sociocultural Environment
77
some land to the wife and the children of a high dignitary, the preamble of the record provides a brief
panegyric account of the king and his meritorious deeds. An English translated extract of the inscription is as
follows:
“(…) he caused the restoration of all the ruined stūpas25 of the Tissārāma Fraternity making
them look like the Cūlāmani Stūpa, also restored all the stūpas attached to the magnificent
Jētavana Mahā-vihāra (Dena Mahavehera); (….) (he) adorned the summits of the Sun flag-posts
at the four pavilions of the Hivala Monastery with golden canopies, also caused the eyes of the
colossal auspicious stone image (of the Buddha) at the Abhayagiri vihāra to be set with blue
sapphires, which were inherited by the (royal) family; built a golden image of the Buddha,
which is equal to that of his own size..” (Ranawella, 2004, p. 229)
(iv) Jētavanäräma Slab Inscription No.1
Two rock inscriptions have been found in the same site in Abhayagiriya, Anuradhapura District that belong
to the 10th century, under the reign of King Mahinda IV. The first one of the inscriptions, which is more
relevant to the current discussion, is rather long with 55 lines of writing. Thus a few lines, translated in
English are presented here:
“(……) he repaired the roof, thirty-five cubits in length, of the Mahāpasāda named Kasub-rad,
built the Pusarba-pasāda, erected large halls of requisites on either sides of Yata-bahila, which
was attached to the alms-hall set apart for providing the requisites for the great community of
monks, and repaired the Vihāras.. (…) He caused to be set with rubies the eyes of the Great
Samadhi stone image which displayed the grace of …. He built at ….. the great alms-hall
(named) Purimālā and rebuilt the Nun’s alms-hall….” (Ranawella, 2004, p.252)
Just like in the first inscription above, the second too records a list of pious acts performed by King Mahinda
IV. Mahāpasāda named Kasub-rad, Pusarba-pasāda, Yata-bahila and Purimālā that appears in the second
inscription are all Buddhist monasteries and temples (Ranawella, 2004).
25 A Buddhist shrine that has a shape of a dome.

Chapter 4: Early Accounting Thought in Ancient Ceylon and the Prominent Role of Sociocultural Environment
78
State Treasury
The existence of a sophisticated tax system, along with significant state expenditure as illustrated above,
inherently outlines the requirement of a state treasury to coordinate fiscal administration. Unsurprisingly,
almost all the sample inscriptions that signify an immunity grant, explicitly refers to “deruvanä”, that is
translated as the officials of the two treasuries26.
Paranavitana (1933), based on archaeological records, provides several explanations for the existence of two
treasuries. First, he believes that there were two treasuries belonging to the king: one within the fort and the
other one at the extreme boundary of the kingdom, mainly for security purposes. According to Paranavitana
(1933) this has been a practice since ancient times, as Kautilya has instructed the Indian kings to possess two
treasuries in his treatise “Arthashastra”27.
Accounting Profession
The above sections illustrate several possible sources of revenue and expenditure for the crown and the
existence of a royal treasury, in the ancient period. The present section is dedicated to analyse rock
inscriptions that refer to the accounting profession. The previously discussed Thupārama Slab Inscription,
refers to an accountant in relation to granting water rates to a monastery. The other two inscriptions
discussed below refer to an accountant operating in a temple and the royal treasury respectively. However,
no detailed information is provided on the exact nature of the functions that would have been carried out
by the accountants in the ancient period.
(i) Thupārama Slab Inscription
The Thupārama Slab Inscription dates back to as far as the 2nd century, under the reign of King Gajabahu I
(circa 171-193 A.D.). It refers to a “Nakara-ganaka” which Paranavitana (1933) translates as a “city-
accountant”. An extract of the inscription reads out as follows:
“(…) the accountant of the city gave in exchange the water rates of the Nakaravavi (tank)”
(Paranavitana, 1933, p.116).
26 Precisely, these inscriptions have prohibited the entry of the officials of the two treasuries to the land that immunity has been granted, for the purpose of levying taxes or other imposts.
27 Alternatively, based on epigraphic evidence, Paranavitana (1933) elucidates that the two royal treasuries may have consisted of one treasury with funds for the king’s private use, or in modern terms “the privy purse” (p.144) and the other one containing funds for public services. Paranavitana (1933) renders a third explanation, where he states that the treasury may have been organized under two principal heads, one for state revenue and the other for state expenditure.

Chapter 4: Early Accounting Thought in Ancient Ceylon and the Prominent Role of Sociocultural Environment
79
This inscription explicitly mentions about a city accountant associated with the term water rates, which may
imply that “nakara-ganaka” in this context was a certain kind of officer who was involved in calculating water
rates.
(ii) Badulla (Horabora) Pillar Inscription
Badulla inscription in the 10th Century (previously discussed), refers to the term “ulvādu kanakkar”.
Paranavitana (1933) deciphers the term ulvādu as some officials connected with the temple. He explains the
term kanakkar, possibly derived from the term “ganaka” above, as an accountant. Thus the whole compound
“ulvādu kanakkar”, as per Paranavitana (1933), refers to “the accountants in charge of the temporalities
belonging to a religious establishment” (p.95).
(iii) An Inscription of Nissamka Malla
This inscription was found in the Polonnaruwa District, North-Central Province of the country and is identified
to be promulgated by King Nissamka Malla (circa 1187-1196 A.D.). The inscription measures about 6 ½ feet
by 1 ¼ feet by 6 inches, written in Sinhalese language. The inscription records a royal edict, which was issued
because the king had become suspicious about the integrity of the accountants of the treasury. The content
of the inscription is interesting in terms of the controls mentioned by the king in the inscription, thus will be
discussed in detail in a later section. The king advises the accountants that if they are in need of anything,
they can take the same, after duly informing the authorities. An extract of the inscription, translated to
English, states the following:
“(…) it is not becoming to create discord by taking others’ properties, like fishes who …. each
other in the water. Not being given to indolence and understanding (the details) of the income
and expenditure the preparation of accounts should be done. And there should be no
association with others” (Paranavitana, 1933, p. 152).
Summing up, the above discussion illustrates the epigraphic evidence on various income sources and the
most significant expenditure, in relation to the crown. Furthermore, abundant epigraphic evidence are
available to indicate the existence of a state treasury and a profession that was known as “ganaka”. Although
the epigraphists have translated this term as “accountant” in English, there is no evidence to substantiate
that such “ganakas” have carried out the functions of a contemporary accountant. Rather, these preliminary
accountants may have been involved in counting and recordkeeping.
The evidence at hand, only indicates the existence of dispersed constituents of an accounting system, such
as income, expenditure, treasury and the accounting profession. Therefore, the researcher is cautious when
interpreting the results. It appears that accounting was used as a technology for naming, counting and
valuing objects, pertaining to the crown in ancient Ceylon, similar to that indicated by Ezzamel and Hoskin 's
(2002), in their work on Mesopotamia and ancient Egypt.
Nevertheless, the inscription by King Nissamka Malla (mentioned above) signifies that accountants or the
officers attached to the royal treasury must have been involved in keeping record of king’s wealth. Hence,

Chapter 4: Early Accounting Thought in Ancient Ceylon and the Prominent Role of Sociocultural Environment
80
this particular inscription signifies the role of accounting practices in the processes of ancient accountability.
Carmona and Ezzamel (2007) present an elementary explanation for ancient accountability practices as
“rendering an account to others as well as to oneself” (p.179). The inscription of King Nissamka Malla, indeed,
reflects that the royal officers were expected to keep records to fulfil their accountability towards the king.
4.4.2.2 Buddhist Temple Accounting in Ancient Ceylon
This section provides epigraphic evidence pertaining to a simple system of accounting that had taken place
in ancient Buddhist monasteries.
(i) Jētavanäräma Slab Inscription No.2
As stated above, two inscriptions have been found in the same archaeological site in the Anuradhapura
District (North-Central Province) and the 1st inscription has already been discussed above, under king’s
expenditure on pious activities.
The present inscription too is identified as a royal edict by King Mahinda IV in the 10th century. The slab
inscription measures 8 feet by 3 feet and 3 inches and contains sixty lines. It primarily contains some
regulations concerning the administration of monasteries that had been instituted at the Abhayagiri vihara,
by the king.
It orders the following:
“(….) Annually the monks of the six āvāsas shall be convened, when the royal officials and the
monastic officials shall read out in the presence of the community of monks the records kept
at the aforementioned places, indicating how the income has been derived and the expenses
were incurred, how the wages had been paid to the servants, and how the tithe tenures had
been assigned. Should any dispute arise with regard to these matters, the high dignitaries of
the Court of Justice shall sit in session and settle that dispute” (Ranawella, 2004, p. 257)
(ii) Dambēgoda Pillar Inscription
This inscription was found in the Monarāgala District (Ūva Province) and belongs to the reign of King Mahinda
IV, in the second half of the 10th century (Ranawella, 2004). This inscription contains an edict issued by the
king along with the common consent of the monks at the Mahāvihāra monastery. This inscription too
provides guidance on recording monastic income and expenditure and requires the records to be read out in
public, to improve transparency. An extract, translated to English, is as follows:
“(…) Records of income and expenditure of the (above mentioned places) should be
maintained, detailing how the incomes due to those places had been collected, and the details
of the expenses, such as the wages paid to the servants (attached to those places), the balance
(of income) left after expenditure, should be retained as non-transferable goods, but (it)
should not be given away in exchange (for other goods). After having assembled the monks
(concerned) annually and causing the monastery officials and the royal officials to be present

Chapter 4: Early Accounting Thought in Ancient Ceylon and the Prominent Role of Sociocultural Environment
81
there, the records pertaining to taxes should be read in the midst of those monks; should there
be any dispute the lords of the Court of Justice shall sit (in session) and settle it” (Ranawella,
2004, p. 267)
(iii) Mihintalē Slab Inscription
This inscription too is identified as promulgated during the reign of King Mahinda IV in the 10th century, in
order to record a set of regulations concerning the administration of the Sāgiriya Monastery. An extract,
translated to English, reads as follows:
“(…) Other than the revenue derived from the lands, which are given to the employees as
maintenance lands, all the other revenues derived from all the places in the villages and from
the lands belonging to this monastery, shall be entered in the register bona fide with the
concurrence of the officials of the Office.
Whatever is spent daily on the maintenance of the Main refectory, on employees, and on the
renovation works shall be entered in the register and a statement of accounts shall be made
with the concurrence of the Office Staff, and those who ought to be signed them shall place
their signatures there and then those sheets of accounts shall be placed in a casket under lock
(and key). Every month the account sheets (so deposited) shall be made public and a full
statement of accounts shall be prepared from them. From the twelve statements of accounts
(so prepared) during the year, a balance shall be compiled at the end of each year, which shall
be read out in the midst of the community of monks and be thus finally disposed of. The houses
of the officials who infringe these regulations shall be confiscated and they shall be dismissed
from the service” (Ranawella, 2004, p. 282)
Elsewhere in the inscription, office-staff have been identified as “the monk who looks after the fraternity, the
warden of the monastery, the chief administrator, the revenue officer, the almoner, the clerk of the
monastery, the registrar of the caskets” (Ranawella, 2004, p. 280) and they are required to work in
conjunction with the monks of the two fraternities at the Abhayagiri monastery, who have come to assist
them. Together they are required to “attend to the matters concerning the income and expenditure etc. (of
the monastery), both inside and outside” (Ranawella, 2004, p. 280). Transparency, which is of paramount
importance in handling monastic funds, is safeguarded by having more than one or few people engaged in
recordkeeping.
In a nutshell, the above inscriptions may imply that notions of systematic recordkeeping, sound internal
control (for instance, the need to have more than one person to perform accounting tasks), accountability
and their relevance to organizational administration were well-established in Ancient Ceylon.
Under kingship accounting practices, in section 4.4.2.1, accounting practices were predominantly identified
as a means of naming, counting and valuing objects. However, the three inscriptions above, reveal further
information on maintaining proper records on inflows and outflows of monastic resources, implying that the

Chapter 4: Early Accounting Thought in Ancient Ceylon and the Prominent Role of Sociocultural Environment
82
ancients possessed the important knowledge of classifying transactions as income and expenditure. The
Dambēgoda and Mihintalē inscriptions in particular, discuss calculating the balance of income, left after
expenses. Thus Liyanarachchi (2015) advocates that despite its simplicity, the conceptual underpinnings are
rich, as the knowledge of revenues, expenses and the calculation of net income is adequate for one to
compute the outcome of a particular economic activity. Furthermore, the knowledge of ancients, regarding
days, weeks and months have enabled them to prepare periodic accounting records, which is explicitly
detailed in the Mihintalē inscription. These conceptions constitute basic, yet essential foundations of modern
accounting thought.
Dambēgoda inscription explicates that the balance of income should be retained as non-transferable goods
because, Buddhist monks were prohibited to engage in endeavours with profit motive. This fact is explained
in more detail in section 4.4.4 – Sociocultural Influences, below.
Another remarkable feature is the requirement to read out the records in an assembly. Jētavanäräma and
Dambēgoda inscriptions denote that records should be read out aloud in front of the community of monks,
the court of justice, monastery officials and royal officials. Mihintalē inscription explicitly mentions about
“office staff” who appear to be a group of monks and lay officials as specified above. This activity evinces that
accounting practices had also played a role in facilitating ancient accountability practices. However, it is
important to note that this study does not attempt to extend the contemporary notions of accountability to
ancient Ceylon. Instead, similar to Carmona and Ezzamel (2007), the term “accountability” is used to identify
“the act of one institution or individual rendering an account to another, be that the state, a superior or an
individual of an equivalent standing” (p.195). They further propose a framework of accountability comprising
of three levels, i.e. hierarchical, horizontal and self. Hierarchical accountability involves superiors and
subordinates, whereas horizontal accountability represents “two sides outside formal power structures”
(Carmona and Ezzamel, 2007). Finally, accountability towards self involves rendering an account to one’s self,
underlining notions of morality. This aspect is not illustrated by the evidence at hand of the present study.
Instead, the evidence suggests that accountability was rather flowing upwards in a hierarchical setting. Yet
there is no epigraphic evidence in ancient Ceylon that pronounces that Buddhist monks were accountable
towards the king. Instead the influence of Buddhist monks on the king was immense. For instance, it was
widely accepted that the king of the state should be the official protector of Buddhism. The king had a close
relationship with the chief monks in a monastery and historic evidence suggests that at times the monks have
provided advice to the king with regard to ruling the state. Also the common belief of the Ceylonese was that
the ruler of the island should be the custodian of the sacred tooth relic of Buddha (Sri Dalada Maligawa
Temple of the Sacred Tooth Relic, 2019). No ruler who was not the custodian of the tooth relic could be
considered as the king. The above portrays the power of the Buddhist monks and strong influence of
Buddhism and Buddhist monks which was exerted over the crown. This influence of Buddhist cultural values
and the monks on the kingship is further explained under section 4.4.4 – Sociocultural Influences.
Nevertheless, the above inscriptions were promulgated by the king, and the monks are expected to obey the
same. Also, it appears that some of these assemblies of monks were attended by royal officials. Thus, although
not explicitly stated in historical records, it can be implied that monks were accountable towards the crown in

Chapter 4: Early Accounting Thought in Ancient Ceylon and the Prominent Role of Sociocultural Environment
83
a subtle way. Moreover, accounts being read out publicly, in front of the other monks in the monastery displays
a horizontal form of accountability. Therefore, in a Ceylonese context, rather than defining formal channels of
accountability, the interpretation of Liyanarachchi (2009) appears to be more relevant. He posits that
accounting for accountability was mostly required to maintain the reputation of the monastery and its
members and to safeguard the goodwill among the monks, rulers and people.
4.4.3 Control Environment
As mentioned previously, Jones (2010) identified a few types of infrastructure that may have contributed
towards the establishment and sustenance of the kingship accounting system, in Britain. These are the
general infrastructure (feudalism), monetary infrastructure (coinage), technological infrastructure (literary
and numerical skills) and logistical infrastructure (efficient communication and transportation network).
In a similar vein, the next few sections will discuss the support infrastructure or the macro-environment that
underpinned the accounting practices in ancient Ceylon. The relationships between the control environment
and the early accounting thought, are presented below in an illustration (figure 4.6), which provides the
framework for the subsequent discussion.
Figure 4.6 embeds the ancient accounting thought and practices in the larger control environment that
encapsulates the political, economic and technological influences. As per epigraphic evidence, the
sociocultural landscape, grounded in Buddhism, appear to have influenced the ancient accounting practices
both directly and indirectly (via its effect on the control environment).
However, it should be noted that this study does not intend to conclude on the effect of such influences on
the advent of accounting practices. Rather it attempts to contextualize the ancient accounting thought and
activities, in a broader socio-economic setting.

Chapter 4: Early Accounting Thought in Ancient Ceylon and the Prominent Role of Sociocultural Environment
84
Figure 4.6: A Framework for the Study on Accounting Practices in Ancient Ceylon and the Control
Environment, with special reference to Sociocultural Factors
4.4.3.1 Political Environment - Feudalism and the Need for Establishing Accountability towards Kingship
Until 1815, when the entire Sri Lanka became a colony under the British rule, the ancient society was
governed by the king (Geiger, 1912). The state was territorially centralized in ancient Ceylon (Geiger, 1912;
Paranavitana, 1933; Ranawella, 2004), just like in the Mesopotamian, Roman and Middle Ages societies
(Jones, 2009). The ownership of all land in the country was vested with the crown. Hence the mass had to
recompense the king for consuming the land (Abhayawardhana, 2009). Accessing the geographically
dispersed masses to collect their dues was unfeasible for the king or the royal officials. Therefore, the
administration was decentralized. This provoked accounting practices by way of recordkeeping activities, to
fulfil the accountability of the crown’s delegates towards the king. The below discussion emphasizes on
epigraphic evidence reflecting the decentralized administration that functioned in ancient Ceylon.
Ranawella (2004), elucidates that the ancient Ceylonese society was organized as several territorial divisions,
which are (in ascending order), Gam (villages), Niyamgam (market towns), Janavu (provinces) and
Malamandulu (several administrative divisions). In addition, Badulla (Horabora) pillar inscription, Vēvälketiya
slab inscription and 13 other inscriptions that are very similar to the Vēvälketiya slab inscription, all belonging
to the 10th century, during the reign of King Mahinda IV (circa 946-954 A.D.), clearly present evidence for the
existence of a village administration system and the functions of a local chieftain.
For instance, the Vēvälketiya slab inscription and the 13 other inscriptions furnish valuable information about
the local administration that had functioned in the ancient era, especially in the 10th century. These
inscriptions refer to an administrative unit called “Dasagama” (a unit of 10 villages) and to a number of smaller
sub-units within a Dasagama, which are called “Kibigama”. Both Dasagama and Kibigama had been

Chapter 4: Early Accounting Thought in Ancient Ceylon and the Prominent Role of Sociocultural Environment
85
administered by a designated “chieftain”. The heads of the kibigamas had been referred to as “Kibigam
Äpädun Nāyakayānan, which means “the chieftains who have provided security to Kibigam” (Ranawella,
2004, p.177). In light of the above, it is evident that the ancient inscriptions reveal that a system of village
administration was executed. Village officials were accountable to the king (Paranavitana, 1933).
On the other hand, epigraphic evidence of ancient Ceylon refers to royal officials who represent the crown
or the central government. Kondawattawan pillar inscription (circa 924-935 A.D.), Giritale pillar inscription
(circa 929-932 A.D.) Velmilla slab inscription (circa 933-942 A.D.) and Mannar Kacceri pillar inscription (either
during 844-879 A.D. or 890-007 A.D.) are some of the inscriptions which deliberate about officials
representing the royal household. These officials include revenue officers representing the royal household,
officers representing the royal treasury and royal scribes.
4.4.3.2 Economic Environment
This section elaborates on the epigraphic evidence that illustrates how the ancient Ceylonese economy
functioned, primarily by focusing on agriculture as the main livelihood of the masses; trade activities and
finally on the existence of activities resembling the practice of banking. The section concludes with a
discussion on how the economic environment stimulated early accounting practices.
Agriculture as the main livelihood
As Identified above, the agricultural economy was one of the three major pillars, the traditional Ceylonese
society was built upon (Kepferer, 1987 cited in Wickramasinghe and Hopper, 2005)). Wickramasinghe and
Hopper (2005, p. 12) states the following:
“An effective agricultural economy underpinned village culture. Villages emerged alongside
rivers and artificial reservoirs: land and water being the major forces of production. The
economy was self-sufficient and the role of kings was to sustain it. As the owner and controller
of soil and water the king was responsible for efficiently providing both for agricultural
development. He financed this through taxes on lands and water…”
Rice production or paddy production is one of the main productions and staple foods in Sri Lanka, even to
date. Several inscriptions in the sample cite providing alms to monks in the form of boiled rice, in various
monasteries.
For instance, the Ätdatkadavala pillar inscription, that was found in the North-Central Province, belonging to
the 10th century under the reign of King Udaya IV, states the following:
“(…) this village shall be enjoyed uninterrupted by Budalna of Saka himself, and by his children
and grandchildren of his lineage on condition that the person enjoying the benefits of this
village shall supply annually ten pots (dasa atalaka) of boiled rice (bat) to the lahage (the rice-
distributing-hall) of the Abhayagiri vihāra…” (Ranawella, 2004, p.221)
Chapter 4: Early Accounting Thought in Ancient Ceylon and the Prominent Role of Sociocultural Environment
86
Furthermore, another inscription found in Mihintalē (Anuradhapura District, North Central Province)
(discussed above), belonging to the 10th century under the reign of King Mahinda IV, provides clear
instructions on the amounts to be paid to a number of official designations attached to a monastery.
According to this inscription, the payments have been mainly done in terms of land, raw rice and gold.
The content of the Vessagiriya slab inscription 1 (Anuradhapura District, North Central Province) from the
10th Century, during the reign of King Mahinda IV, is interesting, as it not only talks about two types of paddy
but also refers to the use of a storage tank for cultivation:
“(…) Having collected water from a storage tank for cultivating the fields and gardens adjoining
and all around the monastery, the sihin-äti variety of paddy should be sown, but not that of
the maha-äti variety of paddy…” (Ranawella, 2004, p. 261)
There is a glut of Inscriptions that refer to units of measurement of paddy, which will be discussed later in
section 4.4.3.3 Technological Influences. Moreover, an equal number of inscriptions, mainly the ones that
record immunity grants, refer to an agricultural officer (vel-vadārannā).
Apart from paddy production, the island has also engaged in cultivating other agricultural commodities such
as pulses (Tōnigala rock inscription); spices such as fenugreek (Brahmanayāgama pillar inscription, Giritalē
pillar inscription 1, Itena pillar inscription, Giritalē pillar inscription 2, Ätākada pillar inscription) and mustard
(Bandāra Ulpata pillar inscription); and other types, such as betel, orange, plantain, jackfruit (Anurādhapura
slab inscription).
Trade Activities
In addition to agricultural activities, ancient inscriptions reveal the prevalence of domestic trade during this
period. In fact, Badulla (Horabora) Inscription provides invaluable information on the administration that took
place in a bazaar. As explained above, international trade thrived during the 6th century A.D., as Ceylon was
geographically situated in a strategic location of the renowned maritime Silk Road (Jayawardana, 1964).
However, based on the evidence at hand, this section limits its focus onto domestic trade based on epigraphic
evidence.
The Badulla (Horabora) inscription was enacted in the 10th Century by King Udaya IV and was found in the
Uva Province of the island. The preamble of the inscription (translated to English) states that:
“(..) Whereas the tenants of the merchants of the Hopitigama bazaar in Sorabora made it
known to His Majesty when he came (here) during a visit to the great monastery at Miyaguna
that the servants (gättan) of the Army General, the recipient of the bazaar, have transgressed
against the statute enacted in the days gone by in the days of the Lord who passed away in the
seventeenth (year of his reign) and have extorted fines illegally….” (Ranawella, 2004, p. 171)
Thereafter the inscription continues to provide explicit rules and regulations for enforcing imposts, a code of
conduct for the officers representing the royal household, rules and regulations for the merchants and

Chapter 4: Early Accounting Thought in Ancient Ceylon and the Prominent Role of Sociocultural Environment
87
imposing fines (for non-compliance). The inscription specifically refers to a mercantile guild (vanigrāman) that
was operating during that period, inferring that trade activities had been conducted in a systematic and an
organized fashion in ancient Ceylon.
The Existence of a Primitive Banking System
One important revelation of Ceylonese epigraphy is the existence of certain constituents that resembles the
practice of banking. Several inscriptions which date back to the 4th century A.D. unearth the existence of a
primitive banking system in the country, yet evidence at hand does not indicate any signs of organized lending
and borrowing activities.
(i) Tōnigala Rock Inscription
The Tōnigala rock inscription which belonged to the latter half of the 4th century records that a certain
minister deposited some quantities of grain and beans with a trade guild in the city, with the stipulation that
capital should remain unspent and the interest should be utilized for providing meals to the monks of a nearby
monastery, during the rainy (Vassa28) season. This inscription explicitly discusses the amount of grain invested
by the minister and the interest amount owed to him. Three types of grains; paddy, udi (a species of
Flemingia29) and beans have been deposited for which the interest amounts were also specified.
“(…) Of the aforesaid two hakadas and ten amanas of paddy, the interest at the principal
harvest (pitadada hasa), the interest at the secondary harvest and the interest at the
intermediate harvest (amount to) twenty-five amanas of paddy. Of the aforesaid six amanas
of udi, the interest is one amana and two pekadas of udi. Of the aforesaid ten amanas of beans,
the interest is two amanas and two pekadas of beans” (Paranavitana, 1933, p. 178)
“Amana” and “pekada” are translated as units of grain measurement by Paranavitana (1933). By looking at
the above inscription, the rate of interest on paddy can be worked out as 50% per annum, where the amount
is being collected during the three crops (principal harvest, secondary harvest and the intermediate harvest)
of the year (Paranavitana, 1933). An interest rate of 25% has been worked out for the other two types of
grains. However, whether equal amounts of harvest were collected during the three crops or whether a
greater proportion was collected during the more important harvests are points that have not been
established. The inscription also uses the term ‘Niyamatanahi’, which Paranavitana (1933) translates as village
assemblies.
According to Usher (1934), there is no evidence supporting the existence of banks of deposit even in their
primitive form, in mediaeval Europe, until the late twelfth century or the beginning of the thirteenth.
Paranavitana (1933) presents evidence for village assemblies acting as local banks, recorded in South Indian
28 Annual retreat practiced by Theravāda Buddhists, during the wet season, usually from July to October. Theravāda Buddhism is one of the two main existing branches of Buddhism (the other being Mahayana). 29 A flowering part native to Asia, in which root tubers have traditionally being used as food.

Chapter 4: Early Accounting Thought in Ancient Ceylon and the Prominent Role of Sociocultural Environment
88
inscriptions, but notably, the Tonigala rock inscription uncovers that “this practice prevailed in Ceylon at an
earlier date than that for which evidence is available in South India” (p.181).
(ii) Two Rock Inscriptions at Labuätabändigala
According to epigraphic evidence, not only grain banks but also banks where money could be deposited
existed in ancient Ceylon. The two rock inscriptions located in Labuatabandigala, in the North Central
province of the country provides the best evidence in this regard and date back to the 5th century. One of
these inscriptions proclaims that a certain individual, who was a son of a minister, has deposited an amount
of 100 Kahapanas with a guild, and that the interest accrued should be donated to a nearby monastery to
conduct the annual vassa festival. Kahapanas (also known as Kahavanas / Kahavanuva) is an ancient coin
which was used in Sri Lanka and had several sub-divisions known as ada-kahavanuva, deka, aka and massa.
According to Codrington (1924), Kahavanuva in medieval Ceylon was a gold coin with a weight of 68-70 grains
of Troy. Precisely the inscription (translated to English) reads as follows:
“Hail! Sirinakayi, the son of the minister Sagaya, having deposited one hundred kahapanas with
the guild of Mahatabaka, in the (Eastern) quarter (of the city), gave (the same) to the great
monastery of Devagiri for the purpose of conducting the sacred vassa festival. (100 kahavanas,
in symbols.) Having taken the interest on these one hundred kahavanas……” (Paranavitana,
1933, p. 250).
The second inscription at the same site also contains a similar message, where another individual who is a
son of one of the highest officials of the state has deposited an amount of 20 Kahapanas, which should also
be used to conduct the sacred Vassa festival in the same monastery.
“Hail! Nitalavitiya Sivayi, the son of Ratiya Sumanaya, caused to be deposited and gave twenty
kahavanas to the monastery of Devagiri (for the purpose of conducting) the sacred (vassa
festival) during the coming years…” (Paranavitana, 1933, p.252)
Although these banks were similar in essential functions to any modern bank of deposit, many special forms
and features of present banking business, such as the use of cheques, commercial papers etc. have not been
used. Therefore Usher (1934) refer to them as the primitive type of bank of deposits.
In summary, the above inscriptions reveal that agriculture has been the main livelihood of ancient Ceylon.
Paranavitana (1933) states that around the 11th century, a system of land measurement by the amount of
paddy or other grain with which the field is capable of being sown has been used (see section 4.4.3.3). This
implies that, if the ancients were given certain dimensions of a land, they possessed the necessary knowledge
to estimate the amount of harvest that could be reaped out of it. A similar example is illustrated in Carmona
and Ezzamel (2007) pertaining to a warehouse that contained ingredients for beer brewing. They illustrate a
scenario in which ancient records had clearly stated the “exact ingredients required for nine different cereal
products and eight different kinds of beer” (p. 186). Underneath the same record, the actual quantity of beer
produced was also recorded. Such practices in ancient Mesopotamia induced Mattessich (1998) to employ

Chapter 4: Early Accounting Thought in Ancient Ceylon and the Prominent Role of Sociocultural Environment
89
the contemporary term “budgetary procedures” to elucidate the same. Although, the evidence at hand from
the Ceylonese context, does not reveal a practice of comparing the actual quantity of harvest against the
predetermined amount, the available data clearly indicates the use of accounting thought facilitating
numerical technology, during the ancient times.
In addition, a share of the harvest was payable to the crown, as explained above. The rest were either traded
or used for personal consumption. Several inscriptions, as indicated above, reveal the practice of domestic
trade in ancient Ceylon. Trading of goods require them to be measured and valued. Furthermore, from
Tōnigala and Labuätabändigala inscriptions, it is clearly evident that the ancients were aware of the two
concepts “capital” and “interest”. All of these instances underpin the functions of accounting as a means of
measuring and valuing objects or put differently to quantify or value human activities, to ascertain modes of
reciprocity and as an instrument for adjudicating economic and social claims.
4.4.3.3 Technological Influences
This section discusses the technological factors that may have supported the accounting practices in ancient
Ceylon and examines the presence of literary activities, the use of numerical technology and coinage as
possible factors that may have assisted the early recordkeeping activities of income and expenditure.
Literacy
The presence of rock inscriptions that are centuries old evinces that the art of writing had existed in ancient
Ceylon centuries ago. The oldest inscription in Ceylon dates back to the late 3rd to early 2nd century B.C. (circa
207 – 197 B.C.) (Perera et al., 2001). This inscription was written using the Brāhmī and Prakit alphabets, which
are accepted as the predecessors of the modern Sinhalese language (Perera et al., 2001).
Furthermore, Mahavamsa, the great chronicle of Si Lanka, was written in Pali language in the 5th or 6th century
A.D. and documents the Sri Lankan history from 400 B.C. to 300 A.D. (Geiger, 1912). This further evinces the
presence of the art of writing in ancient Ceylon.
Furthermore, it should be noted that lithic inscriptions were used by the ruling king in ancient times as a
means of mass media. The message that is contained in the inscription usually targets the monks in a
monastery, officers representing the royal household, local chieftains, merchants and sometimes the masses,
in general. The king would not have used inscriptions as a means of communicating royal edicts, if they cannot
be read and understood by the target audience30.
30 Although other means, such as “anda bera” (a person who beats a drum to gain the attention of masses, to pass on a royal decree) had also been used, the discovery of more than 4000 rock inscriptions in Sri Lanka (Kumarasinghe and Samkin, 2018) implies that written communication had been popular among ancient Ceylonese kings.

Chapter 4: Early Accounting Thought in Ancient Ceylon and the Prominent Role of Sociocultural Environment
90
The Use of a Numerical Technology
Although we do not have enough evidence to comprehend the method of calculating taxes, dues or imposts,
it can be argued that a systematic method existed in the calculating, checking and recording of the royal
income.
Epigraphic evidence suggests that imposts on the harvests were mainly aligned with the harvesting seasons
of the year. According to Paranavitana (1933), the Tonigala rock inscription (discussed above) belonging to
the 4th century sheds light upon 3 different harvests of the year to calculate interest on paddy. The Velmilla
slab inscription (circa 933-942 A.D.) in particular deciphers that two hundred and fifty kalandas of gold shall
annually be taken as dues from the two harvests (Paranavitana,1933). A kalanda according to Codrington
(1924) is a weight equivalent to 70-72 grains of Troy31. All these provide evidence for the existence of a
numerical technology in ancient Ceylon.
Grain Measurement
The Tōnigala rock inscription (4th century A.D.), discussed above, illustrates a grain measurement system.
Paranavitana (1933, p.184) provides the following metric to the ancient system of grain measurement.
4 pǟlas = 1 amana
20 amanas = 1 hakada
Paranavitana (1933) presents the original means of the three words as cartload for “hakada”, troughful for
“amana” and a basketful for “pǟla”. The term pǟla is equivalent in meaning to the word pekada and
Paranavitana (1933) explains that the latter may have been derived from the Pali term “pitaka”. The term
pitaka has been used as a grain measurement unit in ancient India (Paranavitana, 1933). However, it is
important to note that these measures could not have had precisely the same value at every place and every
occasion, they were being used. However, it provides a good understanding of how the units of
measurements have evolved over the years. In addition, the term näliya has also been used in many
inscriptions as a measure of rice.
31 Troy is a system of units of mass that originated in the 15th Century England, which is primarily used today in the precious metal industry (Hallock & Wade, 1906)

Chapter 4: Early Accounting Thought in Ancient Ceylon and the Prominent Role of Sociocultural Environment
91
Land Measurement
Paranavitana (1933) when translating the inscriptions from Eppavala belonging to the 10th century, provides
the following metric to the ancient system of land measurement (p. 189):
1 kiri (karisa) of land = 4 pāyas
However, after the 11th century, this system fell into disuse. A new system was then introduced, which
measures the extent of the field by the amount of paddy or other grain with which the field is capable of
being sown (Paranavitana, 1933). The new system used the terms of capacity, such as yāla, amuna and pǟla,
as land measures. Paranavitana (1933) explains that the meaning of yāla is equivalent to hakada (mentioned
above). Based on the Eppavala inscription (from 10th century) Paranavitana works out the cost of one paya of
land in the 10th century as eight kalandas of gold.
Carmona & Ezzamel (2007) stress that a system of recordkeeping about land production was required in
ancient Egypt, on behalf of the state or temples, because these institutions and ultimately Pharaoh owned
most of the land, which was a lot similar to the setting in ancient Ceylon. Abhayawardhana (2009) also
contends that the measurement of land was usually carried out by the king at the start of his reign.
Codrington (1938) also reiterates that this valuation of land was either done for the whole country at once or
partially.
Coinage
Coinage embodies the inscribing of a standard value onto metal which is itself deemed to have a value
(Ezzamel & Hoskin, 2002). As mentioned above, according to Mahavamsa, Ceylonese history traditionally
starts in circa 6th century B.C. Since then money is mentioned usually by number only (Codrington, 1924).
However the term Kahapanas first appear in Mahavamsa during the reign of King Elara (circa 145-101 B.C.).
Codrington (1924) explains that the term Kahavana32 is mentioned in inscriptions of every century from the
1st century A.D. until 5th to 7th century A.D. According to the author the term Kahavana reappears in the
Mahavamsa in the 10th century A.D. Thus, it can be implied that although the use of the name was continuous,
the name may have been applied to more than one coin in its long history. According to the author Kahavana,
which was a gold coin, may be the deliberate revival of the Kahapana which used in ancient India as stated in
the Buddhist scriptures. However the name was also applied to silver and copper coins(Geiger, 1912).
The above discussion illustrates the existence of literacy, numerical technology and coinage in a very early
era in Ceylon. It is understandable that literacy (art of writing) and numerical skills (arithmetic), even at a
rudimentary level, are crucial for the establishment of accounting practices, not only for double-entry book-
keeping, as affirmed by Littleton (1927), but also for simple recordkeeping exercises. In addition, Littleton
(1927) affirms that money is also an important antecedent of double-entry book-keeping as “without money,
32 The two terms Kahavana and Kahapana had been used concurrently along with few other variants of the term in ancient Ceylon, as discussed earlier.

Chapter 4: Early Accounting Thought in Ancient Ceylon and the Prominent Role of Sociocultural Environment
92
trade would only be barter” (p.141). However, the researcher is cautious in concluding on the direction of
the causality between the aforementioned technological factors and ancient accounting practices. This is
because, based on the evidence from Mesopotamia and ancient Egypt, Ezzamel and Hoskin (2002) validates
that token accounting existed long before the advent of cuneiform writing and that money was an offshoot
of both accounting and writing. Thus, it is not the intention of the researcher to conclude on the direction of
the causality. Instead, the available epigraphic evidence uncover that the aforementioned technological
factors and accounting practices coexisted around similar points of times in the ancient Ceylonese history
and that they may have reinforced the establishment of each other.
4.4.4 Sociocultural Influences
This section discusses the impact of sociocultural forces on early accounting thought and practices in ancient
Ceylon as evinced by epigraphic evidence. Ever since the arrival of Buddhism in Ceylon in the 3rd century B.C.,
it received royal patronage at all times. Since then, government administration, architecture, language and
literature, social conventions and customs and most importantly people’s thinking were inspired by Buddha’s
teachings. The Buddhist philosophies were deeply rooted in the value system of ancient Ceylon. As a result,
the sociocultural influence on accounting thought and practices can be identified as twofold; direct and
indirect. The relationship is illustrated in figure 4.6.
Cultural Influences and Accounting Thought – The Direct Impact
This section discusses the sociocultural background that induced accounting practices to be undertaken in
ancient Buddhist monasteries.
As, identified above, ever since the arrival of Buddhism to the island in the 3rd century B.C. it received royal
patronage at all times. The kings of Ceylon were often regarded as the secular head of Buddhism who is
responsible for protecting the Sāsana33 (Rahula, 1956). For instance, King Mahinda IV (956-972 A.D.) decrees
the following in the Jētavanäräma slab inscription (No.2):
“(……) the noble Ksatriyas34, who are devoted to the omniscient Buddha, the pinnacle of the
Ksatriya family; they who are accustomed to wear the crown to serve and attend on the great
community of monks on the very day they celebrate the coronation festival after attaining to
the dignity of kingship, which is bestowed by the great community of monks for the purpose
of defending the bowl and the robe of the Buddha…….” (Ranawella, 2004, p. 257).
The above inscription, among many, indicates the piety and the devotion of the king towards Buddhism. Thus,
the kings donated substantial amounts of wealth, as land or in any other form, as a sign of their dedication,
33 The practice of Buddhism or the Buddhist doctrine 34 Ksatriya is one of the social classes in ancient India that was only second to the Brahmans who were the priests and teachers of law. Traditionally the royals or the ruling class belonged to Ksatriya class. Based on ancient chronicles and Buddhist literature, Buddha too was a Ksatriya.

Chapter 4: Early Accounting Thought in Ancient Ceylon and the Prominent Role of Sociocultural Environment
93
self-denial and respect. The Great Chronicle, Mahavamsa, belonging to the 5th century, provides ample
evidence of the ancient kings constructing and donating temples and monasteries and donating money to
the Buddhist monks (Sangha). According to Liyanarachchi (2009) the kings donated land to the Sangha and
built living quarters, swimming pools, temples and provided parks and forest-land for their use. Epigraphic
evidence also reveals the donations to Sangha made by private individuals.
Nonetheless, in addition to the land and money, monasteries also received immunities along with the land.
Epigraphic evidence shows that monasteries were made exempt from land taxes, irrigation taxes etc. Soon,
the lands donated to monasteries grew larger in size and number, hence the power of the monasteries were
strengthened while the power of the kings were restrained (Liyanarachchi, 2009). On the other hand, the
accumulation of wealth in monasteries resulted in misappropriation of the same by the monks (Liyanarachchi,
2009). Thus, the kings had to intervene to resolve disputes and to restore discipline in monasteries and as a
result disciplinary rules were introduced to restrain monks from being involved directly in wealth
management activities. This claim is validated by the availability of a large number of inscriptions during the
9th and 10th centuries regarding the discipline of monks in monasteries.
For example, the Kaludiyapokuna slab inscription in the 10th Century, which portrays a set of rules agreed
upon by the common consent of the monks, appears to have three sections, as pointed out by Paranavitana
(1933), viz. rules for the guidance of the monks, those dealing with the temple officials and rules and
regulations to be observed by the royal officials, when dealing with the monastery. The inscription was
identified to belong to the reign of King Sena III and was found in the Matalē District, Central Province of the
island. Some extracts translated to English are indicated below:
“(…) those senior monks who have completed ten vassa seasons35 and the four lessons of
discourses 36 shall be made to dwell in the āvāsa 37 . (……) other than the discourses on
traditional paritta38 … and those who have neglected the study of the Maha-paritta39 shall not
be allowed to dwell in this āvāsa. (…) Their lordships who deprived the hired labourers’ wages
and maintenance land, also their lordships who transgress the aforementioned rules shall not
live in this āvāsa..” (Ranawella, 2004, p.145)
In the above inscription the term “lordships” must have been used to refer to the chief or other powerful
monks in the monastery. The instruction to pay the due wages to labourers, hints that monks may have
evaded wage payments and that they had been involved in misappropriating funds in monasteries in the
ancient days.
35 Annual retreat practiced by Theravāda Buddhists, during the wet season, usually from July to October. Theravāda Buddhism is one of the two main existing branches of Buddhism (the other being Mahayana). 36 Certain teachings of Buddha 37 Residence or dwelling for monks 38 Paritta - Buddhist practice of reciting certain verses or scriptures in order to protect against misfortune. 39 Mahā-paritta is a compilation of three certain parittas.

Chapter 4: Early Accounting Thought in Ancient Ceylon and the Prominent Role of Sociocultural Environment
94
The inscription attempts to curtail misbehaviour of the monks and concludes as follows:
“(…) These regulations which were thus instituted by this Order shall be observed without
transgression” (Ranawella, 2004, p.285).
Nevertheless, as the monasteries expanded in terms of size and wealth, the administration became a complex
matter.
Moreover, according to Buddha’s teachings, it was unacceptable for Buddhist monks to directly involve in
wealth management activities. This is because, monks are primarily expected to preserve and disseminate
Buddha’s teachings and to guide the lay people. They are a group of people who have abandoned their homes
and families, in the pursuit of Nibbāna. They follow a frugal lifestyle and abstain from sensual pleasures in
order to pursue spiritual goals. Therefore ideally, Buddhist monks should not pursue worldly desires or
engage in endeavours with profit motive.
Consequently, lay officials were involved in the administration of monastic properties (Liyanarachchi, 2009).
However, soon, they too were accused of misappropriating funds. In Buddhist monasteries, it was crucial to
establish openness and accountability when dealing with monastic property due to several reasons. Firstly,
as monks do not engage in any economic activity, all the resources and properties that were in a monastery
were those which were donated either by the king or other laymen. Secondly, these resources were donated
to the entire community of monks rather than to an individual monk (Liyanarachchi, 2009). Thirdly, although
monastic wealth proliferated due to above mentioned reasons, monks were expected to abstain from worldly
desires in the pursuit of spiritual goals. Therefore, misappropriation of monastic property would cause
suspicion among the followers and would result with lack of support to the particular monastery.
Therefore, to safeguard the reputation of monks, to remain trustworthy and to maintain a good relationship
with the king and the general masses, the proper recording of monastic funds and periodic public reading of
the same, to encourage transparency, was deemed to be of paramount importance (Liyanarachchi, 2009).
Further, as Buddhist teachings provide no grounds for business and profit desire, especially for the monks,
the temple accounting system operated with a non-profit motive. The instructions to retain the surplus of
income (over expenditure) in the monastery as non-transferable goods in the Dambēgoda pillar inscription
(10th century) and prohibiting the monks to use the same for purchasing other goods explicate the non-profit
motive of the accounting system that developed based on ancient monasteries.
Cultural Influences and Accounting Thought – The Indirect Impact
Above section 4.4.3 discussed how early accounting thought and practices were embedded in the larger
political, economic, and technological landscape. The next three subsections reveal how the Buddhist culture
shaped the political, technological and economic factors in ancient Ceylon. This signifies the indirect impact
of sociocultural factors.

Chapter 4: Early Accounting Thought in Ancient Ceylon and the Prominent Role of Sociocultural Environment
95
The Influence of Buddhist Culture on the Political Organization
This section elaborates the influence exerted by Buddhist teachings and monasteries, mainly on the kingship.
First, a social convention that was commonly held during the early era is that the ruler of the island should
be the custodian of the sacred tooth relic of Buddha, which was brought to Ceylon from India during the 4th
century A.D. (Sri Dalada Maligawa Temple of the Sacred Tooth Relic, 2019). No ruler who was not the
custodian of the tooth relic could be considered as the king. Thus if the king loses the support of the monks,
they may either hide the tooth relic or make it inaccessible to the king. Second, it was widely held that the
king of the state should be the official protector of Buddhism. Ranawella (2004) states that the main duties
of the king were to protect the religion and his subjects. This is further reinforced by epigraphic evidence. For
example, an extract of the Jētavanäräma slab inscription no. 2 (previously discussed), which is a royal edict
by King Mahinda IV in the 10th century states that:
“ (…)they who are accustomed to wear the crown to serve and attend on the great community
of monks on the very day they celebrate the coronation festival after attaining to the dignity
of kingship, which is bestowed by the great community of monks for the purpose of defending
the bowl and the robe of the Buddha, and from whom they have received absolute assurance,
that any person who is no Bōdhisatta would not attain kingship in Sri Lanka…….” (Ranawella,
2004, p. 257).
The above inscription signifies several things. First, as explained above, it elucidates that the primary role of
the king, as promulgated by King Mahinda IV, is to “defend the bowl and the robe of Buddha”, where the
“bowl and the robe” is a metaphor used to refer to the community of monks (Sanga) or the sāsana (the
practice of Buddhism or the Buddhist doctrine). Second, it states that the kingship is bestowed by the great
community of monks, which implies that the blessing of the Sanga is crucial for an individual to be crowned
as the king. The king had a close relationship with the chief monk in a monastery and historic evidence
suggests that at times they have provided advice to the king with regard to ruling the state.
The expression in the last sentence proves interesting. It states that “any person who is no Bōdhisatta would
not attain kingship in Sri Lanka”. A Bōdhisatta or Bodhisattva is a person who is on the path towards
Buddhahood, had made a pledge (perhaps in a previous lifetime) to become Buddha and who had received a
confirmation or prediction from a living Buddha that this will indeed be the case. As the king believed he is a
Bodhisattva, he extensively engaged in pious activities, such as building and restoring temples and
monasteries, building images of Buddha, providing alms, donating land and other gifts to Buddhist monks and
so forth40.
40 Wright (1957) posits that this was similar to one of the ways in which Buddhism was used to sanction royal power in ancient China. The other way was by believing that the ruler or the king is a Buddha incarnate and should be honored as such by the clergy. The practice of ancient Ceylon appear to tally with the former, i.e.

Chapter 4: Early Accounting Thought in Ancient Ceylon and the Prominent Role of Sociocultural Environment
96
Further Buddhist teachings provide a basic framework of Buddhist ethics for rulers, known as “Dasa Rāja
Dharma” (ten royal precepts of kingship) (Pryor, 1991). These are generosity, morality, liberality, uprightness,
gentleness, self-restraint, non-anger, non-hurtfulness, forbearance and non-opposition. Although the
inscriptions in the sample do not bear explicit evidence as to ancient Ceylonese kings practicing the so-called
precepts, their devotion towards Buddhism aids the contention that these precepts were indeed adhered to
by the ancient kings when ruling the country.
Finally, it should be noted the survival of the kingship was strongly dependent on its exchequer. The
exchequer, as discussed above was greatly reliant on the accountability relationship between the principal
(the king) and the agents (the village chieftains or the royal officers in charge of the king’s treasury). Based
on Buddhist cultural principles and moral standards, the relationship between the king and the agent was
more based on trust and mutual faith than strict rules and regulations. The ancient Ceylonese society was
predominantly governed by a strong value system that appears to have acted as a form of control. Epigraphic
evidence reveals the execution of cultural and religious forms of control in ancient Ceylon.
The majority of inscriptions contain rules, regulations and guidelines pertaining to a particular audience, such
as the villagers, merchants or the royal officers and village officers. They also depict the consequences of
noncompliance. Hence, there was a conscious definition of actions deemed acceptable and unacceptable,
and explicit proclamation on punishing the unacceptable behaviour. A limited number of inscriptions
explicate the punitive measures that existed in the form of fines, but a salient feature is the dominance of
cultural controls during this period. This is mainly due to the existence of a deep-seated value system in the
ancient society. As explained above, ever since the teachings of Buddha were introduced in Ceylon, merit
(pin) and demerit or sin (pav) became the guiding principle of a person’s life. The concept of merit and
demerit (pin-pav) or “karma” acted as tools of self-regulation in society and as Karma is not confined to one’s
present life, people refrained from committing a sin, in the fear that the consequences of bad actions will
affect both their present life and future lives.
The above assertion is validated by epigraphic evidence, which are presented below:
Almost all the inscriptions in our sample that records a grant of immunities over land or other donations
offered to monasteries indicate carvings of a dog and a crow. Paranavitana (1933) posits that this implies that
misappropriation of monastic or public property has dire consequences, such as that they may not receive
any food to eat and that they may be born as crows and dogs in their next birth. This is because of the
commonly held belief in the Sri Lankan society that crows, and dogs are two kinds of animals who are always
starving. Thus, even to date in Sri Lanka, people would feed crows and stray dogs because it is considered to
be a meritorious act. The Garandigala rock inscription (circa 732-738 A.D.), Velmilla slab inscription (circa 933-
to glorify the king, not as a Buddha incarnate but “as a Maha-danapati”- a great lay patron whose generosity is modelled on that of a Bodhisattva” (Wright, 1957, p. 413).

Chapter 4: Early Accounting Thought in Ancient Ceylon and the Prominent Role of Sociocultural Environment
97
942 A.D.), Kataragama pillar inscriptions (circa 924 A.D.) contain multiple carvings of figures of a dog and a
crow41
The Ranāva pillar inscription of the 10th century during the reign of King Dappula IV that contains a decree
granting certain immunities states the following:
“(…) those who …..(transgressed the above)..will be born as crows and dogs, or as village-pigs
or the beasts of the hell..” (Ranawella, 2004, p.103)
Furthermore an inscription on the stone canoe within the citadel, Anuradhapura, belonging to the last quarter
of the 10th century, translated by Paranavitana (1933), states that
“ (…) those who violate this shall take (upon themselves) the sins committed by (all) the
inhabitants of the land..” (Paranavitana, 1933, p. 133)
The pillar inscription of King Dappula V, which dates back to circa 924 A.D. records the immunities granted to
a religious establishment and states that:
“ (…) should this command be infringed by any, they shall take upon themselves the sins
committed by a killer of cows at Mahavoti” (Paranavitana, 1933, p.225).
The imprecation in this inscription and many others with the same phrase, imply that Mahavutu or Mahaver
had been a sacred place at that time and a sin committed there was considered as very heinous (Paranavitana,
1933)
The undeniable dominance and the effectiveness of cultural controls during the medieval period in Ceylon is
evident by another inscription which is issued by King Nissamka Malla during circa 1187-1196 A.D. This pillar-
slab inscription discusses the maxims on political morals and is an edict by the king to the officials of the
treasury, as they had caused suspicion in the king’s mind as to their integrity. The king firmly advises the royal
officers that they could enjoy anything in the royal treasury (e.g. gems, pearls, sapphires, emeralds, topaz,
diamonds etc.) but after obtaining permission from the proper authorities. The king states that any misusers
will be:
“ (…) tormented by the fire of anguish called remorse, by appropriating the funds (of the)
treasury without due permission….” (Paranavitana, 1933, p. 152)
41 Some of these inscriptions contain drawings of a monk’s fan depicting that it is monastic property. Also most of them contains carvings of the sun and the moon (or crescent moon) indicating that the rules and regulations recorded in the inscription should last until the sun and the moon endure (Ranawella, 2004).

Chapter 4: Early Accounting Thought in Ancient Ceylon and the Prominent Role of Sociocultural Environment
98
The Kapārārāma pillar- slab Sanskrit inscription during the reign of King Mahinda IV (10th century A.D.) which
is an edict by a senior monk, to provide drinking water to the resident monks in the nearby monastery states
the following:
“(…) should there be any who caused the cessation of (issuing) this water, may they enter that
same hell into which entered Devadatta..” (Ranawella, 2004, p. 287)
According to Buddhist literature Devadatta is considered as the greatest enemy of Buddha, who made many
attempts to kill Buddha. Due to his evil actions he is believed to have entered the hell.
Kaludiyapokuna inscription from the 10th century during the reign of King Sena III, which depicts a set of rules
agreed upon by common consent by the community of monks, states the following:
“(..) should any persons, whether they may be monks or employees, or officers attached to the
royal household, transgress these rules, may they not be able to see Mayittri Buddha”
(Ranawella, 2004, p. 146)
Buddhist literature introduces Mayittri as a Bodhisattva who will be the next Buddha of the world.
The above illustrates how the cultural and religious beliefs and value systems were used as a control
mechanism in the ancient days. According to Jones (2009), the heart of an efficient exchequer system was
the sound accountability process between principal-agent relationship. In a Ceylonese context, the
prevalence of sound controls as mentioned above may have fostered a climate of fear among the agents, to
restrain themselves from involving in unacceptable actions, which in turn safeguarded a sound principal-
agent relationship.
The Influence of Buddhist Culture on Economic Activities
Ancient Ceylonese society had a relatively self-sufficient agricultural economy. According to Wickramasinghe
and Hopper (2005, p. 12), cultural practices and customs dominate agricultural activities, such as “starting
the season at auspicious times, praying for better harvests, respecting tools, celebrating the harvest
ceremonially”. A harvest festival called the “aluth sahal mangalya” or the new rice festival is held in Sri Lanka
to date, where the first harvest each year is offered to the Buddha and guardian deities, while seeking
blessings for the next year’s crop (In Celebration Of The New Harvest: Aluth Sahal Mangallaya, 2017).
Further Wickramasinghe and Hopper (2005, p.15) states that villagers even to date believe that “natural
disasters such as floods or drought can be averted by Buddhist-cultural ceremonies. Buddhist festivals such

Chapter 4: Early Accounting Thought in Ancient Ceylon and the Prominent Role of Sociocultural Environment
99
as vesak42, poson43, and katina44 are celebrated intently and important Buddhist customs such as saving
animals from slaughter and taking a holiday on poya-day (day of full moon) are integral to peoples’ lives”.
In terms of trade, Pryor (1991) asserts that based on Buddhist principles on right livelihood, trade in certain
goods and services are prohibited. This is evident in the Badulla (Horabora) pillar inscription where it says:
“(…) also (they) shall not engage in illicit trade” (Ranawella, 2004, p.171-172)
However, the inscription provides no evidence as to what is qualified as illicit trade but perhaps there were
arbitrary rules and norms governing the trade of early days. Undoubtedly the Buddhist cultural values and
beliefs may have been central in arbitrating these rules and norms.
However Vēvälkätiya slab inscription and thirteen other inscriptions in the sample, all belonging to the 10th
century indicate that killing (and perhaps trading the meat) of domesticated animals like oxen, buffaloes and
goats is a crime that was imposed with capital punishment.
Buddhist Monastic Influence on Education (or the technological environment)
The Buddhism was introduced to the island in the 3rd century B.C. Before long, owing to their experience in
learning Buddhist doctrines, the Buddhist monks became an important group in the literate society of ancient
Ceylon. Buddhist monks were lifelong learners and soon they diversified their intellectual interests into other
areas such as language, grammar and literature (Rahula, 1956). Soon a Buddhist education system originated
in the country (Kumarasinghe and Samkin, 2018) and the Buddhist monks were engaged in disseminating
knowledge, beyond the spiritual domain, to followers of Buddhism including royal family members, other
elites and ordinary lay people. This fostered a sound environment for people to learn new things and generate
new ideas. As explained above, based on epigraphic evidence and other historical records, it can be
ascertained that the inhabitants of the island were civilized and literate that may have undoubtedly aided in
formalization of recordkeeping practices.
Summing up, the above discussion provides insight into how the sociocultural context that was strongly
influenced by Buddhism, impacted the political, economic and technological landscape in ancient Ceylon,
which in turn may have underpinned early accounting thought and practices, signifying the indirect channel
through which sociocultural environment affects accounting practices (see figure 4.6).
42 Vesak poya day celebrates the birth, the enlightenment and the passing-away of the Buddha and is the holiest day in the Buddhist calendar. 43 Poson full moon poya day is marked in history as the day Buddhism was introduced to Sri Lanka by a group of missionaries lead by Arahat Mahinda (the son of the great Indian king Asoka) from India. 44 Katina ceremony is the culmination of the Vas (rainy) season. At the end of the Vas period, a special robe known as the “Katina Cheevara” is offered to monks of every monastery, in a ceremonious manner.

Chapter 4: Early Accounting Thought in Ancient Ceylon and the Prominent Role of Sociocultural Environment
100
4.5 Conclusion
This study examines ancient accounting thought and practices, or more precisely, the existence of well-
articulated forms of ‘kingship accounting’ and ‘Buddhist temple accounting’ practices that were carved in
lithic or other inscriptions, thousands of years ago. The study also focuses on the control environment (i.e.
political, economic, technological and sociocultural factors) that supported or underpinned the early
accounting thought and practices, while placing special emphasis on sociocultural factors that are largely
inspired by Buddhism.
Epigraphic evidence reveals dispersed, yet invaluable findings, regarding the existence of various types of
taxes, state expenditure, two royal treasuries and the accounting profession, which together encompasses a
system of kingship accounting in ancient Ceylon. On the other hand, accounting thought and practices studied
in the context of Buddhist monasteries, or in other words the Buddhist temple accounting system, provide
relatively more detailed and explicit instructions on maintaining proper records on inflows and outflows of
monastic resources, calculating the balance of income - left after expenses and retaining them as non-
transferable goods, preparing periodic accounting records and reading out the records aloud, in an assembly
of monks and other lay officials.
The above information uncovers several things. First, it implies that the ancients had possessed the important
knowledge of classifying transactions as income and expenditure and also the necessary arithmetical ability to
calculate the balance of income, left after expenses. Yet, retaining the balance as a non-transferable good,
signifies the non-profit motive that prevailed in early accounting thought. Furthermore, the knowledge of
ancients, regarding days, weeks and months have enabled them to prepare periodic accounting records.
Further the periodic public reading of records, illustrates notions of accountability, at both hierarchical
(towards the crown) and horizontal (towards the community of monks) levels. Yet, in an ancient Ceylonese
context, rather than defining formal channels of accountability, it appears that accountability was mostly
required to maintain the reputation of the monastery and its members and to safeguard the goodwill among
the monks, rulers and people (Liyanarachchi, 2015)
On the other hand, the study on the political landscape in ancient Ceylon signified feudal characteristics and
decentralized administration (i.e. officers representing the crown and village administration respectively) that
warranted the maintenance of proper records on land, collection of taxes and imposts etc. Economic activities
entailed agriculture, trade and the existence of activities resembling the practice of banking and also evince
the existence of some numerical technology that existed. The epigraphic evidence on primitive banks in
particular, unearth that the ancients were aware of the two concepts “capital” and “interest. Moreover,
epigraphic evidence also reveals the existence of literacy, the use of numerical technology and coinage, which
may have underpinned the early accounting practices beyond doubt.
Finally, ever since the introduction of Buddhism in Ceylon, the Buddhist philosophies were deeply rooted in
the value system of ancient Ceylon. Consequently, sociocultural dynamics evince a dual impact; direct and
indirect, on early accounting thought and practices. The sociocultural factors that compelled accounting

Chapter 4: Early Accounting Thought in Ancient Ceylon and the Prominent Role of Sociocultural Environment
101
practices to be undertaken in ancient Buddhist monasteries signifies the direct impact, whilst the role of
Buddhist cultural values in shaping the ancient political, technological(literacy, numerical technology and
coinage) and economic landscape, which in turn underpinned the early accounting thought denotes the
indirect impact.
Summing up, based on the above findings, it can be concluded that in an ancient Ceylonese context,
accounting has been used as a means of counting, measuring and valuing objects or, put differently, to
quantify or value human activities, to ascertain modes of reciprocity and as an instrument for adjudicating
economic and social claims, similar to the work of Ezzamel (1997) on ancient Egypt. Also the study explores
the role of accounting as a tool in recording and communicating human activities, in order to make human
performances visible, or in other words, in accomplishing notions of accountability practices, both relating to
the kingship and Buddhist monasteries. The study also unearths the unparralled influence of sociocultural
environment that was largely guided by Buddhist teachings, on early accounting thought and practices.
Finally, this research study is significant as according to Previts, Parker and Coffman (1990), history
contributes to contemporary research in policy-making and practice and in standard setting. Further, studies
on history also inform us about how we have reached a consensus on certain issues at present. The present
study supports the interdisciplinary view of accounting and its environmental context (Previts, Parker and
Coffman, 1990).

Chapter 5: CEO’s Cultural Values and Firms’ Leverage Decisions
102
Chapter 5: CEO’s Cultural Values and Firms’
Leverage Decisions
5.1 Introduction
What determines a firm’s capital structure decision? A number of studies, since the ground-breaking work of
Modigliani & Miller (1958), have run ‘empirical horse races’ between the well-known trade-off and pecking
order models of capital structure (see Fama & French, 2002; Frank & Goyal, 2003; Shyam-Sunder & Myers,
1999) and have produced mixed and at times contradictory results. Given that the financing decision is in the
hands of a manager, a more recent strand of literature directs the argument towards the importance of
managerial biases (Hackbarth, 2008; Heaton, 2002; Larwood & Whittaker, 1977; Malmendier et al., 2011;
Malmendier & Tate, 2008; Shefrin, 2001). Yet, empirical evidence shows distinct variation in corporate debt
levels across countries (L. Booth et al., 2001; Kester, 1986; Rajan & Zingales, 1995; Sekely & Collins, 1988;
Wald, 1999). This evinces the existence of divergent debt related behavioural patterns and irrationalities
between countries, i.e. people of the same culture will share certain behavioural biases among them whilst
people of different countries have different biases (see Figure 5.1).
Figure 5.1: Total stock of loans and debt securities issued by non-financial corporations, as a
percent of GDP, in the 10 largest world economies as at 2018
Source: International Monetary Fund (IMF), 201845
This might suggest that there exists a country factor that partially determines the firm leverage, in addition
to all other well-known firm, industry, market and managerial factors. Previous studies have attributed this
45 https://www.imf.org/external/datamapper/NFC_LS@GDD/SWE
0 20 40 60 80 100 120 140 160 180
People's Republic of China
France
Canada
Japan
United Kingdom
United States
Italy
Germany
India
Brazil
Corporate debt, loans and debt securities / GDP (%)

Chapter 5: CEO’s Cultural Values and Firms’ Leverage Decisions
103
country factor to the presence of institutional differences (Booth, Aivazian, Demirguc-Kunt, & Maksimovic,
2001; La Porta, Lopez-De-Silanes, Shleifer, & Vishny, 1997; Rajan & Zingales, 1995; Wald, 1999). This study
proposes that the divergent debt related behavioural patterns and irrationalities between countries can be
explained to some extent by the national culture of each country, in line with Chui, Lloyd and Kwok (2002), Li
et al. (2011) among others. However as all corporate decisions, including the leverage decision, are made by
individuals, this study emphasizes on the traits of individual CEOs, that are presumed to be conditioned by
their national cultural background, as culture is believed to be the software of the mind (Hofstede, 1991).
Previous research has established that culturally transmitted preferences are determined early in life
(Giavazzi, Petkov, & Schiantarelli,2014), deeply rooted in a person’s mind (Fernández & Fogli, 2009; Giavazzi
et al. 2014; Nguyen et al. ,2018), persistent (Giavazzi, Petkov, & Schiantarelli,2014), and guide the behaviour
of an individual (Breuer & Quinten, 2009; Nguyen et al., 2018). Consequently, this study contends that
national cultural values contribute measurably to the behaviour of executives. The empirical analysis of this
chapter has several goals. First, the study examines whether the cultural upbringing of a CEO is an inevitable
factor, when analysing the determinants of a firm’s leverage decision. Second, the relationship between CEO
culture and firm leverage is closely observed to investigate whether CEO cultural values have a
heterogeneous effect on the leverage decision of firms, at varying debt levels. Third, the analysis is extended
to study the financing decisions of highly cultural-biased CEOs, when they are exposed to a major exogenous
intervention to the system, the global financial crisis in 2007/08, seeking confirmation of a direct link between
cultural values and leverage changes. Finally, the study applies the epidemiological approach as described by
Fernández (2011) (explained in section 2.3.4) and scrutinize a sub-sample of foreign CEOs to observe whether
they reflect their own national culture when making the leverage decision, although they are employed in US
companies. This would imply that cultural values are portable (Fernández, 2011; Fisman & Miguel, 2007; K. Li
et al., 2011; Nguyen et al., 2018).
Although the cultural influence on leverage decisions has been examined in some recent studies, the focus
of this body of research has remained on the country of origin-based firm nationality, as opposed to that of
the decision makers. Furthermore, the exact nature of the relationship between leverage and firm’s national
culture is contested with divergent views on its strength and direction. For instance, Chui et al. (2002) employ
Schwartz's (2004) cultural dimensions to measure national cultures and regress country level and firm level
debt ratios on mastery and embeddedness and find that, in both levels, cultural values are negatively
associated with debt ratios. Li et al. (2011) also employ mastery and embeddedness from Schwartz’s
framework and investigate the role of firm’s country of origin in the leverage decision, using foreign joint
ventures operating in China. They find that mastery has negative and significant effects on firm’s short-term
debt and positive and significant effects on firm’s long-term debt. Furthermore Li et al. (2011), find that
embeddedness has no significant effect on firm leverage decisions. In addition, they also confirm the
portability of national cultures, as foreign joint ventures in China were making corporate decisions outside
their home country. Li et al. (2011, p.497) also accentuate that “an interesting area for future research, when
more detailed data become available is to examine whether managers’ decision making reflects their
corporate culture or their own national culture”. This inspired the present study.

Chapter 5: CEO’s Cultural Values and Firms’ Leverage Decisions
104
This research underlines the interaction between CEO culture and traditional capital structure theories, in
particular the trade-off theory. Furthermore it places emphasis on the CEO as the ultimate authority of
decision making (Malmendier et al., 2011; Malmendier & Tate, 2007; Nguyen et al., 2018) . A model is
developed to test the association between national cultural values of CEOs and debt level of a firm, whilst
controlling for well-known firm/ industry related variables (e.g.: tangibility, firm size, growth opportunities,
profitability, industry median leverage and industry concentration) and personal characteristics of CEOs such
as age, CEO experience, gender, education and financial position (Hambrick & Mason, 1984). The results help
to capture and distinguish CEO behaviour guided by cultural values, when all other personal, firm-related and
industry dynamics are held constant. Following previous research (Chui et al. (2002) Li et al. (2011) and Chui,
Kwok, & Stephen Zhou (2016)), Schwartz (2004) cultural dimensions are employed with the two broad
dimensions of cultural values, embeddedness (the opposite of autonomy) and mastery (the opposite of
harmony and egalitarian commitment), to explore the variations between national cultures.
The study investigates the main traits of high mastery and embedded managers and develops contesting
hypotheses. First it is postulated that a high mastery CEO, who is highly concerned about personal success
and values control, would steer away from the financial distress costs and agency cost of debt respectively,
and would opt for less debt (Chui, Lloyd and Kwok, 2002; Li et al., 2011). In contrast, high mastery managers
who value control would be averse to agency cost of equity and would choose more debt (Li et al., 2011).
Highly embedded managers relish harmonious relationships with their stakeholders. They are highly
concerned about the liquidation costs which will have to be borne by them (Chui et al., 2002). Therefore, they
would exacerbate possible bankruptcy risks and would restrain from contacting excessive leverage which
might disrupt in-group solidarity and would opt for less debt. In contrary, highly embedded managers foster
values such as obedience and respect for tradition. They dislike autonomy (Li et al., 2011) or taking initiative
and favour the debt covenants and monitoring placed by debt financing and prefer more debt.
By scrutinizing a sample of 594 CEOs, originating from 14 different nationalities, serving 317 Fortune 500
firms in the United States of America, during 2000 to 2015, the study finds that, ceteris paribus, the cultural
values of CEOs exert a statistically significant impact on a firm’s leverage decision. CEOs with higher mastery
and embeddedness cultural traits increase debt levels, when the existing leverage of a company is low. Debt
is well-known to mitigate manager-shareholder agency conflicts in a firm (Jensen, 1986; Jensen & Meckling,
1976). However, given that the financing decision is in the hands of the manager, why would he/she
voluntarily choose debt discipline? Apparently the costs and benefits of debt are perceived differently by
CEOs with different cultural biases. For instance, high mastery CEOs value control and would exacerbate
agency costs of equity, thereby choosing higher debt that is enabled by the existing low leverage of the firm.
In contrary, at higher existing debt levels, high mastery CEOs, who are concerned about personal success
would exacerbate financial distress costs caused by excessive leverage and would reduce borrowing. This
implies that high mastery CEOs, unknowingly, are in pursuit of a target capital structure, as they trade-off
between their value of control and the need for personal success. On the other hand, highly embedded CEOs
increase borrowing, irrespective of the current level of firm debt, as they are keen on debt monitoring.
Increasing borrowing when current leverage is high, can be risky. However, bearing in mind that the sample

Chapter 5: CEO’s Cultural Values and Firms’ Leverage Decisions
105
consists of the largest corporations in the US, it can be assumed that these firms have a significant debt
capacity. Besides, Rajan and Zingales (1995) point out that firm size may operate as an inverse proxy for the
probability of bankruptcy. Conversely, there may be other factors (such as behavioural biases) at play.
Nevertheless, a direct link between cultural values and leverage, has been detected and confirmed via an
analysis of a major exogenous intervention (global financial crisis 2007/08) to the system. Further as an
industry shock compels the CEO to make decisions to navigate the firm through a changing industry
environment, the resulting decisions are likely to be unstructured and non-routine and CEO characteristics
play a major role in how CEOs respond, alleviating CEO-firm matching concerns. Finally, the study also
concludes that cultural values are portable. Results remain robust to alternative specifications of the
dependent variable and endogeneity concerns caused by both omitted variable bias and simultaneous
causality.
The present study extends the work of Chui et al. (2002) and Li et al. (2011) but distinguishes the same from
previous research mainly in two ways. First, the study goes beyond the previous conventional emphasis on a
firms’ nationality on the leverage decision (macrocosmic effect), as it would only suffice if both the CEO and
the firm originate from the same national culture. However, given the rise in international migration owing
to economic globalisation and the intense public pressure to increase workplace diversity46, this assumption
may not always hold true. Therefore, this study moves beyond the macrocosmic effect to one of microcosmic
impact i.e., CEOs’ cultural values in the leverage decision process. Second, the study also moves one step
beyond and examines the association more closely. The heterogeneous effect of culture on leverage is
investigated by categorising the existing leverage in firms and examining three scenarios, viz. when current
leverage is at lowest, highest and at the median. How would the financing decision be influenced by a non-
rational CEO who is guided by their cultural values, in each scenario? The empirical analysis indicates that
firm’s current degree of leverage significantly matters, when examining the association between CEO culture
and firm leverage. As this study models directional heterogeneous effect across firms over the entire
distribution of the leverage spectrum, this paper appears to be among the first to propose a complete
characterisation of tail behaviour of cultural attributes across the entire leverage spectrum. It also
contributes to the existing literature on the impact of culture on corporate outcomes and precisely, to the
strand of literature that investigates immigrants and their descendants to identify the effect of culture on
corporate outcomes. This study finally concludes that high mastery CEOs make capital structure decisions
that are more in the interest of shareholders, while the capital structure decisions of highly embedded CEOs
can be detrimental to the firm. Academically the findings of this paper open up new paradigms that need to
be considered in the area of agency conflicts and monitoring costs.
46 Berkshire Hathaway was under immense scrutiny by media and shareholders, as it was ranked among the
four worst companies on workplace diversity, from S&P 100 companies, by a report prepared by the Calvert
Investments In 2015.

Chapter 5: CEO’s Cultural Values and Firms’ Leverage Decisions
106
5.2 Overview of Literature
This section commences with a discussion of the advantages and disadvantages of equity and debt financing
to a firm. This subsection is followed by the most prominent theories of capital structure and a comprehensive
discussion of various determinants of capital structure, which includes firm and industry related
determinants, behavioural biases and observable characteristics of managers, (viz. age, gender, education
etc.) and most importantly the cultural background of a firm. The section concludes with a detailed discussion
on the empirical gaps on prior literature and how the present study attempts to fill this void.
5.2.1 Equity or Debt?
“How do firms choose their capital structures?” is one of the most imperative questions faced by a financial
manager, but ironically remains unanswered to date. Despite a vast theoretical literature and a robust body
of empirical work since Modigliani & Miller (1958), the capital structure puzzle still remains unsolved!
Equity financing or debt financing? Each method carries its own advantages and disadvantages. For example,
equity finance can be favoured over debt due to several reasons: First, equity issuance can raise far more
funds than debt alone. Without equity financing, the growth of the company can be very slow or seriously
capped. Furthermore equity financing provides the firms with much needed flexibility, as it doesn’t demand
for a fixed regular repayment. The company need not pay dividends to its shareholders, if it isn’t doing well,
although it would send negative signals to the market. However, the biggest threat posed by equity funding
is the loss of control. Furthermore, issuing equity can be an arduous process and time consuming.
In contrast debt financing is nominally a cheaper source of funds, as it involves less floatation costs than
selling equity. Besides, the interest payment required to service debt is tax deductible, thus would produce a
tax shield for companies (Modigliani & Miller, 1963). In addition, debt financing allows the firm to retain
ownership and control with themselves and once the debt amount is repaid, the firms are free from debt
obligations.
Furthermore, Ross (1977) and later Leland & Pyle (1977), illustrate how the choice of debt level can be used
to signal firm quality, as discussed extensively in pecking order hypothesis later, in the next section. Harris &
Raviv (1988) point out that debt can be employed as an antitakeover device.
Jensen (1986) and Jensen & Meckling (1976) denote how debt can be used to reduce managerial discretion
and thereby to reduce agency conflicts between manager and shareholders that is discussed in detail later,
under agency conflicts. Finally, (Harris & Raviv, 1990) portray that the disciplinary role and informational
consequences of debt also can provide significant benefits.
However, debt financing suffers with several drawbacks as well. Debt involves a fixed amount of repayment,
which should be paid irrespective of the financial health of the company. Also at excessive debt levels, the
company will face financial distress costs and pose great financial uncertainty. Financial distress costs are
those costs that are faced by companies in financial distress, which can take tangible form such as paying
higher interest rates and disposing of assets quickly at a loss, to cover immediate needs. Loss of employee

Chapter 5: CEO’s Cultural Values and Firms’ Leverage Decisions
107
morale and productivity are examples of intangible financial distress costs. Finally, if the firm is declared
bankrupt, it would involve further bankruptcy costs. Technically bankruptcy occurs when the value of the
firm’s assets equals to the value of its debt and value of equity becomes zero. However the formal turning
over of the assets to debt providers is a legal process that is highly costly (see Chapter Note 5.1).
Furthermore, when the company is levered, a conflict of interest is possible between the shareholders and
debt providers, which becomes aggravated in an event of financial distress. In addition, debt financing usually
comes with debt covenants and increased monitoring. Managers dislike the increased monitoring role
provided by debt financing as it can curtail managerial actions, such as investing in projects with a high
potential that may also pose higher risks. These issues are discussed later in detail, under agency costs of
debt.
In summary, both equity and debt brings about their own benefits and costs. Hence, how should a firm choose
the optimal debt-equity ratio? The decisive factor should be the maximization of firm value. In other words,
the best debt-equity ratio should be the one that maximizes firm value. This is the underlying assumption of
the trade-off theory
However, can a firm maximize its value by altering the capital structure? The discussion of the importance of
capital structure has continued to be an imperative phenomenon for more than half a century, but was
surfaced after the influential work carried out by the two Nobel Laureates Franco Modigliani and Merton
Miller in 1958. The next section discusses the pioneering work of Modigliani & Miller (1958) and the principle
theories of capital structure that followed.
5.2.2 Theories of Capital structure
This section discusses the key theories that govern the literature on corporate capital structure.
5.2.2.1 Modigliani and Miller (M&M) Propositions
Modigliani and Miller, hereafter referred to as M&M, laid the foundation for a wealth of subsequent studies
on capital structure. M&M (1958), by undertaking a static partial equilibrium analysis, contend that in a
perfectly efficient market, the market value of a company depends on its earning power and the risk of
underlying assets but not on capital structure and/or dividend distribution. In other words, they affirm that,
in a perfect market, how a firm is financed is irrelevant to its value. Hence their theorem is called “the
irrelevance theorem”.
M&M (1958), argue that a firm has a particular set of cash flows and when the firm decides on a potential
mix of debt and equity, all it does is to divide up its cash flows among the two different types of investors;
debt-holders and equity-holders. This theory assumes that firms and investors have equal access to financial
markets. Thus, shareholders can adjust the firm financial leverage by borrowing and lending on their own.
The use of personal borrowing, in order to alter the degree of financial leverage is referred to as “homemade
leverage”. Hence, as investors can borrow or lend on their own, the equity price of the firm will be the same,
irrespective of the capital structure it chooses.

Chapter 5: CEO’s Cultural Values and Firms’ Leverage Decisions
108
However, this proposition was based on the main assumption of the existence of a perfectly efficient market,
where there are no taxes, no transaction costs, no bankruptcy costs although bankruptcy is possible and
where information is perfectly symmetrical.
The famous M&M proposition II describes that the cost of equity of a firm depends on the required rate of
return on the firm’ assets, firm’s cost of debt and finally its debt to equity ratio. Put differently, this holds that
a firm’s cost of equity is a positive linear function of the firm’s capital structure.
M&M theorem gave rise to both clarity and controversy in terms of capital structure research. Later the
authors revisited their previous research and relaxed some of the strict assumptions that were in operation
in the first model, to better suit real world conditions. Thus Modigliani & Miller (1963) re-presented the above
two propositions, whilst taking taxation into account.
Interest payment on debt is tax deductible. However, as equity does not provide such benefit, a firm is better
off borrowing. Thus, proposition II with taxation contends that the weighted average cost of capital declines
as the debt to equity ratio of a firm grows. Hence Modigliani & Miller (1963) concludes that, in order to fully
capture the benefit of debt, the optimal capital structure of a firm should consist of 100% debt.
However, many subsequent studies opposed this view. For instance Solomon (1963) argues that in an
extreme leverage situation, the market will react by demanding higher rates of return, which will increase
the cost of capital of a firm. Hence, Solomon (1963) opposes M&M’s stance of 100% debt and proclaims that
in order to minimize the weighted average cost of capital of a firm, it needs to avoid excessive levels of debt
and should have an optimal mix of debt and equity.
Although M&M theorem does not provide a realistic explanation of how firms choose their capital structure,
it opened the doors to many other persuasive research in the area. A brief description of the most prominent
theories is contained in the next section.
5.2.2.2 The Trade-off Theory of Capital Structure
The advantages and disadvantages that are part and parcel with both equity and debt financing were
summarized above. Hence it is evident that, at lower levels of debt, the financial distress costs and possibility
of bankruptcy is low and that the benefits of debt finance, such as the tax shields, would overweigh the
possible costs. However, in contrast, when the firm is highly levered, the probability of bankruptcy can be
extremely high, thus the increase in financial distress costs would exceed the benefits of the tax shield.
Apparently, a balance should be struck! Somewhere in between these two extremes lies an optimal point.
This is the underlying principle of the trade-off theory of capital structure. As mentioned above, although
M&M theorem triggered many debates, it also induced further research on capital structure. Hence as a
result, Kim (1978); Kraus & Litzenberger (1973); Lloyd-Davies (1975); Scott Jr. (1977); Solomon (1963) were
among the first to lay the cornerstone for the trade-off theory.
Technically, the static trade off theory suggests that, assuming the assets and operations of the firm remains
constant, a firm can maximize its value by borrowing up to the point where the benefit of tax from an extra

Chapter 5: CEO’s Cultural Values and Firms’ Leverage Decisions
109
unit of currency is exactly equal to the costs that are presented by the increased possibility of financial
distress.
The aforementioned “tax-bankruptcy” trade-off is just one perspective and the benefits and costs of debt can
be obtained in a variety of ways. One other major cost factor is the agency costs. Agency costs arise as a result
of conflict of interests among different stakeholder groups in a firm.
Agency Costs
Jensen & Meckling (1976) and later Jensen (1986) in their path-breaking articles define the concept of agency
costs and its association with the issue of “separation and control”. Furthermore, the authors also discuss the
nature of the agency costs engendered by the existence of debt and “outside” equity.
First and foremost, Jensen & Meckling (1976) defines an agency relationship as “a contract under which one
or more persons (the principal(s)) engage another person (the agent) to perform some service on their behalf
which involves delegating some decision making authority to the agent” (p.5). However, the problem arises
when both parties are utility-maximisers, as then agents will not always act in the best interest of the
principal. Thus, in order to restrain the agents from engaging in non-conforming behaviour, principals usually
establish appropriate incentives. In addition, the principal should frequently monitor the agents’ activities in
order to ensure they are not involved in deviant practices. Hence establishing incentives and regular
monitoring incurs a cost to the principal. In addition, the principal would also have to spend resources in the
form of bonding costs to the agent, in order to first, guarantee that the agent will not engage in activities that
would harm the principal and second, to ensure that the principal will be duly compensated if such a situation
occurs.
Therefore, it is discernible that the agent will hardly ever make optimal decisions from the principal’s point
of view, if no costs are incurred. However positive monitoring and bonding costs (pecuniary and non-
pecuniary) may not always guarantee conforming behaviour by agent. Agents may still deviate from
principal’s interest. Such divergence may cause a reduction in welfare for the principal and the equivalent
monetary amount of this is referred to as the “residual loss”. Hence, Jensen & Meckling (1976) define agency
costs as the sum of all aforementioned costs, viz. the monitoring costs incurred by the principal (that includes
control costs such as budget restrictions, compensation policies, operating rules etc.) the bonding costs by
the agent and the residual loss.
Furthermore, they also point out that there is no single principal-agent relationship, but that agency costs
may arise in any situation that involves corporative effort. However the relationship between the
stockholders and managers of a firm is a prime example.
Agency Cost of “Outside” Equity
In a wholly owned firm that is managed by the owner, he/she will make operating decisions that would
maximize personal utility. If the owner-manager sells equity to outside shareholders, agency conflict between
the owner-manager and the outside shareholders may occur as explained below.

Chapter 5: CEO’s Cultural Values and Firms’ Leverage Decisions
110
As explained above, in a wholly owned firm, owner-manager will make decisions that would reap him benefits
that can be both in terms of pecuniary and non-pecuniary. The latter consists of utility, generated to the
owner-manager by various aspects such as the physical appointments of the office, the level of employee
discipline, the attractiveness of the office staff, personal relations etc. However if firm stock is sold to outside
shareholders, they may enforce monitoring on the owner-manager over the amount of perquisites the
manager may usurp from the business. Moreover, when manager’s ownership claim falls, his commitment
on the business may also drop. This would result with lack of effort to pursue new profitable ventures, in
order to avoid personal costs on the part of the manager, as the pursuit of new ventures may demand too
much effort to learn about new technologies. These conflicts may result with the value of the firm being much
lower than it should be.

Chapter 5: CEO’s Cultural Values and Firms’ Leverage Decisions
111
Agency Cost of Debt
Although M&M (1963) postulate that organizations should be financed almost entirely with debt in order to
fully enjoy the benefits of debt, why does the observed behaviour indicates otherwise? One possible reason,
as already explained, is the existence of bankruptcy and reorganization costs, for firm’s capital structure to
not be dominated by debt. Another possible explanation is the existence of agency costs of debt. This is
explained below.
Agency conflicts between equity-holders and debt-holders
Jensen & Meckling (1976) elucidate that there are several aspects of agency conflicts. In this scenario, the
focus is on the possible conflicts between equity-holders (owners) and debt-holders of the firm. Debt
financing induces owners to distort the investment decision in their own benefit but at the cost of the firm.
For instance, the shareholders of firms that are nearing bankruptcy would distort the investment decision in
two ways. First, they would choose projects with extremely high returns but with substantial levels of risks,
so that they would deliver very high pay-offs if successful, whereas the creditors will have to bear most of the
costs, if it turns out unsuccessful. Therefore, shareholders benefit from “going for broke” (Harris and Raviv,
1991, p. 301), i.e. investing in very risky projects, even if they are value decreasing. These investments
diminish the value of debt. However, the gain in equity values captured at the expense of the debt-holders
can be more than the loss in value of equity as a result of poor investment. On the other hand, if the debt-
holders can anticipate this suboptimal behaviour at the time of debt issuance, they would charge more for
debt, this time causing shareholders to bear the cost. This shifting of risks from either parties is also known
as asset substitution effect, that is an agency cost of debt financing (Jensen, 1986; Jensen & Meckling, 1976
and later by Harris & Raviv, 1991).
Second, Myers (1977) elucidates another possible investment distortion and a source of cost of debt as a
consequence. Accordingly, a highly leveraged firm may overlook good investment opportunities due to the
debt overhang problem, as also identified as Jensen & Meckling (1976). Self-interested shareholders would
decide to underinvest, if the firm is likely to go bankrupt in the near future, so as to prevent the benefit of
investment being ultimately passed on to debt providers.
Thus in order to completely safeguard the creditors from the effects of owners’ divergent behaviour,
incredibly detailed provisions should be enforced when extending credit and these provisions ideally should
cover most operating aspects of the firm including the accepted level of riskiness of potential projects.
However, crafting such detailed provisions and enforcing them incur significant costs. Furthermore,
occasionally such provisions may even curtail the management from making optimal decisions on certain
issues, which results with reduced profitability for the firm. The aggregation of these costs are referred to as
the monitoring and bonding costs of debt, by Jensen & Meckling (1976).
In summary, agency costs of debt consist of the “opportunity wealth loss caused by the impact of debt on the
investment decisions of the firm, monitoring and bonding expenditures by the bondholders and the owner-

Chapter 5: CEO’s Cultural Values and Firms’ Leverage Decisions
112
manager (i.e. the firm) and the bankruptcy and reorganization costs” (Jensen & Meckling, 1976 p.51). This
explains why a firm’s capital structure is not completely dominated by debt.
Alternative Interpretations
This discussion shed light on two particular studies in which reputation is considered to moderate the asset
substitution problem. Diamond (1989), presents a model where there are three types of firms, i.e. firms that
accept only safe projects, firms that accept only risky projects and firms that have access to both. However,
understandably, the investors cannot distinguish the firms ex ante. Thus the lending rates of the investors
would reflect their beliefs about the types of projects chosen by firms, on average.
If a firm is able to convince the investors that it only has access to safe projects, the firm can enjoy a lower
lending rate from the investors. But how will the investors be convinced? The investors will observe the
default history of the firm in order to determine an appropriate lending rate. If a firm has a long history of
repaying its debt obligations, they maintain a better reputation and can secure lower lending rates from the
investors. Thus, older and more established firms, choose not to involve in asset substitution, to avoid losing
a valuable reputation and would only pick safe projects. In contrast, younger firms with little reputation would
dare to choose risky projects, as they have nothing to lose. Hence, firms with long track records have lower
default rates and can be observed to have lower costs of debt than younger firms with brief histories. In the
model, Diamond assumes the debt amount to be fixed. However if the model is extended, it would probably
indicate that younger firms have less debt relative to older firms.
The above analysis looks at the firm reputation, but Hirshleifer & Thakor (1992) build a model that takes
managerial reputation into account. They present a situation where a firm has access to two types of projects,
each with two possible outcomes: success and failure. Failure would mean the same for both projects.
However, Hirshleifer & Thakor posit that managers and shareholders may hold different views in
distinguishing between the projects. Shareholders tend to choose the project with a higher return, although
it would accompany a higher risk, while the managers would distinguish only between success and failure. As
the manager is concerned about personal reputation, every attempt will be taken to increase the probability
of success. If the safer project has a higher probability of success, the manager will choose that, even if it
yields a lower return. This behaviour of managers, reduces agency costs of debt. Therefore, given that
managers are sensitive to reputation effect, such firms are expected to have higher debt, ceteris paribus
Agency conflicts between equity-holders and manager
“Corporate managers are the agents of shareholders” (Jensen, 1986 p.323). Yet managers hold less than the
total residual claim. This implies that although the managers bear the entire costs of profit enhancement
activities, they may not capture the entire gain. Therefore, agents tend to pursue suboptimal behaviour and
they may not always act in the best interest of the shareholders, giving rise to agency conflicts. In particular,
managers may invest less effort in firm activities, or they will attempt to transfer organizational resources to
their personal benefits.

Chapter 5: CEO’s Cultural Values and Firms’ Leverage Decisions
113
Agency conflict between managers and shareholders can be especially severe, when the organization
generates substantial free cash flows47. When managers have access to significant free cash flows under their
control, they may transfer such resources to their own personal benefit, such as to enjoy excessive
perquisites. Furthermore they would either invest cash flows in value destroying ventures or waste them in
organizational inefficiencies. Jensen (1986) also argues that managers seek to grow their businesses beyond
the optimal size (empire building), as growth increases managers’ power by enhancing the resources under
their control.
Managerial discretion over free cash flows can be minimized by motivating them to disgorge the cash. One
possible way is to pay out the cash to shareholders as dividends or by repurchasing stock. This reduces the
amount available for managers as free cash flows. However, managers may promise to pay out future cash
flows, “by announcing an increase in the dividend” (Jensen, 1986, p.324). However, such promises are weak
and the dividends may be reduced in the future, causing stock prices to drop significantly as a consequence.
As an alternative, firms can issue debt. Debt creation, without retaining the proceeds of the issue, enables
managers to effectively bond their promise to pay out future interest costs. In the case of default, managers
give the debt-holders the right to take the firm into bankruptcy and liquidate their assets. Therefore, not only
that debt is a perfect substitute for dividends, but also it mitigates the agency costs of free cash flows by
reducing the cash flow available for managers’ discretionary spending.
In light of the above, it is apparent that although debt aggravates the agency conflicts between shareholders
and debt-holders, it can mitigate the same between managers and shareholders (Stulz, 1990).
Alternative Interpretations
Subsequent to Jensen and Meckling, several other researchers have provided alternative interpretations of
the agency conflicts that may exist between equity-holders and managers within organizations.
For instance, (Harris & Raviv, 1990) agree on the existence of manager-shareholder conflicts within an
organization. However, they posit that such conflicts may arise in a different way than that is underlined by
Jensen and Meckling above. Therefore, how debt can be used to alleviate the agency conflicts and the
disadvantages posed by debt would also differ.
They suggest that managers and investors are likely to disagree over operating decisions. For instance, it is
assumed that managers, in general, always want to continue firm’s current operations, although investors
may prefer liquidation, if necessary. Therefore, having a higher leverage level in a firm would give the option
for debt-holders to force liquidate the company, given cash flows are poor. Therefore, debt mitigates the
agency problem of failure to liquidate by giving the option to debt-holders to force-liquidate, if required.
47 Jensen (1986) describes free cash flow as the cash flow that is in excess of the amount required to finance all projects with positive net present values, when discounted at the relevant cost of capital.

Chapter 5: CEO’s Cultural Values and Firms’ Leverage Decisions
114
They also model costs of debt and call them the “investigation costs”. Although debt can be used as a tool by
investors to generate information and monitor management, it may, at times, take place at a cost. One
possible way of gathering information, is by observing the firm’s ability to honour the payments. The second
possible way is via a costly investigation in the event of default; a.k.a. investigation costs. Debt-holders
employ their legal rights to force the management to reveal information and to carry out the resulting
liquidation decision. Therefore, the optimal capital structure occurs at the point where the value of
information and the opportunities for disciplining the management sets off the probability of incurring
investigation costs.
On the other hand, Stulz (1990) puts forward an alternative view of the manager-shareholder agency
conflicts. He argues that managers strive to invest all available funds within an organization (overinvestment),
although paying out cash is better for investors. Once again, debt can mitigate this agency conflict by reducing
free cash flows available to managers. However, this may also cause managers to sacrifice good projects, as
they may not have sufficient free cash flows available within the firm. This is a cost to a firm. The optimal
capital structure is derived by trading off the benefit of debt in curtailing investment in value decreasing
projects, against the cost of debt in sacrificing value increasing projects.
Furthermore, Morellec (2004) provides another alternative explanation for manager-shareholder agency
conflicts. He points out that, given the financing decision is in the hands of the manager, the actual choice of
debt would differ from the optimal level. Empire-building desires encourage the entrenched managers to
issue less debt than optimal. However when such decisions of managers appear to erode firm value, a change
of control mechanism, such as a takeover, is possible. In such a situation, managers have a tendency to
increase leverage, with the objective of pre-committing to an investment policy that will circumvent excessive
deviations from value maximization.
Re-visiting the static model of capital structure, it is now clear that tax-bankruptcy is not the only trade-off
that should be considered. The trade-off between the agency costs of debt vs benefits of debt too provides
major incentive for a firm to foster a target capital structure.
Dynamic Trade-off Model
The above explanation described a static trade-off model in capital structure. However, the dynamic trade-
off theory of capital structure presents that although firms may deviate from its target capital structure, they
will perform an adjustment behaviour towards the target. The correct financing decision in a dynamic model
ideally depends on the financing margin the firm expects in the next period (Luigi & Sorin, 2009).
Finally, although the trade-off theory straightens out a lot of doubts and criticisms of the precursor theorem
of M&M, it still suffers from its own drawbacks. For instance Jensen & Meckling, (1976) questions the use of
debt, in the absence of taxation. The authors debate that debt finance was commonly used even before the
current tax subsidies on interest payments came into play. Further they argue how the trade-off theory can

Chapter 5: CEO’s Cultural Values and Firms’ Leverage Decisions
115
explain the use of preferred stock or warrants in the capital structure that have no tax advantage 48. These
questions illustrate that the trade-off theory too only partially explains the actual financing behaviour of
firms. In addition Myers (1984) argues that if there really is a target capital structure, the observed debt-
equity ratio of a firm should be its optimal ratio. However, if any firm is knocked away from the optimal point
due to any random event, it may have to incur a cost in adjusting back to the optimal point, which would also
take place at a time lag. According to the author, this can explain the dispersion of debt-equity ratios among
firms in the same industry. However, the static trade-off theory does not consider the costs of adjustment as
a first-order concern. On the other hand Myers (1984) argues that the trade-off model oversimplifies the tax
code and that all firms do not necessarily face the same marginal tax rate. Furthermore he points out that
there are firms with large unused losses carried forward, with no tax liability in the immediate future, whereas
some other firms that pay taxes today may not do so in the future, in which case the tax shields alone is
insufficient to justify the use of debt. Finally Myers (1984) point out that static trade-off model captures only
a fraction of the actual observed financing behaviour of firms, resulting with an unacceptably low R2.
5.2.2.3 The Pecking Order Theory
The aforesaid criticisms of the trade-off model pave the way for new theories to explain the financing
behaviour. As a result, Myers (1984); Myers & Majluf (1984) proclaim that firms generally follow a pecking
order when financing the firm, in which firms choose internal over external financing, followed by debt over
equity. A firm’s retained earnings are classified as internal financing whereas both debt and equity financing
are considered as external sources of finance. Hence, the pecking order model of capital structure postulates
that if a financing need arises, a firm roughly follow the order of retained earnings first, followed by debt and
equity as the last resort.
Although Myers (1984) acknowledges that issue costs might be one possible explanation to the pecking order
of financing, he further states that issue costs may not be substantial enough to supersede the benefits of
debt financing introduced by the static trade-off theory. Hence Myers (1984); Myers & Majluf (1984)
introduced a remarkable yet a very different explanation from static trade-off model. They believe that this
order of preference, can be explained from an ‘asymmetric information’ perspective and along with elements
of static trade-off.
Information Asymmetry and Signalling Theory
Information asymmetry occurs, when one party possesses or has access to more or better information than
another party, which causes an imbalance of information when performing a transaction. Although
information asymmetry is not confined to a firm, an ideal example of information asymmetry would be the
imbalance of information between managers and external stakeholders. For instance, managers of a firm has
more and rich information about the firm’s operations than external parties such as creditors or investors.
48 Jensen & Meckling (1976) later answer their own question and affirm that although preferred stock is very similar to debt in every aspect, the preferred stock holders cannot put the firm into bankruptcy in the event of non-payment of the preferred dividends, which is highly valued by firms.

Chapter 5: CEO’s Cultural Values and Firms’ Leverage Decisions
116
The basic tenets of signalling was first presented by Akerlof (1970) in the context of an automobiles market
(see note Chapter Note 5.2). However this was later developed into an equilibrium theory by Spence (1973),
where he focused on job market dynamics (see Chapter Note 5.3). Rothschild & Stiglitz (1976) underlines
information asymmetry and signalling dynamics in insurance markets and Riley (1975) in job markets.
Phenomena of information asymmetry and signalling are very intuitive; they can be applied to many other
domains49.
Leland & Pyle (1977) in their influential research observed the information asymmetries that can exist
between a borrower and a lender in the context of a financial market. They express that although lenders
would benefit by having more informed information about the borrower, the direct flow of information
transfer would be hampered by moral hazard. Borrowers would conceal information about the firm, and it
would be either very costly or sometimes impossible for the lenders to find out the true characteristics of the
firm50. Similarly, Ross (1977), studies the information asymmetry that exists between the managers of a firm
and its creditors/shareholders. He explains that a situation of information asymmetry occurs when a manager
possesses inside information which creditors and shareholders lack access to.
Myers (1984) in page 582-584 provides the following example to illustrate how information asymmetry would
work its way towards influencing the managers to follow a pecking order for financing. Assume that a firm
requires $10 million to invest in a new profitable venture. However if the manager foresee that the firm will
have to issue shares worth of $12 million to raise $10 million, as the firm equity is undervalued in the market,
he / she will be worried about the value of the existing shareholders stake in the firm and would not proceed
with the sale of equity, as it would further degrade the value of the firm. In other words, the firm will only
issue more equity, if the managers perceive that firm equity is overvalued. This implies that a firm would
rather shun from an investment with a positive net present value than issuing undervalued shares.
49 Rock (1986) attempts to explain why Initial Public Offerings (IPOs) are under-priced in terms of signalling effects. Bhattacharya (1979, 1980); John & Williams (1985) affirm dividends signals the profitability of the firm.
50 However according to Leland & Pyle (1977), this would have detrimental effects on the financial market. The authors claim that, as the market can’t distinguish between “good” projects and “bad” projects, the market will assign a value to a particular project that will indicate an average quality. However, for bad projects, this average value may be higher than its cost, resulting with a profit for the entrepreneurs and subsequently the market will be flooded with bad projects. This would however escalate the cost of capital and consequently, good projects that are known by the entrepreneurs to generate a sound return will also be too costly to undertake. Hence Leland & Pyle (1977) affirms that in financial markets, informational asymmetries are particularly pronounced, as in the presence of substantial informational asymmetries and if the supply of poor projects is greater than the supply of good ones, venture capital markets may fail to exist. Nevertheless, in such a situation, the information asymmetry can be tapered to some extent by the actions of entrepreneurs that “speak louder than words”. Thus, if entrepreneurs invest in their own projects, it would send good signals to the market about its potential and would win the trust of lenders. Thus Leland & Pyle (1977) affirm that the value of the firm increases with the share of the firm held by the entrepreneurs.

Chapter 5: CEO’s Cultural Values and Firms’ Leverage Decisions
117
Only the managers would know whether their stock is overvalued or undervalued, as they have access to
better information about the firm than creditors and investors (shareholders). Hence the decision rule for a
firm should be to issue equity if firm stock is overvalued and to issue debt if firm stock is undervalued.
However, it would be impractical to assume that investors are not aware of the decision rule. Hence if an
investor know that a firm will only issue equity when it is overpriced and debt otherwise, investors would
restrain themselves from buying equity until the debt capacity of the firm is fully exhausted, eventually
forcing the firm to follow a pecking order (Myers, 1984; Myers & Majluf , 1984).
This sheds light on the well-known “signalling” effect of the financing decision that emanates from the
existence of information asymmetry between management and shareholders. Thus, as identified above, if
the management issues new equity, it would signal to the shareholders (investors) that the firm equity is
overvalued and vice versa, if new debt is issued.
As evident from the above discussion, pecking order theory mainly revolves around two underlying facts;
first, that external financing involves a cost and this cost is not limited to administrative costs, underwriting
costs and costs related to under-pricing of new securities but also those costs that will arise as a result of the
existence of asymmetric information. Put differently, the cost of missing a profitable investment with a
positive NPV, if no securities are issued, is also considered as a potential cost of external financing. Second,
similar to trade-off theory but perhaps for different reasons, it believes that issuing debt is more beneficial
than equity. The general rule as pronounced by Myers (1984) is to “issue safe securities before risky ones”
(p.584).
In summary, Myers (1984); Myers & Majluf (1984) condences the modified pecking order as follows. Firms
will avoid the issuance of equity and other risky securities as much as possible to finance new investments
and also will avoid having to forego a profitable venture with a positive net present value or issuing equity at
a price they think is too low. The firms maintain target dividend payout ratios, so that funding requirements
can be met with retained funds. However this doesn’t imply that firms will curtail its investments and will
only invest as long as it can be met by internal funds. Firms will pursue new ventures with debt finance but
will attempt to keep debt at a safe level, in order to first, minimise financial distress costs and second, “to
maintain financial slack in the form of reserve borrowing power” (Myers, 1984, p. 589). However as target
dividend payout ratios are sticky and investment opportunities tend to vary relative to internal cashflows, the
firm at times may not be in a situation to issue safe debt. In such a situation, the firm will choose less risky
securities first, such as risky debt and convertibles before common stock.
Although the authors state that the above explaination can be “grossly oversimplified” and “underqualified”
the theory was plausible enough to stimulate a glut of subseqeunt research on capital structure. For instance,
Shyam-Sunder & Myers (1999) test the two theories, pecking order and static trade-off model and advocates
that the former has more explanatory power than the latter in determining the external debt financing. They
further exlain that the strong performance of the pecking order model does not occur only because firms
tend to finance unexpected cash needs with debt in the short run, but their empirical evidence reveals that
“firms plan to finance anticipated deficits with debt” (Shyam-Sunder & Myers, 1999, p.242).

Chapter 5: CEO’s Cultural Values and Firms’ Leverage Decisions
118
However, in a given point of time, what if the equity market looks more promising than the debt market?
Should the manager overlook the optimism and reach out for the debt market? Can the above two mentioned
theories fully explain the financing behaviour of a firm? A more recently developed theory, but a relatively
old idea, known as the “market timing theory”, attempts to address this issue.
5.2.2.4 Market Timing Theory
Baker & Wurgler (2002) point out that apparently firms “time” their security issues and that they issue equity
when stock prices have soared and repurchase them when the prices plummet. The authors state that this
behaviour has been evinced by previous studies that have investigated the actual financing decisions of firms,
long run returns followed by equity issues and repurchases, realised and forecast earnings around equity
issues and by studying surveys of managers.
In their pathbreaking study, Baker & Wurgler (2002) affirm that market timing has large and persistent effects
on capital structure and further postulate that low debt firms are the ones that raise their funds when the
market valuations are high and highly levered firms are the ones that raise their funds when their market
valuations are low. In other words, Baker & Wurgler (2002) argue that fluctuations in market values have
very long run implications on capital structure, which has not been explained by the traditional theories of
capital structure. Market timing theory does not believe in an optimal capital structure and presents that it
is merely the cumulative outcome of attempts to time the equity market.
As per this theory, managers believe that they can time the market, which is also illustrated in the study of
Graham & Harvey (2001). Not only that CFOs have admitted that they attempt to time the equity market, but
the survey of Graham & Harvey (2001) also suggests that the extent to which the stock has being overvalued
or undervalued is an important consideration when planning a new equity issue.
In essence, market timing theory suggests that managers look at prevailing conditions in both debt markets
and equity markets. In other words, if the company needs financing they will use whichever market which
looks more favourable at that time. However, if both markets do not look favourable, the fund raising may
be deferred. On the other hand, if prevailing conditions look unusually positive, then managers tend to raise
funds, even if it is not currently required.
5.2.3 Determinants of Capital Structure
This section discusses an array of factors that have been documented to have a bearing on a firm’s capital
structure. Most of these factors are controlled for in the econometric specification employed in this study.
5.2.3.1 Firm and industry related determinants of capital structure
An extensive body of previous research have empirically tested the capital structure theories, by employing
an array of proxies that are widely recognised to best capture the firm and industry heterogeneities. A fair
representation of such firm and industry related determinants of capital structure are discussed in detail
below:

Chapter 5: CEO’s Cultural Values and Firms’ Leverage Decisions
119
Tangibility
This refers to the value of tangible assets, such as property, plant and equipment, owned by a firm. Tangibility
can affect a firm’s capital structure in several ways.
In line with the static trade off argument, when a firm possesses more tangible assets, external parties find it
easy to value the firm reliably. This would result with lower financial distress costs and leads to higher
borrowing (Booth et al., 2001; Frank & Goyal, 2009). Further, if a firm owns significant tangible assets, it
would retain more firm value in liquidation (Rajan & Zingales, 1995). Hence the lenders are more willing to
supply loans resulting with higher leverage. Both above arguments imply a positive relationship among
tangibility and firm leverage.
Furthermore, tangible assets are generally used as collaterals when issuing debt. Scott Jr. (1977) argues that
the issuance of secured debt can increase firm value, even in the absence of corporate taxes51. Thus, firms
tend to borrow more implying a positive association between tangibility and firm leverage. Moreover,
tangibility can moderate agency cost problems, as debt secured by tangible assets confines the firm to use
the borrowed funds only for pre-agreed or specified projects, thereby mitigating the agency costs between
the debt providers and the managers. Therefore tangible assets / collaterals evinces a positive association
with firm leverage (Titman & Wessels, 1988).
Furthermore, if a firm owns a higher proportion of tangible assets / collaterals, lenders can protect
themselves from the possible costs of “risk shifting”52 by shareholders (Rajan & Zingales, 1995). The existence
of collaterals in a firm mitigates the agency costs between stockholders and debt-holders by protecting the
latter from possible risk shifting activities and compensates them to lend more, implying a positive
relationship.
51 According to Scott Jr. (1977), a firm could run in to many “hazards” when engaging in commercial activity. One such potential risk is filing of a lawsuit by a disgruntled customer, supplier, an injured employee or any other party and winning legal damages from the firm. Hence a firm is likely to become obligated to pay future legal damages. Other future costs include sales taxes, property taxes, excise taxes and the administrative costs of bankruptcy (Fama and Miller, 1972, as cited in Scott Jr., 1977) . The present value of all such expected future costs forms a liability of the firm. However, by issuing secured debt, the firm can reduce the amount available to pay the potential legal damages and other future costs, in the event of bankruptcy, because secured creditors are ranked ahead of claims for legal damages. Furthermore, importantly, potential winners of legal suits are unable to prevent the firm from issuing secured debt, if at the time of issuance they do not yet have cause for legal action. Consequently, the issuance of secured debt, reduces the probability that these future costs are paid, and as a result would increase firm value.
52 Risk shifting describes a situation where managers of a firm in financial distress taking on excessive risks, with the aim of generating high return for its owners. Equity holders may face little additional downside risk of such a risky venture but may garner excessive extra return. This action shifts the risk from shareholders to debt-holders.

Chapter 5: CEO’s Cultural Values and Firms’ Leverage Decisions
120
However, in contrast, tangibility of a firm can depict a negative association with firm leverage in following
circumstances. In general, it is believed that managers tend to consume more than the optimal level of
perquisites. However highly levered firms are closely monitored by lenders due to the higher treat of
bankruptcy, thereby curtailing the suboptimal behaviour of managers. Debt monitoring becomes more
intense in firms with less collaterals, as monitoring the capital outlays of such firms is probably more difficult,
resulting with higher agency costs. Thus debt monitoring is more valuable in firms with low tangible assets as
collaterals. Therefore such firms tend to borrow more, to curtail managers from consuming excessive
perquisites, implying a negative relationship (Titman & Wessels, 1988).
Alternatively, pecking order hypothesis makes different predictions regarding tangibility and firm leverage.
As explained above, when a firm owns substantial tangible assets, external parties find it easy to value the
firm reliably. Higher tangibility provides signals to external parties, about the internal financial health of the
organisation. Thus, tangibility causes low information asymmetry, making equity issuance less costly. The
bottom line is tangibility can motivate the firms to issue more equity and borrow less, resulting with a
negative relationship (Frank & Goyal, 2009). However, if the adverse selection is about assets in place,
tangibility increases adverse selection and leads to increased debt, depicting a positive relationship. Frank &
Goyal (2009), state that this ambiguity stemmed under the pecking order theory infers that tangibility acts as
a proxy for different economic forces53.
Asset Maturity
Myers (1977) posit that agency costs of debt can be largely reduced by a firm if the maturity of its debt are
matched with the maturity of its assets. Therefore it is expected that firms with long-term assets have more
long-term debt and vice versa (Barclay et al., 2003; Scherr & Hulburt, 2001).
Uniqueness
‘Tangibility’ above explained the role of fixed assets in shaping the leverage decision of a firm. However, many
previous scholars have shown that not only the tenure but also the nature or type of assets play a significant
role in firm leverage decisions.
53 The above explanation illustrates how tangibility can influence firm leverage based on arguments put forward by static trade off and pecking order theories. The underlying rationale behind the above arguments supported by the static trade off theory is that tangible assets are easy to collateralise and therefore reduce agency costs of debt. However Berger & Udell (1995) portrays that, those firms who maintain a good rapport with its creditors need to provide less collateral. This is because close relationships lead to more informed monitoring by creditors which ultimately substitutes the requirement for physical assets. Hence Rajan & Zingales (1995) proclaim that tangibility should matter less in countries that has a strong banking system such as in Japan and Germany, compared to countries with stronger capital markets (e.g. US and UK).

Chapter 5: CEO’s Cultural Values and Firms’ Leverage Decisions
121
Titman, (1984) emphasises that if a firm is engaged in producing a unique or specialised product, in line with
the trade-off theory, its workers, suppliers and customers may face higher liquidation costs. The employees
and suppliers may possess job specific skills, capital and other processes and customers may find it difficult
to substitute the said product with another in the market. Thus, a unique firm faces higher financial distress
costs relative to an average firm. Therefore in order to protect the unique assets, a firm may have less debt
(Frank & Goyal, 2009; Titman & Wessels, 1988). This indicates a negative association.
Firm growth
Growing firms may have high profitable investment projects in the pipeline but have low or no free cash
flows. Therefore in accordance to the static trade off theory, growing firms face higher costs of financial
distress and as a consequence are impotent of higher borrowing, portraying a negative association between
firm growth and debt (Frank & Goyal, 2009).
Shareholders, in general, tend to invest sub-optimally to expropriate wealth from debt-holders, generating
agency issues between shareholders and debt-holders. Such agency costs are more intense in rapidly growing
firms as they are faced with many profitable investment opportunities. Therefore to retain flexibility and to
overcome possible debt covenants and monitoring 54 , shareholders opt for more equity and less debt,
depicting a negative relationship (Frank & Goyal, 2009; Myers, 1977; Rajan & Zingales, 1995; Titman &
Wessels, 1988).
Moreover, growth opportunities can be considered as capital assets that add value to a firm. As they are
intangible assets, they can’t be collateralised when obtaining debt. Hence high growth firms with a higher
proportion of intangible assets relative to tangible assets borrow less, implying a negative correlation (Titman
& Wessels, 1988).
In complete contrast, the pecking order theory suggests that a higher firm growth infers a positive
relationship with firm leverage. The underlying rationale is that high growth firms, as explained above, may
be faced with abundant profitable investment opportunities but are short in cash. Higher investment
opportunities place a strain on firm’s retained earnings and thereby increase borrowing, implying a positive
association (Frank & Goyal, 2009).
However, market timing theory of capital structure too predicts a negative relationship among firm growth
and debt levels, in line with the static trade off theory. The market to book asset ratio is the most commonly
used proxy for growth opportunities (Frank & Goyal, 2009). A higher market to book asset ratio however, can
also be affected by stock mispricing. Thus, in line with market timing proposition, firms tend to issue more
54 However it should be noted that the agency costs of debt can be mitigated by obtaining short-term debt (Myers, 1977) or convertible debt (Green, 1984; Jensen & Meckling, 1976; C. W. Smith & Warner, 1979).

Chapter 5: CEO’s Cultural Values and Firms’ Leverage Decisions
122
equity, in order to exploit the equity mispricing and less debt, inferring a negative correlation between high
growth and firm leverage.
Firm Size
Large, more diversified, firms are generally believed to face lower default risk (Ang et al., 1982; Frank & Goyal,
2009; Rajan & Zingales, 1995; Warner, 1977). Thus trade off theory predicts large firms to borrow more, which
infers a positive relationship55.
However, in contrast, Titman & Wessels (1988) affirms that cost of issuing debt or equity securities is also
corelated with firm size. Small firms pay substantial issue costs when issuing new equity relative to debt (C.
W. Smith, 1977). This infers that small firms tend to borrow more, in order to overcome high issue costs
related to equity issues, portraying a negarive association among firm size and leverage. Smith (1977) also
asserts that firms still incur a significant cost when issuing long-term debt when compared to short-term debt
(through bank loans). Therefore firms would prefer short-term debt over long-term debt financing.
Pecking order theory contradicts the direction predicted by the trade-off theory. The advocates of pecking
order hypothesis argue that larger firms would borrow less, as they possess higher retained earnings. This
suggests a negative relationship among firm size and leverage (Frank & Goyal, 2009). On the other hand,
larger firms may have low informational asymmetries between insiders of the firm and capital markets.
Therefore firms are able to issue more informationally sensitive securities, such as equity (Rajan & Zingales,
1995). This depicts a negative relationship with firm size and debt.
Profitability
If a company is highly profitable, it reduces financial distress costs and as per the notions of the trade-off
theory, would tempt firms to borrow more (Frank & Goyal, 2009). On the other hand, high profitability would
make the tax shields more valuable and thus in line with the trade-off theory, firms would borrow more. Both
these arguments depict a positive association among profitability and firm leverage. Furthermore, from the
supply side, lenders would be more confident to lend to profitable firms, thereby implying a positive
relationship again (Rajan & Zingales, 1995).
Profitability plays a role in influencing firm leverage, even in an agency perspective. Highly profitable firms
face intense free cash flow problems resulting with severe agency issues between managers and shareholders
55 According to the trade-off theory, size is considered as a proxy for the (inverse) probability of default. However, in some countries, firms are tied to main banks and such firms face low financial distress costs, because the main bank organises corporate rescues (Hoshi et al., 1990; Sheard, 1989). Therefore, in such a backdrop, size may not matter in explaining firm leverage.

Chapter 5: CEO’s Cultural Values and Firms’ Leverage Decisions
123
(Jensen, 1986). Therefore, debt discipline and monitoring is perceived to be important, and firms would end
up borrowing more, indicating a positive association.
In contrary, Rajan & Zingales (1995) affirm that when a firm is enjoying high profitability, the managers would
not prefer to curtail their discretionary power caused by intense debt monitoring, thereby choosing less debt.
Pecking order theory, however, predicts a more straightforward relationship among profitability and firm
leverage. When a firm generates higher profits, they would maintain higher retained earnings. Thus a firm
need not seek external financing, inferring a negative relationship among firm profitability and leverage.
Taxes
The role of taxes in determining the firm leverage is apparent and well-known. According to trade-off theory,
debt servicing payments, such as interest costs, are tax deductible and is one of the main advantages of debt
financing. A tax deduction lowers the tax liability of a person or firm by lowering the taxable income. Put
differently, the taxable income is lowered by those expenses that are incurred by a firm throughout the year
and are allowed to be subtracted from the gross income, in order to arrive at the tax liability. Therefore, it
can be assumed that higher taxes would motivate the firm borrow more, in order to take advantage of the
tax shields, implying a positive association between taxes and firm debt (Frank & Goyal, 2009).
Non-Debt Tax Shields
The previous paragraph highlighted how firms can exploit the tax deductibility of interest payments, in order
to increase firm value. DeAngelo & Masulis (1980), however, indicate that there can be other tax shields in
an organisation that may not be debt-related, such as depreciation deduction and investment tax credit.
These expenses are substitutes for the tax benefit of debt (DeAngelo & Masulis, 1980) as depreciation,
investment tax credits, net operating loss carry-forwards etc. too are deducted from the gross income, to
arrive at the taxable income thereby ultimately reducing the tax liability. Therefore a firm with substantial
non-debt tax shields will lose the motivation to borrow (induced by the tax advantage) and will borrow less,
depicting a negative correlation (Frank & Goyal, 2009; Titman & Wessels, 1988) .
Volatility
Titman & Wessels (1988) and Frank & Goyal (2009) among many other researchers underline the influence
of volatile cashflows in determining firm debt levels. In line with the trade-off theory, if a firm is experiencing
volatile cashflow, it faces higher financial distress costs and thereby reduces borrowing, implying a negative
relationship. Further Frank & Goyal (2009) argue that more volatile cash flows reduce the possibility that tax
shields are fully utilised. The loss of tax benefit of debt will discourage firms to borrow further.
According to pecking order hypothesis, it can be argued that volatile firms suffer more from adverse selection.
Hence they would opt for more borrowing (Frank & Goyal, 2009), portraying a positive relationship.

Chapter 5: CEO’s Cultural Values and Firms’ Leverage Decisions
124
Industry median leverage
Industry leverage is another important piece in the capital structure puzzle. It is well-known that capital
structures display a significant variation across industries (Lemmon et al., 2008). For instance, Titman, (1984)
suggests that firms manufacuring products that require specialised servicing and spare parts will find
liquidation costly. Hence firms manufacturing machines and equipment have relatively low debt levels in their
capital structure.
Frank & Goyal (2009) claim that industry differences in determining firm debt may have several possible
interpretations. First, firms may use the industry leverage as a benchmark, as they decide on their own capital
stucture. In fact, in congruence with the trade-off theory, many previous scholars contend that industry
median leverage is often a proxy for target capital structure (Faccio & Masulis, 2005; Hovakimian et al., 2001;
Hull, 1999).
Second, according to Frank & Goyal (2009), industry effects represent a set of correlated factors that may
otherwise be ommitted from the analysis. Firms in an industry face common external factors, such as the
nature of competition, product market interactions, types of assets, business risk, regulations, technology
etc. that would all affect the financing decision. Hence under trade-off theory, a higher industry median
leverage may be accompanied by higher debt, illustrating a positive relationship.
Industry concentration
A concentration ratio determines the fraction of some industry activity, be it sales, employees or assets, that
is controlled by a few number of organisations (Melicher et al., 1976). Firms in highly-concentrated industries
are mostly large in size, enjoy higher profitability (MacKay & Phillips, 2005) and more risky (Kayo & Kimura,
2011). Thus Brander & Lewis (1986) posits that when firm risk is high, equity-holders may pursue risky
strategies and would have higher leverage ratios, to transfer the risk to debt-holders. In contrast, equity-
holders may reduce firm leverage as they do not receive the full benefit of investment (Kayo and Kimura,
2011), especially if company is in financial distress. Therefore the ultimate direction between industry
concentration and firm leverage is an empirical question.
Access to debt markets and credit ratings
When the access to debt markets is restricted in a particular country, all else equal, firms would finance
through equity markets (Faulkender & Petersen, 2006). Access to debt markets can be proxied by firms having
a debt rating. Hence a firm with a debt rating would have higher access to debt markets and consequently
would have higher borrowing, implying a positive relationship.
According to the pecking order theory, firms with a debt rating undergo a process of information revelation
carried out by the credit rating agency. Hence a firm with a credit rating would have less adverse selection
issues. This would result with less debt in capital structure and more equity (Frank & Goyal, 2009). In a similar

Chapter 5: CEO’s Cultural Values and Firms’ Leverage Decisions
125
vein, Kisgen (2006) argues that when a firm is close to a ratings change, it issues less net debt relative to net
equity, as managers view ratings as a signal of firm quality, among other reasons.
Moreover, in addition to corporate ratings, sovereign credit ratings too play a key role in shaping the firm
leverage decision. For instance, Almeida et al. (2017) empirically demonstrates that a sovereign debt
impairment may increase the cost of debt capital, which may impel firms to reduce their investments and
dependence on credit markets.
Stock Market condition
Welch (2004) affirms that stock returns are more important in explaining debt-equity ratios than most of the
well-known determinants taken together. Strong market performance will be followed by a drop in market
leverage (Frank & Goyal, 2009). Hence as per the static trade-off theory, low market debt ratios would
encourage a company to issue more debt, in an attempt to move towards the optimum level, implying a
positive relationship between stock market perfomance anad firm leverage.
From a market timing perspective, when stock prices are high, firms would issue more equity to take
advantage of the high prices. This leads to a negative association with firm debt (Frank & Goyal, 2009).
Macro-economic condition
Hochman & Palmon (1985) establish that inflation increases debt financing. According to (Jaffe, 1978;
Modigliani, 1982; Modigliani & Cohn, 1979) the nominal interest payments comprise of the true interest
payment and a compensation for the reduction in the real value of the principal. Thus, as firms are allowed
to deduct their entire interest expense, including the component that is a reduction of the capital amount,
firm’s cost of debt is reduced. As a result a firm would have increased debt in their capital structure (Hochman
& Palmon, 1985). Similarly, Gordon (1984) asserts that a higher inflation would result with a higher nominal
interest rate, reducing the taxable income. Thus, as per the notions of the trade-off theory, firms would
borrow more, when inflation is high, in order to utilize the tax advantage.
Market timing theory postulates that firms issue more debt when expected inflation is higher relative to
current interest rates, again deriving a positive relationship (Frank & Goyal, 2009).
In addition, Gertler & Gilchrist (1993) discuss how recessionary conditions in an economy would affect a firm’s
capital structure. They reveal that although a recession that is induced by monetary contractions will be
followed by economic expansions. During an expansion, stock prices improve, expected bankruptcy costs
plunge, taxable income boosts and so does cash flow. Therefore, firms tend to borrow more. Furthermore, if
firms borrow against collateral, values of collateral would also go up during an expansion, inducing firms to
borrow more. Hence firm leverage is pro-cyclical (Frank & Goyal, 2009).
However from an agency perspective, during an economic downturn (monetary contraction), managers’
wealth substantially reduces, relative to shareholders. This would lead to severe agency problems between

Chapter 5: CEO’s Cultural Values and Firms’ Leverage Decisions
126
the two parties. As debt is able to mitigate agency conflicts, it can be applied that firms use more debt during
a contraction, in order to dicsipline their managers (Frank & Goyal, 2009). Thus debt in this situation is
counter-cyclical. This demonstrations that trade-off theory produces ambiguous predictions with regard to
economic condition and firm debt.
Further pecking order hypothesis pronounces that during an expansion, a firm would have higher internal
funds and thus would decrease debt (Frank & Goyal, 2009).
Survey Evidence by Graham & Harvey (2001)
Interestingly, a comprehensive survey carried out by Graham & Harvey (2001) that involved 392 Chief
Financial Officers (CFOs) from 4,440 member firms of the Financial Executives Institute, reveal that firms
appear to overlook finance theory and instead rely on “practical, informal rules of thumb” (p.189), when
making capital structure decisions.
According to their survey the main purpose of the debt policy is not to drive down the cost of capital but to
retain financial flexibility. About 60% of the participant firms indicated maintaining financial flexibility and
credit ratings as “important” or “very important”. Corporate tax advantage was moderately important in
capital structure decisions, with about 45% firms describing it as either “important” or “very important”.
Notably, these are the firms that are likely to have high marginal tax rates. Firm size apparently is an important
factor in determining the leverage. A majority of large companies stated that they have “strict” or “somewhat
strict” target debt ratios, whilst only a third of small firms claimed to have target debt ratios.
On the other hand, according to survey results, a large percentage of the participant firms indicate reluctance
to issue common equity, as managers feel their stock is undervalued. They would only issue equity if stock
prices are soaring, mainly due to their concern about diluting Earnings per Share (EPS). As an alternative,
many companies issue convertible debt 56 , especially in high growth companies. Reluctance to issue
undervalued equity, is in line with the beliefs of the well-known pecking order theory. This model points out
that information costs are severe for small high-growth companies. However, Graham & Harvey (2001)
indicate that according to their survey results, small but high-growth firms in their sample do not consider
equity undervaluation as an important factor in their leverage decision. Stock prices apparently are decisive
56 Convertible debt gives the lender the right to convert the debt into common equity on a future date. Put differently, both parties in a debt contract enter into an agreement, to repay all or part of the loan by converting it to a certain number of common shares of the firm, on a future date. Graham & Harvey (2001) declare that the conversion feature of convertible debt makes its value relatively indifferent to information asymmetries between management and investors (explained under pecking order theory). If managers perceive their equity to be undervalued, they can issue convertible debt, to avoid a substantial dilution of value associated with equity issues. On the other hand, managers can overcome a situation of excessive debt and increased financial distress costs by using the conversion feature of convertible debt. In this sense, Graham & Harvey (2001) refer to convertible debt as “delayed common stock” or “backdoor-equity”.

Chapter 5: CEO’s Cultural Values and Firms’ Leverage Decisions
127
for large firms. Hence it can be seen that survey findings do not seem to advocate either the trade-off theory
or pecking order model in full.
Nevertheless, it can be seen that the information costs apparently influence the form and timing of specific
financing choices. Almost two thirds of the CFOs chose recent stock prices as an “important” or “very
important” factor when issuing equity. Thus, survey findings give clear indication that executives attempt to
time the market. The evidence also suggests that large firms are more likely to be involved in market timing.
A possible reason can be that large companies have more flexibility in timing issues as they have access to
large cash resources and financial markets.
5.2.3.2 Behavioural Biases and Traits of Managers as Determinants of Capital Structure
Existing theories such as the trade-off, pecking order and market timing identifies firm / industry and market
related determinants of capital structure, as explained above. However, given that the firm’s financing
decision is in the hands of the manager and the lack of a clear basis or theoretical guidance on how decision
is made, it is equally important to consider managerial traits and behavioural biases. In fact, Hackbarth (2008)
puts forward that managerial traits generate heterogeneity among otherwise homogeneous firms. Bertrand
& Schoar (2003) tests the effect of managerial fixed effects on several firm policies, such as the investment
policy, financing policy, organisational strategy and performance and concludes that managerial fixed effects
have a statistically significant influence on all policies except for firm performance.
Overconfidence and Optimism Biases
Overconfidence and optimism are two well-documented types of biases in psychology and later in
behavioural finance research (Hackbarth, 2008). Gervais (2009) has highlighted managerial overconfidence
in capital budgeting and explains that overconfident individuals overestimate the precision of their
knowledge and information. Heaton (2002, p.33) indicates that managers are optimistic when they
“systematically overestimate the probability of good firm performance and underestimate the probability of
bad firm performance”.
Hackbarth (2008) models how managerial overconfidence and optimism influences the capital structure
decisions of a firm. According to him, optimistic managers are biased in terms of growth perception and
overconfident managers are biased in terms of their risk perception. Put differently, optimistic managers
overestimate the growth rate of earnings (growth perception bias) whilst overconfident managers
underestimate the riskiness of earnings (risk perception bias). Either way, as the managers’ view is influenced
by managerial traits, they differ from the market view. Growth perception bias upholds the view that their
firm is more profitable than it really is and less prone to financial distress. Thus they (optimistic managers)
choose more debt. On the other hand, risk perception bias nurtures the view that their firm is less risky than
it actually is. Thus they (overconfident managers) believe that their firm is less likely to experience financial
distress and would prefer more debt. The choice of higher debt levels, on the other hand, can help to mitigate
agency conflicts. First, high debt levels constrain available free cash flows to managers, thereby, unknowingly
mitigating managerial discretion and the agency conflicts between manager and shareholders. Second,

Chapter 5: CEO’s Cultural Values and Firms’ Leverage Decisions
128
although high debt levels aggravate “underinvestment” problems, mildly biased managers are assumed to
invest earlier than unbiased managers and this is expected to attenuate underinvestment problem. Finally,
Hackbarth (2008) concludes that mildly biased managers can in fact improve firm value.
On the other hand, Malmendier & Tate (2007) explain that overconfident CEOs overestimate their ability to
generate value and future cash flows of the firm. Thus in their empirical study, they indicate that
overconfident CEOs perceive risky securities to be undervalued and reluctant to seek external financing. In
the extreme, this reluctance can lead to debt conservatism. If, however, they do raise external finance, they
would choose debt over equity. In a dynamic setting Malmendier, Tate, & Yan (2011) test the same hypothesis
and conclude that the observable debt conservatism may be a result of overconfident CEOs accumulating
spare riskless debt capacity, in anticipation of future investment, more than the rational investors.
As explained above, theories on asymmetric information between lenders and borrowers assume that
borrowers are better informed than lenders. However de Meza & Southey (1996) reverses this information
structure in their paper and suggest that entrepreneurs, or more specifically applicants for start-up finance,
are relatively naïve and optimistic, whereas banks are efficient processors of information, as banks have a
wealth of case histories to draw on. The authors identify optimism as the disposition to overestimate the
chance of good outcomes, whilst underestimating the likelihood of bad outcomes. Therefore, excessively
optimistic entrepreneurs, when obtaining external finance, would choose a finance contract that would
minimize the payments to the financier, when the firm is in a good state. This resembles to a regular debt
contract. They conclude that optimistic entrepreneurs “are drawn to business and excessive bank loans much
as lemmings are drawn to the sea” (de Meza & Southey, 1996, p.385)
Managerial Entrenchment
Berger et al. (1997) describes managerial entrenchment as the degree to which managers do not experience
discipline from the range of corporate governance and control mechanisms that are in place in an
organisation, such as the monitoring of the board, stock or compensation based performance incentives and
the threat of dismissal or take-over. In their empirical analysis, they operationalise managerial entrenchment
through several variables, viz. CEO tenure (long tenure meaning high entrenchment) performance related
compensation (low if high managerial entrenchment), number of board of directors (high if high managerial
entrenchment), number of outside directors (low inferring high managerial entrenchment), major
stockholders (none if high managerial entrenchment). These characteristics would also evince poor
monitoring in a firm that leads to high managerial entrenchment, which would ultimately result with low
borrowing. Findings reveal that entrenched managers dislike the interest commitments and performance
pressures associated with debt financing. Thus, in such firms leverage levels are low. However in an extended
analysis, the authors studied the aftermath of several events, such as unsuccessful tender offers, involuntary
CEO replacements and addition of major stockholders to the board, that are perceived to represent a negative
shock to CEO security. As expected, in the wake of events that threatens the job security, CEOs tend to
increase leverage either to increase firm value, to increase their personal voting control or as a defensive
measure to keep raiders away. This finding is in line with Jensen's (1986) argument that as leverage reduces

Chapter 5: CEO’s Cultural Values and Firms’ Leverage Decisions
129
managerial discretion, managers may not choose to issue optimal amount of debt without the pressure from
a disciplining force.
5.2.3.3 Observable Managerial Characteristics as Determinants of Capital Structure
Behavioural biases and managerial traits are difficult to be observed and empirically measured. Therefore,
one approach followed by previous researchers has been to study the observable characteristics of managers,
such as their age, gender and education.
Upper Echelons Theory
Hambrick & Mason (1984), introduce an upper echelons perspective that states that “organisational
outcomes, both strategies and effectiveness – are viewed as reflections of the values and cognitive bases of
powerful actors in the organisation” (p.193). The underlying argument here is that top executives matter in
shaping organisational outcomes57.
However, the contrary view is that large organisations are swept along by external events and are somehow,
run themselves. However, according to the theorists of Carnegie School, complex decisions are largely the
result of behavioural factors (March & Simon, 1993) and bounded rationality58, multiple and conflicting goals,
myriad options and varying aspiration levels, all serve to kerb the degree to which complex decisions can be
made on a techno-economic basis (Hambrick & Mason, 1984).
The theory expects that, to a certain degree, the linkages between organisational strategies and the values
and cognitive bases of powerful actors in the organisation can be detected empirically. Hambrick & Mason
(1984) argue that observable background characteristics of managers can be used to predict “givens”59 that
57 Hambrick and Mason suggest that, understanding the upper echelons perspective may bring upon several benefits. Firstly, from an academic perspective, it can tighten a lot of important empirical gaps and give greater power to predict organizational outcomes, than current theories do. Secondly, it can provide valuable information for those who are responsible of selecting and developing upper level executives. Finally, a study
of upper echelons characteristics can assist strategists in predicting competitors’ moves and countermoves.
58 Simon (1991) defines bounded rationality as “the limits upon the ability of human beings to adapt optimally, or even satisfactorily, to complex environments” (p.132). Whilst the classical view upholds that managers make “rational” decisions, this viewpoint has been challenged in practice. For a decision to be made “rationally”, the decision maker should be aware of all available alternatives to a problem. Further there should be clear criterion to evaluate and compare the different alternatives. Finally once an alternative is selected, it should be the preferred one above all other alternatives (Tosi, 2009). However, this is hardly the case in practice. It is highly unlikely that a manager is aware of all possible alternative solutions for an issue. It is even less likely to adopt clear criterion to evaluate the known alternatives. Therefore, decision making will only be “rational” within certain limits. The known alternatives reflect the boundaries of decision rationality. This is the basic understanding of the bounded rationality theory.
59 March & Simon, (1993) present that a decision-maker brings in his own set of “givens” to an administrative situation. These “givens’ represent the decision maker’s cognitive bases and values (Hambrick and Mason, 1984). Cognitive bases will assist a decision maker to possess a knowledge or assumption about future events, available alternatives and the consequences attached to each alternative. On the other hand, values would guide the decision maker to prioritise and rank the alternatives or their consequences according to his or her

Chapter 5: CEO’s Cultural Values and Firms’ Leverage Decisions
130
a manager brings to an administrative situation. They further argue that background characteristics
apparently is a better choice over psychological characteristics as firstly, cognitive bases, values and
perceptions of top-level managers are difficult to measure. Second, some background characteristics (such
as functional background and tenure) may not be close substitutes for and psychological construct. Third,
limitations to standard psychological dimensions (such as locus of control, cognitive style etc.) could
unnecessarily hinder investigations.
Hambrick & Mason (1984) identifies several important managerial characteristics in their study, such as age,
functional tracks, other career experiences, education, socio economic roots, financial position and group
characteristics. Some of them, that may have an impact on the firm leverage decision, are discussed below.
Age
It has been viewed that older executives possess less physical and mental stamina, to grasp new ideas and to
learn new behaviours (Child, 1974; Chown, 1960). In contrast, younger managers aren’t afraid to try novel,
unprecedented actions and to take risks (Hambrick & Mason, 1984), resulting with higher corporate growth
and volatility of sales and earnings (Child, 1974; Hambrick & Mason, 1984)). Therefore Taylor (1975)
postulates that manager’s age is inversely associated with the ability to integrate information in making
decisions and positively correlated with the desire to seek more information and to evaluate information
accurately. Also executive age is positively associated with the time taken to make decisions.
Further an alternative interpretation is that older executives render a greater psychological commitment to
maintain organisational status-quo (J. M. Stevens et al., 1978) and that financial security and career security
is important to them (Carlsson & Karlsson, 1970). On the other hand, younger executives pursue high risk
strategies, such as unrelated diversification, product innovation and financial leverage that can result with
higher growth, significant variability in profitability from industry averages (Hambrick & Mason, 1984) .
Orens & Reheul (2013) empirically show that older CEOs are more risk averse and conservative and they hold
larger levels of cash. They prefer internal funding over external funding, thus it can be assumed that older
CEOs tend to reduce leverage in a firm. Bertrand & Schoar (2003) arrive at a similar conclusion based on their
empirical evidence. They posit that managers representing older generations are financially more
conservative, indicating low debt levels and high interest coverage.
Formal education
Education, to a large extent, can indicate a person’s knowledge and skill base. Hambrick & Mason (1984)
theorises that the amount of formal education enhances the receptivity to innovation. On the other hand,
preferences. Therefore the cognitive bases and values brought in by a decision maker act as a screen or a filter between the situation and his/her eventual perception of it.

Chapter 5: CEO’s Cultural Values and Firms’ Leverage Decisions
131
they postulate that managers with less formal management education (e.g.: an MBA) leads to a substantial
variance from industry performance averages.
Orens & Reheul (2013), on the other hand, argue that a higher education improves the capacity of information
processing, the level of open mindedness, boundary spanning and tolerance for ambiguity of executives.
Therefore they hypothesise that a higher education makes an executive less risk averse and better informed
about the external environment (Dollinger, 1984). However, their empirical analysis evinces that education
is not a significant factor determining the level of cash-holdings in the firm.
Bertrand & Schoar (2003), empirically studies the link between CEOs who are MBA graduates and the leverage
policy and theorised that CEOs with an MBA would generally follow aggressive policies in a firm and would
resultantly have higher leverage. Although a positive relationship is supported empirically, it was not
statistically significant in their study.
Financial position
According to Hambrick & Mason (1984), this indicates the stock ownership of top executives. Although the
relationship between executives’ stock ownership and corporate performance has been researched
extensively, the findings have been contradictory but generally favour the conclusion that executives’ stock
ownership does not influence corporate performance.
However as Harris & Raviv (1988) and Stulz (1988) point out, managers may seek to inflate their voting power
by increasing leverage, as a defensive mechanism over possible take-over challenges. On the other hand, the
use of debt would induce owner-managers to engage in suboptimal agency practices as explained by Jensen
(1986) and Jensen & Meckling (1976). Therefore, it can be argued that the stock ownership of a top executive
inevitably influences the firm leverage decision.
Tenure
Richard, Wu, & Chadwick (2009) posit that executives that are relatively new to a firm are eager to gain
knowledge about the organisation. Further they have an external focus and possess fresh ideas, thus usually
like to consider several alternatives (Hambrick et al., 1993). Thus, Orens and Reheul (2013) hypothesise that
new CEOs identify more investment opportunities than the long-tenured CEOs and would not hesitate to
issue new debt, if required, to pursue new investments.
On the other hand, long-tenured CEOs are generally more confident that they will not be replaced and thus
can be entrenched. Therefore as Berger et al., (1997) also point out, long-tenured CEOs may choose low debt
levels in the firm.
An alternative interpretation is that, long-tenured CEOs stand more legitimate and reliable in the eyes of the
stakeholders. Therefore the intensity of agency conflicts in these firms can be much lower (D. Miller, 1991).

Chapter 5: CEO’s Cultural Values and Firms’ Leverage Decisions
132
Therefore, firms can afford to have less debt, as the role of debt as a monitoring device may not be required
anymore.
Experience
Orens and Reheul (2013) demarcate between same-industry experience and other-industry experience.
Orens and Reheul along with (Hambrick et al., 1993) affirm that same-industry experience can cause a
routine-trap for executives and would commit them to maintain status-quo. Therefore, the outcomes of
these firms may not substantially vary from industry benchmarks. On the other hand, other-industry
experience would enhance the CEO’s professional network (Richard et al., 2009) and is believed to present
increased investment opportunities that might lead to increased firm leverage (Orens and Reheul, 2013).
Alternatively, Dittmar & Duchin (2016) employ managers’ experience from a different perspective and posit
that the professional experience of a CEO has a major influence on corporate financial policy. They argue that
if a CEO has experienced bankruptcy filing or an adverse shock to firm cash flows, stock returns or credit
ratings in a previous role choose to have lower leverage levels in the current firm and that this association is
more pronounced in firms with poor governance systems, with low investor or board monitoring.
Further Malmendier, Tate, & Yan (2011) explore the early life experiences of CEOs and conclude that CEOs
who grew up during the Great Depression are more debt conservative and rely more on internal finance.
CEOs with military experience undertake more aggressive policies, such as increased borrowing.
5.2.3.4 Cultural Background as a Determinant of Capital Structure
A handful of prior research probes into the question, i.e. whether the cultural background has an impact on
the firm leverage decision. However, the focus has remained on the national cultural background of a firm,
based on its country of origin.
One of the earliest studies in this field of research is the work carried out by Stonehill & Stitzel (1969). They
observe that although financial structures of firms in the same industry indicate the existence of a target
capital structure, a substantial level of intra-industry variation exists, implying otherwise. They further
postulate that industry norms dissipate when studying firms in the same industry but in different countries.
They study 463 firms in nine selected industries of eleven developed countries (viz. Belgium, Netherlands,
Luxembourg, France, West Germany, Italy, Japan, Sweden, Switzerland, UK, US) and conclude that cross-
country variations in capital structure are triggered by the differences in national attitudes towards risk, along
with other environmental variables such as institutional differences, tax regimes and inflationary situations.
Sekely & Collins (1988) extend the previous analysis of Stonehill & Stitzel (1969) and explicitly attribute part
of the cross-country variation to be cultural factors. Broek and Webb’s (1973) and James’ (1976) (as cited in
Sekely & Collins, 1988) models on “cultural realms” are employed to classify the cultures and twenty three
countries in the sample have been categorised under seven cultural realms, viz. Anglo American, Latin
American, West Central Europe, Mediterranean Europe, Scandinavia, Indian Peninsula, Southeast Asia. The

Chapter 5: CEO’s Cultural Values and Firms’ Leverage Decisions
133
authors conclude that Anglo American, Latin American and Southeast Asian countries evince low
consumption of debt, whereas Mediterranean countries, Scandinavian countries and Indian Peninsula
indicate very high debt levels. They also affirm that the level of economic development does not exhibit
strong statistical significance on firm leverage.
Chui et al. (2002) in a more recent study, further extend this line of thought and employ Schwartz's (2004)
cultural dimensions to explicitly measure culture and regress country level and firm level debt ratios on
mastery and embeddedness and find that in both levels, cultural values are negatively associated with debt
ratios.
Li et al. (2011) further extended previous work carried out on national culture and capital structure. They not
only investigate the direct effect but also how national culture of foreign joint ventures in China (measured
by mastery and embeddedness) indirectly affects the leverage decision through the selection of other
variables (such as the choice of firm characteristics, industry concentration and affiliation and region of
investment). They find that, mastery has negative and significant direct effects on firm’s short-term debt and
positive and significant direct effects on firm’s long-term debt. Further indirect effects of mastery are found
to sometimes reinforce and sometimes offset the direct effects. On the other hand embeddedness shows no
significant direct impact on firm leverage decisions but exerts its impact entirely via indirect effects. Finally,
they confirm the portability of national cultures, as foreign joint ventures in China were making corporate
decisions outside their home country. Li et al. (2011, p.497) also accentuate that “an interesting area for
future research, when more detailed data become available is to examine whether managers’ decision
making reflects their corporate culture or their own national culture”. This inspired my study.
In other related studies, Chui, Kwok, & Stephen Zhou (2016) portrays that firms in countries with high
embeddedness scores (as per Schwartz cultural dimensions), tend to have lower bankruptcy risks and that
investors in these countries are generally less concerned about agency activities of managers. Therefore,
these countries operate lower costs of debt. The impact of mastery on bankruptcy risks, agency activities and
cost of debt generates ambiguous results. Furthermore, Kwok & Tadesse (2006) investigate why countries
differ in the configuration of their financial systems, despite the existence of legal-system-based and risk-
reduction-based explanations. The authors extend the latter line of thought and conjecture that countries
with strong uncertainty avoidance values (e.g.: Japan and countries in continental Europe) as per Hofstede’s
cultural dimensions, are more likely to have a bank-based financial system. In contrast, in Anglo Saxon
countries, such as in US and UK, the financial system is dominated by stock markets.
5.2.4 Research Contribution
Finally, in light of the above, it can be seen that the present research integrates a number different strands
of literature, such as finance, management and national culture. The study identifies scope for a greater
understanding of capital structure decisions through an empirical investigation of the possible role played by
the cultural values of individual managers in shaping these decisions (i.e. microcosmic impact of culture)

Chapter 5: CEO’s Cultural Values and Firms’ Leverage Decisions
134
Capital Structure
Upper Echelons Theory
National Culture
which is absent in the literature. Therefore an illustration of the research domain, which this research fits
into, is contained in figure 5.2.
Figure 5.2: Identified Gap in the Existing Empirical Research
In the above figure, the area denoted by letter ‘A’ represents the previous research that have been done on
the impact of cultural background of a firm on its capital structure (i.e. the macrocosmic impact). An overview
of literature was discussed in the section 5.2.3.4. The area denoted by ‘B’ indicates prior literature on CEO
characteristics (be it observable characteristics or unobservable traits or behavioural biases of managers) on
capital structure decisions. This aspect has also been discussed above under section 5.2.3.2 and 5.2.3.3. The
upper echelons theory suggests that organisational outcomes should be viewed as reflections of the values
and cognitive bases of powerful actors in an organisation (Hambrick & Mason, 1984), and a manager’s
national cultural background can be crucial in shaping the values of a manager (denoted by area ‘C’), which
forms the basis of many research on CEO cultural characteristics on business decisions, other than the
financing decision. The area ‘D’ emphasizes on the integration of all above elements, and emphasize on how
the values and cognitive bases of managers that are shaped by different cultural backgrounds, would affect
firm financing decision, which indicates a gap in prior literature, is the focus of this study.
5.3 Conceptual Framework and Hypothesis Development
As underlined in the previous section, a growing body of literature has documented the importance of
including managerial factors to the capital structure puzzle. Hence, this study extends prior literature by
including cultural backgrounds of CEOs to the capital structure equation.
A
C
B
D
Financial decision making

Chapter 5: CEO’s Cultural Values and Firms’ Leverage Decisions
135
Li et al. (2011) postulate that cultural characteristics affect the way CEOs perceive the possible costs and
benefits of debt financing. This paper underlines the interaction between CEO culture and the notions of the
trade-off framework. Whilst the tax advantage versus bankruptcy costs is the most common version of the
trade-off framework, it is accepted that tax effects are relatively hard to clearly identify in the data (Frank &
Goyal, 2009). Hennessy & Whited (2005) illustrate that the existence of transaction costs makes it difficult
to empirically identify the tax effects, although it is an important element of the firm’s problem. Furthermore,
although taxes are crucial in steering the leverage decision, it is nominated as a subordinate factor by
managers, among other firm level drivers (Graham & Harvey, 2001). Therefore, although the tax advantage
is disregarded, this research underlines how CEO cultural background would exacerbate or attenuate most
of the other previously discussed benefits and costs of debt. This line of thought is extended when developing
the following hypotheses. In Figures 5.3a and 5.3b the conceptual foundation is presented, with regard to
both mastery and embeddedness.
5.3.1 The association of mastery and leverage
According to Schwartz (2004) managers with high mastery values foster self-assertion and exert power on
the natural and social environment to attain personal goals. Furthermore, they nurture values such as
ambition, success, daring and competence. To develop the research hypotheses, the focus rests upon two of
the main traits of high mastery managers; need for personal success and value of control (see figure 5.3a).

Chapter 5: CEO’s Cultural Values and Firms’ Leverage Decisions
136
Figure 5.3a: Conceptual Foundation: The Association between CEO Mastery and the Firm Leverage
Decision – Channels of Influence
CEOs with High Mastery
Traits
The need for
personal success Value of control
Only pick safe
projects and ignore
risky ones
(Hirshleifer &
Thakor,1992)
enjoy exerting control on the natural and social
environment to attain their individual goals
(Schwartz, 2004)
Consequences
of higher debt Higher risk of
bankruptcy
Debt covenants,
monitoring and
control
Lesser dilution of
control
Cognitive
process
Aggravates the risk
of bankruptcy or
financial distress (Li
et al., 2011)
Averse to the
loss of control
posed by debt
covenants and
monitoring
(Chui et al.,
2002 and Li et
al., 2011).
prefer to retain
control among
themselves (Li et
al., 2011)
Action Choose less debt Choose less
debt Choose more
debt
(1) Mastery: the need for personal success and its influence on the costs of financial distress
Managers with high mastery values cherish personal success. Hirshleifer & Thakor (1992) assert that when
managers are concerned about their personal performance, they would only pick safe projects which have
higher rates of success and will ignore risky ones. Higher debt is associated with higher risks of bankruptcy.
High mastery CEOs would exacerbate the financial distress costs and their desire for personal success would
lead them to choose less debt (Chui et al., 2002 and Li et al., 2011)), implying a negative relationship between
mastery and leverage.
(2) Mastery: value of control and the aversion to monitoring by debt-holders
As mentioned above high mastery managers value control. As per Schwartz (2004), they enjoy exerting
control on the natural and social environment to attain their individual goals. Covenants, monitoring and
control associated with debt finance are known to mitigate free cash flow problems, such as managers
enjoying unreasonably high perquisites, empire building and investing in value destroying ventures etc.
(Jensen, 1986; Jensen & Meckling, 1976). High mastery managers are averse to the strict discipline and loss
(-) (-) (+)

Chapter 5: CEO’s Cultural Values and Firms’ Leverage Decisions
137
of control posed by debt covenants and monitoring (Chui et al., 2002 and Li et al., 2011). Thus, they would
opt for less debt, denoting a negative relationship between mastery and leverage.
Summarising the above, it can be hypothesized that:
Ha1.1: The leverage decision of a firm is negatively associated with the CEO’s level of mastery
(3) Mastery: value of control and the aversion to agency cost of equity
Jensen (1986) argues that leverage alleviates managerial discretion. If so managers may not issue the optimal
level of debt, unless there is pressure from disciplining forces (Berger et al., 1997). Harris & Raviv (1988)
confirms that one possible reason for the issuance of more debt by managers is to retain voting control.
Further Graham and Harvey (2001) demonstrate that managers dislike the dilution of EPS. It is well-known
that if the firm is to raise finance through equity, it would lead to dilution of control. High mastery managers,
who value control would desire to retain control among themselves. Hence, they may prefer debt financing
and would curtail equity funds. This demonstrates a positive relationship among mastery and leverage.
In light of the above the below hypothesis can be developed:
Ha1.2: The leverage decision of a firm is positively associated with the CEO’s level of mastery
However, as the above viewpoints on the association between mastery and optimal capital structure
perspectives are contradictory, the ultimate direction of the association is an empirical question.
5.3.2 The association of embeddedness and leverage
Schwartz (2004) demonstrates that in highly embedded societies, meaning of life percolates largely through
harmonious social relationships and striving towards its shared goals. He further stresses that highly
embedded cultures accentuate (p.4) “maintaining the status-quo and restraining actions that might disrupt
in-group solidarity or the traditional order”. In addition, highly embedded managers place higher importance
on values such as respect for tradition, obedience and social order (see figure 5.3b).

Chapter 5: CEO’s Cultural Values and Firms’ Leverage Decisions
138
Figure 5.3b: Conceptual Foundation: The Association between CEO Embeddedness and the Firm
Leverage Decision – Channels of Influence
CEOs with High Embeddedness
Traits Harmonious relationships
with stakeholders
Obedience and
respect for tradition
Consequences
of higher debt
Higher risk of bankruptcy
associated costs to all
stakeholders
Debt covenants,
monitoring and
control
Cognitive
process
Highly concerned about
the liquidation costs to be
borne by stakeholders
(Chui et al., 2002)
Favours the controls
posed by debt
covenants and
monitoring (Li et al.,
2011)
Action Choose less debt Choose more debt
(1) Embeddedness: nurturing harmonious relationships and its influence on the costs of financial
distress
Bankruptcy costs are a part and parcel of increased debt. In a situation where the firm fails to respect its
financial obligations, the associated costs will more or less affect all stakeholders. Highly embedded managers
relish harmonious relationships with their stakeholders. They are highly concerned about the liquidation costs
which will have to be borne by them (Chui et al., 2002). Therefore, they would exacerbate possible bankruptcy
risks (Chui et al., 2002 and Li et al., 2011) and restrain from contacting excessive leverage which might disrupt
in-group solidarity and would opt for less debt. This infers a negative relationship between embeddedness
and leverage.
Therefore, the following can be hypothesized:
Ha2.1: The leverage decision of a firm is negatively associated with the CEO’s level of embeddedness
(2) Embeddedness: value of obedience that favours agency cost of debt
(-) (+)

Chapter 5: CEO’s Cultural Values and Firms’ Leverage Decisions
139
Highly embedded managers foster values such as obedience and respect for tradition. Thus in line with Li et
al. (2011), it can be presumed that highly embedded CEOs favour the debt covenants and monitoring placed
by debt financing, as they dislike taking initiative. They rather prefer to be guided and favour shared
responsibility of their actions rather than claiming ownership. In other words they attenuate the agency cost
of debt and instead consider the additional controls placed by obtaining more debt as a benefit. This portrays
a positive association between embeddedness and leverage.
Summarizing the above, it can be hypothesized that:
Ha2.2: The leverage decision of a firm is positively associated with the CEO’s level of embeddedness
However, the above two contradictory viewpoints of embeddedness on leverage would result in the direction
of the association between the two an empirical question.
5.3.3 The portability of mastery and embeddedness to a foreign context
Portability in the present context is defined as the persistent influence of the two cultural values of CEOs’
mastery and embeddedness, on firm leverage in a foreign setting, different from CEO’s country of origin.
The study examines portability by testing the following two hypotheses on a sub-sample which consist of only
non-US CEOs:
Ha3.1: The leverage decision of a US firm with a non US CEO is influenced by the CEO’s level of
mastery
Ha3.2: The leverage decision of a US firm with a non-US CEO is influenced the CEO’s level of
embeddedness
If the cultural values of the non-US CEOs evince statistical significance in the firm leverage decision, it can be
concluded that CEO culture is portable.
5.4 Sample and Key Variable Construction
This section includes a discussion of the choice of the research sample and on construction of key variables
in the study.
5.4.1 Sample Overview
The sample consists of the firms listed in Fortune 500 in the U.S. in 2017. The choice of US sample was initially
motivated by Hymowitz (2004, para 2.), who states that “the number of foreign-born CEOs is increasing
steadily in the USA, whilst European and Asian companies still look mostly to their own, to fill the corner
office”. Moreover, Hambrick (2007) also points out that US CEOs are arguably more diverse when compared
to almost any other country, in terms of their age, educational background, socioeconomic background and
functional experience. Another reason for choosing a US sample is that the US CEO have more discretion,
relative to other counterparts in most other developed economies (Hambrick, 2007). The US has a number

Chapter 5: CEO’s Cultural Values and Firms’ Leverage Decisions
140
of formal institutions that permit and promote CEOs of publicly held corporations to take whatever actions
that they believe appropriate, including very bold actions (Hambrick, 2007). Therefore, this study believes
that a US sample is more likely to produce results in support of the Upper Echelons Theory.
Fortune 500 companies are chosen because 40% of Fortune 500 companies were founded by immigrants or
the children of immigrants and seven of the ten most valuable brands in the world come from American
companies founded by immigrants or children of immigrants (The “new American” Fortune 500, 2011).
Immigrant CEOs in Fortune 500 companies has increased during the last decade (Gillenwater, 2016). As the
analysis is restricted to large firms only, it might give rise to the problem of unrepresentative sampling.
However, the large companies in the sample represent a sizeable fraction of the total market capitalisation
of all public companies in the US. Hence, it is assumed that the findings are capable of revealing a reliable
association between CEO culture and firm leverage decision (Berger et al., 1997).
To be consistent with previous studies on the effect of culture on firm leverage, utility companies (ICB code
7000) and financial firms (ICB code 8000) as per FTSE/DJ Industry Classification Benchmark (ICB), are excluded
from the sample. Utility companies are excluded, because they are highly regulated, leaving very little
discretion for managers over the leverage decision. In fact, Cook & Cohn (1959) state that utility companies
will only issue those securities that are permitted from the Securities and Exchange Commission, under the
Public Utility Holding Company Act of 1935, in the USA. Financial companies, such as banks and insurance
companies, are excluded due to several reasons: According to Rajan & Zingales (1995), the leverage of
financial firms can strongly be influenced by investor insurance schemes (implicit or explicit), such as deposit
insurance. Moreover, their debt obligations may not be directly comparable to the debt issued by non-
financial firms. Also, financial firms are subject to regulations on minimum capital requirements, which
directly impact their capital structures. Therefore, the capital structure of financial firms may not be
completely administered by managerial decision making. Finally Fama & French (1992) point out that financial
firms generally have higher levels of leverage, that may not carry the same meaning for non-financial firms.
Such high levels of leverage in a non-financial firm may signal financial distress. Due to the above reasons,
utility and financial companies denote marked differences from other sectors, in terms of their leverage and
corporate governance. The exclusion of utility companies and financial firms results with 365 firms in the
sample. The sample period is 16 years from 2000 to 2015.

Chapter 5: CEO’s Cultural Values and Firms’ Leverage Decisions
141
5.4.2 Key Variables Construction
Measures of Cultural Values
In order to measure culture, Schwartz (1994) derives two culture-level dimensions that are broadly defined,
consisting of opposing values as (1) Autonomy vs Conservatism (later known as embeddedness) and (2)
Hierarchy and Mastery vs Egalitarian Commitment and Harmony with nature. This chapter employs these two
opposing values, viz. embeddedness and mastery to measure cross-cultural differences as per the work of
Chui et al. (2002), Li et al. (2011) and Chui, Kwok, & Stephen Zhou (2016).
Cultures high in embeddedness “treat people as entities embedded in the collectivity”. These individuals
respect in-group social relationships, participate in its shared way of life and strive towards its shared goals.
Values such as maintaining status quo and restraining actions that might disrupt in-group solidarity or the
traditional order are held important. On the other hand, high mastery cultures stimulate active self-assertion
by individuals in order to direct, master and change the social and natural environment, in order to attain
personal or group goals. A full description of Schwartz research and cultural dimensions are included in
section 2.2.4.
The nationalities of the CEOs of the sample firms, during the sample period are collated. CEO nationalities are
obtained from the Boardex database. 17 different CEO nationalities are recognized in the sample60, from
which a majority represents the USA. The values of mastery and embeddedness to each CEO are then
assigned, based on their nationality records. The mastery and embeddedness scores for each CEO in this
sample is obtained from Schwartz (2004) research. As Schwartz’s study distinguishes Canadians as English
and French speaking and Germany as East and West, the study excludes CEOs from the said two countries,
due to the unavailability of specific information. In addition a CEO originating from Armenia was also
excluded, as Armenia is not included in Schwartz’s research. The final sample consists of 594 CEOs, originating
from 14 different nationalities, serving 317 U.S. firms during 2000 to 2015. The resultant dataset is an
unbalanced panel of 3214 firm-year observations.
Measures of Firm Leverage Decision
The response variable is the firm’s debt ratio, operationalized by the proportion of firm’s total debt to total
assets at book value (Frank & Goyal, 2009). A full description of all variables used in the study is provided in
Appendix B. The required data to calculate the ratio are sourced from the Worldscope database. The next
section debates about the use of book values versus market values of leverage.
60 The 17 different nationalities are American, Armenian, Australian, Belgian, British, Canadian, Croatian, Danish, Dutch, French, German, Indian, Iranian, Irish, Italian, Swedish and Taiwanese.

Chapter 5: CEO’s Cultural Values and Firms’ Leverage Decisions
142
Book values or market values of leverage?
Prior research has used several different empirical definitions for leverage. Some previous scholars have used
book values of leverage whist others have advocated market values. The long-standing debate over the usage
of book values vs market values has been enriched with different opinions.
For instance, Myers (1977) advocates book values, as debt is better supported by assets already in place. He
indicates that market values represent the present values of future growth opportunities, or in other words,
assets that are not yet in place. On the other hand, Frank & Goyal (2009) also state that market leverage
numbers may be unreliable as a guide to corporate financial policy due to rapid fluctuations in the financial
markets. According to a survey conducted by Graham & Harvey (2001), most of the managers have responded
that they do not rebalance their capital structures in response to stock market movements. The existence of
adjustment costs have largely restricted firms from rebalancing continuously.
In contrast, Welch (2004) recognises book values as just a “plug number” that reconciles the left hand side
and the right hand side of the balance sheet. He further explains this by demonstrating that book value of
equity can even be negative, although assets cannot be. Therefore according to Welch (2004), book values
do not provide any significant value for decision-making. In addition, book values associate historical costs
and tend to be backward looking, as it measures what has already taken place. Contrariwise, market values
are assumed to be forward looking. This line of thought is further reinforced in the study of Frank & Goyal
(2009). Their findings reiterate that firm growth, firm size and expected inflation (factors that are expected
to capture certain aspects of firm’s anticipated future) significantly influence market-based leverage
measures whereas industry median leverage, tangibility and profitability (factors that reflect the effect of
firm’s past) are important determinants when book leverage is considered.
The main response variable in this study is the firm’s debt ratio, operationalized by the proportion of firm’s
total debt to total assets at book value (Frank & Goyal, 2009). However, several other alternative definitions
of debt, calculated based on both book values and market values are employed to improve robustness and
are discussed later. A full description of all variables used in the study is provided in Appendix B. The required
data to calculate the ratio are sourced from the Worldscope database.
Previous studies that attempt to compare cross-cultural capital structures have been hindered by the lack of
consistent accounting data (Chui et al., 2002) . This drawback is mitigated as this research is only looking at
companies based in the USA, which are all subject to the same accounting rules and conventions.
Additional Variables
The lagged level of debt ratio is included as a control in the model, as leverage decisions made may be based
on previous policies (Brown et al., 2009). Furthermore by including the lagged level of debt ratio in the model,
the study attempts to first, control for the existing high or low levels of firm leverage and second better
capture the decision making of the CEO, as a given CEO may take the reign of a company with high/low level
of gearing (ex-ante).

Chapter 5: CEO’s Cultural Values and Firms’ Leverage Decisions
143
Four well-known firm related factors, viz. tangibility, market to book ratio, firm size and profitability, are
chosen, as further control variables (Bradley, Jarrell, & Kim, 1984; Frank & Goyal, 2009; Harris & Raviv, 1991;
Rajan & Zingales, 1995). Rajan & Zingales (1995) mention that these factors have consistently and reliably
demonstrated their significance on shaping the leverage decision. In addition to the above four factors, the
model also controls for industry median leverage (Frank & Goyal, 2009; Titman & Wessels, 1988), asset
maturity (Myers, 1977; Li et al., 2011) and industry concentration (MacKay & Phillips, 2005) in the regression.
Following Upper Echelons theory, the model also controls for upper echelons characteristics of CEOs such as
CEO tenure, age, education, gender and financial position (Hambrick & Mason, 1984). A full description of all
control variables and the expected signs are provided in Appendix B.
5.5 Empirical Specification and Preliminary Observations
This section opens with a discussion on the research model and includes a detailed explanation about the
data analysis methodology used in this study (i.e. quantile panel regression). The next subsection elaborates
on how this research addresses the CEO-firm matching problem and possible endogeneity concerns. The
section concludes with an elucidation of some interesting preliminary findings.
5.5.1 Model Specification
The selected US companies in the sample may consist of both US born and non-US born (foreign) CEOs.
Therefore, to test the first and second hypotheses, the total sample, which comprises of both US born and
foreign CEOs is used and the following baseline specifications are employed:
(5.1) Debt ratioi,t = β0+ β1masteryi,t+ β2debt(t-1)i,t + controls + fixed effects + ɛi,t
(5.2) Debt ratioi,t = β0+ β1embedi,t + β2debt(t-1)i,t + controls + fixed effects + ɛi,t
where i = firm and t = year.
‘Mastery’ and “Embed’ are scores for the cultural values mastery and embeddedness, which scales between
-1 and 7, as developed by Schwartz (2004). From a firm’s point of view these values not only vary with the
individual firm (i) or CEO but also with the time (t) as a firm might have different CEOs at each year end. The
two cultural values, mastery and embeddedness are considered separately in two regression models, as they
show high correlation with each other (see table 5.1 under preliminary observations later). The model
includes firm fixed effects and control for various CEO characteristics to take CEO fixed effects into account
(Nguyen et al. 2018).
To test the third hypothesis on the portability of cultural values to a foreign context, a subset of the sample,
which only consists of foreign-born CEOs, is created. Data for 22 foreign CEOs serving 20 companies, during
the sample time period from 2000-2015, is collated. Baseline specification (5.1) and (5.2) remain the same.
The statistical significance of cultural dimensions in the non US sample infer that cultural values of CEOs are

Chapter 5: CEO’s Cultural Values and Firms’ Leverage Decisions
144
persistent in influencing the firm’s leverage decisions, even at a foreign setting, which is different to the CEO’s
country of origin. This entails that cultural values are portable.
5.5.1.1 Quantile Panel Regression with Instrumental Variables
One objective of this study is to investigate how culturally biased CEOs would manifest their financing
decision at varying levels of firm leverage. Therefore in order to allow for the asymmetries between cultural
values and leverage the study employs quantile panel regression (QR) which was introduced by Koenker &
Bassett (1978) for the data analysis and estimate parameters that describe the 25%, median (50%) and 75%
of the conditional distribution.
Quantile regression is employed to estimate the impact of a set of covariates at points of the conditional
distribution of the response variables other than the mean as in “traditional” econometrics. As Koenker puts
it: “from a policy standpoint it is important to have a clear indication of how the mean response to changes
in [a covariate of interest] is “allocated” to the various segments of the conditional distribution of [the
outcome of interest], and this is what quantile regression analysis provides” (Koenker, 2005, p.50)61 Another
advantage is that it is robust to outliers compared to OLS in the same fashion that the median is robust to
outliers compared to the mean as a measure of central tendency. Moreover, quantile regressions are able to
capture sources of heterogeneity stemming from the covariates when errors are not necessarily independent
and identically distributed (Koenker, 2005). Recalling the baseline regression equations:
Debti,t = β0+ β1masteryi,t+ β2debt(t-1)i,t + controls + fixed effects + ɛi,t
Debti,t = β0+ β1embedi,t + β2debt(t-1)i,t + controls + fixed effects + ɛi,t
Denote Y the observed outcome variable, say Debt (a firm’s leverage decision), observed for a sample of N
firms that can be written as:
(5.3) 𝑌𝑖𝑡 = 𝑋𝑖𝑡𝛽 + 𝐶𝑖𝑡𝛿 + 𝛼𝑖 + 휀𝑖𝑡 for i=1,…,N; t= 1,…,T
Where X is a set of covariates and ε represents a firm-specific error term. The extra regressor C represents
firm-specific mastery or embeddedness in this case, and the coefficient of interest δ can be consistently
estimated via OLS provided idiosyncratic errors are independent and identically distributed, follow a normal
distribution with zero mean and constant variance, and are orthogonal to X and C. A firm’s leverage decision
is likely to depend on measurable economic factors X, but also on some unobserved firm specific
characteristics. Let mastery (or embeddedness) C assume the following reduced-form representation:
(5.4) 𝐶𝑖𝑡 = 𝑍𝑖𝑡𝜆 + 𝑢𝑖𝑡
61 The phrases in square brackets are amendments made to the original quotation to make it more general.

Chapter 5: CEO’s Cultural Values and Firms’ Leverage Decisions
145
Where Z is a set of measured firm specific characteristics, for instance the variables in X, and u i’s are firm-
specific disturbances. Endogeneity concerns arise when the latter are correlated with the errors in (5.3),
which violates the orthogonality condition on ε (𝐸(휀𝑖𝐶𝑖) ≠ 0) and introduces bias in the OLS estimate of δ.
When Z also includes at least one other exogenous variate that does not enter equation (5.3), then δ can be
consistently estimated via an instrumental variable or control function approach.
Equation (5.3) is the typical representation of a “fixed effects” model62. Individual effects, or unobserved
individual heterogeneity, enter additively and are assumed time-invariant while their distribution is left
unspecified, allowing the researcher to control non-parametrically for potential correlation between
unobserved components αi and one or several variables in X. In practice, in a balanced panel dataset with
two time periods, model (5.3) can be estimated directly by running OLS on the first-difference version of (5.3),
yielding a consistent estimate of parameter β (see e.g. Wooldridge, 2002).
Understandably, there is a rich literature on quantile regression with panel data. Koenker (2004) proposes to
focus on the following conditional quantile functions for response variable Y:
(5.5) 𝑄𝑌𝑖𝑡(𝜏|𝑋𝑖𝑡) = 𝛼𝑖 + 𝑋𝑖𝑡′𝛽𝜏 for i=1,…,N and t=1,…,T
Where the unobserved individual components αi are restricted to have a location-shift effect only, i.e. they
are the same across all quantiles. The author makes a case to circumvent the high-dimensional nature of this
specification (when the number of individuals is very large) by estimating the model for k quantiles
simultaneously and imposing a penalty on the fixed effects which results in solving a problem of the form:
(5.6) min(𝛼,𝛽)
∑ ∑ ∑ 𝑤𝑘𝑖𝑡𝑘 𝜌𝜏𝑘(𝑌𝑖𝑗 − 𝛼𝑖 − 𝑋𝑖𝑗 ′𝛽𝜏𝑘
) + 𝜆 ∑ |𝛼𝑖|𝑖
Where wk is a weight defining the contribution of the k-th quantile to the estimation of the individual effects,
and λ is a regularisation parameter to be chosen by the researcher. The penalty term based on absolute values
is called an l1-penalty and is built to shrink the individual effects towards a common value to an extent
determined by λ. For small values of λ tending to 0 the αi’s tend to their values in the un-penalised version of
the estimator, whereas they tend to be zero for all i when λ tends to infinity. In practice the choice of λ
remains at the discretion of the researcher (Koenker, 2004) and its impact on estimated coefficients can be
quite substantial especially in datasets with numerous panels and few time periods (see for instance
simulation studies in (Geraci & Bottai, 2007) and Bache, Dahl, & Kristensen (2013). Kato, GalvaoJr., & Montes-
62 The researcher takes this opportunity to clarify an often-confusing semantic choice. In the discussion of panel data models, “random” and “fixed” effects always refer to the way unobserved individual components are defined. Random effects representations assume the individual unobserved components are independent of the error term, uncorrelated to the regressors, and follow some pre-specified distribution function. In fixed effects models, the distribution of individual-specific unobservables is left unrestricted, allowing for arbitrary correlation with the error term and regressors, and individual effects can be seen as parameters to be estimated. This clarification is made because researchers with different backgrounds often understand the concepts of random and fixed effects in different ways.

Chapter 5: CEO’s Cultural Values and Firms’ Leverage Decisions
146
Rojas (2012) work out the asymptotic properties of the un-penalised quantile regression fixed effect
estimator for a single quantile index, hence allowing individual effects to affect both location and scale of the
conditional distribution. Ponomareva (2010) derives identification results of quantile coefficients in panel
data with small T when fixed effects have a distributional shift impact (i.e. allowing for correlation between
individual effects and the error term) under the condition that all covariates have continuous support; if
(some) regressors are discrete identification is possible when individual effects are independent from the
error term (location-shift effect only). When individual effects are specified as in Keonker (2004) and many
time periods are available, one can follow the approach of Canay (2011) and run individual-level least squares
regressions to get estimates of the fixed effects which are then subtracted from the response variable. The
transformed variable is then used as the dependent variable in classical linear quantile regressions.
In a competing approach, Geraci and Bottai (2007) assume the quantile error term follows an asymmetric
Laplace distribution and define individual effects as random intercepts that are independent from the error
term and orthogonal to regressors, allowing for within-individual correlation among observations. Assuming
random effects have a pre-specified density function (Gaussian or asymmetric Laplace) with a τ-dependent
parameter, the authors propose a simulation-based estimation procedure where individual effects are
sampled randomly from their estimated conditional density before subtracting them from the response
variable and running the τ-th quantile regression on the transformed variable. A generalisation of this model
accommodating random coefficients on a subset of covariates is developed in Geraci & Bottai (2014).
The instrumental variable quantile regression estimation method of Chernozhukov & Hansen (2006) is
exploited by Harding & Lamarche (2009) to deal with endogeneity in panel data models that include quantile
individual effects63 and interactive effects (Harding & Lamarche, 2014). Their method is applied in Alexander,
Harding, & Lamarche (2011) along with two competing approaches (Koenker’s (2004) penalised fixed effects
estimator and its un-penalised version allowing for quantile-dependent individual effects). The grouped
quantile treatment effects estimator of Chetverikov, Larsen, & Palmer (2016) makes for an intuitive way of
exploiting panel data when treatment is allocated to groups and both individual and group-level data are
available to the researcher. They propose to run group-wise quantile regressions of individual outcomes on
individual regressors and, in the second step, to use the estimated group coefficients (typically the constant)
as dependent variables in a least squares regression on group-level variates. This approach is easily applicable
and can accommodate endogenous group-level treatment variables (use 2-stage least squares in the second
stage) as well as panel data (run first-stage quantile regressions for each group-time period combination
separately) while it allows for exploration of interactive effects by appropriately selecting the first-stage
estimated coefficients to be used as dependent variable in the second stage of estimation.
63 The authors point out that characterising individual effects as “fixed” when they are allowed to vary by quantile is “not fully appropriate” and therefore, prefer to refer to them as quantile individual effects. Such individual fixed effects that have distributional shift impacts on the estimated conditional quantile function were already mentioned when discussing e.g. Canay (2011) or Kato et al. (2012).

Chapter 5: CEO’s Cultural Values and Firms’ Leverage Decisions
147
The presence of a lagged dependent variable as a regressor gives rise to serial correlation in the error terms.
According to Nickell (1981), classical ordinary least squares (OLS) estimators in dynamic panel models with
fixed effects are critically biased when the time dimension of the panel is short. Conventional QR estimation
of dynamic panel data models with fixed effects too suffer from similar bias effects as those seen in the least
squares case, when the temporal dimension is modest (Galvao, 2011) as in the case of this study. Therefore,
to reduce the dynamic bias in the quantile regression fixed effects estimator, the study uses the instrumental
variables (IV) quantile regression method of Chernozhukov & Hansen (2005, 2006, 2008) along with lagged
regressors as instruments, as suggested by Galvao (2011).
To sum up, the heart of the issue is to consider unobserved individual effects as parameters to be estimated
while no transformation of the data can adequately “get rid of them” in the context of quantile regression64.
Even though some methods are straightforward to implement such as that of Canay (2011) or the model
considered in Kato et al. (2012), most of the approaches discussed above rely on large T/large N asymptotics
for consistency, while conditions for identification in a very small T setting are quite restrictive, e.g.
Ponomareva (2011). These considerations were crucial for the choice of a suitable empirical strategy given
the nature of the data that have a large number of panels and only 15 time periods, as explained in the next
section.
5.5.1.2 Accounting for CEO-Firm Matching Problem and Endogeneity Concerns
The empirical specification may be beset with possible CEO-firm matching problem. In other words CEOs and
firms may not match randomly but firms may select CEOs to match the values of the existing leadership (Pan
et al., 2017). This implies that firms with foreign executives or directors are innately different from others,
due to unobserved characteristics. Thus, firm fixed effects are used, as these are known to control for
unobserved heterogeneity in a panel data regression. Furthermore, in section 5.8 the empirical analysis is
extended by investigating the effect of a major exogenous shock to the system, the global financial crisis in
2007/08, and study the financing decisions of highly cultural-biased CEOs around this time. The decisions
made by a CEO through a changing industry environment are likely to be unstructured and non-routine and
CEO characteristics play a major role in how CEOs respond, alleviating CEO-firm matching concerns.
A possible source of endogeneity can be due to the mutual causality between firm leverage decision and CEO
mastery/embeddedness values. Reverse causation between firm leverage decision and CEO cultural values
may occur, if firms hire CEOs with preferred characteristics to continue its existing leverage policies. This
problem has already been taken into account as explained above. Another source of endogeneity is the
existence of an omitted variable that is confounding both independent and dependent variables. To alleviate
64 The study discusses models that assume additivity in the individual effects and the error term. For instance, partial identification of quantile treatment effects with discrete regressors in non-separable panel data models is discussed in Chernozhukov, Fernandez-Val, Hahn, & Newey (2013) in the context of non-parametric and semi-parametric estimation methods. Powell (2016) develops a novel approach to estimating quantile panel data models with non-additive individual effects based on a rank similarity assumption, although the proposed moment-based estimator does not allow for the inclusion of covariates.

Chapter 5: CEO’s Cultural Values and Firms’ Leverage Decisions
148
this problem two steps are employed. Firstly the study employs (unconditional) quantile regression approach
with instrumental variables (IV) (Chernozhukov & Hansen 2005; 2006; 2008) along with lagged regressors as
instruments, as suggested by Galvao (2011). Second, the study controls for additional formal institutions to
capture the effect of variables that may not have been controlled previously, which is explained under section
5.7.1 robustness tests. Furthermore, the robust quantile regression methods solve in part the problem of
outliers in the data.
5.5.2 Preliminary Observations
Firstly, pairwise correlations were examined for the total sample. Even though tangibility depicts high
correlation between asset maturity ratio, variance inflation factors among the same are well below the cut
off threshold of 10 (Hair et al., 2010) , which advocates moderate correlation that is not severe enough to
warrant corrective measures (see table 5.1).

Chapter 5: CEO’s Cultural Values and Firms’ Leverage Decisions
149
Table 5.1: Pairwise Correlation Matrix and Variance Inflation Factors
1 2 3 4 5 6 7 8
1. mastery 1
2. embedded 0.4818* 1
3. l_debt 0.0683* 0.0610* 1
4. tangi 0.0679* 0.0115 0.1650* 1
5. mktbk 0.0336* 0.0116 -0.1707* -0.1511* 1
6. profit 0.0263 0.0132 0.0248 0.2117* 0.1637* 1
7. assetmat 0.0607* 0.018 0.0926* 0.7244* -0.0411* 0.1392* 1
8. emp log -0.0374* -0.0721* -0.0376* 0.1451* -0.0368* -0.0292 -0.0492* 1
9. time_role -0.0065 0.0405* 0.005 -0.0279 0.0292 -0.0122 -0.0111 -0.0790*
10. age 0.0402* -0.0188 0.0740* 0.1211* -0.0772* 0.0384* 0.0883* 0.1416*
11. no quals 0.0098 -0.0682* -0.0046 -0.0056 0.0251 0.0755* 0.0311 0.1029*
12. totwealth_log 0.0221 0.0058 -0.0889* -0.0778* 0.2787* 0.2290* 0.0345 0.1144*
13. indus_med -0.0054 0.0193 0.2513* 0.2198* -0.2599* -0.005 0.0436* 0.0313
14. induscon_log 0.0263 -0.0088 -0.0895* 0.2365* 0.0179 0.3110* 0.1525* -0.1919*

Chapter 5: CEO’s Cultural Values and Firms’ Leverage Decisions
150
9 10 11 12 13 14 VIF(1) VIF(2)
1. mastery 1.02 -
2. embedded - 1.02
3. l_debt 1.11 1.1
4. tangi 2.75 2.75
5. mktbk 1.33 1.33
6. profit 1.37 1.37
7. assetmat 2.19 2.19
8. emp log 1.37 1.37
9. time_role 1 1.25 1.25
10. age 0.2292* 1 1.19 1.19
11. no quals -0.0564* -0.0152 1 1.02 1.03
12. totwealth_log 0.3477* 0.1165* -0.0336 1 1.36 1.36
13. indus_med -0.0226 0.1801* -0.0527* -0.1615* 1 1.26 1.25
14. induscon_log -0.0227 -0.0805* 0.0117 0.0797* -0.0167 1 1.28 1.28
Note: * denotes statistical significance at the 5% level. VIF (1) column reports the variance inflation factors for econometric specification (5.1) and VIF (2) column reports the variance inflation factors for econometric specification (5.2). All variables are defined in Appendix B.

Chapter 5: CEO’s Cultural Values and Firms’ Leverage Decisions
151
A panel unit root test is carried out to test the stationarity of the ratio of the proportion of total debt to total
assets at book value. For this purpose, a Levin-Lin-Chu (LLC) test is applied. The bias-adjusted t statistics for
the LLC test are very large and is significant at all the usual testing levels. Therefore, the researcher finds
overwhelming evidence against the null hypothesis of a unit root and therefore, conclude that total debt as
a proportion of total assets at book value is stationary. Unit root tests are also done for alternative debt ratios
and firm & industry related variables (see table 5.2)
Table 5.2: Panel Unit Root Tests
Panel A Debt 1 Debt 2 Debt 3 Debt 4
Levin-Lin-Chu Test -15.7603 -12.2698 -11.9904 -13.3378
No. of firms 149 149 149 149
No. of years 11 11 11 11
Panel B Tangi Mktbk Profit Assetmat Emp_log Indus_med Indus_con
Levin-Lin-Chu Test -7.0547 -14.4701 -11.2429 -9.8195 -6.4033 -10.5789 -15.1200
No. of firms 140 140 140 140 140 140 140
No. of years 11 11 11 11 11 11 11
Note: Panel unit root tests are applied for a balanced subset of the sample, with 149 firms for panel A and 140 firms for panel B, over 11 years from 2003-2013. The missing values for intermediate years are interpolated to apply the unit root tests. The bias adjusted t statistic for Levin-Lin_Chu (LLC) test is shown. Large negative values generated by LLC test imply the rejection of the unit root for all variables at 1% significance level. All variables are defined in Appendix B.
Pesaran’s (2004) cross-sectional dependence test indicates that the residuals are not correlated across
entities. However, modified Wald test implies the presence of group-wise heteroscedasticity in the fixed
effect regression model. Wooldrige’s test denotes that there is serial correlation in the error terms in the
main specifications (5.1 and 5.2) used in the research, which is inevitable with the presence of a lagged
dependent variable as a regressor. The use of quantile panel regression methods with instruments, overcome
both these problems.
Summary Statistics
Table 5.3 depicts the summary statistics of sample CEOs and the debt ratio of sample firms. Panel A of Table
5.3 depicts that 22 out of the 594, are foreign born CEOs. Yet, only one female is depicted in the foreign born
category whereas there are 17 US born female CEOs in the sample. Panel B portrays that the average age of
a CEO is about 57 years old and on average hold 2 educational qualifications (undergraduate and above) at
the selected annual report date. Also, they have about five years previous work experience as CEOs.

Chapter 5: CEO’s Cultural Values and Firms’ Leverage Decisions
152
Table 5.3: Summary Statistics
A. CEO statistics
US Foreign Total
Female 17 1 18
Male 555 21 576
Total 572 22 594
B. CEO, Firm and Industry characteristics
Variables N Mean STD p25 p50 p75
Dependent Variables: Different measures of
leverage
Total debt / Total assets 3,650 0.2742 0.1946 0.1381 0.2480 0.3804
Long term debt / Total assets 3,650 0.2303 0.1746 0.1078 0.2039 0.3224
Long term debt / Market value of
assets 3,561 0.1298 0.1145 0.0501 0.1038 0.1843
Total debt / Market value of assets 3,561 0.1563 0.1355 0.0639 0.1246 0.2126
Firm specific variables
Tangibility 3,650 0.2747 0.2183 0.0998 0.2125 0.4036
Market to book ratio 3,550 2.2871 1.4123 1.4878 1.9334 2.637
Profitability 3,650 0.1657 0.1333 0.0791 0.1379 0.2256
Asset maturity 3,523 0.0342 0.0424 0.0097 0.0196 0.0428
Ln (no. of employees) 3,554 10.2471 1.3451 9.4174 10.2989 11.1337
CEO specific variables
Time in role 3,728 4.9731 5.1518 1.5 3.6 6.8
Age 3,731 56.5315 7.29 52 57 61
No. of qualifications 3,729 1.9174 1.0163 1 2 2
Ln (total wealth) 2,855 11.1621 1.4443 10.3684 11.0928 11.8611
Industry specific variables
Industry median leverage 3735 0.1209 0.0378 0.0996 0.1275 0.1436
Ln (industry concentration) 3735 6.4802 0.5041 6.2242 6.3855 6.6263
Other controls: CEO's country of origin
Ln (GDP) 3729 10.7859 0.1737 10.7634 10.815 10.8317
Life expectancy 3729 77.8609 1.0685 77.0366 77.9878 78.6415
Rule of Law 3729 91.4502 5.3024 91.0798 91.9431 92.823

Chapter 5: CEO’s Cultural Values and Firms’ Leverage Decisions
153
Ln (Stock trading as a % of GDP) 3729 5.3047 0.5569 5.2812 5.3969 5.4837
Ln (Bank deposits as a % of GDP) 3729 4.2763 0.1242 4.1615 4.2555 4.3893
Note: This table reports the summary statistics for various CEOs, firm and industry variables. Panel A classifies CEOs as US and foreign. Panel B reports the summary statistics for other CEO, firm and industry variables. The sample covers all firms listed in Fortune 500 in the USA in 2017 excluding ICB code 7000 and 8000, for the period from 2000-2015. All variables are defined in the Appendix B.
Panel B illustrates some summary statistics of alternative dependent variables, firm, industry and CEO level
control variables. The average debt ratio for all companies in the sample, irrespective of their industry is 27%
for total debt as a proportion of total assets at book value. On average, firms with debt ratios less than 14%
are considered as low debt firms and firms with debt ratios greater than 38%, are considered as highly levered
firms.
The average drops to 23% when long-term debt is taken as a proportion of assets at book value. The same
ratios drop to 16% and 13% respectively when calculated as a proportion of market values of assets.
5.6 Main Empirical Results and Discussion
5.6.1 The Association of Mastery and Leverage
Panel A of table 5.4 presents the results of the quantile regression method for panel data using instrumental
variables (QRPIV), for specification (5.1) above. The results portray that the role of CEO mastery is statistically
significant in shaping the leverage decision.

Chapter 5: CEO’s Cultural Values and Firms’ Leverage Decisions
154
Table 5.4: CEOs’ culture and firm leverage
QRPIV
Dependent Variable = Total Debt / Total Assets at Book Value
Panel A
(1) (2) (3)
q = 0.25 q = 0.5 q = 0.75
mastery 0.0101*** -0.0134*** -0.0099***
(0.0032) (0.0004) (0.0027)
l_debt 0.8810*** 0.9510*** 0.9640***
(0.0010) (0.0001) (0.0007)
Firm related controls
Tangi -0.0111*** -0.0029*** -0.0041***
(0.0012) (0.0001) (0.0005)
Mktbk -0.0022*** -0.0022*** -0.0012***
(0.0002) (0.0000) (0.0001)
Profit 0.0346*** 0.0348*** 0.0118***
(0.0017) (0.0002) (0.0008)
assetmat 0.0652*** 0.0125*** -0.0201***
(0.0105) (0.0007) (0.0024)
emp_log 0.0045*** 0.0005*** -0.0004***
(0.0004) (0.0000) (0.0001)
CEO related controls
time_role -0.0000 0.0000 0.0000**
(0.0001) (0.0000) (0.0000)
Age 0.0001* -0.0000*** -0.0002***
(0.0001) (0.0000) (0.0000)
no_quals 0.0006 0.0034*** 0.0025***
(0.0004) (0.0000) (0.0001)
gender 0.0046** 0.0068*** 0.0111***
(0.0019) (0.0001) (0.0005)

Chapter 5: CEO’s Cultural Values and Firms’ Leverage Decisions
155
totwealth_log -0.0008*** 0.0010*** 0.0023***
(0.0002) (0.0000) (0.0002)
Industry related controls
indus_med 0.1850*** 0.1090*** 0.2080***
(0.0106) (0.0006) (0.0038)
induscon_log -0.0118*** -0.0078*** -0.0082***
(0.0004) (0.0000) (0.0002)
Observations 2,384 2,384 2,384
No. of groups 216 216 216
Panel B
(1) (2) (3)
q = 0.25 q = 0.5 q = 0.75
embedded 0.0282*** 0.0208*** 0.0275***
(0.0018) (0.0002) (0.0018)
l_debt 0.8810*** 0.9500*** 0.9620***
(0.0005) (0.0001) (0.0007)
Firm related controls
Tangi -0.0053*** -0.0002*** -0.0167***
(0.0007) (0.0001) (0.0006)
Mktbk -0.0033*** -0.0018*** -0.0015***
(0.0001) (0.0000) (0.0001)
Profit 0.0321*** 0.0335*** 0.0204***
(0.0005) (0.0002) (0.0006)
assetmat 0.0395*** -0.0001 -0.0250***
(0.0038) (0.0005) (0.0030)
emp_log 0.0033*** 0.0012*** -0.0001
(0.0001) (0.0000) (0.0001)
CEO related controls
time_role 0.0001*** 0.0002*** -0.0002***
(0.0000) (0.0000) (0.0000)

Chapter 5: CEO’s Cultural Values and Firms’ Leverage Decisions
156
Age 0.0000 -0.0002*** 0.0001***
(0.0000) (0.0000) (0.0000)
no_quals 0.0021*** 0.0031*** 0.0025***
(0.0001) (0.0000) (0.0001)
gender 0.0048*** 0.0066*** 0.0041***
(0.0007) (0.0002) (0.0010)
totwealth_log -0.00010 0.0014*** 0.0001
(0.0001) (0.0000) (0.0001)
Industry related controls
indus_med 0.1500*** 0.1310*** 0.1720***
(0.0021) (0.0006) (0.0019)
induscon_log -0.0116*** -0.0080*** -0.0063***
(0.0002) (0.0000) (0.0002)
Observations 2,384 2,384 2,384
No. of groups 216 216 216
Note: The dependent variable is the proportion of firm’s total debt to total assets at book value. Panel A and B depict specification (5.1) and (5.2). The coefficients are estimated based on fixed effects quantile regression dynamic panel instrumental variables (QRPIV), for quantiles (0.25, 0.5 and 0.75) in columns (1), (2) and (3) respectively. Results are based on 1000 replications. All time-variant independent variables are assumed to be endogenous and are instrumented by lags dated t-1 and t-2 of tangibility, market to book ratio, profitability, asset maturity, no. of employees, CEO’s total wealth, industry median leverage and industry concentration. All models include firm and year fixed effects. Standard errors are shown in parenthesis. *, **, *** indicate significance at the 10%, 5% and 1% level respectively. All the variables are defined in Appendix B.
A striking feature is the curvilinear relationship between CEO mastery and firm leverage. The direction of the
relationship reverses when moving along the leverage distribution, from the lowest quantile (q=0.25) to the
highest quantile (q=0.75) (see figure 5.4).

Chapter 5: CEO’s Cultural Values and Firms’ Leverage Decisions
157
Figure 5.4: The Effect of Mastery on Firm Leverage at each Quantile
At the lowest quantile (q=0.25)
At the lower tail of the leverage distribution, the results show that mastery is positive and statistically
significant at the 1% level. In other words, when mastery increases by one unit, total debt as a proportion of
total assets at book value increases, by about 1% on average, when all other variables are held constant.
The positive association implies that the agency cost of equity perspective is more prominent, when a high
mastery manager is making the leverage decision. Put differently, when a company issues more equity to
finance its requirements bar a successful rights issue, it would provide controlling power to new shareholders
which results in dilution of control for the existing ones.
As per Schwartz (2004), high mastery managers enjoy exerting control on the natural and social environment
to attain their individual goals. Therefore, a CEO with high mastery values treasures control and would not
favour the dilution of control. Therefore, high mastery CEOs, given the choice, will choose more debt, as it
would help him to retain control resulting with a positive association with leverage.
However, the positive association is only visible at the lower tail of the leverage distribution. The lower tail
or quantile 0.25, represents 25% of the total firms which have the lowest debt ratios (on average about 14%
or less). When the firm is experiencing low gearing, it is very safe from debt covenants. Further a low geared
firm is not financially stifled and would result in more flexibility for CEOs and are able to raise funds through
debt relatively easily, thus enabling high mastery CEOs to issue more debt, in order to retain control among
themselves.
-0.015
-0.01
-0.005
0
0.005
0.01
0.015
0 0.1 0.2 0.3 0.4 0.5 0.6 0.7 0.8
Co
effi
cien
t
Quantile
Mastery

Chapter 5: CEO’s Cultural Values and Firms’ Leverage Decisions
158
Alternatively, these firms that occupy the lowest quantile reveal that they have excess debt capacity. Frictions
such as agency costs, distort CEOs to retain cash in the firm and asymmetric information, to maintain excess
debt capacity to finance future investments without having to access equity markets. CEOs increasing debt
in least levered firms can be alternatively interpreted as a result of responding to intense pressure from board
members, shareholders and other related parties in order to enhance firm value.
At the median (q=0.50) and highest quantile (q=0.75)
When moving along the leverage distribution from the median to upper quartiles, the positive association
between CEO mastery and firm leverage moves in the opposite direction, indicating a non-linear relationship.
Both at the median and at quantile 0.75, mastery is negative and statistically significant at the 1% level. At
the median of the leverage distribution, when mastery increases by one unit, total debt as a proportion of
total assets at book value declines by about 1.3% on average, ceteris paribus. At the upper tail of the leverage
distribution (q=0.75), when mastery increases by one unit, the average drop in total debt as a proportion of
total assets at book value is about 1%, ceteris paribus.
The inverse relationship between CEO mastery and firm leverage, when current debt of the firm is high, can
be a result of two phenomena. First, it is well known that debt finance is accompanied with debt covenants,
monitoring and control. These debt covenants can become stricter and more intense for companies with
higher debt. As high mastery managers cherish control, they would be averse to the loss of control posed by
stricter debt covenants and monitoring introduced by higher debt in the capital structure (Chui et al., 2002
and Li et al., 2011). On the other hand, high mastery CEOs like to demonstrate their abilities and hence enjoy
implementing aggressive policies in a firm (Chui et al., 2002). They would not want their assertive corporate
initiatives to be hindered by debt covenants at any cost. Rajan and Zingales (1995) however indicates that
debt monitoring is somewhat attenuated in large firms, as the size of the firm is an inverse proxy of the risk
of bankruptcy. The sample consists of the largest firms in the US, hence debt monitoring in these firms may
be moderated to a certain degree.
Then again, the risk of bankruptcy and financial distress understandably would increase when the relative
level of debt increases in a firm’s capital structure. High mastery managers are overly concerned about
personal success (Schwartz, 2004) and they aggravate bankruptcy related costs (Chui et al., 2002; Li et al.,
2011) Bankruptcy is perceived as a failure of management and hence it is presumable that high mastery
managers would avoid such a situation at all costs. Therefore, the desire for personal success of high mastery
managers, would steer them away from debt (Li et al., 2011).
The non-linear association of mastery with leverage, directs the conclusions to a new spectrum. First, it
reveals that high mastery CEOs behave in line with the notions of the trade-off theory. High mastery CEOs,
unknowingly, follow an implicit target capital structure, where they increase firm leverage to a certain level
and then drive down the same. Second, it also implies that financing decisions taken by culturally biased
foreign CEOs are contextual and that they may not always lead to higher debt. This finding is in line with

Chapter 5: CEO’s Cultural Values and Firms’ Leverage Decisions
159
Nguyen et al. (2018), where they contend performance effects of certain cultures are not consistently good
or poor but they are context dependent.
5.6.2 The Association of Embeddedness and Leverage
Panel B of table 5.4 depicts the results of the quantile regression method for panel data using instrumental
variables (QRPIV), for the specification (5.2) above. Results demonstrate that there is a positive relationship
between embeddedness and incremental leverage which is statistically significant at 1% level for all three
quantiles.
Highly embedded managers respect values such as obedience. They are averse to autonomy and would deter
to take independent decisions. They would rather follow the tide and maintain the status-quo (Schwartz,
2004). Thus, they would favour the additional monitoring and controls placed by obtaining more debt. This
would explain the positive relationship between embeddedness and leverage.
A closer examination of the three quantiles (0.25, 0.5 and 0.75) indicates that the coefficients of CEO
embeddedness are slightly higher at the two ends of the leverage distribution (approximately 3%), than in
the middle (2%). This implies that the effects of CEO embeddedness are higher in magnitude in the lower and
upper tails of the distribution rather than in the middle. Thus, it appears that embeddedness plays its role
the best at extreme levels of leverage than at the average level (see figure 5.5).
Figure 5.5: The Effect of Embeddedness on Firm Leverage at each Quantile
0
0.005
0.01
0.015
0.02
0.025
0.03
0 0.1 0.2 0.3 0.4 0.5 0.6 0.7 0.8
Co
effi
cien
t
Quantile
Embeddedness

Chapter 5: CEO’s Cultural Values and Firms’ Leverage Decisions
160
At the lowest quantile (q=0.25)
Lower tail consists of firms which are low geared. When firms are low geared, the results depict that
embeddedness value of a manager plays a crucial role in determining the leverage of the firm. On average it
can increase the proportion of debt by about 3%, holding all other variables constant. This implies that, given
the choice, highly embedded CEOs would always opt for debt, as they dislike taking initiative and prefer to
be guided. They are willing to adhere to controls placed by debt finance. Also, as current leverage is low, CEOs
have more flexibility in terms of funding decisions and are in a better position to increase current debt levels
with minimum stakeholder scrutiny.
Alternatively, as explained above under mastery, these firms that occupy the lowest quantile reveal that they
have excess debt capacity. The excess debt capacity may be a result of the existence of frictions such as
agency costs and asymmetric information. Hence CEOs increasing debt in least levered firms may also be
driven by the intense pressure from board members, shareholders and other related parties in order to
enhance firm value.
At the median (q=0.50) and highest quantile (q=0.75)
The results portray that at the median and at the upper quartile, one unit increase of embeddedness can
increase incremental debt on average by approximately 2% and 3% respectively, when all other variables are
held constant.
Companies which occupy the upper quantile bear higher debt ratios. Capital intensive firms such as
aerospace, non-ferrous metal, railroads (E. Schwartz & Aronson, 1967; Scott & Martin, 1975) and mature
industries (Talberg et al., 2008) are some among many industries which have a norm of higher leverage ratios.
The concept of “loss aversion” put forward by behavioural theorists, contend that people prefer "inaction
over action” and the “status-quo over any alternatives” as the drawbacks of the alternatives are gauged as
losses and according to “Prospect Theory” (Kahneman & Tversky, 1979; Tversky & Kahneman, 1986, 1992),
losses are perceived to create more emotional impact than does an equivalent amount of gain (Kahneman et
al., 1991; Samuelson & Zeckhauser, 1988; Tversky & Kahneman, 1991). Loss aversion favours maintaining
status-quo rather than implementing alternative actions, even in risky contexts (Kahneman & Lovallo, 1993).
Highly embedded managers place emphasis on maintaining the status-quo. Thus, in a highly geared industry,
they will remain obtaining more debt, if given the choice, in order to avoid the inconveniences of an abrupt
change in the current financing policies. Further as mentioned above, debt monitoring in the sample firms
may be relatively modest to that of an average firm, as the sample consist of the biggest companies in the
US. Thus these firms are likely to have a higher debt capacity. Hence high leverage does not necessarily
indicate financial distress and permit highly embedded managers to follow status-quo.
On the other hand, excessive borrowing can also be interpreted in alternative ways. Harris & Raviv (1988)
suggest that managers increase borrowing beyond the optimal point to reduce the possibility of takeover
attempts. However, Graham and Harvey (2001) indicate that their study indicate less support for this

Chapter 5: CEO’s Cultural Values and Firms’ Leverage Decisions
161
argument. Berger et al. (1997) suggest that if CEOs are entrenched, they would choose excessive borrowing
as a “transitory devise” that gestures a commitment to sell assets or otherwise restructure, thereby, again,
deterring possible takeover attempts. Malmendier, Tate and Yan (2011) expose that early life experiences of
CEOs, such as military experience, cause them to pursue aggressive policies, including higher leverage.
However, these additional factors fall beyond the scope of the present research.
The positive association of embeddedness with leverage at all quantiles, reveals the behaviour of high
embedded CEOs are not in line with the trade-off framework. Thus, it appears that the association between
CEO embeddedness and firm leverage is ambiguous.
5.6.3 Other Determinants
All firm and industry related variables indicate a statistically significant (at 1% level) impact on firm leverage
for both models with mastery and embeddedness. Lagged level of debt ratio has a positive association with
current debt ratio, as expected. Tangibility depicts an inverse relationship with leverage which is in contrary
to the findings of Frank & Goyal (2009) and Rajan & Zingales (1995). However Titman & Wessels (1988) found
no effect of tangibility on firm leverage. On the other hand, Frank & Goyal (2009) propose that firms with
high tangible assets render low information asymmetry, making equity issuances less costly and debt less
appealing.
The sign for the market to book ratio is negative across all models. For firm size and asset maturity, the signs
reverse from positive to negative at very high debt levels (q=0.75), implying a non-linear relationship with
leverage for both models with mastery and embeddedness. Profitability depicts a positive relationship for
both models, as when profits are high financial distress costs are less likely. Industry median leverage is
positively related and industry concentration is negatively related with the firm debt ratio
All CEO characteristics are statistically significant for at least one of the quantiles under both models.
Although the relationship is non-significant at lower quantiles, these variables become statistically significant
at 1% level at higher quantiles. These findings offer new insights. First, the results infer that managerial fixed
effects can significantly explain a firm’s financial practices (Bertrand & Schoar, 2003). Second, the results also
imply that the role of some managerial characteristics (such as CEO experience, education and age) on the
leverage decision becomes more prominent at extreme situations, like when the firm is highly geared.
However negligible values of the coefficients suggest low economic significance.
5.7 Robustness Tests
5.7.1 Addressing endogeneity concerns
Both leverage decision and the cultural values may be a determinant of a third factor that have not been
controlled for in the above specifications (5.1) and (5.2). Thus, in order to overcome possible endogeneity
concerns caused by omitted variables, the following variables are included to the main specifications.

Chapter 5: CEO’s Cultural Values and Firms’ Leverage Decisions
162
1. Adjustment for the heterogeneity in the level of socioeconomic development in CEOs’ home
countries
Although all the CEOs in the sample currently reside in the USA and employed in USA firms, their
countries of origin are diverse. Thus the socioeconomic status of these countries also vary from one
another (Carroll et al., 1994). According to previous studies, cultural values are interrelated with wealth
of nations (Schwartz,1994). Therefore, does it mean that the leverage decision of the individual CEOs
was merely influenced by their different socioeconomic background and not by national cultural values?
To address this question, World Bank data on GDP per capita and life expectancy are gathered, for a
CEO’s country of origin, as per the work of Nguyen et al. (2018). GDP per capita and life expectancy65 are
included in the econometric specifications (5.1) and (5.2) and the results are revealed in panels A and B
in table 5.5. The research hypotheses are supported even after controlling for the heterogeneity in the
level of socioeconomic development in CEOs’ home countries.
65 These variables are added sequentially, as they are highly correlated with each other.

Chapter 5: CEO’s Cultural Values and Firms’ Leverage Decisions
163
Table 5.5: Robustness Tests (Total Sample) -Controlling for socioeconomic development, legal environment and the quality of financial institutions of CEO’s
country of origin
QRPIV
Dependent Variable = Total Debt / Total Assets at Book Value
Panel A
(1) (2) (3) (4)
q = 0.5
Mastery 0.0300*** 0.0614*** 0.0462*** -0.0231***
(0.0014) (0.0020) (0.0017) (0.0037)
l_debt1 0.9560*** 0.9550*** 0.9520*** 0.9550***
(0.0004) (0.0007) (0.0002) (0.0003)
Firm related controls
Tangi -0.0001*** -0.0022*** -0.0084*** 0.0022**
(0.0002) (0.0003) (0.0006) (0.0009)
Mktbk -0.0015*** -0.0005*** -0.0016*** -0.0008***
(0.0000) (0.0001) (0.0000) (0.0001)
Profit 0.0316*** 0.0332*** 0.0282*** 0.0208***
(0.0004) (0.0003) (0.0004) (0.0006)
Assetmat -0.0072*** -0.0048*** 0.0210*** -0.0127**
(0.0014) (0.0016) (0.0027) (0.0052)
emp_log 0.0013*** 0.0020*** 0.0018*** 0.0008***
(0.0000) (0.0000) (0.0000) (0.0001)
CEO related controls
time_role 0.0003*** 0.0005*** 0.0004*** 0.0003***

Chapter 5: CEO’s Cultural Values and Firms’ Leverage Decisions
164
(0.0000) (0.0000) (0.0000) (0.0000)
Age -0.0001*** -0.0002*** -0.0001*** -0.0001***
(0.0000) (0.0000) (0.0000) (0.0000)
no_quals 0.0033*** 0.0030*** 0.0026*** 0.0035***
(0.0000) (0.0001) (0.0000) (0.0001)
Gender 0.0021*** 0.0043*** 0.0047*** 0.0082***
(0.0002) (0.0004) (0.0005) (0.0004)
totwealth_log 0.0012*** 0.0005*** 0.0008*** 0.0012***
(0.0000) (0.0001) (0.0000) (0.0001)
Industry related controls
indus_med 0.1330*** 0.1720*** 0.1550*** 0.1190***
(0.0017) (0.0040) (0.0033) (0.0022)
induscon_log -0.0074*** -0.0068*** -0.0064*** -0.0054***
(0.0001) (0.0001) (0.0001) (0.0002)
Additional controls
gdp_log -0.0007
(0.0005)
life_exp 0.0021***
(0.0001)
rule_of_law -0.0005***
(0.0000)
stocksgdp_log 0.0056***
(0.0001)
bankgdp_log 0.0212***
(0.0008)

Chapter 5: CEO’s Cultural Values and Firms’ Leverage Decisions
165
Observations 2,384 2,384 2,384 2,384
No. of groups 216 216 216 216
Panel B
(1) (2) (3) (4)
q = 0.5
Embedded 0.0262*** 0.0656*** 0.0235*** 0.0524***
(0.0005) (0.0006) (0.0025) (0.0011)
l_debt1 0.9560*** 0.9540*** 0.9560*** 0.9540***
(0.0008) (0.0001) (0.0002) (0.0006)
Firm related controls
Tangi -0.0002 -0.0017*** -0.0052*** 0.0001
(0.0003) (0.0002) (0.0002) (0.0004)
Mktbk -0.0012*** -0.0007*** -0.0017*** -0.0003***
(0.0000) (0.0000) (0.0000) (0.0000)
Profit 0.0306*** 0.0260*** 0.0324*** 0.0164***
(0.0003) (0.0005) (0.0003) (0.0008)
Assetmat -0.0120*** -0.0043*** 0.0130*** 0.0022
(0.0016) (0.0015) (0.0012) (0.0031)
emp_log 0.0013*** 0.0021*** 0.0017*** 0.0010***
(0.0000) (0.0001) (0.0000) (0.0001)
CEO related controls
time_role 0.0003*** 0.0004*** 0.0003*** 0.0002***
(0.0000) (0.0000) (0.0000) (0.0000)
Age -0.0002*** -0.0002*** -0.0001*** -7.08e-05***
(0.0000) (0.0000) (0.0000) (0.0000)

Chapter 5: CEO’s Cultural Values and Firms’ Leverage Decisions
166
no_quals 0.0032*** 0.0034*** 0.0026*** 0.0037***
(0.0001) (0.0000) (0.0000) (0.0001)
Gender 0.0033*** 0.0051*** 0.0040*** 0.0083***
(0.0002) (0.0002) (0.0004) (0.0007)
totwealth_log 0.0012*** 0.0003*** 0.0010*** 0.0008***
(0.0000) (0.0000) (0.0000) (0.0000)
Industry related controls
indus_med 0.1300*** 0.1470*** 0.1370*** 0.1280***
(0.0015) (0.0015) (0.0010) (0.0015)
induscon_log -0.0071*** -0.0046*** -0.0068*** -0.0051***
(0.0001) (0.0001) (0.0001) (0.0002)
Additional controls
gdp_log 0.0112***
(0.0008)
life_exp 0.0043***
(0.0001)
rule_of_law -0.0004***
(0.0000)
stocksgdp_log 0.0024***
(0.0002)
bankgdp_log 0.0361***
(0.0009)
Observations 2,384 2,384 2,384 2,384
No. of groups 216 216 216 216
Note: This table tests whether the differences in the level of socioeconomic development, legal environment and financial institutions of CEOs’ country of origin has any impact on the leverage decision. Panel A and B depict specification (5.1) and (5.2). Column (1), (2), (3) and (4) adds GDP, life expectancy, rule of law and the level of institutional development (measured by stocks traded as a % of GDP and bank deposits as a % of GDP) of CEOs' country of origin to the baseline specification (5.1) and (5.2) sequentially. The

Chapter 5: CEO’s Cultural Values and Firms’ Leverage Decisions
167
dependent variable is the annual proportion of firm’s total debt to total assets at book value. The coefficients are estimated based on fixed effects quantile regression dynamic panel instrumental variables (QRPIV), for the 0.5th quantile (median). For brevity, results for the quantiles 0.25 and 0.75 are unreported. Results are based on 1000 replications. All time-variant independent variables are assumed to be endogenous and are instrumented by lags dated t-1 and t-2 of tangibility, market to book ratio, profitability, asset maturity, no. of employees, CEO’s total wealth, industry median leverage and industry concentration and t-1, t-2 and t-3 of all additional controls. All models include firm and year fixed effects. Standard errors are shown in parenthesis. *, **, *** indicate significance at the 10%, 5% and 1% level respectively. All the variables are defined in Appendix B.

Chapter 5: CEO’s Cultural Values and Firms’ Leverage Decisions
168
2. Adjustment for the heterogeneity in legal environment in CEOs’ home countries
La Porta, Lopez-De-Silanes, Shleifer, & Vishny (1997) establish that legal environment determines the
size and extent of a country’s capital markets. According to the authors, a sound legal environment,
fortifies investor protection against (p.19) “expropriation by entrepreneurs” and will encourage them to
invest funds in exchange of firm securities which would ultimately stimulate capital market activities.
This would increase the use of external finance (debt or equity) by firms. Thus, CEOs from countries with
good legal environment would be keen to acquire external funds, by prejudice. Conversely CEOs who
are originally from countries with poor investor protection laws, would be more cautious in obtaining
external finance. On the other hand Stulz & Williamson (2003) contend that culture is often defined or
measured in order to explicate the differences in institutions and/ or legal practices rather than individual
(investor) behaviour, thus possibly distorting the leverage decision of the sample CEOs. To overcome this
issue, the model controls for the heterogeneity in legal environment68, specifically the quality of law
enforcement of CEOs’ home countries, via the index of rule of law drawn from La Porta et al. (1997).
Results confirm that CEO cultural values are still positive and statistically significant, even after
controlling for the differences in legal environments (refer table 5.5).
3. Adjustment for the heterogeneity in financial institutions in CEOs’ home countries
Countries differ in terms of the configuration of financial systems. Some countries, like Germany and
Japan have very strong banking systems while countries such as US and United Kingdom (UK) have active
stock markets (Barth et al., 1997; Kwok & Tadesse 2006) . Therefore, when a CEO, who originates from a
country with a strong banking sector and a less active stock market, is considering raising additional
funds, his decision would be naturally biased towards obtaining more debt and vice versa. To address
this matter, the level of stock market activity and the size of the banking sector of each CEO’s home
country is considered in the regression equation. To proxy the stock market activity, total value of stocks
traded as a percentage of GDP is employed and to measure the size of the banking sector, bank deposits
as a percentage of GDP is used, sourced from the World Bank Data. These two variables are included in
the econometric specification (5.1) and (5.2)68 and the results validate that cultural values are still
significant at 1% level, even after controlling for the heterogeneity in financial institutions (see table 5.5).
In light of the above it can be concluded that cultural values of a CEO have a statistically significant impact
on firm’s leverage decision, even after taking in to account the differences in socioeconomic, legal and
financial institutions of the CEO’s country of origin.

Chapter 5: CEO’s Cultural Values and Firms’ Leverage Decisions
169
5.7.2 Regressing with alternative debt ratios
Furthermore, to increase the robustness of this study, alternative response variables are tested. Three
additional dependent variables are employed in the study, which are (i) the proportion of long-term debt to
total assets at book value, (ii) at market value and (iii) the proportion of total debt to total assets at market
value. Employing market values alleviates the concerns of book value measures being backward looking and
the fact that book value of equity being a “plug number” to simply balance the left-hand side and the right
hand side of the balance sheet (Welch, 2004). The (quasi) market value of assets are calculated by subtracting
the book value of common equity from total assets and adding back the market value of common equity
(Rajan & Zingales, 1995). Results reveal that mastery and embeddedness remain statistically significant at 1%
level for almost all quartiles, inferring that mastery and embeddedness of CEOs play a dominant role in
shaping the leverage decision of a firm, irrespective of different measures used to explain debt ratio (refer
tables 5.6 and 5.7).

Chapter 5: CEO’s Cultural Values and Firms’ Leverage Decisions
170
Table 5.6: Robustness Tests (Total Sample) -CEO mastery and alternative measures of leverage as the dependent variable
QRPIV
Panel A
y = Long term debt/Total assets at BV
(1) (2) (3)
q = 0.25 q = 0.5 q = 0.75
Mastery 0.0576*** 0.0491*** -0.0237***
(0.0031) (0.0015) (0.0002)
l_debt 0.8440*** 0.9320*** 0.9600***
(0.0008) (0.0006) (0.0001)
Firm related controls
Tangi 0.0003 -0.0029*** -0.0010***
(0.0007) (0.0004) (0.0001)
Mktbk -0.0025*** -0.0013*** -0.0021***
(0.0001) (0.0001) (0.0000)
Profit 0.0359*** 0.0306*** 0.0245***
(0.0005) (0.0005) (0.0000)
Assetmat -0.0111*** 0.0066** -0.0283***
(0.0028) (0.0026) (0.0005)
emp_log 0.0043*** 0.0022*** -0.0019***
(0.0001) (0.0001) (0.0000)
CEO related controls
time_role 0.0006*** 0.0001*** -0.0001***
(0.0001) (0.0000) (0.0000)
Age -0.0003*** -0.0003*** -0.0006***

Chapter 5: CEO’s Cultural Values and Firms’ Leverage Decisions
171
(0.0000) (0.0000) (0.0000)
no_quals 0.0025*** -0.0000 0.0044***
(0.0001) (0.0001) (0.0000)
Gender 0.0049*** 0.0043*** 0.0011***
(0.0004) (0.0004) (0.0000)
totwealth_log -0.0010*** -0.0003*** 0.0012***
(0.0001) (0.0001) (0.0000)
Industry related controls
indus_med 0.1640*** 0.1670*** 0.2560***
(0.0017) (0.0021) (0.0003)
induscon_log -0.0092*** -0.0038*** -0.0069***
(0.0002) (0.0001) (0.0000)
Observations 2,384 2,384 2,384
No. of groups 216 216 216
Panel B
y = Long term debt/Total assets at MV
(1) (2) (3)
q = 0.25 q = 0.5 q = 0.75
Mastery 0.0426*** 0.0789*** 0.0480***
(0.0022) (0.0008) (0.0010)
l_debt 0.7770*** 0.8340*** 0.9210***
(0.0002) (0.0001) (0.0003)
Firm related controls
Tangi -0.0060*** -0.0057*** -0.0050***
(0.0011) (0.0001) (0.0004)

Chapter 5: CEO’s Cultural Values and Firms’ Leverage Decisions
172
Mktbk -0.0023*** -0.0030*** -0.0057***
(0.0000) (0.0000) (0.0001)
Profit 0.0258*** 0.0206*** 0.0102***
(0.0005) (0.0001) (0.0002)
Assetmat 0.0265*** 0.0356*** 0.0300***
(0.0045) (0.0003) (0.0019)
emp_log 0.0022*** 0.0013*** -0.0002***
(0.0000) (0.0000) (0.0000)
CEO related controls
time_role 0.0003*** 0.0008*** 0.0002***
(0.0000) (0.0000) (0.0000)
Age -0.0001*** -0.0005*** -0.0004***
(0.0000) (0.0000) (0.0000)
no_quals 0.0013*** 0.0010*** 0.0025***
(0.0000) (0.0000) (0.0000)
Gender 0.0044*** 0.0116*** 0.0000
(0.0006) (0.0001) (0.0004)
totwealth_log -0.0008*** -0.0012*** 0.0001***
(0.0001) (0.0000) (0.0000)
Industry related controls
indus_med 0.1350*** 0.1650*** 0.1620***
(0.0020) (0.0002) (0.0016)
induscon_log -0.0008*** -0.0018*** 0.0025***
(0.0001) (0.0000) (0.0001)
Observations 2,377 2,377 2,377

Chapter 5: CEO’s Cultural Values and Firms’ Leverage Decisions
173
No. of groups 215 215 215
Panel C
y = Total debt/Total assets at MV
(1) (2) (3)
q = 0.25 q = 0.5 q = 0.75
Mastery 0.0178*** 0.0342*** 0.0896***
(0.0010) (0.0008) (0.0016)
l_debt 0.7910*** 0.8610*** 0.9370***
(0.0007) (0.0004) (0.0002)
Firm related controls
Tangi -0.0078*** -0.0121*** -0.0116***
(0.0003) (0.0002) (0.0001)
Mktbk -0.0026*** -0.0039*** -0.0058***
(0.0000) (0.0000) (0.0000)
Profit 0.0246*** 0.0208*** 0.0128***
(0.0004) (0.0002) (0.0004)
assetmat 0.0323*** 0.0685*** 0.0322***
(0.0018) (0.0008) (0.0007)
emp_log 0.0022*** 0.0016*** -0.0003***
(0.0000) (0.0000) (0.0000)
CEO related controls
time_role 0.0002*** 0.0005*** 0.0004***
(0.0000) (0.0000) (0.0000)
Age -0.0003*** -0.0004*** -0.0005***
(0.0000) (0.0000) (0.0000)

Chapter 5: CEO’s Cultural Values and Firms’ Leverage Decisions
174
no_quals 0.0016*** 0.0016*** 0.0012***
(0.0001) (0.0000) (0.0000)
gender 0.0050*** 0.0042*** 0.0019***
(0.0004) (0.0001) (0.0004)
totwealth_log -0.0006*** -0.0005*** -0.0005***
(0.0000) (0.0000) (0.0000)
Industry related controls
indus_med 0.1300*** 0.1660*** 0.1640***
(0.0011) (0.0009) (0.0005)
induscon_log -0.0026*** -0.0016*** 0.0001**
(0.0001) (0.0001) (0.0000)
Observations 2,377 2,377 2,377
No. of groups 215 215 215
Note: This table reports alternative regression specifications. Panel A, B and C use alternative measures of leverage as dependent variables and mastery as the main independent variable. The coefficients are estimated based on fixed effects quantile regression dynamic panel instrumental variables (QRPIV), for quantiles 0.25, 0.5 and 0.75 in columns (1), (2) and (3) respectively for each dependent variable. Results are based on 1000 replications. All time-variant independent variables are assumed to be endogenous and are instrumented by lags dated t-1 and t-2 of tangibility, market to book ratio, profitability, asset maturity, no. of employees, CEO’s total wealth, industry median leverage and industry concentration. All models include firm and year fixed effects. Standard errors are shown in parenthesis. *, **, *** indicate significance at the 10%, 5% and 1% level respectively. All the variables are defined in Appendix B.
Table 5.7: Robustness Tests (Total Sample) -CEO embeddedness and alternative measures of leverage as the dependent variable
QRPIV
Panel A
y = Long term debt/Total assets at BV
(1) (2) (3)
q = 0.25 q = 0.5 q = 0.75
Embedded -0.0000 0.0284*** 0.0294***
(0.0017) (0.0030) (0.0010)

Chapter 5: CEO’s Cultural Values and Firms’ Leverage Decisions
175
l_debt 0.8530*** 0.9310*** 0.9610***
(0.0010) (0.0005) (0.0008)
Firm related controls
Tangi -0.0000 -0.0030*** -0.0174***
(0.0008) (0.0006) (0.0007)
Mktbk -0.0029*** -0.0016*** -0.0029***
(0.0002) (0.0001) (0.0001)
Profit 0.0265*** 0.0306*** 0.0211***
(0.0013) (0.0008) (0.0004)
Assetmat 0.0146*** 0.0042 -0.0074***
(0.0031) (0.0040) (0.0025)
emp_log 0.0034*** 0.0026*** -0.0021***
(0.0001) (0.0001) (0.0001)
CEO related controls
time_role 0.0003*** 0.0001*** -0.0000
(0.0000) (0.0000) (0.0000)
Age -0.0001*** -0.0003*** -0.0005***
(0.0000) (0.0000) (0.0000)
no_quals 0.0026*** 0.0000 0.0041***
(0.0001) (0.0001) (0.0001)
Gender -0.0013* 0.0025*** 0.0012***
(0.0007) (0.0005) (0.0004)
totwealth_log -0.0002*** -0.0002*** 0.0014***
(0.0001) (0.0001) (0.0000)
Industry related controls

Chapter 5: CEO’s Cultural Values and Firms’ Leverage Decisions
176
indus_med 0.1160*** 0.1630*** 0.2600***
(0.0051) (0.0029) (0.0029)
induscon_log -0.0064*** -0.0041*** -0.0068***
(0.0001) (0.0002) (0.0002)
Observations 2,384 2,384 2,384
No. of groups 216 216 216
Panel B
y = Long term debt/Total assets at MV
(1) (2) (3)
q = 0.25 q = 0.5 q = 0.75
Embedded 0.0136*** 0.0270*** 0.0450***
(0.0005) (0.0012) (0.0004)
l_debt 0.7780*** 0.8430*** 0.9150***
(0.0004) (0.0007) (0.0002)
Firm related controls
Tangi -0.0032*** -0.0016*** -0.0055***
(0.0006) (0.0005) (0.0001)
Mktbk -0.0025*** -0.0032*** -0.0050***
(0.0001) (0.0001) (0.0000)

Chapter 5: CEO’s Cultural Values and Firms’ Leverage Decisions
177
Profit 0.0257*** 0.0171*** 0.00724***
(0.0002) (0.0003) (0.0002)
Assetmat 0.0142*** 0.0347*** 0.0347***
(0.0011) (0.0023) (0.0006)
emp_log 0.0020*** 0.0011*** 0.0005***
(0.0000) (0.0000) (0.0000)
CEO related controls
time_role 0.0002*** 0.0005*** 0.0004***
(0.0000) (0.0000) (0.0000)
Age -0.0002*** -0.0003*** -0.0005***
(0.0000) (0.0000) (0.0000)
no_quals 0.0018*** 0.0014*** 0.0027***
(0.0000) (0.0001) (0.0000)
Gender 0.0016*** 0.0028*** 0.0072***
(0.0004) (0.0003) (0.0001)
totwealth_log -0.0005*** -0.0010*** -0.0008***
(0.0001) (0.0001) (0.0000)
Industry related controls
indus_med 0.1220*** 0.1370*** 0.1890***
(0.0012) (0.0015) (0.0009)
induscon_log -0.0013*** -0.0019*** 0.0026***
(0.0001) (0.0001) (0.0000)
Observations 2,377 2,377 2,377
No. of groups 215 215 215

Chapter 5: CEO’s Cultural Values and Firms’ Leverage Decisions
178
Panel C
y = Total debt/Total assets at MV
(1) (2) (3)
q = 0.25 q = 0.5 q = 0.75
Embedded 0.0257*** 0.0235*** 0.0167***
(0.0005) (0.0003) (0.0028)
l_debt 0.7910*** 0.8620*** 0.9360***
(0.0003) (0.0001) (0.0015)
Firm related controls
Tangi -0.0113*** -0.0069*** -0.0054**
(0.0003) (0.0002) (0.0025)
Mktbk -0.0023*** -0.0042*** -0.0067***
(0.0000) (0.0000) (0.0003)
profit 0.0279*** 0.0206*** 0.0179***
(0.0003) (0.0003) (0.0027)
assetmat 0.0233*** 0.0452*** 0.0217***
(0.0018) (0.0008) (0.0062)
emp_log 0.0028*** 0.0013*** -0.0008***
(0.0000) (0.0000) (0.0003)
CEO related controls
time_role 0.0004*** 0.0004*** 0.0004***
(0.0000) (0.0000) (0.0000)
age -0.0003*** -0.0004*** -0.0006***
(0.0000) (0.0000) (0.0001)

Chapter 5: CEO’s Cultural Values and Firms’ Leverage Decisions
179
no_quals 0.0010*** 0.0021*** 0.0011***
(0.0000) (0.0000) (0.0001)
gender 0.0064*** 0.0033*** 0.0019**
(0.0001) (0.0001) (0.0007)
totwealth_log -0.0008*** -0.0003*** -0.0002***
(0.0000) (0.0000) (0.0001)
Industry related controls
indus_med 0.1460*** 0.1550*** 0.1620***
(0.0009) (0.0004) (0.0015)
induscon_log -0.0029*** -0.0019*** -0.0001***
(0.0000) (0.0001) (0.0002)
Observations 2,377 2,377 2,377
No. of groups 215 215 215
Note: This table reports alternative regression specifications. Panel A, B and C use alternative measures of leverage as dependent variables and embeddedness as the main independent variable. The coefficients are estimated based on fixed effects quantile regression dynamic panel instrumental variables (QRPIV), for quantiles 0.25, 0.5 and 0.75 in columns (1), (2) and (3) respectively for each dependent variable. Results are based on 1000 replications. All time-variant independent variables are assumed to be endogenous and are instrumented by lags dated t-1 and t-2 of tangibility, market to book ratio, profitability, asset maturity, no. of employees, CEO’s total wealth, industry median leverage and industry concentration. All models include firm and year fixed effects. Standard errors are shown in parenthesis. *, **, *** indicate significance at the 10%, 5% and 1% level respectively. All the variables are defined in Appendix B.

Chapter 5: CEO’s Cultural Values and Firms’ Leverage Decisions
180
5.8 The Effect of the Global Financial Crisis in 2008
The above analysis confirms that CEO cultural values play a significant role in shaping the debt levels in US
Fortune 500 firms. However, one can argue that the above cross-sectional results can also be driven by other
unobserved factors and managerial characteristics. In fact, MacKie‐Mason (1990) presents that debt to equity
ratio of a firm is the aggregate result of years of separate decisions. Thus, analyses based on a single
accumulation of different decisions are likely to have low power. Berger et al. (1997) and Jung et al. (1996)
argue that leverage models based on agency conflicts can be better studied by examining decisions to change
leverage, rather than cross-sectional variation in debt and equity ratios. Therefore, a similar research strategy
to that of Berger et al. (1997); Nguyen et al. (2018) and Opler & Titman (1994) is implemented and further
analysis is undertaken to study whether debt levels change significantly after events that represent
exogenous shocks to the economy. Indeed, it is possible that an exogenous intervention, similar to the Global
Financial Crisis (GFC), may influence the impact dynamics of mastery and embeddedness on debt. To identify
the exact impact of mastery and embeddedness under this situation, Difference in Difference (DID)
estimation is employed. DID is a quasi-experimental design that makes use of longitudinal data from
treatment and control groups to obtain an appropriate counterfactual to estimate a causal effect. Using this
procedure, the study estimates the effect of GFC (or treatment) by comparing the changes in debt over time
between a sample of firms that is exposed to this intervention and a sample that is not (the control group).
DID adopts the following specification:
(5.7) Y = β0 + β1*[Time] + β2*[Treatment] + β3*[Time*Treatment] + β4*[Covariates]+ε
The coefficients are interpreted in the following way:

Chapter 5: CEO’s Cultural Values and Firms’ Leverage Decisions
181
Figure 5.6: A Graphical Presentation of the Difference in Difference Model
The coefficient of the treatment variable, β2, is the estimated mean difference in Y (in the case of this study;
debt) between the treatment and control groups prior to the intervention: it represents whatever "baseline"
differences existed between the groups before the intervention was applied to the control group.
β1 is the expected mean change in outcome from before to after the onset of the intervention era among
the control group. It reflects, the pure effect of the passage of time in the absence of the actual intervention.
β3 by itself is the difference in differences estimator and is the focus of interest. It indicates whether the
expected mean change in outcome from before to after was different in the two groups. This will be the
characteristic feature of an effective intervention, assuming adequate power, etc.
The estimated mean difference in debt between the treatment and control groups after the intervention,
can be obtained by adding β2 and β3. However, β2 + β3 may be significantly different from zero, even though
neither β2, nor β3 by itself is.
Nonetheless, the present study tests whether both mastery and embeddedness impacted debt in the same
way after intervention as it was before intervention. In other words, the study investigates whether firms led
by CEOs with higher mastery or embeddedness values experienced a change in impact pattern following the

Chapter 5: CEO’s Cultural Values and Firms’ Leverage Decisions
182
GFC. Although it had long roots, the effects of the GFC became apparent to the world in the last quarter of
200866.
(5.8) Debt ratioi,t = β0+ β1timei + β2High_Masi,t + β3High_Mas* timei + Controls + fixed effects + ɛi,t
(5.9) Debt ratioi,t = β0+ β1timei + β2High_Embi,t + β3High_Emb*timei + Controls + fixed effects + ɛi,t
where i = firm and t = year.
The dependent variable is the firm’s debt ratio measured by firm’s total debt to total assets at book value, as
explained above. Time is a dummy that equals one if the period corresponds to 2008 or after and High_Mas
(High_Emb) is a dummy that equals one if the CEO mastery (embeddedness) is above the sample average67.
The coefficient of interest is the interaction term β3 that indicates how the debt ratio of firms led by CEOs
with high mastery (embeddedness) and low mastery (embeddedness) values differ under the two different
periods (i.e. before and after the financial crisis took off). Most of the firm, CEO and industry controls, as
explained under Additional Variables in Section 5.4.2 are included in the model. Finally, firm fixed effects are
also included in the model.
Panel A of table 5.8 indicates that high mastery CEOs exert a detectable influence over the leverage decision
relative to low mastery CEOs, implying that high mastery CEOs behave differently from the CEO population.
The interaction term between high mastery CEOs and time period is negative and statistically significant at
the 1% level. Following the GFC that kicked off in 2008, firms led by CEOs with high mastery values exhibit a
4%68 drop in debt ratio compared to an average CEO.
66 The effects of the global financial crisis were not apparent to the world until September 2008, when Lehman Brothers (a Wall Street Investment Bank) filed for bankruptcy.
67 The sample average for mastery is 3.96. Low mastery group (followed by their respective mastery score in parenthesis) includes CEOs who are French (3.72), Swedish (3.81), Italian (3.81), Belgian (3.84), Iranian (3.91) and Danish (3.91). High mastery group includes CEOs who are Australian (3.97), Dutch (3.97), Taiwanese (4.0), British (4.01), Irish (4.04), Croatian (4.05), US (4.09), Indian (4.28). On the other hand, the sample average for embeddedness is 3.53. Swedish (3.12), Danish (3.19), Dutch (3.19), French (3.20), Belgian (3.25), British (3.34), Irish (3.41), Italian (3.46) CEOs occupy the low embeddedness group (with respective embeddedness scores indicated in parenthesis) whereas CEOs who are Australian (3.59), American (3.67), Taiwanese (3.82), Indian (3.97), Croatian (4.0) and Iranian (4.18) form the high embeddedness group. 68 To obtain the exact impact of mastery following intervention, i.e., to get the estimated mean difference in Debt between the treatment and control groups after the intervention, we need to look at β2 + β3. In Table 5.8 (panel A, column 2), the coefficient of high_mastery is 0.2110, whereas for the interaction term of mastery with time = -0.1740. Together, the overall effect is 0.037. Both variables are jointly significant (confirmed by F-test).

Chapter 5: CEO’s Cultural Values and Firms’ Leverage Decisions
183
Table 5.8: Difference-in-Difference Test: The Effect of the Global Financial Crisis in 2008
Difference-in-Difference Test - Interaction Analysis
Dependent Variable = Total Debt / Total Assets at Book Value
Panel A
Panel B
(1) (2) (1) (2)
time 0.2580*** 0.1770*** time 0.1000*** 0.0594**
(0.0405) (0.0387)
(0.0276) (0.0260)
High_Mas 0.2870*** 0.2110*** High_Emb 0.0912*** 0.0761***
(0.0412) (0.0394)
(0.0246) (0.0240)
High_Mas*time -0.2280*** -0.1740*** High_Emb*time -0.0688** -0.0565**
(0.0407) (0.0386)
(0.0279) (0.0260)
Constant -0.0228*** -0.0374*** Constant 0.1750*** 0.0657***
(0.0086) (0.0092)
(0.0052) (0.0076)
Firm related controls Firm related controls
tangi
0.0686* tangi
0.0731**
(0.0352)
(0.0353)
mktbk
0.0053*** mktbk
0.0056***
(0.0017)
(0.0017)
profit
-0.2660*** profit
-0.2620***
(0.0291)
(0.0291)
CEO related controls CEO related controls
time_role
0.0002 time_role
-3.19E-05
(0.0005)
(0.0004)
age
0.0009** age
0.0012***
(0.0004)
(0.0004)
no_quals
-0.0034 no_quals
-0.0029
(0.0032)
(0.0032)
gender
0.0022 gender
0.0130
(0.0208)
(0.0207)
Industry related controls Industry related controls
indus_med
0.6120*** indus_med
0.6370***
(0.0674)
(0.0674)
Observations 3,338 3,239 Observations 3,338 3,239
Panel C
F Test 25.25*** 27.58*** F Test 7.23*** 25.44***
Note: This table tests whether firms led by CEOs with higher mastery or embeddedness values altered their behaviour in terms of the leverage decision, following the global financial crisis in 2008. Panel A and B depict specifications (5.8) and (5.9). Columns (1) and (3) indicate the baseline specification where columns (2) and

Chapter 5: CEO’s Cultural Values and Firms’ Leverage Decisions
184
(4) indicate baseline plus controls. The dependent variable is the annual proportion of firm’s total debt to total assets at book value. High_Mas (High_Emb) is a dummy that equals one if the CEO mastery (embeddedness) is above the sample average and time is a dummy that equals one if the period corresponds to 2008 or after. All models include firm fixed effects. Standard errors are shown in parenthesis. *, **, *** indicate significance at the 10%, 5% and 1% level respectively. All variables are defined in Appendix B.
In contrast, the coefficient on high mastery CEOs is positive and significant. Thus, the results suggest that
absent global financial recession, firms run by high mastery CEOs issue more debt than those run by low
mastery CEOs. It appears, therefore, that high mastery CEOs are more debt-averse when the context of
decision-making experiences major shocks.
Panel B of table 5.8 indicates that highly embedded CEOs also exert a detectable influence over the leverage
decision relative to average CEOs. Just like in the case of mastery, the coefficient on highly embedded CEOs
remains positive and significant and the interaction term between high embedded CEOs and time period is
negative and statistically significant at 5% level. Following the global financial crisis, firms led by CEOs with
high embeddedness values exhibit a 2%69 drop in debt ratio compared to an average CEO. Thus, the empirical
evidence suggests that highly embedded CEOs behave differently from the rest of the CEO population,
following an industry shock.
As a final point, by examining the change in CEO behaviour followed by the global financial crisis that triggered
in 2008, the study exploits competitive shocks at industry level that are unanticipated by both the CEO and
the firm. In addition to the concerns mentioned above, this strategy aids to overcome ambiguity on whether
CEOs and firms match on unobserved factors, as explained in section 5.5.1.2. In a nutshell, an industry shock
compels the CEO to make decisions to navigate the firm through a changing industry environment. The
resulting decisions are likely to be unstructured and non-routine and CEO characteristics play a major role in
how CEOs respond. If cultural characteristics of a CEO influence corporate outcomes, it should be evinced by
systematic post-shock differences across firms led by CEOs with different mastery (embeddedness) values.
The results indicate that this is indeed the case.
5.9 The portability of mastery and embeddedness to a foreign context
This section examines the impacts of mastery and embeddedness on the proportion of total debt, in the non-
US sample, i.e. a subset of the sample consisting of only foreign CEOs. These CEOs are not operating in their
own territories but in a foreign setting. Because the sample size in the non-US context is smaller than the
69 In Table 5.8 (panel B, column 2), the coefficient of high_embeddedness is 0.0761, whereas for the
interaction term of embeddedness with time = -0.0565. Together, the overall effect is 0.0196. Both variables
are jointly significant (confirmed by F-test).

Chapter 5: CEO’s Cultural Values and Firms’ Leverage Decisions
185
total sample, problem of multicollinearity arises among some variables. For instance, ‘tangibility’ and ‘asset
maturity’ among the firm level controls and ‘age’ among CEO level controls are found to be collinear. Hence,
these variables are omitted from the regression. Furthermore, similar to the total sample, the heterogeneity
in the impact of culture is also examined, in the non-US sample. Once again, a panel quantile regression with
instrumental variables (QRPIV) is employed to explore robustness of estimates across the distribution of the
dependent variable. Despite smaller samples, the heteroscedasticity test as well as the dip test for the
dependent variable point at the existence of a non-uniform distribution as well as variability in the response
of the dependent variable (viz., total debt/total assets at book value) to a change in the independent variables
(viz., mastery and embeddedness). To compare results, Table 5.9 presents conventional instrumental variable
dynamic panel regression results (‘OLS based or effects at the mean’) along with the median-effects. For the
latter, the estimates are based on instrumental variable panel quantile regression.
Congruent to the theoretical expectation, the empirical evidence denotes a statistically significant positive
effect of both mastery and embeddedness for both the ‘mean-effects and the median effects’ although the
results at the median are far smaller than that of the effects at the mean. Median estimates are robust to
outliers. Therefore, it appears that the effects at the mean are measurably overestimated.
Empirical evidence clearly suggests that mastery and embeddedness values of foreign CEOs, play a vital role
in shaping the leverage decisions of their respective firms. This supports the argument that cultural values
are deeply rooted and can be observed via their behaviour irrespective of the current location. In other words,
it can be concluded that cultural values are portable.

Chapter 5: CEO’s Cultural Values and Firms’ Leverage Decisions
186
Table 5.9: CEOs’ culture and firm leverage in the sample of non-US CEOs (IV dynamic panel
regression (System GMM and quantile)
Dependent Variable = Total Debt / Total Assets at Book Value
Panel A Panel B
(1) (2) (1) (2)
Panel IV
results
IV panel Quantile
(q= 0.5)
Panel IV
results
IV panel Quantile
(q= 0.5)
Mastery 0.8100 0.2890*** embed 0.4020*** 0.0270***
(1.4960) (0.0460)
(0.1820) (0.0080)
l_debt -0.4980*** 0.8300*** l_debt -0.3730*** 0.7200***
(0.1460) (0.0450)
(0.1430) (0.0240)
Firm related controls Firm related controls
Mktbk 0.0140 0.0067 Mktbk -0.0550*** 0.0008
(0.0290) (0.0060)
(0.0230) (0.0020)
Profit -0.8810 0.1170* Profit -0.0840 0.2480***
(0.4270) (0.0700)
(0.1840) (0.0900)
emp_log -0.0180 0.0270*** emp_log 0.0370 -0.0050
(0.0150) (0.0100)
(0.0250) (0.0050)
CEO related controls CEO related controls
time_role -0.0370*** -0.0063* time_role -0.0200*** -0.0113***
(0.0110) (0.0030)
(0.0060) (0.0020)
no_quals -0.0350 0.0050 no_quals 0.0210 -0.0016
(0.1090) (0.0090)
(0.0140) (0.0020)
Gender 0.0000 - Gender - -
(0.0000)
totwealth_log 0.0118 0.0140 totwealth_log 0.0090 0.0390***
(0.0150) (0.0130)
(0.0140) (0.0110)
Industry related controls Industry related controls
indus_med 1.5880** 0.6080*** indus_med 0.3620 0.2390***
(0.7500) (0.0880)
(0.4010) (0.0450)
induscon_log 0.3370 -0.0600*** induscon_log 0.1680 -0.0220***
(0.1400) (0.0050)
(0.1160) (0.0040)
Observations 64 Observations 64 64
Number of
groups 12
Number of
groups 12 12
Note: This table reports the specification (5.1) and (5.2) in panel (A) and (B) respectively, using a subset of the sample, which only consists of data for non US CEOs. The dependent variable is the annual proportion of firm’s total debt to total assets at book value. The coefficients are estimated based on conventional instrumental variable dynamic panel regression results (‘OLS based or effects at the mean’) and fixed effects

Chapter 5: CEO’s Cultural Values and Firms’ Leverage Decisions
187
quantile regression dynamic panel instrumental variables (QRPIV), for the median in columns (1) and (2) respectively. *, **, *** indicate significance at the 10%, 5% and 1% level respectively.
5.10 Implications of the Research
One strategy to maximize shareholder wealth is to have the optimum mix of debt and equity in the capital
structure. All capital structure theories such as trade off theory, pecking order theory and market timing
theory, guide the managers to maximize shareholder wealth by minimizing financing costs and maximizing
financing gains of both debt and equity. However, this study points out that CEOs with culturally conditioned
irrationalities will not always make rational economic decisions. Whilst high mastery CEOs appear to behave
according to the tenets of trade off theory, highly embedded CEOs seem to behave in contrast to the
conventional wisdom. Their decisions which are steered by the cultural values might lead to sub-optimal
outcomes.
Highly geared firms may suffer by having a CEO who is culturally conditioned by high embeddedness values.
Their preference to increase borrowing irrespective of the existing debt levels of the firm, would increase the
likelihood of potential financial distress.
Culturally biased managers make leverage decisions that are more in the interest of shareholders, when the
existing levels of debt are low. However, at extreme levels of debt, cultural biases (especially embeddedness)
can be detrimental to a firm. Therefore, highly leveraged industries should especially be wary about the
cultural characteristics when making CEO recruitment decisions.
5.11 Conclusion
How do firms choose their capital structures? Is it by focusing exclusively on firm / industry and market level
factors (as per classic trade-off model, pecking order and market timing theories)? A growing body of
literature has documented the importance of including managerial biases to the capital structure puzzle.
However, empirical evidence illustrates the diverging relevance of certain behavioural patterns and
irrationalities between countries, i.e. people of the same culture will share certain behavioural biases among
them. This implies the existence of a country factor, which the study proposes to be the national culture. This
study is novel as it transcends the previous conventional emphasis on a firms’ nationality on the leverage
decision by focusing on the CEO’s cultural origin.
This chapter explores the interaction between CEO culture and trade-off theory. It appears that costs and
benefits of debt are perceived differently by CEOs with different cultural biases. This analysis of CEO cultural
impact on firm leverage neither contradicts nor confirms traditional theories. Rather, it contends that by
extending the traditional capital structure theories to account for CEO culture, can tighten some important
gaps between known theoretical predictions and unresolved empirical facts.
Chapter 5: CEO’s Cultural Values and Firms’ Leverage Decisions
188
This study provides conclusive evidence that CEO mastery and embeddedness are significantly associated
with the firm’s debt, after controlling for a set of well-known firm / industry related determinants and
personal characteristics of CEOs. High mastery CEOs increase debt, when existing firm leverage is low and
reduces debt, when existing leverage is high, unknowingly following a target capital structure, as they attempt
to strike a trade-off between their value for control and the need for personal success. On the other hand
highly embedded CEOs seem to increase leverage, irrespective of current gearing of the firm, for which the
causes seem to be ambiguous. The analysis is extended by exploring the effect of a major exogenous shock
to the system; the global financial crisis in 2008 on highly cultural-biased CEO, by studying their financing
behaviour immediately before and after the event, to confirm on the causality of CEO culture and firm
leverage. Further, an industry shock may compel the CEO to make decisions to navigate the firm through a
changing industry environment, where CEO characteristics play a major role in how CEOs respond, alleviating
CEO-firm matching concerns. Finally, by employing a sub-sample with only non US CEOs, the study concludes
that cultural values are portable. The empirical results remain robust to alternative specifications of the
dependent variable and endogeneity concerns caused by both omitted variable bias and simultaneous
causality.
The study concludes that high mastery CEOs make capital structure decisions that are more in the interest of
shareholders, while the capital structure decisions of highly embedded CEOs can be detrimental to the firm.
Academically the findings of this paper open up new paradigms that need to be considered in the area of
agency conflicts and monitoring costs.

Chapter 5: CEO’s Cultural Values and Firms’ Leverage Decisions
189
Chapter Notes:
5.1 At the onset of financial distress, some organisations may be forced to either agree to a reorganization
plan with their creditors or file for bankruptcy. In the US, bankruptcy proceedings may be initiated by the
creditors but in the case of public corporations, it is usually the firm that decides to do so. Two procedures
are available for a company that is facing financial distress and are set out in Chapter 7 and Chapter 11
of the 1978 Bankruptcy Reform Act (Brealey, Myers & Marcus, 2015). As per Chapter 7, the bankruptcy
judge appoints a trustee, who would then close down the firm and sell of the assets, in order to pay off
its creditors. Secured creditors are repaid first and any leftover amount would be shared among the
unsecured creditors, who take an assigned place in the queue. The court and the trustee come first in
the line, followed by wages, then federal and state taxes and debt to government agencies (such as
Pension Benefit Guarantee Corporation in the US). Any amounts leftover will be claimed by remaining
unsecured creditors Brealey, Myers & Marcus (2015). Nonetheless, Chapter 7 sets out procedures to
mark the end of a company. Furthermore, according to Brealey, Myers & Marcus (2015), Chapter 7 is
mostly undertaken by small companies. However, the managers of the troubled firms are reluctant to go
down this road, as they know that this would be the end of the company. Owing to this reason, Chapter
7 proceedings are often launched by creditors and not by the firm.
On the other hand, when large public corporations are unable to pay of their debt, they agree for a
reorganisation plan as supported by Chapter 11. The responsibility of devising a reorganisation plan,
generally rests with the debtor firm but if it cannot produce an acceptable plan, the court may invite a
committee of creditors. The purpose of Chapter 11 is to keep the company alive, in line with the
shareholders’ interest, as they would benefit only if the company remains alive. The reorganisation plan
basically defines who gets what (Brealey, Myers and Marcus, 2015). Each class of creditors renounce
their claim in exchange for new securities of the reorganised firm, or a mixture of new securities and
cash.
Brealey, Myers and Marcus (2015) identify that the new capital structure of the reorganised firm should
be designed in such a way that it will firstly, satisfy the lenders and secondly, enable the firm to resolve
the issues in the business that lead the firm into financial distress.
5.2 The notion of information asymmetry was pioneered by the Nobel laureate George Akerlof, in his seminal
paper “The market for lemons: quality, uncertainty and the market mechanism” in 1970.By focusing on
the automobile market, the author illustrated how information asymmetry between buyers and sellers
will result with deteriorating the quality of goods traded in the market. In colloquial speech in America,
a “lemon” is a car that is found to be faulty after it has been purchased. The problem is, in an automobile
market, buyers cannot distinguish between a “lemon” and a high quality car beforehand, whereas sellers
would know what they hold. This implies the existence of information asymmetry in a market. Owing to
the lack of information about the true quality of the car, buyers would only be willing to pay a fixed price

Chapter 5: CEO’s Cultural Values and Firms’ Leverage Decisions
190
that is an average of the values of a good car and a “lemon” together. This would drive out the suppliers
of high quality cars from the market (as the average price would be less than the price of a high quality
car) and when they start leaving, the average price paid for a car would further drop, leading to even
more suppliers of high quality cars exiting, leaving the market only for “lemons”. This portrays a situation
of how uninformed buyers’ price can create an “adverse selection’ problem which can eventually lead to
a market collapse (Akerlof, 1970).
5.3 The author elucidates the existence of an observed knowledge gap between the organization and the
potential employees (applicants). Although an applicant is aware of his or her own level of ability, the
organization is not capable of identifying such unobservable characteristics, resulting with a case of
information asymmetry. Thus, applicants are ought to send signals about themselves to the prospective
employers, in order to narrow the information gap or to diminish information asymmetries. Good
applicants can send positive signals about themselves, by possessing good educational credentials that
can be too difficult for the bad applicants to match. Hence such signals are acquired at a cost. Further
Spence (1973) defines an equilibrium in the context of a feedback loop, in which the employer will decide
a certain amount of wage for a given level of education that would be sought for by the potential
employees. Thus, the individuals will invest on such educational credentials. However, after recruitment,
the actual relationship of education and productivity may induce the employers to revise their
expectations and beliefs and thus the cycle re-starts. A state of equilibrium occurs when the employers’
set of beliefs are confirmed, by a positive relationship between employees’ education and productivity
after recruitment. Arrow (1973) too studied about signalling in the labour market.

Chapter 6: The Clash of Cultures and Its Effect on Firm Performance Volatility
191
Chapter 6: The Clash of Cultures and Its Effect on
Firm Performance Volatility
6.1 Introduction
Workplace diversity and inclusion has attracted profound attention of practitioner circles, pressure groups
and academic community. The European Commission (2005) identifies workplace diversity as “policies
promoting non-discrimination on grounds of ethnic or racial origin, disability, religion or belief, age and sexual
orientation in the workplace” (para 1). However, racial and ethnic diversity on its own has remained a hot
topic in corporates over several years. In fact, a follow up report of Parker Review70 2017, indicates that out
of the total 1,048 director positions available in the FTSE 100 companies in 2018, only 84 positions (a mere
8%) were filled by individuals representing BAME (Black, Asian and Minority Ethnic) backgrounds (Inman,
2019). Thus, “Women are cracking the glass ceiling; but people of colour remain super-glued to the corporate
floor” says Trevor Phillips, the former British politician and the ex-chairman of the Equality and Human Rights
Commission (EHRC), UK (Inman, 2019, para 12), expressing his concerns over the failure of the top UK firms
failing to increase boardroom diversity.
A large body of research investigates on ethnic / racial diversity in the boardroom and its impact on corporate
outcomes. However diversity and cultural distances are distinct from each other, as the former would only
consider the representation of minority executives in a firm, while cultural distances, a relatively broader
concept, examines how different they can be from each other based on their values, beliefs, attitudes and
perceptions. Figure 6.1 indicates how an American individual differs from a Chinese and a Spanish, based on
Hofstede’s (2001) cultural dimensions.
70 Parker review is an independent review prepared by Sir John Parker that investigates the level of ethnic and cultural diversity of UK boards.

Chapter 6: The Clash of Cultures and Its Effect on Firm Performance Volatility
192
Figure 6.1: An illustration of the differences in cultural values (e.g. among Spain, U.S.A and China)
Hiring a Spanish director (Hispanic ethnicity) would contribute towards improving racial/ethnic diversity in a
US company, but when considering cultural differences, they can be relatively closer to each other in their
values and cultural upbringing. On the other hand, the appointment of a Chinese director to a US company
would also flag as improving diversity, but this would involve very different implications, as US and Chinese
foster diverse values, belief systems, attitudes and perceptions. The above figure indicates that Americans
and Chinese are vastly different from each other in terms of power distance, individualism, long-term vs
short-term orientation and indulgence vs restraint values (Hofstede, 2001). This phenomenon is not
considered when taking only diversity into account and thus motivates the present study. Differences in
values, opinions, perceptions can sometimes be valuable to a firm, as it introduces varied perspectives to a
problem, as per the resource dependence view and learning theory. In contrast, agency and transaction cost
theories posit that difference in opinions and views can lead to lack of trust, miscommunications,
misunderstandings, and conflicts. How would this phenomenon affect the firm idiosyncratic risk? This problem
has not been researched before and is the focus of the present study.
In essence, the present study brings the differences in values, beliefs, attitudes, and perceptions of key
players (e.g. the CEO, board and stakeholders) in a firm, to the fore and emphasizes on its impact on firm
idiosyncratic risk. As the CEO is considered to be the most powerful actor in an organization (Malmendier et
al., 2011; Malmendier & Tate, 2007; Nguyen et al., 2018), with the ultimate authority of decision making, the
differences of national cultures are calculated between (i) the CEO and the dominant culture of the board
and (ii) the CEO and stakeholders (proxied by the country in which the head-office of the firm is located).
Owing to the important role played by the board of directors in an organization in terms of monitoring,
advising and resource provision, (iii) cultural distances among board of directors is also considered. To
operationalize the relative difference in culture among the key players, Kogut and Singh (1988) index, a
0
10
20
30
40
50
60
70
80
90
100
Spain
U.S.A.
China

Chapter 6: The Clash of Cultures and Its Effect on Firm Performance Volatility
193
variant of the Euclidean distance index is employed with Hofstede’s cultural dimensions (1980). To
operationalize the firm idiosyncratic risk, performance volatility, calculated in terms of stock performance
(volatility of monthly / quarterly stock returns), accounting performance (variability in annual accounting
return on assets) and corporate value (variability in annual Tobin’s Q ratio) is employed. The econometric
model controls for CEO characteristics (CEO risk aversion, age, gender, education, network size, CEO power
and managerial ability), board attributes (board size and independence) and firm characteristics (firm size,
leverage, growth opportunities and investment) that are well known to affect firm idiosyncratic risk, whilst
recognising industry heterogeneity via indicator variables for each industry.
Based on prior literature on board dynamics, we develop contesting hypotheses for the impact of three
cultural spheres and volatility. Firstly when the cultural distance between the CEO and board is higher, they
rarely belong to the same network and are less likely to suffer from groupthink (Ferreira, 2010). This will
cause the board to be more “unfriendly” (Adams & Ferreira, 2007) towards the CEO, implying that the board
is more independent. Independent directors are more likely to raise questions and be vigilant about the
behaviour of the management (Carter et al., 2003). This would prevent management from involving in value
destroying risky ventures (Fracassi & Tate, 2012) resulting with less variable performance. It would also
prevent the management from making strategic decisions single-handedly. When making decisions together
by culturally distant CEO and board members, it would entail mixed opinions and disagreements and finally
a “diversification of opinions effect” (Adams, Almeida and Ferreira, 2005, p.1406), when approving
management proposals, resulting with less extreme (neither very good nor very bad) and less variable
performance. Conversely, when greater cultural differences exist between the CEO and the board, it can lead
to difficulty in aggregating the differences in preferences, resulting with more erratic outcomes (Giannetti &
Zhao, 2015), and ultimately increasing performance volatility.
Second, when the cultural distance between the CEO and stakeholders are larger, it can be assumed that
CEO’s priorities over corporate objectives may be different from those of stakeholders. Thus the disarray of
preferences of CEOs and stakeholders are likely to result with CEO’s making unpredictable decisions,
eventually increasing performance volatility (Ferris et al., 2017; Giannetti & Zhao, 2015).
Finally, when the board members are culturally different from each other, their varied opinions may
aggravate conflicts among themselves. Internal conflicts would make it hard to attain a consensus among
members, resulting in more erratic outcomes, ultimately increasing firm risk and outcome volatility (Bernile
et al., 2018; Giannetti & Zhao, 2015). Moreover, in-group conflicts and the resultant coordination problems,
would make the CEO more powerful (Jensen, 1993). The evidence on CEO power and firm performance
volatility is mixed. Adams, Almeida and Ferreira (2005) argue that CEOs with more power leads to more
variable performance, because, when the CEO is involved in making most of the relevant decisions, the risk
arising from the judgement error may not be well diversified and the likelihood of either a very good or a very
bad decision being taken is high, increasing firm performance variability. On the other hand, CEOs with high
power tend to lower their largely undiversifiable “employment risk”, and thereby causing the firm risk to
decrease (Amihud & Lev, 1981; Bertrand & Mullainathan, 2003). Moreover, culturally diverse groups foster

Chapter 6: The Clash of Cultures and Its Effect on Firm Performance Volatility
194
diversified opinions and bring in varied perspectives to a problem. The resultant decision is a compromise,
neither very good nor bad, (Sah & Stiglitz, 1986, 1991), ultimately decreasing performance volatility.
By scrutinizing a sample of 1,190 firms from 12 European countries, over 14 years from 2005 to 2018, the
study finds that, the CEO - board cultural distance lowers firm performance volatility, assessed in terms of
stock, accounting and market value measures. This implies that a greater distance between the CEO and the
board of directors is beneficial to a company as the board will play a more independent and active role in
preventing the management from involving in value destroying risky ventures and making strategic decisions
single-handedly. Conversely, a greater distance between the CEO and stakeholders augments firm
performance volatility, inferring that the greater cultural distances and the resulting disarray of preferences
of CEOs and stakeholder groups may result with CEOs making unpredictable decisions, ultimately increasing
performance volatility. Stakeholders seem to prefer leaders with greater cultural affinity (Ferris, Jayaraman
and Zhang, 2017). McPherson, Smith-Lovin and Cook (2001) support this, in their study on the homophily
principle, where they posit that homophily in race and ethnicity creates the strongest divide among
individuals.
Furthermore, considering the possible heterogeneous nature in the in-sample volatility levels, the study
categorises the firms as least volatile, most volatile and moderately volatile. How would the cultural distances
between the CEO, board and stakeholders affect the performance variability, in each of these three groups?
To address this problem, the study employs quantile panel regressions. Whilst the first two cultural spheres
reinforce the previous findings among all three groups, within-board cultural distances appear to reduce
stock performance volatility, only in firms with moderate idiosyncratic risks, where the same is amplified in
least volatile and most volatile firms. This implies that the extra social and human capital that would be
brought in to the firm by culturally diverse directors (as per the resource dependence view), would help to
position the firm better in terms of managing risks, only in moderately uncertain environments. Such benefits
appear to add little value and the costs of cultural distances seem to outperform the benefits in least and
most volatile firms. Moreover, the empirical analysis indicates that degree of existing performance volatility
of a firm significantly matters, when examining the association between cultural distances and firm
performance variability. As this study models directional heterogeneous effect across firms over the entire
distribution of the performance volatility spectrum, this paper appears to be the first to propose a complete
characterisation of tail behaviour of cultural distance attributes across the entire performance volatility
spectrum.
Moreover, considering the fact that CEO and board characteristics may not be exogenous variables (Hermalin
& Weisbach, 2003), the study develops a dynamic model that controls for reverse causality and for cultural
distances and risk being influenced by unobservable firm factors. Endogeneity corrected association between
CEO-Board / within-board cultural distances and firm risk, remains negative, but statistically non-significant.
The effect of cultural distance between CEO-stakeholders and performance volatility remains positive and
significant. Results of this sphere remain robust to a battery of tests performed, such as employing an
alternative measure of cultural distance (Standardized Euclidean Index) and using alternative cultural

Chapter 6: The Clash of Cultures and Its Effect on Firm Performance Volatility
195
frameworks (Schwartz, GLOBE). In addition to CEO and stakeholders, CEO – board cultural distances too
evince a negative and a statistically significant association with firm risk, when alternative cultural distance
measures and cultural frameworks are used.
The rest of the analysis place special emphasis on within-board cultural distances to examine the reasons
behind its statistical non-significance. The study introduces additional boardroom diversity variables which
were previously excluded from the model, such as director gender and age as ‘variety’ (measured by Blau’s
Index) and director education, tenure and network size as ‘disparity’ (measured by coefficient of variation)
as suggested by Harrison and Klein (2007), as omitting relevant independent variables from the model may
underestimate the strength of the effect of the main regressor. Nevertheless, whilst director gender and
education diversity appear to be statistically significant in lowering firm risk, within-board cultural distances
remain negative but statistically non-significant.
Endogeneity corrected association between within-board cultural distance and firm performance volatility
appears to always remain negative. The negative association could be due to couple of reasons; first,
diversified opinions and varied perspectives, inside the boardroom may lead to the final decision being a
compromise, neither too good nor too bad, reducing performance volatility; second, possible boardroom
conflicts resulting from increased distances among directors, would make the CEO powerful, giving rise to
agency problems, which could either increase or decrease volatility. However, CEO power is controlled for in
the econometric specifications. Could this be the reason, for within-board cultural distances to appear non-
significant? To rule out this possibility, a formal test is done. If in-group conflicts make a board more captive
to the CEO and CEO power leads to less volatile firm performance, it could be reasonably assumed that this
effect is more prominent for boards that are likely to experience severe agency problems. Thus surplus cash
is used as a proxy for the degree of agency problems (Jensen, 1986; Sila et al., 2016) and the econometric
model is extended by adding an interaction term between surplus cash and within-board cultural distance.
The results, indeed, indicate that agency problems appear to be aggravated by culturally distant boards,
leading to less volatile performance, which was not previously captured as CEO power was controlled for.
Finally, we address the possible selection bias issues by employing a Heckman selection model. The results
confirm that firm risks are not driven by employing a non-randomly selected sample.
In summary, the cultural distance between the CEO and stakeholders, on firm risk, appear to remain positive
and strongly significant, regardless of endogeneity correction and various other robustness tests. CEO –
board cultural distance evinces a negative association, which proves statistically significant in most of the
endogeneity corrected regression models. Within-board cultural distances generate interesting results. First,
the findings of quantile panel regression indicate that within-board cultural distances would only benefit
moderately volatile firms, but would intensify the risks of most and least volatile firms. Further, after
correcting for endogeneity, within-board distances remain to have a negative association with performance
volatility, which is statistically non-significant. However further tests indicate that within-board cultural
distances apparently create boardroom conflicts, which would make the CEO more powerful, thereby

Chapter 6: The Clash of Cultures and Its Effect on Firm Performance Volatility
196
aggravating agency problems and ultimately decreasing volatility, which was not captured before as CEO
power was controlled for in the econometric model.
Prior scholars have established that cultural values have an impact on firm outcomes. In addition, cultural
differences among regions/ countries are also shown to affect the relationship among cross-border firms.
However, the emphasis of such research was on the national culture of either the CEO, firm or country. Put
differently, the existing literature only explores the effect of a ‘single’ culture associated with either the
decision-maker or the firm/country. Whilst this study directly contributes to the growing literature on cultural
effects on corporate outcomes, it adopts a novel approach and underlines the existence of a multiplicity of
cultures within a single firm. This phenomenon has been hardly researched. Furthermore the paper
investigates the effect of having a multiplicity of culture on firm idiosyncratic risk, which, to the best of my
knowledge, has not been researched before. Academically, the findings of this paper open up new paradigms
that need to be considered in corporate recruitment and risk management policies.
6.2 Literature Review
6.2.1 Introduction
The literature review is predominantly structured under three divisions. The first division intends to discuss
about the key players within the firm in the context of this study, i.e. mainly the CEO and the board of
directors, and their impact on firm performance and performance volatility. However as the effect of CEO
characteristics on firm outcomes are already discussed in section 5.2.3 of Chapter 5, it is excluded from this
section for brevity. Therefore the first division of the current section elaborates on the board dynamics in
detail and their impact on firm performance / performance volatility. Second division focuses on
operationalizing the cultural differences between the key players of the organization. Therefore, extant
literature that covers theoretical perspectives that frame the construct cultural distance, how it can be
measured, criticisms involved in measurement and finally some previous literature that has employed this
construct is discussed. The final division discusses about the identified empirical gap in literature and how
this study attempts to fill this void.
6.2.2 Board Dynamics
This subsection commences with a discussion on different theoretical perspectives that frame the role of
board of directors. Next, several board characteristics, such as board size, board independence, board
diversity (viz. gender, racial/ethnic/cultural and other) and a related phenomenon which is CEO power is
explained in detail along with their impact on corporate outcomes. All these variables are controlled for in
the empirical model employed in this study.
6.2.1.1 Different Perspectives on the Roles of Board of Directors
Based on prior research, Zahra and Pearce (1989) underline four main attributes (composition,
characteristics, structure and process) and three critical roles (service, strategy and control) of a director
Chapter 6: The Clash of Cultures and Its Effect on Firm Performance Volatility
197
board in a firm. Composition emphasizes on the board size and the mix of different types of directors, in the
board (e.g.: insiders vs outsiders). Characteristics refer to the experience, functional background,
independence, stock ownership etc. of individual directors. Structure highlights how the board is organized,
or the division of work among standing committees and the efficiency of its operations and finally process
encompasses decision making related activities and styles of the board (Zahra and Pearce, 1989). On the
other hand, the service role of the directors incorporates boosting the company reputation by forming close
contacts with the external environment and offering advice to executives, whereas the control role involves
appraising the firm and CEO performance to ensure corporate growth and protection of shareholders’
interest. The strategy role incorporates actions like, initiating strategic analyses, recommending alternative
courses of actions or even broader activities such as formulating the firm’s mission, articulating strategies
and establishing guidelines for effective control of the chosen strategies.
According to Zahra and Pearce (1989), four distinct theoretical perspectives underpin the aforementioned
roles of the board of directors, viz. the legalistic perspective, resource dependency perspective, class
hegemony perspective and agency theory
a) Legalistic Perspective
This perspective elucidates that boards influence the performance of their firms by undertaking the
responsibilities mandated by corporate laws (Zahra and Pearce, 1989).
b) Resource Dependence Perspective
Resource dependence theory (J. Pfeffer & Salancik, 1978) upholds that organisations employ board of
directors, both executive and non-executive, as a mechanism to draw on external resources for its long-term
survival and growth. According to Zahra and Pearce (1989, p.297), resource dependence perspective
considers board of directors as important “boundary-spanners” or “linking-pins” that connects the firm with
its external environment, thereby making timely information available to executives, which makes directors
absorb environmental uncertainty 71 . Similarly Singh (2007) argues that vital informational resources
bestowed by the directors, can place the firm better in terms of managing risks. Directors with substantial
previous experience carry considerable expertise and render valuable advice and other important
information to the firm. In addition the firm can benefit from the directors’ networks and gain legitimacy in
71 Although resource dependence perspective is in close theoretical proximity to the “interlock approach”, Zahra and Pearce (1989) demarcate the two, as the resource dependence perspective posit that directors assist the firm to interact with its general and competitive environments, whereas the latter focuses exclusively on the firm’s interface with the competitive environment. Mizruchi (1996) defines an interlocking directorate as a situation where a person affiliated with one organization sits on the board of directors of another organization and highlights several determinants of interlocks, viz. collusion, cooptation and monitoring, legitimacy, career advancement and social cohesion

Chapter 6: The Clash of Cultures and Its Effect on Firm Performance Volatility
198
the view of its stakeholders by appointing directors with outstanding capabilities and reputation (J. Pfeffer &
Salancik, 1978; Singh, 2007).
According to the resource dependence approach, directors primarily endow two principal resources; viz.
human capital and social capital.
- Human Capital
Human capital theory was proposed by the Nobel Laureate in Economic Science in 1992, Gary S. Becker.
According to him, the human capital perspective “considers how the productivity of people in market and
non-market situations is changed by investments in education, skills and knowledge” (Becker, 1993, p.386).
He further envisages that if a minority member has achieved a high status, such as a directorship in a firm, it
is highly likely that the particular member is well-educated with extensive experience for the board position
(Becker, 1993). Becker also classifies human capital as firm-specific and general human capital, where firm-
specific human capital, unlike its counterpart, has limited external transferability. However at board level,
firms need both firm-specific and general human capital and thus appoint executive and non-executive
directors respectively, as a result.
- Social Capital
Coleman (1990, as cited in Seibert, Kraimer and Liden, 2001, p.5) explains social capital as “any aspect of
social structure that creates value and facilitates the actions of the individuals within that social structure”.
Seibert, Kraimer and Liden (2001) postulate that social capital is created via the interactions of individuals or
organisations, for instance in networks of relationships, through which information, knowledge and support
are shared and communicated, so that important actions can be taken.
Burt (1995) argues that directors of large firms are expected to have instrumental connections across the
business world. Such instrumental networks of a director is referred to as social capital and a firm can improve
its value by appointing a director with a large social capital (Burt, 1995). If a new director is appointed who is
demographically different to the existing directors, it is highly likely that a new network is added to the firm,
thereby enhancing its current social capital. Then again Singh (2007) posit the availability of a rich social
capital would also position the firm better in terms of managing uncertainties.
c) Class Hegemony
Class hegemony interprets the board as a mechanism of enforcing the powers of the “ruling capitalist elite”
(Zahra and Pearce, 1989, p. 299). Advocates of this perspective argue that only the influential and prestigious
individuals are encouraged to serve on boards, which inevitably eliminates other social groups from operating
in board level, thus protecting the values and interests of the ruling capitalists. This approach views the CEO
as the “ultimate power-broker” in a firm (Zahra and Pearce, 1989, p. 300).
Chapter 6: The Clash of Cultures and Its Effect on Firm Performance Volatility
199
d) Agency Perspective
According to the agency theory, agency relationships should be the nucleus in analysing corporate
governance issues. The advocates of agency theory claim that dispersion of corporate ownership results with
executives (“agents”) gaining considerable amount of power and freedom. As executives are in possession
of firm specific knowledge and managerial expertise, they are believed to gain an advantage over firm owners
who are mostly removed from operational activities of the firm (Dalton et al., 1998). As executives gain
control over firm, they tend to pursue objectives that are contradicting with goals of the owners (“principals”)
which would ultimately erode shareholder wealth (Masson, 1971). Therefore, boards are responsible of
monitoring top executives and rewarding compliant behaviour.
In addition to the theoretical perspectives discussed above, Boyd, Haynes and Zona (2011) added few others
to the study of board of directors, viz. the Upper Echelons Theory, Stewardship Theory, Institutional Theory
and Social Network Theory.
e) Upper Echelons Perspective
This theory was explained in detail in section 5.2.3.3 under Chapter 5 and thus for brevity, is not elaborated
here. However, in this context, the theory implies that the extent to which the board roles are carried out
and the success of firm outcomes are bounded by the values and cognitive bases of the board of directors.
f) Stewardship Theory
Stewardship theory opposes its counterpart, agency theory, by interpreting that stewards are motivated to
act in the best interest of their principals (Davis et al., 1997). According to Donaldson and Davis (1991), the
stewardship theory contends that “managers are good stewards of the corporation and diligently work to
attain high levels of corporate profit and shareholder returns” (p.159). The underlying assumption of this
theory is that the steward will, under any circumstances, prioritize organizational needs. This theory further
posits that the behaviour of stewards is motivated by intrinsic rather than extrinsic rewards and is strongly in
compliance with achieving the organizational goals (Boyd, Haynes and Zona, 2011). Continuing this line of
thought, it can be assumed that the need for the control mechanism undertaken by board of directors is at
minimal. Boards are viewed more as providers of valuable resources; hence the stewardship role is consistent
with the previously explained resource dependence perspective.
g) Institutional Theory
Institutional theory emphasizes on the cultural influence on corporate decision making and formal structures.
As per Barley and Tolbert (1997), it rejects the viewpoint that social actors are “rational”. Institutional theory
highlights that firms comply to accepted social or institutional norms of appropriate behaviour in order to
gain legitimacy and to improve its chances of long-term survival. Hence institutional theory appears to have
an ambiguous effect on Zahra and Pearce’s (1989) model on board roles, because as per this theory, the
directors will perform those prescribed roles that have already been socially and institutionally accepted.

Chapter 6: The Clash of Cultures and Its Effect on Firm Performance Volatility
200
h) Social Network Theory
The underlying argument of the social network theory is very similar to the resource dependence perspective.
It suggests that a firm can obtain external resources and information via the appointment of directors, which
will eventually influence firm behaviour and performance via the organisational networks of the directors.
Organisational networks are formed via connections fostered by the focal firm, including supplier
relationships, resource flows, relationships among individual employees, association memberships,
competitor alliances etc. (Boyd, Haynes and Zona, 2011). In addition to the exchange of information, social
networks will also enable the board of directors to observe leadership practices and witness the
consequences of such practices (Gulati & Westphal, 1999). Social network theory primarily explains the
causes and consequences of interlocking directorates (Westphal & Zajac, 1997). It can be assumed that the
pivotal role of the board, is service provision, similar to the idea of resource dependence perspective.
Multiple interpretations of CEO – Board Relations based on different theoretical perspectives
How do CEO and boards interact? This study views this question in terms of their cultural differences.
However, this CEO-board relationship is, indeed, a complex and a multi-faceted phenomenon, but can be
categorized under a variety of labels, such as power, control, involvement and vigilance (Boyd, Haynes and
Zona, 2011). A glut of prior research has investigated this relationship but the framing and focus of these
studies are governed by the theoretical perspective used, that are elaborated above.
For instance, the agency perspective postulates an adversarial association between the CEO and the
board, as the underlying tenet of agency theory assumes that agents (CEOs) are in pursuant of
opportunistic behaviour. Thus it is the responsibility of the board to monitor and reward / punish their
behaviour accordingly.
In complete contrast, resource dependence framework and the social network theory emphasize on the
collaboration between the CEO and the board of directors, holding the view that boards provide valuable
resources and information for the organization.
On the other hand, stewardship theory posits that the pivotal role of the board of directors is to support
the decision-making activities of the CEO and to provide advice. Stewardship theory puts forward that
the agents will always put organisational needs first. Thus, the objectives between agents and principals
rarely contradict. Hence the need to control stewards is minimal. Control is instead replaced by
empowerment and autonomy (Boyd, Haynes and Zona, 2011).
The aforementioned three different stances are further complemented by the institutional theory and upper
echelons theory.
Institutional theory is similar to the resource dependence view, as both theories affirm that firms
should adapt to a constantly changing environment. However it opposes the agency perspective as
institutional theory rejects the model of a rational actor. Institutional theory, instead, believes that

Chapter 6: The Clash of Cultures and Its Effect on Firm Performance Volatility
201
socially accepted norms, overtime, turns in to rules and authoritative guidelines that govern social
behaviour.
Upper echelons theory emphasizes on the bounded rationality of managers and is, in fact, consistent
with resource dependence, social network and stewardship frameworks, because all of these
theories assume that the decision maker’s actions are affected by his or her human and social capital
(Boyd, Haynes and Zona, 2011).
Figure 6.2 summarises all theoretical interpretations (explained above) that underpin the functions of the
board of directors in a firm. The opposing viewpoints under each perspective are indicated by double-headed
arrows.
Figure 6.2 The Role of Board of Directors – Various Theoretical Perspectives
6.2.1.2 Previous Research on the Effectiveness of Board of Directors on Firm Outcomes
Previous research on the effectiveness of board of directors are primarily governed by the agency
perspective. This body of literature largely focus on the influence of the board on corporate performance and
on corporate actions (Hermalin & Weisbach, 2003). The effectiveness of the board is predominantly
operationalised via observable proxies such the a) board size, b) composition (Wang, 2012) i.e. the
composition of inside and outside directors c) CEO power over the board of directors and d) board
heterogeneity. The next subsections focus on the effect of these characteristics of boards, mainly on
corporate performance and performance volatility.
Legalistic Approach
Focus on Corporate Laws
Institutional Theory
Socially accepted norms Behaviour governed
by social norms
Stewardship Theory
Owner-manager goals
Rarely contradict
Safeguarding the interests of owners
Agency Theory
Owner - manager Rational
conflicts of interest behaviour
Class Hegemony
Safeguarding the interests of ruling capitalists
Resource Dependence View
General environment Competitive
environment
(Social Network Theory)
Upper Echelons Theory
Bounded rationality

Chapter 6: The Clash of Cultures and Its Effect on Firm Performance Volatility
202
a) Board size – “Does one size fit all?”
This section reviews previous literature that investigates the impact of board size on firm performance.
Board size and Firm Performance
Although board size and firm performance has been the focus of a number of prior research, the literature
has often produced contradictory results. Some prior scholars advocate the existence of large boards, as the
firms could then distribute board committee assignments, among a large number of directors (Klein, 2002),
that eventually improves board monitoring and because large boards would bring in greater advice and
linkages with the external environment (Klein, 2002; Coles, Daniel and Naveen, 2008; Linck, Netter and Yang,
2008), thereby eventually improving firm value. This viewpoint is grounded in the resource dependence
perspective.
However, the opposing strand of literature is based on the tenets of agency theory that addresses the role of
the board by protecting shareholders from managerial self-interests. These scholars argue that large
boardrooms lead to slower decision making (Yermack , 1996) and “great emphasis on politeness and courtesy
at the expense of truth and frankness in boardrooms” (Jensen, 1993, p.863). Thus directors rarely hold candid
discussions about firm performance or criticize the policies of top managers (Lipton and Lorsch, 1992;
Yermack ,1996).In fact Jensen (1993, p.863) identifies large boards as “both a symptom and cause of failure
in the control system” (p.863) and emphasizes that the board size should ideally be not more than seven to
eight individuals, as small boards can improve firm performance.
Based on prior research, the negative association between board size and firm value can be encapsulated
mainly under two sources. First, large boards would encounter greater problems of communication and
coordination that would diminish the ability of the board to control management, attenuating agency
problems (Jensen, 1993; Yermack, 1996). However, if this is true, why can’t a firm adjust its board size to
improve value? Jensen (1993) explains that a larger board would result with less candid discussions of
managerial performance, which would result with greater CEO control and power. When CEO control is high,
boards are more captive to the CEO, again aggravating agency problems and subsequently deteriorating firm
value, which is the second possible cause as identified by previous literature.
Alternative Interpretations
Continuing the above line of thought, it can be implied that self-interested managers appear to favour large
boards, to avoid intense board monitoring. Thus it can be assumed that this conjecture is more noticeable in
large firms, where ownership and control is made separate.
Yet, Eisenberg et al. (1998), conclude on a negative association between board size and firm value, even in
small, closely held (owner-managed) firms in Finland, where agency costs and the conflicts between
management and the board are deemed to be minimal. They present a different explanation than the agency
perspective and argue that the board size is reflective of the composition of the board and that larger boards

Chapter 6: The Clash of Cultures and Its Effect on Firm Performance Volatility
203
may comprise of more outside directors. Outside directors usually hold a negligible equity stake in the focal
firm. Therefore, the reputation cost that they would have to bear if the project fails, is much more significant
than the benefits that would be enjoyed, given the same project succeeds. Thus outside directors foster a
bias against projects with high performance volatility, even though its net present value may be positive. This
would erode the market value, implying a negative relationship between board size and firm value72.
Board Size, Performance Volatility and Risk Taking
The effect of board size has been investigated on performance volatility in a number of prior research. Cheng
(2008) employs the variability of monthly stock returns to proxy the performance variability. He hypothesizes
that the impact of board size on performance volatility may have two consequences, driven by agency and
non-agency explanations. The non-agency perspective of board size, as per Cheng (2008), is in close proximity
to studies of group decision-making, in the economics and social psychology fields and also is in line with the
resource dependence perspective. Sah and Stiglitz (1991) affirm that decisions of a larger group entail less
variability. In the context of their study, large boards foster diversified opinions and brings in varied
perspectives to a problem (Sah & Stiglitz, 1986, 1991). Therefore, the final decision made by the group is a
compromise that manifests the different opinions and varied perspectives. Such decisions are less extreme,
neither very good nor bad and they tend to reject risky projects, as the project has to be endorsed as
acceptable by several group members, before it can finally be accepted (Cheng, 2008).
On the other hand, as per agency explanations, Cheng (2008) elucidates that when the board size is large, the
higher communication and coordination costs would aggravate agency problems, resulting with higher CEO
power. High CEO power may affect firm performance variability in opposing ways. First, when CEO power is
high, according to Amihud and Lev (1981) CEOs tend to reduce their risk exposure, as evident by their
engagement in conglomerate mergers, in order to lower their largely undiversifiable “employment risk”
(Amihud & Lev, 1981)73.
Contrarily, Adams, Almeida and Ferreira (2005) empirically tests the notions of above explained group
decision-making from a management perspective and affirm that when CEOs have less power, for any given
new venture, the CEO needs the approval of a larger number of other top executives. Although Adams,
Almeida and Ferreira only emphasized on the relationship between the CEO and other top executives of the
72 On the other hand, the effect could flow in the opposite direction, if the directors own equity. In this scenario, given the board size is large, the reputation cost will be shared among more directors in the board and the cost of poor decision making is spread among a larger group. Therefore directors are willing to accept risky projects with higher returns that would eventually increase firm value. 73 A conglomerate merger is generally known to reduce the risks for the combined entity, via its diversification effect. In a perfect capital market, such risk reduction mechanisms are not in the best interest of the shareholders, as they can achieve their own desired levels of risk through “homemade” portfolio. Yet, managers, tend to engage in conglomerate mergers, to lower their largely undiversifiable “employment risk” (Ahimud and Lev, 1981). The authors identify risk of losing the job or tarnishing professional reputation as sources of employment risk.

Chapter 6: The Clash of Cultures and Its Effect on Firm Performance Volatility
204
firm, Cheng (2008) extends the argument to explain a similar situation among the CEO and board of directors.
Eventually, the resulting decision is a compromise that incorporates the varied opinions of all members and
is likely to be less extreme. Nevertheless the ultimate direction between large boards and performance
volatility is apparently ambiguous, from an agency perspective.
Moreover, Eisenberg et al. (1998), also affirm that larger boards are biased against risk taking, as larger boards
may have a higher proportion of outside directors who are highly concerned about their reputation. This has
already been explained in detail before.
b) Board Composition
Board composition is the other most commonly used proxy for board characteristics, apart from the board
size. In the context of this study, board composition is referred to as the mix of outside and inside directors.
Definition of inside and outside directors can take various forms. For instance, Baysinger & Butler (1985);
Bhagat & Black (1999); Byrd & Hickman (1992) categorise board of directors as inside directors (individuals
who are currently officers of the company), affiliated outside directors (former company officers, relatives of
company officers and persons who may have business relationships with the company, like lawyers,
commercial/investment bankers etc.) and independent directors (outside directors without such affiliations).
Nevertheless, the popular view of the academic and corporate community is that outsider-dominated boards
are more independent and engage in effective monitoring and evaluation of CEO performance that can
ultimately lead to increased firm performance and shareholder value. Apparently, this view is largely
grounded in the agency theory. The agency perspective, however, stimulates two lines of arguments involving
outside directors.
Outside Directors and the Information Paradox
First contention relates to an information paradox. Conventional wisdom denotes that outside directors are
more independent and thus are more effective in monitoring the management. However can an outside
director comprehend the organizational control system adequately enough to make sound proposals?
Duchin, Matsusaka and Ozbas (2010), further validate this argument and suggest that given the cost of
acquiring firm information is low, firm performance improves when outsiders are added to the board.
However adding outside directors to the board can worsen firm performance, if the cost of acquiring
information is high. Thus effectiveness of outside directors, according to Duchin, Matsusaka and Ozbas
(2010), depends on the cost of acquiring firm information.
Adams and Ferreira (2007) further discuss this point and underline a paradoxical situation. For the board or
in particular, the outside directors to provide better advises, he/ she should be in better possession of firm
specific information. The responsibility of the provision of accurate and timely firm information to the outside
directors, lies in the hands of the CEO or the top management. However, the same board also acts as
monitoring agents of CEO behaviour. The more precise the information that is provided to the board, the

Chapter 6: The Clash of Cultures and Its Effect on Firm Performance Volatility
205
more the board would interfere with management’s decisions. Hence the “CEO faces a trade-off in sharing
information” (Adams and Ferreira, 2007, p. 218)
The study of Adams and Ferreira (2007) especially reveals how the two primary functions of the board;
monitoring and advisory, contradict with each other. The authors affirm that, as a result, director
independence may have adverse consequences, in a “sole board system”. A sole board system is where the
board is responsible of performing both monitoring and advisory roles and can be generally seen in countries
like U.S., U.K., Australia, Italy, Japan and India etc. (Adams & Ferreira, 2007). In a sole board system, if the
managers reveal more information, the intensity of monitoring increases. This situation will be exacerbated
with the existence of independent directors. Hence managers tend to conceal a lot of sensitive information,
which then lowers the advisory quality and consequently the firm value. Therefore increasing board
independence, in a sole board system, may degrade firm value (Adams & Ferreira, 2007). Adams and Ferreira
suggest that increased board independence in a sole board system should be accompanied by improved
disclosure practices, to indeed reap the benefits of board independence.
However, this association may reverse in a “dual board system”. A dual board system is where the board is
formally separated into a supervisory board and a management board and is mostly visible in several
European countries such as Austria, Belgium, Croatia, Denmark etc. (Adams & Ferreira, 2007). The authors
postulate that increasing the independence of the supervisory board, in a dual board system, will eventually
improve firm value, because more independent directors in the supervisory board will enable the board to
perform their role effectively74 and on the other hand, the board will continue providing quality advise,
provided that better information is shared with them by the management. Finally, the authors also add that
a sole board system would still add firm value, if board is CEO-friendly (doesn’t monitor too intensely) and if
their preferences are more closely aligned with those of the CEO.
Board independence – “Is the fox guarding the chicken coop?”
The second line of thought is related to the appointment of the directors. Boards are appointed on behalf of
the owners, to act in line with the interests of the owners and to monitor CEOs. However, ownership is
represented by many dispersed shareholders, in a large corporation. Due to free-rider problems and the
regulatory requirements, shareholders are unable to directly appoint directors (Hermalin & Weisbach, 1991)
and the appointment of directors in most firms is the responsibility of the CEO (Mace 1971, as cited in
Hermalin and Weisbach, 1991). Thus directors, irrespective of whether they are inside or outside, are more
aligned to the interest of the management than of the shareholders. This evinces that the appointment of
board of directors may not allow the shareholders to completely escape from the agency problem (Hermalin
& Weisbach, 1991). Furthermore, this also depicts that the management in fact gets to appoint their own
74 One can argue that audit committees in a sole board system is a variant of the supervisory board as in the dual board system. Adams, and Ferreira (2007) argues that strengthening the audit committee’s role as an independent monitor may benefit the shareholders, like in the case of a dual board system.

Chapter 6: The Clash of Cultures and Its Effect on Firm Performance Volatility
206
overseers and Hermalin and Weisbach (1991) describe this situation similar to “letting the fox guard the
chicken coop” (p. 103).
Yet, outside directors deem to be independent due to several reasons (Byrd & Hickman, 1992; Hermalin &
Weisbach, 1991) . First, directors are under certain legal obligations to their shareholders and they can be
held liable by the shareholders, if they fail to meet the obligations. Second, directors aspire to safeguard their
reputations as good monitors.
Thus some prior studies have validated the role of outside directors in improving firm performance and firm
value, by denoting a positive association between the same (Baysinger & Butler, 1985; Ezzamel & Watson,
1993; Pearce & Zahra, 1992; Rosenstein & Wyatt, 1990). Rosenstein and Wyatt (1990) in particular, affirm
that the markets respond positively for outside director appointments, denoted via stock price hikes.
Furthermore prior empirical work has demonstrated that boards dominated by outside directors are likely to
behave more in line with shareholders’ interest (Fama & Jensen, 1983; Jensen, 1993; Jensen & Meckling,
1976). Weisbach (1988) demonstrates that CEOs are more likely to resign after poor firm performance in
firms with outsider-dominated boards than in firms with insider-dominated boards. Furthermore, the positive
share price reactions, following the announcements on CEO resignations illustrate that the directors can
increase firm value by removing poor management.
Furthermore, Brickley, Coles and Terry (1994) reveal that, in a firm acquisition, if the board of the target firm
has a majority of outside directors, stock markets would react positively to the announcements of poison
pills, supporting the hypothesis that outside directors serve the interests of shareholders75. In addition, Byrd
and Hickman (1992) suggest that in an acquisition, a bidding firm with independent outside directors holding
at least 50% of the seats will have substantially higher abnormal returns on the announcement date than
other bidders.
An Alternative Perspective
Stewardship theory, however, provides an alternative perspective to the association between board
independence and firm performance. It argues that managers are extremely trustworthy and are good
stewards of the firm, who diligently work towards achieving higher corporate performance and shareholder
value (Donaldson, 1990; Donaldson & Davis, 1991, 1994). Contrary to the agency theory, stewardship
75 In an acquisition, the target company may adopt a poison pill, either to benefit shareholders by enhancing the terms of takeover offers or to harm shareholders by defeating the takeover offer, supporting managerial entrenchment. Based on this conjecture, Brickley, Coles and Terry (1994) develop two competing hypotheses involving the adoption of poison pills in a potential take-over and postulate that if outside directors are controlled by insiders, there won’t be any notable stock market reaction to the adoption of poison pills and contrariwise, whenever the board has a majority of outside directors, the stock market would react positively. By scrutinizing a sample of 247 firms adopting poison pills, the authors find evidence to validate the latter hypothesis.

Chapter 6: The Clash of Cultures and Its Effect on Firm Performance Volatility
207
perspective suggests that control be centralized in the hands of the firm managers (Davis et al., 1997) because
the separation of duties between insiders (including the CEO) and outsiders can result with poor firm value.
In support of the stewardship theoretical perspective, numerous scholars establish the view that inside
directors, rather than outside directors, cause higher firm performance. For example, Kesner (1987)
scrutinized the Fortune 500 firms in the USA and found that returns to investors are higher in firms with a
greater proportion of inside directors. In addition, Hill and Snell (1988) and Baysinger, Kosnik and Turk, (1991)
elucidate that inside directors, if well-represented on a board and therefore are less dependent on the
evaluation of outside directors, may lead to enhanced firm value, by way of increasing investment in Research
and Development (R&D), despite the popular claim of their inclination towards short-term orientation (see
Chapter Note 6.1). Hermalin and Weisbach (1991) and Coles and Hesterly (2000) suggest that inside directors
play a significant role in conveying the necessary and timely information to the top management and outside
directors, as they have access to valuable firm-specific information. Furthermore the insiders are often
subjected to training and evaluation, in order to facilitate the CEO selection process. Nevertheless, several
contingencies should be considered, in order to better understand the relationship between board
composition and firm performance (see Chapter Note 6.2).
Finally, the above discussion reveals that the analysis of the complex relationship between board composition
and firm performance / value warrants multiple theoretical perspectives. Alternatively, the lack of consensus
in scholarly findings may also be due to the dynamic endogeneity problem, where poor firm performance
may result with subsequent changes in board composition or because board independence doesn’t matter
enough to depict a substantial effect on overall financial performance (Hermalin & Weisbach, 2003). In
conclusion, it should be understood that as each firm faces its own management problems and finds its own
solutions, not one governance structure but different governance structures are optimal for different firms
(Hermalin and Weisbach, 1991; Baysinger and Butler, 1985).
Board Independence and Risk Taking
When the board members are more independent, they can be more “unfriendly” (Adams & Ferreira, 2007)
and are less likely to suffer from groupthink (Ferreira, 2010). Independent directors, would not collude with
the CEO /top management or the inside directors, are more likely to raise questions and be vigilant about the
behaviour of the management (Carter et al., 2003). Therefore, the management is unable to involve in value
destroying risky ventures, subsequently resulting with less volatile performance.
This also implies that the management is unlikely to make strategic decisions single-handedly. The decisions
made by the CEO and top management team, will be reviewed intensely by the independent directors. This
would entail mixed opinions and disagreements and finally a “diversification of opinions effect” (Adams,
Almeida and Ferreira, 2005, p.1406), when approving management proposals. This resembles to a model of
group decision making presented by Sah and Stiglitz (1986, 1991) and empirically tested on boards by Adams,
Almeida and Ferreira (2005). The resultant decisions, made by a group, as opposed to an individual, will be
less extreme; neither very good nor very bad and hence associated with less variable performance, as the

Chapter 6: The Clash of Cultures and Its Effect on Firm Performance Volatility
208
project has to be endorsed as acceptable by several group members, before it can finally be accepted (Cheng,
2008). Furthermore, Eisenberg et al. (1998), also affirm that independent boards are biased against risk
taking.
c) CEO Power
CEO power is another widely discussed corporate governance phenomena and over the years, has been under
immense scrutiny by the academic and practitioner community, yet has produced conflicting findings. In an
organization, if CEO makes most of the major decisions, it can be assumed that the CEO is enjoying high
power. On the other hand, CEO power is deemed to be low, if major decisions are a product of a group of
executives including the CEO.
Academics have used several proxies to measure CEO power in a firm76. Nevertheless, most of the prior
scholars have used CEO duality as a proxy to measure CEO power. CEO duality is referred to as the practice
of a single individual, serving as both the board chairman and CEO in a firm (Krause et al., 2014). Put
differently, CEO duality results with concentration of both CEO and the chairman titles in the hands of one
individual. CEO duality is listed as one of two “contemporary and intensely contentious issues related to the
governance of publicly traded companies” (Dalton and Dalton, 2011, p.405)77. Moreover, Finkelstein and
D’Aveni (1994) refer to the practice of CEO duality as a “double-edged sword”. The controversial nature of
CEO duality is due to the complexity of its relationship with firm outcomes. The association warrants analysis
from multiple theoretical perspectives to be better understood78.
Generally the functions of a chairman are not limited to run board meetings, but extend to overseeing the
process of “hiring, firing, evaluating and compensating the CEO” (Jensen, 1993, p.866). Thus, as per the
notions of agency theory, the objective performance of this critical function proves to be difficult or rather
impossible in a firm, if the board chairman and the CEO prove to be the same person. Put differently, CEO
duality weakens board independence and according to Fama and Jensen (1983) and Eisenhardt (1989),
boards should be independent from the management to overcome managerial entrenchment. In essence,
agency theory predicts that CEO duality would centralize the leadership authority leading to management
domination of the board that would ultimately downgrade firm performance (Jensen, 1993). For instance,
76 Adams, Almeida and Fereirra (2005) and Cheng (2008) attempt to capture a comprehensive construct of
CEO power by employing three measures, viz. whether CEO is the company founder, CEO is the only insider
on the board and the concentration of titles in the hands of CEO (i.e. if the CEO is the chairman and there is
no other president/ chief operating officer in the firm or if CEO is both the chairman and the president). 77 Dalton and Dalton (2011) list board composition and CEO duality as the two most contemporary and contentious issues related to corporate governance of publicly traded corporations. 78 Worrell, Nemec and Davidson (1997) extended the CEO duality research to another level by introducing the concept CEO “plurality”. Authors refer to CEO plurality as a situation where all three titles, viz. CEO, chairman and president are concentrated in the hands of a single individual. By analyzing large US corporations, they find evidence that investors react extremely negatively to CEO plurality but showed little reaction to duality.

Chapter 6: The Clash of Cultures and Its Effect on Firm Performance Volatility
209
Rechner and Dalton (1991) study the effect of CEO duality on firm performance, gauged by accounting based
measures, such as Return on Investment, Return on Equity and profit margin and indicate that corporates
with a separate CEO and chairman outperform its counterpart with CEO duality, in each year of study79.
Conversely, stewardship theory posits that the joint structure in CEO duality provides unified leadership and
would eliminate any internal or external ambiguity regarding who is ultimately responsible over firm
outcomes. This would also facilitate organizational effectiveness, which may ultimately improve firm
performance. Further the unified leadership provided through CEO duality would also send strong signals to
external stakeholders that may improve firm value (Dalton et al., 1998). Donaldson and Davis (1991)
scrutinize a multi-industry sample of 337 U.S. firms of varying sizes and advocate this view. Apparently, the
two theoretical perspectives establish contesting hypotheses80.
In addition, Brickley et al. (1997) also indicate a positive relationship with CEO duality and firm performance,
supporting the stewardship arguments. The authors further elucidate that separating CEO and chairman roles
results with several costs that are overlooked by previous research, which are agency costs related to
information asymmetry between CEO and chairman, costs of having firms change their succession
processes81 and other costs such as conflicts in decision making with shared authority.
Furthermore, Daily & Dalton (1994a, 1994b) find evidence that bankrupt firms have a higher incidence of
duality structure. The authors explain that when a firm is impending bankruptcy, firms with powerful CEOs,
serving simultaneously as board chairmen, tend to keep the course and not change anything, or in other
words, adopt threat-rigidity responses, whereas firms that have separate board chairmen would significantly
attempt to prevent crisis by adopting turnaround strategies. Interestingly, one such turnaround strategy
would be to remove the current management. On the other hand, Daily (1995) study 70 firms filing for
Chapter 11 bankruptcy protection during 1980 to 1986 and deduce that board leadership structure show no
link with successful reorganization.
79 However, in their previous study in 1989, Rechner and Dalton employ stockholder returns to measure firm performance and the authors find no significant difference linked to CEO duality. 80 This dispute is clearly visible in both real world practitioner circles and in academic literature. In the corporate sector, throughout the years, activist shareholders have taken measures to separate the CEO and board chairman titles in firms such as News Corp., JP Morgan Chase and Goldman Sachs, etc. However, some firms, such as Chevron Corporation (2012) have responded negatively to such claims, claiming that their boards are sufficiently independent without a separate chair and that duality has awarded them indispensable unity of leadership (Krause, Semadeni and Cannella, 2013). On the other hand, prior findings based on the academic literature on CEO power and firm outcomes show lack of consensus.
81 Brickley, Coles and Jarrel (1997) assert that among U.S. firms, CEO duality is mostly apparent in firms with new CEOs. Further they state that for most of these firms, well-performing CEOs will eventually be granted both titles. They further suggest that awarding the title of chairman operates as an incentive device for new CEOs.

Chapter 6: The Clash of Cultures and Its Effect on Firm Performance Volatility
210
CEO Power and Firm Risk Taking
Major tenets of agency theory assume that shareholders are in a position to diversify their risks, whereas
managers disproportionately suffer the consequences of firm risk taking (Eisenhardt, 1989; Jensen &
Meckling, 1976). Thus, evidently, there exists a conflict of interest between the shareholders and executives
over optimal level of firm risk. Previous studies suggest that CEO duality confers additional power and
encourages executives to lower their exposure to risk. Several prior studies validate this claim and evince that
firms with powerful CEOs are risk averse.
Pathan (2009) investigated the effect of CEO power on performance variability of large US banks, during 1997-
2004. CEO power was gauged by two measures, i.e. whether the CEO is also the chairman of the firm (CEO
duality) and whether the CEO is hired internally. He elucidates that the wealth of a bank manager comprises
of tangible, financial and non-diversifiable human capital, which is mostly concentrated to the firm that
he/she is managing, unlike investors. Therefore, Pathan hypothesis that managers attempt to safeguard their
own interests by “selecting excessively safe assets or by diversification82” (p.1342). This risk averseness will
be aggravated, if the managers are compensated through fixed contracts such as wages and salary as opposed
to stocks or stock option programmes. The costs, managers would have to bear (e.g.: loss of job and
investment in human capital) if the bank fails, is much more significant than the fixed benefit that would be
enjoyed, given the bank succeeds. Therefore, if the risk averse, entrenched manager has high power, he/she
will influence the board monitoring ability and apply force on board’s decisions (that reduces board’s
independent oversight of the manager) and will choose less risk. A similar argument is presented by Amihud
& Lev, (1981a) and is explained under “Board Size, Performance Volatility and Risk Taking” above.
Furthermore, Bertrand and Mullainathan (2003) contends that CEOs who enjoy high power as a result of
being insulated by anti-takeover laws, engage in less destruction of old plants and also less creation of new
plants, implying low risk-taking.
In addition, Westphal and Zajac (1995) illustrate that CEO duality is associated positively with total CEO
compensation and negatively with the proportion of performance-contingent pay, supporting the above
proposition that CEOs with high power are risk averse. Authors employ a mediated model of new director
selection and executive compensation. The authors affirm that when CEO power is high, new directors would
be demographically more similar to the CEO and deduce that demographic similarity would mediate the
effect of CEO power on executive compensation.
82 Managers can undertake diversification at firm level by engaging in conglomerate mergers as explained by Ahimud and Lev (1981)

Chapter 6: The Clash of Cultures and Its Effect on Firm Performance Volatility
211
In contrast, Li and Tang (2010) assert that high CEO power measured by CEO duality would interact with CEO
hubris to increase firm risk taking83. Despite the popular agency perspective that claims CEOs are risk averse,
Li and Tang suggest that CEO hubris is associated with overconfidence causing them to underestimate risk.
Adams, Almeida and Ferreira (2005) investigate the relationship between CEO power and the degree of firm
performance variability. CEO duality was among one of the three measures that proxy high CEO power84. The
authors formulate their hypothesis based on the work of Sah and Stiglitz (1986, 1991) and explicate that if
the CEO of the firm is involved in making most of the relevant decisions (implying high CEO power), the risk
arising from the judgement error may not be well diversified and the likelihood of either a very good or a very
bad decision being taken is quite high. However, on the other hand, given the CEO power is low, the decision
will be made jointly by the CEO and top executives, which can give rise to mixed opinions and disagreements.
Thus group decision making entails a “diversification of opinions effect” (Adams, Almeida and Ferreira 2005,
p.1406) and the final group decision will be a compromise of the different opinions of the group members. It
tends to be less extreme; neither very good nor very bad and hence associated with less variable
performance.
The conflicting evidence around CEO power, as explained above, seem to have stimulated further studies in
the area, forcing researchers to consider other factors, the relationship between CEO power and firm
outcomes is contingent upon. For instance, CEO duality appears to be beneficial for a firm, under high
environmental uncertainty, supporting the stewardship perspective (Boyd, 1995). On the other hand,
advocates of agency theory argue that the negative effect of high CEO power can be negated to a great extent,
by having a small board in a firm, as small boards are effective in holding candid meetings of firm and
managerial performance (Eisenberg et al., 1998; Jensen, 1993; Yermack, 1996).
In a nutshell, it is evident that, despite the existence of sufficient theoretical grounding, CEO power or CEO
duality seems to generate mixed verdicts both in the academic literature and in real corporate world. For
example, some scholars challenge the requirement to separate the two roles by claiming that it is only
practiced in troubled firms, as a solution to a problem (Krause & Semadeni, 2013). Further as stated in
footnote 86, Brickley, Coles and Jarrel (1997) posit that CEO duality is most common in US firms with new
CEOs and upon their satisfactory performance, they will eventually be granted both titles. The reason behind
the contesting findings may be due to the complexity of the relationship that warrants its interpretation in
multiple theoretical perspectives. Further it is evident that the relationship between CEO power and firm
outcomes are contingent upon numerous factors, in addition to the ones mentioned in this section. Finally
83 Authors measure risk taking as the decision to invest in new high-technology projects. 84 Adams, Almeida and Fereirra (2005) employee three measures to operationalize CEO power, viz. whether CEO is the company founder, CEO is the only insider on the board and the concentration of titles in the hands of CEO (i.e. if the CEO is the chairman and there is no other president/ chief operating officer in the firm or if CEO is both the chairman and the president).

Chapter 6: The Clash of Cultures and Its Effect on Firm Performance Volatility
212
this section also reinforces the view that not one governance structure but different governance structures
are optimal for different firms (Baysinger & Butler, 1985; Hermalin & Weisbach, 1991).
d) Board Heterogeneity
Board heterogeneity (or board diversity) attracted profound attention, especially after the Enron scandal in
December 200185. The renowned Higgs Report (2003) and the Tyson Report (2003) are known to encourage
and improve board diversity and corporate governance procedures in the UK (Ferreira, 2010; Singh, 2007),
whilst Catalyst scrutinizes the female representation in boards in Fortune 1000 companies in the USA since
1993 (Ferreira, 2010). Furthermore, some countries have already introduced legislative initiatives to improve
boardroom diversity by increasing female participation. Gender diversity is sometimes referred to as a “soft
law” as it is often encouraged and not required. However, since 2008, six countries have adopted binding
quotas to increase female participation and several others have non-binding quotas or are considering
legislation (N. Smith, 2014). The six countries, according to Smith (2014) are Norway, Finland, Iceland,
Belgium, the Netherlands, and Italy. Norway, in particular, implemented legislations and required all listed
firms to have 40% of board representation by female directors, from January 2008. In 2007, Spain became
the first country in the European Union to enforce a recommended gender quota that required increasing
female participation in boardrooms to 40%, by 201586.
Board diversity can take many forms. For instance directors can be different from each other, in terms of
their age, gender, race, education, functional background, insider status, experience and social
connectedness etc. (Ferreira, 2010). Its relationship with firm performance is grounded in multiple theories,
thus generating mixed results, and is explained below:
Agency perspective – A trade-off between increased board independence and lack of cohesion
Agency theory addresses the role of the board in protecting shareholders from managerial self-interests that
would ultimately improve firm performance and shareholder value. One of the major notions of the agency
view of board is that board independence will improve firm performance and shareholder value, as outside
85 Enron was an energy trading company and was one of the largest corporations in the US before it collapsed and declared bankruptcy in December 2001. The main cause behind the collapse is a massive accounting fraud scheme that went undetected for a long time, due to the prevalence of poor corporate governance practices. At the time, this was the biggest corporate bankruptcy to ever hit the financial world. However, later failures of WorldCom, Lehman Brothers and Washington Mutual have surpassed it (Healy and Palepu, 2003). 86 This target was not achieved and by 2016, female representation in corporate boardrooms was merely around 20%. Gabaldon and Gimenez (2017) underline that resistance on the part of corporations, unwillingness on the part of females to join boards and the temporary descent of the importance of gender equality as a result of the austerity measures following the economic recession as possible causes for failing to achieve the gender equality target. Similarly, in Norway, female participation has improved following the introduction of the legislation, yet the progress has been considerably slower (Klostad, 2017).

Chapter 6: The Clash of Cultures and Its Effect on Firm Performance Volatility
213
directors will not collude with inside directors to weaken shareholders’ interests because outside directors
have incentives to establish and maintain reputation as expert monitors.
One argument in favour of board diversity is that it improves board independence. If the board consist of
directors with different gender, ethnicity or cultural backgrounds, they are less likely to suffer from
groupthink (Ferreira, 2010). Also they are more likely to raise questions (that would rarely be the case in a
homogeneous board) and be vigilant about the behaviour of the management (Carter et al., 2003). This could
be the reason, as depicted by Westphal and Zajac (1995), for powerful and self-interested CEOs to appoint
new board members who are demographically more similar and therefore more sympathetic towards them.
Interestingly, the authors illustrate that when board members are more demographically similar to the
incumbent CEO, the compensation contract of CEO turns out to be more generous, depicting the influence
of CEO over the homogeneous board. The underlying argument here is that a more diverse board might act
as a more activist board (Carter et al., 2003). Thus it can be assumed that board diversity arouses board
independence that would enable the directors to carry out their monitoring function effectively to improve
the firm bottom-line and shareholder value.
On the other hand, it can also be argued that the expected benefits out of board diversity might not be
reaped, as diverse board members may be marginalized (Carter et al., 2003). When boards are
heterogeneous, members are less willing to share ideas and information (K. Kim & Cloud, 2014) and will
create group faultlines87 (Lau and Murnighan, 1998) within the board. This will result in poor communication
within subgroups and increase conflicts and will harm group cohesiveness. From the context of a board of
directors, this will increase coordination costs among directors and will result in ineffective group
communication and weak monitoring, slows down internal processes (Bernile, Bhagwat and Yonker, 2018),
finally degrading firm performance. For instance, Kosnik (1990) illustrates how board heterogeneity can work
against promoting shareholder interest within the board. His empirical study evince that, given the equity
interest of top management is small, boards are less likely to resist to “greenmail” transactions, when it is
diverse in terms of the length of tenure, among other factors. Moreover, boards are less likely to oppose to
“greenmail” transactions when directors are diverse in terms of their principal occupation, independent of
top management equity holdings. Greenmail is a popular takeover defence mechanism88 and engaging in the
same would result with future managerial inefficiencies and also aggravate the conflicts between the
executives and shareholders. Kosnik suggests that board heterogeneity by way of tenure or occupation inhibit
87 Group faultlines are hypothetical separating lines, which can split a group into subgroups based on one or more characteristics (Lau and Murnighan, 1998). 88 In a greenmail transaction, the company privately repurchases stock from a dissident stockholder who poses a potential threat to the control position of the top management. Advocates of agency perspective condemn this behaviour, as the potential threat of takeover can be considered as a disciplinary force that compels the executives to be congruent with shareholder interests. Eradicating this disciplinary force, by engaging in greenmail transactions, would result with future managerial inefficiencies and also aggravate the conflicts between the executives and shareholders.

Chapter 6: The Clash of Cultures and Its Effect on Firm Performance Volatility
214
their ability to relate to each other, hampers group cohesiveness and reduces the frequency of their
interactions, when they evaluate top management proposals.
Furthermore, lack of board consensus would make it easier for the CEO to influence and control board’s
decisions (Jensen, 1993), resulting with boards being more captive to the CEO (Cheng, 2008). Apparently lack
of board consensus increases CEO power and high CEO power, produces mixed evidence, in terms of firm
performance. Further Adams & Ferreira (2007) point out that executives are reluctant to share important
information with minority outside directors that would hamper the effectiveness of monitoring role carried
out by the board, adversely affecting the quality of overall board effectiveness.
Resource Dependence Perspective – A trade-off between increased access to external resources vs.
conflicts of interest
Resource dependence perspective views board of directors as a tool for dealing with the firm’s external
environment (Jeffrey Pfeffer, 1972) and as a mechanism to draw on external resources for its long-term
survival and growth (J. Pfeffer & Salancik, 1978). In fact, Watson, Kumar and Michaelsen (1993) indicate that
diverse groups encourage creativity and introduce a greater range of perspectives and solutions to potential
problems. Also, minority members may give access to unique information, through their networks
(Granovetter, 1973). In addition, directors from various different backgrounds will expose the firm to
different resources and connections (Ferreira, 2010).
A glut of prior research that has been carried out supports the resource dependence perspective of diverse
board of directors. For instance, (R. C. Anderson et al., 2011) portray that overall, greater board
heterogeneity, decomposed into occupational (education, experience and profession) and social diversity
(gender, ethnicity and age) leads to an increase in firm performance measured by Tobin’s Q89. The rest of the
discussion illustrates the impact of diversity in terms of functional backgrounds of the board.
Goldman, Rocholl and So (2009) portrays that directors with political connections can improve shareholder
value. The same authors in a companion paper in 2008 depict one possible way by which political connections
of directors can affect firm value, i.e. by securing a higher likelihood of winning government procurement
contracts. In a similar vein, Agrawal & Knoeber (2001) affirm that firms operating in industries that are more
dependent on the government tend to have more directors with political connections. The authors illustrate,
for instance, that in the manufacturing industry, firms where sales to government is higher; exports and
lobbying are greater, directors with political connections are more prevalent and in industries with stringent
environmental regulations, lawyer-directors are more prevalent.
89 Anderson et al. (2011) also contend that the impact of board diversity on firm performance is contingent upon firm characteristics. For instance, board diversity is beneficial in more complex firms with a CEO with high power, but can be detrimental in a less complex firm.

Chapter 6: The Clash of Cultures and Its Effect on Firm Performance Volatility
215
In contrast, Ferreira (2010) asserts that although politically connected directors agree well with the resource
dependence perspective of boards, the case of directors with financial expertise is more complicated. Put
differently, although directors bring in valuable resources through their functional backgrounds or networks,
owing to the conflicts of interest, the same can hamper the effective provision of their monitoring and
advisory roles.
Kroszner and Strahan (2001) portray that a firm with a banker (a top executive of a commercial bank) in the
board faces a trade-off between benefits from bank monitoring and conflicts of interest between lenders and
shareholders. In line with the resource dependence view of boards, Kroszner and Strahan identify several
benefits of having a banker in the board of the focal firm; viz. the increased information flow between the
bank and the firm will assist the firm to obtain financing from the banker’s commercial bank90. Further banks
possess specialized knowledge by lending to many firms in a particular industry. Thus having a banker in the
board enables the firm to gather valuable industry specific financial expertise. Moreover, a firm with a
banking professional in the board signals to the market that the bank trusts the firm will not experience
financial distress. Thus, a banker performs a certification role in the board, which will lower external costs of
finance to the focal firm. Firms that are more likely to face intense information asymmetry problems or in
other words, smaller, more volatile firms with less collateralizable assets, would benefit more by having a
banker in the board.
However, if a banker is serving as a director in the board of a particular firm, the banker-director faces a
conflict of interest between the fiduciary duty to the firm’s owner and to the bank employer, given that the
bank is lending to the firm (Kroszner and Strahan, 2001). Shareholders generally opt for high risk projects as
they can enjoy very high payoffs if successful, whereas the creditors will have to bear most of the costs, if it
turns out unsuccessful. On the other hand, senior creditors, such as banks prefer projects that would
maximize the probability of repayment rather than the return to shareholders. This conflict between equity-
holders and debt-holders becomes more intense in firms with very risky investment opportunities and firms
in financial distress. This conflict of interest can be eliminated to a greater extent if banks hold an equity stake
in the firm, as in countries like Germany and Japan (Kroszner and Strahan, 2001). However regulation
prevents this in the US and conflict of interest can be addressed by equitable subordination and lender liability
(Berlin & Mester, 2001; Kroszner & Strahan, 2001). These regulations strongly discourage banks from
interfering with firm’s activities before bankruptcy, but the downside is that it could also discourage banks
from providing valuable monitoring and advisory services to the focal firm.
On the other hand, Guner, Malmendier and Tate (2008) study 282 companies over 14 years and provide
evidence that when commercial bankers are serving in the board, that particular firm displays less
90 In principle, a credit agreement that discloses firm information is required to initiate credit facilities. However, by acquiring a seat in the board, banks can obtain more relevant firm information pertaining to changing circumstances and assess management competency easier than through other means (Kroszner and Strahan, 2001).

Chapter 6: The Clash of Cultures and Its Effect on Firm Performance Volatility
216
investment-cash flow sensitivity and borrow more91. The authors also suggest that firms with investment
bankers in their boards engage in value-destroying acquisitions and associate with larger bond issues,
especially if the director’s bank is involved in the deal. Thus Guner, Malmendier and Tate suggest that
although financial experts on boards exert significant influence on corporate outcomes, they mainly act in
the interest of their financial institution.
Thus, above studies on financial expertise in boards reveal the conflict-of-interest problem, which is the
flipside of the resource dependence view of boards. Bankers may be providers of valuable resources to banks
but not to the firms in which they serve as directors (Ferreira, 2010).
Board heterogeneity and performance volatility
The association between board heterogeneity and firm performance volatility has generated equally
conflicting results. Owing to its complexity, prior scholars have interpreted the association in multiple
viewpoints that is very similar to what has been previously explained.
First, it is believed that higher diversity aggravates conflicts among board members that disrupts the board’s
internal decision-making process, making it more difficult to attain a consensus among members. This would
result in more erratic outcomes, ultimately increasing firm risk (Bernile, Bhagwat and Yonker, 2018) and stock
return volatility (Giannetti & Zhao, 2015)92.
The association between board diversity and performance volatility can also be interpreted based on the
notion that group decisions are less extreme than individual judgements (Moscovici & Zavalloni, 1969; Sah &
Stiglitz, 1986, 1991), which has been previously explained a number of times. Thus based on these studies in
social psychology and empirical work on boards by Adams, Almeida and Ferreira (2005), Bernile, Bhagwat and
Yonker (2018) develop their hypothesis that homogeneity of preferences, incentives and views among board
members will result with more idiosyncratic decisions as they undergo less scrutiny within the board, leading
91 Guner, Malmendier and Tate (2008) evince that borrowing increases for firms that are least financially constrained such as firms with investment grade debt.
92 Gianetti and Zhao (2015) also find that when boards are highly diverse, firm strategies are less persistent over time and that they conform less to those of industry peers. Also the authors reveal that executive turnover and director turnover are both higher in firms with diverse boards and also depict that turnover largely appears unrelated to firm performance, indicating the prevalence of conflicts in the boardroom. Furthermore, authors find that more board meetings are held, in firms with diverse boards, suggesting difficulties in the decision making process. Analysts apparently make larger forecast errors in predicting firm performance, proposing that diverse preferences of board members lead to hard-to-predict decisions. Finally, they affirm that their study provides no evidence of diverse boards taking more risk or higher leverage. Also, they assert that firms with diverse boards do not invest more and do not make more acquisitions.

Chapter 6: The Clash of Cultures and Its Effect on Firm Performance Volatility
217
to more volatile results. This implies that board heterogeneity will result with less volatile outcomes. Empirical
evidence of their study suggests that greater board diversity results with lower realized firm risk.
Board diversity is a composite construct that consist of various individual elements. However, gender
diversity, among others, is unarguably the most long-standing and debated element of board diversity. The
rest of the section discusses about gender diversity, along with other elements of board diversity briefly.
Gender diversity
Gender diversity in the boardroom is receiving tremendous amount of attention, both in academia and in the
popular press. The underlying argument behind appointing female directors to boards is that firms can
benefit by having access to a larger pool of talent, as female directors may add a new perspective to corporate
issues (Adams & Ferreira, 2009; Farrell & Hersch, 2005). In addition, female directors are expected to perform
the role of an independent director better than their male counterpart because, as per Adams and Ferreira
(2009), “they do not belong to the old boys club” (p.292). Carter, Simkins and Simpson (2003) and Erhardt,
Werbel and Shrader (2003) empirically show that greater female participation on boards results with higher
firm value and performance.
In contrast, Farrell and Hersch (2005) observe a positive relation between female directors and ROA but an
event study indicates no significant market reaction to female directors. The reason behind this perplexity,
as they believe, is the endogenous nature of the association between the two variables 93. The authors
postulate that women are added to boards in a manner consistent with tokenism94. Adams and Ferreira
(2009) also observe that endogeneity corrected association between gender diversity and firm value and
performance is negative. Thus Adams and Ferreira (2009), along with Almazan and Suarez (2003) and Adams
and Ferreira (2007), posit that too much board monitoring95 may, in fact, decrease shareholder value, as
female directors are considered to be more independent than their male counterpart.
93 Farrell and Hersch (2005) elucidate that better performing firms, in general, are able to focus more on diversity goals and that they tend to have more female directors in the board, to address external pressures on boardroom diversity. Also, from the supply side, Farrell and Hersch (2005) observe that qualified female directors are in short supply, which is implied through their overrepresentation in boards, with multiple directorships. Therefore, as women directors appear to be a scarce commodity, they have the opportunity to self-select to better performing firms, giving rise to endogeneity issues. 94 Women are appointed to boards when there is low or no current female representation or when a current female director leaves, as a mere attempt to address external pressures. 95 Adams and Ferreira (2009) reveal that female directors, indeed, are more independent than male directors and effectively involved in monitoring activities that have a major positive impact on firm corporate governance. The authors find that female directors are less likely to have attendance problems in the board than males and that when the fraction of women on board increases, the attendance of male directors too correspondingly increases. Further, Adams and Ferreira posit that owing to the “independent” characteristic of female directors, they are more likely to sit on monitoring related committees (in particular audit, nominating and corporate governance committees) than their male counterpart. However, comparatively, women are less likely to sit on compensation committees. Moreover, when gender diversity in the board is

Chapter 6: The Clash of Cultures and Its Effect on Firm Performance Volatility
218
Age Heterogeneity
Murray (1989) argues that board members who are in a similar age may have shared the same values when
growing up and experienced the same historic events during their formative years. Therefore, in-group
communication and goal congruence may increase in an age-wise homogeneous board. In contrast, Houle
(1990) suggests that age-wise diversity in boardroom can facilitate more efficient division of labour where
older group providing experience, network and financial resources, middle-aged group engaged with the
main executive responsibilities and younger group to learn and develop their knowledge about the business.
Thus, an age-diverse board will address the issues of succession planning at top management level.
Nevertheless Murray (1989) explains that age-diversity can result with lack of cohesion and directors
favouring completely different decisions, like short-term vs. long-term growth.
Educational / Occupational Heterogeneity
Erhardt, Werbel and Shrader (2003) refer to education as the closest proxy to measure non-observable or
cognitive diversity. Murray (1989) contends that in the oil industry, homogeneous boards dominated by
engineers appear to perform better. Murray argues that a board dominated by engineers, in particular, may
emphasize on process efficiency considerations more than other occupational backgrounds. Bantel (1993), in
contrast, suggest that greater diversity in terms of education and functional background, leads to better
decision making in the banking industry. Homogeneous educational/ occupational backgrounds may develop
“functional fixation”, which is developed when directors focusing extensively on the aspects they are more
familiar with at the expense of other issues that are beyond their “comfort zones” (Mahadeo, Soobaroyen
and Hanuman, 2012, p.378).
Ethnic / Racial / Cultural Heterogeneity
Ferraro and Cummings (2007) distinguish the terms culture, ethnicity and race96. Nevertheless, the effect of
ethnic, racial or cultural diversity on firm performance, resembles the effect of gender diversity. The
underlying argument is that firms can benefit by having access to a larger pool of talent, as racially/ethnically/
culturally diverse directors may add a new perspective to corporate issues and bring in a rich pool of social
capital that would position the firm better in terms of managing uncertainties (Singh, 2007). In addition, if
higher, CEOs are likely to be held accountable for poor stock return performances and CEO turnover appear to be more sensitive to stock return performances.
96 Ferraro and Cummings (2007) view culture as a collection of beliefs, values, and modes of thinking that influence behaviour among a group of people. They refer to ethnicity as “symbolically marked groups” (p.219) either by language, dialect or clothing and posit that cultural differences may exist in a population, even when ethnicity is not marked. However, Ferraro and Cummings (2007) suggest that ethnic differences can still prevail in a population with cultural homogeneity. Finally, the authors explain race as similar to ethnicity,
except that “markers” are genetically transmitted, for instance physical characteristics.

Chapter 6: The Clash of Cultures and Its Effect on Firm Performance Volatility
219
the board consists of directors with different races, ethnicity or cultural backgrounds, they are less likely to
suffer from groupthink (Ferreira, 2010) and would perform the role of an independent director better than
in a homogeneous board. Erhardt, Werbel and Shrader, (2003) find evidence that US firms with minority
directors, who are African, Hispanic, Asian and Native Americans, indicate higher firm performance denoted
by accounting measures such as Return on Assets (ROA) and Return on Investments (ROI). In contrast, racial/
ethnic/ cultural diversity will result in poor communication among directors, increasing conflicts that will
harm group cohesiveness (Ferreira, 2010). In fact, as per McPherson, Smith-Lovin and Cook (2001)
“Homophily in race and ethnicity creates the strongest divides in (the) personal environment” (p.415).
6.2.3 Cultural Distance
Revisiting the research objective, the present study operationalizes the cultural distances between the key
players within an organization, i.e. the CEO, the board of directors and the stakeholders. Therefore this
section discusses about the construct ‘cultural distance’.
In principle, distance can be evaluated between any two entities, “be it individuals, teams, organisations,
nations, ethnic groups, language groups, even organizational fields” (Beugelsdijk, Ambos and Nell, 2018,
p.1114). However, in most of the prior research in international business and management, distance has been
measured in between countries. In fact, Zaheer, Schomaker and Nachum (2012, p.20) explain cultural
distance as “the collective differences between countries”.
The inter-country distance concept was originated in the early work of international economics. Geographic
distance between countries play a major role in gravity models97 commonly used in classic and modern trade
theory (Anderson and Van Wincoop, 2003). Beckerman (1956) was the first to draw academic attention
beyond the mere geographic distance between countries towards the concept of “psychic” distance (Dow,
2000). In his seminal work on the distance and the pattern of intra-European trade, Beckerman (1956)
emphasizes that the manner in which the purchases of raw materials by a firm are distributed geographically
will depend partly on the psychic distance between the countries and exemplifies that an Italian entrepreneur
would prefer to purchase raw materials from a Swiss supplier than from a Turkish supplier (provided that
transport costs and all other factors remain constant), because the Italian entrepreneur would have more
contacts with the Swiss supplier and will perceive him as “nearer” in a psychic evaluation (e.g.: fewer language
difficulties etc.).
The concept of “psychic distance” was later popularized by a series of studies published by the Uppsala
University in Sweden. Uppsala school (Johanson & Vahlne, 1977; Johanson & Wiedersheim‐Paul, 1975) argues
that psychic distance notably influences the Internationalisation paths of firms and their location choices.
Johanson and Vahlne (1977) define psychic distance as “the sum of factors preventing the flow of information
97 Based on the traditional gravity model, the potential flow of a mass of goods or labour or other factors of production between two countries is reduced by the distance between them (Anderson, 2011).

Chapter 6: The Clash of Cultures and Its Effect on Firm Performance Volatility
220
from and to the market” (p.24). Examples of such factors, according to the authors are “differences in
language, education, business practices, culture and industrial development” (p.24) and these factors were
all combined to create a composite measure, in order to operationalize the construct of psychic distance.
6.2.3.1 Theoretical Perspectives of Cultural Distance
There is no general distance theory, with internally consistent set of assumptions or mechanisms or boundary
conditions (Beugelsdijk, Ambos, et al., 2018). Instead, Beugelsdijk, Ambos, et al. (2018) state that “distance
is a construct and as such is meaningful only in the context of a specific theory, be it, for example, agency
theory, transaction cost theory or learning theory. For instance, distance may imply a different view in
learning theories as compared to agency and transaction cost theories.
Cultural distance from the perspective of agency and transaction cost theories
Stahl and Tung (2015) stress that cultural distance has been overly emphasized as a negative factor, that
associates with concepts such as “foreignness”, “unfamiliarity costs”, “institutional gaps”, “culture novelty”,
“cross-cultural miscommunications” and so on (p.392). This has resulted with the common belief that cultural
distance is largely responsible of incompatibility that would result with “discordance, friction and conflict”
(Stahl and Tung, 2015, p.392). Stevens, Plaut and Sanchez-Burks (2008) refer to this standpoint as the
“problem-focused approach” (p.117) of cultural diversity.
Agency theory and transaction cost theory are the main root causes of the negative interpretation of cultural
distances, as they emphasize on “increased uncertainty and the potential for misunderstandings”
(Beugelsdijk, Ambos and Nell, 2018, p.1116). Kostova, Nell and Hoenen (2017) propose an agency model
between the headquarters (principal) and subsidiary (agent) and elucidate that distance (be it cultural,
economic, administrative, linguistic or institutional) poses significant challenges for a multinational
corporation in an array of activities, for instance, in transferring knowledge across borders, managing cross-
border joint ventures, integrating foreign acquisitions, achieving legitimacy and acceptance across locations
and devising effective agency alleviation strategies. The authors affirm that cultural and institutional distance
between the home and host countries aggravate the agency problems and higher distance is likely to result
with subsidiaries developing self-interested behaviour. Further, environmental uncertainty is considered to
be a primary variable in transaction cost theory (Kogut & Singh, 1988; Shenkar et al., 2008) that can drive
firm Internationalisation. According to Shenkar, Luo and Yeheskel (2008), environmental uncertainty can
perfectly be proxied by cultural distance, making it a key player in the transaction cost theory. The advocates
of this view attach higher transaction costs to higher distance, due to information costs and the difficulty of
transferring competencies and skills (Beugelsdijk, Kostova, et al., 2018). Information costs will be derived as
a result of the information asymmetries between the principal (headquarters) and the agent (subsidiary),

Chapter 6: The Clash of Cultures and Its Effect on Firm Performance Volatility
221
where verifications of claims by culturally distant agents, can be extremely difficult (Shenkar, 2001). This
would in turn aggravate agency problems98.
Cultural distance from the perspective of resource-dependence and learning theories
The advocates of the resource dependence and learning perspectives view cultural distances as an
opportunity rather than a threat. For instance, Stevens, Plaut and Sanchez-Burks (2008) suggest that racial
and ethnic differences, in particular, can be considered as a resource for “building on employees’ strengths;
cultivating a climate that fosters respect, compassion and openness and ultimately, gaining a competitive
advantage through generating feelings of inclusion of both minority and nonminority employees” (p.119). On
the other hand cultural differences is also favoured because it introduces adaptability, increased creativity
and problem-solving skills (Adler, 2003). Furthermore the resource based view and organization learning
theories (Lane et al., 2001; Shenkar, 2001) posit that cultural heterogeneities can be a source of synergistic
benefits for multinational organisations99.
6.2.3.2 The Measurement of Cultural Distance
Kogut and Singh (1988) - Cultural Distance Index
About a decade later since the publication of Uppsala School’s literature (Johanson & Vahlne, 1977; Johanson
& Wiedersheim‐Paul, 1975) on psychic distance, Kogut and Singh (1988) investigated the degree to which
cultural differences between the investing country and the target country, explain the differences in country
propensities in the choice of entry modes. They argue that the differences in cultures among countries can
influence managers’ perception about costs and uncertainties of alternative modes of entry. They propose
that, given constant revenues across alternatives, managers are likely to choose the entry mode that
minimizes the perceived costs associated with the mode of entry and subsequent management of the
subsidiary. Prior studies in international economics, have identified “uncertainty” as a major factor that
influences the foreign investment decision. One way of explaining uncertainty is associated with the firm’s
98 On the other hand Parkhe (1991) views the role of cultural distance from a novel perspective. He elucidates that cultural distance neither permanently improves nor deteriorates firm outcomes but instead has a mixed impact. He explains that inter-firm differences (interdependencies) are valuable, for the reason that, they form the underlying strategic motivations for formulation, development and collaborative effectiveness of Global Strategic Alliances (GSAs). In fact, Parkhe contends that GSAs are specifically created to exploit the inter-firm diversity as it amalgamates strengths and complementary resources furnished by the alliance partners. However, on the other hand, in the operational phase, inter-firm differences can negatively affect the longevity and effective functioning of the GSA.
99 For instance, according to Hofstede (1989), concern for performance and concern for relationships are both
crucial in managing global competition where the former is manifested by individuals with high masculinity
values and the latter by individuals with femininity values.

Chapter 6: The Clash of Cultures and Its Effect on Firm Performance Volatility
222
ability to manage the operations in the foreign subsidiary. Relative cultural distance between the countries
can influence the perceived ability to manage the foreign subsidiary (Kogut & Singh, 1988).
How can cultural distance between two countries be measured? A composite index was developed by Kogut
and Singh (1988) (hereafter referred to as the KSI) to measure cultural distance, by using Hofstede's cultural
dimensions (1980). First, the deviations along each of the four dimensions (viz. power distance, uncertainty
avoidance, masculinity vs femininity and individualism vs collectivism) between the investing country and the
target country (the US, in the context of their study) are calculated. The difference is squared in order to
avoid any negative values. The squared difference is then divided by the variance of each dimension, to
correct for the differences in variances of each dimension and then finally arithmetically averaged (Kogut and
Singh, 1988; p.422), as follows:
(6.1) CDj = ∑ {(𝐼𝑖𝑗 − 𝐼𝑖𝑢)2
/𝑉𝑖 }4𝑖=1 / 4
Where CDj refers to the cultural distance between jth country and the US, I ij refers to the index for the ith
cultural dimension in jth country, Iiu to the index of US for the same dimension, Vi to the variance of the index
of the ith dimension. Hofstede’s (1980) cultural framework had only four dimensions. Therefore to arrive at
the arithmetic average, the value is divided by four.
Alternative measures of Cultural Distance
Euclidean Distance
The concept of distance, between countries or regions, lies at the core of international business research.
Zaheer et al. (2012), in fact, define international management as “management of distance” (p.19),
emphasizing the significance of the concept within the discipline. Thus scholars in this area, are relentlessly
in search of the best approach to measure distances. Nevertheless literature to date, does not show any
consensus regarding which method to be used.
Berry, Guillén and Zhou (2010) identify five desirable properties that a distance measure should exhibit, viz.
symmetry, non-negativity, identification, definiteness and triangle inequality. The traditional Euclidean
distance measure satisfies all five criteria listed above. Euclidean method is defined as the geometrically
shortest possible distance between two points (Berry, Guillén and Zhou, 2010) and the Euclidean distance
between the ith and jth country is depicted below:
(6.2) Euclidean (cultural) distanceij =√∑ (𝐼𝑖𝑗 − 𝐼𝑖𝑢)2
4𝑖=1
Although some studies refer to the KSI as a Euclidean distance measure (Beugelsdijk, Ambos, et al., 2018;
Cuypers et al., 2018), Konara and Mohr (2019) affirm that the two methods are fundamentally different from
each other. First, unlike in the Euclidean distance, the KSI requires the deviations to be corrected for the
variances of each dimension, which is applauded by several studies (H. Berry et al., 2010; Beugelsdijk, Ambos,

Chapter 6: The Clash of Cultures and Its Effect on Firm Performance Volatility
223
et al., 2018; Konara & Mohr, 2019). However, the KSI then arithmetically averages the sum of the
standardized and squared differences, instead of taking the square root as per the Euclidean measure. Thus,
by ignoring to calculate the square root, the KSI creates a “second-degree (quadratic) function of distance”
(Konara and Mohr, 2019, p.338). One can argue that x2 (squared distance) is positively correlated with x
(distance). However “when x is non-negative, it is not appropriate to use the wrong one (squared distance),
especially if the correct one (distance) is readily available and using the wrong one leads to biased/incorrect
results (Konara and Mohr, 2019, p.340)100.
On the other hand, KSI does not satisfy the condition of triangle inequality, a critical condition that a distance
measure should fulfil (H. Berry et al., 2010; Konara & Mohr, 2019). Triangle inequality condition, as explained
by Konara and Mohr (2019) states that, in the simple illustration portrayed in figure 6.3, the distance between
A and B, should be less than or equal to the sum of distances between A and C and between C and B.
Figure 6.3: An Illustration of triangle inequality
However, Berry, Guillén and Zhou (2010) and Konara and Mohr (2019) posit that squared Euclidean distances
calculated by KSI, does not meet this requirement and thereby violate the condition of triangle inequality,
leading to “a distortion of distances in the cultural space” (p.348). This issue has consequences, particularly
for studies that investigate the role of cultural distance in multi-partner IJVs or in acquisitions where the
acquirer, the acquisition target and the seller are based in different countries, but not very relevant for the
context in this paper.
100 From a sample of sixty-eight countries and 2278 country pairs, Konara and Mohr (2019) calculates
distances based on both Hofstede and GLOBE cultural dimensions, according to both KSI and Euclidean
measures. As KSI builds on the squared and not the linear function of distance, the authors reveal that KSI
transforms the Euclidean distance to an exponential form and that they progressively augments the
magnitude of distances as they grow.
C
A B
5
8
5

Chapter 6: The Clash of Cultures and Its Effect on Firm Performance Volatility
224
Konara and Mohr (2019), contend that the KSI is a biased measure and that it fails to capture the true distance
between two countries. Therefore in order to improve the measure of cultural distance, the authors present
a corrected form of Euclidean distance formula that is corrected for the variances of each dimension, by
replacing the non-standardized cultural dimensions scores (as in the original Euclidean measure) with the
standardized ones, as depicted below:
(6.3) Euclidean distance (standardized)ij = √∑ (𝐼𝑖𝑗 − 𝐼𝑖𝑢)2
/𝑉𝑖 4𝑖=1
Mahalanobis distance
Berry, Guillén and Zhou (2010) propose to use Mahalanobis approach to measure the distance, in the
international business field. This distance measure was originally formulated in 1936 and used by scholars in
chemistry, climatology and other fields to solve problems related to clustering, multivariate calibration,
pattern recognition and so forth (Berry, Guillén and Zhou, 2010).
Berry, Guillén and Zhou (2010) suggests Euclidean approach is a better measure of cultural distance than KSI,
as the latter violates the triangle inequality condition. Euclidean measure satisfies all aforementioned five
properties of a distance measure. However one inherent weakness in the Euclidean approach is that it does
not take into account the correlation between the variable indicators. Variables that embody countries can
be very highly correlated with each other. Berry, Guillén and Zhou (2010) exemplify that Hofstede’s cultural
dimensions such as power distance and individualism can be very highly correlated with each other. In
addition, economic development variables, such as GDP and inflation are also highly correlated against each
other. The authors contend that a distance measure that disregards correlation, would be placing more
weight to the characteristic measured by correlated variables.
Second, the Euclidean index does not take into consideration the variance of the variables101. Third, it is
sensitive to the scale of measurement (Berry, Guillén and Zhou, 2010). This is also important because the
variables that characterize a country are measured on different scales (e.g.: GDP per capita and inflation are
measured by different units). The Euclidean measure does not allow for multiple scales. However this
argument is less relevant for cultural and institutional distance because both are measured using similar
scales (e.g.: from 0-100) (Beugelsdijk, Ambos, et al., 2018). As a consequence, Berry, Guillén and Zhou (2010),
advocates the use of Mahalanobis distance as a measure of distance. Thus Mahalanobis distance is equivalent
to the Euclidean distance computed with the standardized values of the principal components (De
Maesschalck et al., 2000).
However Mahalanobis distance is not void of all errors; it has its own weaknesses. First, the technique is
relatively complex and often leads to misunderstanding when computing or interpreting. Second, the index
101 This is one advantage of using KSI over the Euclidean measure.

Chapter 6: The Clash of Cultures and Its Effect on Firm Performance Volatility
225
has no added value when; (i) the individual distance dimensions included in the index are totally uncorrelated
(in this case, the resulting Mahalanobis index is perfectly correlated with the variance corrected Euclidean
index) or (ii) when all individual dimensions are highly correlated with each other102 (Beugelsdijk, Ambos, et
al., 2018). These authors compute the pairwise correlations for Hofstede’s dimensions and find out that the
individual dimensions are highly correlated with each other. Thus they affirm that employing the Mahalanobis
approach, for Hofstede based cultural distance, will not generate different results, when compared to the
variance corrected Euclidean approach (Beugelsdijk, Ambos, et al., 2018).
Summing up, the present study has a choice of three alternatives to measure cultural distances among key
players within a firm. However due to its clarity, parsimony, and resonance with managers (Kirkman et al.,
2006), KSI is prioritized over the other two measures. For improved robustness, KSI is then substituted by the
standardized Euclidean Index in section 6.7.3. A detailed description over the choice of an approach to
measure cultural distance is included in section 6.4.2 Key Variables Construction.
6.2.3.3 Criticisms of Cultural Distance Construct
As Shenkar (2001, p.519) describes, “few constructs have gained broader acceptance in the international
business literature than cultural distance.” Yet, the construct has been the subject of severe criticism, mainly
due to its conceptual and methodological properties. Similarly, the KSI, the most widely –adopted approach
to measure cultural distance to this day (Beugelsdijk, Ambos, et al., 2018; Cuypers et al., 2018; Konara &
Mohr, 2019), has also been under immense scrutiny. Shenkar (2001) has provided a very comprehensive list
of criticisms on both the cultural distance construct and the KSI. He believes that the cultural distance
construct, in particular, operates with hidden assumptions that largely go unnoticed, but are not supported
by either logic or any prior empirical evidence. Shenkar, identifies some of these hidden assumptions to
emanate from conceptual properties and the others to stem from methodological properties of the construct.
These criticisms classified under the two headings, conceptual and methodological properties, are explained
below, along with the necessary measures adopted in this study, with the intention of heeding Shenkar’s
(2001) warnings.
Conceptual Properties
The illusion of symmetry
The distance, in the international business area, is the linking of two essential constituents of doing business
across borders. The most commonly understood distance between two countries relates to their geography.
In general, geographic distance is believed to be symmetric, i.e. the distance from point A to B is identical to
102 Beugelsdijk, Ambos and Nell (2018), using Quality of Governance (QoG) index data for 2013, reveal that correlation between the six QoG indicators vary between 0.62 and 0.94. A Principal Component Analysis (PCA) conducted on these six indicators depict that they portray one single construct explaining 86% of the variation across the six indicators. The authors suggest, given the very high correlations, it is reasonable to use the factor score and to gauge the institutional quality as one single reflective construct.

Chapter 6: The Clash of Cultures and Its Effect on Firm Performance Volatility
226
the distance from point B to A. However, is cultural distance symmetric? Shenkar (2001) elucidates this with
an example. If a Dutch firm is investing in China, will it be confronted with the same cultural distance as a
Chinese firm investing in Netherlands? The answer would be no. Cultural distance from one country to
another can be asymmetric. Research on psychic distance has denoted that the perceived distance between
country A and country B can be different from that between country B and A (Håkanson & Ambos, 2010).
One possible reason for this, may be the difference in the levels of economic development between the two
countries. On the other hand, if the cultural distance between two countries is symmetrical, it implies equal
roles for the home and host cultures. The home country culture will be embedded in the firm and the host
country’s culture will be operated in a national environment. Thus home and host country effects are
different in nature (Shenkar, 2001). Finally, there are no studies indicating symmetry between two countries
and as per Shenkar (2001) there is no reason to assume one.
The illusion of stability
Some scholars argue that cultures change over time103. However, cultural distances, measured at a single
point in time, is obliquely assumed to be constant. The notions of convergence (Webber, 1969, as cited in
Shenkar, 2001), however, would present that cultural distances are narrowing over time, with more
interactions take place among different cultures. As more investors gather to the market, when local
employees becomes conversant in managing multinational corporations (Shenkar, 2001) and when a firm
gains more international experience in a country (Kogut and Singh, 1988), the perceived cultural distance
appear to diminish gradually.
However, in contrast, Beugelsdijk, Maseland and van Hoorn (2015) proclaim that cultural change is absolute
rather than relative. Put differently, they explain that scores of Hofstede’s dimensions for a given country will
not change very much relative to the scores of another country. Thus, as a consequence, cultural differences
(or cultural distances) between country pairs remain stable, in general. Further Barkema and Vermeulen
(1997) by studying longitudinal data for over three decades proclaim that cultural values, measured using
Hofstede’s dimensions, are stable over time.
The above discussion is on cultural change and convergence among countries. However an individual can
undergo a process of acculturation as explained in section 2.2.3. The process of acculturation has been subject
to incessant debate. Giavazzi, Petkov and Schiantarelli (2014) assert that, although cultures converge over
time, it occurs slowly, so that the attitudes of immigrants and the second generation immigrants still closely
resemble to those of their home countries and would remain different to the prevailing set of norms of the
host country (USA in their case). Thus we employ first-generation immigrants in this study, to overcome
dilution of cultural values.
103 Refer section 2.2.3 of Chapter 2 for a debate on persistence of culture.

Chapter 6: The Clash of Cultures and Its Effect on Firm Performance Volatility
227
The illusion of linearity
Most of the prior research has been conducted with the assumption that cultural distance has a linear impact
on the outcome variable. However, this may not always be the case, as firms undergo a learning curve in
terms of foreign exposure.
This study employs quantile panel regression that was introduced by Koenker & Bassett (1978), to allow for
the asymmetries (non-linearity) between cultural distances and firm performance volatility. A detailed
explanation is given in section 6.6.4.
The illusion of causality
Most of the studies on cultural distance are based on the implicit assumption that cultural distance has a
causal effect on the outcome variable. Furthermore they infer that culture is the only determinant that drives
distance (Shenkar, 2001). Many earlier work on distances seemingly have foreseen this issue, as apparently
they have included “non-culture” variables to the distance measure. For instance, as previously explained,
Johanson and Vahlne (1977) defines psychic distance as a collection of numerous factors, such as the
differences in language, education, business practices, industrial development and culture that can prevent
the flow of information from and to the market. Cultural differences is apparently one factor among many.
For instance, Dow (2000) posits that if Hofstede’s scales are used in isolation, resulting predictive power is
weaker when compared to other comprehensive measures of psychic distance.
Therefore, some prior studies recommend the use of additional non-cultural variables to measure distances
(Boyacigiller, 1990; Dow & Karunaratna, 2006; Ghemawat, 2001). Yet, according to Beugelsdijk et al., (2018),
among others, the study in hand uses cultural values due to their centrality in moulding individual and
organizational values.
The illusion of discordance
Prior research on the role of cultural distance shows lack of consensus. Cultural distance is generally viewed
to have negative consequences. Shenkar (2001) posits that the implicit assumption of most of the prior
studies is that cultural differences generate lack of fit posing an obstacle for transactions. However not every
cultural difference is critical to performance. On the other hand cultural heterogeneities can result with a
positive synergistic effect. This proposition is already explained in detail, under the resource dependence and
learning perspectives of cultural distance. Accordingly competing hypotheses are developed in this study.
Methodological Properties
The assumption of corporate homogeneity
The cultural distance construct inherently assumes that there is no heterogeneity in corporate culture.
However this may not always be true. For example, Laurent (1986) posit that corporate culture of

Chapter 6: The Clash of Cultures and Its Effect on Firm Performance Volatility
228
multinational organisations tend to dilute some of the observed national cultural differences and introduce
more homogeneity in the picture. Nevertheless, as suggested by Shenkar (2001), this study in hand challenges
the homogeneity assumption and focuses on the existence of a multiplicity of cultures within an organization
and how the differences among different cultures would affect firm performance volatility.
The assumption of spatial homogeneity
Furthermore, the cultural distance construct assumes uniformity within the national boundary. However
there exists evidence for the prevalence of intra-cultural variation104.
The assumption of equivalence
Finally, Shenkar (2001) presents that KSI, the most popular tool to measure cultural distance construct,
appear to suffer from several methodological weaknesses. Firstly, as KSI is primarily based on Hofstede’s
(1980) dimensions, it is exposed to the same criticisms that are levelled against Hofstede’s work105. Second,
the index is not updated to include the latter work of Hofstede, which incorporates two additional cultural
dimensions, long-term vs short-term orientation and indulgence vs restraint. Finally, Shenkar (2001) suggests
that KSI suffers with the invalid assumption of equivalence and challenges the aggregate measure to be overly
simplified and providing “false readings regarding meaningful cultural differences” (p. 525) (see Chapter Note
6.3).
Nevertheless, the study in hand emphasizes on distances among key players within an organization in general
and how such cultural distances affect firm performance volatility. Beugelsdijk, Ambos and Nell (2018)
contend that a composite index is suitable for such research questions that deals with distance in general as
opposed to theoretcial arguements involving a specific dimension. More details on the choice of KSI to
measure cultural distances are included in section 6.4.2 Key Variables Construction.
Psychic distance
Psychic distance and cultural distance are two related constructs. The term “psychic distance” was first coined
by Beckerman (1956) in his study on the patterns of intra-European trade. Over the next few decades, the
construct, psychic distance, surfaced sporadically in international trade flow research but later seemed to
disappear from the trade flow literature lexicon (Dow & Karunaratna, 2006). Psychic distance finally gained
prominence in management-oriented international sbusiness literature (Dow and Karunaratna, 2006) and
currently plays a primary role in the discipline (Konara and Mohr, 2019).
Johanson and Vahlne (1977, p.24), as previously stated, define psychic distance as “the sum of factors
preventing the flow of information from and to the market”. Nordstrӧm and Vahlne (1994) later revise the
104 Refer section 2.2.2 of Chapter 2 for a description on layers of culture. 105 Refer section 2.2.4 of Chapter 2 for a description on criticisms of Hofstede’s cultural dimensions.

Chapter 6: The Clash of Cultures and Its Effect on Firm Performance Volatility
229
definition and suggest that psychic distance as the factors disturbing or preventing firm’s learning about and
understanding of a foreign environment. Zaheer et al. (2012, p.20) define the same as the “collective
differences between countries”. These definitions infer that psychic distance focuses on a group of factors
whereas cultural distance only emphasizes on a single facet, the inter-country cultural differences. Therefore,
psychic distance is a broader construct than cultural distance (see Chapter Note 6.4). In fact, Dow and
Karunaratna (2006, p.8) posit that “cultural distance is a component of psychic distance, but only one aspect”.
Thus, although the two constructs, psychic distance and cultural distance are related, they can be very
different from each other. In addition, Sousa and Bradley (2006) mention that many prior studies,
erroneously, use the two terms interchangeably, although each of them address different phenomena.
Nevertheless, cultural distance between two countries “remains the most widely used type of distance in
international business”, possibly due to the centrality of cultural values in moulding individual and
organizational values (Beugelsdijk, Kostova, et al., 2018) and thus, similar to many other prior work (explained
in the next section), is employed in this study.
6.2.3.4 Cultural Distance – Some Previous Literature – From International Business to International
Finance
Cultural distance construct, which measures the degree to which one culture is different from or similar to
another, has been widely used in the domains of management (human resource management, strategy,
organization behaviour etc.), marketing, finance and accounting (Shenkar, 2001).
Cultural distance plays a primary role in the discipline of international business, as explained so far. Over the
years, a large number of studies have focused on how cultural distance can affect the different stages of the
firm Internationalisation process. Beugelsdijk et al., (2018) categorize the glut of literature under two main
headings in the internationalization process: viz. studies regarding the pre-investment stage and post-
investment stage. Pre-investment stage involves strategic decisions such as location choice, entry and
establishment mode and degree of ownership where post-investment stage involves integration of foreign
operations and managing and controlling performance. A comprehensive meta-analysis undertaken by
Beugelsdijk et al., (2018) reveal several important findings.
First, cultural distance appears to have a different effect on the various phases of the firm internationalization
process. Second, the authors suggest that cultural distance significantly affect decisions made in the pre-
investment stage, such as location choice and entry mode, with the exception of the degree of ownership.
Third, during the post-investment stage, cultural distance results with greater transfer of home-country
practices to the subsidiary in the host country. Fourth, previous studies indicate that transfer practices appear
to be more difficult with cultural distance, but firms that manage to do so largely benefit from it. Finally, the
authors suggest that prior studies indicate a negative impact of cultural distance on the performance of
subsidiary but no effect on the performance of the whole multi-national corporation.
On the other hand, “finance has recently picked up on the concept of cultural distance (..) to explain patterns
in other forms of cross-border financial flows” (Karolyi, 2016, p.612). For instance, cultural distance studies

Chapter 6: The Clash of Cultures and Its Effect on Firm Performance Volatility
230
in the realm of international finance, posit that issuers might choose prospective investors in culturally nearby
markets, in order to enable the flow of information between home and host markets (Siegel et al., 2011).
The study of Grinblatt and Keloharju (2001) appear to be one of the earliest investigation of culture in finance
(Karolyi, 2016). The authors conclude that investors are more likely to buy, hold and sell the stocks of Finnish
firms that are in geographically close proximity to the investor, that communicate in the investor’s native
tongue and with CEOs of the same cultural background. Interestingly, the study depicts that language and
culture appear to exacerbate perceived distances between countries.
By studying international investment flows between country pairs around the world, covering bond and
equity issuances, syndicated loans and mergers and acquisitions (M&A), Siegel, Licht and Schwartz (2011)
discover that, the greater the cultural distance between two countries, the lower the scope of investment
between them would be. Authors operationalize cultural distance based on one cultural dimension,
“egalitarianism”, derived from Schwartz cultural dimensions. Schwartz (2007, p.6) define egalitarianism as
the extent to which people “recognize one another as moral equals who share basic interests as human
beings”. The negative association is due to investors demanding a higher expected rate of return to
compensate for the need to adjust to this new environment. Thus when the egalitarianism distance between
two countries increases “assets may become more difficult to price, corporate governance may be less
acceptable, firm stakeholders (lenders, employees, authorities etc.) more difficult to deal with, subsidiaries’
managements more difficult to control and negotiations more likely to fail” (Siegel, Licht and Schwartz, 2011,
p.622). The authors assert that firms do not gain value in bridging the distance, after reaching a certain point.
Ahern, Daminelli and Fracassi (2015) emphasize on the effect of trust, hierarchy and individualism, derived
from the World Values Survey, on merger volumes and synergy gains. Unsurprisingly, greater cultural distance
leads to smaller merger volumes and greater distances in trust and individualism in particular, results with
lower combined announcement returns.
In addition, cultural distance also plays a role in foreign portfolio holdings and foreign portfolio flows (Karolyi,
2016). Home-bias puzzle explains the phenomenon where investors overvalue the securities of their home
country in their investment portfolio relative to foreign securities, despite the substantial benefits that can
be derived out of international diversification. On the other hand, when investing in foreign countries,
investors may allocate funds to each market according to their personal preferences or put differently, the
weights on each foreign market may differ. This issue is known as the foreign bias puzzle (Beugelsdijk & Frijns,
2010).
Beugelsdijk and Frijns (2010), investigate the foreign bias puzzle and affirm that investors from countries that
are more uncertainty avoiding tend to invest less in foreign equity and investors from more individualistic
societies tend to invest more in foreign equity. Further they also contend that investors from countries that
are more distant from each other, in terms of culture, tend to invest less in each other relative to countries
that are in more close proximity.

Chapter 6: The Clash of Cultures and Its Effect on Firm Performance Volatility
231
6.2.3.5 Cultural Distances within a Firm
Mostly, as illustrated above, prior research in international business and management has measured
distances between countries. However, a multiplicity of cultures can exist within a firm and not many prior
scholars have pursued this issue. A similar argument is presented by Shenkar (2001), under the assumption
of corporate homogeneity.
The work of Cao, Ellis and Li (2018), emphasize on the cultural distances within board of directors106 and its
impact on cross-border mergers and acquisitions (CBMA) and related decisions. Initially they find that firms
with foreign board of directors appear to more frequently engage in less profitable CBMAs. The authors also
show that this finding is only present in companies with directors that are more culturally distant. Cao, Ellis
and Li (2018) reveal that information asymmetry, greater problems in coordination and communication,
personal conflicts over different values and perceptions are highly likely when board members are more
culturally distant. The authors conclude that despite the resource dependence view, when foreign directors
greatly differ in terms of norms and shared values relative to the country they are currently employed in (the
US, in this case), the resource provision function and even the monitoring role of board of directors tend to
weaken, eventually deteriorating the decision quality of the CBMA.
Ferris, Jayaraman and Zhang (2017) examine the simultaneous interplay of several cultures within a firm.
They postulate that culture’s impact on firm outcomes occurs from the interaction of these sub-cultures that
co-exist within the organization. The existence of several corporate cultures within a firm creates divergences
in the attitudes and perceptions of the various corporate agents such as the CEO, the board of directors or
stakeholders. The impact of the cultural differences between the CEO and board of directors (which they
refer to as leadership wedge) and the CEO and stakeholders (which they refer to as citizenship wedge), on
CEO turnover and firm value are examined in their study.
Nevertheless, the focus of the present study remains distinct from the above studies as it investigates how a
multiplicity of cultures within a firm may contribute to or reduce firm risk and comprehensively
operationalizes the cultural distances within a firm. In other words, instead of restricting the focus to the CEO,
Board of directors and the firm stakeholders, the present study recognises the important role played by the
board of directors in a firm and also measures cultural distances among board members.
106 They also focus on boardroom diversity measured by the foreign directors as a proportion of total directors.

Chapter 6: The Clash of Cultures and Its Effect on Firm Performance Volatility
232
6.2.4 Research Contribution
Prior scholars have established that cultural values have an impact on firm outcomes. In addition, cultural
differences among regions/ countries are also shown to affect the relationship among cross-border firms.
However the emphasis of such research was on the national culture of either the CEO, firm or country. Put
differently, the existing literature only explores the effect of a ‘single’ culture associated with either the
decision-maker or the firm/country. However, in the current study, the focus rests upon the existence of a
multiplicity of cultures (viz. the CEO’s culture, board of directors’ cultural backgrounds and the stakeholders’
culture), within a single firm and how the distances among them would affect corporate performance
volatility.
A large body of research that investigates about ethnic / racial diversity in the boardroom and its impact on
corporate outcomes exist in the corporate governance literature lexicon. However diversity and cultural
distances are distinct from each other, as the former would only consider the representation of minority
executives in the board, measured by the proportion of minority directors out of the total, while cultural
distances consider how different they can be from each other, based on their values, beliefs, attitudes and
perceptions. The focus of the present study rests upon the latter and examines a relatively broader concept.
Differences in values, opinions, perceptions can sometimes be valuable to a firm, as it introduces varied
perspectives to a problem. On the other hand, difference in opinions and views can lead to lack of trust,
miscommunications, misunderstandings and conflicts. How would this phenomenon affect the firm
idiosyncratic risk? This problem has not been researched before and is the focus of the present study. A
comprehensive literature review indicates that only one published study (e.g. Cao, Ellis and Li, 2018) and a
conference paper (e.g. Ferris, Jayaraman and Zhang, 2017) has focused on cultural distances within a firm,
yet their focus is different, because (as stated above) the former has researched on cross border mergers and
acquisitions whereas the latter on CEO turnover and firm value. Furthermore the present study
comprehensively operationalizes the cultural distances within a firm, firstly by looking at many key players in
an organization (i.e. CEO, Board of directors and the firm stakeholders) and second by calculating cultural
distances among the aforesaid groups and also among board members. The present study also categorises
the performance volatility distribution of sample firms to 3 groups, i.e. least volatile, moderately volatile and
most volatile and examines the behaviour of cultural distances within each of this group.
6.3 Hypothesis Development
This study emphasizes on the existence of a multiplicity of cultures within a single organization. The key
players within the firm, e.g.: the CEO, board of directors, employees and other stakeholders may represent
different cultural backgrounds.
Among a multiplicity of cultures that may exist within an organization, the study in hand only emphasizes on
the following:

Chapter 6: The Clash of Cultures and Its Effect on Firm Performance Volatility
233
1. Chief Executive Officer’s (CEO) national culture
2. National cultures of the board of directors
3. National culture of the stakeholders
In an organization, if the CEO, board of directors and the majority of the stakeholders are from varying cultural
backgrounds, they may be different from each other in terms of their values, attitudes or beliefs. This would
lead to differences in position or opinion among members regarding firm policies, which would mostly result
in disagreement and opposition. However this may also introduce different perspectives to an issue that
would moderate the decisions so that the final decision is a compromise. Harrison and Klein (2007) refer to
this facet of diversity, as separation107.
To operationalize the separation among the aforementioned cultures, cultural distances among the key
players are calculated. As the CEO is considered to be the most powerful actor in an organization (Malmendier
et al., 2011; Malmendier & Tate, 2007; Nguyen et al., 2018), with the ultimate authority of decision making,
the distances of national cultures are calculated as follows:
1. Cultural distance between the CEO and the dominant culture of the board
2. Cultural distance between the CEO and stakeholders
Finally as board of directors play an important role in an organization in terms of monitoring, advising and
resource provision etc., it is reasonable to assume that the cultural values and diversities of board of directors
alone can make an impact on firm performance volatility. Therefore, another measure is added as follows:
3. Cultural distances within the board (among different members)
Based on prior literature, the following hypotheses for the aforementioned 3 spheres are developed. In
figures 6.4, 6.5 and 6.6, the conceptual foundation with regard to the three cultural spheres and performance
volatility are presented.
6.3.1 Sphere 1 - Cultural distance between the CEO and board of directors
Fracassi and Tate (2012) affirm that close CEO-director ties encourage managers to engage in value destroying
acquisitions, leading to volatile outcomes. Conversely, a culturally distant CEO and board of directors rarely
belong to the same network. Thus from an agency theory perspective, this would imply that the board
members are more “unfriendly” (Adams & Ferreira, 2007). Furthermore the CEO and the board are less likely
to suffer from groupthink (Ferreira, 2010) and consequently the board would be more independent than a
homogeneous board. Independent directors, in general, would not collude with the CEO /top management
107 In their study, Harrison and Klein (2007) identify three distinctive facets under the construct diversity, viz, separation, variety and disparity. A detailed explanation is included in section 6.7.4.

Chapter 6: The Clash of Cultures and Its Effect on Firm Performance Volatility
234
or the inside directors, are more likely to raise questions and be vigilant about the behaviour of the
management (Carter et al., 2003). Therefore the management is unable to involve in value destroying risky
ventures, subsequently resulting with less volatile performance.
Nonetheless, this would also infer that a culturally distant board would be less captive to the CEO, thus will
play an active role in monitoring CEO’s decisions, implying that CEOs are unlikely to make strategic decisions
single-handedly. The decisions made by the CEO and top management team, will be reviewed intensely by
the culturally distant board members, resulting in greater differences in opinions, views and perspectives,
regarding a given strategic choice. This would entail mixed opinions and disagreements and finally a
“diversification of opinions effect” (Adams, Almeida and Ferreira, 2005, p.1406), when approving
management proposals. This resembles to a model of group decision making presented by Sah and Stiglitz
(1986, 1991) and empirically tested on boards by Adams, Almeida and Ferreira (2005). The resultant
decisions, made by a group, as opposed to an individual, will be less extreme; neither very good nor very bad
and hence associated with less variable performance, as the project has to be endorsed as acceptable by
several group members, before it can finally be accepted (Cheng, 2008)
Therefore, by looking at the above arguments, it can be postulated that:
H1 Higher cultural distance between CEO and Board of Directors decrease the performance variability
However on the other hand, when greater cultural differences exist between the CEO and the board, it can
lead to difficulty in aggregating the differences in preferences, resulting with more erratic outcomes
(Giannetti & Zhao, 2015). These authors affirm that in such a backdrop corporate strategy are rarely
persistent.
Thus, the following can be hypothesized:
H2 Higher cultural distance between CEO and Board of Directors increase the performance variability
Thus, ultimate direction remains an empirical question.
The above possible channels of influence are summarized in figure 6.4:

Chapter 6: The Clash of Cultures and Its Effect on Firm Performance Volatility
235
Figure 6.4: Conceptual Foundation: Cultural Distance between the CEO and Board of Directors and
its Association with Firm Performance Volatility– Channels of Influence
difficulty in aggregating the differences in
preferences
More erratic outcomes. (Gianetti and Zhao, 2015)
higher performance variability
Sphere 1
Between board of directors and CEO
Higher cultural distance
Board is more distant from the CEO and thus can be inferred as more
independent
More likely to raise questions and be vigilant about the behaviour of
the management
Less performance variability
Intense board monitoring
and the CEO unable to make
strategic decisions single-
handedly.
A model of group decision
making where resultant
decisions are less extreme,
neither very good nor very
bad (Sah and Stiglitz,
1986;1991 and Adams,
Almeida and Fereirra, 2005)
Decisions taken collectively
by CEO and board who
fosters different opinions,
views and perspectives
Management is unable to
engage in value destroying
risky ventures (see Fracassi
and tate, 2012)
Less performance variability

Chapter 6: The Clash of Cultures and Its Effect on Firm Performance Volatility
236
6.3.2 Sphere 2 - Cultural distance between the CEO and stakeholders
Stakeholders of a firm may include but not restricted to its managers, employees, investors, suppliers,
customers and general public etc. For instance, in his pioneering work, Beckerman (1956) exemplified that
an Italian entrepreneur would prefer to purchase raw materials from a Swiss supplier than from a Turkish
supplier (provided that transport costs and all other factors remain same) because the Italian entrepreneur
would have more contacts with the Swiss supplier and will perceive him as “nearer” in a psychic evaluation
(e.g.: fewer language difficulties etc.).
In a similar vein, Ferris, Jayaraman and Zhang (2017), states that greater cultural affinity among the CEO and
stakeholders would not only foster greater communication among both parties but would also result in
increased trust. Furthermore, greater cultural affinity among the CEO and the stakeholders would result in
higher acceptance of CEO’s decisions (Ferris et al., 2017).
However if the CEO and stakeholders are culturally very distant, miscommunication and misunderstandings
are quite common (Ferris et al., 2017). CEOs may have their own views, perceptions, values and priorities
that are different from stakeholders. Culturally distant CEOs might not only face difficulties in communicating
his/her decisions to the firm’s stakeholders but they may also disagree on what the pressing problems of the
firm are (Giannetti & Zhao, 2015). For instance, even if the CEO aims to maximize the firm’s long-term value,
he or she may have different preferences over corporate policies to implement, in order to achieve this
objective.
Furthermore different CEOs may care to a different extent about firms’ different stakeholders (e.g., long-term
shareholders, short-term shareholders, debt-holders, the environment, the local community, the workers,
etc.) (Giannetti & Zhao, 2015). Therefore the disarray of preferences of CEOs and stakeholder groups may
result with CEOs making unpredictable decisions (refer figure 6.5).
Thus, in light of the above, it can be hypothesized that:
H2 Higher cultural distance between CEO and stakeholders increase corporate performance volatility

Chapter 6: The Clash of Cultures and Its Effect on Firm Performance Volatility
237
Higher performance variability
Likely to result with CEOs making unpredictable decisions.
Sphere 2
Higher cultural distance
the CEOs priorities may be different from the priorities of the
firm stakeholders
Disarray of preferences of CEOs and stakeholders. Eg: (i) CEO-
Stakeholder disagreements on prioritising the pressing
problems of the firm (ii) Different CEOs care to a different
extent about firm's different stakeholders (long term vs short
term shareholders etc.
Between stakeholders and CEO
Figure 6.5: Conceptual Foundation: Cultural Distance between the CEO and Firm Stakeholders and
its Association with Firm Performance Volatility– Channels of Influence

Chapter 6: The Clash of Cultures and Its Effect on Firm Performance Volatility
238
6.3.3 Sphere 3 - Cultural distances among board of directors
When the board members are culturally different from each other, their varied opinions and views may
aggravate conflicts among board members that would disrupt the board’s internal decision-making process.
Internal conflicts would make it hard to attain a consensus among members, resulting in more erratic
outcomes, ultimately increasing firm risk and outcome volatility (Bernile et al., 2018; Giannetti & Zhao, 2015).
Moreover, in-group conflicts and the absence of consensus would result in lack of group cohesiveness. This
would, in turn, trigger coordination problems among board members. According to Jensen (1993), when
there exists coordination problems, “board members are less likely to function effectively and are easier for
the CEO to control” (p.865), making CEOs powerful. The evidence on CEO power and firm performance
volatility is mixed. Adams, Almeida and Ferreira (2005) argue that CEOs with more power leads to more
variable performance. This is because, if the CEO of the firm is involved in making most of the relevant
decisions (implying high CEO power), the risk arising from the judgement error may not be well diversified
and the likelihood of either a very good or a very bad decision being taken is quite high.
Therefore, this study postulates that:
H3 Higher cultural distance among board of directors increase the performance variability
On the other hand, some other authors affirm that high CEO power would entail low firm risk. Amihud & Lev
(1981a) affirm that CEOs with high power tend to engage in conglomerate mergers, to lower their largely
undiversifiable “employment risk” (Amihud & Lev, 1981). Bertrand and Mullainathan (2003) contends that
CEOs who enjoy high power as a result of being insulated by anti-takeover laws, engage in less destruction of
old plants and also less creation of new plants, implying low risk-taking.
Moreover, large boards foster diversified opinions and brings in varied perspectives to a problem (Sah and
Stiglitz, 1986, 1991). Consequently, Sah and Stiglitz (1991) affirm that decisions of a larger group entail less
variability. As per the resource dependence perspective, this line of argument can equally be applied to
culturally diverse groups. Thus, the final decision made by a culturally diverse group is a compromise that
demonstrates the different opinions and varied perspectives. Such decisions are neither very good nor bad,
thus are less extreme. Risky projects are likely to get rejected as the project has to be endorsed as acceptable
by several group members, before it can finally be accepted (Cheng, 2008), inferring low volatility in
outcomes.
Therefore in light of all the above, it can be postulated that:
H4 Higher cultural distance among board of directors decrease the performance variability
Therefore the ultimate direction between cultural distance among board of directors and performance
variability is an empirical question. The above channels of association are summarized in Figure 6.6.

Chapter 6: The Clash of Cultures and Its Effect on Firm Performance Volatility
239
Figure 6.6: Conceptual Foundation: Cultural Distance among the Board of Directors and its
Association with Firm Performance Volatility– Channels of Influence
Higher performance variability
Diversified opinions and varied
perspectives to a problem
final decision is a compromise - neither
very good nor very bad
Less performance variability
the board is more captive to
the CEO, making the CEO
more powerful in decision
making
Higher
performance
volatility
CEO involved in
making most of the
major decisions
CEO reduces largely
undiversifiable
employment risk
take less risk -
less performance
variability
Resulting in more erratic
outcomes
Varied opinions and views of board members
Aggravates conflicts within the board / difficulty in attaining a
consensus among members.
lack of board cohesiveness
coordination problems among
group members
judgement error
not wel diversified -
may yield very
good or very bad
results
Sphere 3
Among board of directors
Higher cultural distance

Chapter 6: The Clash of Cultures and Its Effect on Firm Performance Volatility
240
6.4 Data and Variable Construction
6.4.1 Sample Overview
A European sample is chosen for the purpose of this study due to several reasons. The main motivation is the
economic liberalization operating in the European region that causes more foreign CEOs and directors to be
employed in these firms, relative to other countries108. Most of the stakeholders of a particular firm (e.g.:
employees, subordinate managers) would generally belong to the same culture as the firm’s country of
domicile. Yet, owing to globalization pressures, and the free mobility of labour in the EU, the board of
directors and the CEO might be foreign nationals. Interestingly, Trompenaars (1993) posits that “nowhere do
cultures differ so much as inside Europe”. In fact, the founder of the European Community, Jean Monnet, has
once declared, “if I were again facing the challenge to integrate Europe, I would probably start with culture”
(quoted from Trompenaars, 1993, p. 8).
Furthermore, Jenkinson, Morrison, & Wilhelm (2006) assert that European countries give more prominence
to custom and prior practice than formal regulation. Therefore, as the emphasis on tradition happen to be
significant in European firms, cultural distances between the key constituents of the firm, such as the CEO,
board of directors, stakeholders, are likely to be crucial.
Finally, Ferris, Jayaraman and Zhang (2017) affirm that excluding the US would confirm that the results are
not driven by one mega-economy and that the findings of cultures’ influence are insightful to a more global
sample of firms.
Out of the twenty-eight countries in the European Union (EU), as at 2018, the first fifteen countries, with the
highest Gross Domestic Product (GDP) at market prices, calculated based on purchasing power standards are
initially identified for the sample. However due to data limitations, firms from Romania, Czechia and Italy are
eliminated. If a particular country operates with several stock exchanges, which happens to be the case
108 The European Union operates a single market, which is referred to as the world’s most highly developed and open marketplace that also enables the citizens of member countries to live or work freely in any EU country (European Union, 2020). This union was initially formed after the second world war in 1958, as the European Economic Community (EEC), predominantly to foster economic cooperation among member countries (European Union, 2020). The EEC opened up the national markets of the region to intra-EU competition, as creating a large domestic market would result in greater efficiencies and economies of scale that would derive benefits for its member states (Millington & Bayliss, 1996). What kicked off with six countries (viz. Belgium, Germany, France, Italy, Luxembourg and the Netherlands) in1958, currently consist of twenty-eight member countries, for a variety of policy areas in addition to economic policy, such as climate, environment, health, security, justice and migration. On 31st January 2020, the United Kingdom left the European Union, marking the total number of member states in the EU as twenty-seven (European Union, 2020).

Chapter 6: The Clash of Cultures and Its Effect on Firm Performance Volatility
241
mostly, the principal stock exchange of a country is identified. All companies listed in the principal stock
exchange (excluding cross-listings109) of a particular country is chosen for the sample.
To be consistent with previous studies, regulated industries, such as utility companies (ICB code 65) and
financial firms (ICB code 30) as per FTSE Russell Industry Classification Benchmark (ICB)110, are excluded from
the sample. This is mainly due to two reasons: First, government regulation is highly likely to affect firm
performance (Anderson et al., 2011), and thus performance volatility, in these industries. Second, prior
studies show that the importance of board of directors as an internal governance mechanism is dampened
to a greater extent in public utility firms (Baysinger & Zardkoohi, 1986) and in financial firms (J. R. Booth et
al., 2002). Put differently, government regulation leads to different and more limited roles for the boards of
directors in regulated industries (Yermack, 1996)111.
109 To identify cross-listings, the data type “QTEALL” was used under “Static Request” in Thomson Reuters DataStream 110 ICB industry classification has been changed with effect from 01st July 2019. According to previous ICB classifications, utility firms are denoted by ICB code 7000 and financial firms by ICB code 8000.
111 Baysinger and Zardkoohi (1986) distinguish board of directors in a firm, based on the nature of the role they perform. They assert that a board of directors consists of (i) decision controllers (outside directors who ratify decision initiatives of management and monitor the implementation of initiatives), (ii) decision managers (directors with specific internal information about various functions and input needs), (iii) decision supporters (directors who provide external information regarding input markets) and (iv) public relations members. Baysinger and Zardkoohi further explain that as utility companies enjoy regulatory safeguards, the opportunistic behaviour of management is reduced to a greater extent and that agency conflicts are less severe in regulated industries. The ratification of management decision initiatives and monitoring the implementation, to a large extent, is performed by the regulatory body. Thus, regulated industries require lesser proportion of decision control directors in their boards, ceteris paribus. On the other hand, in regulated utility firms, most of the strategic decisions, such as capital investment, employment etc. are affected by constraints imposed by regulators. For instance, the rate of return in regulated firms is controlled by regulation, hence impacting investment and other input decisions. This suggests that regulated firms require a smaller proportion of decision managers and decision supporters in their boards, relative to unregulated firms. Thus, it is evident that the roles of decision controllers, decision managers and decision supporters are substituted to a greater extent by the regulations in place. Therefore public utility firms are excluded from the sample (contd.).
Booth, Cornett and Tehranian (2002) illustrate how regulation plays a major role in monitoring managers’ actions, in financial firms, in particular. Although financial companies and utility firms face different forms of regulations, both will influence the degree to which agency conflicts exist. The authors affirm that while the regulations in financial industry may not directly target to increase shareholder wealth, they would still closely monitor managerial decisions, in order to limit managerial discretion for the safety and soundness of banks, fair lending practices and consumer protection. The authors conclude that as regulations function as a substitute for internal monitoring mechanisms, the independence of the board and their responsibility for monitoring play a less important governance role. Therefore, due to this reason banks and other financial firms are excluded from the sample.

Chapter 6: The Clash of Cultures and Its Effect on Firm Performance Volatility
242
Required data are sourced mainly from two databases, Worldscope and Boardex112, where all financial data
are retrieved from the former and the CEO and director level data (e.g.: nationality, gender, age, education
etc.) are collected from the latter. Companies with too many missing values have been dropped. Final sample
includes 1,190 firms from 12 European countries, over 14 years from 2005 to 2018. The sample constituents
are illustrated in table 6.1.
Table 6.1: Sample Constituents
Country No. of Firms
Austria 12
Belgium 83
Denmark 41
France 262
UK 338
Germany 78
Ireland 30
Netherlands 76
Poland 26
Portugal 25
Spain 87
Sweden 132
Total 1190
112 Most of the European countries have a dual board system as highlighted by Adams and Ferreira (2007), except for UK and Sweden (who have sole boards) and France (who has a mixed board structure). However, in this study, the data retrieved from the Boardex database consist of total data, i.e. the total number of directors in the firm, including the number of supervisory directors, executive directors and independent non-executive directors involved in performing both monitoring and advisory roles.

Chapter 6: The Clash of Cultures and Its Effect on Firm Performance Volatility
243
6.4.2 Key Variables Construction
Dependent Variable(s) - Measures of Performance Volatility
The empirical analysis focuses on the within-firm, over-time variability of corporate performance. This is
proxied by the volatility in stock performance and to measure this, the annualized standard deviation of
monthly stock returns over a period of 12 months (Cheng, 2008; Giannetti & Zhao, 2015; Sila et al., 2016;
Wang, 2012) is calculated113. To improve robustness, the study also uses the annualized standard deviation
of quarterly stock returns over a period of 12 months (Cheng, 2008; Giannetti & Zhao, 2015; Sila et al., 2016;
Wang, 2012).
Furthermore, in addition to stock performance, similar to Cheng (2008), within-firm, over-time variability in
accounting performance and market value are also considered. The former is defined as the standard
deviation of the firm’s annual return on assets (ROA) and the latter as the standard deviation of the firm’s
annual return on corporate value, measured by Tobin’s Q ratio. A definition of all variables is included in
Appendix B.
Main Independent Variable(s) – Measures of Cultural Distance Spheres
This study develops three spheres of cultural distance:
1. Cultural distance between CEO and the board of directors
2. Cultural distance between the CEO and stakeholders
3. Cultural distance among board of directors
Firstly the nationalities of the CEO and all board of directors in each firm are collated from the Boardex
database. The nationality of firm’s stakeholders is proxied by the country in which the head-office of the firm
is located. The choice of this proxy can be justified due to following reasons. Head-office is usually the main
office of the firm or the place where the business first started or where the administrative and other functions
are located. Thus the prominent national cultural characteristics of the country where the head-office is
situated are likely to be embedded to the value system prevailing in the organization. Also given the well-
known home bias present in the portfolio holdings of investors, it is probable that a large number of firm’s
investors will share the culture of the country where the head-office is located (Ferris et al., 2017). The
country where the head-office is located is also sourced from the Boardex database.
113 The following steps have been involved in calculating the final figure. Firstly, the monthly total return index (TRI) data for each firm are downloaded from Thomson Reuters Datastream, over the sample period. Secondly, monthly increase / decrease in the TRI for each firm is calculated as a percentage. Thirdly, the standard deviation of monthly TRI changes over a period of twelve months, from January to December in each year, is calculated for each firm. Finally, the standard deviation of a particular firm in a given year is multiplied by the square root of twelve, in order to obtain the annualized figure.

Chapter 6: The Clash of Cultures and Its Effect on Firm Performance Volatility
244
What distance measure to be used?
In order to calculate the distances between the key players, the study employs the KSI developed by Kogut
and Singh (1988), over the other two alternative measures (Euclidean index and the Mahalanobis index)
discussed earlier. This is due to several reasons; firstly, Euclidean index does not take into account the
variance of individual cultural dimensions (H. Berry et al., 2010; Beugelsdijk, Ambos, et al., 2018). However
the KSI is a Euclidean distance with a variance correction, which is applauded by many scholars. Secondly,
Beugelsdijk, Ambos and Nell (2018) affirm that as Hofstede’s cultural dimensions are highly correlated with
each other, it would impair the use of the Mahalanobis index, as the two methods, KSI and Mahalanobis
index, would not yield fundamentally different results from each other. Due to the above stated reasons and
owing to the widespread adoption of KSI as “the paradigmatic measure of distance in international business
research” (Ambos and Håkanson, 2014, p.1), the study in hand employs KSI to measure distances. KSI, in
deed, has been adopted by a large number of studies due to its clarity, parsimony, and resonance with
managers and perhaps can be considered as the most influential cultural classification (Kirkman et al., 2006).
However, to overcome the aforementioned weaknesses of the KSI measure and to increase robustness, the
standardized Euclidean Index, recommended by Konara and Mohr (2019) is employed in Section 6.7.3.
What cultural framework to be used?
Next, to operationalize cultural distances, the study adopts Hofstede’s (1980) cultural dimensions. Therefore,
Hofstede’s cultural scores are assigned for the nationalities of the aforementioned three constituents of the
organization; i.e. the CEO, board of directors and the stakeholders proxied by the country in which the firm’s
head-office is located. Two other well-known cultural frameworks, viz. Schwartz (1994, 1999, 2006) and
GLOBE (House et al., 2004) frameworks are also used in Section 6.7.2, to improve robustness. None of these
cultural frameworks are void of errors, yet such criticisms are not very relevant from a distance perspective
(Beugelsdijk, Ambos, et al., 2018). For example, the authors explain that criticisms over whether the labels
represent the underlying items would only matter when giving fundamental meaning to specific individual
dimensions. However when all dimensions are aggregated into a cultural distance index, this doesn’t matter
substantially. Moreover, they also elucidate that over the years, while cultural indicator levels can change,
cultural distance may not be affected as many countries, more or less move in the same direction, towards
becoming more indulgent, more individualistic and less power distant. This results with cultural distance
between countries remaining relatively stable.
Furthermore, they contend that these three frameworks, i.e. Hofstede, Schwartz and GLOBE, capture very
different facets of culture and institutions. However a pairwaise correlation is conducted between the
distances calculated for the three spheres based on all Hofstede, Schwartz and GLOBE frameworks (depicted
in table 6.2). This portrays that some of the distances are highly correlated.

Chapter 6: The Clash of Cultures and Its Effect on Firm Performance Volatility
245
Table 6.2: Pairwise Correlations between Distance Variables Calculated Based on alternative
Cultural Frameworks
1 2 3 4 5 6 7
1 CEO_bod_Hof 1
2 CEO_stk_Hof 0.2502* 1
(0.0000)
3 Within_Hof 0.0161 0.0050 1
(0.2360) (0.7310)
4 CEO_bod_Sch 0.1172* -0.0007 -0.0013 1
(0.0000) (0.9620) (0.9270)
5 CEO_stk_Sch 0.1712* 0.5826* 0.0141 0.0008 1
(0.0000) (0.0000) (0.3350) (0.9530)
6 Within_Sch 0.0216 0.0497* 0.2130* -0.0014 0.0652* 1
(0.1190) (0.0005) (0.0000) (0.9130) (0.0000)
7 CEO_bod_GLB 0.8471* 0.1921* 0.0134 0.8643* 0.1942* 0.0089 1
(0.0000) (0.0000) (0.3520) (0.0000) (0.0000) (0.5230)
8 CEO_stk_GLB 0.1740* 0.4972* 0.0188 0.0002 0.5278* 0.0587* 0.2493*
(0.0000) (0.0000) (0.1990) (0.9910) (0.0000) (0.0000) (0.0000)
9 Within_GLB 0.0429* 0.0068 0.8918* 0.0371* 0.0168 0.3282* 0.0564*
(0.0029) (0.6440) (0.0000) (0.0080) (0.2560) (0.0000) (0.0000)

Chapter 6: The Clash of Cultures and Its Effect on Firm Performance Volatility
246
8 9
8 CEO_stk_GLB 1
9 Within_GLB 0.0358 1
(0.0151)
Note: *denotes statistical significance at the 1% level. T statistics are in parentheses. 'CEO_bod', 'CEO_stk' and 'Within' represent cultural distances between CEO - board, CEO-stakeholders’ and within the board. 'Hof', 'Sch' and 'GLB' indicates distances calculated based on Hofstede, Schwarts and GLOBE frameworks. A definition of all variables is included in Appendix C.
Nevertheless all three cultural frameworks are employed mainly because, arguably, the selection of and
restricting to an individual cultural framework remains arbitrary to some extent. Furthermore, the distances
calculated based on different cultural frameworks will not be employed in the regression equation
simultaneously, thus would not give rise to multicollinearity issues. Therefore the initial analysis with
Hofstede’s dimensions is later complemented with Schwartz and then GLOBE frameworks, and discussed in
section 6.7.2.
Finally, one could question the suitability of substituting macro level cultural variables to individuals.
However, Dow, Håkanson and Ambos (2014) advocate that a researcher can still capture approximately about
80% of the explained variance of cultural distance, even by using a comprehensive set of macro level
variables, such as cultural dimensions, in the absence of information on perceptions of individual directors.
Hofstede’s cultural framework with four or six dimensions?
We employ the KSI with Hofstede’s initial four dimensions, viz. power distance, collectivism vs. individualism,
uncertainty avoidance and femininity vs. masculinity. Beugelsdijk, Ambos and Nell, (2018) recommend the
use of Hofstede’s six dimensional cultural framework, so that researchers take all readily available
information into account. Moreover, due to its relationship to Confucianism, Shenkar (2001) states that the
fiifth dimension is crucial to measure distances for studies involving East-Asian countries. The sample in hand,
however, includes only three directors from East-Asian and Southeast- Asian countries, viz. South Korea,
Malaysia and Singapore out of 12,298 directors in total.
On the other hand, (Beugelsdijk, Ambos and Nell (2018) challenge the theoretical and methodolgical
soundness in adding the two new dimensions. The additional two dimensions of Hofstede’s framework, viz.
“long-term orientation” and “indulgence vs. restraint” are based on recent data in the 2000s, whereas the
original dimensions used data collected during 1968-1972. Further, sampling procedures, factor analytic

Chapter 6: The Clash of Cultures and Its Effect on Firm Performance Volatility
247
structure and the relationship between questionairre items and labelling of the dimensions largely differ
between the original and the two new dimensions (Beugelsdijk, Ambos, et al., 2018). Furthermore, the
authors advise that owing to the high correlation between four and six dimensions of Hofstede framework,
adding dimensions will not produce fundamentally different results. As the study in hand uses “the
framework in its totality” (p.1122) as opposed to focusing on an individual distance dimension and because
the additional two dimensions, viz. “long-term orientation” and “indulgence vs restrain” result with a lot of
missing values to the countries in the sample in hand, the focus only remains on the original four Hofstede
dimensions. Furthermore, the analysis use the variance of a dimension that is relevant within a dataset that
consists of only a sub-sample of countries (i.e. the sample variance), as suggested by Beugelsdijk, Ambos and
Nell (2018).
Sphere 1: Cultural distance between the CEO and board of directors
Cultural distance between the CEO and board of directors is calculated as below:
(6.4) CDCEO-DIR = ∑ {(𝐼𝐶𝐸𝑂𝑖𝑥𝑡 − 𝐼𝐷𝐼𝑅𝑖𝑥𝑡)2 /𝑉𝑖𝑥𝑡 }𝑛𝑖=1 / N
where CD CEO-DIR is the cultural distance between the CEO and board of directors. ICEOixt is the Hofstede’s score
for ith cultural dimension, attached to the CEO’s country in firm x and time t. IDIRixt is the mean score of
Hofstede’s ith cultural dimension, attached to all directors’ respective countries in firm x at time t. V ixt is the
in sample variance for the ith cultural dimension for firm x and time t. N is equal to 4.
Sphere 2: Cultural distance between the stakeholders and the CEO
Cultural distance between the CEO and stakeholders is calculated as below:
(6.5) CDCEO-STK = ∑ {(𝐼𝐶𝐸𝑂𝑖𝑡 − 𝐼𝐹𝑖𝑟𝑚𝑖)2 /𝑉𝑖𝑡 }𝑛𝑖=1 / N
where CD CEO-STK is the cultural distance between the CEO and stakeholders. ICEOit is the Hofstede’s score for
ith cultural dimension, attached to the CEO’s country of the respective firm in time t. IFIRMi is the Hofstede’s
score for ith cultural dimension, attached to the country in which the head-office of the firm is located. Vit is
the in sample variance for the ith cultural dimension for time t. N is equal to 4.
Sphere 3: Cultural distances among board of directors
Cultural distance among the board of directors is calculated as below:
(6.6) CDBOD = ∑ {(𝐼𝐷𝐼𝑅𝑖𝑥𝑡 − 𝐼𝑀𝐴𝐽𝑖𝑥𝑡)2
/𝑉𝑖𝑥𝑡 }𝑛𝑖=1 / N
Where CDBOD is the cultural distance among board of directors. IDIRixt is the mean score of Hofstede’s ith
cultural dimension, attached to all directors’ respective countries in firm x and time t. IMAJixt is the Hofstede’s
score for ith cultural dimension, attached to the nationality held by the majority of board of directors, in firm
x and time t. Vixt is the in sample variance for the ith cultural dimension for firm x and time t. N is equal to 4.

Chapter 6: The Clash of Cultures and Its Effect on Firm Performance Volatility
248
Control Variables
The study controls for CEO level, board level and firm level variables.
CEO level variables:
CEO risk aversion, CEO age, CEO gender, CEO education and CEO network size are controlled for in the
analysis.
CEO risk aversion : This is proxied by CEO tenure (Berger et al., 1997; Sila et al., 2016). Berger et al. (1997)
state that longer tenures entrench CEOs and lead to less risk taking. Alternatively, Hermalin and Weisbach
(1991) affirm that longer CEO tenure is likely to reflect that CEO’s ability is above average, because if
otherwise, CEO would have been dismissed years ago due to poor performance. CEO’s high ability can be
more effective in terms of managing risk (Sila et al., 2016). Due to both these reasons, the study in hand
predicts a negative association between CEO tenure and firm risk.
CEO age: Younger managers aren’t afraid to try novel, unprecedented actions and to pursue risky strategies,
such as unrelated diversification, product innovation and financial leverage that can result with higher
growth, significant variability in sales, profitability and earnings from industry averages (Child, 1974;
Hambrick & Mason, 1984). In contrast, older executives are considered to possess less physical and mental
stamina, to grasp new ideas and to learn new behaviours (Child, 1974; Chown, 1960). Further older executives
value financial security and career security (Carlsson & Karlsson, 1970) and are committed to maintain
organisational status-quo (J. M. Stevens et al., 1978). Expected relationship between CEO age and
performance volatility, therefore, is negative.
CEO Education: Hambrick and Mason (1984) theorises that the amount of formal education enhances the
receptivity to innovation. On the other hand, they postulate that managers with less formal management
education leads to a substantial variance from industry performance averages. In a similar vein, Orens &
Reheul (2013), hypothesize that a higher education makes an executive less risk averse and better informed
about the external environment (Dollinger, 1984). Bertrand & Schoar (2003), on the other hand, empirically
studies the link between CEOs who are MBA graduates and the leverage policy and theorise that CEOs with
an MBA would generally follow aggressive policies in a firm and would resultantly have higher leverage,
supporting a positive relationship. Thus the predicted relationship between CEO education and performance
volatility is an empirical question.
CEO gender: Studies in psychology and economics literature suggest that women tend to be more risk averse
than men (Bernasek & Shwiff, 2001; Fehr-Duda et al., 2006). However most of these studies were based on
women in the general population. Deaves et al. (2009) suggest that women who are attracted to “male”
disciplines such as finance, economics and business could be more overconfident than the general female
population and that they do not show any difference in overconfidence or trading activity, when compared
to men. This could also be that the extent of risk aversion in females may diminish, once they have broken

Chapter 6: The Clash of Cultures and Its Effect on Firm Performance Volatility
249
through the “glass ceiling” (Adams & Funk, 2012; Sila et al., 2016) . The predicted sign, therefore, is an
empirical question.
CEO network size: Instrumental networks of a director are referred to as social capital and a firm can improve
its value by appointing a manager with a large social capital (Burt, 1995). In line with the notions of the
resource dependence theory, Singh (2007) posits that rich sources of both human and social capital would
position the firm better in terms of managing uncertainties. Although these authors emphasize on director
networks, the same can be applied form the context of a CEO. The predicted direction of the relationship
with performance volatility is negative.
All aforementioned CEO based data are sourced from the Boardex database.
In addition CEO power and managerial ability are also controlled for.
CEO power is proxied by CEO duality (a dummy variable that is 1 if CEO duality is present or 0 otherwise) and
is obtained from the Boardex database. Prior studies on the effect of high CEO power on firm performance
volatility yield mixed results and have been discussed under section 6.2.1.2. Thus the direction of the
relationship is an empirical question.
On the other hand, managerial ability is inferred by firm profitability as per Sila et al. (2016) (Return on Assets
calculated as earnings before tax divided by book value of total assets) and the underlying argument is that
CEO’s high ability can be more effective, in terms of managing firm risk. Thus the expected sign of the
relationship is negative.
The financial data required to operationalize managerial ability are collated from the Worldscope database.
Board characteristics
Under board characteristics, the study controls for board size measured by the number of directors on the
board and board independence measured by non-executive directors as a proportion of total directors (Cheng,
2008; Sila et al., 2016; Wang, 2012).
Board size: The effect of board size on firm performance volatility can be interpreted based on agency and
non-agency perspectives and full description is included in section 6.2.1.2. Alternative views produce
contradictory results thus the ultimate direction of the relationship is an empirical question.
Board independence: The presence of independent directors can result in a more shareholder focused board
(Fama & Jensen, 1983), which could lead to higher risk taking (Sila et al., 2016). Conversely, Independent
directors, in general, would not collude with the CEO /top management or the inside directors, are more
likely to raise questions and be vigilant about the behaviour of the management (Carter et al., 2003).
Therefore the management is unable to involve in value destroying risky ventures, subsequently resulting
with less volatile performance. Furthermore, outside directors may foster a bias against projects with high

Chapter 6: The Clash of Cultures and Its Effect on Firm Performance Volatility
250
performance volatility, even though its net present value may be positive, due to the negligible equity stake
they hold in the focal firm and the large reputation cost that they would have to bear if the project fails
(Eisenberg et al., 1998). A comprehensive discussion on board independence is included in section 6.2.1.2.
The predicted direction of the relationship is an empirical question.
The data on the number of directors on the board and the number of non-executive directors in each firm for
each year are collated from the Boardex database.
Firm and industry characteristics
Firm size: Larger firms, in general, can be assumed as matured or well-established, and expected to have less
performance volatility (Cheng, 2008). Firm size, on the other hand, can also act as a proxy for the complexity
of a firm that may contribute to increased performance volatility (Sila et al., 2016; Wang, 2012). The study
operationalizes firm size by the number of employees and controls its effects on the outcome variable. The
expected sign is an empirical question.
Firm leverage: This is measured as total debt as a proportion of total assets at book value. This is also a proxy
for firm complexity as well as a determinant of risk (Sila et al., 2016). On one hand, higher leverage may
encourage the manager to take more risks, in order to transfer wealth from bondholders to stockholders
(Jensen, 1986; Jensen & Meckling, 1976). On the other hand, the increased financial distress costs and
possible bankurptcy related costs that are associated with high leverage may hinder managers from involving
in high risk ventures. Again, the ultimate direction of the relationship is an empirical question.
Firm growth opportunities and investment: As Guay (1999) points out, firms with greater growth options
and investment opportunities are likely to take more risks. Thus growth opportunities (proxied by market to
book ratio as per Wang, 2012; Giannetti and Zhao, 2015) and firm investment (measured by capital
expenditure scaled by total assets) are also controlled for (Sila et al., 2016). The study predicts a positive
relationship between the said variables and firm performance volatility.
Industry Dummies: In order to account for industry-specific factors that would drive firm volatility, the model
includes industry dummies.
The data required for operationalizing firm/ industry level variables are obtained from the Worldscope
Database.

Chapter 6: The Clash of Cultures and Its Effect on Firm Performance Volatility
251
6.5 Methodology
6.5.1 Model Specification
(6.7) Volatility in Corporate Performanceit = β0 + CEO_board cultural distanceit + CEO_stakeholder
cultural distanceit + Within-board cultural distanceit +
CEO controlsit + Board controlsit + Firm controlsit +
Industry fe + Country fe + Year fe
where i =firm and t=year.
Cultural distances among the CEO, board of directors and stakeholders (proxied by the nationality of where
the firm’s head-office is located) are calculated as detailed above. Within a firm, cultural distances can vary
with the time t, as CEO’s and directors may change. However this is sporadic. Wooldridge (2002) states that
for the fixed effects to capture the time invariant feature for the same individual, the independent variable
should be different across time. However, if the independent variable is constant across time, the effect of
this variable cannot be distinguished from the fixed effect. According to Hermalin & Weisbach (1998) board
structure is relatively persistent. Thus only include industry, country and time fixed effects are included but
not firm fixed effects (see Hermalin and Weisbach, 1991; Coles, Daniel and Naveen, 2008; Wang, 2012;
Giannetti and Zhao, 2015 for similar arguments).
6.5.2 Preliminary Tests
Table 6.3 denotes pairwise correlations and Variance Inflation Factors (VIF). A low positive correlation (42%)
can be seen between board size and firm size. However no multicollinearity is detected among any of the
variables under consideration, as variance inflation factors for all variables are well below the cut off
threshold of 10 (Hair et al., 2010). Therefore, the low correlation between board size and firm size is ignored
as it is not severe enough to warrant corrective measures.

Chapter 6: The Clash of Cultures and Its Effect on Firm Performance Volatility
252
Table 6.3: Pairwise Correlation Matrix and Variance Inflation Factors among Main Independent Variables
1 2 3 4 6 7 VIF
1 CEO_bod_HOF 1
1.15
2 CEO_stk_HOF 0.2502* 1
1.18
(0.0000) (0.0000)
3 Within_HOF 0.0161 0.0050 1
1.05
(0.2360) (0.7310)
4 roa 0.0268 -0.0044 0.0180 1
1.16
(0.2450) (0.7880) (0.4510)
6 ceo tenure -0.0472* -0.0073 0.0006 0.0522* 1
1.11
(0.0010) (0.4680) (0.9660) (0.0020)
7 ceo age -0.0330 0.0076 -0.0433* -0.0268 0.3689* 1 1.08
(0.0230) (0.4580) (0.0040) (0.1100) (0.0000)
8 No_quals -0.0274 -0.0236 0.1015* -0.0483* -0.0939* -0.0836* 1.14
(0.0560) (0.0190) (0.0000) (0.0030) (0.0000) (0.0000)
9 CEO_net -0.0390* 0.0110 0.0078 -0.0088 -0.0475* -0.0174 1.13

Chapter 6: The Clash of Cultures and Its Effect on Firm Performance Volatility
253
(0.0060) (0.2740) (0.5950) (0.5900) (0.0000) (0.0900)
10 Tot_dir -0.1418* -0.0052 -0.0552* 0.0597* -0.0824* 0.1109* 1.14
(0.0000) (0.6030) (0.0000) (0.0000) (0.0000) (0.0000)
11 Board_ind 0.0458* -0.0204 0.0287 0.0463* -0.0599* -0.0150 1.24
(0.0010) (0.0420) (0.0340) (0.0020) (0.0000) (0.1440)
12 No_emp -0.0626* 0.0043 -0.0299 0.0223 -0.0462* 0.0642* 1.14
(0.0000) (0.6840) (0.0400) (0.1540) (0.0000) (0.0000)
13 firm growth -0.0078 -0.0032 -0.0001 0.1451* -0.0051 0.0088
1.12
(0.5830) (0.7650) (0.9970) (0.0000) (0.6310) (0.4170)
14 firm lev -0.0339 0.0151 0.0044 -0.1187* -0.0644* -0.0148 1.04
(0.0150) (0.1490) (0.7560) (0.0000) (0.0000) (0.1670)
15 firm inv -0.0118 -0.0125 0.0002 0.0194 -0.0036 -0.0181 1.07
(0.3980) (0.2330) (0.9870) (0.2010) (0.7290) (0.0920)
8 9 10 11 12 13 14 15
8 No_quals 1

Chapter 6: The Clash of Cultures and Its Effect on Firm Performance Volatility
254
9 Ceo_net 0.2462* 1
(0.0000)
10 Tot_dir 0.1240* 0.1684* 1
(0.0000) (0.0000)
11 Board_ind 0.0869* 0.1651* -0.2217* 1
(0.0000) (0.0000) (0.0000)
12 No_emp 0.0813* 0.1490* 0.4211* 0.0450* 1
(0.0000) (0.0000) (0.0000) (0.0000)
13 firm growth 0.0049 -0.0062 -0.0080 -0.0011 0.0063 1
(0.6440) (0.5590) (0.4100) (0.9140) (0.5310)
14 firm lev 0.0356* 0.0543* 0.0680* -0.0385* 0.0555* 0.0200 1
(0.0010) (0.0000) (0.0000) (0.0000) (0.0000) (0.0420)
15 firm inv -0.0044 -0.0337* -0.0010 0.0040 -0.0037 0.0011 0.0736* 1
(0.6720) (0.0010) (0.9160) (0.6830) (0.7090) (0.9130) (0.0000)
Note: * denotes statistical significance at the 1% level. T statistics are in parentheses. A definition of all variables is included in Appendix C.

Chapter 6: The Clash of Cultures and Its Effect on Firm Performance Volatility
255

Chapter 6: The Clash of Cultures and Its Effect on Firm Performance Volatility
256
Most of the panel unit root (stationarity) tests available in the “Stata” statistical software, require datasets
to be strongly balanced. Thus, the original unbalanced dataset employed in this study, is balanced in order to
run panel unit root tests114. Levin-Lin-Chu (LLC) test was first applied for a balanced set of data, to examine
whether within-firm, over-time variability of corporate performance (measured by annualized standard
deviation of monthly stock returns over a period of 12 months) contains a unit root. A trend is included,
assuming a linear time trend in the model that describes the process by which the series is generated. The
test involves fitting an augmented Dickey–Fuller regression for each panel. To estimate the long-run variance
of the series, ‘xtunitroot’ command in Stata by default uses the Bartlett kernel using 10 lags as selected by
the method proposed by Levin, Lin, and Chu (2002). The demean option is also used to xtunitroot, to remove
cross-sectional means from the series to mitigate the effects of cross-sectional correlation. The Levin–Lin–
Chu bias-adjusted t statistic is −34.57, which is significant at all the usual testing levels. This presents
overwhelming evidence against the null hypothesis, which states the series contains a unit root and accept
the alternative hypothesis that validates the series is stationary. Unit root tests are done for alternative
corporate performance volatility measures, all independent and control variables (see table 6.4). The findings
reject the null of unit roots for all variables at 1% level.
LLC test requires the ratio of the number of panels to time periods to tend to zero asymptotically. Therefore,
one can argue that it is not suitable for large datasets with a greater number of panels and relatively less time
periods (Stata, n.d.). Therefore, a Harris-Tzavalis (HT) test is also carried out in addition to LLC tests for all
aforementioned variables. HT test assumes the number of panels tends to infinity while the number of time
periods is fixed (Stata, n.d.). The point estimates of ρ and the z statistics for each test are indicated, which are
significant at 1% level in almost all instances. In very few cases, the statistic is significant at either 5%
(indicated as **) or 10% (indicated as *) levels, inferring that the null hypothesis which suggests that “panels
contain unit roots” can be rejected. Put differently, the results suggest that the series is stationary.
114 Xtbalance command in Stata has been run for each variable to balance the dataset, to take into account the maximum number of observations for each variable.

Chapter 6: The Clash of Cultures and Its Effect on Firm Performance Volatility
257
Table 6.4: Panel Unit Root Tests
Panel A Dependent Variables
SD_Mnthly SD_Qtrly
Levin-Lin-Chu Test -34.57 -36.20
Harris-Tzavalis Test - ρ 0.12 -0.03
z statistic -34.01 -47.14
No. of firms 548 548
No. of years 14 14
Panel B Independent Variables
CEO_bod_Hof_KSI CEO_stk_Hof_KSI Within_Hof_KSI CEO_bod_Sch_KSI CEO_stk_Sch_KSI Within_Sch_KSI
Levin-Lin-Chu Test -28.31 -41.54 -280.00 -19.61 -61.75 -8.72
Harris-Tzavalis Test - ρ 0.50* 0.48 0.44 0.50** 0.39 0.19
z statistic -1.31 -3.14 -3.79 -1.64 -9.4 -14.92
No. of firms 156 333 144 171 333 154
No. of years 14 14 14 14 14 14
CEO_bod_GLB_KSI CEO_stk_GLB_KSI Within_GLB_KSI CEO_bod_Hof_SEI CEO_stk_Hof_SEI Within_Hof_SEI

Chapter 6: The Clash of Cultures and Its Effect on Firm Performance Volatility
258
Levin-Lin-Chu Test -9.62 -8.77 -73.35 -18.21 -25.36 -21.29
Harris-Tzavalis Test - ρ 0.47 0.47 0.33 0.47 0.49 0.33
z statistic -2.83 -3.95 -8.82 -2.56 -2.94 -8.78
No. of firms 163 333 148 156 333 144
No. of years 14 14 14 14 14 14
CEO_bod_Sch_SEI CEO_stk_Sch_SEI Within_Sch_SEI CEO_bod_GLB_SEI CEO_stk_GLB_SEI Within_GLB_SEI
Levin-Lin-Chu Test -4.53 -63.65 -7.49 -6.88 -10.96 -10.66
Harris-Tzavalis Test - ρ 0.48** 0.39 0.20 0.45 0.48 0.21
z statistic -2.31 -9.21 -14.68 -3.65 -3.14 -13.92
No. of firms 171 333 154 163 333 148
No. of years 14 14 14 14 14 14
Panel C Control Variables
ROA CEO_tenure CEO_age No_quals CEO_networks Tot_Dir
Levin-Lin-Chu Test -8.35 -63.12 -130.00 -180 -99.73 -36.55
Harris-Tzavalis Test - ρ 0.12 0.48 0.42 0.49 0.54 0.36
z statistic -7.40 -3.25 -6.78 -2.44 0.79 -13.94
No. of firms 26 300 292 300 333 548
No. of years 14 14 14 14 14 14

Chapter 6: The Clash of Cultures and Its Effect on Firm Performance Volatility
259
Board_Indep No_emp Firm growth Firm_lev Firm_Inv
Levin-Lin-Chu Test -19.91 -2.02* -16.45 -10.9 -11.15
Harris-Tzavalis Test - ρ 0.41 0.70 0.26 0.34 0.19
z statistic -10.46 5.03 -13.18 -6.09 -10.87
No. of firms 548 73 128 81 79
No. of years 14 14 14 14 14
Note: Panel unit root tests are applied for balanced subsets of the sample. Panel A, B, C indicate the test results for dependent, main independent and control variables respectively. Precisely, panel A includes alternative dependent variables. Panel B includes distance variables calculated using alternative cultural frameworks (schwartz and GLOBE) and alternative measures of cultural distance (Standard Euclidean index). Test statistics for both Levin-Lin-Chu and Harris-Tzavalis tests are given. The bias adjusted t statistic for Levin-Lin_Chu (LLC) test is shown in the 1st row of each table and the large negative values generated by LLC test imply the rejection of the unit root for all variables at 1% significance level. In the Harris-Tzavalis test, the point estimate of ρ and the z statistic is given. All of the values are statistically significant, suggesting that Ho "panels contain unit roots" can be rejected. * and ** indicate significance at 10% and 5% levels respectively, only in very limited instances. All other figures are statistically significant at 1% level and is not asterisked for brevity. All variables are defined in Appendix C.

Chapter 6: The Clash of Cultures and Its Effect on Firm Performance Volatility
260
Pesaran’s (2004) cross-sectional dependence test indicates that the residuals are not correlated across
entities. However, the modified Wald test implies the presence of group-wise heteroscedasticity115 terms in
our fixed effect regression model. Wooldrige’s (2002) test denotes the presence of first order serial
correlation in the error term. Thus, to overcome the issues of heteroscedasticity and serial correlation,
Generalized Least Squares (GLS) regression is employed to estimate the above models.
Generalized Least Squares (GLS) Regression
Gauss-Markov theorem suggests that if a certain set of assumptions are met, Ordinary Least Squares (OLS)
estimate for the regression coefficients give the best linear unbiased estimates (BLUE) as possible. The set of
assumptions are summarized by Wooldridge (2009) as follows:
The parameters that are being estimated using the OLS should be linear
Data must have been randomly sampled from the population
The independent variables being calculated are not perfectly correlated with each other
The error has an expected value of zero given any values of the independent variable. In other words,
E(u| x1, x2, ……..xk) = 0
The error has the same variance given any value of the explanatory variables. In other words,
Var(u| x1, x2, ……..xk) = σ2
The population error u is independent of the explanatory variables x1, x2,……., xk and is normally
distributed with zero mean and variance σ2 : u ~ Normal (0, σ2).
However, these assumptions may not always hold true in all situations. For instance, the preliminary tests
conducted in this study indicate the presence of group-wise heteroscedasticity in the data. When the
assumption of constant variance is not met, one possible solution is to transform the data (e.g.: taking the
log value of the dependent and independent variables), to achieve constant variance. A second approach is
to employ GLS, which is a modification of OLS that takes into account the inequality of variance in the
observations. Wooldrige (2009) explains this process as follows:
Assuming that x denotes all explanatory variables:
(6.8) Var(u| x) = σ2 h(x),
where h(x) = some function of the independent variables that determines heteroscedasticity. As variances
should be positive, h(x) >0 for all possible values of the explanatory variables. Assuming that h(x) is known
115 The error process may be homoscedastic within cross-sectional units, but its variance may differ across units. This condition is known as group-wise heteroscedasticity (Baum, 2001) .

Chapter 6: The Clash of Cultures and Its Effect on Firm Performance Volatility
261
and population parameter σ2 is unknown, it can still be estimated from a data sample. For a random drawing
from the population, the following can be written:
(6.9) σi2 = Var (ui | xi) = σ2 h(xi),= σ2hi
where xi indicates all independent variables for observation i and hi changes with each observation because
the explanatory variables change across observations.
Let’s assume the following regression equation,
(6.10) Yi = β0 + β1xi1 + β2xi2 +……+ βkxik +ui
that contains heteroskedastic errors. It then needs to be transformed into an equation with homoscedastic
errors. As hi is a function of xi, ui / √hi has an expected value of zero, conditional on xi. Also as Var (ui |
xi)=E(u𝑖2|xi) = σ2hi, the variance of ui /√hi (conditional on xi) is σ2:
(6.11) E[(ui / √hi )2] = E(𝑢𝑖2) / hi = (σ2hi) / hi = σ2
By dividing the equation 6.10 by√hi, the following can be obtained:
(6.12) Yi / √hi = β0 / √hi + β1(xi1 / √hi ) + β2 (xi2 / √hi ) +……+ βk (xik / √hi) + (ui / √hi )
or:
(6.13) 𝑌𝑖∗ = β0 𝑥𝑖0
∗ + β1𝑥𝑖1∗ + ……+ βk𝑥𝑖𝑘
∗ +𝑢𝑖∗
Where 𝑥𝑖0∗
= 1/√hi and all other starred variables indicate the corresponding original variables divided by √hi.
Although the equation in (6.13) may look unusual, it has been derived to obtain estimators of the β i that
contains better efficiency properties than OLS. Equation (6.13) has linear parameters, and the random
sampling assumption has not been changed. Further 𝑢𝑖∗ has a zero mean, a constant variance and is
conditional on 𝑥𝑖∗
. Thus, if the original equation satisfies the first four Gauss-Markov assumptions, then the
transformed equation (6.13) satisfies the first four plus the fifth assumption. Therefore, the parameters in
equation (6.13) can be estimated using OLS. However β0
∗, β
1
∗, β
𝑘
∗ will be different from the OLS estimates in
the original equation (6.10), as they are examples of generalized least squares estimators. In this scenario,
GLS estimators are used to address heteroscedasticity in the errors.
In the above illustration, it was assumed that the exact form of heteroscedasticity is known. However, when
the exact form of heteroscedasticity in unknown, feasible generalized least squares (FGLS), a variant of GLS
can be employed, as in the context of this study.
The Wooldridge (2002) test conducted under preliminary investigations of the study in hand denotes the
presence of first order serial correlation in the error term. This can be written as:

Chapter 6: The Clash of Cultures and Its Effect on Firm Performance Volatility
262
(6.14) Ut = put-1 + et, for all t=1, 2, ….
As ut has a zero-mean conditional on x, in the following analysis, conditioning on x is made implied in order
to simplify the notation. Thus, the variance of ut can be written as follows:
(6.15) Var(ut) = 𝜎𝑒2 / (1- ρ 2),
Considering a case of single independent variable:
(6.16) Yt = β0 + β1xt + ut , for all t =1, 2,….,n.
The problem in this equation is the serial correlation in ut. Therefore, the equation should be transformed to
eliminate serial correlation. For t ≥ 2, the following can be written:
(6.17) Yt - 1 = β0 + β1xt -1 + ut - 1 ,
(6.18) Yt = β0 + β1xt + ut* ,
Now, if the first equation is multiplied by ρ and it is subtracted from the second equation:
(6.19) Yt - ρy t-1 = (1- ρ) β0 + β1 (xt - ρ x t-1)+ et , t ≥ 2
When we use the fact that et = ut - ρ u t-1, we can write the following:
(6.20) �̃�t = (1 – ρ) β0 + β1 �̃�t + et , t ≥ 2
The residual terms in equation (6.20) are serially uncorrelated and satisfies all of the aforementioned Gauss-
Markov assumptions. Therefore, if ρ is known, β0 and β1 can be estimated by regressing �̃�t and �̃�t, provided
the estimated intercept is divided by (1 – ρ).
The OLS estimators from equation (6.20) is not quite BLUE, because the first time period is not used. This can
be rectified by writing the equation for t = 1 as,
(6.21) Y1 = β0 + β1x1 + u1* ,
As each et is uncorrelated with u1, the equations (6.20) and (6.21) can be added and still have serially
uncorrelated errors. However, using (6.15), Var(u1) = σ𝑒2 / (1- ρ 2) > σ𝑒
2 = Var(et), equation (6.15) clearly does
not hold when | ρ | ≥ 1, Therefore equation (6.21) is multiplied by (1- ρ 2)1/2, to get errors with the same
variance:
(6.22) (1- ρ 2)1/2 y1 = (1- ρ 2)1/2 β0 + β1 (1- ρ 2)1/2 x1 + (1- ρ 2)1/2 u1
or
(6.23) �̃�1 = (1- ρ 2)1/2 β0 + β1 �̃�1 + �̃�1,

Chapter 6: The Clash of Cultures and Its Effect on Firm Performance Volatility
263
where �̃�1 = (1- ρ 2)1/2 u1, �̃�1 = (1- ρ 2)1/2 y1, and so on. The error in equation (6.23) has a variance var(�̃�1) = (1- ρ 2)
var(u1) = σ𝑒2
. Therefore, we can use equation (6.23) and (6.20) in an OLS regression. This generates BLUE
estimates for β0 and β1. This is an example of a GLS estimator in the presence of serial correlation. Unless ρ =
0, the GLS estimator, or put differently the OLS on the transformed data will be different from the original
OLS estimator in general. The GLS estimator is BLUE and as the errors of the transformed equation are serially
uncorrelated and homoscedastic, t and F statistics from the transformed equation are valid (Wooldrige,
2009).
6.6 Findings
This section commences with some preliminary findings, followed by findings of GLS regressions. Alternative
dependent variables are used in the GLS regression model to improve robustness and the findings are
revealed in the latter part of the section. As the sample firms represent varying industries and varying
European markets, at various stages of the business cycle, it is highly likely for the in-sample volatility
distribution to be heterogeneous. Therefore, once the association between cultural distances and stock
performance volatility is established, the study also examines whether the effect of cultural distances would
remain the same among all firms in the sample, i.e. among highly volatile firms, moderately volatile firms and
comparably stable firms. To investigate the possible heterogeneous effect of cultural distances on
performance volatility, quantile panel regression method is employed in the last subsection. This also aids in
overcoming the illusion of linearity as explained by Shenkar (2001), discussed in section 6.2.3.3.
6.6.1 Preliminary Findings
Table 6.5 denotes summary statistics. It indicates that the average monthly stock performance volatility is
about 30%. Further CEO characteristics portray that the average age of a CEO is about 53 years old and on
average hold 2 educational qualifications (undergraduate and above) at the selected annual report date. Also
they have about six years previous work experience as CEOs. Board characteristics reveal that an average
board comprises about 10 directors in sample firms. Jensen (1993) suggests that the ideal size of the board
should be about 7 or 8 directors. Moreover, panel D illustrates that the average number of employees in
sample firms is very large (about 23,600). The large board size and the number of employees taken together
may imply that the sample is biased towards larger firms. This issue is taken into account in section 6.7.6 –
Addressing Sample Selection Bias.

Chapter 6: The Clash of Cultures and Its Effect on Firm Performance Volatility
264
Table 6.5: Summary Statistics
N Mean SD p25 p50 p75
Dependent Variable
Stk. Perf. Volatility
Monthly 11900 0.309 0.194 0.197 0.268 0.378
Quarterly 11900 0.492 0.380 0.252 0.413 0.635
Distance Measures
CEO_bod_Hof 5681 0.674 1.414 0.050 0.170 0.468
CEO_stk_Hof 9959 0.131 0.581 0.061 0.122 0.334
Within_Hof 5431 0.218 0.642 0.100 0.167 0.292
CEO Characteristics
ROA 4399 0.057 0.191 0.031 0.070 0.111
surp_cash 10536 0.035 0.170 0.008 0.039 0.077
ceo_tenure 9904 6.355 6.694 1.800 4.300 8.400
ceo_age 9482 53.601 7.410 49 53 58
no_quals 9905 1.708 1.155 1 2 2
ceo_networks 9959 723.498 1189.289 83 288 843
Board of Director Characteristics
tot_directors 11900 9.694 4.111 7 9 11

Chapter 6: The Clash of Cultures and Its Effect on Firm Performance Volatility
265
board_indep 11900 0.476 0.223 0.333 0.500 0.625
Firm Characteristics
no_emp 10199 23592.18 58350.56 847 3997 16297
firm_growth 10482 0.146 9.323 0.014 0.053 0.091
firm_lev 10734 0.247 0.217 0.100 0.227 0.352
Firm_inv 10638 0.046 0.056 0.014 0.032 0.059
Note: This table reports the summary statistics for alternative dependent variables, distance measures and a range of variables relating to CEOs, board of directors and firms. The sample covers 1,190 firms from 12 different European countries for 14 years from 2005 to 2018, representing all industries but excluding ICB code 65 (utility companies) and 30 (financial companies) as per FTSE Russell Industry Classification Benchmark. All variables are defined in the Appendix C.

Chapter 6: The Clash of Cultures and Its Effect on Firm Performance Volatility
266
Appendix D depicts a breakdown of the nationalities of sample CEOs, directors and firms’ registered head-
offices. The sample consists of 12,298 directors in total, representing 90 different countries. Out of the total,
a considerable number (i.e. 2,188 which is about 17.8%) of directors are females. Yet, the proportion is
substantially below the binding quotas of female participation (about 40%) that prevails in a lot of European
countries. However, 17.8% is still fair, when compared to the female CEO proportion. Out of the total 1,566
CEOs, only 38 are females, a mere 2%. The sample CEOs represent 48 different nationalities. The stakeholder
nationality is proxied by the country of which firm’s registered head-office is located. It also denotes that firm
head-offices in the sample are spread over 29 different countries and almost all of them are in the Europe116.
6.6.2 Feasible Generalized Least Squares (FGLS) Regressions
Table 6.6 depicts the results from FGLS regression.
Table 6.6: Cultural Distance Measures and Monthly Return Volatility of Stocks
Feasible Generalised Least Squares Regressions
Dependent Variable = annualized standard deviation of monthly stock returns over a period of 12 months (SD_Mnthly)
CEO_bod_Hof -0.0143**
(0.0056)
CEO-stk_Hof 0.0522***
(0.0102)
Within_Hof 0.0028
(0.0256)
Constant 0.3340***
(0.0661)
CEO Characteristics
ceo_dual 0.0058
(0.0188)
roa -0.2140***
(0.0431)
ceo_tenure -0.0024**
116 Only seven firms in the sample has head-offices located outside Europe, viz. in Singapore, Malaysia, Israel, United Arab Emirates, Canada, Bermuda and Mexico.

Chapter 6: The Clash of Cultures and Its Effect on Firm Performance Volatility
267
(0.0011)
ceo_age 0.0003
(0.0008)
gen_dum_1 (Omitted)
gen_dum_2 0.0431
(0.0389)
no_quals 0.0081
(0.0058)
ceo_networks 0.0000
(0.0000)
Board of Director Characteristics
tot_directors -0.0005
(0.0019)
board_indep -0.0876***
(0.0300)
Firm Characteristics
no_emp -0.0000
(0.0000)
firm_growth -0.0339***
(0.0102)
firm_lev 0.0202
(0.0316)
firm_inv 0.2610***
(0.0971)
Industry FE Yes
Country FE Yes
Time FE Yes
Observations 731
Note: This table reports specification (6.7). The dependent variable is the with-in firm over-time variability in stock performance calculated as annualized standard deviation of monthly stock returns over 12 months. The coefficients are estimated based on feasible generalized least squares (FGLS) regression. Industry, country and time fixed effects are included in the model. Standard errors are shown in parentheses. *,**,*** indicate significance at the 10%, 5% and 1% level respectively. All the variables are defined in Appendix C. The number of observations are limited to 731 due to missing values.

Chapter 6: The Clash of Cultures and Its Effect on Firm Performance Volatility
268
Sphere 1: Cultural distance between board of directors and the CEO
Table 6.6 depicts the results of the Generalized Least Squares Regression method for panel data, for
specification (6.7) above. The results portray that the cultural distance between the CEO and the board of
directors (CEO_bod) is statistically significant, in driving the within-firm over-time volatility in corporate
performance.
The negative relationship between CEO-Board cultural distance and stock performance volatility advocates
that higher cultural distance between CEO and board of directors decreases the performance variability. In
fact, when cultural distance increases by one unit, the standard deviation of stock performance volatility
would decrease on average by 1.4% and this relationship is statistically significant at 5% level. This can be due
to couple of reasons. First, based on studies of board diversity, it can be assumed that increased levels of
heterogeneity (among the CEO and directors) result in less groupthink. Also, when the boards of directors are
culturally distant and different from the CEO they do not belong to “the old boys club” (Adams and Ferreira,
2009). Therefore, extending this line of thought, it could be assumed that culturally distant boards of directors
would not collude with the management and that they are more independent. Therefore, these directors are
likely to raise more questions and to be more vigilant about the behaviour of the management, relative to a
board that is culturally homogeneous to the CEO. This finding is further reinforced by Fracassi and Tate (2012)
as they affirm that close CEO-director ties encourage managers to engage in value destroying acquisitions,
leading to volatile outcomes
Adams, Almeida and Ferreira (2005) posit that if the CEO in a firm, makes most of the major decisions by
herself, the risk arising from the judgement errors is not well diversified, resulting with either very good or
very bad decisions that can be highly volatile. However, as the culturally distant board of directors, play an
active role, the CEO is unable to make the decisions single-handedly. The decisions taken by the management
will be vigorously reviewed by the board. On the other hand, culturally distant board members and the CEO,
will bring different perspectives and opinions to a strategic issue. Thus the resulting decision is a compromise,
neither very good nor bad, which reflects the different opinions of both parties (Giannetti & Zhao, 2015) and
less extreme.
Alternative interpretation
From an alternative perspective, Cook and Glass (2014), suggest that firms hire minority leaders in a symbolic
effort (tokenism), when they are generally underrepresented in the firm. Cook and Glass also affirm that such
tokens are under immense performance pressures and intense scrutiny. Finally by examining Fortune 500
companies in the US during 1996-2010, they posit that when the performance declines in a firm that is led by
a minority CEO, the minority leader is replaced by a traditional “white” leader, to whom they refer to as
“corporate saviours”.
In the context of the study in hand, CEO being culturally different from the board of directors imply several
things, i.e. either the CEO is a minority leader or the board of directors represent a minority culture. It could

Chapter 6: The Clash of Cultures and Its Effect on Firm Performance Volatility
269
also be the result of both CEO and the board representing different minority cultures. Therefore it could be
assumed that either the CEO or the board who belongs to the minority, or even both parties, are under
immense performance pressures from the shareholders. Thus the minority party would be biased against
projects with a high variance, even if the net present value of the project is positive. As they are under
immense scrutiny, they would be highly concerned about their reputation and would pick safe projects with
stable returns, resulting with less variability in performance. This situation will be aggravated if the board
represents the minority culture. This is because the outside directors in the board, generally own negligible
shareholding in a firm and even if the project succeeds, their share of the gain would be limited (Eisenberg et
al., 1998). Thus, outside directors would be generally biased against risk taking, which may be exacerbated
due to intense performance pressures.
Sphere 2: Cultural distance between the stakeholders and the CEO
Table 6.6 indicates that the distance between the CEO and stakeholders (CEO_Stk) is positively associated
with the firm’s stock performance volatility. In other words, when the cultural distance between the CEO and
stakeholders increase by one unit, on average, the annualized standard deviation of firm’s monthly stock
return increases by 5.2%, when all other variables are held constant. This relationship is statistically significant
at 1%.
This validates our claim that a higher cultural distance between the CEO and stakeholder groups would result
in miscommunication and misunderstandings and a disarray of preferences between the CEO and stakeholder
groups that may eventually result with CEOs making unpredictable decisions. Also greater cultural distance
would induce stakeholders to perceive the CEO as distant, in a psychic evaluation and would foster mistrust.
Put differently, the results suggest that stakeholders prefer leaders with greater cultural affinity (Ferris,
Jayaraman and Zhang, 2017). Besides, McPherson, Smith-Lovin and Cook (2001) in their study on homophily
principle, posit that homophily in race and ethnicity creates the strongest divide among individuals. This is
further reinforced by several prior research such as, for example, Kumar, Niessen-Ruenzi and Spalt (2015), as
they reveal that in US mutual funds, the annual flows to funds managed by individuals with foreign-sounding
names are 10% lower than funds managed by typical American names.
The reason for this behaviour can also be attributed to “intergroup bias” explained by Hewstone, Rubin and
Willis (2002) as “the systematic tendency to evaluate one’s own membership group (the in-group) or its
members more favourably than a nonmembership group (the out-group) or its members” (p.576). As a
consequence, out-group individuals may be trusted less, could undergo intense scrutiny and even experience
discrimination (Kumar, Niessen-Ruenzi and Spalt, 2015). In the context of a firm, Park and Westphal (2013)
applies this argument to the corner office and suggest that if a particular firm is led by a minority CEO, white
male executives in that firm or white male CEOs of other firms are highly likely to attribute any low
performance to internal factors, such as mistakes in strategic decisions or poor leadership rather than to
external factors such as unfavourable conditions in the industry environment.

Chapter 6: The Clash of Cultures and Its Effect on Firm Performance Volatility
270
A greater cultural distance between the CEO and stakeholders in the study in hand would infer that the CEO
is unarguably a foreign national, as stakeholders’ culture is proxied by the country in which the head-office
of the firm is located. Thus it could be assumed, as previously stated, that prominent national cultural
characteristics of the country where the head-office is situated are likely to be embedded to the value system
prevailing in the organization and that owing to “home-biasness” a large number of firm’s investors will share
the culture of the country where the head-office is located (Ferris et al., 2017). Thus the results suggest that
the aforementioned racial divide and intergroup bias lead stakeholders to perceive as CEOs making
unpredictable decisions.
Sphere 3: Cultural distances among board of directors
Table 6.6 indicates that the coefficient of within-board distances is positive, inferring that within-board
cultural distances among directors would result in increased within-firm over-time variability in performance.
However, the association is statistically non-significant. The positive relationship advocates the agency based
hypothesis discussed in section 6.3. For instance, this study hypothesizes that varied opinions and views
garnered as a result of within-board cultural differences, would lead to conflicts and eventually more erratic
outcomes (Bernile et al., 2018; Giannetti & Zhao, 2015) and higher performance volatility. On the other hand,
within-board conflicts would result with lack of cohesiveness which would make boards more captive to the
CEO. As a result the CEO become powerful and CEO power on performance volatility yield conflicting results.
Adams, Almeida and Ferreira (2005), in particular, affirm that when CEO power increases, most of the major
decisions would be taken by the CEO and as risk arising from the judgement error may not be well diversified,
the likelihood of either a very good or a very bad decision being taken is quite high, resulting with higher firm
performance volatility. However, CEO power is controlled for in the analysis and perhaps could be the reason
behind the statistical non-significance of the relationship. Alternatively, it could also be that cultural
diversities among board of directors are not material enough to drive firm performance volatility.
6.6.3 Alternative Dependent Variables
This section employs alternative dependent variables to specification (6.7) above for increased robustness.
Quarterly Return Volatility of Stocks
Stock performance volatility is recalculated using the annualized standard deviation of quarterly stock returns
over a period of 12 months (Cheng, 2008; Giannetti & Zhao, 2015; Sila et al., 2016; Wang, 2012). The
directions of the association remain the same while only the cultural distance between the CEO and
stakeholders evince statistical significance at just over 5% level. Within-board distances portray a negative
relationship with stock performance volatility, yet statistically non-significant. This is indicated below in table
6.7.

Chapter 6: The Clash of Cultures and Its Effect on Firm Performance Volatility
271
Table 6.7: Cultural Distance Measures and Quarterly Return Volatility of Stocks
Feasible Generalised Least Squares Regressions
Dependent Variable = annualized standard deviation of quarterly stock returns over a period of 12 months (SD_qtrly)
CEO_bod_Hof -0.0138
(0.0121)
CEO-stk_Hof 0.0463*
(0.0239)
Within_Hof -0.0934
(0.0627)
Constant 0.6860***
(0.1350)
CEO characteristics
ceo_dual -0.0467
(0.0396)
Roa -0.2650***
(0.0880)
ceo_tenure -0.0034*
(0.0019)
ceo_age 0.0006
(0.0016)
gen_dum_1 (Omitted)
gen_dum_2 0.0482
(0.1070)
no_quals 0.0084
(0.0131)
ceo_networks 0.0000
(0.0000)
Board Characteristics
tot_directors 0.0047
(0.0040)

Chapter 6: The Clash of Cultures and Its Effect on Firm Performance Volatility
272
board_indep -0.1620**
(0.0710)
Firm Characteristics
no_emp -0.0000
(0.0000)
firm_growth -0.0797***
(0.0238)
firm_lev -0.0323
(0.0625)
firm_inv 0.4320**
(0.2190)
Industry FE Yes
Country FE Yes
Time FE Yes
Observations 731
Note: This table reports specification (6.7). The dependent variable is the with-in firm over-time variability in stock performance calculated as the annualized standard deviation of quarterly stock return over 12 months. The coefficients are estimated based on feasible generalized least squares (FGLS) regression. Industry, country and time fixed effects are included in the model. Standard errors are shown in parentheses. *,**,*** indicate significance at the 10%, 5% and 1% level respectively. All the variables are defined in Appendix C. The number of observations are limited to 731 due to missing values.
Other Variables
Among CEO characteristics, managerial ability (proxied by ROA) and risk aversion (proxied by CEO tenure)
appear to be statistically significant with the expected signs. CEO tenure can also proxy CEO’s ability and
longer tenure may indicate that the ability of the CEO is above average (Arthur, 2001; Hermalin & Weisbach,
1991, 1998), because if otherwise, CEO would have been dismissed years ago due to poor performance. Thus,
negative coefficients of ROA and CEO tenure may both suggest that CEO’s high ability is capable of effectively
managing risk. Among board characteristics, only board independence evince a statistical significant effect
on performance volatility. Although the study operates with contesting hypotheses regarding board
independence, the negative association in the results implies that independent directors, in general, do not
collude with the CEO /top management or the inside directors and are more likely to raise questions and be
vigilant about the behaviour of the management (Carter et al., 2003). Therefore the management is unable
to involve in value destroying risky ventures, subsequently resulting with less volatile performance.
Furthermore, as outside directors hold negligible equity stake in a firm, they would foster a bias against risk

Chapter 6: The Clash of Cultures and Its Effect on Firm Performance Volatility
273
taking, as reputation cost that they would have to bear if the project fails, is much more significant than the
benefits that would be enjoyed, given the same project succeeds (Eisenberg et al., 1998).
As expected almost all the firm related variables appear statistically significant. Firm size evince a statistically
significant negative association with performance volatility, as larger firms, in general, can be assumed as
matured and well-established that can effectively manage firm risks (Cheng, 2008). Furthermore, larger firms
are likely to have larger boards and owing to corporate governance regulations, can consist of a higher
proportion of outside directors, who are biased against risk taking, as explained earlier. Firm investment
illustrates a positive significant association as expected whereas firm growth indicates a negative significant
relationship, against the prediction. This fact warrants further research yet falls beyond the scope of the
research in hand.
Performance Volatility in terms of Accounting Measures and Corporate Value
The left-hand side of the econometric specification (6.7) above, is replaced with the volatility in accounting
performance and corporate value. In table 6.8, the dependent variable is the with-in firm over-time variability
in accounting performance calculated as the standard deviation of the firm’s annual ROA over the sample
period and in table 6.9, the dependent variable is the with-in firm over-time variability in corporate value
calculated as the standard deviation of the firm’s annual Tobin’s Q over the sample period. To run regressions,
an approach similar to that of Cheng (2008) is followed, where all independent variables are averaged over
the sample period, so that every sample firm has one observation. The association between CEO - board
cultural distance and the volatility in accounting measures and corporate value, remain significantly negative,
possibly owing to the reasons mentioned above. The cultural distance between the CEO and stakeholders
and its association with the volatility in accounting measures and corporate value, remain positive, yet barely
significant with volatility in accounting performance. However, within-board cultural distances yield mixed
results, i.e. positively significant with the volatility in accounting performance and negatively significant with
the volatility in corporate value. This makes it difficult to gauge the true channel of influence exerted by
within-board cultural distances on the performance volatility, be it stock, accounting or corporate value.
Nevertheless, the results are indicated in table 6.8 and 6.9 below:

Chapter 6: The Clash of Cultures and Its Effect on Firm Performance Volatility
274
Table 6.8: Cultural Distance Measures and Accounting Performance
Feasible Generalised Least Squares Regressions
Dependent Variable = standard deviation of firm's annual ROA (SD_ROA) over the sample period
avg_CEO_bod_Hof -0.0032***
(0.0003)
avg_CEO_Stk_Hof 0.0017*
(0.0009)
avg_Within_Hof 0.0976***
(0.0031)
Constant 0.1010***
(0.0056)
CEO Characteristics
avg_tenure -0.0016***
(0.0001)
avg_age 0.0003***
(0.0000)
avg_quals 0.0092***
(0.0004)
avg_nworks -0.0000***
(0.0000)
Board Characteristics
avg_dir -0.0049***
(0.0002)
avg_indep -0.0928***
(0.0026)
Firm Characteristics
avg_size -0.0000***
(0.0000)
avg_growth -0.0534***
(0.0017)

Chapter 6: The Clash of Cultures and Its Effect on Firm Performance Volatility
275
avg_lev 0.0185***
(0.0026)
avg_inv 0.0375***
(0.0093)
Industry FE Yes
Country FE Yes
Observations 2,516
Note: This table reports specification (6.7). The dependent variable is the with-in firm over-time variability in accounting performance calculated as the standard deviation of the firm’s annual ROA over the sample period. The coefficients are estimated based on feasible generalized least squares (FGLS) regression. Industry and country fixed effects are included in the model. Standard errors are shown in parentheses. *,**,*** indicate significance at the 10%, 5% and 1% level respectively. All the variables are defined in Appendix C.

Chapter 6: The Clash of Cultures and Its Effect on Firm Performance Volatility
276
Table 6.9: Cultural Distance Measures and Corporate Value
Feasible Generalised Least Squares Regressions
Dependent Variable = standard deviation of the firm's annual Tobin's Q (SD_Q) over the sample period
avg_CEO_bod_Hof -0.2070***
(0.0371)
avg_CEO_Stk_Hof 0.0242
(0.0844)
avg_Within_Hof -0.5550**
(0.2740)
Constant 0.9700***
(0.3980)
CEO Characteristics
avg_tenure
-0.0505***
(0.0108)
avg_age 0.0746***
(0.0112)
avg_quals -0.2240***
(0.0484)
avg_nworks 0.0000
(0.0000)
Board Characteristics
avg_dir
-0.2650***
(0.0316)
avg_indep -0.0165
(0.3310)

Chapter 6: The Clash of Cultures and Its Effect on Firm Performance Volatility
277
Firm Characteristics
avg_size
0.0000***
(0.0000)
avg_lev -0.2790***
(0.0236)
avg_inv 0.4200
(0.0142)
Industry FE Yes
Country FE Yes
Observations 6,891
Note: This table reports specification (6.7). The dependent variable is the with-in firm over-time variability in corporate value calculated as the standard deviation of the firm’s annual Tobin’s Q. The coefficients are estimated based on feasible generalized least squares (FGLS) regression. Industry and country fixed effects are included in the model. Standard errors are shown in parentheses. *,**,*** indicate significance at the 10%, 5% and 1% level respectively. All the variables are defined in Appendix C.
6.6.4 Employing Quantile Panel Regression
The findings of the previous section portrayed how cultural distances among various key players affect the
performance volatility of a firm. However, it does not provide any information about whether the effect of
cultural distances would remain the same among all firms in the sample, i.e. highly volatile firms, moderately
volatile firms and comparably stable firms. As the sample firms represent varying industries and varying
European markets, at various stages of the business cycle, it is highly likely for the in-sample volatility
distribution to be heterogeneous. Thus we investigate the effect of cultural distance on performance volatility
by categorising the firms by their existing volatility levels and examining three groups, viz. firms that are least
volatile, most volatile and moderately volatile. How would the cultural distances between the CEO, the board
and the stakeholders affect the performance variability, in each of these three groups?
To investigate this research question, the study employs quantile panel regression method (QR) which was
introduced by Koenker & Bassett (1978) and estimate parameters that describe the 25%, median (50%) and
75% of the conditional distribution. This also aids in overcoming the illusion of linearity as explained by
Shenkar (2001), discussed in section 6.2.3.3.
Quantile regression method is an alternative to Ordinary Least Squares (OLS) regression and related methods
and is known to allow for the asymmetric association between the independent and dependent variables. It
groups the differences across the distribution of a given dependent variable rather than only at the mean.
QR models have significant advantages over Gaussian models, as the former is a semiparametric model and
will be less sensitive to the tail behaviour of the underlying random variables, representing the forecasting

Chapter 6: The Clash of Cultures and Its Effect on Firm Performance Volatility
278
variables of interest and as a result will be less sensitive to outliers. Also, controlling for individual specific
heterogeneity via fixed effects while exploring heterogeneous covariate effects within the QR framework
offers a more flexible approach to the analysis of panel data than that offered by the classical Gaussian fixed
and random effects estimators (Galvao, 2011) . A comprehensive description on quantile panel regression is
included in Chapter 5 Section 5.5.1.1.
Table 6.10 depicts the results of the quantile regression method for panel data, for specification (6.7) above
and reveals that degree of current performance volatility significantly matters, when examining the
association between cultural distance and performance volatility.

Chapter 6: The Clash of Cultures and Its Effect on Firm Performance Volatility
279
Table 6.10: Cultural Distance Measures and Monthly Return Volatility of Stocks Using Quantile
Panel Regression
Quantile Panel Regression Method
Dependent Variable= annualized standard deviation of monthly stock returns over a period of 12 months (SD_Mnthly)
(1) (2) (3)
q=0.25 q=0.5 q=0.75
CEO_bod_Hof -0.0056*** -0.0144*** -0.0136***
(0.0001) (0.0009) (0.0006)
CEO-stk_Hof 0.0317*** 0.0600*** 0.0581***
(0.0002) (0.0003) (0.0004)
Within_Hof 0.0294*** -0.0017* 0.0157***
(0.0003) (0.0009) (0.0030)
CEO Characteristics
ceo_dual 0.0074*** 0.0056*** 0.0361***
(0.0002) (0.0012) (0.0006)
Roa -0.2230*** -0.2000*** -0.5020***
(0.0015) (0.0035) (0.0027)
surp_cash 0.2150*** 0.0250*** -0.0313***
(0.0015) (0.0025) (0.0044)
ceo_tenure 0.0036*** 0.0003*** -0.0010***
(0.0001) (0.0000) (0.0001)
ceo_age -0.0008*** -0.0006*** 0.0008***
(0.0000) (0.0000) (0.0000)
no_quals 0.0020*** 0.0029*** 0.0026***
(0.0001) (0.0002) (0.0003)
ceo_networks 0.0000*** 0.0000*** 0.0000***
(0.0000) (0.0000) (0.0000)
Board Characteristics
tot_directors -0.0045*** -0.0049*** -0.0092***
(0.0000) (0.0002) (0.0001)
board_indep -0.1250*** -0.0894*** -0.1620***
(0.0004) (0.0025) (0.0026)

Chapter 6: The Clash of Cultures and Its Effect on Firm Performance Volatility
280
Firm Characteristics
no_emp -0.0000*** -0.0000*** -0.0000***
(0.0000) (0.0000) (0.0000)
firm_growth -0.0417*** -0.0338*** -0.0779***
(0.0001) (0.0002) (0.0002)
firm_lev 0.0218*** -0.0051** -0.0409***
(0.0005) (0.0026) (0.0016)
firm_inv 0.1490*** 0.1510*** 0.5770***
(0.0025) (0.0087) (0.0077)
Observations 746 746 746
Number of groups 135 135 135
Note: This table reports specification (6.7). The dependent variable is the with-in firm over-time variability in stock performance calculated as annualized standard deviation of monthly stock return over 12 months. The coefficients are estimated based on quantile panel regression, for quantiles 0.25, 0.50 and 0.75 in columns (1), (2) and (3) respectively. Standard errors are shown in parentheses. *,**,*** indicate significance at the 10%, 5% and 1% level respectively. All the variables are defined in Appendix C. The number of observations are limited to 746 due to missing values.
Table 6.10 unveils interesting results. Based on quantile panel regressions, all three cultural distance spheres
seem to statistically significantly affect the firm performance volatility at all quantiles 0.25, 0.5 and 0.75. The
cultural distance between the CEO and the board of directors evince to have a negative association with firm
performance variability at all quantiles, reinforcing our previous findings. Moreover, the association between
CEO-stakeholders sphere and performance volatility, remains positive, implying that a greater distance
between the CEO and stakeholders, in terms of their cultural backgrounds, generates volatility in firm stock
performance, irrespective of the current variability in performance. The remarkable finding is associated with
the last sphere, i.e. cultural distances within board of directors. Interestingly, the results suggest that cultural
distances within board, contributes towards increased within-firm over-time variability, only in highly volatile
firms (q=0.75) and in comparably stable firms (q=0.25). Conversely in moderately volatile firms (q=0.5),
within-board cultural differences help to lower firm performance variability.
Stahl and Tung (2015), stress that cultural distance has been overly emphasized as a negative factor, that
associates with concepts such as “foreignness”, “unfamiliarity costs”, “institutional gaps”, “culture novelty”,
“cross-cultural miscommunications” and so on (p.392) in the context of multinational organisations. However
based on resource dependence view and learning theories, cultural differences can be viewed as an
opportunity rather than a threat, as it introduces adaptability, increased creativity, problem-solving skills
(Adler, 2003), builds on employees’ strengths and may generate a competitive advantage through nurturing
feelings of inclusion, of both minority and nonminority employees (F. G. Stevens et al., 2008). Thus based on
empirical evidence, it can be implied that cultural differences would foster increased creativity and problem
solving skills to generate a competitive advantage in moderately volatile firms (represented by the median of
the performance volatility distribution).

Chapter 6: The Clash of Cultures and Its Effect on Firm Performance Volatility
281
On the other hand, low volatile firms have stronger operating performance (Dutt & Humphery-Jenner, 2013).
Thus the benefits of cultural distances among board of directors appear to be trivial and play a peripheral
role in these firms. Instead, in such firms, director cultural distances may work in the opposite direction.
Cultural distances may aggravate conflicts among the directors that would result in more erratic decisions in
the firm, ultimately increasing the performance volatility. Within-board cultural distances apparently play a
similar role in highly volatile firms. In highly volatile firms, directors’ conflicts and miscommunications may
have an amplified effect on the volatility.
Thus the empirical evidence suggests that the benefits of within-board cultural distances, as proposed by the
resource dependence perspective, can only be reaped by firms with moderate performance volatility levels,
as the extra social and human capital that would be brought in to the firm by culturally diverse directors,
would help to position the firm better in terms of managing risks in moderately uncertain environments. In
low and highly volatile firms, the costs outperform the benefits.
6.7 Robustness Tests
6.7.1 Addressing Possible Endogeneity Issues
Board characteristics are not exogenous variables (Hermalin & Weisbach, 2003), instead they are selected by
firms “to suit their operating and information environments and the bargaining power of various stakeholders
in the firm” (Sila et al., 2016, p.29). For instance, Fama and Jensen (1983) elucidate that the scope and
complexity of firms affect board characteristics. Adams and Ferreira, (2007) explicate the paradoxical
situation faced by the CEO and the top management, where they encounter a trade-off in revealing sensitive
firm information to the board of directors for the fulfilment of board advisory role against concealing the
same in order to elude intense board monitoring. Hermalin and Weisbach (1998) illustrate how the CEO
would tackle this issue by using the bargaining power over the board selection process. On the other hand,
neither do CEOs and firms match randomly but firms may select CEOs to match the values of the existing
leadership (Pan et al., 2017).
Cultural distances can only be operationalized if one of the three parties in this study (viz. the CEO, board of
directors and stakeholders) or more, represent a foreign cultural background. Owing to the rise in
international migration, economic globalisation and the intense public pressure to increase workplace
diversity, the likelihood of the sample firms having a foreign CEO or board member is very high. Therefore
when estimating the association between cultural distances and performance volatility, it is imperative to
consider the fact that the appointment of a foreign CEO or a director is a choice made by the firm and
therefore endogenous. Therefore, to accurately estimate the relationship, at least two alternative
explanations need to be considered, i.e. the association is driven by omitted variables or by reverse causality.

Chapter 6: The Clash of Cultures and Its Effect on Firm Performance Volatility
282
- Omitted unobserved factors
Unobserved omitted variables are those factors that can affect both the dependent variable (i.e. performance
volatility in this context) and the independent variables (viz. the selection of a foreign CEO / board of
directors, in the context of this study). Sila et al. (2016) identify two such omitted variables in their study of
board room gender diversity and firm risk, which are corporate social responsibility (CSR) and managerial
ability. These two variables can act as omitted variables, even in the present context, and is explained below.
Channels through which CSR can affect firm risk (outcome) and the selection of foreign CEOs / board of
directors (predictor) are as follows. CSR can affect firm risk in several ways. Firstly, by increasing CSR, the firm
can foster a sound relationship with its stakeholders that would increase firm legitimacy while reducing firm
specific risk (Sila et al., 2016). Secondly, it would reduce the sensitivity of firm performance to economic
fluctuations, due to increased customer loyalty (Albuquerque et al., 2014). Thirdly, socially responsible firms
are perceived to be better managed and thus less risky (McGuire et al., 1988) . On the other hand, CSR can
also affect the selection of foreign (minority) CEOs and directors, as follows: Firstly on the demand side,
socially responsible firms tend to appoint more minority executives and directors to increase firm legitimacy.
Secondly, foreign executives and minority participation in the boardroom is one way of evaluating the firm in
terms of CSR. On the supply side, firms with a sound CSR agenda may be more appealing to foreign CEOs /
directors, and consequently they would self-select to firms with higher CSR activities.
On the other hand, managerial ability can also affect the firm risk and the selection of minority directors, as
follows. Firstly, CEO’s ability is imperative in terms of managing firm risk effectively and secondly managers
with high ability are likely to possess high power (Hermalin and Weisbach, 1998) and they are also more likely
to exercise their bargaining power over the board selection process, especially to escape excessive
monitoring. As culturally distant directors are considered to be effective monitors (as discussed above),
powerful CEOs would prefer less foreign participation in boardroom.
Although prior scholars have used various proxies, as in the present study, managerial ability is discernibly
extremely hard to measure, thus qualifies as an unobserved variable and mostly omitted from econometric
models. In terms of CSR, despite the existence of some quantitative and measurable indicators of social
performance, these measures predominantly rely on voluntary disclosure by firms and therefore may be
unreliable indicators of a firms’ actual engagement of CSR (Sila et al., 2016; Ullmann, 1985). Sila et al. (2016)
further explain that CSR data may only be available to a subset of firms and that CSR itself could be an
endogenous variable determined by other factors (Campbell, 2007; Sila et al., 2016). Thus factors moulding
a firm’s CSR agenda are not readily observable and are therefore generally omitted from empirical models.
The usual academic response to address omitted variable bias is the employment of a fixed effect estimator
that may not be adequate due to the existence of another form of bias, i.e. reverse causality.

Chapter 6: The Clash of Cultures and Its Effect on Firm Performance Volatility
283
- Reverse Causality
In the context of this study, it is hypothesized that cultural distances among the key players would affect
performance volatility. However as explained previously, cultural distances can only be operationalized if the
firm appoints culturally diverse directors or a CEO. Thus, can the causality run in the opposite direction? Put
differently, can firm performance volatility levels govern the CEO or board selection process? This occurrence
is known as reverse causality.
Previous studies illustrate that national cultures affect firm risk taking. For instance, Li, Griffin, Yue, & Zhao,
(2013) posit that managers high in individualism enjoy taking risk whilst managers high in uncertainty
avoidance and harmony values are more risk averse. Therefore, in line with Farrell and Hersch (2005)
contention about female directors and firm risk (explained in section 6.2.1.2 under gender diversity), it could
be assumed that managers high in uncertainly avoidance and harmony values would self-select to firms with
low risk whilst individualistic managers would prefer firms with risky ventures. On the other hand, Lehn, Patro
and Zhao (2005) posit that when firms are encountering more uncertain prospects, they would shrink their
boards, to enhance the promptness of board decisions. The same argument can be applied in this context.
When firms are faced with more uncertain prospects, firms with more variable performance would choose
to have a homogeneous board to speed up decision making, achieve unity of command and reduce potential
conflicts. This implies that the current boardroom representation or CEO positions by culturally diverse
individuals (hereafter referred to as foreign appointments) may be influenced by firm risk, implying reverse
causality.
Furthermore Wintoki, Linck and Netter (2012) posit that reverse causality issues in governance research tend
to be of a dynamic nature, i.e. the current foreign appointments are influenced by past realization of firm
risk. This is known as dynamic endogeneity. This is because the appointment decision is made before the next
realization of firm risk. Past risk measures will be incorporated in the information set deliberated by the
incumbent board when making appointment decisions.
- Identification Strategy
In order to account for the unobserved heterogeneity and reverse causality in a dynamic nature, explained in
the previous section, a dynamic empirical model is developed in this section.
As already established foreign appointment as a CEO or a director is a choice variable that can be determined
by board characteristics, firm characteristics, other unobserved and therefore omitted variables from the
model and past realisations of firm performance volatility levels. This can be formally written as:
(6.24) Foreign appointment it = f(Xit , Performance Volatility i t-1 , Performance Volatility i t-2 ,
Performance Volatility i t-p , µi,)

Chapter 6: The Clash of Cultures and Its Effect on Firm Performance Volatility
284
The matrix Xit indicates other factors that determine the appointment of a foreign CEO (board member).
Performance Volatilityi t-1, Performance Volatilityi t-2, Performance Volatilityi t-p represent the past
performance volatility levels at lag 1, 2 and p. µi are time invariant unobserved heterogeneity.
These variables can also be correlated with the current level of performance volatility (Brown et al., 2009;
Wintoki et al., 2012). Thus, to accurately assess the relationship between cultural distances and firm
performance volatility, all these variables need to be included in the model and should be written as follows:
(6.25) Performance Volatilityi,t = + β Distance measures (arising from
foreign appointments) +
Xit γ ∑ (δ𝑠𝑃𝑒𝑟𝑓𝑜𝑟𝑚𝑎𝑛𝑐𝑒 𝑉𝑜𝑙𝑎𝑡𝑖𝑙𝑖𝑡𝑦𝑖 𝑡−𝑠) 𝑝𝑠=1 +
{µi, + εit}
This dynamic empirical model fixed effects infer that current firm performance volatility is affected by
distance measures arising from foreign appointments, all aforementioned control variables indicated by Xit
both unobserved heterogeneity (through µi,) and by past realizations of performance volatility (through
Performance Volatility i t-1 , Performance Volatility i t-2 , …, Performance Volatility i t-p). In the context of this
study, the interest is on estimating β. However, the Ordinary Least Squares (OLS) estimator operates with
few assumptions, which specifies that the residual term should not be correlated with the proportion of
foreign appointments in the board or corner office. However, this assumption is unrealistic in the above
model, because as already established, the appointment of foreign directors or a CEO can depend on
unobservable factors such as managerial ability or firm CSR agenda. This implies that the residual term (µi,)
is correlated with the foreign appointments in the firm and thus OLS estimates of β may be inconsistent.
On the other hand, a fixed effects estimator assumes that all explanatory variables are uncorrelated with
contemporaneous past and future residual terms, which is also known as the strict exogeneity assumption.
However due to the dynamic nature of the relationship, performance volatility is highly correlated across
time. The estimator would only be consistent, when the time dimension of the panel sample is large and
when the effect of past volatility on current volatility levels weakens over time. However, practical limitations
may hinder researchers from obtaining a panel with adequately long-time dimension.
In light of these limitations, as per Sila et al. (2016), the identification strategy relies on the assumption that
firms choose a certain proportion of foreign directors, based on unobserved heterogeneities in the
board/firm and past volatility levels, to target a certain level of volatility. Put differently, when making an
appointment decision on a new CEO or a director, the incumbent board or the CEO may consider a set of
information that is available to them at the time of appointment, which includes past risk measures and
existing board and firm characteristics, and would target an expected level of future firm risk. Thus, they
argue that when the actual firm risk has materialized, the residual term can be assumed to be uncorrelated

Chapter 6: The Clash of Cultures and Its Effect on Firm Performance Volatility
285
to the current information set that determines foreign appointments. As past realizations of variables that
are included in the information determining appointment decisions are not correlated with the current
residual terms, these variables can be employed as instrumental variables for foreign appointments of
directors and CEO. Hence dynamic panel system generalized method of momentum (DPS-GMM) is used to
estimate the relationship between cultural distances arising from foreign appointments of directors or CEO
and firm performance volatility.
DPS-GMM estimators was introduced by Arellano and Bover (1995) and (Blundell & Bond, 1998). It uses a
stacked system that consists of both first-differenced and level equations. Identification operates with the
assumption that past endogenous variables in levels are not correlated with the current residual terms in first
differences (Δ εit) and that past variables in first differences are not correlated with the error term in levels
(εit).
Nevertheless, it is important to note that the identification strategy of this study operates with an
assumption, as similar to Sila et al. (2016), which is all time varying factors that would determine foreign
appointments of directors or a CEO and performance volatility levels, are included in the empirical model or
that their influence on the foreign appointments is channelled through past volatility measures. Although a
better strategy would be to identify a truly exogeneous instrumental variable for foreign appointment, finding
a truly exogeneous instrumental variable is a challenging task (Sila et al., 2016; Wang, 2012).
In essence, the DPS-GMM operates with the following underlying assumptions as identified by (Roodman,
2009, p.99), which are summarized below:
i. the process should be dynamic, with current realizations of the dependent variable affected by past
ones;
ii. there may be arbitrarily distributed fixed individual effects;
iii. the empirical model may include some regressors that are endogenous;
iv. idiosyncratic disturbances (apart from fixed effects) may have individual specific patterns of
heteroscedasticity and serial correlation;
v. the idiosyncratic disturbances are uncorrelated across individual entities;
vi. the model can include some predetermined regressors that are not strictly exogenous, for instance
they can be influenced by past experiences. E.g.: the existence of a lagged dependent variable.
vii. The sample panel contains large entities but shorter temporal dimension
viii. The available instruments are ”internal” based on lags of the instrumented variable
The econometric specification (6.25) above includes previous year’s performance volatility as a regressor,
thus resulting with a dynamic panel model. The above discussion has illustrated how the main regressor, viz.
the cultural distances can be influenced by unobserved heterogeneous variables and past realizations of firm
risk, thus making the variables endogenous. Also, the initial screening tests reveal that idiosyncratic
disturbances (apart from fixed effects) are heteroskedastic, serially correlated but not cross-sectionally
correlated. The problem of serial correlation is aggravated with the inclusion of the lagged dependent variable

Chapter 6: The Clash of Cultures and Its Effect on Firm Performance Volatility
286
in the right-hand side of the model. Furthermore, the dataset also includes a relatively shorter time span (14
years) but a larger number of individual entities (1,190 firms). Finally the analysis uses internal instruments,
based on lags of the instrumented variables, as finding a truly exogenous instrumental variable is a
challenging task (Sila et al., 2016; Wang, 2012). The empirical model (6.25) developed above satisfies all above
assumptions to employ DPS-GMM for the estimation.
The empirical model includes dummies for year, industry and country fixed effects. All time varying
independent variables are treated as endogenous except for industry, year and country dummy variables.
Endogenous variables are instrumented by three and four of their past values. A higher lag length is chosen
because according to Sila et al. (2016, p.37) the number of lags “must be high enough to ensure that the
model is dynamically complete such that further information in the past is not related to the expectational
error in the data”. The results using DPS-GMM are illustrated in Table 6.11.

Chapter 6: The Clash of Cultures and Its Effect on Firm Performance Volatility
287
Table 6.11: Robustness Tests – Dynamic Panel System GMM Regressions
Dynamic Panel System GMM Regression
Dependent Variable = annualized standard deviation of monthly stock returns over a period of 12 months (SD_Mnthly)
(1) (2)
CEO_bod_Hof -0.0077 -0.0059
(0.0091) (0.0096)
CEO-stk_Hof 0.0303** 0.0285**
(0.0133) (0.0142)
Within_Hof -0.0520 -0.0489
(0.0503) (0.0535)
L. sd_mnth 0.4463*** 0.5064***
(0.0410) (0.0460)
CEO Characteristics
ceo_dual -0.0021 -0.0038
(0.0244) (0.0253)
Roa -0.1520*** -0.1380**
(0.0498) (0.0557)
ceo_tenure -0.0017 -0.0013
(0.0019) (0.0020)
ceo_age 0.0008 0.0004
(0.0011) (0.0011)
gen_dum_1 Omitted omitted
gen_dum_2 0.0408 0.0400
(0.0544) (0.0564)
no_quals 0.0146 0.0070
(0.0089) (0.0094)
ceo_networks 0.0000 0.0000
(0.0000) (0.0000)

Chapter 6: The Clash of Cultures and Its Effect on Firm Performance Volatility
288
Board Characteristics
tot_directors -0.0025 -0.0023
(0.0028) (0.0029)
board_indep -0.1360*** -0.1020*
(0.0497) (0.0530)
Firm Characteristics
no_emp -0.0000 -0.0000
(0.0000) (0.0000)
firm_growth -0.0311*** -0.0323***
(0.0081) (0.0091)
firm_lev 0.0108 0.0116
(0.0418) (0.0445)
firm_inv 0.1720 0.1460
(0.1630) (0.1840)
Industry FE Yes Yes
Country FE Yes Yes
Time FE Yes Yes
Observations 667 667
AR(1) -6.88*** -8.32***
AR(2) -0.96 -0.87
Sargan Test 344.61 283.98
Note: This table reports specification (6.25). The dependent variable is the with-in firm over-time variability in stock performance calculated as annualized standard deviation of monthly stock return over 12 months. The coefficients are estimated based on DPS-GMM regression. The model includes year, industry and country fixed effects. All time varying independent variables are treated as endogenous. Endogenous variables are instrumented by three and four of their past values in columns (1) and (2) respectively. Standard errors are shown in parentheses. *,**,*** indicate significance at the 10%, 5% and 1% level respectively. All the variables are defined in Appendix C. The number of observations are limited to 667 due to missing values.
The results reveal that, when endogeneity is taken into account, the previously identified correlation between
CEO-Board cultural distances and performance volatility disappears. Endogeneity corrected association,
although still negative, is in fact, not statistically significant. On the other hand within-board cultural distances
denote a negative association but remain statistically non-significant. However, the cultural distances
between the CEO and firm’s stakeholders appear to have a strong positive association with performance
volatility that is statistically significant at 5% level, even after correcting for endogeneity.

Chapter 6: The Clash of Cultures and Its Effect on Firm Performance Volatility
289
The Sargan Test operates with the null hypothesis that the instruments as a group are exogenous. High p
values indicate that the study fails to reject the null hypothesis and that the instruments as a group are,
indeed, exogenous. The AR(1) test has the null hypothesis that there is no autocorrelation in the differenced
residuals and is rejected, as expected. This is because, Δeit =eit – ei,t-1 and Δei, t-1 = ei,t-1 - ei,t-2 and both have ei,t-
1. However the AR(2) test detects autocorrelation in levels equation, which is more important and the above
analysis reveals a high p value. Thus the study fails to reject the null hypothesis that there is no
autocorrelation in the residuals of the levels equation.
6.7.2 Employing alternative cultural frameworks to measure cultural distances
As discussed above, arguably, the selection of and restricting to a single cultural framework remains arbitrary
to some extent. Therefore the initial analysis with Hofstede’s dimensions is complemented with Schwartz
and GLOBE frameworks, to measure cultural distances. The dynamic econometric specification, presented in
specification (6.25), is employed and DPS-GMM is used, with three lags of all time-varying independent
variables as instruments, to estimate the relationship between cultural distances and firm performance
volatility. The results are denoted in table 6.12.

Chapter 6: The Clash of Cultures and Its Effect on Firm Performance Volatility
290
Table 6.12: Robustness Tests – Alternative Cultural Frameworks
Dynamic Panel System GMM Regression
Dependent Variable = annualized standard deviation of monthly stock returns over a period of 12 months (SD_Mnthly)
Panel A Panel B
CEO_bod_Sch -0.0175* CEO_bod_GLB -0.0262**
(0.0091)
(0.0114)
CEO-stk_Sch 0.0137*** CEO-stk_ GLB 0.0282**
(0.0043)
(0.0129)
Within_Sch -0.0104 Within_ GLB -0.0327
(0.0430)
(0.0448)
L. sd_mnth 0.4255*** L. sd_mnth 0.4494***
(0.0373) (0.0392)
CEO Characteristics
CEO Characteristics
ceo_dual 0.0021 ceo_dual 0.0016
(0.0201)
(0.0199)
Roa -0.1570*** Roa -0.1440***
(0.0446)
(0.0461)
ceo_tenure -0.0025 ceo_tenure -0.0016
(0.0016)
(0.0018)
ceo_age 0.0009 ceo_age 0.0012
(0.0010)
(0.0010)
gen_dum_1 omitted
gen_dum_1 omitted
gen_dum_2 0.0287 gen_dum_2 0.0000
(0.0480)
-
no_quals 0.0102 no_quals 0.0036
(0.0081)
(0.0084)
ceo_networks 0.0000 ceo_networks 0.0000
(0.0000)
(0.0000)
Board Characteristics
Board Characteristics
tot_directors -0.0035 tot_directors -0.0037

Chapter 6: The Clash of Cultures and Its Effect on Firm Performance Volatility
291
(0.0027)
(0.0027)
board_indep -0.1090** board_indep -0.1010**
(0.0462)
(0.0495)
Firm Characteristics
Firm Characteristics
no_emp -0.0000 no_emp -0.0000
(0.0000)
(0.0000)
firm_growth -0.0313*** firm_growth -0.0311***
(0.0077)
(0.0078)
firm_lev 0.0228 firm_lev 0.0212
(0.0398)
(0.0407)
firm_inv 0.1010 firm_inv 0.1470
(0.1480)
(0.1690)
Industry FE Yes Industry FE Yes
Country FE Yes Country FE Yes
Time FE Yes Time FE Yes
Observations 750 Observations 714
AR(1) -6.94*** AR(1) -7.88***
AR(2) -1.07 AR(2) -0.96
Sargan 417.40 Sargan 384.66
Note: This table reports specification (6.25). The dependent variable is the with-in firm over-time variability in stock performance calculated as annualized standard deviation of monthly stock return over 12 months. Panel A and panel B employs cultural distance calculated based on alternative cultural frameworks, i.e. based on Schwartz and GLOBE frameworks respectively. The coefficients are estimated based on DPS-GMM regression. The model includes year, industry and country fixed effects. All time varying independent variables are treated as endogenous. Endogenous variables are instrumented by three of their past values. Standard errors are shown in parentheses. *,**,*** indicate significance at the 10%, 5% and 1% level respectively. All the variables are defined in Appendix C. The number of observations are limited to 750 due to missing values.
The signs of the association are in line with the previous results generated based on specification (6.25). In
both panel A (Schwartz framework) and panel B (GLOBE framework), CEO-Board and CEO-Stakeholders
cultural distances evince statistical significance, whereas within-board distances do not.
Beugelsdijk, Ambos and Nell (2018) contend that the three frameworks, i.e. Hofstede, Schwartz and GLOBE,
capture very different facets of culture and institutions. Yet, the results in table 6.12 indicates very similar
results, to what was previously generated by using Hofstede’s cultural framework, in terms of the direction
of the association. This was flagged beforehand to a certain extent, by the high pairwaise correlations

Chapter 6: The Clash of Cultures and Its Effect on Firm Performance Volatility
292
between the distances calculated for the three spheres based on all Hofstede, Schwartz and GLOBE
frameworks (depicted in table 6.2).
The reason behind obtaining similar results in this study can be due to the fact that all dimensions are
aggregated into a single cultural distance index. Thus the fundamental meanings of specific individual
dimensions are trivial.
6.7.3 Employing an alternative measure of cultural distance
To overcome the previously discussed weaknesses of the KSI measure and to increase robustness, the
standardized Euclidean Index, recommended by Konara and Mohr (2019) is employed to measure cultural
distances. Furthermore, the standardized Euclidean Index is substituted with all three cultural frameworks,
i.e. Hofsetde, Schwartz and GLOBE. The dynamic econometric specification, presented in specification (6.25),
is employed and DPS-GMM is used, with three lags of all time-varying independent variables as instruments,
to estimate the relationship between cultural distances and firm stock performance volatility. The results are
denoted in table 6.13.
The results remain robust despite the use of alternative cultural distance measures.

Chapter 6: The Clash of Cultures and Its Effect on Firm Performance Volatility
293
Table 6.13: Robustness Tests –Alternative Cultural Distance Measures
Dynamic Panel System GMM Regression
Dependent Variable = annualized standard deviation of monthly stock returns over a period of 12 months (SD_Mnthly)
Panel A Panel B Panel B
CEO_bod_Hof_sei -0.0165* CEO_bod_Sch_sei -0.0209*** CEO_bod_GLB_sei -0.0183***
(0.0097)
(0.0066)
(0.0063)
CEO-stk_Hof_sei 0.0263** CEO-stk_Sch_sei 0.0217*** CEO-stk_GLB_sei 0.0158**
(0.0110)
(0.0054)
(0.0075)
Within_Hof_sei -0.0137 Within_Sch_sei -0.0094 Within_GLB_sei -0.0015
(0.0182)
(0.0127)
(0.0114)
L.sd_mnth 0.4510*** L.sd_mnth 0.4120*** L.sd_mnth 0.4540***
(0.0412)
(0.0375)
(0.0396)
CEO Characteristics
CEO Characteristics
CEO Characteristics
ceo_dual -0.0012 ceo_dual 0.0080 ceo_dual 0.0060
(0.0246)
(0.0200)
(0.0201)
Roa -0.1500*** Roa -0.1490*** Roa -0.1380***
(0.0500)
(0.0444)
(0.0463)
ceo_tenure -0.0017 ceo_tenure -0.0026 ceo_tenure -0.0015
(0.0019)
(0.0016)
(0.0018)
ceo_age 0.0007 ceo_age 0.0008 ceo_age 0.0013
(0.0011)
(0.0010)
(0.0010)
gen_dum_1 omitted
gen_dum_1 omitted
gen_dum_1 omitted
gen_dum_2 0.0000 gen_dum_2 0.0219 gen_dum_2 0.0000
(0.0000)
(0.0476)
(0.0000)
no_quals 0.0142 no_quals 0.0089 no_quals 0.0035
(0.0089)
(0.0080)
(0.0084)
ceo_networks 0.0000 ceo_networks 0.0000 ceo_networks 0.0000
(0.0000)
(0.0000)
(0.0000)
Board Characteristics
Board Characteristics
Board Characteristics
tot_directors -0.0025 tot_directors -0.0043 tot_directors -0.0036

Chapter 6: The Clash of Cultures and Its Effect on Firm Performance Volatility
294
(0.0028)
(0.0027)
(0.0027)
board_indep -0.1320*** board_indep -0.1160** board_indep -0.0979*
(0.0499)
(0.0461)
(0.0498)
Firm Characteristics
Firm Characteristics
Firm Characteristics
no_emp -0.0000 no_emp -0.0000 no_emp -0.0000
(0.0000)
(0.0000)
(0.0000)
firm_growth -0.0312*** firm_growth -0.0314*** firm_growth -0.0312***
(0.0081)
(0.0076)
(0.0078)
firm_lev 0.0070 firm_lev 0.0264 firm_lev 0.0255
(0.0421)
(0.0396)
(0.0409)
firm_inv 0.1820 firm_inv 0.0695 firm_inv 0.1350
(0.1640)
(0.1480)
(0.1700)
Industry FE Yes Industry FE Yes Industry FE Yes
Country FE Yes Country FE Yes Country FE Yes
Time FE Yes Time FE Yes Time FE Yes
Observations 667 Observations 750 Observations 714
AR(1) -7.21*** AR(1) -6.68*** AR(1) -7.78***
AR(2) -0.96 AR(2) -1.15 AR(2) -0.96
Sargan 341.55 Sargan 410.82 Sargan 379.01
Note: This table reports specification (6.25). The dependent variable is the with-in firm over-time variability in stock performance calculated as annualized standard deviation of monthly stock return over 12 months. Panel A, panel B and panel C employs cultural distance calculated based on the Standard Euclidean Index by using alternative cultural frameworks, i.e. Hofstede, Schwartz and GLOBE frameworks respectively. The coefficients are estimated based on DPS-GMM regression. The model includes year, industry and country fixed effects. All time varying independent variables are treated as endogenous. Endogenous variables are instrumented by three of their past values. Standard errors are shown in parentheses. *,**,*** indicate significance at the 10%, 5% and 1% level respectively. All the variables are defined in Appendix C. The number of observations are limited to 667 due to missing values.
6.7.4 Within-board Cultural Distances and Other Forms of Boardroom Diversity
Empirical evidence in this study so far have failed to detect a statistically significant impact of within-board
cultural distances on the stock performance volatility. Within-board cultural distances arise when directors
are culturally diverse. However, cultural diversity is just one aspect of boardroom diversity. A boardroom can
be diverse in several other forms, for example in terms of director gender, age, educational background etc.
Omitting these variables from the econometric specification may cause underestimation of the strength of
the effect of within-board cultural distances. Could this be the reason for the non-significance of within-board

Chapter 6: The Clash of Cultures and Its Effect on Firm Performance Volatility
295
cultural diversity? This section evaluates this conjecture, by employing other ‘diversity’ variables, in addition
to cultural distances.
Harrison and Klein (2007) assert that, although “diversity” [which they define as “the distribution of
differences among the members of a unit with respect to a common attribute” (p.1199)], is used as an
overarching term, the construct has three fundamentally distinctive types; i.e. “separation”, “variety” and
“disparity”. These three types differ in their attributes and relevant theoretical perspectives.
For instance, separation refers to the dissimilarities in opinion among unit members and these differences
may reflect discord and opposition or “horizontal distance along a single continuum representing dissimilarity
in a particular attitude or value” (p.1200). Few examples of attributes are opinions, beliefs, values and
attitudes etc. As the study in hand focuses on the differences of cultural values between the key players in
an organization, this type of diversity suits the best. As per Harrison and Klein (2007), the underlying
theoretical arguments focus on factors such as reduced cohesiveness, more interpersonal conflict and
distrust. To operationalize separation, the authors recommend the use of the Euclidean index. The study uses
KSI, a variant of the Euclidean index that is corrected for variances of individual cultural dimensions and the
standardised Euclidean Index, later for increased robustness.
On the other hand, variety refers to the differences in category, primarily of knowledge, information or
experience among unit members. Examples of few attributes are the functional background, network ties
etc. Most prior studies conceptualize greater creativity and decision quality, higher tendency to innovate, yet
higher task conflict associated with higher variety among unit members. To operationalize variety, Harrison
and Klein (2007) recommend the use of Blau’s index and Teachman’s (entropy) index.
Finally, disparity indicates vertical differences that when exercised at their extreme, would privilege few
individuals over many. In other words, disparity refers to the differences in concentration of valued resources
such as pay and status among unit members. As per Harrison and Klein (2007), few examples of such
attributes are pay, status, income-prestige, social power and decision making authority and
recommendations for operationalization is coefficient of variation and Gini coefficient. Furthermore
according to Harrison and Klein (2007), the expected outcome is most likely to underline within-unit
competition, resentful deviation etc.
Harrison and Klein (2007) posit that demographic attributes, such as age, gender, tenure etc. may be
meaningfully conceptualized as separation or as variety or as disparity. The authors suggest to closely focus
on the research context, in order to arrive at any conceptualization.
Thus, the next section, emphasizes on the within-board diversity in terms of gender, age, education, tenure
and network size. All variables are explained in Appendix C. The conceptualization is carried out based on the
above three categorizations of diversity.

Chapter 6: The Clash of Cultures and Its Effect on Firm Performance Volatility
296
Director gender and age as “variety”
In the context of this study, it is assumed that different gender / age cohorts vary in their knowledge,
experience and perspectives. For example, men and women may have qualitatively different sources of
knowledge (Wood, 1987). Older and younger directors may have different perspectives to a strategic issue.
Older executives render a greater psychological commitment to maintain organizational status-quo (J. M.
Stevens et al., 1978) whereas younger executives pursue high risk strategies, such as unrelated diversification,
product innovation and financial leverage that can result with higher growth, significant variability in
profitability from industry averages (Hambrick & Mason, 1984) . Therefore director gender and age diversity
are conceptualized as variety and is calculated using the Blau’s index.
Blau’s index is the most commonly employed measure to operationalize diversity as variety (Bunderson &
Sutcliffe, 2002). It is calculated as follows:
(6.26) 𝐵𝑙𝑎𝑢′𝑠 𝑖𝑛𝑑𝑒𝑥 =1-∑pk2
Director education, tenure and network size as “disparity”
In the context of this study, director education is only proxied by the number of educational qualifications,
above the undergraduate level and owing to data limitations, doesn’t consider different educational
backgrounds. Therefore, education is not operationalized as a variety. Instead education, along with tenure
and network size is conceptualized as disparity, due to the following reasons: A longer tenure may imply that
the directors are entrenched and a higher level of education and network ties would infer the high bargaining
power of the directors within the board. Therefore diversity in terms of education, tenure and network ties
in a board may result in empowerment of the team’s long-entrenched and highly qualified directors, due to
his ability to access valued resources (Harrison and Klein, 2007). Thus director disparity in terms of the
number of qualifications, tenure and network sizes, would lead to unequal distribution of power and status
(Harrison and Klein, 2007). To operationalize the disparity among directors, the study uses the coefficient of
variation calculated as follows:
(6.27) Coefficient of Variation = sqrt [ ∑(Di - Dmean)2/n] / Dmean
Revisiting the research question, the study includes the above-mentioned other forms of boardroom diversity
to econometric model (6.25) above and estimate coefficients based on DPS-GMM regression with three lags
and the results are depicted in table 6.14.

Chapter 6: The Clash of Cultures and Its Effect on Firm Performance Volatility
297
Table 6.14: Robustness Tests – Within-board Cultural Distances and Other Forms of Boardroom
Diversity
Dynamic Panel System GMM Regression
Dependent Variable = annualized standard deviation of monthly stock returns over a period of 12 months (SD_Mnthly)
CEO_bod_Hof -0.0070
(0.0087)
CEO-stk_Hof 0.0311**
(0.0129)
Within_Hof -0.0375
(0.0457)
L.sd_mnth 0.4020***
(0.0393)
CEO Characteristics
ceo_dual -0.0053
(0.0237)
Roa -0.1460***
(0.0479)
ceo_tenure -0.0017
(0.0018)
ceo_age 0.0005
(0.0011)
gen_dum_1 Omitted
gen_dum_2 0.0000
(0.0000)
no_quals 0.0086
(0.0087)
ceo_networks 0.0000
(0.0000)
Board Characteristics

Chapter 6: The Clash of Cultures and Its Effect on Firm Performance Volatility
298
tot_directors -0.0003
(0.0028)
board_indep -0.1190**
(0.0482)
Boardroom Diversity
gender_blau -0.1120**
(0.0561)
generation_blau -0.0007
(0.0027)
cv_network 0.0269
(0.0211)
cv_educ -0.0874**
(0.0436)
cv_tenure -0.0099
(0.0189)
Firm Characteristics
no_emp -0.0000
(0.0000)
firm_growth -0.0322***
(0.0078)
firm_lev 0.0088
(0.0408)
firm_inv 0.1340
(0.1520)
Industry FE Yes
Country FE Yes
TimeFE Yes
Observations 667
AR(1) -9.20***
AR(2) -1.12
Sargan 426.20
Note: This table reports specification (6.25). The dependent variable is the with-in firm over-time variability in stock performance calculated as annualized standard deviation of monthly

Chapter 6: The Clash of Cultures and Its Effect on Firm Performance Volatility
299
stock return over 12 months. The coefficients are estimated based on DPS-GMM regression. The model includes year, industry and country fixed effects. All time varying independent variables are treated as endogenous except for industry, year and country dummy variables. Endogenous variables are instrumented by three of their past values. Standard errors are shown in parentheses. *,**,*** indicate significance at the 10%, 5% and 1% level respectively. All the variables are defined in Appendix C. The number of observations are limited to 667 due to missing values.
Table 6.14 depicts that gender and educational diversity within the board are statistical significant at 5% level.
As expected, the sign of the coefficient is negative, implying that the more diverse the board is, in terms of
gender and education, the less volatile would the firm stock performance be. Yet, cultural distances within
board of directors remain statistically non-significant.
6.7.5 Diverse opinions versus agency problems within culturally distant boards
Within-board cultural distances evince statistical non-significance in almost all regressions described above.
Could it be that cultural distances among board of directors are not material enough to drive firm
performance volatility? Arguably, there can be other possibilities.
Endogeneity corrected association between within-board cultural distance and firm performance volatility
appears to always remain negative. As illustrated in figure 6.6, the negative association could be due to couple
of reasons. First, diversified opinions and varied perspectives, inside the boardroom as a result of higher
cultural distance would make the final decision a compromise, neither too good nor too bad, reducing
performance volatility. Second, increased distances among directors would result with boardroom conflicts
and lack of group cohesiveness that would make the board more captive to the CEO, giving rise to agency
problems. When the CEO is more powerful, firm performance may be more or less volatile. Both model (6.7)
and model (6.25) control for CEO power. Could this be the reason, for within-board cultural distances to
appear non-significant? In this section, more formal tests are conducted to distinguish between these
explanations.
If in-group conflicts make a board more captive to the CEO and CEO power leads to less volatile firm
performance, it could be reasonably assumed that this effect is more prominent for boards that are likely to
experience severe agency problems. According to Jensen (1986), the availability of free cash flows would
increase managerial discretion and thus exacerbate agency problems. Therefore the study employs an
indicator, surplus cash, as a proxy for the degree of agency problems (Sila et al., 2016) and model (6.25) is
extended by adding an interaction term between this indicator and within-board cultural distance. The results
by using DPS-GMM with three lags of all time-varying independent variables as instruments, are depicted in
table 6.15.

Chapter 6: The Clash of Cultures and Its Effect on Firm Performance Volatility
300
Table 6.15: Robustness Tests – Diverse opinions versus agency problems within culturally distant
boards
Dynamic Panel System GMM Regression
Dependent Variable = annualized standard deviation of monthly stock returns over a period of 12 months (SD_Mnthly)
CEO_bod_Hof -0.0079
(0.0091)
CEO-stk_Hof 0.0292**
(0.0134)
Within_Hof -0.0227
(0.0521)
Within_Hof * surp_cash -0.7910**
(0.3350)
surp_cash 0.2520**
(0.1040)
L.sd_mnth 0.4350***
(0.0414)
CEO Characteristics
ceo_dual 0.0043
(0.0245)
Roa -0.2600***
(0.0767)
ceo_tenure -0.0023
(0.0019)
ceo_age 0.0012
(0.0011)
gen_dum_1 Omitted
gen_dum_2 0.0336
(0.0549)
no_quals 0.0137

Chapter 6: The Clash of Cultures and Its Effect on Firm Performance Volatility
301
(0.0090)
ceo_networks 0.0000
(0.0000)
Board Characteristics
tot_directors -0.0022
(0.0028)
board_indep -0.1270**
(0.0504)
Firm Characteristics
no_emp -0.0000
(0.0000)
firm_growth -0.0267***
(0.0082)
firm_lev 0.0109
(0.0428)
firm_inv 0.1860
(0.1640)
Industry FE Yes
Country FE Yes
Time FE Yes
Observations 665
AR(1) -7.09***
AR(2) -0.96
Sargan 336.80
Note: This table reports specification (6.25). The dependent variable is the with-in firm over-time variability in stock performance calculated as annualized standard deviation of monthly stock return over 12 months. The coefficients are estimated based on DPS-GMM regression. The model includes year, industry and country fixed effects. All time varying independent variables are treated as endogenous. Endogenous variables are instrumented by three of their past values. Standard errors are shown in parentheses. *,**,*** indicate significance at the 10%, 5% and 1% level respectively. All the variables are defined in Appendix C. The number of observations are limited to 665 due to missing values.
Interestingly, the results indicate that the coefficient on within-board cultural distance is negative but
statistically not significant, while the coefficient on the interaction term is negative and statistically significant
at just over 1% level (p=0.018). Apparently the results are consistent with agency problems aggravated by
culturally distant boards leading to less volatile performance over the other conjecture stated above.

Chapter 6: The Clash of Cultures and Its Effect on Firm Performance Volatility
302
6.7.6 Addressing Sample Selection Bias
This section discusses about the sample selection bias “that results from employing non-randomly selected
samples to estimate behavioural relationships” (Heckman, 1979, p.153). Sample selection bias, according to
Sartori (2003), may arise when values of a study’s outcome variable are missing as a result of another process.
Heckman (1979) elaborates this phenomenon in detail and suggests that sample selection bias is an outcome
of two possible scenarios, first, when there is self-selection by the individuals or data units being studied;
second, as a result of sample selection decisions taken by researchers, which operate in much the same
fashion as self-selection117.
Heckman correction involves a two-stage approach. The first stage (selection) determines whether or not an
observation in an overall population appears in its final representative sample. This equation is called the
selection equation. The second stage models the relationship between the hypothesized dependent and
independent variables in the final sample (J. M. Wooldridge, 2010). If an omitted variable creates a correlation
between the error terms, in these two stages, traditional techniques such as OLS generates biased coefficient
estimates. Thus the Heckman model, introduced by Heckman (1976) resolve the potential sample selection
bias, by involving the aforementioned two-step process for data generation.
In addition, Certo et al., (2016), explain that sample selection bias is a product of a special case of
endogeneity, which they refer to as “sample-induced endogeneity” (p.2640). This special case occurs, as
explained by the authors, when omitted variables are correlated with the residual term in the selection
equation (i.e. the first stage of a study’s statistical model) and the residual term in the equation of interest
(i.e. the second stage).
Finally, Heckman models should consist of at least one variable in the first stage that does not appear in the
second stage (Sartori, 2003). These variables are referred to as “exclusion restrictions” and they influence the
probability of an observation’s appearing in the sample, but do not influence the ultimate outcome variable
in the second stage OLS model. Kennedy (2006) (as cited in Certo et al., 2016) asserts that Heckman models
without exclusion restrictions can do more harm than good. However, Lennox, Francis and Wang (2012), in
their analysis on ‘selection models in accounting research’, state that “a surprising number of studies (14 of
117 Heckman (1979) exemplifies the first source of self-selection bias as follows. He explains that it would be biased to assume that the wages of migrants would be a reliable estimate of what non-migrants would have earned, had they migrated. Similarly, the earnings of human resource trainees is not a reliable estimate of the earnings that non-trainees would have earned had they opted to become trainees (Heckman, 1979). On the other hand, Heckman (1979) further explains that data can be non-randomly selected owing to the decisions taken by researchers. For instance, in studies of human resource training experiments, a common practice is to analyze observations followed for the full length, of the sample, as in the case of the present study. Heckman (1979) affirms that these procedures have the same effect on structural estimates as self-selection.

Chapter 6: The Clash of Cultures and Its Effect on Firm Performance Volatility
303
75) had no exclusions, and other studies (7 out of 75) omitted the first stage model when reporting results,
making it impossible to determine if they imposed exclusion restrictions.
In the context of this study, firm’s Tobin’s Q is employed, as the exclusion restriction, inspired by the study of
Cheng (2008). As table 6.5-summary statistics hint that the sample is somewhat biased towards large firms
and because the sample in this study is restricted to companies that are listed in the principal stock exchange
of a particular country, the study tests the possibility that only successful (i.e. more valuable) firms are
selected into the sample. Table 6.16 portrays the results of Heckman (maximum likelihood) estimates.

Chapter 6: The Clash of Cultures and Its Effect on Firm Performance Volatility
304
Table 6.16: Heckman Two Stage (Maximum Likelihood)
Heckman Two Stage Selection Model
Panel A: Probit estimates on sample firms being highly valued (first-stage Heckman results)
Dependent variable: Equals one if the chosen firm is a high value one
(1) (2) (3) (4)
tobin_q -0.0973*** -0.0719*** -0.1000*** -0.0829***
(0.0207) (0.0168) (0.0214) (0.0290)
CEO_bod_Hof -0.0355
-0.0812**
(0.0273)
(0.0357)
CEO-stk_Hof
0.2440**
0.2270**
(0.1070)
(0.1130)
Within_Hof
-0.1380 0.0039
(0.2600) (0.2830)
no_emp 0.0000 0.0000 0.0000 0.0000
(0.0000) (0.0000) (0.0000) (0.0000)
firm_lev 0.0415 -0.0843 0.0107 0.0533
(0.2220) (0.1660) (0.2420) (0.2610)
firm_inv -0.1110 -0.2790 0.0745 -0.2440
(1.0480) (0.7200) (1.0870) (1.1690)
Constant 2.0450*** 1.9430*** 2.0450*** 1.9900***
(0.0994) (0.0706) (0.1150) (0.1280)
Panel B: 2nd Stage Heckman Results
Dependent Variable = annualized standard deviation of monthly stock returns over a period of 12 months (SD_Mnthly)
(1) (2) (3) (4)
CEO_bod_Hof 0.0039**
-0.0018
(0.0020)
(0.0030)
CEO-stk_Hof
0.0198***
0.0207***
(0.0045)
(0.0054)
Within_Hof
0.0001 -0.0018
(0.0165) (0.0175)

Chapter 6: The Clash of Cultures and Its Effect on Firm Performance Volatility
305
no_emp -0.0000*** -0.0000*** -0.0000*** -0.0000***
(0.0000) (0.0000) (0.0000) (0.0000)
firm_lev -0.0138 0.0065 -0.0112 -0.0150
(0.0139) (0.0111) (0.0147) (0.0155)
firm_inv 0.2840*** 0.0559 0.2480*** 0.2720***
(0.0660) (0.0482) (0.0670) (0.0736)
Constant 0.3010*** 0.3050*** 0.3030*** 0.3020***
(0.0054) (0.0041) (0.0064) (0.0070)
Observations 3,285 5,557 3,146 2,787
Wald chi2(2) 130.02*** 110.45*** 101.58*** 111.82***
Note: This table bases the regression model on a standard two-step Heckman procedure. Panel A estimates the likelihood that only successful firms with higher Tobin’s Q value are included in the sample and the dependent variable equals one if the chosen firm is a high valued firm. Panel B depicts the results after controlling for self-selection bias, in which the dependent variable is the with-in firm over-time variability in stock performance calculated as annualized standard deviation of monthly stock return over 12 months. Columns (1), (2) and (3) report estimates for distance variables considered separately and column (4) depicts results when all distance variables are included in the model. Standard errors are shown in parentheses. *,**,*** indicate significance at the 10%, 5% and 1% level respectively. All the variables are defined in Appendix C.
Table 6.16 denotes the results of Heckman two-stage procedure. Panel A illustrates the results of the
Heckman 1st stage and panel B portrays 2nd stage results. Columns (1), (2) and (3) examines the three spheres
of cultural distances (i.e. CEO-board distance, CEO-stakeholder distance, and within-board distances)
separately in three different equations together with firm controls. Column (4) includes all three spheres and
firm controls in the same regression equation.
The results of the selection equation illustrated in panel A confirms that Tobin’s Q is statistically significant,
at 1% significance level, in all four models, implying that the likelihood of a firm to be selected to the sample
appears to be a function of Tobin’s Q. However, the negative association is noteworthy and contradicts with
the assumption that only successful (i.e. more valuable) firms are selected into the sample.
Panel B of table (2nd stage Heckman results) portrays the Heckman estimates of the impact of cultural
distances on performance volatility. Columns (1) and (2) indicate that CEO-Board and CEO-Stakeholders
cultural distances evince statistical significance in determining performance volatility. Column (4) considers
all three spheres together along with firm controls and only CEO-stakeholder cultural distance evince
statistical significance. This infers that cultural distance between the CEO and stakeholders are statistically
significantly associated with stock performance volatility, even after controlling for sample selection bias
based on firm value. Within-board distances remain non-significant in all cases.

Chapter 6: The Clash of Cultures and Its Effect on Firm Performance Volatility
306
6.8 Implications
Academically, the findings of this paper open up new paradigms that need to be considered in corporate
recruitment and risk management policies. Despite being a hot topic among practitioner circles, pressure
groups and academic community, this study unveils a different facet of ‘workplace diversity’. Workplace
diversity predominantly considers about the diversity in terms of ethnicity (or gender). However ethnic
diversity and cultural distances are distinct from each other as diversity would only consider the proportion
of minority executives out of the total, while cultural distances consider how different they can be from each
other based on their values, beliefs, attitudes and perceptions. The focus of this study rests upon the latter.
As per research findings, hiring a foreign CEO who is culturally very distant from the board would be beneficial
for a company, as the distances between the foreign CEO and the board would imply that the board is more
independent, making them better monitors of management policies, ultimately reducing firm risk.
Furthermore, culturally distant CEOs will bring in perspectives and opinions to a strategic issue that are
different from those of the board. As the approval depends on both parties (CEO and the board) that are
different in terms of their views, opinions and perspectives, the resultant decision is, greatly moderated,
eventually lowering performance volatility. However, the disarray of preferences, values and attitudes
between the foreign CEO and stakeholders may cause the stakeholder groups to be cynical about CEO’s
decisions, resulting with increased performance volatility. Thus, the recruiters can consider hiring ethnically
diverse executives to a firm, but an informed estimation of the differences in cultural values (e.g. American
vs Chinese), should be a crucial factor in making recruitment decisions, which would ultimately affect firm’s
risk. Furthermore, the differences in opinion, in a culturally distant boardroom and the resultant conflicts
would eventually make the CEO more powerful, aggravating agency problems.
Finally, when making hiring decisions, existing levels of firm risk proves to be a crucial factor, because, cultural
distances, especially among the board of directors, appear to bring synergistic effects when the existing firm
risk is moderate. Yet at extremely volatile conditions, this effect seems reverse.

Chapter 6: The Clash of Cultures and Its Effect on Firm Performance Volatility
307
6.9 Conclusion
Prior scholars have established that cultural values have an impact on firm outcomes. In addition, cultural
differences among regions/ countries are also shown to affect the relationship among cross-border firms.
However, the emphasis of such research was on the national culture of either the CEO, firm or country. Put
differently, the existing literature only explores the effect of a ‘single’ culture attached to either the decision-
maker or the firm/country. Whilst this study directly contributes to the growing literature on cultural effects
on corporate outcomes, it adopts a novel approach and underlines the existence of a multiplicity of cultures
within a single firm. This phenomenon has been hardly researched. Furthermore the paper investigates the
effect of having a multiplicity of cultures on firm idiosyncratic risk, which has not been researched before.
Cultural distance within a firm is distinct from the well-researched topic, ethnic / racial diversity in workplace.
Ethnic / racial diversity would only consider the representation of minority executives in a firm, while cultural
distances, a relatively broader concept, examines how different they can be from each other based on their
values, beliefs, attitudes and perceptions. Differences in values, opinions, perceptions can sometimes be
valuable to a firm, as it introduces varied perspectives to a problem, as per the resource dependence view
and learning theory. In contrast, agency and transaction costs theory posit that difference in opinions and
views can lead to lack of trust, miscommunications, misunderstandings and conflicts. How would this
phenomenon affect the firm idiosyncratic risk?
The present study considers the cultural differences of key players (e.g. the CEO, board and stakeholders) in
a firm. As the CEO is considered to be the most powerful actor in an organization, with the ultimate authority
of decision making, the distances of national cultures are calculated between (i) the CEO and the dominant
culture of the board and (ii) the CEO and stakeholders (proxied by the country in which the head-office of the
firm is located). Owing to the important role played by the board of directors in an organization in terms of
monitoring, advising and resource provision, (iii) cultural distances among board of directors is also
considered. To operationalize the relative difference in culture among the key players, Kogut and Singh (1988)
index, a variant of the Euclidean distance index is employed with Hofstede’s cultural dimensions (1980, 2001).
Performance volatility is calculated as the variability of monthly / quarterly stock returns, annual accounting
return on assets and Tobn’s Q. The econometric model controls for CEO characteristics, board attributes and
firm /industry characteristics that are well known to affect firm idiosyncratic risk.
In brief, empirical evidence suggests that the cultural distance between the CEO and stakeholders, on firm
risk, appear to remain positive and strongly significant, regardless of endogeneity and various other
robustness tests. CEO – board cultural distance evinces a negative association, which proves statistically
significant in most of the endogeneity corrected regression models. Within-board cultural distances generate
interesting results. First, the findings of quantile panel regression indicate that within-board cultural distances
would only benefit moderately volatile firms, but would intensify the risks of high and low volatile firms.
Further after correcting for endogeneity, within-board distances remain to have a negative association with
performance volatility, which appear statistically non-significant. However further tests indicate that within-

Chapter 6: The Clash of Cultures and Its Effect on Firm Performance Volatility
308
board cultural distances apparently create boardroom conflicts, which would make the CEO more powerful,
thereby aggravating agency problems and ultimately decreasing volatility, which was not captured before as
CEO power was controlled for in the econometric model.
Academically, the findings of this paper open up new paradigms that need to be considered in corporate
recruitment and risk management policies. As per research findings, hiring a foreign CEO who is culturally
very distant from the board would be beneficial for a company, because it would help to lower the firm
performance volatility. However, the disarray of preferences between the foreign CEO and stakeholders may
cause the stakeholder groups to be cynical about CEO’s decisions, resulting with increased performance
volatility. Thus, the recruiters can consider hiring ethnically diverse executives to a firm, but an informed
estimation of the differences in cultural values (e.g. American vs Chinese), should be a crucial factor in making
recruitment decisions.
Finally, when making hiring decisions, existing levels of firm risk proves to be a crucial factor, because, cultural
distances, especially among the board of directors, appear to bring synergistic effects when the existing firm
risk is moderate. Yet at extremely volatile conditions, this effect seems to reverse.
Chapter Notes:
6.1 High investment in R&D is generally deemed as a high risk-high return strategy that would attract
the stockholders as they can enjoy the high return while mitigating the risk by keeping a diversified
homemade portfolio. R&D projects are usually for long-term and do not yield short-term results and
their innovative nature involves high failure rates. This would discourage the executives as their
wealth (financial, tangible and human capital) is mainly concentrated to a particular firm and largely
undiversifiable. Thus a project failure may put the executive’s wealth at risk. Further, if the firm is
adopting control systems that are more oriented towards short-term financial performance (eg:
Return on Investment), executives would also be more inclined towards projects with short-time
horizons. Hence the common belief is that executives tend to overlook good R&D projects due to
the associated high risk. If, as per the common belief, the inside directors lack independence from
the CEO, a higher proportion of inside directors on the board may result with low investment on
R&D, that will ultimately downgrade the firm value. However the studies of Baysinger et. al. (1991)
and Hill and Snell (1988) indicate otherwise.
6.2 One such contingency is the firm size. In a small entrepreneurial firm, ownership and control is rarely
separated and management often own a major part of the shareholding. In such a firm, the directors
will still be appointed by the owner-manager, resulting in ambiguities over the true independence
of outside directors (Huse, 1994). However some scholars argue that agency conflicts are less intense
in small firms due to the lack of owner-manager conflicts, as owner and the manager can essentially
be the same party (Eisenberg et al., 1998; Huse, 1994).Therefore previous research on board
independence and firm performance in small firms show no support of agency perspective and
sometimes even depict a negative association. The negative association can either be thought of as

Chapter 6: The Clash of Cultures and Its Effect on Firm Performance Volatility
309
supporting the notions of the stewardship theory or due to the biases against risk taking by outside
directors in order to safeguard their reputation (see Eisenberg, Sundgren and Wells, 1998).
6.3 KSI being a composite index has been criticized by many other prior scholars (Dow and Karunaratna,
2006 ; Kirkman et.al., 2006) arguing that the dimensions included in the index are conceptually very
different from each other and aggregating them makes the composite index imprecise and noisy.
Shenkar (2001) further asserts that some cultural differences are less disruptive than others and it
makes no sense to aggregate them all together in one compound measure. For example, some
differences, such as uncertainty avoidance, is more important in predicting the success of foreign
direct investment, than other dimensions (Hofstede, 1989). Individualism is also shown to affect
foreign direct investment (Shane, 1992), than others. Barkema and Vermeulen (1997) discover that
the survival of international joint ventures entirely depends on two Hofstede’s cultural dimensions,
viz. differences in uncertainty avoidance and long-term orientation.
6.4 Johanson and Vahlne (1977) proposes to employ the differences in language, education, business
practices, culture and industrial development to measure inter-country distances. In addition, an
array of distance variables other than culture has been established throughout the years, which are
geo-cultural distance (Goodnow & Hansz, 1972); level of economic development (Boyacigiller, 1990;
Davidson & McFetridge, 1985; Goodnow & Hansz, 1972); political (in)stability (Goodnow and Hansz,
1972); socio-cultural distance (Richman and Copen, 1972, as cited in Shenkar, 2001); dominant
religion; business language; form of government, levels of emigration (to the US) (Boyacigiller, 1990)
and last but not least, the size and sophistication of markets (Davidson and McFetridge, 1985). More
recently, when the term psychic distance re-surfaced in international business research, several
influential studies have re-attempted to introduce additional dimensions to accurately capture inter-
country differences. For instance, Ghemawat (2001) introduces CAGE framework to measure
distances among countries, where CAGE is an acronym that stands for cultural, administrative,
geographical and economic distances between countries. Dow and Karunaratna (2006) employ
several other new measures such as industrial development, political systems, time zones and
colonial links, in addition to the commonly cited variables such as culture, language, religion and
education levels.

Chapter 7: Conclusion and Future Research
310
Chapter 7: Conclusion and Future Research
This thesis empirically analyses the role of cultural aspects in accounting and finance disciplines, from diverse
perspectives. It is composed of three distinct research papers. The first paper (chapter 4) primarily
investigates the impact of sociocultural factors in underpinning early accounting thought and practices in an
ancient civilization (Ceylon). The next two papers maintain a focus on cultural aspects, but shift the focus to
the modern corporate world. Specifically, the second paper (chapter 5) examines the role of CEO culture in
the firm leverage decision. The third paper (chapter 6) extends the work of chapter 5 and proposes that a
firm does not associate with only a single culture, which has been the conventional research focus, but that
firms operate with a multiplicity of cultures. Chapter 6 then empirically analyses the impact of cultural
differences among the CEO, board of directors and stakeholders in a firm in determining its idiosyncratic risk.
This thesis highlights the impact of culture on various accounting and finance aspects in a context from
antiquity to modern times. Another notable feature is that chapters 5 and 6 of this thesis, transcend the
previous conventional focus of firm nationality based on country of origin and studies corporate decision-
making at a granular level, i.e. by examining the cultural values of the key players in the firm (e.g. the CEO,
board of directors, stakeholders). Overall, the thesis contributes to the existing literature on the impact of
culture on Accounting and Finance outcomes. A brief summary of the findings of the three research questions
is discussed below, followed by a description of potential future research.
7.1 Summary of Results
Chapter 4 of this thesis focuses on the early accounting thought and practices that existed in ancient Ceylon
(presently Sri Lanka), along with the macro-environmental factors that underpinned these, with special
reference to sociocultural factors. The study predominantly relies on 122 lithic and other inscriptions that
date back to the period from 1st century A.D. to the 16th century A.D., and a content analysis method is used
to examine the content of the inscriptions. Similar to the work of Ezzamel (1997) on ancient Egypt, this study
recognises accounting as a means of counting, measuring and valuing objects (i.e. as a means to quantify or
value human activities); to ascertain modes of reciprocity and as an instrument for adjudicating economic
and social claims. Also, the study explores the role of accounting as a tool in making human performances
visible, or in other words, in accomplishing notions of accountability practices, both relating to the kingship
and Buddhist monasteries. The study reveals the following findings: (i) the existence of various types of taxes,
state expenditure, two royal treasuries and the accounting profession, which is classified as the notion of
kingship accounting in this study, which have occurred mainly in the kingship, to keep track of the king’s
wealth; (ii) epigraphic evidence relating to Buddhist monasteries that encompasses explicit instructions on
maintaining proper records on inflows and outflows of resources, calculating the balance of income - left
after expenses and retaining them as non-transferable goods, preparing periodic accounting records and
reading out the records loud, in an assembly of monks and other lay officials which encapsulates the system
of Buddhist temple accounting, in the context of this research; (iii) the role of the political, economic and

Chapter 7: Conclusion and Future Research
311
technological factors (literacy, numerical technology and coinage) in underpinning early accounting thought
and finally (iv) the prominent role played by sociocultural dynamics largely inspired by Buddhism, that appear
to have exerted a dual impact; direct and indirect, on early accounting thought and practices.
This study makes several distinct contributions. First, it extends the current literature on accounting history
and practices pertaining to ancient kingdoms and civilizations, to a South Asian context, where there has been
very limited attempts to study ancient accounting practices in the region, despite the existence of an age-old
Indian treatise on Accounting, viz. “Arthasāstra” (circa 300-184 BC) by Kautilya (Mattessich, 1998). Second,
the scope of this study differs from the limited prior studies carried out from a Sri Lankan context. The present
study, operates with a broader focus as it defines, accounting practices as a means of quantifying or valuing
human activities, to ascertain modes of reciprocity and as a tool in making human performances visible.
Furthermore, the study adopts a coherent and a holistic research approach to study the ancient accounting
practices and highlights the political, economic and technological infrastructure that underpinned this. Third,
and most importantly, the study is unique as it brings to the fore, the influence of socio-cultural factors that
prevailed during the ancient era and to the best of my knowledge, this is the first study to do so. Finally, this
research is significant as, according to prior research, history contributes to contemporary research in
policymaking, practice and in standard setting. Studies on history inform us about how we have reached a
consensus on certain issues at present.
Chapter 5 of this thesis focuses on cultural implications in a modern corporate setting. In particular, it
investigates the role of the CEO’s national cultural values in determining firm leverage. By analysing a sample
of 594 CEOs, originating from 14 different nationalities, serving 317 Fortune 500 firms in the United States of
America, during 2000 to 2015, the study finds that, ceteris paribus, the cultural values of CEOs exert a
statistically significant impact on a firm’s leverage decision. CEOs with higher mastery and embeddedness
cultural traits increase debt levels, when the existing leverage of a company is low. Debt is well-known to
mitigate manager-shareholder agency conflicts in a firm (Jensen, 1986; Jensen & Meckling, 1976). However,
given that the financing decision is in the hands of the manager, why would he/she voluntarily choose debt
discipline? Apparently, the costs and benefits of debt are perceived differently by CEOs with different cultural
biases. For instance, high mastery CEOs value control and would exacerbate agency costs of equity, thereby
choosing higher debt that is enabled by the existing low leverage of the firm. In contrast, at higher existing
debt levels, high mastery CEOs, who are concerned about personal success would exacerbate financial
distress costs caused by excessive leverage and would reduce borrowing. This implies that high mastery CEOs,
unknowingly, are in pursuit of a target capital structure, as they trade-off between their preference for
control and the need for personal success. On the other hand, highly embedded CEOs increase borrowing,
irrespective of the current level of firm debt, as they are keen on debt monitoring. Increasing borrowing when
current leverage is high, can be risky. However, bearing in mind that the sample consists of the largest
corporations in the US, it can be assumed that these firms have a significant debt capacity. Conversely, there
may be other factors (such as behavioural biases) at play.
Nevertheless, a direct link between cultural values and leverage has been detected and confirmed via an
analysis of a major exogenous intervention (global financial crisis 2007/08) to the system. Further, as an

Chapter 7: Conclusion and Future Research
312
industry shock forces the CEO to make decisions to navigate the firm through a changing industry
environment the resulting decisions are likely to be unstructured and non-routine and CEO characteristics
play a major role in how CEOs respond, alleviating CEO-firm matching concerns. Finally, by analysing a sub-
sample of non-US CEOs operating in Fortune 500 firms in the US, the study also concludes that cultural values
are portable. Results remain robust to alternative specifications of the dependent variable and endogeneity
concerns caused by both omitted variable bias and simultaneous causality.
This chapter makes several unique contributions. First, the study moves beyond the macrocosmic effect to
one of microcosmic impact i.e., CEOs’ cultural values in the leverage decision process. Second, the study allow
for the asymmetries between CEO cultural values and firm leverage. The empirical analysis indicates that a
firm’s current degree of leverage significantly matters, when examining the association between CEO culture
and firm leverage. It contributes to the existing literature on the impact of culture on corporate outcomes
and specifically, to the strand of literature that investigates immigrants and their descendants to identify the
effect of culture on corporate outcomes. The study finally concludes that high mastery CEOs make capital
structure decisions that are more in the interest of shareholders, while the capital structure decisions of
highly embedded CEOs can be detrimental to the firm. Overall, this study reveals that, despite the business
requirement to maximise shareholder wealth, CEOs with culturally conditioned irrationalities will not always
make rational economic decisions. Their decisions, which are steered by cultural values, might lead to sub-
optimal outcomes. Academically, the findings of this paper open up new paradigms that require further study
in the area of agency conflicts and monitoring costs.
Chapter 6 extends the work of chapter 5 and considers several cultures that might be operating in a firm and
not just a single culture. It brings cultural differences of key players in a firm, to the fore and highlights its
impact on firm idiosyncratic risk. As prior research establish the CEO as the most powerful actor in an
organization with the ultimate authority of decision making, the differences of national cultures are
calculated between (i) the CEO and the dominant culture of the board and (ii) the CEO and stakeholders
(proxied by the country in which the head-office of the firm is located). Considering the important role played
by board of directors within a firm (iii) the cultural distances among board of directors are also calculated.
By scrutinizing a sample of 1,190 firms from 12 European countries, over 14 years from 2005 to 2018, the
study finds that the cultural distance between the CEO and stakeholders, on firm risk, appears to remain
positive and strongly significant, regardless of endogeneity correction and various other robustness tests,
inferring that the greater cultural distances and the resulting disarray of preferences of CEOs and stakeholder
groups may result with CEOs making unpredictable decisions, ultimately increasing performance volatility.
CEO – board cultural distance reveals a negative association, which proves statistically significant in most of
the endogeneity corrected regression models, implying that a greater distance between the CEO and the
board of directors is beneficial to a company, as the board will play a more independent and active role in
preventing the management from engaging in value destroying risky ventures and making strategic decisions
single-handedly. Within-board cultural distances generate interesting results. First, the findings of quantile
panel regression indicates that within-board cultural distances would only benefit moderately volatile firms,

Chapter 7: Conclusion and Future Research
313
but would intensify the risks of most and least volatile firms, implying that the extra social and human capital
that would be brought in to the firm by culturally diverse directors (as per the resource dependence view),
would help to position the firm better in terms of managing risks, only in moderately uncertain environments.
Such benefits appear to add little value and the costs of cultural distances seem to outperform the benefits
in least and most volatile firms. Further, after correcting for endogeneity, within-board distances continue to
have a negative association with performance volatility, which is statistically non-significant. However further
tests indicate that within-board cultural distances apparently create boardroom conflicts, which would make
the CEO more powerful, thereby aggravating agency problems and ultimately decreasing volatility, which was
not captured before as CEO power was controlled for, in the econometric model.
The impact of cultural values on firm outcomes has already been established by prior research. In addition,
cultural differences among regions/ countries are also shown to affect the relationship among cross-border
firms. However the emphasis of such research was on the national culture of either the CEO, firm or country.
In other words, the existing literature only explores the effect of a ‘single’ culture associated with either the
decision-maker or the firm/country. Whilst this study directly contributes to the growing literature on cultural
effects on corporate outcomes, it adopts a novel approach that highlights the existence of a multiplicity of
cultures within a single firm. Furthermore, despite being a hot topic among practitioner circles, pressure
groups and the academic community, this study unveils a different facet of ‘workplace diversity’. Diversity
and cultural distances are distinct from each other, as the former would only consider the proportion of
minority executives out of the total, while cultural distances consider how different they can be from each
other based on their values, beliefs, attitudes and perceptions. The findings of chapter 6 open up new
paradigms that need to be considered in corporate recruitment, risk management and investment policies.
Overall, the objective of this doctoral thesis is to improve the existing knowledge on the subtle and
understated influences of cultural differences and resulting human behaviour on business outcomes.
7.2 Future Research
This section briefly discusses possible avenues for future research. For instance, chapter 4 of thesis carries a
comprehensive analysis of the lithic and other inscriptions in ancient Ceylon, during the period from 1st
century A.D. to 16th century A.D. to explore the notions of early accounting thought and the influence of the
control environment, with special emphasis on the sociocultural landscape. It would be worthwhile to carry
out a comparative study with several other ancient civilisations, during the same time frame. Further, a
comparison between Western vs Non-Western values, in moulding early accounting practices would be an
interesting field to pursue.
Furthermore, chapter 5 of this thesis explores the effect of CEO’s cultural background on the firm leverage
decision. It would be interesting to extend this study to include other corporate decisions such as the dividend
decision, investment decision, cross-border mergers and acquisitions, international asset allocation etc.
Moreover, researchers in this discipline would benefit immensely by having an enhanced empirical

Chapter 7: Conclusion and Future Research
314
knowledge base on the relationships between cultural values and the well-known and heavily-researched
behavioural biases, such as overconfidence, optimism, herding behaviour and so on. Some cultures may
foster certain behavioural biases more than others, e.g. investors in individualistic countries may be over
confident and more optimistic than other cultures, or herding behaviour is more noticeable in collectivist
cultures. This phenomenon is little researched empirically.
Finally, chapter 6 examines the cultural differences between the three spheres and their impact on firm
idiosyncratic risk. An interesting avenue for future research would be to incorporate possible interactions
among the distance variables, to understand the effect of one distance variable on the level of the other,
rather than only focusing on the main effects of each distance sphere. Furthermore, an extended analysis
into the differences between individual cultural dimensions (e.g. difference in uncertainty avoidance value
and so forth of Hofstede’s framework) of the key players, and how they would affect firm risk, would also be
worthwhile to explore.

Appendices
315
Appendices
Appendix A: The List of Inscriptions Referenced (Based on Chronological Order)
No. Inscription Time Period Location King and the Reign Purpose Source
1 Minvila rock inscription I
1st century A.D. North Central Province
King Kutakanna * king's charitable acts
Inscriptions of Ceylon Vol 2
2 Molahitiyavelegala rock inscription I
1st century A.D. North Central Province
King Bhatika Abhaya * king's charitable acts
Epigraphia Zeylanica Vol III
3 Molahitiyavelegala rock inscription II
1st century A.D. North Central Province
King Mahadathika Mahanaga *
king's charitable acts
Epigraphia Zeylanica Vol III
4 Minvila rock inscription II
1st century A.D. North Central Province
King Mahadathika Mahanaga
king's charitable acts
Inscriptions of Ceylon Vol 2
5 Godawaya rock inscription
1st or 2nd century A.D.
Sourthern Province King Amanda Gamani Abhaya* or Gajabahu I *
king's charitable acts
Epigraphia Zeylanica Vol III
6 Kataragama pillar inscription I
1st or 2nd century A.D.
Uva Province No record Charitable acts by other individuals
Epigraphia Zeylanica Vol III
7 Pahala Kayinattama rock inscription
2nd century A.D. North Central Province
King Subha * king's charitable acts
Epigraphia Zeylanica Vol III
8 Viharegala rock inscription I
2nd century A.D. North Central Province
King Subha king's charitable acts
Epigraphia Zeylanica Vol III
9 Minvila rock inscription III
1st or 2nd century A.D.
North Central Province
King Gajabahu I king's charitable acts
Inscriptions of Ceylon Vol 2
10 Thuparama slab inscription
2nd century A.D. North Central Province
King Gajabahu I king's charitable acts
Epigraphia Zeylanica Vol III

Appendices
316
No. Inscription Time Period Location King and the Reign Purpose Source
11 Viharegala rock inscription II
2nd century A.D. North Central Province
King Gajabahu I king's charitable acts
Epigraphia Zeylanica Vol III
12 Tonigala rock inscription
4th century A.D. In the boundary line between the
Northern and North Central Provinces
King Siri-Meghavanna * Prototype banks Epigraphia Zeylanica Vol III
13 Ruvanvalisaya pillar inscription of the reign of Buddhadasa
4th or 5th century A.D.
North Central Province
King Buddhadasa * Charitable acts by other individuals
Epigraphia Zeylanica Vol III
14 Labuatabandigala rock inscriptions I
5th century A.D. North Central Province
Between the reigns of King Siri-Meghavanna and King Mahanama *
Prototype banks Epigraphia Zeylanica Vol III
15 Labuatabandigala rock inscriptions II
5th century A.D. North Central Province
Between the reigns of King Siri-Meghavanna and King Mahanama *
Prototype banks Epigraphia Zeylanica Vol III
16 Kuccaveli rock inscription
5th to 8th century A.D.
Eastern Province No record Other Epigraphia Zeylanica Vol III
17 Kataragama pillar inscription II
circa 6th century A.D.
Uva Province King Mahadathika Mahanaga (local ruler)-
Son of Tiritara *
king's charitable acts
Epigraphia Zeylanica Vol III
18 Thimbirivava inscription I
6th century A.D. Between North Western and North
Central Province
King Kassapa I * Charitable acts by other individuals
S.P. Uni of ceylon Review 1961 vol xix no 2
19 Thimbirivava inscription II
6th century A.D. Between North Western and North
Central Province
King Kumaradasa * Charitable acts by other individuals
S.P. Uni of ceylon Review 1961 vol xix no 2

Appendices
317
No. Inscription Time Period Location King and the Reign Purpose Source
20 Garandigala rock inscription
8th century A.D. Central Province King Kassapa III (710-717 A.D.)
Charitable acts by other individuals
Epigraphia Zeylanica Vol III
21 Indikatusaya Copper plaques
8th or 9th century North Central Province
No record Other Epigraphia Zeylanica Vol III
22 Two inscriptions of Sena I No. I
9th century A.D. North Central Province
King Sena I (826-846A.D.) Immunity Grants Epigraphia Zeylanica Vol III
23 Two inscriptions of Sena I No. 2
9th century A.D. North Central Province
King Sena I (826-846A.D.) Immunity Grants Epigraphia Zeylanica Vol III
24 Kaludiyapokuna inscription
9th century A.D. Central Province King Sena II (846-880 A.D) Charitable acts by other individuals
Epigraphia Zeylanica Vol III
25 Mannar Kacceri pillar inscription
9th century A.D. Northern Province King Sena II (846-880 A.D.) or his brother King
Kassapa IV (891-908 A.D.)
Immunity Grants Epigraphia Zeylanica Vol III
26 Nagama pillar inscription
10th century A.D. North Central Province
King Kassapa IV (891-908 A.D.)
Immunity Grants Inscriptions of Ceylon Vol V Part II
27 Colombo Musaeum pillar inscription of Kassapa IV
9th or 10th century A.D.
not recorded King Kassapa IV (891-908 A.D.)
Immunity Grants Epigraphia Zeylanica Vol III
28 Dorabavila pillar inscription
1st half of the 10th century A.D.
North Western Province
King Dappula IV (924-935 A.D.)
Immunity Grants Inscriptions of Ceylon Vol V Part II
29 Anuradhapura fragmentary pillar inscription
1st half of the 10th century A.D.
North Central Province
King Dappula IV (924-935 A.D.)
Immunity Grants Inscriptions of Ceylon Vol V Part II
30 Vessagiriya slab inscription I
1st half of the 10th century A.D.
North Central Province
King Dappula IV (924-935 A.D.)
Charitable acts by other individuals
Inscriptions of Ceylon Vol V Part II
31 Mullegama pillar inscription
1st half of the 10th century A.D.
North Western Province
King Dappula IV (924-935 A.D.)
Immunity Grants Inscriptions of Ceylon Vol V Part II

Appendices
318
No. Inscription Time Period Location King and the Reign Purpose Source
32 Kumbukvava pillar inscription
1st half of the 10th century A.D.
North Central Province
King Dappula IV (924-935 A.D.)
Immunity Grants Inscriptions of Ceylon Vol V Part II
33 Trincomalee archaeological musaeum pillar inscription
1st half of the 10th century A.D.
Eastern Province King Dappula IV (924-935 A.D.)
Immunity Grants Inscriptions of Ceylon Vol V Part II
34 Hirpitiya - ihala barube pillar inscription
1st half of the 10th century A.D.
North Western Province
King Dappula IV (924-935 A.D.)
Immunity Grants Inscriptions of Ceylon Vol V Part II
35 Bayova pillar inscription
1st half of the 10th century A.D.
North Western Province
King Dappula IV (924-935 A.D.)
Immunity Grants Inscriptions of Ceylon Vol V Part II
36 Iluppakaniya fragmentary pillar inscriptions I
1st half of the 10th century A.D.
North Central Province
King Dappula IV (924-935 A.D.)
Immunity Grants Inscriptions of Ceylon Vol V Part II
37 Giritale Unagala - Vehera pillar inscription
1st half of the 10th century A.D.
North Central Province
King Dappula IV (924-935 A.D.)
Immunity Grants Inscriptions of Ceylon Vol V Part II
38 Malagane pillar inscription
1st half of the 10th century A.D.
North Western Province
King Dappula IV (924-935 A.D.)
Immunity Grants Inscriptions of Ceylon Vol V Part II
39 Allevava pillar inscription
1st half of the 10th century A.D.
North Central Province
King Dappula IV (924-935 A.D.)
Immunity Grants Inscriptions of Ceylon Vol V Part II
40 Panduvasnuvara pillar inscription
1st half of the 10th century A.D.
North Western Province
King Dappula IV (924-935 A.D.)
Immunity Grants Inscriptions of Ceylon Vol V Part II
41 Ataviragolla pillar inscription
1st half of the 10th century A.D.
North Central Province
King Dappula IV (924-935 A.D.)
Immunity Grants Inscriptions of Ceylon Vol V Part II
42 Ranava pillar inscription
1st half of the 10th century A.D.
North Central Province
King Dappula IV (924-935 A.D.)
Immunity Grants Inscriptions of Ceylon Vol V Part II

Appendices
319
No. Inscription Time Period Location King and the Reign Purpose Source
43 Kandarodai fragmentary pillar inscription
1st half of the 10th century A.D.
Northern Province King Dappula IV (924-935 A.D.)
Immunity Grants Inscriptions of Ceylon Vol V Part II
44 Iluppakaniya fragmentary pillar inscriptions II
1st half of the 10th century A.D.
North Central Province
King Dappula IV (924-935 A.D.)
Immunity Grants Inscriptions of Ceylon Vol V Part II
45 Puliyankulama slab inscription
1st half of the 10th century A.D.
North Central Province
King Dappula IV (924-935 A.D.)
Sets of ecclesiastical
regulations agreed upon by common
consent
Inscriptions of Ceylon Vol V Part II
46 Polonnaruwa -siva-devala pillar inscription
1st half of the 10th century A.D.
North Central Province
King Dappula IV (924-935 A.D.)
Immunity Grants Inscriptions of Ceylon Vol V Part II
47 Kondawattawan pillar inscription
1st half of the 10th century A.D.
Eastern Province King Dappula IV (924-935 A.D.)
Adminisration of a village
Inscriptions of Ceylon Vol V Part II
48 Anuradhapura-pankuliya pillar inscription
1st half of the 10th century A.D.
North Central Province
King Dappula IV (924-935 A.D.)
Immunity Grants Inscriptions of Ceylon Vol V Part II
49 Murunkan pillar inscription
1st half of the 10th century A.D.
Northern Province King Dappula IV (924-935 A.D.)
Immunity Grants Inscriptions of Ceylon Vol V Part II
50 Allai pillar inscription
1st half of the 10th century A.D.
Eastern Province King Dappula IV (924-935 A.D.)
Immunity Grants Inscriptions of Ceylon Vol V Part II
51 Kadurugaskada pillar inscription
1st half of the 10th century A.D.
North Central Province
King Dappula IV (924-935 A.D.)
Immunity Grants Inscriptions of Ceylon Vol V Part II
52 Kataragama- Detagamuva pillar inscription
1st half of the 10th century A.D.
Uva Province King Dappula IV (924-935 A.D.)
Immunity Grants Inscriptions of Ceylon Vol V Part II

Appendices
320
No. Inscription Time Period Location King and the Reign Purpose Source
53 Brahmanayagama pillar inscription
1st half of the 10th century A.D.
North Central Province
King Dappula IV (924-935 A.D.)
Immunity Grants Inscriptions of Ceylon Vol V Part II
54 Manava pillar inscription
1st half of the 10th century A.D.
North Central Province
King Dappula IV (924-935 A.D.)
Immunity Grants Inscriptions of Ceylon Vol V Part II
55 Nagama pillar inscription
1st half of the 10th century A.D.
North Central Province
King Dappula IV (924-935 A.D.)
Immunity Grants Inscriptions of Ceylon Vol V Part II
56 Galtampita pillar inscription
1st half of the 10th century A.D.
North Western Province
King Dappula IV (924-935 A.D.)
Immunity Grants Inscriptions of Ceylon Vol V Part II
57 Gonnava devala pillar inscription
1st half of the 10th century A.D.
North Western Province
King Dappula IV (924-935 A.D.)
Immunity Grants Inscriptions of Ceylon Vol V Part II
58 Aturupolayaga ma pillar inscription
1st half of the 10th century A.D.
North Western Province
King Dappula IV (924-935 A.D.)
Immunity Grants Inscriptions of Ceylon Vol V Part II
59 Giritale pillar inscription I
1st half of the 10th century A.D.
North Central Province
King Dappula IV (924-935 A.D.)
Immunity Grants Inscriptions of Ceylon Vol V Part II
60 Itena pillar inscription
1st half of the 10th century A.D.
North Western Province
King Dappula IV (924-935 A.D.)
Immunity Grants Inscriptions of Ceylon Vol V Part II
61 Bandara Ulpata Pillar inscription
1st half of the 10th century A.D.
North Central Province
King Dappula IV (924-935 A.D.)
Immunity Grants Inscriptions of Ceylon Vol V Part II
62 A fragmentary inscription on a pillar discovered near Jaffna Road, Anuradhapura
1st half of the 10th century A.D.
North Central Province
King Dappula V (918-930 A.D.)
Immunity Grants Epigraphia Zeylanica Vol III
63 Kataragama pillar inscription III
1st half of the 10th century A.D.
Uva Province King Dappula V (918-930 A.D.)
Immunity Grants Epigraphia Zeylanica Vol III
64 Giritale pillar inscription II
1st half of the 10th century A.D.
North Central Province
King Udaya II (930-933 A.D.)
Immunity Grants Epigraphia Zeylanica Vol III

Appendices
321
No. Inscription Time Period Location King and the Reign Purpose Source
65 Giritale pillar inscription III
1st half of the 10th century A.D.
North Central Province
King Udaya III (935-938 A.D.)
Immunity Grants Inscriptions of Ceylon Vol V Part II
66 Atakada pillar inscription
1st half of the 10th century A.D.
North Central Province
King Udaya III (935-938 A.D.)
Immunity Grants Inscriptions of Ceylon Vol V Part II
67 Polonnaruwa pillar inscritpion
1st half of the 10th century A.D.
North Central Province
King Udaya III (935-938 A.D.)
Immunity Grants Inscriptions of Ceylon Vol V Part II
68 Bandara-Ratmale pillar inscription
1st half of the 10th century A.D.
North Central Province
King Sena III (938-946 A.D.)
Immunity Grants Inscriptions of Ceylon Vol V Part II
69 Buddanehela pillar inscription
1st half of the 10th century A.D.
North Central Province
King Sena III (938-946 A.D.)
Immunity Grants Inscriptions of Ceylon Vol V Part II
70 Anuradhapura pillar inscription
10th century A.D. North Central Province
King Sena III (938-946 A.D.)
Immunity Grants Inscriptions of Ceylon Vol V Part II
71 Kaludiyapokuna slab inscription
10th century A.D. Central Province King Sena III (938-946 A.D.)
Sets of ecclesiastical
regulations agreed upon by common
consent
Inscriptions of Ceylon Vol V Part II
72 Velmilla slab inscription
10th century A.D. Western Province King Sena III (938-946 A.D.)
Immunity Grants Inscriptions of Ceylon Vol V Part II
73 Palu-madavacciya pillar insciption
10th century A.D. North Central Province
King Sena III (938-946 A.D.)
Immunity Grants Inscriptions of Ceylon Vol V Part II
74 Badulla (Horabora) pillar inscription
10th century A.D. Uva Province King Udaya IV (946-954 A.D.)
Adminisration of a village
Inscriptions of Ceylon Vol V Part II
75 vevalkatiya slab inscription
10th century A.D. North Central Province
King Udaya IV (946-954 A.D.)
Administration of Justice
Inscriptions of Ceylon Vol V Part II
76 MaluveYaya Slab Inscription
10th century A.D. Central Province King Udaya IV (946-954 A.D.)
Administration of Justice
Inscriptions of Ceylon Vol V Part II

Appendices
322
No. Inscription Time Period Location King and the Reign Purpose Source
77 Vannadi Palama Slab Inscription
10th century A.D. Eastern Province King Udaya IV (946-954 A.D.)
Administration of Justice
Inscriptions of Ceylon Vol V Part II
78 Mihonda-vava slab inscription
10th century A.D. North Central Province
King Udaya IV (946-954 A.D.)
Administration of Justice
Inscriptions of Ceylon Vol V Part II
79 Kottapitiya Slab Inscription
10th century A.D. Central Province King Udaya IV (946-954 A.D.)
Administration of Justice
Inscriptions of Ceylon Vol V Part II
80 Kahatagasdigiliya Slab Inscription
10th century A.D. North Central Province
King Udaya IV (946-954 A.D.)
Administration of Justice
Inscriptions of Ceylon Vol V Part II
81 Vessagiriya slab inscription II
10th century A.D. North Central Province
King Udaya IV (946-954 A.D.)
Administration of Justice
Inscriptions of Ceylon Vol V Part II
82 Seruvila-Somapura Pillar-Slab Inscription
10th century A.D. Eastern Province King Udaya IV (946-954 A.D.)
Administration of Justice
Inscriptions of Ceylon Vol V Part II
83 Karum-Puliyankulam Fragmentary Slab Inscription
10th century A.D. Northern Province King Udaya IV (946-954 A.D.)
Administration of Justice
Inscriptions of Ceylon Vol V Part II
84 Mallimadu, Vilpattu National Park (The Colombo Museum) Fragmentary Pillar Inscription
10th century A.D. North Western Province
King Udaya IV (946-954 A.D.)
Administration of Justice
Inscriptions of Ceylon Vol V Part II
85 Ilakkattu-Eba Slab Inscription
10th century A.D. North Western Province
King Udaya IV (946-954 A.D.)
Administration of Justice
Inscriptions of Ceylon Vol V Part II
86 Nathanar Kovil Fragmentary Slab Inscritpion
10th century A.D. Eastern Province King Udaya IV (946-954 A.D.)
Administration of Justice
Inscriptions of Ceylon Vol V Part II

Appendices
323
No. Inscription Time Period Location King and the Reign Purpose Source
87 Hingurakgoda Fragmentary Slab Inscritpion
10th century A.D. North Central Province
King Udaya IV (946-954 A.D.)
Administration of Justice
Inscriptions of Ceylon Vol V Part II
88 Dombavelagama Fragmentary Slab Inscription
10th century A.D. North Central Province
King Udaya IV (946-954 A.D.)
Administration of Justice
Inscriptions of Ceylon Vol V Part II
89 Ampara Pillar inscription
2nd half of the 10th century
Eastern Province King Udaya IV (946-954 A.D.)
Immunity Grants Inscriptions of Ceylon Vol V Part II
90 Atdatkadavala pillar inscription
10th century A.D. North Central province
King Udaya IV (946-954 A.D.)
Immunity Grants Inscriptions of Ceylon Vol V Part II
91 Kurundannmale fragmentary slab inscription
10th century A.D.
Northern Province King Udaya IV (946-954 A.D.)
Sets of ecclesiastical
regulations agreed upon by common
consent
Inscriptions of Ceylon Vol V Part II
92 A fragmentary slab inscription found at the Buddhist railing near the eastern Dagaba, Anuradhapura
2nd half of the 10th century
North Central Province
King Mahinda IV (956-972 A.D.)
Immunity Grants Inscriptions of Ceylon Vol V Part II
93 Rambava slab inscription
2nd half of the 10th century
North Central Province
King Mahinda IV (956-972 A.D.)
king's charitable acts
Inscriptions of Ceylon Vol V Part II
94 Divurumvela Fragmentary Slab Inscription
2nd half of the 10th century
Uva Province King Mahinda IV (956-972 A.D.)
Immunity Grants Inscriptions of Ceylon Vol V Part II
95 Polonnaruva-Kirivehera
2nd half of the 10th century
North Central Province
King Mahinda IV (956-972 A.D.)
Immunity Grants Inscriptions of Ceylon Vol V Part II

Appendices
324
No. Inscription Time Period Location King and the Reign Purpose Source
Fragmentary Pillar Inscription
96 Anuradhapura Jetvana Buddhist Railing Fragmentary Slab Inscription
2nd half of the 10th century
North Central Province
King Mahinda IV (956-972 A.D.)
Charitable acts by other individuals
Inscriptions of Ceylon Vol V Part II
97 Polonnaruva:Raja Maligava Pillar Inscription
2nd half of the 10th century
North Central Province
King Mahinda IV (956-972 A.D.)
Immunity Grants Inscriptions of Ceylon Vol V Part II
98 Jetavanarama slab inscription I
2nd half of the 10th century
North Central Province
King Mahinda IV (956-972 A.D.)
king's charitable acts
Inscriptions of Ceylon Vol V Part II
99 Jetavanarama slab inscription II
2nd half of the 10th century
North Central Province
King Mahinda IV (956-972 A.D.)
Sets of ecclesiastical
regulations agreed upon by common
consent
Inscriptions of Ceylon Vol V Part II
100 Vessagiriya Slab Inscription III
2nd half of the 10th century
North Central Province
King Mahinda IV (956-972 A.D.)
Immunity Grants Inscriptions of Ceylon Vol V Part II
101 Vessagiriya Slab Inscription IV
2nd half of the 10th century
North Central Province
King Mahinda IV (956-972 A.D.)
Charitable acts by other individuals
Inscriptions of Ceylon Vol V Part II
102 Dambegoda Pillar Inscription
2nd half of the 10th century
Uva Province King Mahinda IV (956-972 A.D.)
Sets of ecclesiastical
regulations agreed upon by common
consent
Inscriptions of Ceylon Vol V Part II
103 Anuradhapura slab inscription
2nd half of the 10th century
North Central Province
King Mahinda IV (956-972 A.D.)
Administration of a village
Inscriptions of Ceylon Vol V Part II

Appendices
325
No. Inscription Time Period Location King and the Reign Purpose Source
104 Mihintale slab inscription
2nd half of the 10th century
North Central Province
King Mahinda IV (956-972 A.D.)
Sets of ecclesiastical
regulations agreed upon by common
consent
Inscriptions of Ceylon Vol V Part II
105 Kapararama Pillar- slab sanskrit inscription
2nd half of the 10th century
North Central Province
King Mahinda V (982 - 1029 A.D.)
Charitable acts by other individuals
Inscriptions of Ceylon Vol V Part II
106 Inscription on the Stone canoe within the citadel Anuradhapura I
10th century A.D. North Central Province
No record Charitable acts by other individuals
Epigraphia Zeylanica Vol III
107 Inscription on the Stone canoe within the citadel Anuradhapura II
10th century A.D. North Central Province
No record Other Epigraphia Zeylanica Vol III
108 Inscription on the Stone canoe within the citadel Anuradhapura III
10th century A.D. North Central Province
No record Charitable acts by other individuals
Epigraphia Zeylanica Vol III
109 Eppavala inscription I
2nd half of the 10th century
North Central Province
No record Sets of ecclesiastical
regulations agreed upon by common
consent
Epigraphia Zeylanica Vol III
110 Eppavala inscription II
10th or 11th century A.D.
North Central Province
No record Charitable acts by other individuals
Epigraphia Zeylanica Vol III
111 Two tamil pillar inscriptions from Budumuttava II
11th or 12th century
North Western Province
King Kulottunga I (Cola King) - Contemporary
Charitable acts by other individuals
Epigraphia Zeylanica Vol III

Appendices
326
No. Inscription Time Period Location King and the Reign Purpose Source
Sinhala King- King Vijaya-Bahu I (1058-1114 A.D.)
112 Kevulgama inscription
11th or 12th century
Central Province King Vijaya-Bahu (1058-1114 A.D.)
Kings grants to royal ministers
Epigraphia Zeylanica Vol III
113 Two tamil pillar inscriptions from Budumuttava I
12th century A.D. North Western Province
King Jayabahu I (1114-1116 A.D.)
Other Epigraphia Zeylanica Vol III
114 Devanagala rock inscription of Parakramabahu I
12th century A.D. Sabaragamuva Province
King Parakramabahu I (1153-1186 AD)
Kings grants to royal ministers
Epigraphia Zeylanica Vol III
115 Polonnaruwa: Lankatilaka Guard-stone inscription
12th century A.D. North Central Province
King Parakramabahu I (1153-1186 AD)
Charitable acts by other individuals
Epigraphia Zeylanica Vol III
116 Polonnaruva Van-Ala inscription by King Nissamkha Malla
12th century A.D. North Central Province
King Nissamkha Malla (1187 - 1196 A.D.)
Other Epigraphia Zeylanica Vol III
117 Katugaha-galge pillar inscription
12th century A.D. Uva Province King Nissamkha Malla (1187 - 1196 A.D.)
Other Epigraphia Zeylanica Vol III
118 Pillar-inscription of Bhuvanaikabahu Mahapa from Anuradhapura
13th century A.D. North Central Province
King Parakramabahu II (1225-1269 A.D.)
Charitable acts by other individuals
Epigraphia Zeylanica Vol III
119 Oruvala Sannasa 14th century A.D. North Central Province
King Parakramabahu IV (1303-1333 A.D.)
Kings grants to royal ministers
Epigraphia Zeylanica Vol III
120 the Madavala rock inscriptions
15th century A.D Central Province King Sri Parakramabahu VI (1410-1467 A.D.)
King's grant to an individual
Epigraphia Zeylanica Vol III

Appendices
327
No. Inscription Time Period Location King and the Reign Purpose Source
121 Dadigama slab-inscription of Bhuvaneka Bahu VI
15th century A.D Sabaragamuva Province
King Bhuvanekabahu VI (1469 -1476 A.D.)
Other Epigraphia Zeylanica Vol III
122 The Palkumbura Sannasa
16th century A.D. Central Province King Sri Bhuvanika Bahu VII (1529-1550 A.D.)
king's charitable acts
Epigraphia Zeylanica Vol III
* The exact reign undetermined (Paranavitana, 1933) Note: The historical work of Paranavitana (1933) and Ranawella (2004) have been consulted to identify the reign of each king. The history of Ceylon in ancient chronicles have been documented based on the Buddhist era that falls before the Christian era. Buddhist era is based on the year of Buddha's demise, which was 483 or 543 years ahead of the Gregorian calendar. Whether the Buddha's demise took place in 483 B.C. or 543 B.C. remains unsettled (Paranavitana, 1933). However, the reigns of kings, in the above table have been transformed to the Christian era (Anno Domini - A.D.) based on 544-543 B.C. as the year of Buddha's death.

Appendices
328
Appendix B: Chapter 5 - Variable Definition
Variable Definition Source
Main Debt ratio Total Debt / Total Assets at book value Worldscope
WC03255 / WC 02999
Alternative debt ratios
Long Term Debt / Total Assets at book value
Worldscope
WC03251 / WC 02999
Long Term Debt / Total Assets at Market Value (MV)118
Worldscope
WC 03251 / WC 02999 – {WC 02999-WC 03101-[WC 05503 X
(WC 08001 / P)] – WC 03451-WC 02649} +WC 08001
Total Debt / Total Assets at Market Value (MV)
Worldscope
WC 03251 / WC 02999 – {WC 02999-WC 03101-[WC 05503 X
(WC 08001 / P)] – WC 03451-WC 02649} +WC 08001
Factors
Variable Definition Expected relationship
with debt
Source
CEO nationality CEO’s passport nationality BoardEx
Mastery Mastery score based on CEO nationality The direction is an empirical
question https://www.researchgate.net
/publication/304715744_The_7_Schwartz_cultural_value_orientation_scores_for_80_countries/c
itations
embedded Embeddedness score based on CEO nationality
The direction is an empirical
question Same as above
time_role CEO Tenure (+) / (-) BoardEx
118 MV = total assets - book value of equity (BVE)* + market capitalization
BVE = total assets – current liabilities – [long term liabilities per share x (market capitalization / price)]- preferred stock - total intangibles other assets

Appendices
329
Time in role for CEO at a selected annual report date
The direction is an empirical
question
Age CEO’s current age at the selected annual report date
(-) BoardEx
no_quals
CEO Education
Total number of educational qualifications (undergraduate and above) at the selected annual report date
(+) BoardEx
Gender CEO Gender
(Male=1 Female=0)
Higher debt if male and less debt if female
BoardEx
totwealth_log CEO’s Financial position
Ln (total wealth)
Total wealth = equity held + options + long-term incentive plans held at the end of the period valued at the closing stock price of the annual report date selected.
The direction is an empirical
question
BoardEx
Tangi Tangibility
Net property plant & equipment / Total assets
(-) / (+)
The direction is an empirical
question
Worldscope
WC 02501 / WC 02999
Mktbk Market to Book Ratio
Market Value of Assets1 / Total Assets
(-) / (+)
The direction is an empirical
question
Worldscope
WC 02999 – {WC 02999-WC 03101-[WC 05503 X (WC
08001 / P)] – WC 03451-WC 02649} +WC 08001 / WC
02999
Profit Profitability
Operating income before depreciation119 /net sales or revenues.
(-) / (+)
The direction is an empirical
question
Worldscope
(WC01250 + WC01151) / WC01001
119 Operating income before depreciation = Operating income + depreciation/depletion/amortization

Appendices
330
assetmat Asset maturity
(total current assets / total assets) x (total current assets / cost of goods sold) + (net property plant & equipment / total assets) x (net property plant & equipment / depreciation, depletion, amortization) divided by 100
(+) with long-term debt.
The direction with total debt is an empirical
question
Worldscope
{[(WC02201/WC02999) X (WC02201/WC01051)] + [(WC02501/WC02999) X
(WC02501/WC01151)]}/100
emp_log Firm size
Ln (number of employees)
Number of both full time and part time employees of the company excluding seasonal employees and emergency employees
(-) / (+)
The direction is an empirical
question
Worldscope
WC07011
indus_med Median of total debt to market value of assets by ICB code and by year
(+) ICB codes from Worldscope
WC07040
induscon_log
Ln (Industry concentration)
Industry Concentration = Herfindahl index using sales by ICB code and by year
(-) / (+)
The direction is an empirical
question
ICB codes from Worldscope
WC07040
gdp_log
Ln (Gross Domestic Product) (GDP) =
GDP per capitate for each country based on purchasing power parity (PPP) converted to international dollars. Data are in constant 2011 international dollars.
(-) / (+)
The direction is an empirical
question
World Bank Open Data https://data.worldbank.org/
life_exp
Life expectancy at birth
(number of years a new born infant would live if prevailing patterns of mortality at the time of its birth were to stay the same throughout its life.)
(-) / (+)
The direction is an empirical
question
https://data.worldbank.org/
rule_of_law
Rule of law
An estimate of the quality of law enforcement, assessed by investors in
(-) / (+)
The direction is an empirical
question
http://mba.tuck.dartmouth.edu/pages/faculty/rafael.laporta
/publications.html
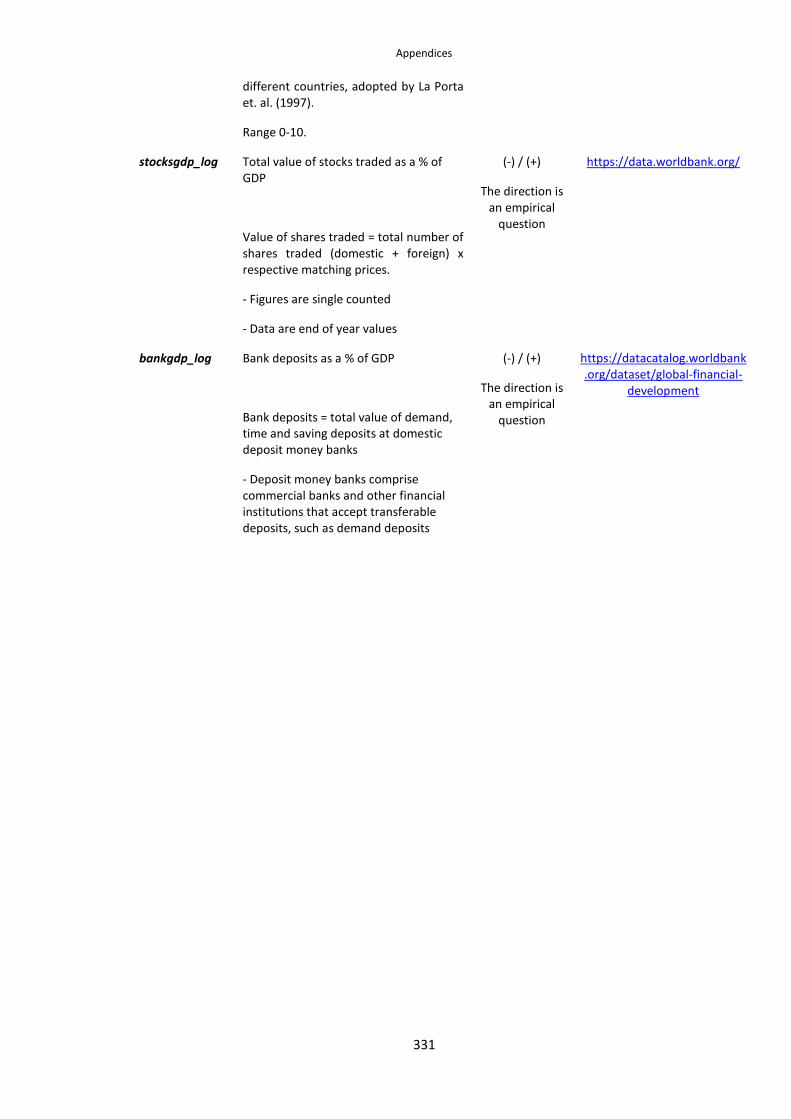
Appendices
331
different countries, adopted by La Porta et. al. (1997).
Range 0-10.
stocksgdp_log
Total value of stocks traded as a % of GDP
Value of shares traded = total number of shares traded (domestic + foreign) x respective matching prices.
- Figures are single counted
- Data are end of year values
(-) / (+)
The direction is an empirical
question
https://data.worldbank.org/
bankgdp_log
Bank deposits as a % of GDP
Bank deposits = total value of demand, time and saving deposits at domestic deposit money banks
- Deposit money banks comprise commercial banks and other financial institutions that accept transferable deposits, such as demand deposits
(-) / (+)
The direction is an empirical
question
https://datacatalog.worldbank.org/dataset/global-financial-
development

Appendices
332
Appendix C: Chapter 6 -Variable Definition
Variable Definition Source
SD_Mnthly annualized standard deviation of monthly stock returns over a period of 12 months
Thomson Reuters Datastream
RI (frequency – monthly)
SD_Qtrly annualized standard deviation of quarterly stock returns over a period of 12 months
Thomson Reuters Datastream
RI (frequency – quarterly)
SD_ROA Volatility in Accounting Performance
SD of annual ROA
Worldscope
WC01401 / WC02999
SD_Q Volatility in Corporate Value
SD of annual Tobin’s Q
Tobin’s Q = Market value of assets120 divided by the replacement costs of assets*
*Book value of assets are used as a proxy for the replacement costs of assets (Cheng, 2008)
Worldscope
WC 02999 – {WC 02999-WC 03101-[WC 05503 X (WC 08001 / P)] – WC 03451-WC 02649} +WC
08001 / WC 02999
Factors
Variable Definition Expected
relationship with debt
Source
CEO nationality CEO’s passport nationality BoardEx
Board of director nationalities
Director’s passport nationality
BoardEx
Nationality of the registered head-office of each firm
Country in which the head-office of the firm is located
BoardEx
120 MV of assets= total assets - book value of equity (BVE)* + market capitalization
BVE = total assets – current liabilities – [long term liabilities per share x (market capitalization / price)]-
preferred stock - total intangibles other assets

Appendices
333
tot_directors Board size
Total directors on the board at the selected annual report date
(-) / (+)
The direction is an
empirical question
BoardEx
board_indep Board independence
Number of independent directors divided by number of directors
(both at the selected annual report date)
(-) / (+)
The direction is an
empirical question
BoardEx
ceo_tenure
CEO Tenure to proxy for CEO risk aversion
Time in role for CEO at a selected annual report date
(-) BoardEx
ceo_age CEO’s current age at the selected annual report date
(-) BoardEx
no_quals
CEO Education
Total number of educational qualifications (undergraduate and above) at the selected annual report date
(-) / (+)
The direction is an
empirical question
BoardEx
ceo_networks The number of individuals with whom the selected individual overlaps while in employment, other activities or education roles at the same company, organisation or institution
(-) BoardEx
ceo_gender CEO Gender
(Male=1 Female=0)
The direction is an
empirical question
BoardEx
ceo_dual CEO duality to proxy for CEO power
Executive chairman present on board or combined role of CEO and Chairman is present (1 – yes, 0 –No)
(-) / (+)
The direction is an
empirical question
BoardEx
ROA Return on Assets to proxy for managerial ability
Income before tax divided by book value of total assets
(-) Worldscope
WC01401 / WC02999

Appendices
334
surp_cash Surplus cash to proxy for agency problems caused by free cash flows
Net cash flow from operating activities less depreciation and amortization plus research and development expenditure divided by the book value of total assets
(-) / (+)
The direction is an
empirical question
Worldscope
(WC04860 – WC01151 + WC01201) / WC02999
emp_log Ln (number of employees) to proxy for Firm size
Number of both full time and part time employees of the company excluding seasonal employees and emergency employees
(-) / (+)
The direction is an
empirical question
Worldscope
WC07011
firm_growth Market to Book Ratio
Market Value of Assets / Total Assets
(+) Worldscope
WC 02999 – {WC 02999-WC 03101-[WC 05503 X (WC
08001 / P)] – WC 03451-WC 02649} +WC 08001 / WC
02999
firm_lev Firm leverage
Total Debt / Total Assets at Book Vale
(-) / (+)
The direction is an
empirical question
Worldscope
WC03255 / WC02999
firm_inv Firm investment
capital expenditure divided by total assets
(+) Worldscope
WC04601 / WC02999
Industry FE Dummy variables for ICB codes for each industry
ICB codes from Worldscope
WC07040
Databases to retrieve Cultural Scores
Hofstede’s cultural dimensions https://geerthofstede.com/research-and-vsm/dimension-
data-matrix/
Schwartz’s Cultural Value Orientation Scores
https://www.researchgate.net/publication/304715744_The_7_Schwartz_cultural_value_orientation_scores_for_80_
countries
GLOBE cultural dimensions https://globeproject.com/study_2004_2007?page_id=data
#data

Appendices
335
Appendix D: Sample Breakdown of Nationalities and Gender
Country No. of Directors No. of CEOs Registered Head-
Office
Algeria 2
America 751 68
Angola 2
Argentina 6 2
Armenia 1
Australia 54 16
Austria 159 22 14
Barbados 1
Belarus 1 1
Belgium 487 70 72
Belize 1
Brazil 35 2
United Kingdom 3581 543 290
Bulgaria 1
Cameroon 1
Canada 94 7 1
Chile 13 1
China 33
Colombia 5
Costa Rica 1
Cyprus 6 1
Czechia 4
Denmark 353 48 28
Netherland 628 105 70
Egypt 5 1
United Arab Emirates 10 1
Ethiopia 1
Faroe Islands 3
Phillipines 2

Appendices
336
Country No. of Directors No. of CEOs Registered Head-
Office
Finland 61 4 2
France 2111 276 241
Gabon 1
Georgia 1 1
Germany 1394 107 75
Ghana 1
Greece 21 3
Hungary 1 1
Iceland 4 3
India 39 4
Indonesia 2
Iraq 1
Republic of Ireland 297 50 37
Israel 31 7 1
Italy 124 14
Japan 23
Jordan 6 3
Kazakhstan 4 1
Kenya 1
Kuwait 1
Latvia 1
Luxembourg 30 2 8
Malaysia 15 1 1
Mali 1
Mexico 22 3 1
Monaco 2
Morocco 4
Mozambique 1
Netherlands Antilles 4 1
New Zealand 10 2

Appendices
337
Country No. of Directors No. of CEOs Registered Head-
Office
Nigeria 2
North Korea 1
Norway 55 2
Pakistan 4 1
Paraguay 1
Peru 5 3
Poland 64 4 15
Portugal 159 25 21
Puerto Rico 1
Qatar 4
Romania 3
Russia 17 5
Saudi Arabia 1
Senegal 2
Singapore 26 1 1
Slovenia 11 1 1
South Africa 52 7
South Korea 3 1
Spain 510 71 74
Sweden 821 66 70
Switzerland 78 6 5
Syria 1 1
Taiwan 1
Tanzania 1
Trinidad and Tobago 1
Turkey 10 1
Ukraine 4 1 1
Uruguay 1
Venezuela 1
Vietnam 1

Appendices
338
Country No. of Directors No. of CEOs Registered Head-
Office
Zimbabwe 2
Croatia 1
Gibraltar 1
Jersey 4
Isle Of Man 2
Bermuda 1
Guernsey 4
Total 12298 1566 1043
Male 10110 1528
Female 2188 38

Bibliography
339
Bibliography
Aaker, J. L., & Williams, P. (1998). Empathy Versus Pride: the Influence of Emotional Appeals Across Cultures. Journal of Consumer Research, 25(3), 241–261. https://doi.org/10.1086/209537
Abeysekera, I., & Guthrie, J. (2004). How is intellectual capital being reported in a developing nation? Research in Accounting in Emerging Economies, Supplement 2: Accounting and Accountability in Emerging and Transition Economies, 149–169.
Abeysekera, I., & Guthrie, J. (2005). An empirical investigation of annual reporting trends of intellectual capital in Sri Lanka. Critical Perspectives on Accounting, 16(3), 151–163. https://doi.org/10.1016/S1045-2354(03)00059-5
Abeywardana, N., Bebermeier, W., & Schütt, B. (2018). Ancient water management and governance in the dry zone of Sri Lanka until abandonment, and the influence of colonial politics during reclamation. Water (Switzerland), 10(12). https://doi.org/10.3390/w10121746
Abhayawardhana, H. A. P. (2009). Lēkammiṭi Vimarshanaya (A Critical Study of Lekam Miti / Ancient Land Registers). Department of National Archives, No.07, Philip Gunawardana Mawatha (Reid Avenue), Colombo 07, Sri Lanka.
Adams, R. B., Almeida, H., & Ferreira, D. (2005). Powerful CEOs and Their Impact on Corporate Performance. The Review of Financial Studies, 18(4), 1403–1432. https://doi.org/10.1093/rfs/hhi030
Adams, R. B., & Ferreira, D. (2007). A Theory of Friendly Boards. The Journal of Finance, LXII(1), 217–250.
Adams, R. B., & Ferreira, D. (2009). Women in the boardroom and their impact on governance and performance. Journal of Financial Economics, 94, 291–309. https://doi.org/10.1016/j.jfineco.2008.10.007
Adams, R. B., & Funk, P. (2012). Beyond the Glass Ceiling : Does Gender Matter ? Management Science, 58(2), 219–235. https://doi.org/10.2307/41406385
Adler, N. J. (2003). International dimensions of organizational behavior (4th Ed.). South-Western College Publishing.
Aggarwal, R., Faccio, M., Guedhami, O., & Kwok, C. C. Y. (2016). Culture and finance: An introduction. Journal of Corporate Finance, 41, 466–474.
Aggarwal, R., & Goodell, J. W. (2009). Markets and institutions in financial intermediation: National characteristics as determinants. Journal of Banking and Finance, 33(10), 1770–1780. https://doi.org/10.1016/j.jbankfin.2009.03.004
Aggarwal, R., Kearney, C., & Lucey, B. (2012). Gravity and culture in foreign portfolio investment. Journal of Banking and Finance, 36(2), 525–538. https://doi.org/10.1016/j.jbankfin.2011.08.007
Agrawal, A., & Knoeber, C. R. (2001). Do Some Outside Directors Play a Political Role ? Journal of Law and Economics, 44(1), 179–198.
Ahern, K. R., Daminelli, D., & Fracassi, C. (2015). Lost in translation? The effect of cultural values on mergers around the world. Journal of Financial Economics, 117(1), 165–189. https://doi.org/10.1016/j.jfineco.2012.08.006
Ailon, G. (2008). Mirror, mirror on the wall: Culture’s consequences in a value test of its own design. Academy of Management Review, 33(4), 885–904. https://doi.org/10.5465/AMR.2008.34421995
Akerlof, G. (1970). The Market for “Lemons”: Quality Uncertainty and the Market Mechanism. The Quarterly Journal of Economics, 84(3), 488–500.

Bibliography
340
Albuquerque, R. ., Durnev, A., & Koskinen, Y. (2014). Corporate social responsibility and asset pricing in industry equilibrium.
Alesina, A., & Fuchs-Schündeln, N. (2007). Good-bye Lenin (or not?): The effect of communism on people’s preferences. American Economic Review, 97(4), 1507–1528. https://doi.org/10.1257/aer.97.4.1507
Alexander, M., Harding, M., & Lamarche, C. (2011). Quantile Regression for Time-Series-Cross-Section Data. International Journal of Statistics and Management System, 6, 47–72.
Almazan, A., & Suarez, J. (2003). Entrenchment and Severance Pay in Optimal Governance Structures. Journal of Finance, 58(2), 519–548. https://doi.org/10.1111/1540-6261.00536
Almeida, H., Cunha, I., Ferreira, M. A., & Restrepo, F. (2017). The Real Effects of Credit Ratings: The Sovereign Ceiling Channel. Journal of Finance. https://doi.org/10.1111/jofi.12434
Ambos, B., & Håkanson, L. (2014). The Concept of Distance in International Management Research. Journal of International Management, 20, 1–7. https://doi.org/10.1016/j.intman.2013.10.003
Amihud, Y., & Lev, B. (1981). Risk reduction as a managerial motive for conglomerate mergers. The Bell Journal of Economics, 12(2), 605–617.
Anderson, J. E., & Van Wincoop, E. (2003). Gravity with gravitas: A solution to the border puzzle. American Economic Review, 93, 170–192. https://doi.org/10.1257/000282803321455214
Anderson, R. C., Reeb, D. M., Upadhyay, A., & Zhao, W. (2011). The Economics of Director Heterogeneity. Financial Management • Spring, 40(1), 5–38.
Andrews, S. (2019). Thematic and Narrative Analysis in the Context of Courtroom Examinations With Alleged Victims of Child Abuse. In SAGE Research Methods Datasets Part 2. https://doi.org/10.4135/9781526498878
Ang, J. S., Chua, J. H., & McConnell, J. J. (1982). The Administrative Costs of Corporate Bankruptcy: A Note. The Journal of Finance, March, 219–226. https://doi.org/10.2307/2327126
Antecol, H. (2000). An examination of cross-country differences in the gender gap in labor force participation rates. Labour Economics, 7(4), 409–426. https://doi.org/10.1016/S0927-5371(00)00007-5
Antonczyk, R. C., & Salzmann, A. J. (2014). Overconfidence and optimism: The effect of national culture on capital structure. Research in International Business and Finance, 31, 132–151. https://doi.org/10.1016/j.ribaf.2013.06.005
April, K. A., Bosma, P., & Deglon, D. A. (2003). IC measurement and reporting: Establishing a practice in SA mining. Journal of Intellectual Capital, 4(2), 165–180. https://doi.org/10.1108/14691930310472794
Arellano, M., & Bover, O. (1995). Another look at the instrumental variable estimation of error-components models. Journal of Econometrics, 68(1), 29–51. https://doi.org/10.1016/0304-4076(94)01642-D
Arrow, K. J. (1973). Higher education as a filter. Journal of Public Economics, 2(3), 193–216. https://doi.org/10.1016/0047-2727(73)90013-3
Arthur, N. (2001). Board composition as the outcome of an internal bargaining process : empirical evidence. Journal of Corporate Finance, 7, 307–340.
Au, K. (1997). Another consequence of culture - Intra-cultural variation. International Journal of Human Resource Management, 8(5), 743–755. https://doi.org/10.1080/095851997341496
Au, K., & Cheung, M. W. L. (2004). Intra-cultural variation and job autonomy in 42 countries. Organization Studies, 25(8), 1339–1362. https://doi.org/10.1177/0170840604046345
Au, K. Y. (1999). Intra-cultural variation: Evidence and implications for international business. Journal of International Business Studies, 30(4), 799–812. https://doi.org/10.1057/palgrave.jibs.8490840

Bibliography
341
Au, K. Y. (2000). Intra-cultural variation as another construct of international management: A study based on secondary data of 42 countries. Journal of International Management, 6(3), 217–238. https://doi.org/10.1016/S1075-4253(00)00026-0
Bache, S., Dahl, C., & Kristensen, J. (2013). Headlights on tobacco road to low birthweight outcomes. Empirical Economics, 44(3), 1593–1633.
Bae, S. C., Chang, K., & Kang, E. (2012). Culture, corporate governance, and dividend policy: International evidence. Journal of Financial Research, 35(2), 289–316. https://doi.org/10.1111/j.1475-6803.2012.01318.x
Baker, M., & Wurgler, J. (2002). Market timing and capital structure. Journal of Finance, 57(1), 1–32. https://doi.org/10.1111/1540-6261.00414
Bantel, K. A. (1993). Strategic Clarity in Banking: Role of Top Management-Team Demography. Psychological Reports, 73(3), 1187–1201. https://doi.org/10.2466/pr0.1993.73.3f.1187
Barclay, M. J., Marx, L. M., & Smith, C. W. (2003). The joint determination of leverage and maturity. Journal of Corporate Finance, 9(2), 149–167. https://doi.org/10.1016/s0929-1199(02)00003-2
Barkema, H. G., & Vermeulen, F. (1997). What differences in the cultural backgrounds of partners are detrimental for international joint ventures? Journal of International Business Studies, 28(4), 845–864. https://doi.org/10.1057/palgrave.jibs.8490122
Barley, S. R., & Tolbert, P. S. (1997). Institutionalization and structuration: Studying the links between action and institution. Organization Studies, 18(1), 93–117. https://doi.org/10.1177/017084069701800106
Barth, J. R., Nolle, D. E., & Rice, T. N. (1997). Commercial banking structure, regulation, and performance: An international comparison. Managerial Finance, 23(11), 1–39. https://doi.org/10.1108/eb018653
Baum, C. F. (2001). Residual Diagnostics for Cross-section Time Series Regression Models. The Stata Journal: Promoting Communications on Statistics and Stata, 1(1), 101–104. https://doi.org/10.1177/1536867x0100100108
Baysinger, B. D., & Butler, H. N. (1985). Corporate Governance and the Board of Directors : Performance Effects of Changes in Board Composition. Journal of Law, Economics & Organization, 1(1), 101–124.
Baysinger, B. D., Kosnik, R. D., & Turk, T. A. (1991). Effects of Board and Ownership Structure on Corporate R&D Strategy. Academy of Management Journal, 34(1), 205–214. https://doi.org/10.5465/256308
Baysinger, B. D., & Zardkoohi, A. (1986). Technology , Residual Claimants , and Corporate Control. Journal of Law, Economics and Organization, 2(2), 339–349.
Becker, G. S. (1993). Nobel Lecture : The Economic Way of Looking at Behavior. Journal of Political Economy, 101(3), 385–409.
Beckerman, W. (1956). Distance and the Pattern of Intra-European Trade. The Review of Economics and Statistics, 38(1), 31–40.
Beckmann, D., Menkhoff, L., & Suto, M. (2008). Does culture influence asset managers’ views and behavior? Journal of Economic Behavior and Organization, 67(3–4), 624–643. https://doi.org/10.1016/j.jebo.2007.12.001
Berger, P. G., Ofek, E., & Yermack, D. L. (1997). Managerial Entrenchment and Capital Structure Decisions. The Journal of Finance, 52(4), 1411–1438.
Berger, & Udell, G. F. (1995). Relationship Lending and Lines of Credit in Small Firm Finance. The Journal of Business, 68(3), 351–381. https://doi.org/10.1086/296668
Berlin, M., & Mester, L. J. (2001). Lender Liability and Large Investors. Journal of Financial Intermediation, 10(2), 108–137. https://doi.org/10.1006/jfin.2001.0312

Bibliography
342
Bernasek, A., & Shwiff, S. (2001). Gender , Risk , and Retirement. Journal of Economic Issues, 35(2), 345–356.
Bernile, G., Bhagwat, V., & Yonker, S. (2018). Board Diversity , Firm Risk , and Corporate Policies. Journal of Financial Economics, 127(3), 588–612.
Berry, H., Guillén, M. F., & Zhou, N. (2010). An institutional approach to cross-national distance. Journal of International Business Studies, 41(9), 1460–1480. https://doi.org/10.1057/jibs.2010.28
Berry, J. W., Kim, U., Power, S., Young, M., & Bujaki, M. (1989). Acculturation Attitudes in Plural Societies. Applied Psychology, 38(2), 185–206. https://doi.org/10.1111/j.1464-0597.1989.tb01208.x
Bertrand, M., & Mullainathan, S. (2003). Enjoying the quiet life? Corporate governance and managerial preferences. Journal of Political Economy, 111(5), 1043–1075. https://doi.org/10.1086/376950
Bertrand, M., & Schoar, A. (2003). Managing with style: The effect of managers on firm policies. The Quarterly Journal of Economics, 118(4), 1169–1208.
Beugelsdijk, S., Ambos, B., & Nell, P. C. (2018). Conceptualizing and measuring distance in international business research: Recurring questions and best practice guidelines. Journal of International Business Studies, 49, 1113–1137. https://doi.org/10.1057/s41267-018-0182-4
Beugelsdijk, S., & Frijns, B. (2010). A cultural explanation of the foreign bias in international asset allocation. Journal of Banking and Finance, 34(9), 2121–2131. https://doi.org/10.1016/j.jbankfin.2010.01.020
Beugelsdijk, S., Kostova, T., Kunst, V. E., Spadafora, E., & van Essen, M. (2018). Cultural Distance and Firm Internationalization: A Meta-Analytical Review and Theoretical Implications. Journal of Management, 44(1), 89–130. https://doi.org/10.1177/0149206317729027
Beugelsdijk, S., Kostova, T., & Roth, K. (2017). An overview of Hofstede-inspired country-level culture research in international business since 2006. Journal of International Business Studies, 48(1), 30–47. https://doi.org/10.1057/s41267-016-0038-8
Beugelsdijk, S., Maseland, R., & van Hoorn, A. (2015). Are Scores on Hofstede’s Dimensions of National Culture Stable over Time? A Cohort Analysis. Global Strategy Journal, 5(3), 223–240. https://doi.org/10.1002/gsj.1098
Beugelsdijk, S., Slangen, A., Maseland, R., & Onrust, M. (2014). The impact of home-host cultural distance on foreign affiliate sales: The moderating role of cultural variation within host countries. Journal of Business Research, 67(8), 1638–1646. https://doi.org/10.1016/j.jbusres.2013.09.004
Bhagat, S., & Black, B. (1999). The Uncertain Relationship Between Board Composition and Firm Performance Authors. The Business Lawyer, 54(3), 921–963.
Bhattacharya, S. (1979). Imperfect Information, Dividend Policy, and “The Bird in the Hand” Fallacy. The Bell Journal of Economics, 10(1), 259–270. https://doi.org/10.2307/3003330
Bhattacharya, S. (1980). Nondissipative Signaling Structures and Dividend Policy. The Quarterly Journal of Economics, 95(1), 1–24. https://doi.org/10.2307/1885346
Blau, F. D. (1992). The fertility of immigrant women: evidence from high-fertility source countries. In Immigration and the Workforce: Economic Consequences for the United States and Source Areas.
Blundell, R., & Bond, S. (1998). Initial conditions and moment restrictions in dynamic panel data models. Journal of Econometrics, 87(1), 115–143. https://doi.org/10.1016/S0304-4076(98)00009-8
Booth, J. R., Cornett, M. M., & Tehranian, H. (2002). Boards of directors , ownership , and regulation. Journal of Banking & Finance, 26, 1973–1996.
Booth, L., Aivazian, V., Demirguc-Kunt, A., & Maksimovic, V. (2001). Capital structures in developing countries. Journal of Finance, 56(1), 87–130. https://doi.org/10.1111/0022-1082.00320

Bibliography
343
Boyacigiller, N. (1990). The Role of Expatriates in the Management of Interdependence , Complexity and Risk in Multinational. Journal of International Business Studies, 21(3), 357–381.
Boyd, B. K. (1995). CEO duality and firm performance: A contingency model. Strategic Management Journal, 16(4), 301–312. https://doi.org/10.1002/smj.4250160404
Boyd, B. K., Haynes, K. T., & Zona, F. (2011). Dimensions of CEO – Board Relations. Journal of Management Studies, 48(8), 1892–1923. https://doi.org/10.1111/j.1467-6486.2010.00943.x
Bradley, M., Jarrell, G. A., & Kim, E. H. (1984). On the Existence of an Optimal Capital Structure: Theory and Evidence. The Journal of Finance, 39(3), 857–878. https://doi.org/10.1111/j.1540-6261.1984.tb03680.x
Brander, J. A., & Lewis, T. R. (1986). Oligopoly and Financial Structure: The Limited Liability Effect. The American Economic Review, 76, 956–970.
Brealey, R., Myers, S., & Marcus, A. (2015). Fundamentals of Corporate Finance (8th ed.). McGraw-Hill.
Brennan, N. (2001). Reporting intellectual capital in annual reports: Evidence from Ireland. Accounting, Auditing & Accountability Journal, 14(4), 423–436. https://doi.org/10.1108/09513570110403443
Breuer, W., & Quinten, B. (2009). Cultural Finance. In SSRN Electronic Journal. https://doi.org/10.2139/ssrn.1282068
Breuer, W., & Salzmann, A. J. (2012). National culture and corporate governance. In Corporate Governance: Recent Developments and New Trends (pp. 369–397). https://doi.org/10.1007/978-3-642-31579-4_16
Brickley, J. A., Coles, J. L., & Jarrell, G. (1997). Leadership structure : Separating the CEO and Chairman of the Board. Journal of Corporate Finance, 3, 189–220.
Brickley, J. A., Coles, J. L., & Terry, R. L. (1994). Outside directors and the Adoption of poison pills. Journal of Financial Economics, 35, 371–390.
Brown, J. R., Fazzari, S. M., & Petersen, B. C. (2009). Financing Innovation and Growth : Cash Flow , Equity , and the 1990s R & D Boom. The Journal of Finance, 64(1), 151–185.
Bryan, S., Nash, R., & Patel, A. (2015). The effect of cultural distance on contracting decisions : The case of
executive compensation ☆. 33, 180–195. https://doi.org/10.1016/j.jcorpfin.2015.06.001
Budiasih, I. G. A. N. (2016). Social and Environment Accounting Practices at the Time of the Ancient Bali. Procedia - Social and Behavioral Sciences, 219, 145–151. https://doi.org/10.1016/j.sbspro.2016.04.056
Bunderson, S. J., & Sutcliffe, K. M. (2002). Comparing alternative conceptualizations of functional diversity in management teams: Process and performance effects. Academy of Management Journal, 45(5), 875–893. https://doi.org/10.5465/3069319
Burt, R. S. (1995). Structural Holes: The Social Structure of Competition. Harvard University Press. https://ebookcentral-proquest-com.elib.tcd.ie
Byrd, J. W., & Hickman, K. A. (1992). Do outside directors monitor managers? Evidence from tender offer bids. Journal of Financial Economics, 32(2), 195–221. https://doi.org/10.1016/0304-405X(92)90018-S
Campbell, J. L. (2007). Why would corporations behave in socially responsible ways? An institutional theory of corporate social responsibility. Academy of Management Review, 32(3). https://doi.org/10.5465/AMR.2007.25275684
Canay, I. A. (2011). A simple approach to quantile regression for panel data. The Economics Journal, 14(3), 368–386.
Cao, J., Ellis, K. M., & Li, M. (2018). Inside the board room : the influence of nationality and cultural diversity on cross ‑ border merger and acquisition outcomes. Review of Quantitative Finance and Accounting,

Bibliography
344
53, 1031–1068. https://doi.org/10.1007/s11156-018-0774-x
Carlsson, G., & Karlsson, K. (1970). Age, Cohorts and the Generation of Generations. American Sociological Review, 35(4), 710–718. https://doi.org/10.2307/2093946
Carmona, S., & Ezzamel, M. (2007). Accounting and accountability in ancient civilizations: Mesopotamia and ancient Egypt. Accounting, Auditing & Accountability Journal, 20(2), 177–209. https://doi.org/10.1108/09513570710740993
Carroll, C. D., Rhee, B.-K., & Rhee, C. (1994). Are there cultural effects on saving? Some cross-sectional evidence. The Quarterly Journal of Economics, 109(3), 685–699.
Carter, D. A., Simkins, B. J., & Simpson, W. G. (2003). Corporate Governance , Board Diversity , and Firm Value. The Financial Review, 38, 33–53. https://doi.org/10.1111/1540-6288.00034
Certo, S. T., Busenbark, J. R., Woo, H. S., & Semadeni, M. (2016). Sample selection bias and Heckman models in strategic management research. Strategic Management Journal, 37(13), 2639–2657. https://doi.org/10.1002/smj.2475
Chakrabarti, R., Gupta-Mukherjee, S., & Jayaraman, N. (2009). Mars-Venus marriages: Culture and cross-border M & A. Journal of International Business Studies, 40, 216–236. https://doi.org/10.1057/jibs.2008.58
Chandwani, N. (2019). Brief history of Chola Dynasty. The Times of India. https://timesofindia.indiatimes.com/blogs/desires-of-a-modern-indian/brief-history-of-chola-dynasty/
Chang, C. H., & Lin, S. J. (2015). The effects of national culture and behavioral pitfalls on investors’ decision-making: Herding behavior in international stock markets. International Review of Economics and Finance, 37, 380–392. https://doi.org/10.1016/j.iref.2014.12.010
Chang, K., & Noorbakhsh, A. (2009). Does national culture affect international corporate cash holdings? Journal of Multinational Financial Management, 19(5), 323–342. https://doi.org/10.1016/j.mulfin.2009.07.001
Cheng, S. (2008). Board size and the variability of corporate performance. Journal of Financial Economics, 87, 157–176. https://doi.org/10.1016/j.jfineco.2006.10.006
Chernozhukov, V., Fernandez-Val, I., Hahn, J., & Newey, W. (2013). Average and quantile effects in nonseparable panel models. Econometrica, 81(2), 535–580.
Chernozhukov, V., & Hansen, C. (2005). An IV Model of Quantile Treatment Effects. Econometrica, 73(1), 245–261. http://www.siaw.unisg.ch/org/siaw/webold.nsf/d638de4e02e667cac12568f0002661cf/e804d633a2376a0ec1256a6b0024354d/$FILE/ATT2Z21Z/ChernozhukovHansen.pdf
Chernozhukov, V., & Hansen, C. (2006). Instrumental quantile regression inference for structural and treatment effect models. Journal of Econometrics, 132(2), 491–525. https://doi.org/10.1016/j.jeconom.2005.02.009
Chernozhukov, V., & Hansen, C. (2008). Instrumental variable quantile regression: A robust inference approach. Journal of Econometrics, 142(1), 379–398. https://doi.org/10.1016/j.jeconom.2007.06.005
Chetverikov, D., Larsen, B., & Palmer, C. (2016). IV Quantile Regression for Group‐Level Treatments, With an Application to the Distributional Effects of Trade. Econometrica, 84(2), 809–833.
Child, J. (1974). Managerial and Organizational Factors Associated With Company Performance Part I. Journal of Management Studies, 11(3), 175–189. https://doi.org/10.1111/j.1467-6486.1974.tb00693.x
Chow, C. W., Shields, M. D., & Wu, A. (1999). The importance of national culture in the design of and preference for management controls for multi-national operations. Accounting, Organizations and Society. https://doi.org/10.1016/S0361-3682(99)00047-1

Bibliography
345
Chown, S. M. (1960). A factor analysis of the Wesley Rigidity Inventory: Its relationship to age and nonverbal intelligence. Journal of Abnormal and Social Psychology. https://doi.org/10.1037/h0042403
Chui, A.C.W., Titman, S., Wei, K. C. J. (2010). Individualism and momentum around the world. Journal of Finance, 65, 361–392.
Chui, A. C. W., & Kwok, C. C. Y. (2008). National culture and life insurance consumption. Journal of International Business Studies. https://doi.org/10.1057/palgrave.jibs.8400316
Chui, A. C. W., Kwok, C. C. Y., & Stephen Zhou, G. (2016). National culture and the cost of debt. Journal of Banking and Finance, 69, 1–19. https://doi.org/10.1016/j.jbankfin.2016.04.001
Chui, A. C. W., Lloyd, A. E., & Kwok, C. C. Y. (2002). The determination of capital structure: Is national culture a missing piece to the puzzle? Journal of International Business Studies, 33(1), 99–127. https://doi.org/10.1057/palgrave.jibs.8491007
Codrington, H. W. (1924). Ceylon Coins and Currency, Memoirs of the Colombo Museum Series A; no. 3 (Printed by).
Codrington, H. W. (1938). Ancient land tenure and revenue in Ceylon. Colombo: Printed at the Ceylon Government Press.
Coles, J. L., Daniel, N. D., & Naveen, L. (2008). Boards: Does one size fit all? Journal of Financial Economics. https://doi.org/10.1016/j.jfineco.2006.08.008
Coles, J. W., & Hesterly, W. S. (2000). Independence of the chairman and board composition: Firm choices and shareholder value. Journal of Management, 26(2), 195–214. https://doi.org/10.1177/014920630002600202
Cook, A., & Glass, C. M. (2014). Analyzing promotions of racial/ethnic minority CEOs. Journal of Managerial Psychology, 29(4), 440–454. https://doi.org/10.1108/JMP-02-2012-0066
Cook, D. C., & Cohn, H. B. (1959). Capital Structures of Electric Utilities under the Public Utility Holding Company Act. Virginia Law Review, 45(6), 981–1006.
Cuypers, I. R. P., Ertug, G., Heugens, P. P. M. A. R., Kogut, B., & Zou, T. (2018). The making of a construct: Lessons from 30 years of the Kogut and Singh cultural distance index. Journal of International Business Studies. https://doi.org/10.1057/s41267-018-0181-5
Daily, C. M. (1995). The Relationship Between Board Composition and Leadership Structure and Bankruptcy Reorganization Outcomes. 21(6), 1041–1056.
Daily, C. M., & Dalton, D. R. (1994a). Bankruptcy and Corporate Governance: The Impact of Board Composition and Structure. Academy of Management Journal. https://doi.org/10.5465/256801
Daily, C. M., & Dalton, D. R. (1994b). Corporate governance and the bankrupt firm: An empirical assessment. Strategic Management Journal. https://doi.org/10.1002/smj.4250150806
Dalton, D. R., Daily, C. M., Ellstrand, A. E., & Johnson, J. L. (1998). Meta-analytic Reviews of Board Composition , Leadership Structure and Financial Performance. Strategic Management Journal, 19, 269–290.
Dalton, D. R., & Dalton, C. M. (2011). Integration of micro and macro studies in governance research: CEO duality, board composition, and financial performance. Journal of Management, 37(2), 404–411. https://doi.org/10.1177/0149206310373399
Davidson, W. H., & McFetridge, D. G. (1985). Key Characteristics in the Choice of International Technology Transfer Mode. Journal of International Business Studies. https://doi.org/10.1057/palgrave.jibs.8490448
Davis, J. H., Schoorman, F. D., & Donaldson, L. (1997). Toward a stewardship theory of management. Academy of Management Review. https://doi.org/10.5465/AMR.1997.9707180258

Bibliography
346
de Jong, E., & Semenov, R. (2006). Cultural determinants of ownership concentration across countries. International Journal of Business Governance and Ethics. https://doi.org/10.1504/ijbge.2006.009414
De Maesschalck, R., Jouan-Rimbaud, D., & Massart, D. L. (2000). The Mahalanobis distance. Chemometrics and Intelligent Laboratory Systems. https://doi.org/10.1016/S0169-7439(99)00047-7
de Meza, D., & Southey, C. (1996). The Borrower’s Curse: Optimism, Finance and Entrepreneurship. The Economic Journal. https://doi.org/10.2307/2235253
DeAngelo, H., & Masulis, R. (1980). Optimal Capital Structure under Corporate and Personal Taxation. Journal of Financial Economics, 8, 3–29.
Deaves, R., Uders, E. L., Luo, G. U. O. Y., Gervais, S., Glaser, M., Guggenberger, P., Haigh, M., Inkmann, J., Joaquin, M., Kempf, A., Kluger, B., Kraeussl, R., Lin, T., Lohre, H., Lypny, G., Maynes, E., Milevsky, M., Mountain, D., Roberts, G., … Tian, Y. (2009). An Experimental Test of the Impact of Overconfidence and Gender on Trading Activity. September 2008, 555–575. https://doi.org/10.1093/rof/rfn023
Desender, K. A., Castro, C. E., & de León, S. A. E. (2011). Earnings management and cultural values. American Journal of Economics and Sociology. https://doi.org/10.1111/j.1536-7150.2011.00786.x
Di Tella, R., Galiani, S., & Schargrodsky, E. (2007). The formation of beliefs: Evidence from the allocation of land titles to squatters. Quarterly Journal of Economics. https://doi.org/10.1162/qjec.122.1.209
Diamond, D. W. (1989). Reputation Acquisition in Debt Markets. Journal of Political Economy. https://doi.org/10.1086/261630
Dittmar, A., & Duchin, R. (2016). Looking in the rearview mirror: The effect of managers’ professional experience on corporate financial policy. Review of Financial Studies, 29(3), 565–602. https://doi.org/10.1093/rfs/hhv051
Dollinger, M. J. (1984). Environmental Boundary Spanning and Information Processing Effects on Organizational Performance. Academy of Management Journal. https://doi.org/10.2307/255929
Donaldson, L. (1990). The Ethereal Hand: Organizational Economics and Management Theory. Academy of Management Review. https://doi.org/10.5465/amr.1990.4308806
Donaldson, L., & Davis, J. H. (1991). Stewardship Theory or Agency Theory: CEO Governance and Shareholder Returns. Australian Journal of Management. https://doi.org/10.1177/031289629101600103
Donaldson, L., & Davis, J. H. (1994). Boards and Company Performance ‐ Research Challenges the Conventional Wisdom. Corporate Governance: An International Review. https://doi.org/10.1111/j.1467-8683.1994.tb00071.x
Doupnik, T. S. (2008). Influence of culture on earnings management: A note. Abacus. https://doi.org/10.1111/j.1467-6281.2008.00265.x
Dow, D. (2000). A note on psychological distance and export market selection. Journal of International Marketing, 8(1), 51–64. https://doi.org/10.1509/jimk.8.1.51.19563
Dow, D., Håkanson, L., & Ambos, B. (2014). Perceptions versus national-level differences: A mediating model of psychic distance. Progress in International Business Research, 9(June 2015), 133–170. https://doi.org/10.1108/S1745-886220140000009005
Dow, D., & Karunaratna, A. (2006). Developing a multidimensional instrument to measure psychic distance stimuli. Journal of International Business Studies, 37(5), 578–602. https://doi.org/10.1057/palgrave.jibs.8400221
Duchin, R., Matsusaka, J. G., & Ozbas, O. (2010). When are outside directors effective? Journal of Financial Economics. https://doi.org/10.1016/j.jfineco.2009.12.004
Dutt, T., & Humphery-Jenner, M. (2013). Stock return volatility, operating performance and stock returns:

Bibliography
347
International evidence on drivers of the “low volatility” anomaly. Journal of Banking and Finance, 37(3), 999–1017. https://doi.org/10.1016/j.jbankfin.2012.11.001
Edwards, J. R., Coombs, H. M., & Greener, H. T. (2002). British central government and “the mercantile system of double entry” bookkeeping: A study of ideological conflict. Accounting, Organizations and Society. https://doi.org/10.1016/S0361-3682(01)00060-5
Eisenberg, T., Sundgren, S., & Wells, M. T. (1998). Larger Board Size and Decreasing Firm Value in Small Firms. Journal of Financial Economics, 48, 35–54. http://scholarship.law.cornell.edu/facpub%5Cnhttp://scholarship.law.cornell.edu/facpub/393
Eisenhardt, K. M. (1989). Agency Theory: An Assessment and Review. Academy of Management Review. https://doi.org/10.5465/amr.1989.4279003
Ellis, M. D. E. J. (1974). Taxation in Ancient Mesopotamia : The History of the Term miksu. Journal of Cuneiform Studies, 26(4), 211–250.
Epigraphy and Numismatics Division. (2019). http://www.archaeology.gov.lk/web/index.php?option=com_content&view=article&id=57&Itemid=87&lang=en
Erhardt, N. L., Werbel, J. D., & Shrader, C. B. (2003). Board of Director Diversity and Firm Financial Performance. Corporate Governance: An International Review, 11(2), 102–111. https://doi.org/10.1111/1467-8683.00011
European Commission. (2005). 83% of European companies with “diversity in the workplace” policies see business benefits - Commission report. https://ec.europa.eu/social/main.jsp?catId=89&langId=en&newsId=336&furtherNews=yes
European Union. (2020). https://europa.eu/european-union/index_en
Ezzamel, M. (1997). Accounting, control and accountability: Preliminary evidence from ancient Egypt. Critical Perspectives on Accounting, 8, 563–601. https://doi.org/10.1006/cpac.1997.0123
Ezzamel, M., & Hoskin, K. (2002). Retheorizing accounting, writing and money with evidence from Mesopotamia and ancient Egypt. Critical Perspectives on Accounting, 13, 333–367. https://doi.org/10.1006/cpac.2001.0500
Ezzamel, M., & Watson, R. (1993). Organizational Form, Ownership Structure and Corporate Performance: A Contextual Empirical Analysis of UK Companies. British Journal of Management. https://doi.org/10.1111/j.1467-8551.1993.tb00056.x
Faccio, M., & Masulis, R. W. (2005). The choice of payment method in European mergers and acquisitions. Journal of Finance. https://doi.org/10.1111/j.1540-6261.2005.00764.x
Fama, E. F., & French, K. R. (1992). The Cross-Section of Expected Stock Returns. The Journal of Finance, 47(2), 427–465. https://doi.org/10.1016/j.bir.2017.08.003
Fama, E. F., & French, K. R. (2002). Testing Trade-Off and Pecking Order Predictions About Dividends and Debt. Review of Financial Studies. https://doi.org/10.1093/rfs/15.1.1
Fama, E. F., & Jensen, M. C. (1983). Separation of Ownership and Control. Journal of Law and Economics, 26, 301–325. https://doi.org/10.1086/467037
Fan, J. X., & Xiao, J. J. (2006). Cross-cultural differences in risk tolerance: a comparison between Chinese and Americans. Journal of Personal Finance, 5(3), 54–75.
Farrell, K. A., & Hersch, P. L. (2005). Additions to corporate boards : the effect of gender. Journal of Coroprate Finance, 11, 85–106. https://doi.org/10.1016/j.jcorpfin.2003.12.001
Faulkender, M., & Petersen, M. A. (2006). Does the source of capital affect capital structure? In Review of Financial Studies. https://doi.org/10.1093/rfs/hhj003

Bibliography
348
Fehr-Duda, H., De Gennaro, M., & Schubert, R. (2006). Gender, financial risk, and probability weights. Theory and Decision, 60(2–3), 283–313. https://doi.org/10.1007/s11238-005-4590-0
Fernández, R. (2011). Does culture matter? In Handbook of Social Economics. https://doi.org/10.1016/B978-0-444-53187-2.00011-5
Fernández, R., & Fogli, A. (2009). Culture: An Empirical Investigation of Beliefs, Work and Fertility. American Economic Journal: Macroeconomics, 1(1), 146–177.
Ferraro, P. J., & Cummings, R. G. (2007). Cultural Diversity , Discrimination and Economic Outcomes : An Experimental Analysis. Economic Inquiry, 45(2), 217–232.
Ferreira, D. (2010). Board Diversity. In H. K. Baker & R. Anderson (Eds.), Corporate Governance: A Synthesis of Theory, Research, and Practice (pp. 225–242).
Ferris, S., Jayaraman, N., & Zhang, T. (2017). A Clash of Cultures: The Governance and Valuation Effects of Multiple Corporate Cultures.
Fidrmuc, J. P., & Jacob, M. (2010). Culture, Agency Costs, and Dividends. Journal of Comparative Economics, 38(3), 321–339.
Finkelstein, S., & D’Aveni, R. (1994). CEO Duality as A Double-Edged Sword: How Boards of Directors Balance Entrenchment Avoidance and Unity of Command. Academy of Management Journal, 37(5). https://doi.org/10.2307/256667
Fisman, R., & Miguel, E. (2007). Corruption, norms, and legal enforcement: evidence from diplomatic parking tickets. Journal of Political Economy. https://doi.org/10.1086/527495
Flynn, B. B., & Saladin, B. (2006). Relevance of Baldrige constructs in an international context: A study of national culture. Journal of Operations Management. https://doi.org/10.1016/j.jom.2005.09.002
Fracassi, C., & Tate, G. (2012). External networking and internal firm governance. Journal of Finance. https://doi.org/10.1111/j.1540-6261.2011.01706.x
Frank, M. Z., & Goyal, V. K. (2003). Testing the pecking order theory of capital structure. Journal of Financial Economics. https://doi.org/10.1016/S0304-405X(02)00252-0
Frank, M. Z., & Goyal, V. K. (2009). Capital Structure Decisions: Which Factors Are Reliably Important? Financial Management • Spring, 1–37.
Frucot, V., & Shearon, W. T. (1991). Budgetary participation, locus of control, and Mexican managerial performance and job satisfaction. Accounting Review.
Galvao, A. F. (2011). Quantile regression for dynamic panel data with fixed effects. Journal of Econometrics, 164(1), 142–157. https://doi.org/10.1016/j.jeconom.2011.02.016
Gao, S., & Handley-Schachler, M. (2003). The influences of Confucianism, Feng Shui and Buddhism in Chinese accounting history. Accounting, Business & Financial History, 13(1), 41–68. https://doi.org/10.1080/09585200210164566
Geiger, W. (1912). The Mahavamsa or The Great Chronicle of Ceylon. Translated to English. London: Henry Frowde, Oxford University Press, Amen Corner, E.C. https://what-buddha-said.net/library/pdfs/mahavamsa.geiger.pdf
Gelfand, M. J., Raver, J. L., Nishii, L., Leslie, L. M., Lun, J., Lim, B. C., Duan, L., Almaliach, A., Ang, S., Arnadottir, J., Aycan, Z., Boehnke, K., Boski, P., Cabecinhas, R., Chan, D., Chhokar, J., D’Amato, A., Ferrer, M., Fischlmayr, I. C., … Yamaguchi, S. (2011). Differences between tight and loose cultures: A 33-nation study. Science, 332, 1100–1104. https://doi.org/10.1126/science.1197754
Geraci, M., & Bottai, M. (2007). Quantile regression for longitudinal data using the asymmetric laplace distribution. Biostatistics, 8(1), 140–154.

Bibliography
349
Geraci, M., & Bottai, M. (2014). Linear Quantile Mixed Models. Statistics and Computing, 24(3), 461–479.
Gertler, M., & Gilchrist, S. (1993). The Role of Credit Market Imperfections in the Monetary Transmission Mechanism : Arguments and Evidence Author ( s ): Mark Gertler and Simon Gilchrist Source : The Scandinavian Journal of Economics , Vol . 95 , No . 1 ( Mar ., 1993 ), pp . 43-64 Published. The Scandinavian Journal of Economics, 95(1), 43–64.
Gervais, S. (2009). Behavioral Finance : Capital Budgeting and Other Investment Decisions *.
Ghemawat, P. (2001). Distance Still Matters. Harvard Business Review, September, 137–147.
Giannetti, M., & Yafeh, Y. (2012). Do cultural differences between contracting parties matter? Evidence from syndicated bank loans. Management Science. https://doi.org/10.1287/mnsc.1110.1378
Giannetti, M., & Zhao, M. (2015). Board Diversity and Firm Performance Volatility.
Giavazzi, F., Petkov, I., & Schiantarelli, F. (2014). Culture: Persistence and Evolution. In National Bureau of Economic Research. https://doi.org/10.1192/bjp.205.1.76a
Gillenwater, S. (2016). Immigrant CEOs: What Global Citizens Bring to American Business. https://web.boardroominsiders.com/immigrant-ceos-what-global-citizens-bring-to-american-business
Giuliano, P. (2007). Living arrangements in Western Europe: Does cultural origin matter? Journal of the European Economic Association, 5(5), 927–952. https://doi.org/10.1162/JEEA.2007.5.5.927
Giuliano, P., & Spilimbergo, A. (2013). Growing up in a recession. Review of Economic Studies. https://doi.org/10.1093/restud/rdt040
Glazer, N., & Moynihan, D. P. (1963). Beyond the melting pot: the Negroes, Puerto Ricans, Jews, Italians, and Irish of New York City. Cambridge, MA: MIT Press.
Goldman, E., Rocholl, J., & So, J. (2009). Political Connections and the Allocation of Procurement Contracts. Review of Finance.
Gombrich, R. F. (2012). Buddhist Precept & Practice. Routledge.
Goodnow, J. D., & Hansz, J. E. (1972). Environmental Determinants of Overseas Market Entry Strategies. Journal of International Business Studies. https://doi.org/10.1057/palgrave.jibs.8490740
Gordon, R. H. (1984). Inflation, Taxation, and Corporate Behavior. The Quarterly Journal of Economics. https://doi.org/10.2307/1885528
Graham, J. R., & Harvey, C. R. (2001). The theory and practice of corporate finance: Evidence from the field. Journal of Financial Economics, 60, 187–243. https://doi.org/10.1016/S0304-405X(01)00044-7
Granovetter, M. S. (1973). The Strength of Weak Ties. American Journal of Sociology. https://doi.org/10.1086/225469
Gray, R., Kouhy, R., & Lavers, S. (1995). Methodological themes: Constructing a research database of social and enviromental reporting by UK companies. Accounting, Auditing & Accountability Journal, 8(2), 78–101. https://doi.org/10.1108/09513579510086812
Gray, S. J. (1988). Towards a Theory of Cultural Influence on the Development of Accounting Systems Internationally. Abacus, 24(1), 1–15. https://doi.org/10.1111/j.1467-6281.1988.tb00200.x
Green, R. C. (1984). Investment incentives, debt, and warrants. Journal of Financial Economics. https://doi.org/10.1016/0304-405X(84)90034-5
Griffin, J. M., Ji, X., & Martin, J. S. (2003). Momentum Investing and Business Cycle Risk: Evidence from Pole to Pole. In Journal of Finance. https://doi.org/10.1046/j.1540-6261.2003.00614.x

Bibliography
350
Grinblatt, M., & Keloharju, M. (2001). How distance, language, and culture influence stockholdings and trades. Journal of Finance, 56(3), 1053–1073. https://doi.org/10.1111/0022-1082.00355
Grove, C. N. (2005). Introduction to the GLOBE Research Project on Leadership Worldwide. https://www.grovewell.com/wp-content/uploads/pub-GLOBE-intro.pdf
Gruber, J., & Hungerman, D. M. (2008). The church versus the mall: What happens when religion faces increased secular competition? Quarterly Journal of Economics. https://doi.org/10.1162/qjec.2008.123.2.831
Guay, W. R. (1999). The sensitivity of CEO wealth to equity risk: an analysis of the magnitude and determinants. Journal of Financial Economics. https://doi.org/10.1016/S0304-405X(99)00016-1
Guba, E. G., & Lincoln, Y. S. (1994). Competing paradigms in qualitative research. In N. K. Denzin & Y. S. Lincoln (Eds.), Handbook of Qualitative Research (pp. 105–117). Thousand Oaks, CA: Sage.
Guiso, L., Sapienza, P., & Zingales, L. (2004). The role of social capital in financial development. American Economic Review, 94(3), 526–556. https://doi.org/10.1257/0002828041464498
Guiso, L., Sapienza, P., & Zingales, L. (2006). Does culture affect economic outcomes? Journal of Economic Perspectives, 20(2), 23–48. https://doi.org/10.1257/jep.20.2.23
Guiso, L., Sapienza, P., & Zingales, L. (2008). Trusting the stock market. The Journal of Finance, 63(6), 2557–2600. https://doi.org/10.1111/j.1540-6261.2008.01408.x
Guiso, L., Sapienza, P., & Zingales, L. (2013). The determinants of attitudes toward strategic default on mortgages. Journal of Finance, 68(4), 1473–1515. https://doi.org/10.1111/jofi.12044
Guiso, L., Sapienza, P., & Zingales, L. (2016). LONG-TERM PERSISTENCE. Journal of the European Economic Association, 14(6), 1401–1436. https://doi.org/10.1111/jeea.12177
Gulati, R., & Westphal, J. D. (1999). Cooperative or controlling? The effects of CEO-board relations and the content of interlocks on the formation of joint ventures. Administrative Science Quarterly. https://doi.org/10.2307/2666959
Gunawardana, R. A. L. H. (1971). Irrigation and Hydraulic Society in Early Medieval Ceylon. Oxford University Press on Behalf of The Past and Present Society, 53, 3–27.
Guner, A. B., Malmendier, U., & Tate, G. (2008). Financial Expertise of Directors. Journal of Financial Economics, 88(2), 323–354.
Hackbarth, D. (2008). Managerial traits and capital structure decisions. Journal of Financial and Quantitative Analysis, 43(4), 843–882. https://doi.org/10.1017/S002210900001437X
Hair, J. F., Black, W. C., Babin, B. J., & Anderson, R. E. (2010). Multivariate Data Analysis 7ed. In Pearson Prentice Hall. https://doi.org/10.1016/j.ijpharm.2011.02.019
Haj Youssef, M. S., & Christodoulou, I. (2018). Exploring cultural heterogeneity: The effect of intra-cultural variation on executives’ latitude of actions in 18 countries. International Journal of Cross Cultural Management. https://doi.org/10.1177/1470595818790611
Håkanson, L., & Ambos, B. (2010). The antecedents of psychic distance. Journal of International Management, 16(3), 195–210. https://doi.org/10.1016/j.intman.2010.06.001
Halkos, G. E., & Tzeremes, N. G. (2011). Modelling the effect of national culture on multinational banks’ performance: A conditional robust nonparametric frontier analysis. Economic Modelling. https://doi.org/10.1016/j.econmod.2010.07.002
Hallock, W., & Wade, H. T. (1906). Outlines of the evolution of weights and measures and the metric system. London: The Macmillan company.
Hambrick, D. C. (2007). Upper Echelons Theory : An Update. Academy of Management Review, 32(2), 334–

Bibliography
351
343. http://www.jstor.org/stable/20159303%5Cnhttp://about.jstor.org/terms
Hambrick, D. C., & Mason, P. A. (1984). Upper Echelons: The Organization as a Reflection of Its Top Managers. Academy of Management Review, 9(2), 193–206. https://doi.org/10.5465/amr.1984.4277628
Hambrick, Geletkanycz, M. A., & Fredrickson, J. W. (1993). Top executive commitment to the status quo: Some tests of its determinants. Strategic Management Journal, 14(6), 401–418. https://doi.org/10.1002/smj.4250140602
Harding, M., & Lamarche, C. (2009). A quantile regression approach for estimating panel data models using instrumental variables. Economics Letters, 104(3), 133–135.
Harding, M., & Lamarche, C. (2014). Estimating and testing a quantile regression model with interactive effects. Journal of Econometrics, 178(1), 101–113.
Harris, M., & Raviv, A. (1988). Corporate control contests and capital structure. Journal of Financial Economics. https://doi.org/10.1016/0304-405X(88)90040-2
Harris, M., & Raviv, A. (1990). Capital Structure and the Informational Role of Debt. The Journal of Finance, 45(2), 321–349.
Harris, M., & Raviv, A. (1991). The Theory of Capital Structure. The Journal of Finance, 46(1), 297–355.
Harrison, D. A., & Klein, K. J. (2007). What’s the Difference ? Diversity Constructs as Separation , Variety , or Disparity in Organizations. Academy of Management Review, 32(4), 1199–1228. https://doi.org/10.5465/AMR.2007.26586096
Harrison, G. L., McKinnon, J. L., Panchapakesan, S., & Leung, M. (1994). The Influence of Culture on Organizational Design and Planning and Control in Australia and the United States Compared with Singapore and Hong Kong. Journal of International Financial Management & Accounting. https://doi.org/10.1111/j.1467-646X.1994.tb00045.x
Haskins, C. H. (1912). The abacus and the king’s Curia. English Historical Review. https://doi.org/10.1093/ehr/XXVII.CV.101
Heaton, J. B. (2002). Managerial Optimism and Corporate Finance. Financial Management. https://doi.org/10.2307/3666221
Heckman, J. J. (1979). Sample selection bias as a specification error. Econometrica, 47(1), 153–161.
Hennessy, C. A., & Whited, T. M. (2005). Debt dynamics. Journal of Finance. https://doi.org/10.1111/j.1540-6261.2005.00758.x
Hermalin, B. E., & Weisbach, M. S. (1991). The Effects of Board Composition and Direct Incentives on Firm Performance. Financial Management, 20(4), 101–112.
Hermalin, B. E., & Weisbach, M. S. (1998). Endogenously Chosen Boards of Directors and Their Monitoring of the CEO. American Economic Review. https://doi.org/10.2307/116820
Hermalin, B. E., & Weisbach, M. S. (2003). Boards of Directors as an Endogenously Determined Institution : A Survey of the Economic Literature. April, 7–26.
Hewstone, M., Rubin, M., & Willis, H. (2002). Intergroup Bias. Annual Review of Psychology, 53(1), 575–604. https://doi.org/10.1146/annurev.psych.53.100901.135109
Hill, C. W. L., & Snell, S. A. (1988). External control, corporate strategy, and firm performance in research‐intensive industries. Strategic Management Journal. https://doi.org/10.1002/smj.4250090605
Hirshleifer, D., & Thakor, A. (1992). Managerial conservatism, project choice and debt. The Review of Financial Studies, 5(3), 437–470.

Bibliography
352
Hochman, S., & Palmon, O. (1985). The Impact of Inflation on the Aggregate Debt-Asset Ratio. The Journal of Finance, 40(4), 1115–1125.
Hofstede, G. (1980). Culture’s Consequences: International Differences in Work-Related Values. SAGE Publications, Beverly Hills, CA.
Hofstede, G. (1983). The Cultural Relativity Of Organizational Practices and Theories. Journal of International Business Studies, 14, 75–89.
Hofstede, G. (1984). Cultural dimensions in management and planning. Asia Pacific Journal of Management, 1, 81–99. https://doi.org/10.1007/BF01733682
Hofstede, G. (1989). Organising for cultural diversity. European Management Journal. https://doi.org/10.1016/0263-2373(89)90075-3
Hofstede, G. (1991). Cultures And Organizations - Software of the Mind. In Development. Maidenhead, UK: Mcgraw‐Hill.
Hofstede, G. (2001). Culture ́ s consequences : Comparing values , behaviors , institutions , and organizations across nations (2nd ed.). SAGE Publications, Beverly Hills, CA. https://doi.org/10.1177/0022022110388567
Hofstede, G. (2011). National cultures, organizational cultures, and the role of management”. Values and Ethics for the 21st Century. Madrid: …, 385–403. https://www.bbvaopenmind.com/wp-content/uploads/2013/02/National-Cultures-Organizational-Cultures-and-the-Role-of-Management_Geert-Hofstede.pdf
Hofstede, G., & Bond, M. H. (1988). The Confucius connection: From cultural roots to economic growth. Organizational Dynamics, 16(4), 5–21. https://doi.org/10.1016/0090-2616(88)90009-5
Hofstede, G., Hofstede, G. J., & Minkov, M. (2010). Cultures and Organizations. In Cultures and Organizations (3rd ed.). McGraw-Hill. https://doi.org/10.1007/s11569-007-0005-8
Hofstede, G., Neuijen, B., Ohayv, D. D., & Sanders, G. (1990). Measuring Organizational Cultures: A Qualitative and Quantitative Study Across Twenty Cases. Administrative Science Quarterly, 35(2), 286–316. https://doi.org/10.2307/2393392
Hoshi, T., Kashyap, A., & Scharfstein, D. (1990). The role of banks in reducing the costs of financial distress in Japan. Journal of Financial Economics. https://doi.org/10.1016/0304-405X(90)90021-Q
Houle, C. O. (1990). Who Should Be on Your Board? Nonprofit World.
House, R. J., Hanges, P. J., Javidan, M., Dorfman, P. W., & Gupta, V. (2004). Culture, Leadership , and Organizations. The GLOBE Study of 62 Societies.
Hovakimian, A., Opler, T., & Titman, S. (2001). The Debt-Equity Choice. The Journal of Financial and Quantitative Analysis. https://doi.org/10.2307/2676195
Hsieh, H. F., & Shannon, S. E. (2005). Three approaches to qualitative content analysis. Qualitative Health Research. https://doi.org/10.1177/1049732305276687
Hull, R. M. (1999). Leverage Ratios, Industry Norms, and Stock Price Reaction: An Empirical Investigation of Stock-for-Debt Transactions. Financial Management. https://doi.org/10.2307/3666193
Huse, M. (1994). Board-Management Relations in Small Firms : The Paradox of Simultaneous Independence and Interdependence.
Hymowitz, C. (2004). Foreign-Born CEOs Are Increasing in U.S., Rarer Overseas. https://www.wsj.com/articles/SB108543349255419931
In Celebration Of The New Harvest: Aluth Sahal Mangallaya. (2017). Explore Sri Lanka. http://exploresrilanka.lk/2017/04/celebration-new-harvest-aluth-sahal-mangallaya/

Bibliography
353
Inman, P. (2019). Top UK firms failing to increase boardroom diversity, study shows. The Guardian. https://www.theguardian.com/business/2019/dec/04/top-uk-firms-failing-to-increase-boardroom-diversity-study-shows
Jaffe, J. F. (1978). A NOTE ON TAXATION AND INVESTMENT. The Journal of Finance. https://doi.org/10.1111/j.1540-6261.1978.tb03430.x
Jain, S. C. (1989). Standardization of International Marketing Strategy: Some Research Hypotheses. Journal of Marketing. https://doi.org/10.2307/1251525
Jayawardana, W. A. (1964). Purathana Lankawa (Ancient Lanka) From 304-560 AD. University of Kelaniya, Sri Lanka.
Jenkinson, T., Morrison, A. D., & Wilhelm, W. J. (2006). Why are European IPOs so rarely priced outside the indicative price range? Journal of Financial Economics. https://doi.org/10.1016/j.jfineco.2005.05.001
Jensen, M. (1986). Agency Costs of Free Cash Flow , Corporate Finance , and Takeovers. American Economic Review, 76(2), 323–329.
Jensen, M. (1993). The Modern Industrial Revolution , Exit , and the Failure of Internal Control Systems. The Journal of Business, 48(3), 831–880.
Jensen, M., & Meckling, W. (1976). Theory of the Firm : Managerial Behavior , Agency Costs and Ownership Structure Theory of the Firm : Managerial Behavior , Agency Costs and Ownership Structure. Journal of Financial Economics, 3, 305–360. https://doi.org/10.1016/0304-405X(76)90026-X
Ji, L. J., Zhang, Z., & Guo, T. (2008). To buy or to sell: Cultural differences in stock market decisions based on price trends. Journal of Behavioral Decision Making. https://doi.org/10.1002/bdm.595
Johanson, J., & Vahlne, J.-E. (1977). The Internationalization Process of the Firm—A Model of Knowledge Development and Increasing Foreign Market Commitments. Journal of International Business Studies, 8(1), 23–32. https://doi.org/10.1057/palgrave.jibs.8490676
Johanson, J., & Wiedersheim‐Paul, F. (1975). The Internationalization Of The Firm — Four Swedish Cases. Journal of Management Studies, 12(3), 305–323. https://doi.org/10.1111/j.1467-6486.1975.tb00514.x
John, K., & Williams, J. (1985). Dividends, Dilution, and Taxes: A Signalling Equilibrium. The Journal of Finance. https://doi.org/10.1111/j.1540-6261.1985.tb02363.x
Jones, M. J. (2009). Origins of medieval Exchequer accounting. Accounting, Business and Financial History, 19(3), 259–285. https://doi.org/10.1080/09585200802667147
Jones, M. J. (2010). Sources of power and infrastructural conditions in medieval governmental accounting. Accounting, Organizations and Society. https://doi.org/10.1016/j.aos.2009.01.005
Jung, K., Kim, Y. C., & Stulz, R. M. (1996). Timing, investment opportunities, managerial discretion, and the security issue decision. Journal of Financial Economics, 42, 159–185. https://doi.org/10.1016/0304-405X(96)00881-1
Kahneman, D., Knetsch, J. L., & Thaler, R. H. (1991). Anomalies: The Endowment Effect, Loss Aversion and Status Quo Bias. Journal of Economic Perspectives, 5(1), 193–206. https://doi.org/10.1257/jep.5.1.193
Kahneman, D., & Lovallo, D. (1993). Timid Choices and Bold Forecasts: A Cognitive Perspective on Risk Taking. Management Science, 39(1), 17–31. https://doi.org/10.1287/mnsc.39.1.17
Kahneman, D., & Tversky, A. (1979). Kahneman & Tversky (1979) - Prospect Theory - An Analysis Of Decision Under Risk.pdf. In Econometrica. https://doi.org/10.2307/1914185
Karolyi, G. A. (2016). The gravity of culture for finance. Journal of Corporate Finance, 41, 610–625. https://doi.org/10.1016/j.jcorpfin.2016.07.003
Kato, K., GalvaoJr., A. F., & Montes-Rojas, G. V. (2012). Asymptotics for panel quantile regression models

Bibliography
354
with individual effects. Journal of Econometrics, 170(1), 76–91.
Kaufman, B. E. (1999). Emotional arousal as a source of bounded rationality. Journal of Economic Behavior and Organization. https://doi.org/10.1016/s0167-2681(99)00002-5
Kayo, E. K., & Kimura, H. (2011). Hierarchical determinants of capital structure. Journal of Banking & Finance, 35, 358–371.
Kesner, I. F. (1987). Directors’ Stock Ownership and Organizational Performance: An Investigation of Fortune 500 Companies. Journal of Management. https://doi.org/10.1177/014920638701300306
Kester, W. C. (1986). Capital and Ownership Structure: A Comparison of United States and Japanese Manufacturing Corporations. Financial Management. https://doi.org/10.2307/3665273
Kim, E. H. (1978). A Mean-Variance Theory of Optimal Capital Structure and Corporate Debt Capacity. The Journal of Finance, 33(1), 45–63.
Kim, K., & Cloud, S. (2014). Board Heterogeneity: Double-Edged Sword ? Focusing on the Moderating Effects of Risk on Heterogeneity-Performance Linkage. Electronic Business Journal, 13(9), 584–600.
Kirkman, B. L., Lowe, K. B., & Gibson, C. B. (2006). A quarter century of culture’s consequences: A review of empirical research incorporating Hofstede’s cultural values framework. Journal of International Business Studies, 37(3), 285–320. https://doi.org/10.1057/palgrave.jibs.8400202
Kisgen, D. J. (2006). Credit ratings and capital structure. Journal of Finance. https://doi.org/10.1111/j.1540-6261.2006.00866.x
Klein, A. (2002). Economic Determinants of Audit Committee Independence. The Accounting Review, 77(2), 435–452.
Klostad, U. (2017). The value of women’s work: Reflections on Norway’s gender quotas. BroadAgenda. https://www.broadagenda.com.au/2017/the-value-of-womens-work-reflections-on-norways-gender-quotas/
Koenker, R. (2004). Quantile regression for longitudinal data. Journal of Multivariate Analysis, Volume 91(1), 74–89.
Koenker, R. (2005). Quantile Regression. Cambridge University Press.
Koenker, R., & Bassett, G. (1978). Regression Quantiles. Econometrica, 46(1), 33. https://doi.org/10.2307/1913643
Kogut, B., & Singh, H. (1988). the Effectof Nationalcultureon the Choiceof Entrymode. Journal of International Business Studies.
Kohn, M., & Schooler, C. (1983). Work And Personality. In Body & Society. https://doi.org/10.1177/1357034X99005002004
Konara, P., & Mohr, A. (2019). Why We Should Stop Using the Kogut and Singh Index. Management International Review, 59(3), 335–354. https://doi.org/10.1007/s11575-019-00378-7
Kosnik, R. D. (1990). Effects of Board Demography and Directors ’ Incentives on Corporate Greenmail Decisions. The Academy of Management Journal, 33(1), 129–150.
Kostova, T., Nell, P. C., & Hoenen, A. K. (2017). Understanding Agency Problems in Headquarters-Subsidiary Relationships in Multinational Corporations: A Contextualized Model. Journal of Management, 3(1), 57–81.
Kraus, A., & Litzenberger, R. H. (1973). A State‐Preference Model of Optimal Financial Leverage. The Journal of Finance, 28(4), 911–922. https://doi.org/10.1111/j.1540-6261.1973.tb01415.x
Krause, R., & Semadeni, M. (2013). Apprentice, departure, and demotion: An examination of the three

Bibliography
355
types of CEO-board chair separation. Academy of Management Journal. https://doi.org/10.5465/amj.2011.0121
Krause, R., Semadeni, M., & Cannella, A. A. (2014). CEO Duality: A Review and Research Agenda. In Journal of Management (Vol. 40, Issue 1). https://doi.org/10.1177/0149206313503013
Krippendorff, K. (1989). Content Analysis. 1, 403–407.
Krippendorff, K. (2004). Content Analysis: an introduction to its methodology (2nd ed.). SAGE Publications, Inc.
Kroszner, R. S., & Strahan, P. E. (2001). Bankers on boards : monitoring , conflicts of interest , and lender liability $ (Vol. 62).
Kumar, A., Niessen-Ruenzi, A., & Spalt, O. G. (2015). What’s in a Name? Mutual Fund Flows When Managers Have Foreign-Sounding Names. In Review of Financial Studies (Vol. 28, Issue 8). https://doi.org/10.1093/rfs/hhv017
Kumarasinghe, S. (2011). A counting history. Accounting, Auditing and Accountability Journal, 24(1), 132–132. https://doi.org/10.1108/09513571111098081
Kumarasinghe, S., & Samkin, G. (2018). Impression management and ancient Ceylonese rulers. Accounting History, 1–22. https://doi.org/10.1177/1032373218802892
Kwok, C. C. Y., & Tadesse, S. (2006). National culture and financial systems. Journal of International Business Studies, 37(2), 227–247. https://doi.org/10.1057/palgrave.jibs.8400188
La Porta, R., Lopez-De-Silanes, F., Shleifer, A., & Vishny, R. W. (1997). Legal determinants of external finance. Journal of Finance, 52(3), 1131–1150. https://doi.org/10.1111/j.1540-6261.1997.tb02727.x
Lane, P. J., Salk, J. E., & Lyles, M. A. (2001). Absorptive capacity, learning, and performance in international joint ventures. Strategic Management Journal, 22(12), 1139–1161. https://doi.org/10.1002/smj.206
Larwood, L., & Whittaker, W. (1977). Managerial myopia: Self-serving biases in organizational planning. Journal of Applied Psychology. https://doi.org/10.1037/0021-9010.62.2.194
Lau, D. C., & Murnighan, J. K. (1998). Demographic diversity and faultlines: The compositional dynamics of organizational groups. Academy of Management Review. https://doi.org/10.5465/AMR.1998.533229
Laurent, A. (1986). The cross‐cultural puzzle of international human resource management. Human Resource Management, 25(1), 91–102. https://doi.org/10.1002/hrm.3930250107
Lehn, K., Patro, S., & Zhao, M. (2005). Determinants of the Size and Structure of Corporate Boards: 1935-2000. SSRN Electronic Journal. https://doi.org/10.2139/ssrn.470675
Leland, H. E., & Pyle, D. H. (1977). Informational Asymmetries, Financial Structure, and Financial Intermediation. The Journal of Finance, 32(2), 371. https://doi.org/10.2307/2326770
Lemmon, M. L., Roberts, M. R., & Zender, J. F. (2008). Back to the beginning: Persistence and the cross-section of corporate capital structure. Journal of Finance, 63(4), 1575–1608. https://doi.org/10.1111/j.1540-6261.2008.01369.x
Lennox, C. S., Francis, J. R., & Wang, Z. (2012). Selection models in accounting research. Accounting Review. https://doi.org/10.2308/accr-10195
Levinson, J. D., & Peng, K. (2007). Valuing Cultural Differences in Behavioral Economics. ICFAI Journal of Behavioral Finance, 4(1), 32–47. http://ssrn.com/paper=899688
Li, J., & Tang, Y. (2010). CEO hubris and firm risk taking in China: the moderating role of managerial discretion. Academy of Management Journal. https://doi.org/10.5465/amj.2010.48036912
Li, K., Griffin, D., Yue, H., & Zhao, L. (2011). National culture and capital structure decisions: Evidence from

Bibliography
356
foreign joint ventures in China. Journal of International Business Studies, 42(4), 477–503. https://doi.org/10.1057/jibs.2011.7
Li, K., Griffin, D., Yue, H., & Zhao, L. (2013). How does culture influence corporate risk-taking? Journal of Corporate Finance. https://doi.org/10.1016/j.jcorpfin.2013.07.008
Licht, A. N. (2001). The Mother of All Path Dependencies: Toward a Cross-Cultural Theory of Corporate Governance Systems. Delaware Journal of Corporate Law, 26(1), 147–205. https://doi.org/10.2139/ssrn.208489
Linck, J. S., Netter, J. M., & Yang, T. (2008). The determinants of board structure. Journal of Financial Economics. https://doi.org/10.1016/j.jfineco.2007.03.004
Lipton, M., & Lorsch, J. W. (1992). A modest proposal for improved corporate governance. Iowa Law Review.
Littleton, A. C. (1927). The Antecedents of Double-Entry. The Accounting Review, 2(2), 140–149.
Liu, X. (2016). Corruption culture and corporate misconduct. Journal of Financial Economics, 122(2). https://doi.org/10.1016/j.jfineco.2016.06.005
Liyanarachchi, Gregory A. (2009). Accounting in ancient Sri Lanka: Some evidence of the accounting and auditing practices of Buddhist monasteries during 815-1017 AD. Accounting History, 14(1–2), 101–120. https://doi.org/10.1177/1032373208098554
Liyanarachchi, Gregory A. (2008). Ethics in accounting: Exploring the relevance of a Buddhist perspective. Accountancy Business and the Public Interest, 7(2), 118–148.
Liyanarachchi, Gregory Asoka. (2015). Antecedents of double-entry bookkeeping and Buddhist Temple Accounting. Accounting History, 20(1), 85–106. https://doi.org/10.1177/1032373214560154
Lloyd-Davies, P. (1975). Optimal Financial policy in Imperfect Markets. The Journal of Financial and Quantitative Analysis, 10(3), 457–481.
Luigi, P., & Sorin, V. (2009). A Review of the Capital Structure Theories. Annals of Faculty of Economics, 3(1), 315–320.
Lune, H., & Berg, B. L. (2017). Qualitative Research Methods for the Social Sciences (9th ed.). Pearson Education Limited.
MacKay, P., & Phillips, G. M. (2005). How does industry affect firm financial structure? Review of Financial Studies, 18(4), 1433–1466. https://doi.org/10.1093/rfs/hhi032
MacKie‐Mason, J. K. (1990). Do Taxes Affect Corporate Financing Decisions? The Journal of Finance, 45, 1471–1493. https://doi.org/10.1111/j.1540-6261.1990.tb03724.x
Mahadeo, J. D., Soobaroyen, T., & Hanuman, V. O. (2012). Board Composition and Financial Performance : Uncovering the Effects of Diversity in an Emerging Economy. Journal of Business Economics, 105, 375–388. https://doi.org/10.1007/s10551-011-0973-z
Malmendier, U., & Tate, G. (2007). Corporate Financial Policies With Overconfident Managers. Corporate Governance.
Malmendier, U., & Tate, G. (2008). Who makes acquisitions? CEO overconfidence and the market’s reaction. Journal of Financial Economics. https://doi.org/10.1016/j.jfineco.2007.07.002
Malmendier, U., Tate, G., & Yan, J. (2011). Overconfidence and Early-Life Experiences: The Effect of Managerial Traits on Corporate Financial Policies. Journal of Finance. https://doi.org/10.1111/j.1540-6261.2011.01685.x
Malul, M., & Shoham, A. (2008). A global analysis of culture and imperfect competition in banking systems. International Journal of Financial Services Management. https://doi.org/10.1504/ijfsm.2008.019666

Bibliography
357
March, J. G., & Simon, H. A. (1993). Organizations. 1958. In NY: Wiley, New York (2nd ed.). Wiley-Blackwell.
Masson, R. T. (1971). Executive Motivations, Earnings, and Consequent Equity Performance. Journal of Political Economy. https://doi.org/10.1086/259835
Mattessich, R. (1989). Accounting and the Input-Output Principle in the Prehistoric and Ancient World. Abacus, 25(2), 78–84.
Mattessich, R. (1998). Review and extension of Bhattacharyya’s Modern Accounting Concepts in Kautilya ’s Arthaśāstra. Accounting, Business & Financial History. https://doi.org/10.1080/095852098330512
McGuire, J. B., Sundgren, A., & Schneeweis, T. (1988). Corporate Social Responsibility and Firm Financial Performance. Academy of Management Journal. https://doi.org/10.5465/256342
McPherson, M., Smith-Lovin, L., & Cook, J. M. (2001). Birds of a Feather: Homophily in Social Networks. Annual Review of Sociology, 27, 415–444. https://www.jstor.org/stable/2678628?pq-origsite=summon&seq=1#metadata_info_tab_contents
McSweeney, B. (2002). Hofstede ’ s model of national cultural differences and their consequences: A triumph of faith - a failure of analysis. Human Relations, 55(1), 89–118.
Melicher, R. W., Rush, D. F., & Winn, D. N. (1976). Industry Concentration, Financial Structure and Profitability. Financial Management, 5(3), 48–53.
Merrilees, B., McKenzie, B., & Miller, D. (2007). Culture and marketing strategy in discount retailing. Journal of Business Research. https://doi.org/10.1016/j.jbusres.2006.10.016
Miguel, E., Saiegh, S. M., & Satyanath, S. (2011). Civil war exposure and violence. Economics and Politics. https://doi.org/10.1111/j.1468-0343.2010.00372.x
Miller, D. (1991). Stale in the saddle: CEO tenure and the match between organization and environment. Management Science. https://doi.org/10.1287/mnsc.37.1.34
Miller, P., & Napier, C. (1993). Genealogies of calculation. Accounting, Organizations and Society. https://doi.org/10.1016/0361-3682(93)90047-A
Millington, A., & Bayliss, B. (1996). Corporate Integration and Market Liberalisation in the EU. 14(2).
Mitra, D., & Golder, P. N. (2002). Whose culture matters? Near-market knowledge and its impact on foreign market entry timing. Journal of Marketing Research. https://doi.org/10.1509/jmkr.39.3.350.19112
Mizruchi, M. S. (1996). What Do Interlocks Do? An Analysis, Critique, and Assessment of Research on Interlocking Directorates Mark S. Mizruchi Annual Review of Sociology, Vol. 22. (1996), pp. 271-298. Annual Review of Sociology, 22(1996), 271–298.
Modigliani, F. (1982). Debt, Dividend Policy, Taxes, Inflation and Market Valuation. The Journal of Finance, 37, 255–273. https://doi.org/10.1111/j.1540-6261.1982.tb03549.x
Modigliani, F., & Cohn, R. A. (1979). Inflation, Rational Valuation and the Market. Financial Analysts Journal. https://doi.org/10.2469/faj.v35.n2.24
Modigliani, F., & Miller, M. H. (1958). The Cost of Capital, Corporation Finance and the Theory of Investment. American Economic Review, 48(3), 261–297. https://doi.org/10.1257/aer.103.5.i
Modigliani, F., & Miller, M. H. (1963). Corporate Income Taxes and the Cost of Capital: A Correction. The American Economic Review, 53(3), 433–443.
Morellec, E. (2004). Can Managerial Discretion Explain Observed Leverage Ratios? Review of Financial Studies, 17(1), 257–294. https://doi.org/10.1093/rfs/hhg036
Morosini, P., Shane, S., & Singh, H. (1998). National Cultural Distance and Cross-Border Acquisition Performance. Journal of International Business Studies, 29(1), 137–158.

Bibliography
358
https://doi.org/10.1057/palgrave.jibs.8490029
Moscovici, S., & Zavalloni, M. (1969). The group as a polarizer of attitudes. Journal of Personality and Social Psychology, 12(2), 125–135. https://doi.org/10.1037/h0027568
Murray, A. I. (1989). Top management group heterogeneity and firm performance. Strategic Management Journal. https://doi.org/10.1002/smj.4250100710
Myers, S. C. (1977). Determinants of corporate borrowing. Journal of Financial Economics, 5, 147–175. https://doi.org/10.1016/0304-405X(77)90015-0
Myers, S. C. (1984). The Capital Structure Puzzle. The Journal of Finance, 39(3), 575. https://doi.org/10.1111/j.1540-6261.1984.tb03646.x
Myers, S. C., & Majluf, N. S. (1984). Corporate financing and investment decisions when firms have information that investors do not have. Journal of Financial Economics. https://doi.org/10.1016/0304-405X(84)90023-0
Nadler, C., & Breuer, W. (2019). Cultural Finance as a research field : an evaluative survey. Journal of Business Economics, 89(2), 191–220. https://doi.org/10.1007/s11573-017-0888-y
Nakata, C., & Sivakumar, K. (1996). National culture and new product development: An integrative review. Journal of Marketing. https://doi.org/10.2307/1251888
Naor, M., Linderman, K., & Schroeder, R. (2010). The globalization of operations in Eastern and Western countries: Unpacking the relationship between national and organizational culture and its impact on manufacturing performance. Journal of Operations Management. https://doi.org/10.1016/j.jom.2009.11.001
Neimark, M. (1983). How to Use Content Analysis in Historical Research. The Accounting Historians Notebook, 6(2).
Newman, K. L., & Nollen, S. D. (1996). Culture and congruence: The fit between management practices and national culture. Journal of International Business Studies. https://doi.org/10.1057/palgrave.jibs.8490152
Ng, S. I., Lee, J. A., & Soutar, G. N. (2007). Are Hofstede’s and Schwartz’s value frameworks congruent? International Marketing Review. https://doi.org/10.1108/02651330710741802
Nguyen, D. D., Hagendorff, J., & Eshraghi, A. (2018). Does a CEO’s cultural heritage affect performance under competitive pressure? Review of Financial Studies, 31(1), 97–141. https://doi.org/10.1093/rfs/hhx046
Nickell, S. (1981). Biases in Dynamic Models with Fixed Effects. Econometrica, 49(6), 1417–1426. https://doi.org/10.1016/j.dyepig.2005.07.001
Nissen, H., Damerow, P. & Englund, R. (1993). Archaic Bookkeeping translated by P. Larsen. Chicago: The University of Chicago Press.
Nordstrӧm, K., & Vahlne, J. (1994). Is the globe shrinking? Psychic distance and the establishment of Swedish sales subsidiaries during the last 100 years. International Trade: Regional and Global Issues.
North, D. C. (1990). A Transaction Cost Theory of Politics. Journal of Theoretical Politics. https://doi.org/10.1177/0951692890002004001
Opler, T. C., & Titman, S. (1994). Financial Distress and Corporate Performance. The Journal of Finance, 49(3), 1015–1040. https://doi.org/10.1111/j.1540-6261.1994.tb00086.x
Orens, R., & Reheul, A. M. (2013). Do CEO demographics explain cash holdings in SMEs? European Management Journal, 31(6), 549–563. https://doi.org/10.1016/j.emj.2013.01.003
Pan, Y., Siegel, S., & Wang, T. Y. (2017). Corporate risk culture. Journal of Financial and Quantitative

Bibliography
359
Analysis. https://doi.org/10.1017/S0022109017000771
Paranavitana, S. (1933). Epigraphia Zeylanica Being Lithic and Other Inscriptions of Ceylon (Volume III). London: Humphrey Milford, Oxford University Press, Amen House, E.C.
Paranavitana, S. (1983). Inscriptions of Ceylon: Volume II Part I. Late Brahmi Inscriptions. Colombo: Department of Archaeology, Ceylon.
Park, S. H., & Westphal, J. D. (2013). Social Discrimination in the Corporate Elite: How Status Affects the Propensity for Minority CEOs to Receive Blame for Low Firm Performance. Administrative Science Quarterly, 58(4), 542–586. https://doi.org/10.1177/0001839213509364
Parkhe, A. (1991). Interfirm Diversity, Organizational Learning and Longevity in Global Strategic Alliances. Journal of International Business Studies, 22, 579–601.
Pathan, S. (2009). Strong boards , CEO power and bank risk-taking. Journal of Banking and Finance, 33, 1340–1350. https://doi.org/10.1016/j.jbankfin.2009.02.001
Pearce, J. A., & Zahra, S. A. (1992). Board Composition From a Strategic Contingency Perspective. Journal of Management Studies. https://doi.org/10.1111/j.1467-6486.1992.tb00672.x
Perera, L. S., Kiribamune, S., & Sēnānāyaka, P. (2001). The Institutions of Ancient Ceylon from Inscriptions Vol I (From 3 century BC to 830 AD). Kandy International Centre for Ethnic Studies.
Pfeffer, J., & Salancik, G. R. (1978). An external perspective on organizations, Organization and social context defined & Social control of organizations. In The External Control of Organizations: A Resource Dependence Perspective.
Pfeffer, Jeffrey. (1972). Size and Composition of Corporate Boards of Directors: The Organization and its Environment. Administrative Science Quarterly, 17(2), 218–228.
Pirouz, D. M. (2012). National Culture and Global Stock Market Volatility. Saudi Med J, 33(949), 3–8. https://doi.org/10.1073/pnas.0703993104
Ponomareva, M. (2010). Quantile regression for panel data models with fixed effects and small T: Identification and estimation. In University of Western Ontario.
Powell, D. (2016). Quantile regression with nonadditive fixed effects (Quantile Treatment Effects).
Previts, G. J. (1984). Methods and meanings of historical interpretation for accountancy. The Accounting Historians Notebook, 7(2), 8.
Previts, G. J., & Bricker, R. (1994). Fact and Theory in Accounting History: Presentmindedness and Capital Market Research. Contemporary Accounting Research, 10(2), 625–641. https://doi.org/10.1111/j.1911-3846.1994.tb00408.x
Previts, G. J., Parker, L. D., & Coffman, E. N. (1990a). Accounting History : Definition and Relevance. Abacus, 26(1), 1–16.
Previts, G. J., Parker, L. D., & Coffman, E. N. (1990b). An Accounting Historiography: Subject Matter and Methodology. Abacus, 26(2), 136–158. https://doi.org/10.1111/j.1467-6281.1990.tb00250.x
Pryor, F. L. . (1991). A Buddhist Economic System . In Practice : The Rules of State Policy Making of the Ideal Kings Sought a ’ Middle Way ’ between Right and Left. The American Journal of Economics and Sociology, 50(1), 17–32.
Putnam, R. D. (1993). Making democracy work: Civic traditions in modern Italy. In R. D. Putnam, R. Leonardi, & R. Y. Nanetti (Eds.), Journal of Visual Languages & Computing. Princeton University Press.
Rahula, W. (1956). History of Buddhism in Ceylon. Buddhist Cultural Centre.
Rajan, R. G., & Zingales, L. (1995). What Do We Know about Capital Structure? Some Evidence from

Bibliography
360
International Data. The Journal of Finance, 50(5), 1421–1460. https://doi.org/10.1111/j.1540-6261.1995.tb05184.x
Ramírez, A., & Tadesse, S. (2009). Corporate cash holdings, uncertainty avoidance, and the multinationality of firms. International Business Review, 18(4), 387–403. https://doi.org/10.1016/j.ibusrev.2009.02.013
Ranawella, S. (2004). Inscriptions of Ceylon, Volume V, Part II (from 924 to 1017 AD). Department of Archaeology.
Rechner, P. L., & Dalton, D. R. (1989). The Impact of CEO as Board Chairperson on Corporate Performance: Evidence vs. Rhetoric. Academy of Management Executive, 3(2), 141–143. https://doi.org/10.5465/ame.1989.4274764
Rechner, P. L., & Dalton, D. R. (1991). CEO duality and organizational performance: A longitudinal analysis. Strategic Management Journal. https://doi.org/10.1002/smj.4250120206
Ribbink, D., & Grimm, C. M. (2014). The impact of cultural differences on buyer-supplier negotiations: An experimental study. Journal of Operations Management. https://doi.org/10.1016/j.jom.2014.01.004
Richard, O. C., Wu, P., & Chadwick, K. (2009). The impact of entrepreneurial orientation on firm performance: The role of CEO position tenure and industry tenure. International Journal of Human Resource Management. https://doi.org/10.1080/09585190902850281
Riley, J. G. (1975). Competitive signalling. Journal of Economic Theory. https://doi.org/10.1016/0022-0531(75)90049-6
Rock, K. (1986). Why new issues are underpriced. Journal of Financial Economics, 15(1–2), 187–212. https://doi.org/10.1016/0304-405X(86)90054-1
Roodman, D. (2009). How to do xtabond2: An introduction to difference and system GMM in Stata. Stata Journal. https://doi.org/10.1177/1536867x0900900106
Rosenstein, S., & Wyatt, J. G. (1990). Outside directors, board independence, and shareholder wealth. Journal of Financial Economics. https://doi.org/10.1016/0304-405X(90)90002-H
Ross, S. A. (1977). The Determination of Financial Structure: The Incentive-Signalling Approach. The Bell Journal of Economics, 8(1), 23–40. https://doi.org/10.2469/dig.v27.n1.2
Rothschild, M., & Stiglitz, J. (1976). Equilibrium in Competitive Insurance Markets: An Essay on the Economics of Imperfect Information. The Quarterly Journal of Economics, 90(4), 629. https://doi.org/10.2307/1885326
Ryan, B., Scapens, R. W., & Theobold, M. (2002). Research Method and Methodology in Finance and Accounting (2nd ed.). Cengage Learning.
Ryans, J. K., & Donnelly, J. H. (1969). Standardized Global Advertising, a Call As Yet Unanswered. Journal of Marketing. https://doi.org/10.2307/1249405
Sah, R. K., & Stiglitz, J. E. (1986). The Architecture of Economic Systems: Hierarchies and Polyarchies. The American Economic Review.
Sah, R. K., & Stiglitz, J. E. (1991). The Quality of Managers in Centralized Versus Decentralized Organizations. The Quarterly Journal of Economics. https://doi.org/10.2307/2937917
Samuelson, W., & Zeckhauser, R. (1988). Status Quo Bias in Decision Making. Journal of Risk and Uncertainty, 1(1), 7–59. https://doi.org/10.1007/BF00055564
Sartori, A. E. (2003). An Estimator for Some Binary-Outcome Selection Models Without Exclusion Restrictions. Political Analysis. https://doi.org/10.1093/pan/mpg001
Saunders, M., Lewis, P., & Thornhill, A. (2007). Research Methods for Business Students (4th ed.). Pearson

Bibliography
361
Education Limited, New York.
Saunders, M., Lewis, P., & Thornhill, A. (2009). Research Methods for Business Students (5th ed.). Pearson Education Limited, New York.
Scherr, F. C., & Hulburt, H. M. (2001). The Debt Maturity Structure of Small Firms. Financial Management, 30(1), 85–111.
Schmandt-Besserat, D. (1992). Before Writing: Volume I, From Counting to Cuneiform. Texas: The University of Texas Press.
Schuler, R. S., & Rogovsky, N. (1998). Understanding compensation practice variations across firms: The impact of national culture. Journal of International Business Studies. https://doi.org/10.1057/palgrave.jibs.8490030
Schwartz, E., & Aronson, J. R. (1967). Some surrogate evidence in support of the concept of optimal financial structure. The Journal of Finance. https://doi.org/10.1111/j.1540-6261.1967.tb01650.x
Schwartz, S. H. (1992). Universals in the content and structure of values: Theoretical advances and empirical tests in 20 countries. Advances in Experimental Social Psychology, 25(C), 1–65. https://doi.org/10.1016/S0065-2601(08)60281-6
Schwartz, S. H. (1994). Beyond individualism/collectivism: New cultural dimensions of values. In Individualism and Collectivisim: theory, method, and applications. https://doi.org/10.1017/CBO9781107415324.004
Schwartz, S. H. (1999). A theory of cultural values and some implications for work. Applied Psychology. https://doi.org/10.1080/026999499377655
Schwartz, S. H. (2004). Mapping and Interpreting Cultural Differences around the World. In Comparing cultures, Dimensions of culture in a comparative perspective. https://doi.org/10.1177/026858090602100311
Schwartz, S. H. (2006). A theory of cultural value orientations: Explication and applications. Comparative Sociology. https://doi.org/10.1163/156913306778667357
Schwartz, S. H. (2007). A theory of cultural value orientations: Explication and applications. In International Studies in Sociology and Social Anthropology.
Schwartz, S. H. (2008). The 7 Schwartz cultural value orientation scores for 80 countries. https://www.researchgate.net/publication/304715744_The_7_Schwartz_cultural_value_orientation_scores_for_80_countries/citations
Schwartz, S. H., Bardi, A., & Bianchi, G. (2000). Value Adaptation to the Imposition and Collapse of Communist Regimes in East-Central Europe. In S. A. Renshon & J. Duckitt (Eds.), Political Psychology (Vol. 11, Issue 3, pp. 217–237). Palgrave Macmillan. https://doi.org/https://doi.org/10.1057/9780230598744_13
Schwartz, S. H., & Ros, M. (1995). Values in the West: A theoretical and empirical challenge to the individualism-collectivism cultural dimension. World Psychology.
Scott, D. F., & Martin, J. D. (1975). Industry influence on financial structure. Financial Management, 4(1), 67–73. https://doi.org/10.2307/3665473
Scott Jr., J. H. (1977). Bankruptcy, Secured Debt and Optimal Capital Structure. The Journal of Finance, 32(1), 1–19. https://doi.org/10.1111/j.1540-6261.1977.tb03237.x
Seibert, S. E., Kraimer, M. L., & Liden, R. C. (2001). A Social Capital Theory of Career Success. The Academy of Management Journal, 44(2), 219–237. https://doi.org/10.2307/3069452
Sekely, W. S., & Collins, M. J. (1988). Cultural Influences on International Capital Structure. Journal of International Business Studies, 19(1), 87–100.

Bibliography
362
Shao, L., Kwok, C. C. Y., & Zhang, R. (2013). National culture and corporate investment. Journal of International Business Studies. https://doi.org/10.1057/jibs.2013.26
Sheard, P. (1989). The main bank system and corporate monitoring and control in Japan. Journal of Economic Behavior and Organization. https://doi.org/10.1016/0167-2681(89)90037-1
Shefrin, H. (2001). Behavioral Corporate Finance. Journal of Applied Corporate Finance, 14(3), 113–124. https://doi.org/10.1111/j.1745-6622.1999.tb00009.x
Shenkar, O. (2001). Cultural distance revisited: Towards a more rigorous conceptualization and measurement of cultural differences. Journal of International Business Studies. https://doi.org/10.1057/palgrave.jibs.8490982
Shenkar, O., Luo, Y., & Yeheskel, O. (2008). From “distance” to “friction”: substituting metaphors and redirecting intercultural research. In Academy of Management Review. https://doi.org/10.5465/AMR.2008.34421999
Shyam-Sunder, L., & Myers, S. C. (1999). Testing Static Trade Off Against Pecking Order Models of Capital Structure. Journal of Financial Economics, 51, 219–244. https://doi.org/10.1016/S0304-405X(98)00051-8
Siegel, J. I., Licht, A. N., & Schwartz, S. H. (2011). Egalitarianism and international investment. Journal of Financial Economics, 102(3), 621–642. https://doi.org/10.1016/j.jfineco.2011.05.010
Sila, V., Gonzalez, A., & Hagendorff, J. (2016). Women on board: Does boardroom gender diversity affect firm risk? Journal of Corporate Finance, 36, 26–53. https://doi.org/10.1016/j.jcorpfin.2015.10.003
Simon, H. A. (1991). Bounded Rationality and Organizational Learning. Organization Science, 2(1), 125–134.
Singh, V. (2007). Ethnic diversity on top corporate boards : a resource dependency perspective Ethnic diversity on top corporate boards : a resource dependency perspective. The International Journal of Human Resource Management, 18, 2128–2146. https://doi.org/10.1080/09585190701695275
Sivakumar, K., & Nakata, C. (2001). The stampede toward Hofstede ’ s framework : Avoiding the sample design pit in ... International Business.
Smith, C. W. (1977). Alternative methods for raising capital. Rights versus underwritten offerings. Journal of Financial Economics. https://doi.org/10.1016/0304-405X(77)90040-X
Smith, C. W., & Warner, J. B. (1979). On financial contracting. An analysis of bond covenants. Journal of Financial Economics. https://doi.org/10.1016/0304-405X(79)90011-4
Smith, M., & Taffler, R. J. (2000). The chairman’s statement - A content analysis of discretionary narrative disclosures. Accounting, Auditing & Accountability Journal. https://doi.org/10.1108/09513570010353738
Smith, N. (2014). Gender quotas on boards of directors Little evidence that gender quotas for women on boards of directors. May, 1–10. https://doi.org/10.15185/izawol.7
Solomon, E. (1963). Leverage and the Cost of Capital. The Journal of Finance, 18(2), 273–279.
Sousa, C. M. P., & Bradley, F. (2006). Cultural Distance and Psychic Distance : Two Peas in a Pod ? Carlos M . P . Sousa. Journal of International Marketing, 14(1), 49–70. http://www.atypon-link.com/AMA/doi/abs/10.1509/jimk.14.1.49
Spence, M. (1973). Job Market Signaling. The Quarterly Journal of Economics, 87(3), 355–374.
Sri Dalada Maligawa Temple of the Sacred Tooth Relic. (2019). http://sridaladamaligawa.lk/
Stahl, G. K., & Tung, R. L. (2015). Towards a more balanced treatment of culture in international business studies: The need for positive cross-cultural scholarship. Journal of International Business Studies, 46(4), 391–414. https://doi.org/10.1057/jibs.2014.68

Bibliography
363
Stanton, P., Stanton, J., & Pires, G. (2004). Impressions of an annual report: An experimental study. Corporate Communications: An International Journal, 9(1), 57–69. https://doi.org/10.1108/13563280410516500
Stata. (n.d.). Stata panel-data unit-root tests. https://www.stata.com/features/overview/panel-data-unit-root-tests/
Steenkamp, J. B. E. M. (2001). The role of national culture in international marketing research. International Marketing Review. https://doi.org/10.1108/02651330110381970
Steenkamp, N. (2007). Intellectual Capital Reporting in New Zealand: Refining content analysis as a research method.
Steenkamp, N., & Northcott, D. (2007). Accounting research: 17(3).
Stevens, F. G., Plaut, V. C., & Sanchez-Burks, J. (2008). Unlocking the benefits of diversity: All-inclusive multiculturalism and positive organizational change. Journal of Applied Behavioral Science. https://doi.org/10.1177/0021886308314460
Stevens, J. M., Beyer, J. M., & Trice, H. M. (1978). Assessing Personal, Role, and Organizational Predictors of Managerial Commitment. Academy of Management Journal. https://doi.org/10.5465/255721
Stonehill, A., & Stitzel, T. (1969). Financial Structure and Multinational Corporations. California Management Review, 12(1), 91–95. https://doi.org/10.2307/41164210
Stulz, R. M. (1988). Managerial control of voting rights. Financing policies and the market for corporate control. Journal of Financial Economics. https://doi.org/10.1016/0304-405X(88)90039-6
Stulz, R. M. (1990). Managerial discretion and optimal financing policies. Journal of Financial Economics, 26(1), 3–27. https://doi.org/10.1016/0304-405X(90)90011-N
Stulz, R. M., & Williamson, R. (2003). Culture, openness, and finance. Journal of Financial Economics, 70(3), 313–349. https://doi.org/10.1016/S0304-405X(03)00173-9
Tabellini, G. (2010). Culture and institutions: Economic development in the regions of Europe. Journal of the European Economic Association. https://doi.org/10.1162/jeea_a_00001
Talberg, M., Winge, C., Frydenberg, S., & Westgaard, S. (2008). Capital structure across industries. International Journal of the Economics of Business, 15(2), 181–200. https://doi.org/10.1080/13571510802134304
Tashakkori, A., & Teddlie, C. (1998). Mixed Methodology: Combining Qualitative and Quantitative Approaches. Thousand Oaks, CA: Sage.
Taylor, R. N. (1975). Age and Experience as Determinants of Managerial Information Processing and Decision Making Performance. Academy of Management Journal. https://doi.org/10.5465/255626
The “new American” Fortune 500. (n.d.).
Titman, S. (1984). The effect of capital structure on a firm’s liquidation decision. Journal of Financial Economics. https://doi.org/10.1016/0304-405X(84)90035-7
Titman, S., & Wessels, R. (1988). The Determinants of Capital Structure Choice. The Journal of Finance. https://doi.org/10.1111/j.1540-6261.1988.tb02585.x
Tosi, H. L. (2009). Teories of Organization. In Theories of Organization. SAGE Publications.
Tosi, H. L., & Greckhamer, T. (2004). Culture and CEO Compensation. Organization Science, 15(6), 657–670. https://doi.org/10.1287/orsc.1040.0099
Triandis, H. C., Bontempo, R., Betancourt, H., Bond, M., Leung, K., Brenes, A., Georgas, J., Hui, C. H., Marin, G., Setiadi, B., Sinha, J. B. P., Verma, J., Spangenberg, J., Touzard, H., & de Montmollin, G. (1986). The

Bibliography
364
measurement of the etic aspects of individualism and collectivism across cultures. Australian Journal of Psychology. https://doi.org/10.1080/00049538608259013
Trompenaars, F. (1993). Riding the waves of culture - understanding cultural diversity in business (N1 OEA). Nicholas Brealey Publishing Ltd.
Tse, D. K., Lee, K., Vertinsky, I., & Wehrung, D. A. (1988). Does Culture Matter? A Cross-Cultural Study of Executives’ Choice, Decisiveness, and Risk Adjustment in International Marketing. Journal of Marketing. https://doi.org/10.2307/1251635
Tung, R. L. (2008). The cross-cultural research imperative: The need to balance cross-national and intra-national diversity. Journal of International Business Studies. https://doi.org/10.1057/palgrave.jibs.8400331
Tversky, A., & Kahneman, D. (1986). Rational Choice and the Framing of Decisions. The Journal of Business. https://doi.org/10.1086/296365
Tversky, A., & Kahneman, D. (1991). Loss Aversion in Riskless Choice : A Reference-Dependent Model. Quarterly Journal of Economics, 106(4), 1039–1061. https://doi.org/10.2307/2937956
Tversky, A., & Kahneman, D. (1992). Advances in prospect theory: Cumulative representation of uncertainty. Journal of Risk and Uncertainty. https://doi.org/10.1007/BF00122574
Ullmann, A. A. (1985). Data in Search of a Theory: A Critical Examination of the Relationships Among Social Performance, Social Disclosure, and Economic Performance of U.S. Firms. Academy of Management Review. https://doi.org/10.5465/amr.1985.4278989
Usher, A. P. (1934). The Origins of Banking : The Primitive Bank of Deposit , 1200-1600. The Economic History Review, 4(4), 399–428.
Wald, J. K. (1999). How Firm Characteristics Affect Capital Structure: An International Comparison. Journal of Financial Research, 22(2), 161–187. https://doi.org/10.1111/j.1475-6803.1999.tb00721.x
Walliman, N. (2001). Your research project: A step by step guide for the first time researcher. London, Sage.
Wang, C. (2012). Board size and firm risk-taking. Review of Quantitative Finance and Accounting, 38, 519–542. https://doi.org/10.1007/s11156-011-0241-4
Warner, J. B. (1977). Bankruptcy, absolute priority, and the pricing of risky debt claims. Journal of Financial Economics. https://doi.org/10.1016/0304-405X(77)90002-2
Watson, W. E., Kumar, K., & Michaelsen, L. K. (1993). Cultural Diversity’s Impact On Interaction Process and Performance: Comparing Homogeneous and Diverse Task Groups. Academy of Management Journal. https://doi.org/10.5465/256593
Weber, R. P. (1990). Basic Content Analysis (2nd ed.). SAGE Publications, Inc.
Weber, Y., Shenkar, O., & Raveh, A. (1996). National and corporate cultural fit in mergers/acquisitions: An Exploratory Study. Management Science, 42(8), 1215–1227.
Weisbach, M. S. (1988). Outside directors and CEO turnover. Journal of Financial Economics. https://doi.org/10.1016/0304-405X(88)90053-0
Welch, I. (2004). Capital Structure and Stock Returns: The European Evidence. Journal of Political Economy, 112(1), 106–131. https://doi.org/10.2139/ssrn.957302
Wennekers, S., Thurik, R., Van Stel, A., & Noorderhaven, N. (2007). Uncertainty avoidance and the rate of business ownership across 21 OECD countries, 1976-2004. Journal of Evolutionary Economics. https://doi.org/10.1007/s00191-006-0045-1
Westphal, J. D., & Zajac, E. J. (1995). Who Shall Govern? CEO/Board Power, Demographic Similarity, and New Director Selection. Administrative Science Quarterly. https://doi.org/10.2307/2393700

Bibliography
365
Westphal, J. D., & Zajac, E. J. (1997). Defections from the inner circle: Social exchange, reciprocity, and the diffusion of board independence in U.S. Corporations. Administrative Science Quarterly. https://doi.org/10.2307/2393812
Wickramasinghe, D., & Hopper, T. (2005). A cultural political economy of management accounting controls: A case study of a textile Mill in a traditional Sinhalese village. Critical Perspectives on Accounting. https://doi.org/10.1016/j.cpa.2003.07.001
Williamson, O. E. (2000). The New Institutional Economics: Taking Stock, Looking Ahead. Journal of Economic Literature, 38(3), 595–613. https://doi.org/10.1257/jel.38.3.595
Wintoki, M. B., Linck, J. S., & Netter, J. M. (2012). Endogeneity and the dynamics of internal corporate governance. Journal of Financial Economics. https://doi.org/10.1016/j.jfineco.2012.03.005
Wood, W. (1987). Meta-Analytic Review of Sex Differences in Group Performance. In Psychological Bulletin. https://doi.org/10.1037/0033-2909.102.1.53
Wooldridge, J. (2009). Introductory Econometrics: A Modern Approach. South-Western College Publishing.
Wooldridge, J. M. (2002). Econometric Analysis of Cross Section and Panel Data. MIT Press.
Wooldridge, J. M. (2010). Econometric Analysis of Cross Section and Panel Data. MIT Press.
Worrell, D. L., Nemec, C., & Davidson, W. N. (1997). One hat too many: Key executive plurality and shareholder wealth. Strategic Management Journal. https://doi.org/10.1002/(SICI)1097-0266(199706)18:6<499::AID-SMJ898>3.0.CO;2-F
Yermack, D. (1996). Higher market valuation of companies with a small board of directors. Journal of Financial Economics, 40, 185–211. https://doi.org/10.1016/0304-405X(95)00844-5
Zaheer, S., Schomaker, M. S., & Nachum, L. (2012). Distance without direction: Restoring credibility to a much-loved construct. Journal of International Business Studies. https://doi.org/10.1057/jibs.2011.43
Zahra, S. A., & Pearce, J. A. (1989). Boards of Directors and Corporate Financial Performance : A Review and Integrative Model. Journal of Management, 15(2), 291–334. https://doi.org/10.1177/014920638901500208