the influence of interactivity and online store atmospherics … · 2018-07-09 · the influence of...
TRANSCRIPT

APPROVED: Sanjukta Pookulangara, Major Professor Bharath M. Josiam, Minor Professor Jiyoung Kim, Committee Member Lisa Kennon, Program Coordinator Tammy Kinley, Chair of the Department of
Merchandising Judith C. Forney, Dean of the School of
Merchandising and Hospitality Management
James D. Meernik, Acting Dean of the Toulouse Graduate School
THE INFLUENCE OF INTERACTIVITY AND ONLINE STORE ATMOSPHERICS
OF A 3-D RETAIL STORE IN SECOND LIFE ON
CONSUMER PURCHASE INTENTIONS
Avantika Thombre, B.Eng
Thesis Prepared for the Degree of
MASTER OF SCIENCE
UNIVERSITY OF NORTH TEXAS
August 2011

Thombre, Avantika. The influence of interactivity and online store atmospherics of a 3-D
retail store in Second Life on consumer purchase intentions. Master of Science (Merchandising),
August 2011, 106 pp., 10 tables, 4 figures, references, 162 titles.
Second Life, a 3-D virtual world, has evolved as a shopping channel for both consumers
and retailers. This channel of retailing offers interactive environment, allows designing
atmospherics, and provides enjoyable shopping experience as compared to website stores. The
purpose of the study was: (1) to identify the key features of Second Life stores and (2) to
determine the relationship of the Second Life store features with consumer purchase intentions.
The online survey was administered in Second Life by an external research agency, and 249
usable surveys were collected. The data were analyzed utilizing factor analysis and regression.
Three key features of Second Life stores were explored in this study. These three features
were: (1) interactivity via the two components of two-way communication and active control, (2)
store atmospherics, and (3) shopping enjoyment. Regression analysis showed that shopping
enjoyment and two-way communication (i.e., the presence of an avatar sales representative) were
significant predictors of purchase intention in Second Life stores, while active control and store
atmospherics did not influence purchase intentions.

ii
Copyright 2011
by
Avantika Thombre

iii
ACKNOWLEDGEMENTS
I would like to express my sincere gratitude to my advisor Dr. S. Pookulangara and my
committee members Drs. J. Kim and B. Josiam for their tremendous support and guidance
through the course of this research. I thank them all for their interest in the study, valuable
suggestions, advice, and for serving on my thesis committee. I really appreciate the time and
efforts taken by Dr. Pookulangara, for spending most of her 2010 winter break time helping me
structure my research. I am thankful to her as she worked really hard with me to complete the
study.
I also appreciate Dr. Kim, for her invaluable support in developing the framework of my
study. Thanks are also due to Dr. Josiam, as the survey design would not be a success without his
help. My appreciation goes to Drs. D. Spears and J. Strubel for their help in data collection for
the pre-test. Dr. Spears provided me strength during the study and I will always remember his
words “set little goals and not one BIG goal all at once (it will culminate with the big goal of
completion).” Finally, I would like to thank all my professors again for trusting me and for
providing me an opportunity to work on a novel topic such as Second Life. I am blessed to work
in the vicinity of such intellectual professors!
This thesis would not be a success without my husband Prashant and sister Ashwini’s
support and encouragement. They walked with me patiently through the ups and downs of this
journey. Finally, I am thankful to my parents and in-laws for providing me strength and courage
to complete my research.

iv
TABLE OF CONTENTS
Page ACKNOWLEDGEMENTS ........................................................................................................... iii LIST OF TABLES ........................................................................................................................ vii LIST OF FIGURES ..................................................................................................................... viii Chapters
1. INTRODUCTION ...................................................................................................1
Rationale ......................................................................................................5
Purpose of the Study ....................................................................................8
Operational Definitions ................................................................................9
Limitations .................................................................................................10 2. LITERATURE REVIEW ......................................................................................11
Interactivity ................................................................................................14
Store Atmospherics ....................................................................................19
Shopping Enjoyment ..................................................................................24
Purchase Intention ......................................................................................28
Research Model .........................................................................................28
Hypotheses .................................................................................................31
Influence of Interactivity on Purchase Intention ............................31
Influence of Store Atmospherics on Purchase Intention................32
Influence of Shopping Enjoyment on Purchase Intention .............33
Summary of Literature Review ..................................................................34 3. METHODOLOGY ................................................................................................36
Instrument Development ............................................................................36
Interactivity ....................................................................................37
Store Atmospherics ........................................................................38
Shopping Enjoyment ......................................................................39
Purchase Intention ..........................................................................39
SL Consumer Demographic Characteristics ..............................................39

v
Population and Sample ..............................................................................40
Data Collection ..........................................................................................41
Pre-Test ......................................................................................................44 4. RESULTS ..............................................................................................................48
Sample Demographic Characteristics ........................................................48
Other External Variables............................................................................51
Statistical Analysis .....................................................................................52
Identification of Underlying Dimensions: Principal Component Analysis ....................................................................................................................54
Interactivity ....................................................................................56
Store Atmospherics ........................................................................57
Shopping Enjoyment ......................................................................58
Purchase Intention ..........................................................................58
Preliminary Data Screening .......................................................................58
Data Analysis: Testing the Assumptions of Multiple Regression .............59
Hypothesis Testing: Multiple Regression ..................................................62 5. SUMMARY AND DISCUSSION .........................................................................65
Interactivity ................................................................................................65
Two-way Communication .............................................................65
Control ...........................................................................................67
Store Atmospherics ....................................................................................68
Shopping Enjoyment ..................................................................................69 6. IMPLICATIONS ...................................................................................................71
Academic Implications ..............................................................................71
Implications for Retailers ...........................................................................74 7. LIMITATIONS AND FUTURE RESEARCH ......................................................78
Appendices
A. RECRUITMENT EMAIL .....................................................................................80 B. SURVEY 1-ARMIDI AND SURVEY 2-GADORE STORE ...............................82 C. SRF AGREEMENT FORM ..................................................................................89

vi
D. IRB APPROVAL LETTER ...................................................................................93
REFERENCES ..............................................................................................................................95

vii
LIST OF TABLES
Page 1. Literature Involving Interactivity .......................................................................................17
2. Literature Involving Store Atmosphere .............................................................................22
3. Literature Involving Shopping Enjoyment ........................................................................27
4. Scales .................................................................................................................................37
5. Demographic Characteristics of the Respondents (N = 249) .............................................48
6. Descriptive Statistics of the Respondents (N = 249) .........................................................51
7. Factor Analysis ..................................................................................................................54
8. Skewness and Kurtosis for the Data ..................................................................................59
9. Correlations Among the Independent Variables ................................................................62
10. Regression Model ..............................................................................................................64

viii
LIST OF FIGURES
Page
1. The impact of interactivity, store atmospherics, and shopping enjoyment on purchase intention .............................................................................................................................31
2. Normal P-P plot of purchase intention...............................................................................60
3. Scatter plot of the standardized residuals (the errors) by the regression standardized predicted value ...................................................................................................................61
4. SL store features and purchase intention ...........................................................................63

1
CHAPTER 1
INTRODUCTION
In 2011, the United States (U.S.) Census Bureau reported that annual retail sales reached
approximately $348 billion, of which online retail sales contributed 13% (see also Wauter,
2011). The contribution of online retailers is less compared to retailers’ brick-and-mortar stores
(Aoyama, 2001; Shang, Chen, & Shen, 2005); however, online retailing offers great marketing
potential due to its advantages of instant market access and global reach. The adoption of online
channels is rapidly increasing due to the tremendous potential for them to be used as marketing
tools as well as sales channels (Pentina, Pelton, & Hasty, 2009). Sage (2010) revealed that by
2014, online retail sales in the U.S. are expected to reach $248.7 billion, representing a 60%
growth from 2009. This retail sales forecast represents a remarkable increase in online retail
sales within the last two years and could be attributed to the increase of Internet users in the
country which has doubled since 2000 (Internet World Stats, 2010). Currently, there are more
than 266 million Internet users, which accounts for 77.3% of the total U.S. population (Internet
World Stats, 2010). Therefore, it can be inferred that the rise in the number of Internet users
would lead to growth in online retailing.
With the increase in the number of Internet users, the rapid adoption of websites for
commerce purposes has been ongoing, and a web presence has become imperative for most
retailers (Doherty-Ellis & Chadwick, 2000; Wen, Chen, & Hwang, 2001). Regardless of retailer
size, the Internet offers an affordable alternative to opening a brick-and-mortar store and
provides innovative ways of doing business (Francis, 2009). Other than the low cost, retail
websites offer benefits such as a huge customer base and consumer data for database marketing
(i.e., “who is buying what, when, and how” Doherty & Ellis-Chadwick, 2000, p. 955). The

2
Internet allows retailers to (1) target specific consumers; (2) invest less capital and bear lower
risk than a physical store in terms of: inventory, sales associate salaries, store maintenance, rent,
real estate purchase for the stores, utilities and property taxes, (3) operate 24 hours a day and 7
days a week; and (4) provide sufficient product options and service information to consumers
(Doherty & Ellis-Chadwick, 2000; Duparcq, Hanna, & Berger, 2009).
Doherty and Ellis-Chadwick (2000) explained that U.S. retailers perceive online retailing
as an additional channel that can be utilized as a communication tool for attracting new
consumers, expanding into new markets, promoting the brand, and facilitating consumer
retention. From the consumers’ perspective, online shopping is convenient, saves time, provides
information on product prices and retailer services, and enables price comparisons quite easily
(Cole, Suman, Lunn, & Maguire, 2000). The competition in online retailing has intensified as
consumers have become more comfortable using the Internet for online shopping (National Mail
Order, n.d.; Sage, 2010). Therefore, retailers greatly need to differentiate between themselves in
the market in order to generate sales and establish their brands.
As the Internet has evolved as a shopping channel for both consumers and retailers, it is
important to consider some of the major drawbacks associated with online retail stores. For
example, the interactivity level of online stores is usually very low (e.g., customer assistance and
communication with sales representatives is nearly absent from online shopping). In addition, it
is very difficult to engage consumers in shopping at an online store when store atmospherics
(store surroundings such as colors, music, or display) are absent. Kotler (1973-1974) explained
“in some cases atmosphere is the primary product” (p. 48), and atmosphere could be a leading
factor in product purchase decisions. In comparison with brick-and-mortar stores, consumers
experience less shopping enjoyment in an online store (Shang, Chen, & Shen, 2005). Thus, an
3
interactive website with appropriate store atmospherics and the presence of online “shopping
assistants” are the significant factors, and if store atmospherics are unavailable, consumers could
be hindered from obtaining product information or having pleasurable shopping experiences
(Holzwarth, Janiszewski, & Neumann, 2006). Consequently, due to increase in sales as well as
competition in online retailing, marketers constantly work to enhance their website features to
make their websites and products more appealing to consumers, but the overall success of online
retailing depends upon consumers’ Internet access, usage, and experiences with online shopping.
The drawbacks mentioned above have been somewhat eliminated by the enriching experience
and interactivity of virtual stores in the virtual worlds such as Second Life (SL).
There are several three-dimensional (3-D) virtual worlds, which are categorized for
different types of users depending upon specific age groups or hobbies. These include Active
World and Cyber Town. Some are specially meant for gaming purposes, such as World of
Warcraft or Star War Galaxies (Goozee, 2010; Hemp, 2006; Virtual Worlds, n.d.); however; the
first virtual world, SL falls under all of the above mentioned categories because it is extremely
similar to the real world, because its residents can live like they live in the real world. For
instance, SL allows the residents to interact, socialize, shop, travel around the world, and rent or
buy land. Also, SL has emerged as an effective platform for fashion designers to display their
creative work, hold virtual business meetings, and fill classrooms with distance learners (Book,
2004; Justin, 2001; Lemon & Kelly, 2009; Novak & Steffey, 2007).
SL was created by San Francisco based Linden Labs in 2003. Currently, more than 18
million residents dwell in SL (Winder, 2010). This virtual world represents a shared space with a
3-D graphical environment in which several users can simultaneously interact with each other
and perform activities similar to those they perform in the real world. SL can be accessed via the

4
Internet and is considered a Massively Multiplayer Online Role-Playing Game (MMORPG), a
genre of computer role playing games. The interface facilitates interactions among players in a
shared 3-D space via fictional characters called “avatars.” An avatar in SL is a virtual body, or a
3-D representation of an SL resident (Robbins & Bell, 2008). The user can control the avatar’s
appearance, movement, and speech. Avatars in SL can communicate via local chat or global
instant messaging which is called IM for instant messaging. According to information available
on the SL website, even though the environment is virtual, the interactions among the players are
real (SL, n.d.). Thus, SL is an online virtual world as a MMORPG that is parallel to the real
world, and in SL, residents represent themselves under the guise of their avatars.
SL is rapidly emerging as a business hub. Approximately $150 million are being spent
every day by virtual vendors, virtual real estate agents, and residents (Second Life’s new leader,
2010). The virtual currency used in SL is Linden dollar (L$). The exchange rate varies, but
usually $1 U.S. dollar (USD) equals L$250 to L$300 (Currency exchange, n.d.). The avatars lead
real lives inside this virtual world. Customization of avatar body and appearance (e.g., hair
styles, skins-colors, shapes of the body parts, clothing, accessories, and footwear) has provided
opportunities to retailers to sell services and products to the residents or avatars (Book, 2004).
Avatars buy all these products to enhance their looks (Hemp, 2006; Odrejka, 2004).
After closely observing SL, it was noticed that this virtual world is not only limited to
gaming and entertainment but it also has several advantages. SL facilitates face-to-face
interaction of avatars because of its 3-D graphical environment. SL engages consumers as they
interact and obtain product information through their avatars or sale representatives (Tate et al.,
2010). Additionally, SL provides innovative experiences to consumers by allowing them to
examine products in the interactive, 3-D graphical environment where they can take 360 degree

5
view of the product on the computer while changing colors and using apparel try-on technology
which allows consumers’ avatars to wear clothing instantly. All of these features increase
interactivity with SL stores that provide realistic shopping experiences and help engage
consumers.
Hemp (2006) emphasized that virtual worlds offer untapped marketing potential for real-
world products and services, mainly because of their ability to generate sustained consumer
engagement with a brand. Therefore, similar to online retail stores, SL could be considered as an
additional retail channel. SL offers the advantage of being able to experiment with new ideas,
products, or promotions at very minimal cost and time, as the highest paid money for a weekly
classified in SL is L$300,002 as of November 1, 2010 (Linden Lab Official, 2010). Thus, SL
could serve as a launch pad for a new product, enabling retailers to launch new products in SL to
gage consumer response before launching any new product into the real world. For example,
Levi Strauss lunched a new style of jeans in an SL store to predict consumer response in real-life
(Hrastnik, 2007). From a financial perspective, SL has the potential to be profitable for real life
retailers since many people make real life money from virtual businesses (Hemp, 2006).
Rationale
The top selling online products include apparel, footwear, and accessories (Symons,
2010). The increase in online sales has been attributed to the growing numbers of Internet users.
Symons (2010) also pointed out that apparel, footwear, and accessories along with consumer
electronics and computers (including both hardware and software) have dominated online retail
sales and account for 40% of all the total online retail sales across the country. Symons included
the following statement by the executive director of shop.org, “Retailers are doing such a great
job online that in some cases it's easier to find and buy clothing on the Web than it is in a store."

6
Furthermore, the success of the influx of new retailers has been attributed to liberal shipping
policies on return and exchanges. Additionally, the growth in online sales has increased due to
the integration of new technologies that engage consumers by providing realistic shopping
experiences. The integration of several modern technologies, such as rich-imagining zoom and
rotate and product views in different colors, enhances interactive nature of retail websites. Due to
these technologies, consumers are more comfortable in making online apparel purchases.
Goldsmith and Flynn (2004) found that “online apparel buying is motivated more by the Internet
innovativeness than by clothing innovativeness” (p. 84).
Similar to online retailing, apparel shopping is the number one activity in SL. In SL, a
large amount of money is spent on avatar outfitting and appearance by residents (Guiniven,
2006; Ondrejka, 2004). In fact, apparel (i.e., virtual) and avatar stores (where avatar skins and
hair are sold) were the first businesses to start in SL (Ondrejka, 2004). SL’s rapidly growing
internal economy (Ondrejka, 2004) indicates that this medium has a potential to become another
successful channel for apparel retailing. Ondrejka (2004) also mentioned that residents spend
more time and money on shopping than on other activities in SL, which has boosted the number
of designer stores in SL. According to Hemp (2006), several SL apparel designers have been
approached by real world fashion houses to work on real life fashion projects. For example,
Martina Karapetrić, a fashion designer from Croatia opened her boutique in SL. Her SL creations
caught attention of fashion aficionados which helped her earn many real-life projects including
shows on European runways (Otawara, 2010). The reason many fashion designers have been
stepping into SL is the ease with which real life dresses can be recreated in SL and the interactive
features of SL which make apparel appear real. The virtual dresses look the same as real ones.
This is possible because of the numerous options available to the designers in SL such as virtual

7
fabric textures, colors, and drapes. As a result, SL is emerging as a hub for virtual commerce and
has possibilities both for professionals who want to have sideline businesses (e.g., designers who
want to showcase their creations) and for real life retailers. The avatar operated and owned SL
businesses are burgeoning and are translating into “real-life” profitable businesses (Hemp, 2006).
A real life apparel brand, American Apparel, started its brand promotion by selling its
apparel to avatars and offering coupons for their real life purchases at their brick and mortar and
online stores. Similarly, Levi Strauss launched its new pattern jeans on SL, and based on the
responses the company obtained, Levi’s introduced the new product into the actual market
(Hrastnik, 2007). Even though Adidas sold over 15,000 virtual shoes to SL avatars in a time span
of four weeks (Second Life lessons, 2006), big retail chains continue hesitating to invest time
and money in SL. This hesitation indicates that irrespective of the interactive features that SL
provides (including avatar sales representatives, voice chat, 360 degree product view, and virtual
try-on technology) retailers do not take complete advantage of this medium. SL provides better
technological features than retail websites and at minimum cost. Therefore, it is very important
to investigate the effect of SL’s interactivity on consumer purchase intentions. The current study
aims to explore the potential of SL as a retail channel. Even SL can be utilized for brand
building, promoting products, or introducing new products to increase sales in the real world.
Regardless of these advantages, retailers are currently not very active in SL (Hemp, 2006).
The purpose of this paper is to identify main features of SL stores which could possibly
attract and engage consumers toward shopping in online 3-D virtual environments. Upon an
extensive review of literature, the following variables serve as important influences of consumer
purchase intentions in SL: (1) interactivity, (2) store atmospherics, and (3) shopping enjoyment.
Interactivity refers to how consumers communicate in an SL store, whether face-to-face i.e.,

8
through avatars using Voice over Internet Protocol (VoIP; i.e., voice chat) or through IM.
Interactivity also refers to the response time (slow or fast) to consumers’ requests (e.g. price
check of the product or navigation in the SL store). This feature of SL could be very beneficial to
retailers, since in online stores interactivity is an important component which affects consumer
shopping decisions to a greater extent (Ballantine, 2005; Liu, 2003).
Store atmospherics mainly explain the store ambience, that is, the look and feel of stores’
interiors in term of colors used, merchandise displayed, or music played in the store. Shopping
enjoyment is defined as the fun experienced during shopping in an SL store. Nevertheless, as
stated earlier, SL offers more advantages than a retail website in terms of interactivity, allows
designing atmosphere, and enjoyment and this study’s aim was to explore the SL retail store’s
potential influence on purchase intention. Additionally, based on data analysis, suggestions were
made as to how retailers can explore how to use SL as a new retail channel.
Purpose of the Study
Most retailers, including American Apparel, Adidas, and Nike, entered into SL mainly
for the purpose of brand building and setting a market presence (Driver & Jackson, 2008).
However, none of them were able to mark their presence (Ohrstrom, 2008). SL offers several
great features to enhance the consumer-shopping experience, which have not been realized to full
potential by most of these retailers. American Apparel, one of the early adopters of SL, was
widely reported to be empty of shoppers most of the time because it offered no sales
representative to assist the consumers (Lyons, 2008). The lack of a sales representative could
have led to consumers’ disinterest in the brand, as interaction with consumers is a crucial process
in a business. Thus, the main purpose of this study is: (1) to identify the key features of SL

9
stores and (2) to investigate the relationship between the SL store features and consumer
purchase intentions. Therefore, this study was based on the following propositions:
1. SL stores’ functional mechanisms, such as interactivity in terms of presence of an avatar as
sales representatives, response time, and control over navigation affect consumers’
perceptions of their shopping experiences and purchase intentions.
2. SL store environmental cues, such as interior color-combination and product display, are
associated with more favorable consumer purchase intentions (Babin, Harsey, & Suter,
2003; Eroglu, Mechleit, & Davis, 2003).
3. Shopping enjoyment plays a significant role in consumer’s adoption of a medium for
shopping and leads consumers to make purchases through the store/medium (Ha & Stoel,
2009). Thus, the enjoyment experienced while shopping in an SL store leads to positive
purchase intentions.
Therefore, based on these propositions, this study was aimed toward providing marketers
with insight on consumers’ expectations from SL stores. Also, this study was important as no
other studies have been solely focused on SL store features or explored consumers’ purchase
intentions via SL store. This study explores a new method of operating retail. In addition, this
study’s findings might help marketers understand and improve the main features of SL stores to
facilitate consumer browsing and shopping at the store and making purchases from these stores.
Operational Definitions
Second life. SL is a 3-D virtual world which facilitates socializing, communication, and
customization of avatars through the extremely interactive technology called Massively
Multiplayer Online Role-Playing Game (MMORPG).

10
Linden dollar. The currency used in SL is the Linden dollar which is written as L$.
Usually, $1 U.S. dollar is equivalent to L$250 to L$300.
Avatar. This word is originally taken from an ancient Indian language, Sanskrit which
describes the worldly incarnation of the Hindu god Vishnu (Hemp, 2006). In the context of SL,
an avatar is basically an SL user who can acquire any form, such as a human body, animal, or
even an object.
3-D store. These are the retail stores in SL.
Interactivity. In online media, interactivity is associated with two-way communication,
user control, time to perform web activities, such as a monetary transactions, or downloading
webpages.
Store atmospherics. Kotler (1973-1974) defined store atmospherics as “the conscious
designing of space to create certain effects in buyers. More specifically, atmospherics is the
effort to design buying environments to produce specific emotional effects in the buyer that
enhance purchase probability” (p. 50).
Shopping Enjoyment. The emotional response of pleasure obtained by shopping.
Limitations
This study of purchase intentions from SL stores was limited to the three features of SL
stores that were interactivity, atmosphere, and enjoyment. Hence, the study did not include other
aspects of the SL stores, such as technology acceptance. This study was limited to the
examination of SL store features, but did not compare consumer purchase behaviors in SL stores
to online stores, a currently, widely accepted sales channel. Additionally, the sample was
selected from all over the world, and the study was not focused solely on American consumers.

11
CHAPTER 2
LITERATURE REVIEW
Marketers are utilizing the Internet to provide product and service information and to sell
products and services to consumers. Marketers are using the Internet to reach consumers who
would otherwise be difficult to reach globally (i.e., through traditional print and advertising
media) because of high cost (Peter & Olson, 2001). According to Carrillat, Riggle, Genbhart, and
Less (2009), to develop a consumer-oriented business, it is crucial to acquire the advanced
understanding of customers (e.g., feedback). This is especially important for online retailing
since it is extremely hard to engage consumers in an online medium as compared to a brick-and-
mortar store (Häubl & Figueroa, 2002). Häubl and Figueroa (2002) further explained that any
lack of involvement in an online shopping environment could be attributed to consumer’s
inability to physically examine products before making purchase decisions, and they suggested
that this problem could be overcome by using three-dimensional (3-D) environments, known as
virtual realities.
Second Life (SL) is a dynamic virtual world environment entirely driven by the users. A
study revealed that out of 1,259 SL residents, the majority of the residents are in SL for personal
reasons, such as fun and creativity, social networking, and shopping (Driver, 2008). The
remaining respondents utilized SL for professional purposes, such as networking, conducting
business and research, bringing a real life business into SL, and running a business in SL. Solis
(2011) suggested that the usage of SL by retail brands will increase by 11%. Solis indicated that
in SL, avatars not only engage in gaming but also exist in a social environment that allows users
to generate money similar to real world dollars. As stated earlier, the number of apparel stores in

12
SL has been increasing, and a study exploring the layout and other atmospheric features of such
stores would be of relevance.
There are numerous features available through SL, which make activities in this virtual
world mimic real life activities. The presence of features like 3-D stores, products, and avatars
who can communicate with each other via voice chat enables the information of sharing and
ability to gather feedback (7 things, 2008). Additionally, SL offers plenty of interactive features,
such as the presence of avatar sales representatives in SL stores which is similar to the presence
of real sales representatives in brick-and-mortar stores.
The consumers’ virtual experiences in SL stores resemble real life shopping experiences
and allow consumers to interact with products (Li, Dauherty, & Biocca, 2001). Virtual
experience incorporates visual control and functional control, which together enable a higher
level of interactivity (Jiang & Benbesat, 2007). Visual control means consumers can use the
website to view products through different angles, and functional control refers to consumers’
ability to control actions performed during website navigation. Virtual experience refers to
realistic product experiences obtained over the Internet (Li et al., 2001). But due to the lack of
any documented studies on SL stores and their features, the literature was built by comparing the
similarities between the online retail stores and SL stores. Based on the literature available on
online stores, three important features of SL stores were identified. The three identified features
were the following: (1) interactivity, (2) store atmospherics, and (3) shopping enjoyment.
Ballantine (2005) reported interactivity to be the most documented feature among several
features of an online store. Interactivity in an online environment entails two-way
communication, active control, and response time (Liu & Shrum, 2002; McMillan & Hwang,
2002). Liu and Shrum (2002) explained active control as the user’s ability to freely participate in

13
a communication over the Internet. Liu and Shrum stated that active control is an important
element in order to perform communication easily and emphasized that the interactive nature of
an online store allows consumers to communicate via a one-on-one basis. Better control means
greater ability to perform actions or gain experiences within an online medium. Ballantine (2005)
found that higher levels of interactivity increase consumer satisfaction. Similarly, Constantinides
(2004) found interactivity of an online medium to build positive customer experience.
As compared to interactivity, the atmospherics of an online store represent a relatively
new concept that emerged in late 1990s (Manganari, Siomkos, & Vrechopoulos, 2009). The
transition from brick-and-mortar to online retail stores has attracted many researchers to study
store atmospherics in the context of the online environment. Also, store atmospherics (of both
brick-and-mortar and online stores) were documented as the important aspect of a store, which
significantly affects consumers’ attitudes and intentions to purchase products (Bellizzi & Hite,
1992; Koo & Ju, 2010; Kotler, 1973-1974). Store atmosphere includes anything that affects the
design or ambience of a store, such as music, scent, and color (Koo & Ju, 2010). Similar to
online stores, most of the stores in SL have similar layouts and open areas with signboards on the
walls. The signboards display product information and advertise the products the stores sell.
These sign boards also act as a point of sale, which means the product displayed on the signboard
can be purchased by a consumer who simply clicks the computer mouse over the product’s
signboard. In SL stores, product information is readily available, and money transactions and
virtual product delivery happen extremely quickly. Additionally, the 3-D layout of SL stores
helps mimic the atmospherics of a brick-and-mortar store and includes the use of music,
mannequins at the display window, wall colors, and display units highlighting the products

14
(Robbins & Bell, 2008). Thus, based on previous research, store atmosphere has been identified
as an important feature of SL stores.
Along with interactivity and store atmospherics, shopping enjoyment is an important
feature of online shopping. Consumers who experience enjoyment during shopping sprees are
more likely to make purchases (Guiry, Mägi, & Lutz, 2006; Kim, Fiore, & Lee, 2007). SL stores
provide enjoyable experiences (Grassian, Trueman & Clemson, 2006; Jin & Bolebruch, 2009)
due of the presence of several fun elements (e.g., avatars and the 3-D interactive interface).
Therefore, interactivity, store atmospherics, and shopping enjoyment were identified as the
primary design features of SL stores that affect consumer intentions to make purchases at SL
stores.
Interactivity
Websites provide numerous features (Dholakia & Zhao, 2009), yet certain features such
as interactivity or realistic product experiences (e.g., product trial or touch and ability to feel
products) that are absent from online media. Several authors have identified interactivity as one
of the most important aspects of the online stores (Ballantine, 2005; Dolakia & Zhao, 2009;
Fortin & Dholakia, 2005). Chen and Yen (2004) acknowledged interactivity to be a very
important feature of an online business that helps to improve “communication quality.”
Constantinides (2004) stated that interactive retail websites enhance web experiences and
provide the opportunity to retailers desiring to differentiate themselves in the marketplace.
Constantinides also classified interactivity as a functional element of a website which facilitated
two-way communication between the seller and the buyer and as a way to help establish
relationships with other users. Furthermore, Constantinides explained customer service and after
sales service (i.e., customer’s feedback) and two-way communication are some of the important

15
components of interactivity between customers and online vendors. Constantinides asserted that
interactivity is an important marketing tool which can be controlled by the marketer effectively
designing the website. Similarly, Coyle and Thorson (2001), Hoque and Lohse (1999), and Fiore,
Jin, and Kim (2005) explained that a higher level of interactivity increases the online retailer’s
chances of success. All these researchers emphasized the impact of interactivity on online retail
websites. According to Dholakia and Zhao (2009), interactivity strengthens the buyer-seller
relationship due to faster information exchanges. In addition, interactivity can be used with
consumers to deliver virtual product experiences and resemble direct experience of a product (Li
et al., 2001). According to Ballantine (2005), several features of the design of a website interface
contribute to its success. Interactivity of a medium is affected by the speed with which the
information is shared or the amount of time required to respond consumers’ requests (Ballantine,
2005; Steuer, 1992). Ballantine further mentioned that shorter response time adds value to real
time interaction and as a result provides more realistic experiences. The studies related to
interactivity were primarily focused on the following aspects: (a) control, (b) two-way
communication, and (c) response-time (Ballantine, 2005; Dholakia & Zhao, 2009; Liu & Shrum,
2002; McMillan & Hwang, 2002). Liu (2003) developed a scale to measure the interactivity
levels of websites. This scale was a multidimensional scale with the three distinct dimensions of
active control, two-way communication, and synchronicity.
Similar to websites, interactivity plays a pivotal role in providing realistic experiences in
SL. SL does a better job at providing interactive features to its users. Daugherty and Biocca
(2009) explained that the 3-D environment is the most powerful media over all the other media
sources (i.e., print and broadcast), because consumers can interact with the products and the 3-D
presentations of the products outperform two-dimensional (2-D) pictorial presentations of online

16
stores (Li, Daugherty, & Biocca , 2003). Therefore, it can be inferred that interactivity is an
important functional mechanism of SL stores. In addition, SL provides interactive features, such
as communication with sales representatives at the store and gathering feedback via IM or VoIP,
that allow consumers to receive quicker responses about their queries. Due to presence of these
interactive features (i.e., active control, two-way communication, and synchronicity) in SL, these
were identified as sub-features of the interactivity of an SL store. Thus, based on previous
studies on online retailing, interactivity was identified as an important feature of an SL store.
It is important to understand that each of these interactivity variables may have different
degrees of interactivity and can affect customer experience of an online environment differently.
For example, presence of an avatar sales representative at an online storefront provides a more
realistic shopping experience to customers (Dholakia & Zhao, 2009) and facilitates faster
responses. The user interface (MMORPG) of SL itself suggesting that interactivity is an integral
and an important feature of SL stores. Thus, it can be inferred that interactivity in SL is an
important variable and needs to be further examined. Ballantine (2005) explained Rafaeli’s
(1998) interpretation of interactivity, according to which interactivity requires the mutual
exchange of communication via both face-to-face and real time responses. This feature is
available in SL stores in the form of the avatar who provides real time information, faster
response times, and face-to-face communication. Ballantine found that increased levels of
interactivity result in higher consumer satisfaction while shopping online. Therefore, to keep the
interactivity of SL stores high, web developers constantly work to make the SL store more
similar to the brick-and-mortar store because higher levels of interactivity in SL stores allow
consumers to relate to the shopping experience more easily (7 things, 2008).

17
Table 1
Literature Involving Interactivity
Researchers Application Constructs Components Results
Ballantine
(2005)
Online stores (retail
website)
Online shopping
environment
Interactivity and product
information
Level of interactivity has significant
affect on consumer satisfaction
Constantinides
(2004)
Online stores (retail
website)
Web experience
components
(Functional- usability and
interactivity, psychological-
trust and credibility, and content
elements- aesthetic and
marketing mix)
Interactivity leads to a positive
customer experience
Coyle and
Thorson (2001)
Internet marketing sites Telepresence Interactivity and vividness Higher levels of interactivity leads to
stronger attitudes toward the website.
Dholakia and
Zhao (2008)
Online store (retail
website)
Interactivity Objective and subjective Interactivity positively impact online
shoppers’ satisfaction and behavioral
intentions
(table continues)

18
Table 1 (continued).
Researchers Application Constructs Components Results
Lee et al. (2006) (retail website) Interactivity Image interactivity
technology (IIT)
Interactivity positively affects consumers’
attitude toward an online retailer.
Liu (2003) Website Interactivity Active control, two-way
communication, and
synchronicity
Developed a scale to measure interactivity.
Mollen and
Wilson (2010)
Website Engagement Interactivity, flow and
involvement
Developed a framework with constructs:
engagement, interactivity, flow, and
involvement to measure consumer experience.
Stuer (1992) Technological
hardware (e.g.,
computer, head-
mounted displays, and
headphones.
Telepresence Vividness and
interactivity
Developed a definition of virtual reality and
the application of virtual reality.

19
Store Atmospherics
According to Kotler (1973-1974), store atmospherics are formed from “the conscious
designing of space to create certain effects in buyers” (p. 50). There are many atmospheric cues
that influence consumers which are provided in brick-and-mortar stores as well as in online
stores. The atmospheric cues mainly incorporate lighting, noises, smells, temperature, shelf space
and displays, signs, colors, and merchandise (Peter & Olson, 2001). According to the authors,
these are also called in-store stimuli. Peter and Olson suggested that store atmospherics are the
major marketing tools which heighten consumers’ sensory awareness, enhance their purchase
probability, and influence their behavior (Chang, 2000). Peter and Olson described sensory
awareness as resulting from the visual, aural, olfactory, and tactile experiences that stimulate
consumers’ senses upon entering a store.
Kim and Kim (2004) pointed out that many retailers perceive online stores as
unappealing to a wide range of senses (e.g., smell, touch, sight, and so on) and as hindering
consumers’ ability to examine merchandise prior to making purchases. Kim and Kim pointed out
that especially for sensory products like clothing, jewelry, and accessories, more than one of the
five senses are used. In the absence of experience with merchandise through the senses, the
elements involved in online store design such as background colors, fonts, images, logos, and
shopping procedures become very important. In this study, color, brightness, size, and shapes are
categorized as visual dimensions; volume and pitch represent the aural dimension; scent and
freshness are part of the olfactory dimension; and softness, smoothness, and temperature are
categorized as part of the tactile dimension.
Further, Kim and Kim (2004) classified atmospherics into the two categories of the
intended atmosphere and the perceived atmosphere. The intended atmosphere is carefully

20
designed to stimulate consumers’ senses via customizing particular color schemes or the lighting
effects found in the store. In contrast, perceived atmosphere varies for different consumers. For
instance, men are less attentive toward store atmospherics than women, because men are goal
oriented and focused on merchandise only during shopping (Grewal, Baker, Levy, & Glenn,
2003; Otnes & McGrath, 2001). Also, people of different cultures associate particular colors with
particular occasions. For example, in Asian cultures, the color of white is associated with
funerals, and in the European or Western cultures, the black color is the funeral color.
Essentially, perceptions about store atmosphere may be different to consumers of different
cultures (Davis, Wang, & Lindridge, 2008). Therefore, the usage of this marketing tool depends
largely on the place where the product is purchased or consumed. Normally, atmospheric
elements like color, music, signboards, graphics, scents, and lighting are present in brick-and-
mortar stores and can be utilized effectively.
On the other hand, many of these elements (e.g., scent or lighting) are not present in
online stores. Shergill and Chen (2005) pointed out that online stores cannot fully replicate the
ambience of a brick-and-mortar store. Thus, in the absence of some atmospheric elements from
online environment, it is very difficult to create the effective and dynamic atmosphere to be
similar to brick-and-mortar stores. However, the loss of the traditional in-store ambience can be
compensated by the effective design of the online experience. For example, advancements in
modern technology including flash player to provide 360 degree views of products, 3-D product
displays, and zooming in to see products more closely in online stores aid in creating interactive
atmospheres in online environments. Eroglu, Machleit, and Davis (2001) mentioned that
websites are capable of providing full-color presentations. Likewise, Manganari et al. (2009)
described color as an omnipresent element on websites. These elements are crucial in building a

21
positive online experience (Constantinides, 2004). Appropriate usage of color can enrich the
online store layout and enhance the hedonic shopping experience to offer an ambience analogous
to those found in brick-and-mortar stores (Hausman & Siekpe, 2009; Menon & Kahn, 2002).
Algharabat and Dennis (2009) created a hypothetical website and provided 3-D product
visualization, and they found that an authentic 3-D atmosphere within a website could help
retailers succeed in providing realistic experiences to consumers. Algharabat and Dennis
demonstrated that colors in a 3-D environment provide realistic experiences and positively affect
behavioral intention. Thus, a properly designed website with suitable atmospheric elements, such
as color, animation, and control, enriches consumer experiences (both hedonic and utilitarian)
and facilitates consumers forming positive attitudes toward online retailers (Bellizzi & Hite,
1992; Childers, Carr, Peck, & Carson, 2001; Coyle & Thorson, 2001; Crowley, 1992; Fiore,
Kim, & Lee, 2005b, Fiore, Yah, & Yoh, 2000; Wang, Hernandez, & Minor, 2010). Online store
atmosphere is relatively a new area, especially in the context of online stores. Likewise, SL store
atmospherics is an even newer concept needing to be explored in order to use SL stores for the
purpose of retailing.

22
Table 2
Literature Involving Store Atmosphere
Researchers Application Constructs Components Results
Algharabat and
Dennis (2009)
Website (3D
product stimulus)
Atmosphere S-O-R [Stimulus (color & control),
organism(hedonic & utilitarian),
responses (behavioral intentions )]
Atmospherics of a 3D virtual model
adds more information, fun and
enhances consumer responses
towards the online retailer.
Bellizzi and Hite
(1992)
Brick-and-mortar
stores
Atmosphere Colors (red and blue) Studied differential effects of red and
blue colors. The color blue positively
affects purchase intention.
Eroglu et al.,
(2001)
Website Atmosphere S-O-R refers to Stimulus (online
environmental cues), organism (internal
states e.g., affect and cognition), and
responses (shopping outcomes e.g.,
approach and avoidance)
Research implications are provided
with the help of derived propositions.
(table continues)

23
Table 2 (continued).
Researchers Application Constructs Components Results
Koo and Ju
(2010)
Website Atmosphere Graphics, colors, menu, links Colors and rest of the components
have effect on consumer purchase
intentions.
Kotler (1973-
1974)
Brick-and-mortar
stores
Atmosphere Visual (colors, brightness, size,
shapes); aural (volume, pitch);
olfactory (scent, freshness); and
tactile (softness, smoothness,
temperature)
Atmospherics affect consumers’
purchase intention.
Manganari et
al. (2009)
Website Atmosphere Virtual layout & design, virtual
atmospherics (background color,
color scheme etc.), virtual theatrics,
and virtual social preference.
Effective layout, atmospherics, and
theatrics are marketing tools and
determine consumers’ overall
responses.

24
Shopping Enjoyment
Shopping enjoyment in brick-and-mortar stores and in online stores has been broadly
discussed by several researchers (Arnold & Reynolds, 2003; Carpenter & Moore, 2009; Guiry et
al., 2006; Hsiao, 2009; Kim et al., 2007; Kim & Kim, 2008; Lee, Fiore, & Kim, 2006;
Wolfinbarger & Gilly, 2001). However, this phenomenon has not yet been investigated with
regard to SL stores. Hence, this section of the literature review addresses the importance of
shopping enjoyment in SL stores.
A large number of authors found that shopping enjoyment is an important concept and
prompts consumers to make impulse purchases (Guiry et al., 2006; Kim et al., 2007; Kim &
Kim, 2008; Lee et al., 2006). According to Guiry et al. (2006), the hedonic consumers who are
seeking pleasure are more likely to spend money shopping while the utilitarian consumers were
not, irrespective of the channel of purchase. Dawson, Bloch, and Ridgway (1990) explained that
shopping motives can encourage consumers to visit marketplaces, but consumers’ purchase
preferences largely depend upon the type of experiences they get in stores. Thus, hedonic
consumers are more likely to notice the effect of retail attributes such as product display and
store décor, which could affect their purchase intentions, although some authors revealed
insignificant results (Kim & Stoel, 2004; Koufaris, 2002). Based on previous literature, Kim and
Stoel (2004) identified six dimensions of website quality. Those six dimensions were web
appearance, entertainment, informational fit-to-task, transaction capability, response time, and
trust. Among these dimensions, only informational fit-to-task, transaction capability, response
time were significant predictors of consumer satisfaction, and shopping enjoyment was an
insignificant predictor. Similarly, Koufaris (2002) found that shopping enjoyment has no effect
on consumers’ unplanned purchases.

25
Shopping enjoyment has been studied by many researchers in the context of the 3-D
virtual environment (Algharabat & Dennis, 2009; Daugherty, Li, & Biocca, 2008; Holzwarth et
al., 2004; Jiang & Benbasat, 2007; Kim & Forsythe, 2008; Li et al., 2001). However, the above-
mentioned findings did not relate to SL directly, but these studies incorporated the 3-D
visualization of products (Daugherty et al., 2008; Jiang & Benbasat, 2007), that is, 3-D avatars
(Holzwarth, Janiszewski, & Neumann, 2004) as a sales representative and virtual try-on
technology (Kim & Forsythe, 2008) with 360 degree product views available in online stores.
Algharabat and Dennis (2009) found that the 3-D virtual model provides a high level of
enjoyment to consumers. Also, Fiore, Kim, and Lee (2005b) described virtual environments as
heightening hedonic value such as enjoyment. Algharabat and Dennis designed an experiment
which allowed participants to control the content and form of 3-D flash on a “pseudo” website of
electronic products retailer. For example, participants could zoom in to take a closer look at a
product or out farther to look at the product as a whole, rotate the product to view it in 360
degree angles. In addition, participants could change the colors of the products. Algharabat and
Dennis concluded that enabling participants to control website contents (i.e., zoom in or out and
rotate) increased the enjoyment element of the website and facilitated consumers’ positive
intentions toward the website. Similar to this study, many scholars reported that the 3-D virtual
environment is the main contributor in enhancing shopping enjoyment (Heeter, 1992; Lombart &
Ditton, 1997; Song, Fiore, & Park, 2007).
Childers et al. (2001) suggested that online shopping incorporates both hedonic and
utilitarian factors. On this note, it could be assumed that the experience of shopping enjoyment
can play a significant role in consumers’ use of SL stores. Correspondingly, Kim and Forsythe
(2007) mentioned that the main reasons behind consumers using 3-D product visualization are to

26
have more fun, enjoyment, and entertainment. Online retailers can add these fun elements by
providing 360 degree rotations of products, zoom in or out, color change options, etc. However,
in SL, retailers do not have to spend money on these technologies as the virtual environment has
all these facilities inbuilt. Most of the SL residents use the virtual environment for fun and are
more likely to notice the fun factor they associate with a store. Therefore, this research was
focused on shopping enjoyment as experienced by SL residents.

27
Table 3
Literature Involving Shopping Enjoyment
Researchers Application Constructs Components Results
Algharabat and
Dennis (2009)
Website Atmospherics S-O-R [Stimulus (color & control),
organism(hedonic and utilitarian),
responses (behavioral intentions )]
Atmospherics of a 3D virtual model
adds more information, fun and
enhances consumer responses
towards the online retailer.
Daugherty et al.
(2008)
Website 3D product
visualization
Product knowledge, brand attitude,
and purchase intention.
Use of 3D product visualization
increases enjoyment.
Kim and Forsythe
(2008)
Website Virtual try-on
technology
Information, interactivity, and
entertainment
Virtual try-on technology increases
entertainment value.
Kim and Stoel
(2004)
Website Dimensions
of website
quality
Web appearance, entertainment,
informational fit-to-task, transaction
capability, response time, and trust.
Informational fit-to-task,
transaction capability, response
time are significant predictors of
shopping satisfaction.

28
Purchase Intention
Purchase intention is a measure of response behavior and consumer reaction to certain
experiences (Daugherty et al., 2008). The main objective of applied social science or business
research is to establish a relationship between the psychographic characteristics of individuals
and the behaviors of these individuals (Young, DeSarbo, & Morwitz, 1998). Psychographic
characteristics are related to personal values, attitudes, interests, and so on. For example, the goal
of this research was to determine consumer purchase intentions from SL stores based upon their
experiences and psychographic characteristics. Therefore, based upon measured consumer
purchase intentions (via answers to questions asked in a questionnaire), this research tested
whether consumers would purchase products if retailers actually sold real products through SL
stores. However, in the real world it is not feasible to observe actual purchase behavior of
individuals. Consumers’ responses (i.e., self-reported purchase intention) in the survey about SL
stores being used to sell real products were used as a proxy variable to predict consumers’ actual
purchase intentions. Therefore, on the basis of consumers’ responses on the purchase intention
scale, this research was used to explain consumers’ SL store purchase intentions when using an
SL store by a real life retailer selling its products.
Research Model
As a result of the ongoing developments in software technology, especially in high
efficiency computers and high-resolution graphics, there are plenty of chances for SL to be
adopted as a new retail channel. Also, constantly growing competition in the retail sector pushes
retailers to avail themselves of new technologies such as SL. Having discussed the opportunities
for retailing through SL in the previous sections, this study was used to identify crucial factors
that might prompt consumers to make purchases from SL stores. Upon extensive research,

29
interactivity, store atmosphere, and shopping enjoyment were determined as the three
dimensions of SL stores which influence consumers’ purchase intentions. Most of the reviewed
literature attributed store atmosphere and shopping enjoyment to purchase intentions. Also,
interactivity was the main contributor to increasing consumers’ online store purchase intentions.
Since these factors are important in an online environment, the same features were adopted for
SL stores. Thus, identifying the importance of SL store features toward consumers’ purchase
intentions, the study utilized interactivity, store atmospherics, and shopping enjoyment as the
predictors of purchase intention in an SL store. The first predictor, interactivity incorporated the
sub-features of control, two-way communication, and response-time. All these elements were
combined into one construct called interactivity.
To study consumers’ purchase intentions from SL stores, it was important to understand
the influence of interactivity, store atmospherics, and shopping enjoyment on purchase decisions.
In the case of online stores, even though they are capable of providing important information
about their products effectively, they are unable to provide realistic product experiences to
consumers (Daugherty et al., 2008). As a result, consumers experience a lack of the same
interactivity they would experience in a brick-and-mortar store. This flaw of online retail stores
has been somewhat eliminated by the 3-D environment (Daugherty & Biocca, 2009). Daugherty
and Biocca emphasized that 3-D environments are capable of providing realistic or direct
experiences like those found in brick-and-mortar stores. These direct experiences elevate
consumers’ purchase intentions from that store since the 3-D virtual environment allows
consumers to interact with the product and to analyze the product carefully. According to Shim,
Eastlick, Lotz, and Warrington (2001), consumers are likely to purchase a product through the
same medium at which they have examined the product. Thus, consumers who are likely to

30
analyze the products in an SL store will probably make their purchases through the same SL
store. Also, Kim et al. (2007) suggested retailers adopt 3-D virtual product presentation
technology in their stores to attract and retain consumers. SL presents information completely
through 3-D technology, including products, avatars, stores, and so on. Therefore, it would be
beneficial to use SL for retailing instead of using expensive 3-D technology in online stores.
Kim and Kim (2004) stated that online stores have the potential to influence consumer
purchase intentions if they are convinced that online shopping is interactive by providing rich
information about the product and two-way communication and offering good store layouts in
terms of quality graphics and pictures. Additionally, virtual image technology such as 3-D
product visualization encourages consumers to shop online (Kim et al., 2007; Verton, 2001). The
3-D environment of SL and the colors used in SL stores create an entirely different atmosphere
for consumers than the environments created through conventional online stores. Li et al. (2003)
found that 3-D virtual product presentation technology outperformed 2-D pictorial presentation
of a product. Thus, SL stores’ atmosphere closely resembles those of brick-and-mortar stores.
Jin and Boleburch (2009) stated, “enjoyment in both offline and online shopping
situations is critical” (p. 52). The 3-D virtual technology found in online stores increases
consumers’ experience of enjoyment during shopping and leads to increased online sales (Kim et
al., 2007). This finding implies that due to the presence of the 3-D environment in an SL store
consumers can enjoy shopping and experience increased purchase intention.

31
Figure 1. The impact of interactivity, store atmospherics, and shopping enjoyment on purchase intention.
Hypotheses
Influence of Interactivity on Purchase Intention
Previous studies demonstrated that online stores’ interactivity influence consumers’
purchase intentions and their satisfaction (Ballantine, 2005; Daugherty et al., 2008; Jiang &
Benbasat, 2007; Lee et al., 2006). The timeliness of information provided on a retailer’s website
results in better interaction for consumers and has a significant effect on consumer satisfaction,
as better interactivity of an online store allows consumers to have greater control over their
shopping experiences (Algharabat & Dennis, 2009; Ballantine, 2005; Dholakia & Zhao, 2008).
Constantinides (2004) defined interactivity as a combination of customer service and after sales
interaction with company personnel and network effects. All these elements preexist in an SL
store. Previous researchers revealed that interactive retail websites, with the inclusion of an
animated character (or avatar) as a customer representative, increase consumers’ purchase
intentions (Häubl & Trifts, 2000; Holzwarth et al., 2004; Moon, 2000; Nass, Lombard,
Purchase Intention
Interactivity
Store Atmospherics
Shopping Enjoyment

32
Henriksen, & Steur, 1995 ). Therefore, on the basis of previous research and SL stores’
preexisting features the first research hypothesis was stated as the following:
H1: Interactivity of an SL store positively affects consumer purchase intention.
Influence of Store Atmospherics on Purchase Intention
Kotler (1973-1974) found that store atmospherics were important and decisive factors in
determining consumers’ purchase intentions. Thus, the background including wall colors and
colors of the signboards used to highlight and display merchandise in an SL store are collectively
used to define store atmospherics. Store atmospherics are an integral part of SL stores, which
could be noticed consciously or subconsciously by a consumer and could impact consumers’
purchase decisions. The literature review formed a foundation to select store atmospherics as
predictors of purchase intentions.
Earlier researchers indicated that store atmosphere can influence consumers’ purchase
intentions when shopping in brick-and-mortar stores (Baker, Grewal, & Levy, 1992; Bellizi,
Crowley, & Hasty, 1983; Kotler, 1973-1974; Milliman, 1982). Researchers have investigated
store atmospherics in reference to color, lighting, or music and found that these aspects of store
atmospherics significantly influence consumers’ emotions (e.g., pleasure and arousal) and
thereby affect their intentions to make purchases from a given store (Menon & Kahn, 2002).
Taking into account the rapid technical innovations in the e-commerce arena and the use of the
Internet for retailing, many researchers have focused on online store atmospherics (Manganari et
al., 2009; Wu et al., 2008). Looking at the importance of store atmospherics in online store, it is
important to examine the characteristics of an SL store’s shopping environment. Therefore, this
study included examining the effect of merchandise display colors (i.e., signboards) and the
colors used to highlight the merchandise and to define important merchandise information in an

33
SL store on consumers’ purchase intention. Therefore, the second research hypothesis was stated
as the following:
H2: Atmospherics of an SL store positively affect consumer purchase intention.
Influence of Shopping Enjoyment on Purchase Intention
Similar to shopping at a retail website, a consumer could find an SL store experience
entertaining while shopping. The enjoyment could occur during product examination, during
communication with an avatar sales representative, or due to the interactive environment of the
SL store. Daugherty et al. (2008) stated that online stores have the ability to provide realistic
experiences because the Internet creates a sense of interactivity and enjoyment. The realistic
experiences results in increased product knowledge (since SL residents can observe the product
in a 3-D environment) and behavioral change toward the product and the store. The realistic
experiences provide users with a sense of control over the type of experience they can get and
with their activities in SL. Daugherty et al. found that these types of virtual experiences with a
product lead to increased purchase intentions. Therefore, the third predictor for this study was
shopping enjoyment.
Shopping enjoyment is an important aspect of online shopping to retain consumers
(Shergill & Chen, 2005). Shergill and Chen (2005) pointed that shopping enjoyment experienced
in an online store is positively and significantly related to the intent to purchase from that
website. According to Guiry et al. (2006), many consumers perceive shopping enjoyment as a
recreational activity and enjoy the experience of being in the marketplace to make purchases. By
taking into account SL stores’ unique 3-D environment, the third research hypothesis was stated
as the following:

34
H3: Shopping enjoyment experienced in an SL store positively affects consumer purchase
intention.
Summary of Literature Review
Currently, consumers are inundated with numerous shopping channel choices which
include brick-and-mortar stores, catalogues, online stores, direct marketing, and television
shopping. However, all of these channels have both advantages and disadvantages. For example,
shopping in brick-and-mortar stores can be time consuming but allows consumers to enjoy the
tangible aspects of shopping like touching and trying products prior to purchase. Additionally,
brick-and-mortar shopping allows face-to-face interactions with sales associates and the ability
to ask for assistance while shopping as well as experiences with store atmosphere and general
social interaction opportunities. While online stores provide the advantage of product
comparison, save time, and operate 24 hours a day, but they lack interactivity, atmosphere and
enjoyment. It is very difficult in an online store to create the desired store atmospherics that
engage consumers in the shopping experience. That means there is not much scope to
differentiate one online store from another. However, many researchers have argued that
enjoyment is not only an inseparable part of online shopping but also that enjoyment prompts
consumers to make impulse purchases (Kim et al., 2007; Kim & Kim, 2008; Lee et al., 2006).
On the contrary, some researchers found that enjoyment does not affect consumers’ purchase
decisions in the online atmosphere (Kim & Stoel, 2004; Koufaris, 2002). SL stores eliminate
most of the drawbacks to catalog, brick-and-mortar, and online store shopping. Therefore, taking
into account the three SL store features of interactivity, store atmosphere, and shopping
enjoyment, this study was aimed at predicting consumers’ purchase intentions to buy real
products from SL stores. However, virtual environments such as SL are very complex to study.

35
This literature review was developed from studies based on brick-and-mortar and online stores.
The three features of SL were reviewed in the context of SL, and a framework for SL stores was
determined regarding the influence of SL stores’ features on consumers’ purchase intentions if a
real-life retailer sells real products through these SL stores. Finally, in this literature review SL
was analyzed from a different perspective in order to enable retailers to utilize SL as a new retail
channel in the future.

36
CHAPTER 3
METHODOLOGY
The invention of three-dimensional (3-D) virtual technology in computer gaming industry
in early 2000 gave birth to Second Life (SL). SL is a virtual world parallel to the real world and
enables users (also called as avatars and residents) to perform all the activities similar to those
they perform in the real world. Because SL has not been systematically researched, the lack of
documentation about SL makes it even more difficult to utilize SL for retailing. Therefore, the
current research addressed this gap in the literature. This study was aimed at determining some
of the key features of SL that influence consumers’ purchase intentions from the SL stores.
Additionally, this study provided retailers a systematic approach to target consumers, or SL
residents, by collecting their real life demographics and their brand preferences.
A framework along with three hypotheses was developed to achieve the above mentioned
aims. This framework included the three independent variables of interactivity, store
atmospherics, and shopping enjoyment and a dependent variable of purchase intention. Based on
previous literature addressing online stores, a questionnaire was developed to measure all the
three variables on a scale. Questionnaire development is discussed in detail in the Instrument
section of this chapter. The sections of this chapter are comprised of the study’s methodology
and explain instrument development, target population and sample, SL demographics, followed
by pre-test information and its results.
Instrument Development
A survey instrument was developed by adapting existing scales selected from the
literature review. Based on the reviewed literature, the predictor variables were identified as
interactivity, store atmospherics, and shopping enjoyment. The outcome variable in the study

37
was purchase intention (Table 4). The instrument included the demographic variables of gender,
age, ethnicity, education level, and annual household income. The participants were encouraged
to provide their personal views and shopping experiences in SL.
Table 4
Scales
Source Variables Scale
Liu (2003) Interactivity (originally 15-items)
Koo and Ju (2010) Store Atmosphere (color) 3-items
Jiang and Benbasat (2007);
Koufaris (2002)
Shopping Enjoyment 4-items
Burner et al. (2001) Purchase intention 4-itmes
Gender, age, ethnicity,
education level, annual
household income
Demographics 11-items
Interactivity
The variable, interactivity was composed of the two underlying constructs of active
control and two-way communication. The scale used to measure this variable was adapted from
previous research (Liu, 2003). Originally, a 15-item scale was developed to measure the
underlying constructs of interactivity in an online store. Further, three constructs of active
control, two-way communication, and synchronicity were identified as the variables of
interactivity. Each of these constructs was discussed in detail in the literature review section of
this study. However, for the purpose of the study only 10 scale items were used.

38
Active control was a 4-item scale and measured consumers’ ability to control the flow of
information as well as their activities in an SL store. According to Liu (2003), in an interactive
medium, consumers should be able to control their activities (i.e., shopping/browsing) in an
online medium, and they should be able to choose freely what they are willing to do. For
example, the scale had items such as “while I was shopping/browsing in this SL store, I felt that I
had a lot control over my shopping experiences,” “I could choose freely what I wanted to see,”
and “my actions decided the kind of experiences I got.” The scale for two-way communication
was a 6-item scale and measured SL stores’ ability to facilitate two-way communication with
consumers. Examples of the scale items were “this SL store is effective in gathering customer’s
feedback” and “this SL store facilitates two-way communication between the customers and
avatar sales representative.”
Store Atmospherics
Store atmospherics was measured on a 3-item scale. The atmospherics questions were
adapted from Koo and Ju’s (2010) scale and modified to better suit the purpose of this study. The
actual scale was developed to measure the effects of several other components (e.g., graphics,
links, menu, and color) of the SL store website on online purchase intention. For the purpose of
this study, the “color” component was adapted from this scale. The statements for this scale were
modified to address SL stores’ visual displays, colors, and attractiveness. The scale items
included items like “this store emphasizes newly displayed merchandise with distinctive colors,”
“the colors in this SL store are visually appealing,” and “color coding” used in the SL store
“highlights important content.”
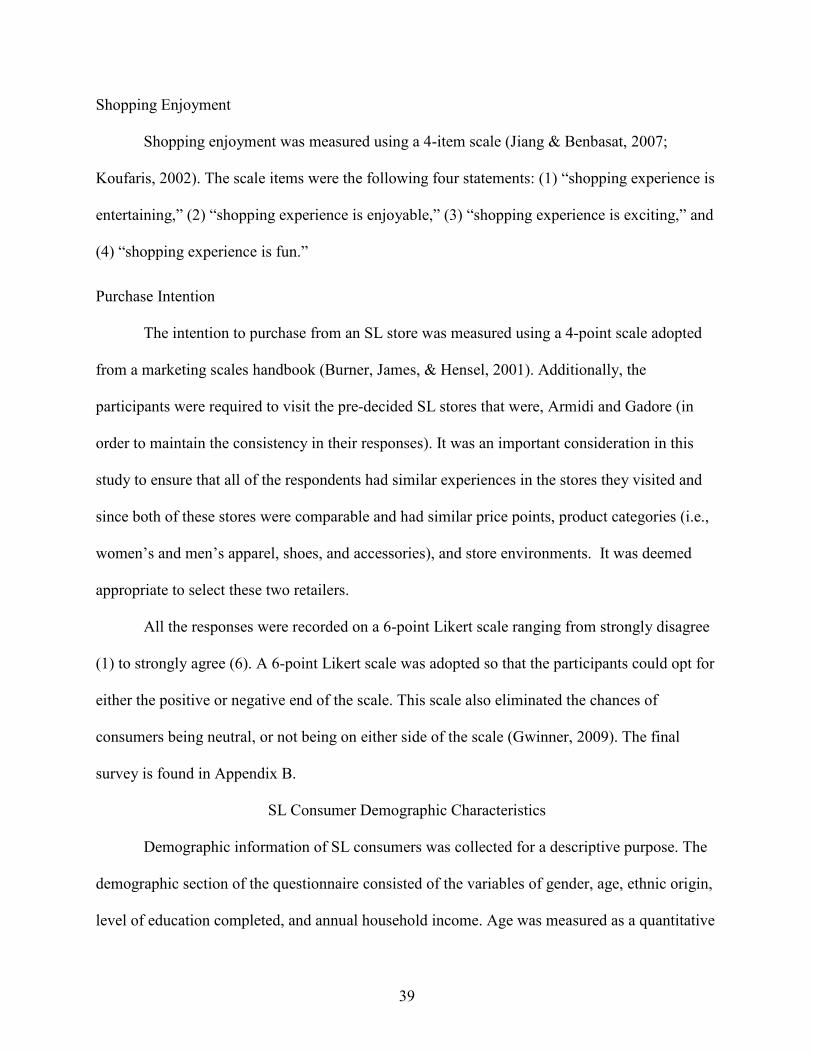
39
Shopping Enjoyment
Shopping enjoyment was measured using a 4-item scale (Jiang & Benbasat, 2007;
Koufaris, 2002). The scale items were the following four statements: (1) “shopping experience is
entertaining,” (2) “shopping experience is enjoyable,” (3) “shopping experience is exciting,” and
(4) “shopping experience is fun.”
Purchase Intention
The intention to purchase from an SL store was measured using a 4-point scale adopted
from a marketing scales handbook (Burner, James, & Hensel, 2001). Additionally, the
participants were required to visit the pre-decided SL stores that were, Armidi and Gadore (in
order to maintain the consistency in their responses). It was an important consideration in this
study to ensure that all of the respondents had similar experiences in the stores they visited and
since both of these stores were comparable and had similar price points, product categories (i.e.,
women’s and men’s apparel, shoes, and accessories), and store environments. It was deemed
appropriate to select these two retailers.
All the responses were recorded on a 6-point Likert scale ranging from strongly disagree
(1) to strongly agree (6). A 6-point Likert scale was adopted so that the participants could opt for
either the positive or negative end of the scale. This scale also eliminated the chances of
consumers being neutral, or not being on either side of the scale (Gwinner, 2009). The final
survey is found in Appendix B.
SL Consumer Demographic Characteristics
Demographic information of SL consumers was collected for a descriptive purpose. The
demographic section of the questionnaire consisted of the variables of gender, age, ethnic origin,
level of education completed, and annual household income. Age was measured as a quantitative

40
variable and divided into groups. The seven age groups were the following: (1) 18-20 years old,
(2) 21-23 years old, (3) 24-26 years old, (4) 27-29 years old, (5) 30-32 years old, (6) 33-35 years
old, and (7) more than 35 years old. Ethnicity was measured in the following seven categories:
(1) African-American, (2) Asian American, (3) Caucasian American, (4) Hispanic American, (5)
Native American, (6) Bi/Multi-racial American, and (7) Other. Respondents were asked to report
their education level according to the following: (1) High school, (2) Associate degree, (3)
Bachelor’s degree, (4) Master’s degree, (5) Doctoral degree, (6) Professional degree, (7) Other.
Income was measured as gross annual household income and were represented in the following
10 income intervals: (1) Less than $40,000; (2) $40,000-$59,999; (3) $60,000-$79,999; (4)
$80,000-$99,999; (5) $100,000-$119,999; (6) $120,000-$139,999; (7) $140,000-$159,999; (8)
$160,000-$179,999; (9) $180,000-$199,999; and (10) More than $200,000. At the end of the
questionnaire, participants were asked to provide their comments or to describe their experiences
in SL stores.
Population and Sample
All active SL residents who had purchased apparel, shoes, or accessories from the SL
stores were the population of this study. However, to better meet the goals of the study there
were pre-determined criteria for the sample of this study. The first criterion was to collect data
from the participants in the age group of 18-35 years, that is, Gen Y consumers. A report on the
SL demographic revealed that most of the SL residents or consumers belong to the age group of
25-34 years (Borst, 2009). The category Gen Y comprises of the people born between 1980 and
1994 (Unknown, 2009), who are completely immersed in a technology-rich culture and are
considered “digital natives” or the “Net generation” (Benette, Maton, & Kervin, 2008; Prenksy,
2001; Tapscott, 1999). Gen Y consumers possess sophisticated knowledge and skills in suing

41
information technology. As a result of their upbringing coinciding with the latest interactive
technologies and their experiences with technology, Gen Y consumers display different views,
opinions, behaviors in terms of shopping preferences and styles from earlier generations of
consumers. It could be concluded that this generation is immersed in technology and equipped
with latest gadgets, latest technology and other support systems, such as money. Therefore, Gen
Yers have turned toward the Internet, rather than spending time in malls, for their shopping
which has motivated retailers to target Gen Y consumers on SL (Hrastnik, 2007). The population
for this study consisted of Gen Y consumers who make purchases in the SL stores for their
avatar’s apparel and have sufficient knowledge to answer the questions. The second criterion for
the study required that the respondents should be residents of the United States of America
(USA), as the report by Borst (2009) showed that the majority of consumers in SL are from the
USA. The purpose of targeting USA residents in SL was to maintain consistency within the
sample. The third criterion required that the participants must be experienced shoppers in SL so
that they could answer the survey questions. Therefore, the participants must have been SL
residents for at least the past 6 months prior to the study and must have visited or made
purchases from SL stores mainly for apparel, shoes, and accessories from SL retail stores. This
criterion was set to ensure that the participants possessed sufficient knowledge about SL stores
and were familiar with SL shopping in order to ensure they provided realistic data for this study.
Data Collection
Due to lack of responses it was not practical to approach SL consumers for administering
the survey. Additionally, due to time differences between different time zones in different
countries very few avatars can be seen on SL during day time (i.e., USA central time zone). Also
SL users demanded very high compensation to participate in the study. Therefore, to collect data,

42
several organizations including Social Research Foundation (SRF), Market Truths Limited, and
Qualtrics were contacted in October of 2009. Market Truths and Qualtrics quoted data collection
expenses as high as $4,000. However, SRF offered a student discount and agreed do this project
for $500 and provided $2 compensation to each panel member. SRF is a New York based non-
profit organization that has been active in SL since 2003. This organization has conducted
several studies, for example the 2008 Second Life Survey, to provide in-depth understanding of
SL demographics and SL residents’ shopping behavior (SRF, 2010). The 2008 Second Life
Survey involved a detailed study of SL consumers and their perspectives on real-life brands in
SL. From SRF’s (2010) website the following information was gathered: In 2006, SRF launched
the largest consumer research panel in SL, the First Opinion Panel, with about 13,000 members.
The members of the First Opinion Panel were SL residents, who owned virtual land, spent and
earned money in SL, were doing business via SL, and spent at least 2 hours a day in SL.
The requirements of the study and the survey as well as the demographics of SL residents
were discussed with SRF’s CEO Mr. Andrew Mallon over a period of 10 months while the
survey design was in progress. When the survey was ready to launch in September 2010, Mr.
Mallon reviewed his panel list to satisfy all the criteria of this study. On October 12, 2010, Mr.
Mallon said they did not have sufficient panel members that satisfy the criteria of this study of
collecting data only from Gen Y consumers and American residents. SRF declined to conduct
data collection. Even though all of these demographic requirements were discussed and given to
Mr. Mallon in written consent SRF form (see Appendix C), in a telephonic conversation he said
that many of the panel members had left SL due to inactivity of the retailers in this virtual world.
The issue was discussed with the committee members (Dr. Bharath Josiam and Dr. Sanjukta
Pookulangara) overseeing this study and a collective decision was made to include all age groups

43
and to use participants from different countries. As for the sample being representative of the
population, it must be selected from the population (Rumsey, 2003). Also, because the
population of SL itself is very diverse, the restriction in age was removed which expanded the
demographic profile of the participants. This decision was based on the fact that the population
of this study was SL residents who could be anybody from anywhere, and as long as they were
active in SL and residing in SL for at least past 6 months, they were eligible to participate.
Finally, SRF’s CEO Mr. Mallon agreed to undertake the project and was hired to collect data for
this study. The final copy of the survey was sent to Mr. Mallon on October 14, 2010. Later, Mr.
Mallon suggested changing few technical terms used in the survey considering the fact that the
panel members/participants might not understand those terms. The survey was launched on
October 26, 2010. The survey launch period was longer than anticipated due to the delay in
survey testing. The data from 250 respondents was collected over the period of 12 days
(10/26/2010 to 11/8/2010). Each participant was awarded a compensation of L$500 ($1 USD =
L$250) to complete the questionnaire. SRF was responsible for compensating the participants
upon completion of the questionnaire. They collected the participants’ SL avatar names and
email addresses to distribute the compensation. The L$500 awards were directly deposited to
participants’ SL accounts after they completed the survey.
The simple random sampling technique was used for data collection, and 250 participants
were randomly selected from SRF’s list of panel members. This technique was helpful to collect
data representative of the population. In this technique, every member of the population had an
equal opportunity of being selected to be part of the sample (Rumsey, 2003). The focus of this
study was all the SL residents who spend money and time in SL; therefore, the random sample
technique was useful for this study.
44
Pre-Test
To test the scale reliability and content validity of the questionnaire a pre-test was
conducted. The instrument was developed by adapting scales from previous studies as well as by
modifying the scales completely so that they were suitable for SL. Thus, it was important to
conduct the pre-test to confirm the content validity and reliability of the modified scales prior to
final data collection.
Validity is a pivotal factor in the selection and application of a scale in an instrument.
Validity is the extent to which an instrument measures what it is intended to measure (Lynn,
1986). Lynn (1986) stated that “content validity is the determination of the content
representativeness or content relevance of the elements/items of an instrument” (p. 382). The
content validity of the instrument was verified by having the committee members, who were
familiar with the subject and helped design the instrument, confirm the items measured the scales
as intended. By taking their recommendations into account, changes were made to the
instrument.
Reliability is the ability of a scale (measure or questionnaire) to produce consistent
results when the same variables are measured under the same conditions. Cronbach’s alpha (α) is
a measure of reliability and indicates the overall reliability of a questionnaire. Values of α that
attain about .8 are considered good and indicate that given the same conditions the questionnaire
would reproduce the same results.
The pre-test data were collected using a convenience sampling technique. All of the
undergraduate students (n = 100) majoring in the merchandising field were the population of this
pre-test. The purpose for selecting merchandising students was that they were studying fashion
and retailing and possessed sufficient knowledge to answer the research questions. Due to time

45
and money constraint, it was not possible to seek SL residents to participate in this pre-test. As
some sort of incentives are always helpful to raise motivation to participate in surveys (Church,
1993), in order to motivate students and increase participation in the pre-test study, the pre-test
participants were awarded extra credit points upon completing the survey.
The questionnaire was developed using the Qualtrics Survey Pro tool. Surveys can be
easily and quickly created using this tool. This instrument was carefully designed to make it
user-friendly, including the incorporation of a progress-indicator. The progress-indicator made it
easy for participants to estimate the length of the survey and motivated participants to complete
the survey (Couper, Traugott, & Lamias, 2001). This survey tool allowed the researcher to
create a survey link which could be further distributed to the participants. The link to the
questionnaire, along with the cover letter (see Appendix A), was uploaded on the online section
of the classes. The cover letter explained that participation was voluntary and that confidential
information about the participants will never be disclosed. Prior to uploading the survey link on
the online section of the classes, the professors were requested to ask students if they have ever
used SL before in their classes. It was noticed that many of the participants showed ignorance
about SL, so the cover letter included a brief introduction of SL, steps to download SL, and the
web addresses of the SL stores (via links to the Armidi and Gadore stores). Since the participants
of this pre-test were Gen Y consumers, it was assumed that participants would be conversant
with online/virtual shopping and was expected that they would be comfortable completing the
online survey. To experience the ambience of the SL stores, participants were asked to visit the
two pre-selected stores in SL. Accordingly there were two different questionnaires for the two
different stores. Although all the content was same for both stores’ surveys, only the store names
were changed so as to remind the participants the name of the store they had just visited. As

46
explained in previous section, two different yet comparable SL stores were selected, Armidi and
Gadore. The participants were randomly assigned to the two different surveys so that 50% of
them visited the Armidi store and 50% visited the Gadore store and filled out the questionnaire in
reference to the respective SL store they visited.
The pre-test started at the end of July of 2010. But the time frame of the pre-test was
extended due to the low response rate and low enrollment in the 2010 summer semester. Thus,
upon the commencement of fall semester, the pre-test was launched again. Total of 108
responses (with 100 being usable) were collected from August 15, 2010 through September 30,
2010. Although the number of responses was low, but the amount was acceptable to conduct
factor analysis. According to Guadagnoli and Velicer (1988), a sample size of 100 to 200
responses is sufficient for factor analysis.
The data collected for this pre-test were analyzed using SPSS version 18.0 for factor
analysis and reliability. Pre-test is basically a final stage in questionnaire design which
ascertains how well the questionnaire works (Hunt, Sparkman, & Wilcox, 1982). The three
independent variables pre-tested were interactivity, store atmosphere, and shopping enjoyment.
The one dependent variable pre-tested was purchase intention. Upon exploratory factor analysis,
the variable of interactivity was split into two different constructs. The two components became
two-way communication and control.
According to Nunnaly (1978), the higher the value for the Cronbach’s α coefficient, the
more reliable the scale is. Nunnaly indicated that the value of 0.7 is an acceptable reliability
coefficient but that lower values of the Cronbach’s α can sometimes be seen in literature. Scale
reliabilities for the two components of two-way communication and control ranged from .71 to
.67. This scale was found to be consistent with the literature (Ballantine, 2005; Dholakia & Zhao,

47
2009; Liu & Shrum, 2002; Liu, 2003; McMillan & Hwang, 2002). The store atmosphere scale
was unidimensional, and the reliability was .89. The shopping enjoyment scale was found to be
unidimensional, and reliability was .98.
The reliability results showed that the scales are consistent and able to differentiate
between different components. The pre-test results showed no inconsistencies in the reliability
of the scales, and no modifications were needed. The reliability of all of the scales was high
except for the control factor of the interactivity scale, which could be due to the lower number of
items in the scale. The reliability and factor analysis results showed that the survey instrument
was reliable. Therefore, the survey was utilized for final data collection without any changes.
The finalized questionnaire was sent to the SRF research agency for data collection.

48
CHAPTER 4
RESULTS
A total of 255 responses were collected from Second Life (SL) residents. The
demographic information of SL residents is described in the first section. The data analysis
section of this study is comprised of demographic details of the sample, factor analysis, and the
reliability of the dependent and independent variables followed by multiple regressions.
Sample Demographic Characteristics
Among 275 panel members, 255 completed the survey with a response rate of 92.7%.
There were 249 usable surveys. Almost half of the respondents were above 35 years old
(40.1%), and the majority of the participants were female (54.6%) and Caucasian (61.0%).
Twenty-seven percent of this sample was comprised of foreign nationals from Britain, Australia,
Europe, and South America. The foreign national category had the second highest number of
respondents. Also, most of the respondents have completed high school (31.3%) and about 28%
had completed a bachelor’s degree. About 35% of the respondents earned below $40,000
annually, and about 27% earned incomes in the range of $40,000 to $59,999 (Table 5).
Table 5
Demographic Characteristics of the Respondents (N=249)
Variables Total sample
Frequency %
Gender
Male 113 45.4
(table continues)

49
Table 5 (continued).
Variables Total Sample
Frequency %
Female 136 54.6
Age
18-20 18 7.2
21-23 29 11.6
24-26 30 12.0
27-29 27 10.8
30-32 18 7.2
33-35 27 10.8
More than 35 years old 100 40.1
Ethnicity
African-American 3 1.2
Asian-American 8 3.2
Caucasian-American 152 61.0
Hispanic-American 7 2.8
Native-American 6 2.4
Bi/Multi-Racial-American 5 2.0
Other 68 27.3
Education
High School 78 31.3
(table continues)

50
Table 5 (continued).
Variables Total Sample
Frequency %
Associate Degree 39 15.7
Bachelor’s Degree 69 27.7
Master’s Degree 24 9.6
Doctoral Degree 8 3.2
Professional Degree 12 4.8
Other 19 7.6
Income
Less than $40,000 88 35.3
$40,000-$59,999 65 26.1
$60,000-$79,999 26 10.4
$80,000-$99,999 27 10.8
$100,000-$119,999 25 10.0
$120,000-$139,999 7 2.8
$140,000-$159,999 3 1.2
$160,000-$179,999 2 .8
$180,000-$199,999 1 .4
More than $200,000 5 2.0

51
Other External Variables
Table 6 summarizes the descriptive statistics of SL usage per week; time spent on
shopping in SL stores; number of years shopping in SL; amount of money spent on shopping via
SL, catalog, online stores, and brick and mortar stores in the past 6 months; and up to five real
life brands seen or purchased in SL. Approximately 46% of the respondents logged into SL one
to two times per week to shop, 45% spent 3 to 5 hours on shopping or browsing in SL stores, and
half of the respondents (55.8%) had been shopping via SL stores for the past 3 to 4 years. About
24% of the respondents mentioned that they had purchased brands like Nike from SL stores, and
16.9% purchased Adidas brand from SL stores.
Table 6
Descriptive Statistics of the Respondents (N=249)
Variables Total sample
Frequency %
Number of times logged into SL/week
1-3 115 46.2
4-6 49 19.7
7-9 35 14.1
10-12 12 4.8
More than 12 times 27 10.8
Other 11 4.4
Time spent on shopping in SL/visit
(table continues)

52
Table 6 (continued).
Variables Total sample
Frequency %
1-2 hours 93 37.3
3-5 hours 112 45.0
6-10 hours 33 13.3
11-15 hours 5 2.0
16+ hours 3 1.2
Other 3 1.2
Number of years since shopping in SL
Less than 1 year 24 9.6
1-2 years 65 26.1
3-4 years 139 55.8
5-6 years 17 6.8
More than 6 years 4 1.6
Other 0 0
Statistical Analysis
Several statistical methods were employed, such as frequency distribution, descriptive
statistics, factor analyses, multiple regression analyses using SPSS, Inc., version 18. Principal
component analyses with varimax rotations were used for the multi-item scales in order to
identify the underlying dimensions of the scales: interactivity of SL stores, SL store
atmospherics, shopping enjoyment in SL stores, and purchase intentions from an SL store. The
factors loading below .40 were eliminated from the scales. Stevens (1992) suggested that the

53
cut-off point of .40 was appropriate for interpretative purposes in that loadings greater than .40
represent substantive values.
It is very useful to check the reliability of a scale post factor analysis. Reliability means a
scale should consistently reflect the construct it is measuring (Field, 2005). Cronbach’s alpha (α)
is the measure of scale reliability. Each scale was tested for reliability and content validity.
Overall, the scales were internally consistent.
After conducting factor analyses and reliability, mean scores of each scale (i.e.,
interactivity, store, atmospherics, shopping enjoyment, and purchase intention) were computed to
form new variables. The function “compute” under the “transform” tab in SPSS was used to
create new variables. This function allows carrying out any number of calculations on the
variables. New variables were created by adding all the items which loaded on the same factor
and then dividing by the number of items, resulting in mean score to represent the variable. The
newly formed variables then appeared in a new column in the data editor window. These new
variables were utilized as the independent and dependent variables in the regression model.
Hypotheses H1, H2, and H3 were tested by using stepwise multiple regression analysis.
The purpose of multiple regression analysis is to find the linear combination of the independent
variables that correlate maximally with the dependent variable. A stepwise regression identifies
the independent variable that best predicts the dependent variable. In stepwise regression the
independent variable having highest correlation with the dependent variable is selected first. This
way the independent variables, which are strongly correlated with the dependent variable are
selected in order of strength and statistically insignificant variables are excluded from the
regression model.

54
Identification of Underlying Dimensions: Principal Component Analysis
Principal component analysis using varimax rotation was initially performed to identify
the dimensions of the scales used in the study. The analyses revealed two underlying dimensions
of interactivity of SL stores as control and two-way communication. Whereas, SL store
atmospherics, shopping enjoyment, and purchase intention from SL stores were unidimensional
scales. The results of the factor analysis with the calculated Cronbach’s α scores are provided in
Table 7.
Table 7
Factor Analysis
Factor Scale items Factor
loading
Eigen
value
Explained
variance
(%)
α
Two-way communication
3.04
34.8 .79
Facilitates two-communication between
the customers and avatar sales
representatives
.819
Effective in gathering customer’s
feedback
.795
Processed my requests very quickly .755
Provides information very quickly .705
Control
1.35 16.6 .68
(table continues)

55
Table 7 (continued).
Factor Scale items Factor
loading
Eigen
value
Explained
variance
(%)
α
Choose freely what I wanted to see .867
Had a lot of control over my shopping
experiences
.849
My actions decided the kind of
experiences I got
.574
Atmospherics
.192 64.1 .72
Displayed merchandise with distinctive
colors
.862
Colors are visually appealing .774
Highlight important content .763
Shopping
enjoyment
3.32 82.99 .93
Shopping experience is entertaining .906
Shopping experience is enjoyable .920
Shopping experience is exciting .888
Shopping experience is fun .929
(table continues)

56
Table 7 (continued).
Factor Scale items Factor
loading
Eigen
value
Explained
variance (%)
α
Purchase intention
2.15 52.38 .68
I intend to buy from SL store within next
3 months
.862
I intend to buy from
this SL store
.774
I will continue to use SL stores for
shopping in the future
.763
I will use the SL store rather than website
for shopping
.477
Likert scale range: 1 = strongly disagree; 6 = strongly agree
Interactivity
The results of principal component analysis revealed two dimensions of interactivity
scale (see Table 7). The two dimensions were labeled as two-way communication and control.
The results of factor analysis and the calculated Cronbach’s αs are shown in Table 7. The scale
was a modification of a previously developed scale by Liu (2003) for online stores. The
researcher developed a 15-item scale and identified three underlying dimensions of interactivity
which were two-way communication, active control, and synchronicity. However, only the two
dimensions of two-way communication and control were taken into account as per the features
available in SL stores and thus items pertaining to synchronicity were removed, and the scale
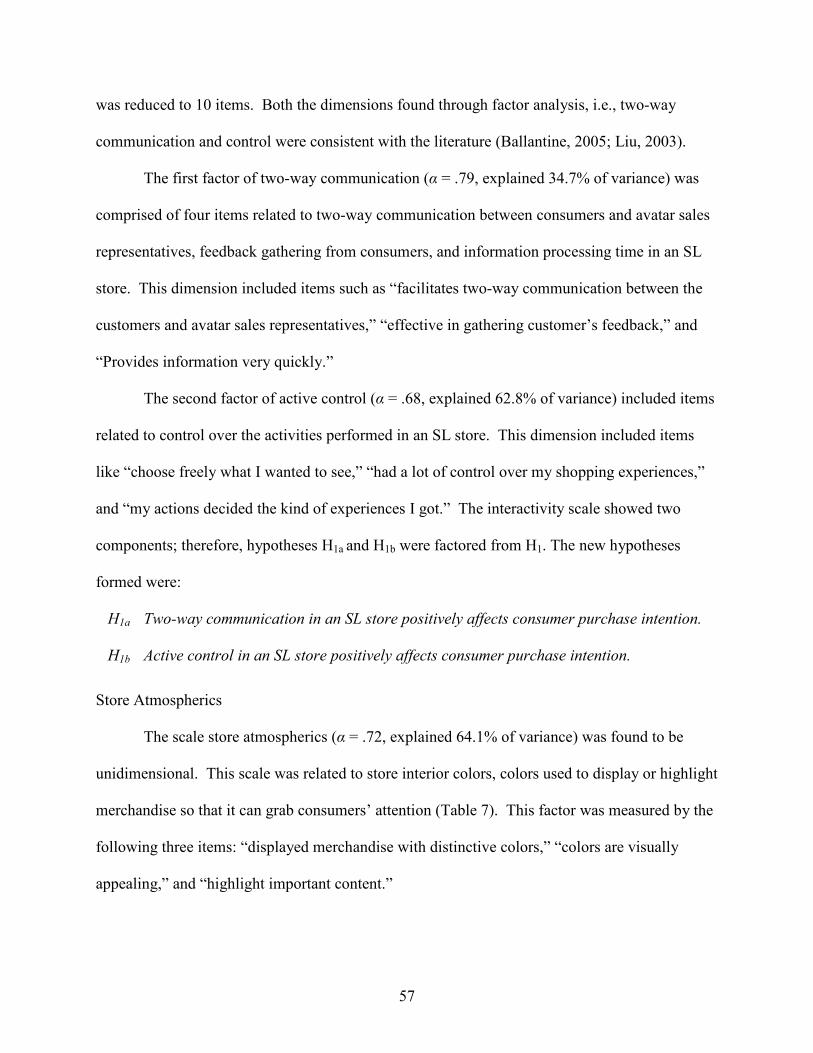
57
was reduced to 10 items. Both the dimensions found through factor analysis, i.e., two-way
communication and control were consistent with the literature (Ballantine, 2005; Liu, 2003).
The first factor of two-way communication (α = .79, explained 34.7% of variance) was
comprised of four items related to two-way communication between consumers and avatar sales
representatives, feedback gathering from consumers, and information processing time in an SL
store. This dimension included items such as “facilitates two-way communication between the
customers and avatar sales representatives,” “effective in gathering customer’s feedback,” and
“Provides information very quickly.”
The second factor of active control (α = .68, explained 62.8% of variance) included items
related to control over the activities performed in an SL store. This dimension included items
like “choose freely what I wanted to see,” “had a lot of control over my shopping experiences,”
and “my actions decided the kind of experiences I got.” The interactivity scale showed two
components; therefore, hypotheses H1a and H1b were factored from H1. The new hypotheses
formed were:
H1a Two-way communication in an SL store positively affects consumer purchase intention.
H1b Active control in an SL store positively affects consumer purchase intention.
Store Atmospherics
The scale store atmospherics (α = .72, explained 64.1% of variance) was found to be
unidimensional. This scale was related to store interior colors, colors used to display or highlight
merchandise so that it can grab consumers’ attention (Table 7). This factor was measured by the
following three items: “displayed merchandise with distinctive colors,” “colors are visually
appealing,” and “highlight important content.”
58
Shopping Enjoyment
This scale was unidimensional (α = .93, explained 83% of variance). The scale was
related to enjoyment experienced during shopping in an SL store. It was a four-item scale. The
four items were: “shopping experience is entertaining,” “shopping experience is enjoyable,”
“shopping experience is exciting,” and “shopping experience is fun.”
Purchase Intention
The purchase intention scale was unidimensional (α = .68, explained 52.4% of variance).
The scale was comprised of four items such as “I intend to buy from SL store within next 3
months,” “I will continue to use SL stores for shopping in the future,” and “I will use the SL
store rather than website for shopping.”
The next step was to compute the mean scores of each factor found. Since there were
two underlying factors of the scale interactivity, the mean scores of each factor were computed
separately and were named as two-way communication and active control. Similarly, mean
scores for the rest of the scales were computed.
Preliminary Data Screening
Skewness and kurtosis were the measures utilized to identify outliers. Skewness refers to
asymmetry of the distribution. A distribution with an asymmetric tail extending out to the right
is referred to as “positively skewed” or “skewed to the right,” while a distribution with an
asymmetric tail extending out to the left is referred to as “negatively skewed” or “skewed to the
left.” A symmetric distribution of the data will have skewness value that is close to zero or is
zero. Skewness can range from minus infinity to positive infinity. Kurtosis is a measure of the
“peakedness” of the distribution. If the data are within the range of +3 then the kurtosis is

59
acceptable. Frequencies with kurtosis and skewness values and histograms with normal curve
overlay were used to identify the outliers.
The data were examined for outliers prior to analyses of the hypotheses. The values for
skewness and kurtosis were in the acceptable range. Thus, it was assumed that the continuous
variables were normally distributed.
Data Analysis: Testing the Assumptions of Multiple Regression
The data were further analyzed to check the assumptions of multiple regression analysis.
To test the first assumption of normality, visual examination of the histogram with normal curve
overlay as well as skew and kurtosis values for each variable (Table 8) were completed. Non-
normally distributed variables (highly skewed or kurtotic variables or variables with substantial
outliers) can distort relationships and significance tests (Osbborne & Waters, 2002). All of the
variables were normally distributed, and the assumption of normality was met.
Table 8
Skewness and Kurtosis for the Data
Variables Skewness Kurtosis
Two-way-com .023 .130
Control .884 1.401
Atmos -.500 .289
Enjy -.478 .397
Purch_Inten -.172 .198
For the second assumption, the linear relationship among the predictors and the ultimate
performance was examined. Standard simple and/or multiple regressions can accurately estimate
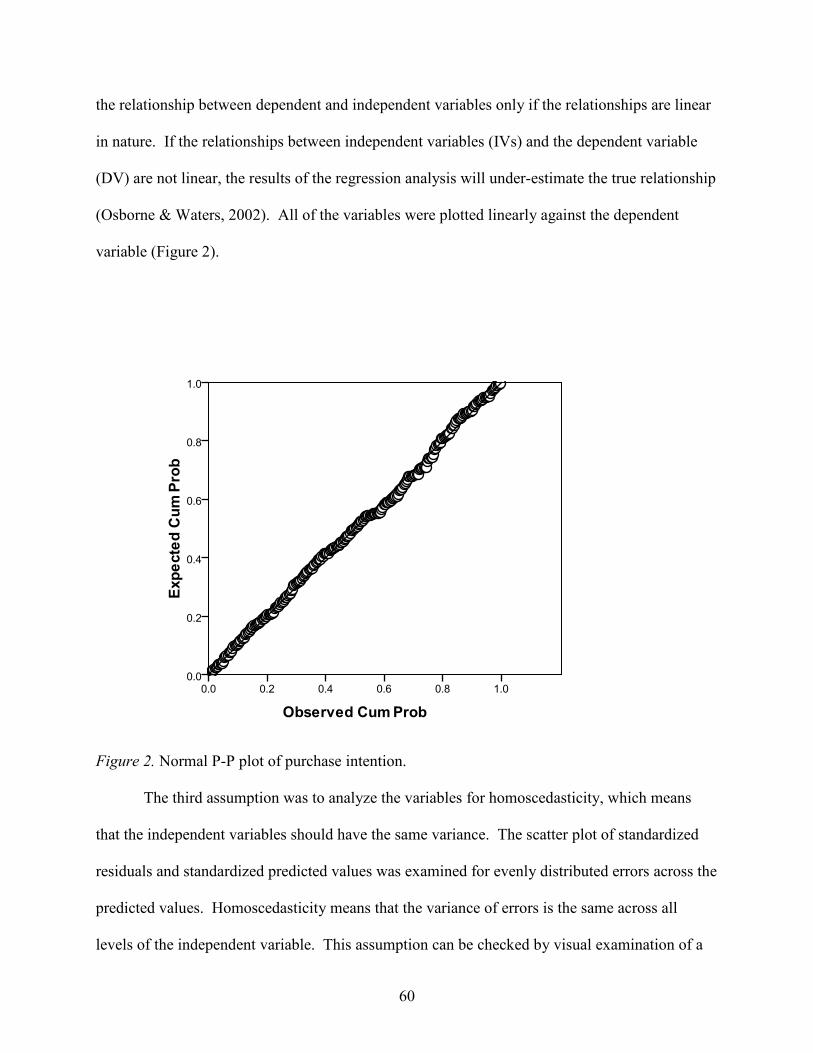
60
the relationship between dependent and independent variables only if the relationships are linear
in nature. If the relationships between independent variables (IVs) and the dependent variable
(DV) are not linear, the results of the regression analysis will under-estimate the true relationship
(Osborne & Waters, 2002). All of the variables were plotted linearly against the dependent
variable (Figure 2).
Figure 2. Normal P-P plot of purchase intention.
The third assumption was to analyze the variables for homoscedasticity, which means
that the independent variables should have the same variance. The scatter plot of standardized
residuals and standardized predicted values was examined for evenly distributed errors across the
predicted values. Homoscedasticity means that the variance of errors is the same across all
levels of the independent variable. This assumption can be checked by visual examination of a

61
plot of the standardized residuals (the errors) by the regression standardized predicted value, but
when the variance of errors differs at values of the independent variables, heteroscedsasticity is
indicated because the residuals are not evenly scattered around the line (Osborne & Waters,
2002). Figure 3 confirms that the assumption of homoscedasticity was met.
Figure 3. Scatter plot of the standardized residuals (the errors) by the regression standardized predicted value.
The last assumption of no multicollinearity states that there should be no perfect linear
relationship between two more of the independent variables. This assumption was checked by
conducting bivariate correlations among the independent variables (Table 9). In social sciences,
if the value of Pearson’s correlation coefficient (r) is more than .90, the coefficient indicates the
presence of multicollinearity (Tabachnick & Fidell, 1996). There was no multicollinearity found
among the variables.

62
Table 9
Correlations Among the Independent Variables
Scale Two-way
Communication Control Atmosphere Enjoyment Two-way Communication -
Control .357** -
Atmosphere .437** .270** -
Enjoyment .547** .345** .616** -
Purchase Intention .406** .186** .350** .600**
Note. * p < .05, ** p < .01, ***p < .001.
Hypothesis Testing: Multiple Regression
Multiple regression analyses were conducted to examine the hypotheses H1a, H1b, H2, and
H3. To generate a parsimonious result, the regression analysis was analyzed using the stepwise
method. Stepwise multiple regression is one of the several methods available to compute
ordinary least square regression in stages. In stage 1, the independent variable best correlated
with the dependent is included in the equation. This is followed by entering the second variable
of the remaining independent variables with the highest partial correlation with the dependent,
controlling for the first independent, and so on. This process is repeated at each stage, partialling
for previously-entered independents, until the addition of the remaining independent variables do
not increase R2 by a significant amount (Garson, 2008). Among the three hypotheses, only H1a
and H3 demonstrated significant models (Figure 4).
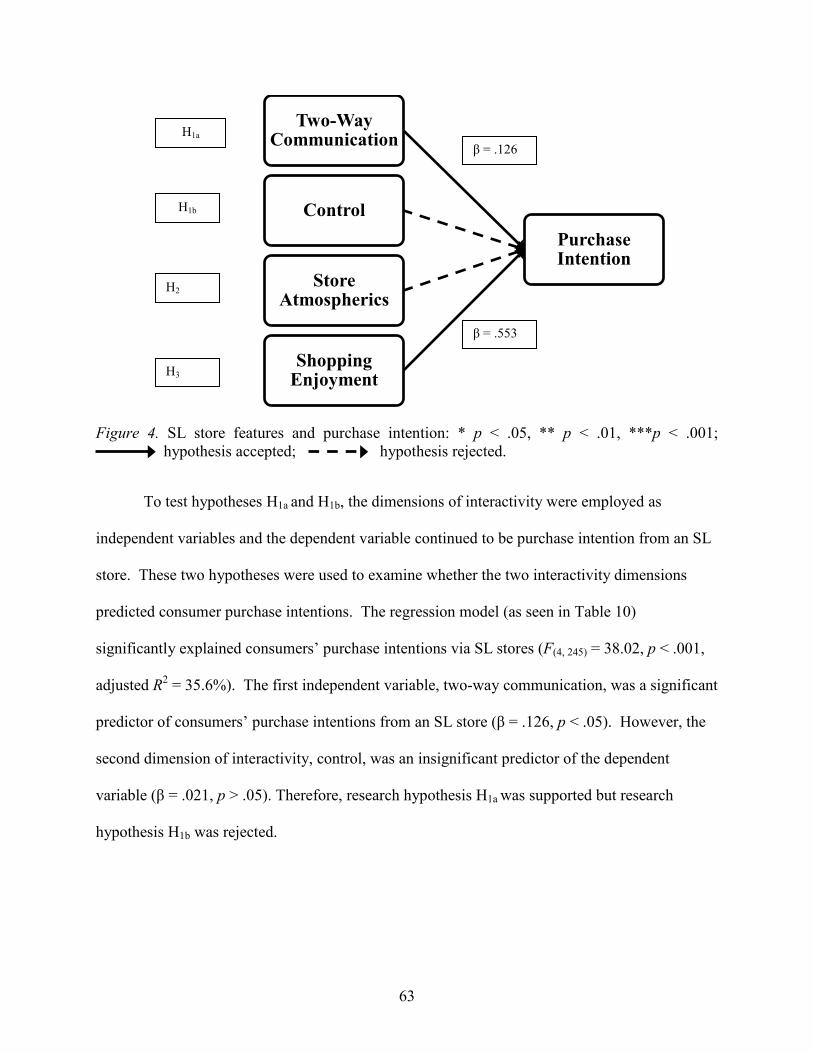
63
Figure 4. SL store features and purchase intention: * p < .05, ** p < .01, ***p < .001; hypothesis accepted; hypothesis rejected.
To test hypotheses H1a and H1b, the dimensions of interactivity were employed as
independent variables and the dependent variable continued to be purchase intention from an SL
store. These two hypotheses were used to examine whether the two interactivity dimensions
predicted consumer purchase intentions. The regression model (as seen in Table 10)
significantly explained consumers’ purchase intentions via SL stores (F(4, 245) = 38.02, p < .001,
adjusted R2 = 35.6%). The first independent variable, two-way communication, was a significant
predictor of consumers’ purchase intentions from an SL store (β = .126, p < .05). However, the
second dimension of interactivity, control, was an insignificant predictor of the dependent
variable (β = .021, p > .05). Therefore, research hypothesis H1a was supported but research
hypothesis H1b was rejected.
Purchase Intention
Two-Way Communication
Control
Store Atmospherics
Shopping Enjoyment
H1a
H1b
H2
H3
β = .126
β = .553

64
Table 10
Regression Model for Hypothesis H1a
Variables Parameter Estimates SEb
Predictors of Purchase Intentions from an SL store
Two-way communication (H1a) .126* .055
Control (H1b) .021 .049
Atmospherics (H2) -.029 .065
Shopping Enjoyment (H3) .553*** .063
Note. Adjusted R2 = 35.6%; F = 38.02***; * p < .05, ***p < .001.
The third research hypothesis was used to examine whether the store atmospherics of SL
stores predict consumer purchase intention. This variable was not a significant predictor of
purchase intention (β = -.029, p > .05). Hence, research hypothesis H2 was rejected.
The independent variable, shopping enjoyment, was a significant predictor of purchase
intention from SL stores (β = .553, p < .001). This variable was most significant predictor of
purchase intention from an SL store with the highest beta coefficient value. Thus, research
hypothesis H3 was supported. Therefore, according to the standard regression equation,
Yi = (b0 + b1aX1a + b1bX1b + b2X2 +…. + bnXn)+ εi
where, Yi is the predicted variable, b0 is constant, b1 is the coefficient of the first
predictor (X1), b2 is the coefficient of the second predictor (X2), bn is the coefficient of the nth
predictor (Xn), and εi is the error or the difference between the predicted and the observed value
of Y for the ith participant,
(Purchase Intention)249 = 2.183 + .126(two-way communication) 249 + .021(control) 249
+ (-.029)(store atmospherics) 249 + .553(shopping enjoyment) 249 + .272

65
CHAPTER 5
SUMMARY AND DISCUSSION
The three main features of Second Life (SL) stores, interactivity, store atmospherics and
shopping enjoyment, were examined in this study. Further, the effect of these three features of
SL stores on consumers’ purchase intentions was analyzed. Previous literature related to online
stores indicated that all the three identified features have a significant impact on consumer
purchase intentions (Algharabat & Dennis, 2009; Guiry et al., 2006; Li et al., 2003). Therefore,
to examine the effect of these three features on consumers’ purchase intentions from SL stores, a
regression model was built. The independent variables were interactivity, store atmospherics,
and shopping enjoyment, while purchase intention was the dependent variable. Upon statistical
analysis two out of the four hypotheses corroborated the significant impact of two-way
communication and shopping enjoyment on consumer purchase intention in an SL store. These
findings indicated that two-way communication and shopping enjoyment both are the primary
drivers that prompt consumers to purchase from SL stores. Therefore, new marketing strategies
must be developed around these two SL store features to utilize this medium for retailing and
marketing real life products.
Interactivity
Two-way Communication
Two dimensions of interactivity were revealed in the factor analysis: two-way
communication and control. Therefore, H1 was segregated into two parts i.e., H1a and H1b. On the
basis of the results obtained from multiple regression analysis, H1a (two-way communication in
an SL store positively affects consumer purchase intention) was supported (β = .126). Two-way
communication is a significant predictor of consumer purchase intentions from an SL store.

66
Two-way communication facilitates reciprocal interaction between a store sales representative
and the consumer. In case of SL, two-way communication is similar to real interaction between
the individuals, because a consumer’s avatar can experience face-to-face communication aided
with voice chat. This interaction in SL is very different than the interaction in online stores,
where important features of SL, such face-to-face and voice chat, are absent. For an online
medium to be able to provide realistic experiences to consumer, two-way communication is an
extremely important feature. For example, Chen and Yen (2004) indicated that interactivity is
effective when it provides real-time communication and in an MMORPG interface such an SL
store; interactivity is possible due to voice chat and presence of avatar sales representatives.
The results of this study revealed that the presence of an avatar in SL increased product
involvement and positive involvement toward a product. Online stores and online banking
services provide customer assistance by text chat and thus consumers experience lack of
interactivity because they cannot see the sale assistant face-to-face, on the other hand sales
representative’s avatar in SL is visible during instant messaging or voice chat. The presence of
an avatar in a three dimensional (3-D) environment, such as SL, is a very promising
communication channel for brand marketing and advertising (Jin & Bolebruch, 2009). Jin and
Bolebruch’s (2009) study supported the above findings that two-way communication increases
purchase intentions from an SL store.
The results of this study provide empirical evidence that the presence of avatars as sales
representatives in SL stores support two-way communication (i.e., real-time interaction) and thus
increases interactivity. Other than the absence of sales representatives in online stores, another
reason for lack of interactivity in online stores is time lag (Che & Yen, 2004). This drawback is
eliminated by SL’s voice chat option, up to a certain extent, because customers do not have to

67
wait for the text response from the sales representatives. Overall, the exchange of information in
SL is instant. Therefore, two-way communication is a significant predictor of consumer
purchase intention in SL.
Control
One of the reasons for the rejection of H1b research hypothesis of “active control in an SL
store positively affects consumer purchase intention” could be that the users were already
familiar with navigating the website or online environments similar to SL. Hence, control over
navigation might not lead to a significant predictor of purchase intention from an SL store. The
results indicated that SL residents may have already achieved good control over the SL virtual
environment.
According to Coyle and Thorson (2001) the variable control depends upon an
individual’s experience with computerized media. Greater levels of user experience with
computer or online environments result in positive attitudes toward online environments. In this
study, participants were asked few questions about their familiarity with SL. The participants
were asked how many hours per week they spent in SL. Another question asked them the
number of years since shopping in SL. Among all of the participants, 45% spent 3 to 5 hours
shopping in SL in a single visit and about 56% had been using SL for shopping for the past 3 to 4
years. The participants in the 3 to 4 years category were considered to be a highly experienced
SL group of users. The answers indicated that the participants were well familiarized with the
SL environment and able to control their subsequent actions in SL.
Liu (2003) defined control as the user’s ability to participate in a communication. The
users’ high experience with SL supports the fact that the users could comfortably participate in
communication within the SL environment and did not place importance on control factors in

68
SL. Similarly, Novak, Hoffman, and Yung (2000) demonstrated that the extent of use (i.e.,
experience) leads to greater skills at using the Internet or computers and directly affects users’
control. Skills refer to the consumer’s ability for action during the online navigation process.
Therefore, for users able to navigate (i.e., perform actions or play games) in a complex 3-D
virtual environment like SL, control is not be significant predictor of purchase intention.
Store Atmospherics
The statistical analyses of this study showed that store atmospherics have no effect on
consumer purchase intentions from an SL store and the hypothesis H2 of “store atmospherics
have positive effect on consumer purchase intentions from an SL store” was not substantiated.
Store atmospherics in this study referred to the “color” used in SL stores and did not affect
consumers’ purchase intentions from an SL store. The findings contradict earlier research in
which color was an important variable that could impact consumers’ decisions during shopping
(Hausman & Siekpe, 2009; Kotler, 1973-1974; Manganari, et al., 2009; Menon & Kahn, 2002).
In this study particularly, there could be many reasons for store atmospherics (i.e., color)
not being a significant predictor of purchase intention. One of the reasons could be gender, as
there is a difference between male and female shopping behaviors. For example, some
researchers mentioned that men are goal oriented and focus only on merchandise during
shopping while women focus on store atmospherics (Grewal et al., 2003; Otnes & McGrath,
2001). In earlier mentioned studies, store atmospherics played a significant role in the purchase
decisions of women. In the present study, the sample consisted of 45% of males. This high
number of men might have impacted the results because male participants might have ignored
SL atmospherics of SL stores. Another reason could be the participants of this study might not
have owned upgraded computer devices with high speed processors, graphic cards, and large

69
amounts of memory or software. All of this decreases the visual appeal and quality of graphics
(i.e., colors), and thus, the respondents might have ignored store atmospherics. As Shergill and
Chen (2005) noticed, not all online stores completely simulate the atmospherics of a physical
store because of the limitations of the computer devices. Therefore, it is very important to have
an upgraded system for SL to operate and to perform activities (i.e., for an avatar to function
properly) with faster downloading of SL graphics and to visualize true colors of the animated
products in SL. The variable, store atmospherics was an insignificant predictor of purchase
intention because of the presence of stronger predictors like two-way communication and
enjoyment. The participants may have experienced enjoyment and interactivity in SL stores
more than atmospherics and may have ignored atmospherics of the SL store.
Shopping Enjoyment
Shopping enjoyment was found to be the strongest predictor (β = .553) of consumers’
purchase intentions from an SL store. Therefore, hypothesis H3, “shopping enjoyment has
positive effect on consumer purchase intentions from an SL store,” was accepted. As stated
earlier, most of the people view SL as a leisure activity to socialize, shop, and enjoy. That means
the primary purpose of SL residents is to enjoy and thus SL consumers could be categorized as
hedonic consumers (Guiry et al., 2006). Guiry et al. explained that hedonic consumers are more
likely to spend money on shopping irrespective of the shopping channel. Plus, hedonic
consumers shop for fun experiences. SL residents are more than likely to purchase from SL
stores because they experience enjoyment during shopping. Also, virtual environments heighten
the enjoyment experienced by the consumers and prompt them to make purchases (Algharabat &
Dennis, 2009). This signifies that SL’s virtual (3-D) environment itself increases the enjoyment
experience in consumers. Another reason for enjoyment being the strongest predictor could be

70
consumers’ ability to control the content display (360o rotation and zoom) or change colors of
the products. According to Algharabat and Dennis (2009) enabling consumers to control website
improves the enjoyment element. With all these options inbuilt in SL, plus fast and easy
transactions with instant delivery of virtual merchandise, respondents’ enjoyment experiences in
SL stores increases.
Overall, the three variables of interactivity, store atmospherics and shopping enjoyment
were identified as the main features of SL stores. It was assumed that the three features would
affect consumer purchase intentions from SL stores. Statistical analysis revealed that two-way
communication and shopping enjoyment were the two main predictors of purchase intention.
The main reasons are presence of virtual avatar sales representatives at the SL stores. The 3-D
virtual interactive environment of SL facilitates direct communication with avatar sales
representatives (i.e., face-to-face interaction), and the virtual environment provides enjoyment
options. Several previous studies showed evidence that control and store atmospherics were very
important components of online stores affecting consumers’ purchase intentions. But due to the
small sample size, variations in demographics, male to female ratio of respondents, and
technology-related (e.g., inadequate computer capacity) issues, these variables were insignificant
predictors of purchase intentions in this study. Implications, future research, and limitations of
SL as a retail channel are provided in the next two chapters.

71
CHAPTER 6
IMPLICATIONS
In summary, this study was used successfully to determine three key features of Second
Life (SL) stores and examine the relationship between purchase intention and the SL store
features. This study is unique in the sense that SL store features have never been explored
before. There are several studies in the education and medical fields involving exploration of the
use of SL (Boulos, Hetherington, & Wheeler, 2007; Levingstone & Kemp, 2006; Lucia,
Francese, Passero, & Tortora, 2009). But the use of SL in retailing is relatively unexplored. The
findings of this study lead to implications for both the academic and retail fields. The results of
the current study provide deeper insight into the relationship between SL store features and
consumers’ purchase intentions. In other words, utilization of SL as an additional sales channel
requires knowledge of SL features that could bring consumers to the store.
Academic Implications
This study is the starting point of research in SL retailing area. Several published
research articles were introductory articles on SL, and some of them analyzed why SL should be
utilized as a retailing channel. But none of the authors explored consumer purchase intention via
SL store or actually focused on SL store. Possibly, the most noteworthy finding of this study was
the three SL store features that directly impact consumers’ purchase intentions. The three
important SL store features (or variables) were extracted in this study, thereby reducing the
number of variables required to predict purchase intention from an SL store. This reduction in
the number of features curtailed the number of questions in the survey, and as a result the
administration time of the questionnaire was reduced (Mitra & Bosnjak, 2009). However due to
lack of time and money, this study could not be focused on other variables that may influence

72
purchase intentions, for example, technology acceptance factors or the perceived ease of use and
perceived usefulness. Both of these factors indicate a user’s ability to utilize the technology and
their perceptions of the usefulness of the technology to perform the online task. Online shopping
is considered the process of technology acceptance (Klopping & McKinney, 2004). Technology
acceptance factors could affect consumer shopping behavior in SL and need to be explored in
future studies.
Furthermore, the 10-item scale developed for SL interactivity needs to be studied in more
detail. The original scale by Liu (2003) comprised of 15 items with three underlying factors:
two-way communication, active control, and synchronicity. The factor synchronicity
corresponds to the speed of the interaction. This variable is very important as the speed of
interaction in SL would be expected to affect a consumer’s interest in shopping at SL stores. In
the current study, the factor of synchronicity was not measured due to time and money
constraints. Additionally, it was difficult to adapt the scale items to examine synchronicity with
SL due to the wording of the items. Therefore, further development of the “interactivity” scale
with detailed analysis of all the constructs of interactivity is suggested in order to explore this
important variable on SL.
The variable of store atmospherics was not a significant predictor of purchase intention
from SL stores. This variable needs to be examined in detail, not only because it is an important
feature of a store but it also affects consumers’ buying behavior. Past researchers had found that
atmospherics affect purchase intention (Chang, 2000; Kotler 1973-1974). However, in the
current study, no relationship between atmospherics and purchase intention could be established.
Only one atmospherics component, color, was studied among various store atmospherics
components like 3-D atmosphere, merchandise images, font size, and the décor of the store.

73
Inclusion of above mentioned atmospherics could have increased the predictive power of the
variable. Also, time (and length of survey) and money constraints were major problems for this
study and led to the other atmospheric components not being studied.
Overall, an SL’s store atmosphere would require study in more detail. This study has
opened new doors for SL research and provided opportunities to academicians to extend
environmental psychology theories into the SL shopping context, similar to online retailing
research. Future researchers can examine the applicability of store atmospherics in the SL
context through theoretical and empirical research.
Finally, shopping enjoyment requires detailed research. Researchers can specifically
look into the areas where consumers experience the most enjoyment. For example, which of the
following activities are most enjoyed by consumers: product presentation in SL store, browsing,
presence of sales avatars, interaction with other avatars during shopping, or product trial? This
research could help researchers to focus on particular areas in SL that enhance enjoyment during
shopping activities. Therefore, there is a need to develop the enjoyment scale in the context of
SL, since SL has more features than an online store and thus an enjoyment scale for an online
store would likely be somewhat unsuitable for SL.
The results of correlations (Table 9) implicated significant relationships between active
control and store atmospherics with the dependent variable of purchase intention. However, the
regression model (Table 10) did not explain any variance due to these variables individually.
The results were indicative of the presence of suppressor effects in this regression model. It was
noteworthy that the independent variables of two-way communication, store atmosphere, and
shopping enjoyment showed a significant positive relationship with each other. Hence, it could
be implied that a subsuming effect happened for these variables in predicting purchase intention.

74
In other words, active control and store atmospherics had very low correlations with the
dependent variable but showed larger correlations with the other two independent variables.
This implies that in order to enjoy shopping in an SL store certain amount of control was
necessary on the actions performed. Similarly, SL store’s atmospherics enhanced shopping
enjoyment. The results indicated active control and store atmospherics to be the necessary
features that enhance two-way communication and shopping enjoyment and play indirectly into
predicting purchase intentions.
Future studies on SL can explore the effect of interactivity, i.e., two-way communication
and active control on shopping enjoyment. Shopping enjoyment should be considered an attitude
feature, while interactivity should be treated as a mediator in predicting consumer purchase
intention. As the results of the correlations revealed a significant relationship between the two
factors of interactivity with purchase intentions, there is potential for another research framework
to be examined; in this framework, interactivity could be hypothesized to act as a mediator in the
relationship of shopping enjoyment and consumer purchase intentions. This type of model would
help in understanding the impact of interactivity on shopping enjoyment.
Implications for Retailers
The findings from this study can provide guidelines to retailers to strengthen their
offerings in an SL environment. To utilize SL for retailing, it is of paramount importance to
understand the nature of retail environment in SL. Although SL is very similar to the real world,
it is a virtual world and requires several technological aids, such as computer and Internet, for
users to perform different activities. Therefore, to make it look and feel more realistic, retailers
need to invest more in technology so that the animated versions of their virtual products appear
realistic to users.

75
For retailers, it is very tedious to reproduce some of the real-life products in SL. For
example, according to Toyota Motors, building a virtual car in SL for promotional purposes is a
very time consuming process and requires a very skilled computer graphic designer (Robbins &
Bell, 2008). For apparel retailers, the quality of the apparel’s texture is very crucial to making it
look more realistic. However, these efforts would help retailers sell real products via SL stores
because consumers can have 3-D views of products.
SL is a promising communication tool for interactive marketing. This is the first study to
explore the SL store features and their impact on purchase intention. The findings of this study
provide retailers an insight on consumers’ perception and behavior in SL. The interactive nature
of SL induces a favorable attitude toward a product and increases a consumer’s intent to
purchase. Lee, Lee, and Schumann (2002) found that information received through audio-visual
sources was more effective than from text-visual sources. According to Lee et al., when
consumers receive information about innovative products through a 3-D virtual medium (which
has the facility of voice chat), the 3-D medium is more effective than other online
communication types. In a similar study by Jin (2009), virtual environments such as SL were
found to be more effective for communicating product information to consumers. Also, the use
of 3-D avatars in SL stores makes the medium more interactive and increases consumers’
purchase intentions through that medium. Retailers can take advantage of the interactive SL
medium, the availability of 3-D avatars to communicate with consumers, and the unlimited
opportunities to manipulate store atmospherics as per their target market which would definitely
increase consumers’ shopping enjoyment in the virtual world.
This study provides several marketing implications for retailers with regard to how they
should focus on store features to peak their target consumers’ interest. For example, if the

76
retailer sells funky/casual apparel, it would be very important to focus on the enjoyment aspect
of the clothing in the SL store. Consumers purchasing funky apparel are more casual and would
prefer to have fun in SL while shopping. Also, consumers’ involvement in the product or brand
can be increased by utilizing instant messaging, the voice chat function, or interactive spokes-
avatars. Jin (2009) explained that product involvement in SL can be increased by having the
avatar greet the consumer, introduce products, suggest alternate options, resolve consumers’
queries, or obtain consumers’ feedback about products.
Lastly, SL can be a powerful marketing tool for several different retailers. Since the
retailer in SL can gain the advantage of PR (public relations) for the company. This type of
effective web presence for retailers’ products can be created by establishing a small community
of people with similar interests where they can provide their views on the product. In addition,
the amount of investment could be exceptionally low depending on the product type. Although
SL is not a massive revenue generating stream (Robbins & Bell, 2008) for major companies, SL
has worked well as a promotional tool. Robbin and Bell (2008) suggested the following business
strategies may be most effective within SL:
1. Marketing. SL provides an excellent platform to market real world products. Toyota used
SL for marketing its real life cars. For instance, to promote its Scion line of cars Toyota
first introduced a virtual model of Scion in SL, had a huge event to announce its launch,
and gave away a bunch of virtual cars anticipating that the SL residents would like it and
take the test-drive in real world and end up buying a real life car.
2. Information. Some of the large companies use SL to introduce their new products in SL
prior to releasing them in real life. This exact strategy was used by American Apparel

77
before launching a denim line in real life. The product was first introduced in SL and made
available to the SL residents to purchase and note how they actually liked the clothing.

78
CHAPTER 7
LIMITATIONS AND FUTURE RESEARCH
Although this study provided valuable insights into Second Life (SL) store features and
consumers’ purchase intentions, there are several limitations of the study. First, the current study
did not include the technological shortcomings, such as synchronicity, of using SL on a home
computer. For example, consumers who use outdated, slow computers or who have bandwidth
restrictions or network congestion may not obtain enjoyable and good shopping experiences in
SL. Fast Internet is the primary need for SL to operate smoothly for users. At the same time,
graphical downloading of store, merchandise, avatar, and communication with the avatar could
be very slow which could possibly result in a significant decrease in shopping enjoyment and
purchase intention (Jin, 2009).
Second, the data were collected from anybody who had been an SL resident past six
months and had visited an SL store at least once. Due to lack of time and money, data collection
was restricted to individuals who had visited an SL store but not necessarily purchased
merchandise from the SL store. That is, some participants had not actually bought merchandise
via SL and thus they might not have been familiarized with SL’s shopping environment.
Therefore, the current study measured future purchase behavior of the consumers but not the
actual purchase behavior. Hence, replication of this study with a larger sample (including actual
shoppers in SL) to examine actual purchase behavior will help to generalize the results.
According to Driver and Jackson (2008), principal analysts at Forester research firm, SL
is still in its experimentation stage, especially for retailers and consumers. Therefore, there is a
need for research in several different areas relating to SL to explore its marketing potential. This

79
would provide a concrete platform for the retailers to establish themselves in SL and could
motivate consumers to switch from shopping in online retail stores to shopping in SL stores.
Agharabat and Dennis (2009) explained that in a highly competitive environment, online
retailers need to find ways of attracting and retaining customers. Agharabat and Dennis
emphasized that along with the interactive nature of the shopping channel, it is very important to
have a proper design of an online store atmosphere (e.g., color or animation) that enhances
online shopping enjoyment experiences and contributes to positive outcomes. For instance,
pleasant store atmospherics can brings online shoppers to visit the online retailer (Manganari et
al., 2009), build a positive attitude towards the online retailer (Childers et al., 2001; Coyle &
Thorson 2001; Fiore et al., 2005a), and boost shoppers’ behavioral intentions. In conclusion, an
SL store with 3-D atmospherics offers important stimuli to help retailers to find success.

80
APPENDIX A
RECRUITMENT EMAIL
81
July 2010
Hello, Dr. Sanjukta Pookulangara (Assistant Professor) and I, Avantika Thombre
(Student, Merchandising) in the School of Merchandising and Hospitality Management and are
conducting a study to investigate the influence of interactivity and store atmospherics of 3-D
retail stores in Second Life on consumer purchase intentions .This research will help researchers
and retailers to better understand the influence of Second Life retail stores on your purchase
behavior. Since your views are important, we are requesting that you participate in the study for
which you will be provided with compensation of L$500 (equivalent to $2).
Please understand that your participation is voluntary, your refusal to participate will
involve no penalty or loss of benefits to which you are otherwise entitled, and you may
discontinue your participation at any time without penalty or loss of benefits. Also, you do not
have to answer any questions that may be asked. You can opt out of the survey at any time by
clicking on the close (X) icon on the screen. By participating in the survey you have granted
your consent. If you decide to participate in this study, please answer all of the survey questions.
This survey will take approximately 10 minutes of your time.
I would like to thank you for taking the time to fill out the survey. If you have any
questions concerning this project, please do not hesitate to contact me at (940) 565-2439. This
research project has been reviewed and approved by the UNT Institutional Review Board (940-
565-3940). Contact the UNT IRB with any questions regarding your rights as a research subject.
You may print this notice for your records.
Sanjukta Pookulangara Avantika Thombre Assistant Professor – Merchandising Student-MS, Merchandising University of North Texas, Denton, TX University of North Texas, Denton, TX

82
APPENDIX B
SURVEY

83
Survey1- Armidi Store UNIVERSITY OF NORTH TEXAS
SCHOOL OF MERCHANDISINING AND HOSPITALITY MANAGEMENT
The Influence of Interactivity and Online Store Atmospherics of 3-D Retail Stores in Second Life on Consumer Purchase Intentions.
INFORMED CONSENT STATEMENT Dear Participant:
The School of Merchandising and Hospitality Management at the University of North Texas is conducting a survey on to Investigate the relationship between the interactivity and online store atmospherics and consumer purchase intentions. This research will help researchers and retailers to better understand the influence of 3-D retail stores in Second Life on your purchase behavior. Since your views are important, we are requesting you to participate in the study for which you will be provided with compensation of L$500 (equivalent to $2).
Please understand that your participation is voluntary and all the responses will be kept confidential and no foreseeable risks are associated with participation in this study. Your refusal to participate will involve no penalty or loss of benefits to which you are otherwise entitled, and you may discontinue your participation at any time without any penalty or loss of benefits. Also, you do not have to answer any questions that may be asked. By participating in the survey you have granted your consent. Please answer all of the survey questions. This survey will take approximately 10-15 minutes of your time.
We would like to thank you for taking the time to fill out the survey. If you have any questions concerning this project, please do not hesitate to contact either of us at (940) 565-2439. This research project has been reviewed and approved by the UNT Institutional Review Board (940-565-3940). Contact the UNT IRB with any questions regarding your rights as research subject. You may print this notice for your records. Sincerely, Sanjukta Pookulangara Avantika Thombre Assistant Professor – Merchandising Student-MS, Merchandising University of North Texas, Denton, TX, USA University of North Texas, Denton, TX, USA
How many times do you log into Second Life in a week to shop?
1-3 times 4-6 times 7-9 times 10-12 times more than 12 times Other
How much time do you spend on shopping or browsing in Second Life stores each time you visit? Less than 1 hour 1-2 hours 3-5 hours 6-10 hours 11-15 hours 16+ hours
How long have you been shopping at Second Life stores? Less than 1 year 1-2 years 3-4 years 5-6 years More than 6 years Other
How much money did you spend on shopping in the past 6 months with reference to your expenditure in the category of clothing/shoe/accessories Second Life $ Catalog $ Online/ store website $ Brick and Mortar/Physical Store $ Please name up-to five real life clothing/shoe/accessories brands which you have seen or purchased in Second Life 1. 2. 3. 4. 5.

84
Please visit Armidi store in Second Life and rate your level of agreement with the following statements
Scale of Agreement
Strongly Disagree
Disagree Somewhat Disagree
Somewhat Agree
Agree Strongly Agree
While I was shopping/browsing in this Second Life store, I felt that I had a lot of control over my shopping experiences
1 2 3 4 5 6
While I was shopping/browsing in this Second Life store, I could choose freely what I wanted to see
1 2 3 4 5 6
While shopping/browsing in this Second Life store, I had absolutely no control over what I could do in the store
1 2 3 4 5 6
While shopping/browsing in this Second Life store, my actions decided the kind of experiences I got
1 2 3 4 5 6
Please rate your level of agreement with the following statements in reference to your visit to Armidi store in Second Life
Scale of Agreement
Strongly Disagree
Disagree Somewhat Disagree
Somewhat Agree
Agree Strongly Agree
This Second Life store is effective in gathering customer's feedback 1 2 3 4 5 6
This Second Life store does not encourage customer's feedback
1 2 3 4 5 6
This Second Life store facilitates two-way communication between the customers and avatar sales representatives
1 2 3 4 5 6
This Second Life store processed my requests very quickly 1 2 3 4 5 6
This Second Life store provides information very quickly 1 2 3 4 5 6
This Second Life store was very slow in responding to my requests 1 2 3 4 5 6
Please rate your level of agreement with the following statements in reference to your visit to Armidi store in Second Life
Scale of Agreement
Strongly Disagree Disagree Somewhat
Disagree Somewhat
Agree Agree Strongly Agree
This Second Life store emphasizes newly displayed merchandise with distinctive colors
1 2 3 4 5 6
The colors in this Second Life store are visually appealing 1 2 3 4 5 6

85
Color coding is used effectively in this Second Life store to highlight important content, and to identify different sections of the store
1 2 3 4 5 6
Please rate your level of agreement with the following statements in reference to your visit to Armidi store
Scale of Agreement
Strongly Disagree
Disagree Somewhat Disagree
Somewhat Agree
Agree Strongly Agree
I find my shopping experience with this Second Life store entertaining 1 2 3 4 5 6
I find my shopping experience with this Second Life store enjoyable 1 2 3 4 5 6
I find my experience with this Second Life store exciting 1 2 3 4 5 6
I find my shopping experience with this Second Life store fun 1 2 3 4 5 6
Please rate your level of agreement with the following statements in reference to your visit to Armidi in Second Life
Scale of Agreement
Strongly Disagree Disagree Somewhat
Disagree Somewhat
Agree Agree Strongly Agree
I intend to buy clothing/shoe/accessories from this Second Life store within the next 3 months
1 2 3 4 5 6
I will buy clothing/shoe/accessories the next time I need from this Second Life store
1 2 3 4 5 6
I will continue to use Second Life stores for shopping in the future 1 2 3 4 5 6
I will use the Second Life store rather than websites/online stores or stores for purchasing clothing/shoe/accessories
1 2 3 4 5 6
I am: Male Female My age is 18-20 years old
21 to 23 years old
24 to 26 years old
27 to 29 years old
30 to 32 years old
33 to 35 years old
More than 35 years old
My ethnic origin is from:
African-American Asian- American
Caucasian American Hispanic American Native American Bi/Multi-racial American
Other
The level of education that I have completed is:
High School
Associate Degree
Bachelor's Degree
Master’s Degree Doctoral Degree Professional Degree Other
My gross annual household income range is
Less than $40,000
$40,000-$59,999 $60,000-$79,999
$80,000-$99,999
$100,000-$119,999
$120,000-$139,999
$140,000-$159,999
$160,000-$179,999
$180,000-$199,999
More than $200,000
Any additional comments about the retail stores in Second Life and your experiences related to it. THANK YOU FOR YOUR TIME AND PATIENCE!

86
Survey 2-GAdore Store UNIVERSITY OF NORTH TEXAS
SCHOOL OF MERCHANDISINING AND HOSPITALITY MANAGEMENT
The Influence of Interactivity and Online Store Atmospherics of 3-D Retail Stores in Second Life on Consumer Purchase Intentions.
INFORMED CONSENT STATEMENT Dear Participant:
The School of Merchandising and Hospitality Management at the University of North Texas is conducting a survey on to Investigate the relationship between the interactivity and online store atmospherics and consumer purchase intentions. This research will help researchers and retailers to better understand the influence of 3-D retail stores in Second Life on your purchase behavior. Since your views are important, we are requesting you to participate in the study for which you will be provided with compensation of L$500 (equivalent to $2).
Please understand that your participation is voluntary and all the responses will be kept confidential and no foreseeable risks are associated with participation in this study. Your refusal to participate will involve no penalty or loss of benefits to which you are otherwise entitled, and you may discontinue your participation at any time without any penalty or loss of benefits. Also, you do not have to answer any questions that may be asked. By participating in the survey you have granted your consent. Please answer all of the survey questions. This survey will take approximately 10-15 minutes of your time.
We would like to thank you for taking the time to fill out the survey. If you have any questions concerning this project, please do not hesitate to contact either of us at (940) 565-2439. This research project has been reviewed and approved by the UNT Institutional Review Board (940-565-3940). Contact the UNT IRB with any questions regarding your rights as research subject. You may print this notice for your records. Sincerely, Sanjukta Pookulangara Avantika Thombre Assistant Professor – Merchandising Student-MS, Merchandising University of North Texas, Denton, TX, USA University of North Texas, Denton, TX, USA How many times do you log into Second Life in a week to shop?
1-3 times 4-6 times 7-9 times 10-12 times more than 12 times Other
How much time do you spend on shopping or browsing in Second Life stores each time you visit? Less than 1 hour 1-2 hours 3-5 hours 6-10 hours 11-15 hours 16+ hours
How long have you been shopping at Second Life stores? Less than 1 year 1-2 years 3-4 years 5-6 years More than 6 years Other
How much money did you spend on shopping in the past 6 months with reference to your expenditure in the category of clothing/shoe/accessories
Second Life $ Catalog $ Online/ store website $ Brick and Mortar/Physical Store $ Please name up-to five real life clothing/shoe/accessories brands which you have seen or purchased in Second Life
1. 2. 3. 4. 5.

87
Please visit Gadore store in Second Life and rate your level of agreement with the following statements
Scale of Agreement
Strongly Disagree
Disagree Somewhat Disagree
Somewhat Agree
Agree Strongly Agree
While I was shopping/browsing in this Second Life store, I felt that I had a lot of control over my shopping experiences
1 2 3 4 5 6
While I was shopping/browsing in this Second Life store, I could choose freely what I wanted to see
1 2 3 4 5 6
While shopping/browsing in this Second Life store, I had absolutely no control over what I could do in the store
1 2 3 4 5 6
While shopping/browsing in this Second Life store, my actions decided the kind of experiences I got
1 2 3 4 5 6
Please rate your level of agreement with the following statements in reference to your visit to Gadore store in Second Life
Scale of Agreement
Strongly Disagree
Disagree Somewhat Disagree
Somewhat Agree
Agree Strongly Agree
This Second Life store is effective in gathering customer's feedback 1 2 3 4 5 6
This Second Life store does not encourage customer's feedback
1 2 3 4 5 6
This Second Life store facilitates two-way communication between the customers and avatar sales representatives
1 2 3 4 5 6
This Second Life store processed my requests very quickly 1 2 3 4 5 6
This Second Life store provides information very quickly 1 2 3 4 5 6
This Second Life store was very slow in responding to my requests 1 2 3 4 5 6
Please rate your level of agreement with the following statements in reference to your visit to Gadore store in Second Life
Scale of Agreement
Strongly Disagree Disagree Somewhat
Disagree Somewhat
Agree Agree Strongly Agree
This Second Life store emphasizes newly displayed merchandise with distinctive colors
1 2 3 4 5 6
The colors in this Second Life store are visually appealing 1 2 3 4 5 6

88
Color coding is used effectively in this Second Life store to highlight important content, and to identify different sections of the store
1 2 3 4 5 6
Please rate your level of agreement with the following statements in reference to your visit to Gadore store
Scale of Agreement
Strongly Disagree
Disagree Somewhat Disagree
Somewhat Agree
Agree Strongly Agree
I find my shopping experience with this Second Life store entertaining 1 2 3 4 5 6
I find my shopping experience with this Second Life store enjoyable 1 2 3 4 5 6
I find my experience with this Second Life store exciting 1 2 3 4 5 6
I find my shopping experience with this Second Life store fun 1 2 3 4 5 6
Please rate your level of agreement with the following statements in reference to your visit to Gadore in Second Life
Scale of Agreement
Strongly Disagree Disagree Somewhat
Disagree Somewhat
Agree Agree Strongly Agree
I intend to buy clothing/shoe/accessories from this Second Life store within the next 3 months
1 2 3 4 5 6
I will buy clothing/shoe/accessories the next time I need from this Second Life store
1 2 3 4 5 6
I will continue to use Second Life stores for shopping in the future 1 2 3 4 5 6
I will use the Second Life store rather than websites/online stores or stores for purchasing clothing/shoe/accessories
1 2 3 4 5 6
I am: Male Female My age is
18-20 years old
21 to 23 years old
24 to 26 years old
27 to 29 years old
30 to 32 years old
33 to 35 years old
More than 35 years old
My ethnic origin is from:
African-American Asian- American
Caucasian America Hispanic American Native American Bi/Multi-racial American
Other
The level of education that I have completed is:
High School
Associate Degree
Bachelor's Degree
Master’s Degree Doctoral Degree Professional Degree Other
My gross annual household income range is
Less than $40,000
$40,000-$59,999 $60,000-$79,999
$80,000-$99,999
$100,000-$119,999
$120,000-$139,999
$140,000-$159,999
$160,000-$179,999
$180,000-$199,999
More than $200,000
Any additional comments about the retail stores in Second Life and your experiences related to it. THANK YOU FOR YOUR TIME AND PATIENCE!

89
APPENDIX C
SRF AGREEMENT FORM

90

91

92

93
APPENDIX D
IRB APPROVAL LETTER

94

95
REFERENCES
7 things you should know about: Second Life. (2008, June). Educause Learning Initiative. Retrieved online January 22, 2010 from www.educause.edu/eli
Agrawal, R. & Karahanna, E. (2000). Time flies when you’re having fun: Cognitive absorption and beliefs about information technology usage. MIS Quarterly, 24(4), 665-694.
Algharabat, R. & Dennis, C. (2009). Modelling 3d product visualisation for online retail atmospherics. Brunel University, West London. Retrieved June 27, 2010 online from http://dspace.brunel.ac.uk/handle/2438/3766
Almoroso, D. & Hunsinger, D. (2009). Understanding consumers’ acceptance of online purchasing. Journal of Information Technology Management, 20(1), 15-41.
Aoyama, Y. (2001). Structural foundations for e-commerce adoption: A comparative organization of retail trade between Japan and the United States. Urban Geography, 22(2), 130-153.
Arnold, M.J. & Reynolds, K.E. (2003). Hedonic shopping motivations. Journal of Retailing, 79, 77-95
Babin, B.J., Darden, W.R., & Griffin, M. (1994). Atmospheric affect as a tool for creating value and gaining share of value. Journal of Consumer Research, 49(2), 91-99.
Babin, , B.J., Hardesty, D. M., & Suter, T.A. (2003). Color and shopping intentions: The intervening effect of price fairness and perceived effect. Journal of Business Research, 56(7), 541-551.
Ballantine, P. W. (2005). Effects of interactivity and product information on consumer satisfaction in an online retail setting. International Journal of Retail & Distribution Management, 33 (6), 461-471.
Bennett, S., Maton, K. & Kervin, L. (2008), The ‘digital natives’ debate: A critical review of the evidence. British Journal of Educational Technology, 39(5), 775-786.
Bellizie, J.A. & Hite, R. E. (1992). Environmental color, consumer feelings, and purchase likelihood. Psychology & Marketing, 9(5), 347-363.
Bogdanovich, A., Simoff, S., Sierra, C., & Berger, H. (2005). Implicit training of virtual shopping assistants in 3D electronic institutions. IADIS International Conference e-Commerce.
Book, B. (2004, April). “These bodies are free, so get one now!”: Advertising and branding in social virtual worlds. Virtual Worlds Review. Retrieved online January 28, 2010 from
http://www.virtualworldsreview.com

96
Bort, T. (2009, April 30). Know your customers: Second Life demographics. Virtualworldbusiness.com. Retrieved online 2011, January 3 from http://xdfusion.wordpress.com/2009/04/30/know-your-customers-second-life-demographics/
Boulos, M., Hetherington, L., & Wheeler, S. (2007). Second Life: An overview of the potential of 3-D virtual worlds in medical and health education. Health Information & Libraries Journal, 24(4), 233-245.
Burner, G.C., James, K.E., & Hensel, P.J. (2001). Marketing scales handbook: A compilation of multi-item measures, Volume III. (3rd ed.). Chicago, IL: American Marketing Association.
Carpenter, J.M. & Moore, M. (2009). Utilitarian and hedonic shopping value in the US discount sector. Journal of Retailing and Consumer Services 16, 68-74.
Carrillat, F.A., Riggle, R.J., Genbhart, G.F., & Less, J.M. (2009). Cognitive segmentation modeling the structure and content of customers’ thoughts. Psychology & Marketing, 26(6), 479-506.
Chang, K. (2000). The impact of perceived physical environments on customers’ satisfaction and return intentions. Journal of Professional Services Marketing, 21(2), 75-85.
Chang, M. K., Cheung, W., & Lai, V. S. (2005). Literature derived reference models for the adoption of online shopping. Information & Management, 42, p. 543-559.
Chen, K. & Yen, D.C. (2004). Improving the quality of online presence through interactivity. Information & Management, 42, 217-226.
Chen, L., Gillenson, M.L., & Sherrell, D.L. (2004). Consumer acceptance of virtual stores: A theoretical model and critical success factors for virtual stores. ACM Digital Library, 35(2), 8-31.
Childers, T. L., Carr, C. L., Peck, J., & Carson, S. (2001). Hedonic and utilitarian motivations for online shopping behavior. Journal of Retailing, 77(4), 511-535.
Church, A. (1993). Estimating the effect of incentives on mail survey response rates: A meta-analysis. Public Opinion Quarterly, 57, 62-79.
Cole, J.I., Suman, M., Lunn, B., & Maguire, P. (2000). The UCLA internet report-Surveying the digital future. Retrieved October 25, 2010 from http://www.digitalcenter.org/pdf/internetReportYearOne.pdf
Conroy, P. (2009, July 9). Into the fray: A view from the consumer products sector. Retrieved online on August 4, 2009 from www.deloitte.com
Constantinides, E. (2004). Influencing the online consumer’s behavior: the web experience. Internet Research, 4(2), 11-126.

97
Couper, M.P., Traugott, M.W., & Lamias, M.J. (2001). Web survey design and administration. Public Opinion Quarterly, 65, 230-253.
Coyle, J. R. & Thorson, E. (2001). The effects of progressive levels of interactivity and vividness in web marketing sites. Journal of Advertising, 30(3), 65-77.
Currency exchange. (n.d.). Second Life. Retrieved February 5, 2010 online from http://secondlife.com/whatis/currency.php
Daugherty, T., Li, H., & Biocca, F. (2008). Consumer learning and the effects of virtual experience relative to indirect and direct product experience. Psychology & Marketing, 25(7), 568-586.
Davis, F. D. (1993). User acceptance of information technology: System characteristics,user perceptions and behavioral impacts. International Journal of Man–Machine Studies, 39(3), 475–487.
Davis, F. D., Bagozzi, R. P. & Warshaw, P. R. (1989). User acceptance of computer technology: A comparison of two theoretical models. Management Science, 35(8), 982-1003.
Davis, L. Wang, S., & Lindridge, A. (2008). Culture influences on emotional responses to on-line store atmospherics cues. Journal of Business Research, 61, 806-812.
Dawson, S., Bloch, P.H., & Ridgway, N.M. (1990). Shopping motives, emotional states and retail outcomes. Journal of Retailing, 66(4), 408-427.
Dholakia, R. R. & Zhao, M. (2008). Retail website interactivity: How does it influence customer satisfaction and behavioral intentions? International Journal of Retail & Distribution Management, 37(10), 821-838.
Doherty, N. & Ellis-Chadwick, F. (2000). Retailer adoption of the internet- Implications for retail marketing. European Journal of Marketing, 34(8), 954-974.
Doherty, N., Ellis-Chadwick, F., & Hart, C. (2003). An analysis of the factors affecting the adoption of the internet in the UK retail sector. Journal of Business Research, 56(11), 887-897.
Driver, E. (2008). Professional see their future in Second Life. ThinkBalm. [Online]. Retrieved September 10, 2010 from http://www.metanomics.net/show/archive100608/
Driver, E. & Jackson, P. (2008, January 7). Getting real work done in virtual worlds. Forrester Research. Retrieved October 24, 2010 online from http://www.forrester.com/rb/Research/getting_real_work_done_in_virtual_worlds/q/id/43450/t/2
Duparcq, P., Hanna, R. C., & Berger, P.D. (2009). Reaching Customers Anytime, Anywhere, Any Platform. (1st ed.). Lombard, Il: Marsh Publication.

98
Eastlick, M.A. & Feinberg, R.A. (1999). Shopping motives for mail catalog shopping. Journal of Business Research, 45, 281-290.
Eroglu, S.A., Machleit, K.A., & Davis, L.M. (2001). Atmospheric qualities of online retailing: A conceptual model and implications. Journal of Business Research, 54, 177-184.
Eroglu, S. A., Mechleit, K. A., & Davis, L. M. (2003). Empirical testing of a model of online store atmospherics and shopper responses. Psychology & Marketing, 20(2), 139-150
Field, A. (2005). Discovering Statistics Using SPSS. (2nd ed.). London: SAGE Publications Ltd.
Fiore, A. M., Jin, H-J., & Kim, J. (2005a). For fun and profit: Hedonic value from image interactivity and responses toward an online store. Journal of Psychology & Marketing, 22(8), 669-694.
Fiore, A., Kim, J., & Lee, H-H. (2005b). Effects of image interactivity technology on consumer responses toward the online retailing. Journal of Interactivity Marketing, 19(3), 39-53.
Fiore, A.M, Yah, X., & Yoh, E. (2000). Effects of a product display and environmental fragrancing on approach responses and pleasurable experience. Psychology & Marketing, 17(1), 27-54.
Francis, C. (2009, November 10). How etailers can take on the whole worlds. Ecommerce Times. [online]. Retrieved October 25, 2010 from http://www.ecommercetimes.com/story/68603.html?wlc=1288038674
Fortin, D. R. & Dholakia, R.R. (2005). Interactivity and vividness effects on social presence and involvement with a web based advertisement. Journal of Business Research, 58, 387-396.
Goldsmith, R.E. & Flynn, L.R. (2004). Psychological and behavioral driver of online clothing purchase. Journal of Fashion Marketing & Management, 8(1), 84-95.
Goozee, R. (2010, October 24). You only live twice. Business Management. Retrieved October 24, 2010 online from http://www.busmanagement.com/article/You-Only-Live-Twice/
Grassian, E., Trueman, R.B., & Clemson, P. (2006). Stumbling, bumbling, teleporting and flying…librarian avatars in Second Life: Selected bibliography. Reference Services Review, 35(1), 90-97.
Grewal, D., Bker, J., Levy, M., & Voss, G.B. (2003). The effects of wait expectations and store atmosphere evaluations on patronage intentions in service-intensive retail stores. Journal of Retailing, 79, 259-268.
Guadagnoli, E. & Velicer, W (1988). Relation of sample size to the stability of component patterns. Psychological Bulletin, 103(2), 265-275.
Guiniven, J. (2006). Avatars are people too: PR in the virtual world. Public Relations Tactics, 13(10), 6.

99
Guiry, M., Mägi, A.W., & Lutz, R. (2006). Defining and measuring recreational shopper identity. Journal of the Academy of Marketing Science, 34(1), 74-83.
Ha, S. & Stoel, L. (2009). Consumer e-shopping acceptance: Antecedents in a technology acceptance model. Journal of Business Research, 62(5), 565-571.
Ha, Y., Kwon, W-S., & Lenon, S.J. (2007). Online visual merchandising (VMD) of apparel websites. Journal of Fashion Marketing and Management, 11(4), 1361-2026.
Hausman, A. V. & Siekpe, J.S. (2009). The effect of web interface features on consumer online purchase intentions. Journal of Business Research, 62, 5-13.
Häubl, G. & Figueroa, P. (2002). Interactive 3D presentations and buyer behavior. CHI 2002. [Short Talk: User Studies – Lessons for HCI]. Minneapolis, Minnesota.
Häubl, G & Trifts, V. (2000). Consumer decision making in online shopping environments: The effects of interactive decision aids. Marketing Science, 19(1), 4-21.
Heeter, C. (1992). Being there: The subjective experience of presence. Presence: Teleoperators and Virtual Environments, 1, 262-271.
Hemp, P. (2006, June). Avatar-based marketing. Harvard Business Review, 84(6). Retrieved online November 11, 2009 from http://ww3.harvardbusiness.org/corporate/assets/content/AvatarBased.pdf
Hoffman, D.L. & Novak, T.P. (1996). Marketing in hypermedia computer-mediated environments: Conceptual foundations. Journal of Marketing, 60(July), 50-68.
Hoffman, D.L. & Novak, T.P. (1998). Bridging the racial divide on the Internet. SCIENCE, 280(April 17), 380-391.
Holzwarth, M., Janiszewski, C., & Neumann, M.M. (2006). The influence of avatars on online consumer shopping behavior. Journal of Marketing , 70, 19-36.
Hrastnik, R. (2007, January 27). Second Life; How can marketers take advantage? Marketingstudies.net. Retrieved online January 28, 2009 from http://rssdiary.marketingstudies.net/content/second_life_2_how_can_marketers_take_advantage.php
Hsiao, M-H. (2009). Shopping mode choice: Physical store shopping versus e-shopping. Transportation Research Part E, 45, 86-95.
Hsu, C. & Lin, J. C. (2008). Acceptance of blog usage: The roles of technology acceptance, social influence and knowledge sharing motivation. Information & Management,45(1), 65-74.
Hunt, S. D., Sparkman, R.D., & Wilcox, J.B. (1982). The pretest in survey research: Issues and preliminary findings. Journal of Marketing Research, 19(2), 269-273.

100
Internet World Stats. (2010). Retrieved November 24, 2009 from http://www.internetworldstats.com/stats.htm
Jiang, Z. & Benbasat, I. (2007). Investigating the influence of the functional mechanisms of online product presentations. Information System Research, 18(4), 545-470.
Jin, S-A. (2009). The roles of modality richness and involvement in shopping behavior in 3D virtual stores. Journal of Interactive Marketing, 23, 234-246.
Jin, S-A. & Bolebruch, J. (2009). Avatar-based advertising in Second Life: The role of presence and attractiveness of virtual spokespersons. Journal of Interactive Advertising, 10(1). Retrieved on August 5, 2010 from http://jiad.org/article124
Justin, R. (2001, February 19). Avatars: The vehicle to virtual reality on the Web. HighBeam Research. Retrieved online from http://www.encyclopedia.com/doc/1P3-69113084.html
Kelly, T.S. & Rhind, A. (2007). Marketing in Second Life and other virtual worlds. Media Contacts: MCInsight. Retrieved on June 6, 2010 from http://www.mediacontacts.com/wp-content/uploads/2007/10/mc_insight_outubro.pdf
Kempf, D. S. (1999). Attitude formation from product trial: Distinct roles of cognition and affect for hedonic and functional products. Psychology and Marketing, 16 (1), 35-30.
Kim, J., Fiore, A.M., & Lee, H-H. (2007). Influences of online store perception, shopping enjoyment, and shopping involvement on consumer patronage behavior towards an online retailer. Journal of Retailing and Consumer Services, 14, 95-107.
Kim, J. & Forsythe, S. (2008). Adoption of virtual try-on technology for online apparel shopping. Journal of Interactive Marketing, 22(2), 45-59.
Kim, E-Y. & Kim, Y-K. (2004). Predicting online purchase intentions for clothing products. European Journal of Marketing, 38(7), 883-897.
Kim, H-Y. & Kim, Y-K. (2008). Shopping enjoyment and store shopping modes: The moderating influence of chronic time pressure. Journal of Retailing and Consumer Services, 15, 410-419.
Kim, S. & Stoel, L. (2004). Apparel retailers: website quality dimensions and satisfaction. Journal of Retailing and Consumer Services, 11, 109-117.
Klopping, I. & McKinney, E. (2004). Extending the technology acceptance model and the task-technology fit model to consumer e-commerce. Information Technology, Learning, and Performance Journal, 22(1), 35-48.
Koo, D-M & Ju, S-H. (2010). The interactional effects of atmospherics and perceptual curiosity on emotions and online shopping intentions. Computers in Human Behavior, 26, 377-388.

101
Kotler. P. (1973-1974). Atmospherics as a marketing tool. Journal of Retailing, 49(4), 48-64.
Koufaris, M. (2002). Applying the model technology acceptance model and flow theory to online consumer behavior. Information Systems Research, 13(2), 205-223.
Lee, E-J., Lee, J. & Schumann, D.W. (2002). The influence of communication source and mode on consumer adoption of technological innovations. Journal of Consumer Affairs, 36(1), 1-27.
Lee, H-H., Fiore, A.M., & Kim, J. (2006). The role of the technology acceptance model in explaining effects of image interactivity technology on consumer responses. International Journal of Retail Distribution Management, 34(8), 621-644.
Lemon, M. & Kelly, O. (2009). Laying Second Life foundations: Second chance learners get first skills. Proceedings ASCILITE Auckland 2009.
Levingstone, D. & Kemp, J. (2006). Putting a second life “metaverse” skin on learning management systems. Proceedings of the First Life Education Workshop, Part of the 2006 Second Life Community Convention, August18th-20th 2006, Fort Mason, San Francisco, CA.
Li, H., Daughtery, T., & Biocca, F. (2001). Characteristics of virtual experience in electronic commerce: A protocol analysis. Journal of Interactive Marketing, 15(3), 13-30.
Li, H., Daughtery, T., & Biocca, F. (2003). The role of virtual experience in consumer learning. Journal of Consumer Psychology, 13(4), 395-407.
Linden Lab Official: Classifieds FAQ. (2010). Retrieved online 2011 February 1 from http://wiki.secondlife.com/wiki/Classifieds
Liu, Y. (2003). Developing a scale to measure the interactivity of websites. Journal of Advertising Research, 43(2), 207-216.
Liu, Y. & Shrum, L.J. (2002). What is interactivity and is it always such a good thing? Implications of definition, person, and situation for the influence of interactivity on advertising effectiveness. Journal of Advertising, 13(4), 53-64.
Lombard, M. & Ditton, T. (1997). At the heart of it all: The concept of presence. Journal of Computer-Mediated Communication, 3(2).Retrieved June 22, 2010 from http://www.ascusc.org/jcmc/vol3/issue2/lombard.html
Lucia, A., Francese, R., Passero, I., & Tortora, G. (2009). Development and evaluation of a virtual campus on Second Life: The case of SecondDMI. Computers & Education, 52(1), 220-233.
Lynn, M.R. (1986). Determination and qualification of content validity. Nursing Research, 35(6), 382-386.Manganari, E.E., Siomkos, G.J., & Vrechopoulos, A.P. (2009). Store atmosphere in web retailing. European Journal of Marketing, 43(9/10), 1140-1153.

102
Lyons, K. (2008). Towards a theoretically-grounded framework for evaluating immersive business models and applications: Analysis of ventures in Second Life. Journal of Virtual Worlds Research, 1(1), 1-19.
McMillan, S.J. & Hwang, J-S. (2002). Measures of perceived interactivity: An exploration of the role of direction of communication, user control, and time in shaping perceptions of interactivity. Journal of Advertising, 31(3), 29-42.
Menon, S. & Kahn, B. (2002). Cross-category of induced arousal and pleasure on the internet shopping experience. Journal of Retailing, 78, 31-40.
Mitra, G. & Bosnjak, M. (2009). Effects of questionnaire length on participation and indicators of response quality in a web survey. Public Opinion Quarterly, 73(2), 349-360.
Mollen, A. & Wilon, H. (2010). Engagement, telepresence and interactivity in online consumer experience: Reconciling scholastic and managerial perspectives. Journal of Business Research, 63(9-10), 919-925.
Monsuwe, T. P. , Dellaert, B., & Ruyter, K. (2004). What drives consumers to shop online? A literature review. International Journal of Service Industry Management, 15(1), 101-121. Retrieved online from http://www.emeraldinsight.com/Insight/ViewContentServlet?Filename=Published/EmeraldFullTextArticle/Articles/0850150105.html
Moore, G.C. & Benbasat, I. (1991). Development of an instrument to measure the perceptions of adopting an information technology innovation. Information System Research, 2(3), 192-222.
Nass, C. I., Lombard, M., Henriksen, L., & Steur, J. S. (1995). Anthropocentrism and computers. Behaviour and Information Technology, 14 (4), 229–38.
National Mail Order Association. (n.d.). Retrieved October 25, 2010 from http://www.nmoa.org/articles/dmnews/keynote.htm
Novak, T.P., Hoffman, D.L., & Yung, Y-F. (2000). Measuring the customer experience in online environments: A structural modeling approach. Special Issue On Marketing Science and the Internet, 19(1), 22-42.
Novak, T. & Steffey, A.O. (2007, October 7). Consumer behavior research in Second Life: Issues and approaches. UCR: eLab-Sloan Center for Internet Retailing. Retrieved online January 28, 2010 from http://elabresearch.ucr.edu/blog/uploads/papers/ACR%20Talk%20long%20version%20(October%2025,%202007).pdf
Nunnaly, J. (1978). Psychometric Theory. New York: Mc Graw-Hill.
O’Keefe, R. M. & Mceachern, T. (1998). Web-based customer decision support systems. Communications of the ACM, 14(3), 71-78.

103
Ohrstrom, L. (2008, January 10). American Apparel opens virtual lower east side store. The New York Observer. Retrieved June 10, 2010 from http://www.observer.com/2008/american-apparel-opens-new-branch-virtual-lower-east-side
Ondrejka, C. R. (2004). Aviators, moguls, fashionistas and barons: Economics and ownership in Second Life. Retrieved on June 5, 2010 from http://papers.ssrn.com/sol3/papers.cfm?abstract_id=614663
Otawara, E. (2010, July 21). European fashion designer brings her line into Second Life. New World Notes. Retrieved June 2, 2010 online from http://nwn.blogs.com/nwn/2010/07/croatian-sl-designers.html
Otnes, C. & McGrath, M.A. (2001). Perceptions and realities of male shopping behavior. Journal of Retailing, 77(1), 111-137.
Peter, J.P. & Olson, J.C. (2001). Consumer Behavior and Marketing Strategy. (6th ed.). New York, NY: McGraw-Hill /Irwin
Perceptions of the presence of brands in Second Life. (2007, April). CBNews-Repéres. Retrieved online from http://www.reperes-secondlife.com/etude_pdf/CBNEWS-REPERES_Presence_of_brands_in_SL.pdf
Perterson, R. A., Balasubramanian, S., & Bronneberg, B. J (1997). Exploring the implications of the internet for consumer marketing. Journal of the Academy of Marketing Science, 25(4), 329-346.
Project Factory brand video posted on YouTube. (2007, May 31). Retrieved September 2, 2010 from http://secondliferesearch.blogspot.com/
Polischuk, P. (2007, May). Second Life: Options and opportunities for EPA in a virtual world. Woodrow Wilson International Center for Scholars-Foresight and Governance Project. Retrieved online from www.wilsoncenter.org/topics/docs/SecondLifeReview_May07.pdf
Prenksy, M. (2001). Digital natives, digital immigrants. On the Horizon, 9(5), 1-6.
Qiu, L., Jiang, Z., & Benbasat, I. (2006). Real experience in a virtual store: Designing for presence in online shopping. The Tenth Pacific Asia Conference on Information Systems (PACIS 2006), 1150-1158.
Ranger, S. (2006, November). Second Life – Whose HQ can you use? Retail & Leisure. Retrieved November 4, 2009 from http://www.silicon.com/retailandleisure/0,3800011842,39163691-1,00.htm
Robbins, S. & Bell, M. (2008). Second Life for dummies. (1st ed.). Hoboken, NJ: Wiley Publishing, Inc.
Rumsey, D. (2003). Statistics for Dummies. (1st ed.). Indianapolis, Indiana: Wily Publishing Inc.

104
Sage, A. (2010, Mar 8). US web retail sales to reach $249 BLN by’14-study. Reuters. [Online]. Retrieved October 25, 2010 from http://www.reuters.com/article/idUSN0825407420100308
Schlosser, A.E. (2003). Experiencing products in the virtual world: The role of goal and imagery in influencing attitudes versus purchase intentions. Journal of Consumer Research, 30(2), 63-72.
Second Life. (n.d.). Retrieved online January 5, 2009, from http://secondlife.com/shop/learn/
Second Life lessons. (2006, November 27). Business Week. Retrieved online February 5, 2010 from http://secondlife.com/whatis/currency.php
Second Life’s new leader: Rod Humble becomes CEO of Linden Lab. PR Newswire. Retrieved online February 1, 2011 from http://www.prnewswire.com/news-releases/second-lifes-new-leader-rod-humble-becomes-ceo-of-linden-lab-112383469.html
Shang, R-A., Chen, Y-C., & Shen, L. (2005). Extrinsic versus intrinsic motivations for consumers to shop on-line. Information & Management, 42(3), 401-413.
Shelton, A.K. (2010). Defining the lines between virtual and real world purchases: Second Life sells, but who’s buying? Computers in Human Behavior, 26, 1223-1227.
Shergill, G. & Chen, Z. (2005). Web-based shopping: Consumers’ attitudes towards online shopping in New Zealand. Journal of Electronic Commerce Research, 6(2), 79-94.
Shim, S., Eastlick, M., Lotz, S. L. & Warrington, P. (2001). An online prepurchase intentions model: The role of intention to search. Journal of Retailing, 77(4), 397-416.
Social Research Foundation. (2010). www.socialresearchfoundation.org. Retrieved online February 1, 2010.
Solis, B. (2011, March 2). Report: Brands pursue the social consumer. Fast Company. [Website]. Retrieved online on March 2, 2011 from http://www.fastcompany.com/1733548/report-brands-pursue-the-social-consumer
Song, K., Fiore A. M., Park, J. (2007). Telepresence and fantasy in online apparel shopping experience. Journal of Fashion Marketing and Management, 11(4), 553-570.
Sorry, we’re closed. American Apparel. [Website]. Retrieved October 12, 2010 online from http://americanapparel.net/presscenter/secondlife/
Steuer, J. (1992). Defining virtual reality: Dimensions determining telepresence. J Commum, 42(4), 73-93.
Stevens, J.P. (1992). Applied Multivariate Statistics for the Social Sciences. (2nd ed.). Hillsdale, NJ: Erlbaum.

105
Symons, J. (2010. March 8). Forrester Forecast: Double-digit growth for online retail in the US and Western Europe. Forrester Research, Inc. Retrieved September 20, 2010 online from http://www.forrester.com/ER/Press/Release/0,1769,1330,00.html
Tabachnick, B.A. & Fidell, L. (1996). Using Multivariate Statistics. (3rd ed.). New York: Harper Collins.
Tapscott, D. (1999). Educating the net generation. Educational Leadership, 56(5), 6-11.
Tate, A., Chen-Burger, Y-H., Dalton, J., Potter, S., Richardson, D., Stader, J., Wickler, G., Bankier, I., Walton, C. & William, P.G. (2010). I-Room: A virtual space for intelligent interaction. IEEE Intelligent Systems.
Taylor, A., & Varley, R. (2008). Embodiment in 3D virtual retail environments: exploring perceptions of the virtual shopping experience. In: The body: Connections with fashion conference proceedings 2008. IFFTI Conference. Retrieved August 13, 2010 from http://eprints.hud.ac.uk/6002/1/IFFTI__2008.pdf
Tomaseti, E., Ruiz, S., & Reynolds, N. (n.d.). Flow and attitude toward the website on the evaluation of products present by means of virtual reality: A conceptual model. Advances in Consumer Research, 36, 916-918. Retrieved online February 2, 2010 from http://www.acrwebsite.org/volumes/v36/NAACR_v36_28.pdf
Unknown. (2009, October 1). J.D. Power and Associates Reports: Generation Y Early Careerists Grapple with 'Quarter-Life Crisis' as the Foundering Economy Shapes Their Aspirations and Buying Patterns. PR Newswire. [On-line Business Media]. Retrieved online from http://www.prnewswire.com
U.S. Census Bureau News. (2011).Retrieved online from http://www.census.gov/retail/marts/www/marts_current.pdf
Vijayasarathy, L. (2002). Predicting consumer intentions to use on-line shopping: The case for an augmented technology acceptance. Information & Management, 41(6), 747-762.
Virtual Worlds List by Category. (n.d.). Retrieved October 24, 2010 online from http://www.virtualworldsreview.com/info/categories.shtml
Verton, D. (2001). Churn. Computerworld, 35(6), 50.
Wang, Y. J., Hernandez, M.D., & Minor, M. (2010). Web aesthetics effects on perceived online service quality and satisfaction in an e-tail environment: The moderating role of purchase task. Journal of Business Research, 63(9-10), 935-942.
Wauters, R. (2011, February 28). Forrester: Online retail industry in the US will be owrth $279 billion in 2015. Retrieved on April 13, 2011 from http://techcrunch.com/2011/02/28/forrester-online-retail-industry-in-the-us-will-be-worth-279-billion-in-2015/

106
Wen, J.H., Chen, H-G., & Hwang, H-G. (2001). E-commerce web site design: Strategies and models. Information Management & Computer Security, 9(1), 5-12.
Winder, D. (2010, February 22). Sex in Second Life ain’t at all that (says Linden Lab CEO). Daniweb- IT Discussion Community. Retrieved online 2011, February 1 from http://www.daniweb.com/news/story262226.html
Wolfinbarger, M & Gilly, M.C. (2001). Shopping online for freedom, control, and fun. California Management Review, 43(2), 34-55
Wu, C-S., Chen, F-F., & Yen, D. C. (2008). The atmospheric factors of online storefront environment design: An empirical experiment in Taiwan. Information Management, 45, 493-498.
Yi, C. & Jiang, Z. (2007). The antecedents of online consumers’ perceived usefulness of website: A protocol analysis approach. Human-Computer Interaction, 4, 142-149.
Young, M. R., Desarbo, W.S., & Morwitz, V.G. (1998). The stochastic modeling of purchase intentions and behavior. Management Science, 44(2), 188-202.