the influence of earnings management on firm value … · the influence of earnings management on...
TRANSCRIPT

THE INFLUENCE OF EARNINGS MANAGEMENT
ON FIRM VALUE AND GOOD CORPORATE
GOVERNANCE AS MODERATING VARIABLE
(Empirical Studies Real Estate and Properties Companies Listed in
Indonesia Stock Exchange Period 2012-2014)
Created by:
Muhammad Anugrah Asshiddiq
1111082100007
DEPARTEMENT OF ACCOUNTING
INTERNATIONAL CLASS PROGRAM
FACULTY OF ECONOMICS AND BUSINESS
SYARIF HIDAYATULLAH STATE ISLAMIC UNIVERSITY
JAKARTA


SHEET STATEMENT
AUTHENTICITY SCIENTIFIC WORKS
Signature below:
Name : Muhammad Anugrah Asshiddiq
Student ID : 1111082100007
Faculty : Economics and Business
Department : Accounting (International Program)
Hereby declare that in the writing of this thesis, I;
1. Not use other people’s ideas without being able to develop and accountable.
2. Do not do plagiarism of other people’s works manuscript.
3. Do not use other people’s work without mentioning the original source or without
the owner’s permission.
4. Do not manipulate and falsify the data.
5. Own work and able to work responsible for this work.
If in the future there is a demand from the other side of my work, and have been accountably
proved, was indeed found evidence that I have violated the above statement, and then I am ready
to be sanctioned according to rules applicable in the Faculty of Economics and Business Syarif
Hidayatullah State Islamic University Jakarta.
Thus statement truly made with sincerely.
Jakarta, April 2016
(Muhammad Anugrah Asshiddiq)

CURRICULUM VITAE
MUHAMMAD ANUGRAH ASSHIDDIQ
Accounting Departement
Economic and Business Faculty
UIN Syarif Hidayatullah Jakarta
PERSONAL IDENTITY
Name : Muhammad Anugrah Asshiddiq
Gender : Male
Place & Date of Birth : Tangerang, Januari 21th 1994
Religion : Islam
Nationality : Indonesia
Address : Bukit Waringin B7 no. 21, Kedung Waringin, Bojonggede,
Kab. Bogor, Jawa Barat Indonesia
Phone/Mobile : +62877-7245-8513
E-mail Address : [email protected] - [email protected]
FORMAL EDUCATION
College : Accounting Departement, Economic and Business Faculty, UIN
Syarif Hidayatullah Jakarta
Senior High School : SMA-IT Al-Madinah
Junior High School : SMPN I Bojonggede
Elementary School : SDIT Daarul Fataa

v
The Influence of Earnings Management on Firm Value and Corporate
Governance as Moderating Variable
(Empirical Studies in Real Estate and Properties Companies listed in Indonesian
Stock Exchange Period 2012-2014)
ABSTRACT
The objective of this research is to examine the influence of the earnings
management concerning to the firm value and to examine whether the corporate
governance mechanism is the moderating variable between influence of earnings
management toward the firm value. The variable examined in this research is
earnings management measured with discretionary accrual by modified Jones
model, firm value, board of director, managerial ownership and institutional
ownership.
The sample which is used in this research are real estate and properties
companies listed in Indonesian Stock Exchange on period 2012-2014. This
research is using purposive sampling method to determine the sample and it
produce 12 companies as research sample. Regression analysis method used
descriptive statistic and multiple regression.
The result of this research shows earning management, size of company
and board of director, managerial ownership institutional, ownership as
moderating on earnings management simultaneously or together have ability to
effect the firm value. Partially board of director, managerial ownership and
institutional ownership is a moderating. Beside that the result also indicates that
size of company have significant effect positive to firm value. Board of director,
managerial ownership, and institutional ownership have significant effect negative
to firm value. Other variable do not have significant influence to firm value.
Keywords : earnings management, good corporate governance, firm
value, board of director, managerial ownership, institutional
ownership

vi
Pengaruh Manajemen Laba Terhadap Nilai Perusahaan dan Corporate
Governance sebagai Variabel Moderating
(Studi Empiris di Real Estate dan Properti Perusahaan yang terdaftar di Bursa
Efek Indonesia Periode 2012-2014)
ABSTRAK
Tujuan dari penelitian ini adalah untuk menguji pengaruh manajemen
laba menyangkut dengan nilai perusahaan dan untuk menguji apakah mekanisme
corporate governance adalah variabel moderasi antara pengaruh manajemen
laba terhadap nilai perusahaan. Variabel yang diteliti dalam penelitian ini
adalah manajemen laba diukur dengan akrual diskresioner oleh dimodifikasi
model Jones, nilai perusahaan, dewan komisaris, dewan direktur dan komite
audit.
Sampel yang digunakan dalam penelitian ini adalah perusahaan real
estate dan properti yang terdaftar di Bursa Efek Indonesia pada periode 2012-
2014. Penelitian ini menggunakan metode purposive sampling untuk menentukan
sampel dan menghasilkan 41 perusahaan sebagai sampel penelitian. Metode
analisis regresi digunakan statistik deskriptif dan regresi berganda.
Hasil penelitian ini menunjukkan manajemen laba, ukuran perusahaan
dan dewan direktur, kepemilikan manajerial, kepemilikan institusional sebagai
moderator pada manajemen laba secara bersamaan atau bersama-sama memiliki
kemampuan untuk mempengaruhi nilai perusahaan. Secara parsial dewan
direktur, kepemilikan manajerial dan kepemilikan institusional adalah
pemoderasi. Selain itu hasilnya juga menunjukkan bahwa ukuran perusahaan
berpengaruh signifikan positif terhadap nilai perusahaan. Direksi, kepemilikan
manajerial, dan kepemilikan institusional berpengaruh signifikan negatif
terhadap nilai perusahaan. variabel lainnya tidak berpengaruh signifikan
terhadap nilai perusahaan.
Kata kunci: manajemen laba, good corporate governance, nilai perusahaan,
dewan direktur, kepemilikan manajerial, kepemilikan institusional

vii
FOREWORD
Assalammu’alaikum Wr. Wb.
All praise to Allah SWT, the Most Gracious and the Most Merciful, the
Cherisher and Sustainer of the worlds; who always gives the writer all the best of
this life and there is no doubt about it. Shalawat and Salaam to the
Prophet Muhammad SAW and his family. With blessing and mercy from Allah
SWT, the writer can complete this thesis to fulfill one of the requirements in
accomplishing bachelor degree.
The writer is also well-aware that without advice and support from various
parties, this thesis will not be realized properly. Therefore, the writer would like to
take her opportunity to express her deep and sincere gratitude to the following:
1. Beloved parents and sister, my father Andi Nasri Hamzah, my mother Iin
Aryanti and also my sister Aliyah Khairunissa who have given all their
efforts morally and material to my college study. For also being such a
great parents and sister that always give me support and advice to finish
this thesis. Thank you for your love and prayers that never end. All
this efforts is dedicated to you all. May Allah SWT always give His
blessing for you all.

viii
2. Dr. Arief Mufraini, Lc., M.si. as the Dean of Economic and Business
Faculty.
3. Yessi Fitri, SE., Ak., M.Si and Hepi Prayudiawan,SE ,Ak ,MM., as the
Lead and Secretary of Accounting Department.
4. Prof. Dr. Azzam Jasin, MBA as the thesis supervisor I. By his
advice, direction, and guidance I can write this thesis properly. Thank
you so much for your time and kindness to help me in finishing this thesis.
5. Atiqah, SE, MS. Ak as the thesis supervisor II. Also by her advice,
direction, and guidance I can write this thesis properly. Thank you so
much for your time and kindness to help me in finishing this thesis.
6. All the lectures who have taught me many things patiently. Thank you for
all the knowledge that will lead me to a better future. May your charity and
deeds are always recorded by Allah SWT.
7. All the staffs in Economic and Business Faculty. Especially to Mr. Bonyx
who always reminds me to finish my thesis and provide me all the
procedures I need in making this thesis.
8. All my dear friends in Accounting International Program 2011 for every
foolish things, jokes, support and motivation that you have done. My
'Gang Kubur' mates and 'Warkop' mates for every moment we spend
together. And especially to my Oktaviani Dewi Masitho who always have
time for me in your activity. Thank you for your pray, help, support and
everythings that you did.

ix
9. Senior and junior thank you for support an help me in wite this thesis, and
all of you that I cannot mention one by one. Thank you for sharing joy
moments.
The writer realizes that this thesis is still far from perfection due to limited
knowledge of the writer. All the suggestions and constructive criticism are
welcomed in order to make this thesis better. Hope, this thesis will be useful for
any researcher or reader. May Allah SWT always bless every step in our life.
Wassalamu’alaikum Wr. Wb.
Jakarta, April 2016
The Writer
Muhammad Anugrah Asshiddiq
x
TABLE OF CONTENTS
Certifivation of Comprehensive Exam ..................................................................... i
Certifivation From Supervisor .................................................................................. ii
Sheet Statement Authenticity Scientific Work .......................................................... iii
Curriculum Vitae ....................................................................................................... iv
Abstract ...................................................................................................................... v
Abstrak ...................................................................................................................... vi
Foreword .................................................................................................................... vii
Table of Content ........................................................................................................ x
List of Tables ............................................................................................................. xiv
List of Figures ............................................................................................................ xvi
List of Appendix ........................................................................................................ xvii
Chapter I INTRODUCTION
A. Background ................................................................................. 1
B. Problem Identification ................................................................. 9
C. Research Objectives .................................................................... 9
D. Benefits of Research .................................................................... 10
Chapter II LITERATURE REVIEW
A. Theory Development ................................................................... 11
1. Agency Theory ...................................................................... 11
2. Good Corporate Governance (GCG) ..................................... 14
a. Concept Good Corporate Governance ............................ 14

xi
b. Good Corporate Governance’s
Legal Basis in Indonesia .................................................. 16
c. Basic Principle of Good Corporate Governance ............. 17
d. The purpose and Benefits of
Good Corporate Performance .......................................... 20
3. Board of Director .................................................................. 22
4. Ownership Structure ............................................................. 23
a. Institutional Ownership .................................................... 24
b. Managerial Ownership ...................................................... 26
5. Earnings Management .......................................................... 27
6. Company Performance Analysis .......................................... 30
B. Previous Research ...................................................................... 34
C. Theoritical Framework ................................................................ 36
D. Hypothesis .................................................................................. 38
Chapter III RESEARCH METHODOLOGY
A. Scope of Research ....................................................................... 41
B. Sampling Method ....................................................................... 41
C. Data Collection Method ............................................................. 42
D. Analyze Method .......................................................................... 43
1. Descriptive Statistical Analysis ............................................ 43
2. Classical Assumption ........................................................... 44
a. Normality Test ................................................................. 44
b. Multicollinearity Test ...................................................... 45
c. Autocorrelation Test ........................................................ 46

xii
d. Heteroscedasticity Test .................................................... 46
3. Hypothesis Testing ................................................................ 47
a. Coefficient of Determination (R2) ................................. 47
b. Multiple Regression Analysis ........................................ 48
c. Simultaneous Significance Test (F-Test) ........................ 48
d. Partial Significance Test (t-Test) .................................... 49
e. Moderated Regression Analysis...................................... 49
E. Definition of Operational Variable ............................................ 50
1. Independent Variable ........................................................... 50
2. Dependent Variable ............................................................ 52
3. Moderating Variable ............................................................ 53
Chapter IV ANALYSIS AND DISCUSSION
A. General Description of Research Object ..................................... 55
B. Analysis and Discussion .............................................................. 57
1. Descriptive statistic .............................................................. 57
2. Classic Assumption Test ...................................................... 59
a. Normality Test .................................................................. 59
b. Multicollinearity Test ........................................................ 66
c. Autocorrelation Test ........................................................ 68
d. Heterocedasticity Test ...................................................... 70
3. Hypothesis Testing ............................................................... 72
a. Coefficient of Determination (R2) .................................... 72
b. Multiple Regression Analysis .......................................... 75
c. Simultaneous Significant Test (F-Test) ........................... 81

xiii
d. Significant Partial Test (t-Test) ........................................ 83
e. Moderate Regression Analysis ......................................... 89
Chapter V CONCLUSIONS AND RECOMMENDATIONS
A. Conclusion .................................................................................. 92
B. Recomendation ........................................................................... 93
REFERENCE ......................................................................................................... 95
APPENDIX I ........................................................................................................... 101
APPENDIX II ......................................................................................................... 105
xiv
LIST OF TABLE
NO DESCRIPTION PAGE
2.1 Previous Research .......................................................................................... 34
3.1 Summary of Variable Operational Research ................................................. 54
4.1 Sample Selection .......................................................................................... 56
4.2 List of Companies Sample ............................................................................. 56
4.3 Descriptive Analysis ...................................................................................... 57
4.4 One Sample Kolmogorov-Smirnov Test (Model 1) ...................................... 60
4.5 One Sample Kolmogorov-Smirnov Test (Model 2) ...................................... 60
4.6 One Sample Kolmogorov-Smirnov Test (Model 3) ...................................... 61
4.7 Multicollinearity Test (Model 1) ................................................................... 66
4.8 Multicollinearity Test (Model 2) ................................................................... 67
4.9 Multicollinearity Test (Model 3) ................................................................... 67
4.10 Autocorrelation Test (Model 1) ..................................................................... 69
4.11 Autocorrelation Test (Model 2) ..................................................................... 69
4.12 Autocorrelation Test (Model 3) ..................................................................... 70
4.13 Criteria of Correlation Coefficient ................................................................. 73
4.14 Model Summary (Model 1) ........................................................................... 73
4.15 Model Summary (Model 2) ........................................................................... 74
4.16 Model Summary (Model 3) ........................................................................... 74
4.17 Multiple Regression Analysis (Model 1) ....................................................... 75
4.18 Multiple Regression Analysis (Model 2) ....................................................... 77
4.19 Multiple Regression Analysis (Model 3) ....................................................... 79
4.20 Simultaneous Significant Test (Model 1) ...................................................... 81

xv
4.21 Simultaneous Significant Test (Model 2) ...................................................... 82
4.22 Simultaneous Significant Test (Model 3) ...................................................... 82
4.23 Partial Test Result (Model 1) ......................................................................... 83
4.24 Partial Test Result (Model 2) ......................................................................... 84
4.25 Partial Test Result (Model 3) ......................................................................... 89

xvi
LIST OF FIGURE
NO DESCRIPTION PAGE
2.1 Theoritical Framework ................................................................................. 36
4.1 Normality Test (Model 1) .............................................................................. 62
4.2 Normality Test (Model 2) .............................................................................. 63
4.3 Normality Test (Model 3) .............................................................................. 63
4.4 Histogram (Model 1) ..................................................................................... 64
4.5 Histogram (Model 2) ..................................................................................... 65
4.6 Histogram (Model 3) ..................................................................................... 65
4.7 Scatterplot (Model 1) ..................................................................................... 71
4.8 Scatterplot (Model 1) ..................................................................................... 71
4.9 Scatterplot (Model 1) ..................................................................................... 72

xvii
LIST OF APPENDIX
NO DESCRIPTION PAGE
APPENDIX I Sample Descriptive ...................................................................... 101
APPENDIX II Output SPSS .................................................................................. 105

1
CHAPTER I
INTRODUCTION
A. Background
At this time the people of the world economy is facing a massive transition
process in the field of economy, namely globalization. globalization leading to
free trade and open investment climate lead to greater competition, as a result
the company is required to operate in a more competitive and productive in
improving firm value.
The performance is an overview of the implementation of an activity's
achievements in realizing the objectives of the company. Where one of the
important objectives of the establishment of the company is maximizing
shareholder wealth through increased value of the company (Brigham and
Houston, 2001). The company's financial performance is a reflection of
the financial condition of a company are analyzed with the tools of
financial analysis, so that it can be known about either the bad financial state
of a company that reflects the achievements of the work in a given period.
With the company's financial performance is also called a determination that
measures concerning both the company in bad work achievement can be seen
from its financial condition in a certain period.
Going public is one way a business entity to obtain funds by way of selling
and offering to relinquish rights to shares with payment. Business entities may

2
go public by selling new shares originating from authorized capital as well as
the old shares originating from the capital that has been paid (Sumantoro,
1990 : 64). In order to attract the investors, the company must provide details
of the financial statements as financial performance assessment has been
carried out. The financial condition of the company will be known from the
company's financial statements consisting of balance sheet, income statement
and other financial reports. By conducting an analysis of the financial
statement the investors know about the company financial performance
(Palupi, 2013).
Companies that go public are managed by separating the functions of
ownership (principal) with management or managerial function (agent). The
separation of these functions form an agency relationship is a relationship in
which shareholders entrust the management of the company is done by
another person or manager (agent) in accordance with the interests of the
owner (principal) by delegating some decision-making authority to the agent
(Jensen and Meckling, 1976). As a result of devolution and appointment
management (manager) has brought various consequences and impact of the
separation of powers and interests between the owner (principal) and
management (agent) that will cause agency problems (Berle and Means,1934).
The agency problem arises as a result of the opportunistic nature of the
management (agent) who tend to prefer the welfare that is contrary to the
goals of the principal (Jensen and Meckling, 1976). Management (agent)

3
considers that the company's success in achieving performance (performance)
is the result of work without seeing a large contribution from other parties
including the owners (stakeholders). In relation to the agency problem, some
experts argue that the presence of the agent and the principal is one of the
factors on which the emergence of the theory of agency.
Disharmony the objectives and interests between the agent and the
principal can lead agency cost and asymmetric information. Asymmetric
information is an imbalance between the information held by the agent and the
principal in the management of the company (Ujiyantho and Pramuka, 2007).
There are two types of asymmetry of information, namely: adverse selection
and moral hazard. Adverse selection, is a condition in which the management
has more information from the owner (principal) about the company's
prospects, while moral hazard, a condition where the owner (principal) who do
not know the activity of management (Scott, 2003). The existence of
asymmetric information that gives an opportunity for management to perform
earnings management (Richardson, 1998).
Healy and Wahlen, 1999 in Theresia, 2005) states that earnings
management is the management's efforts to change the financial statements
aimed at misleading the shareholders who want to know the performance of
the company or to influence contractual outcomes that rely on accounting
numbers that reporting. Gumanti (2000) stated that earnings management
allegedly committed by managers or preparers of financial statements in the

4
financial reporting process of an organization because they are expecting a
benefit from their actions. Note that earnings management is not always
associated with an attempt to manipulate the data or accounting information,
but more likely to be associated with the selection of accounting model
(accounting methods) to set the gain that could be done because it is allowed
according to the accounting regulations. If the company is in a condition
where the management cannot achieve the profit target set, then the manager
will make modifications profit is still in accordance with the applicable
accounting standards. Management motivated to show good performance in
generating maximum profits for the company so that management tends to
select and apply accounting methods that can provide a better return
information (Halim, et al; 2005).
Earnings management action by management has lead to scandal in
financial reporting (accounting) such as Merck, Wordcom and Enron as well
as several other large companies in the United States (Cornett et al; 2006).
Some major cases in corporate financial reporting scandals involving major
companies in Indonesia including PT. Kimia Farma Tbk, and Bank Lippo
Tbk. PT Kimia Farma Tbk indicated inflate the annual net profit of 32.668
billion rupiah in 2004. While PT. Indofarma Tbk perform earnings
management practices by presenting overstated net income by presenting a
higher inventory than it should, so that cost of goods sold that year occurred
understated (Bapepam, 2004).

5
In this case a violation of the principle of disclosure is accurate and
transparency are consequently extremely detrimental to investors, because it
overstated profits have formed the basis of transactions by investors to do
business. With the existence of such cases, it is proved that the application of
corporate governance is still very weak, because of the practice of
manipulation of financial statements still do despite being away from the crisis
period in 1997-1998. Evidence indicates weak corporate governance practices
in Indonesia leads to deficiencies in the company's decision-making and action
(Tjager, et al, 2003 in Hardikasari, 2011).
Good corporate governance is control efforts by the company to improve
performance management by making control more focused on monitoring the
behavior of the manager, so that the action taken by the manager is
accountable to the parties with an interest in the company. Warsono, et al
(2010) states that there are five basic principles of corporate governance that
must be met and is owned by five groups of participants in the company that
the Board of Directors, Board of Executives, Board of
Commissioners/Committees, Auditors, and Stakeholders. Five principles are
Transparency, Accountability and Responsibility, Responsiveness,
independence, and Fairness.
The issue of corporate governance started to become an important
discussion, especially in Indonesia, namely after Indonesia experienced a
period of crisis since 1998. Many people say that the length of the repair

6
process problems that the crisis in Indonesia due to the very weak of
implementation corporate governance in enterprises in Indonesia. Since then,
both the government and investors began to give significant attention in the
corporate governance practices (Hardikasari, 2011).
The failure of some companies and the onset of the financial crisis as a
result of malpractice cases are strong evidence of poor practice of Good
Corporate Governance. According to Pangestu and Hariyanto (2004), the
characteristics of weak good corporate governance practices in southeast
Asia is (1) the existence of a concentration of ownership and the power
of insider shareholders (including the government and the parties related to
the central power); (2) the weak financial sector governance and (3) the
ineffectiveness of internal rules and the absence of the consent law for
minority shareholders to deal with majority shareholder and manager.
Therefore, based on phenomena above the author interested to analyze :
“The Influence of Earnings Management on Firm Value and Good Corporate
Governance as Moderating Variable”
This research has been done by several researchers. Research conducted
by Herawaty (2008) examine the role of Corporate Governance Practices as a
variable that moderates the effect of Earnings Management to the value of the
firm. The variable examined in this research is earnings management
measured with discretionary accrual, firm value, institutional ownership,

7
independent commissioner and audit quality. The sample which is used in this
research listed non financial company in Indonesian stock exchange on period
of 2004-2006. The analytical method used is multiple regression method. In
doing multiple regression analysis, first performed classical assumption test in
order to meet the nature of regression estimation is BLUES (Best Linear
Unbiased Estimator).
Sutrisno (2010) examine the influence of the earnings management
concerning to the firm value and to examine whether the corporate governance
mechanism is the moderating variable between influence of earnings
management toward the firm value. The variable examined in this research is
earnings management measured with discretionary accrual by modified Jones
model, firm value, institutional ownership, managerial ownership,
independent commissioner and auditor quality. The sample which is used in
the research listed non financial company in Indonesian stock exchange on
period of 2005-2009. This research is using purposive sampling method to
determine the sample and it produce 58 companies as research sample.
Regression analysis method used descriptive statistic and multiple regression.
Dyas Tri Pamungkas (2012) examine the influence of corporate
governance through managerial ownership, institutional ownership, the
proportion of independent board and audit quality as a moderating variable of
the relationship between earnings management and firm value. The samples
used in this study were manufacturing companies listed on the Stock

8
Exchange during the years 2007-2010 with a random sampling method based
some multiple criteria and obtained a sample of 140 companies.
Fauzan Kamil (2014) examine the influence of earning management to
firm value with corporate governance mechanism as moderating variable. The
populations of this research are 77 companies which listed in LQ-45 Index in
Indonesia Stock Exchange within 2010-2012 periods. In this research 12
sample are selected and used after using non-probability – purposive sampling
method. The data used in this research are secondary data, which is financial
and annual report of the companies within 2012-2014 periods, which obtained
from www.idx.co.id site, and sites of the companies that listed in this research
sample.
This research is using statistic descriptive test, linear regression test, and
multiple linear regression test to get the understanding about the connection
between variables in this research.
The difference of this research with previous research, namely:
1. Years observed in this study was in 2012-2014.
2. In this study, researchers focus to one industry that is real estate companies
which include property. The goal is to avoid bias caused by differences in
the study.

9
3. In this research use corporate governance indicators is Board of Director,
Managerial Ownership and Institutional Ownership.
B. Problem Identification
Based on the above description of the background, the problem
formulation in this research are:
1. Whether the earnings management influence the firm value?
2. Whether the corporate governance proxied by board of director influence
the relationship between earnings management on firm value?
3. Whether the corporate governance proxied by managerial ownership
influence the relationship between earnings management on firm value?
4. Whether the corporate governance proxied by institutional ownership
influence the relationship between earnings management on firm value?
C. Research Objectives
The purpose of this study was to analyze empirically the influence of
earning management on firm value and good corporate governance as
moderating:
1. To analyze influence of earnings management on firm value.
2. To analyze influence of corporate governance proxied by board of director
on relation between earnings management and firm value.

10
3. To analyze influence of corporate governance proxied by managerial
ownership on relation between earnings management and firm value.
4. To analyze influence of corporate governance proxied by institutional
ownership on relation between earnings management and firm value.
D. Benefits of Research
Implementation of this study is expected to provide the following benefits:
1. For the authors, this study is expected to provide insight into the influence
of earnings management on firm value and corporate governance as
moderating.
2. For companies, this study can be used as additional information or inputs
that builds primarily on the influence of earnings management on firm
value and corporate governance as moderating.
3. For others, this research is also expected to be useful for those who require
a knowledge and insight.

11
CHAPTER II
LITERATURE REVIEW
A. Theory Development
1. Agency Theory
Agency theory is a theory that explains the relationship between
agents as those who manage the company and the principal as the owner
of both which are bound in a contract. The owner or principal is a party to
evaluate the information and agents are running as part of management
activities and decision making (Jensen and Meckling, 1976).
Jensen and Meckling (1976) also define an agency relationship as
a contract under which one or more persons the principals engage another
person (the agent) to perform some service on their behalf which involves
delegating some decision making authority to the agent. If both
parties to the relationship are utility maximizes, there is good reason to
believe that the agent will not always act in the best interests of the
principal. The principal can limit divergences from his interest by
establishing appropriate incentives for the agent and by incurring
monitoring costs designed to limit the aberrant activities of the agent. In
addition, in some situations, it will pay the agent to expend resources
(bonding costs) to guarantee that he will not take certain actions which

12
will harm the principal or to ensure that the principal will be
compensated if he does take such actions.
However, it is generally impossible for the principal or the agent
at zero cost to ensure that the agent will make optimal decisions from
the principal’s viewpoint. In most agency relationships, the principal
and the agent will incur positive monitoring and bonding costs (non-
pecuniary as well as pecuniary), and in addition, there will be some
divergence between the agent’s decisions and those decisions which
would maximize the welfare of the principal. The dollar equivalent of the
reduction in welfare experienced by the principal as a result of this
divergence is also a cost of the agency relationship, and we refer to this
latter cost as the “residual loss”.
In reality, managers will know more about internal information and
the company's prospects in the future than shareholders. Therefore,
managers should always give a signal about the condition of the
company to the shareholder. The signal can be given by the manager
through the disclosure of accounting information such as financial report.
The financial report is a very important thing for the external users
because these entities are in the greatest condition of uncertainty (Ali,
2002). Imbalance knowledge of information will lead to the emergence of
a condition known as information asymmetry. With the existence of
information asymmetry between management and the shareholder will

13
give the opportunity to the manager to do earning management, so that it
will mislead shareholders about the company's economic performance.
Corporate governance is a concept based on agency theory that is
expected to serve as a tool to provide assurance to investors that they will
receive a return on the funds they had invested. Corporate governance is
closely related to how to make the investors believe that managers will
give benefit to them, by believing in that the manager will not misuse the
invested fund to the illegal projects. Besides that, corporate governance
also relates to how the investors control the managers (Siallagan and
Machfoedz, 2006).
Special authority in every region in Indonesia in
implementing corporate governance is based on Law no. 5 of 1974 on the
Principles of Governance in the Region, as well as explaining the
relationship between central and local government. After the
implementation of policies to implement regional autonomy in Indonesia
through Law no. 22 of 1999 as amended by Law no. 32 of 2004
on Regional Government has change a paradigm and a very basic
structure, especially the local government relations (Executive) with the
Regional Representatives Council/DPRD (Legislative). In this
relationship, the Legislative delegates authority to run the government to
the executive.

14
Agency problems that arise among executives tend to maximize
utility (self- interest) in the creating or composing the local budget,
because they have the advantage of information (information asymmetry).
As a result, executives tend to do "budgetary slack". This happens due to
the executive try to secure its position in the government in the point of
view of legislative and the public / people, even for the sake of the next
election, but budgetary slack of APBD is more for personal interest
among executives (self-interest) rather than for the benefit of society.
(Latifah, 2010).
2. Good Corporate Governance
a. Concept of Good Corporate Governance
Good Corporate Governance indefinitely as a system which has
authority and as a control to add value for all of stakeholders. As
principal of corporate governance have interest for all shareholders
and stakeholders in corporate governance. Understand of corporate
governance according to the Turnbull Report in the UK (April 1999)
Corporate Governance is a company’s system of internal control,
which has principal to the management’s risk which are significant to
fulfill of its business objectives to safeguard the company’s asset and
enhancing over time the value of the shareholders’ investment. The
Implementation involved development of GCG, have two related
aspects, namely: hardware and software. The hardware includes the

15
establishment of technical or structural change and organizational
systems. The software includes more psychosocial change of
paradigm, vision. In real-world business practices, most companies
more emphasize hardware aspects, such as the preparation of systems
and procedures and the establishment of organizational structures.
Gede Raka, as panelist from Indonesian Institute for Corporate
Governance (IICG), stated of Good Corporate Governance have
implied the company and not make a profit for owners, but create
value for all concerned parties. Good Corporate Governance concept
reflects to share, care, and preserve. Good Corporate
Governance should changes of system and structure and dimension
paradigm, vision, mission of organization. Changes in technical
aspects of structure and systems are required as management’s
capabilities. In this case, focuses in concern are regularity and
smoothness on the process in organization as well as members of the
company's adherence to the policy to implement the Principles Good
Corporate Governance.
The definition according to Cadbury, said that Good Corporate
Governance is direct and control the company, in order to reach
balance between power of strength and authority of company. World
Bank defines Good Corporate Governance is a collection of laws,
regulations, and rules which have to fulfill and can push the

16
performance of corporate resources as function efficiently, in
order to generate economic value of sustainable long term for
shareholders and society as a whole.
According to decree of Minister of state-owned enterprise
No: PER-01/MBU/2011 regarding on the implementation of Good
Corporate Governance practices in state-owned enterprise is
principles underlying the process and mechanism of corporate
governance based enterprise management regulations and business
ethics.
b. Good Corporate Governance’s Legal Basis in Indonesia
In Indonesia, the implementation of good corporate governance
guidelines have been made by Komite Nasional Kebijakan
Governance (KNKG) through his new book released in 2006 entitled
“Pedoman Umum Good Corporate Governance Indonesia". Devices
Regulations and Legislation Circular of Minister of State for
Investment and Development of State-Owned Enterprises 106 of 2000
and Decree of Minister of State Enterprises no. 23 2000 that regulate
and formulate the development of good practice the company's
corporate governance in the company, and then refined with KEP-
117/M-MBU/2002 which is renewed by the Regulation of Minister of
State-Owned Enterprises PER-1/MBU/2011 of Implementation
Practices of Good Corporate Governance (GCG) on SOEs. There

17
has also been issued Decree of Minister of State Enterprises
no.103 Year 2002 on Establishment of Audit Committee. Capital
Market Supervisory Board No. through a circular.. SE-
03/PM/2000 has recommended that public companies to maintain audit
committees.
c. Basic Principles of Good Corporate Governance
Various rules and system as a regulator in management of
company’s need to be poured in form of principles that must be
adhered to the concept of Good Corporate Governance. In
generally, there are 5 (five) basic principles (KNKG, 2006),
namely:
1) Transparency
To maintain the objective of corporate must provide
information, which is material and relevant in a way that is
easily accessible and understood by stakeholders. Companies
should take the initiative to reveal not only the problem that
required by law, but also the importance for decision-making by
shareholders, creditors and other stakeholders. Corporate must
provide the information timely, adequately, clearly, accurately,
and all the important events that may affect the condition of
corporate.

18
2) Accountability
Corporate must be accountable for their performance in a
transparent and fair. It must be properly managed, scalable, and in
accordance with the interests of the company to remain
stakeholder’s interests. Specify details of duties and
responsibilities of each organization and all employees.
Corporate must ensure that the organs of company and all
employees have competent accordance with the duties,
responsibilities, and roles in implementing Good Corporate
Governance. Corporate needs to ensure an effective system of
internal control to be manage in the company.
3) Responsibility
Corporate must comply with laws and regulations and
carry out responsibilities for people and the environment. So, the
business can be maintained in the long run and gained recognition
as the Good Corporate Governance. The organization must adhere
to the principle of prudence and ensure compliance with regulatory
laws, statutes and regulations. Corporate should be carried out
social responsibility. Corporate has to be responsible in
management to the principle of corporate, as well as existing of
some regulation.

19
4) Independency
The corporate should be managed independently, so the
individual companies do not dominate other organs and no
intervention by other parties. Each organ must avoid domination
by any party, is not affected by particular interests, independent of
other interests, influence and pressure. Each organ shall carry out
the functions and duties in accordance with the statutes and
regulations, and not dominate the other, or passing the buck
between each other. Independency state whereas the corporate are
managed by professional without any conflict interest and pressure
from any side, which will be affected to the health of corporate.
To accelerate the implementation of Good Corporate
Governance, the corporate should be managed independently, so
their organizations do not dominate to the other and no
intervention other parties. Each organization of corporate has to
avoid the domination any party, not influenced by special interest,
free from conflict and pressure, so the decision-making will be
done objectively. Each organ must perform its functions and
duties in accordance with the statutes and regulations, do not
dominate others and passing the buck between each other to
realize an effective internal control.

20
5) Fairness
To carry out these activities, the company should pay
attention to the interests of stakeholders based on the principle of
equality and fairness. Corporate provide equal treatment to all
stakeholders. Corporate provides the opportunity for stakeholders
to give advice and opinion for company’s performance and open
access of information in accordance with the principles of
transparency within the scope of the position.
Equality and fairness defined as fair and equal treatment in
fulfilling the right of stakeholder arising under treaties and laws,
which have applied. Fairness also includes to fulfill the right of
investors, legal system and enforcement of regulations, which
protect investors. Fairness is expected to make the entire of
company’s assets are well managed and prudent, also expect to
protect all members. Corporate should provide the opportunity for
stakeholders to provide input and expression to the interests of
companies and open access to information in accordance with
the principle of transparency in their respective positions.
d. The Purpose and Benefits of Good Corporate Governance
The essence of corporate governance is improving the company's
performance through the supervision or monitoring of the performance
management and accountability to the shareholder and management

21
interests of other users, based on a framework of rules and regulations
(Gunarsih, 2003). In addition to these good corporate governance also
has its benefits, namely as follows:
1) Increase the company performance through the creation process
of a better decision making, improving the operational efficiency
of the company and further improve service to stakeholders.
2) Facilitate getting a cheaper financing funds so that it can further
improve the corporate value.
3) Reduce agency cost means that the cost that should be borne by the
shareholder as a result of the delegation of authority to the
management.
4) Increase the value of shares of the company so as to enhance the
company's image to the wider public in the long run.
5) Restore investor confidence to infuse capital in Indonesia.
Whereas the purpose of good corporate governance is as follows:
1) Protecting the rights and interests of the shareholders.
2) Protecting the rights and interests of the members of stakeholders.
3) Increase the value of the company and its shareholders.

22
4) Improve the efficiency and effectiveness of work of the Board of
Directors and management of the company.
5) Improve the quality of the relationship the Board of Directors with
senior management of the company.
3. Board of Directors
The board of directors is a party to a corporate entity tasked with
carrying out the operation and management of the company. Members of
the Board of Directors appointed by the Annual General Meeting (AGM).
According to the limited liability company act, which can be appointed as
a board member is an individual who is able to carry out legal action and
not been declared bankrupt or become a member of the directors or
commissioners who were found guilty of causing the company to go
bankrupt, or a person who never convicted of committing adverse financial
criminal state within five years prior to appointment.
The boards of directors are fully responsible for all operations and
management of the company in order to carry out the interests in achieving
corporate goals. The board of directors is responsible for the affairs of the
company with external parties such as suppliers, customers, regulators and
legal parties. With such a large role in the management of the company,
directors basically have a significant controlling interest in resource
management companies and funds from investors. Functions, powers, and
responsibilities of directors is expressly stipulated in Law no. 40 of 2007

23
on Limited Liability Company. In this law, the board has the task, among
others:
1) Leading publishing company with corporate policies.
2) Choose, assign, and supervise duties of the employee and the manager.
3) Approve the annual budget of the company.
4) Delivering a report to shareholders for the performance of the
company.
According to the general guidelines of good corporate governance
Indonesia, the number of board members must be tailored to the
complexity of the company with regard to its effectiveness in decision
making. In a company, the amount of both the board of directors and board
of commissioners vary. A large number of councils that can provide gains
or losses in the company.
4. Ownership Structure
The ownership structure is the shareholding in the company,
particularly the number of majority (either individually or together) will
determine the extent and intensity control to management. Ownership
structure is the percentage of shares held by the insider and the outsider
shareholder. Insider party i.e. shareholders who are aligned as a directors
and commissioners. Outsider party i.e. shareholders that have by the
institutions, individuals and other outside the company. Company

24
ownership can be seen from the point of the concept of corporate
governance, as the owner of an external mechanism, which is strongly
associated with the commissioners and directors (Hadiprajitno, 2013).
Agency problem is problems arising from the parties involved have
different interests with each other. The ownership structure is a mechanism
to reduce the conflict between management and shareholders (Faisal,
2004). So the agency problem can be mitigated by the presence of the
ownership structure, due to the presence of structured ownership structure,
believed to have the ability to influence the future course of the company
that may affect the agency costs incurred by the company.
Ownership structure can be individual investors, government, and
private institutions. The ownership structure is divided into several
categories. Specifically ownership structure category includes ownership
by institutional ownership and managerial ownership.
a. Institutional Ownership
Institutional ownership is ownership of shares owned by domestic
institutions, foreign institutions, government institutions such as
insurance companies, banks, investment companies and other.
Institutional ownership may indicate the presence of institutional
investors that strong corporate governance mechanisms which can be
used to monitor the management of the company (Tarjo, 2008).
Ownership structure of public companies in Indonesia is concentrated

25
in institutions. Institutions which mean the owner of a public company
in the form of institutions, not on behalf of the owner of individual
private (Sekaredi, 2011). The majority of institutions is a Limited
Liability Company.
Ownership by institutional investors is likely to encourage more
optimal monitoring the management performance, since share
ownership represents a source of power that can be used to support or
otherwise of the management performance. Jensen and Meckling
(1976) suggest that institutional ownership has a very important role in
minimizing agency conflicts that occur between managers and
shareholders.
According Barnae and Rubin (2005), institutional shareholders
with a large stake have an incentive to monitor corporate decision-
making. The greater the institutional ownership will make sound
power and boost the institution to oversee the management and
consequently will give greater impetus to optimize the value of the
company. In addition, ongoing surveillance of both managers and
reduce agency costs.
The existences of institutional investors are considered capable of
being an effective monitoring mechanism in any decision made by the
manager. This is due to the institutional investors involved in strategic
decision-making is not easy to believe the earnings manipulation.

26
According Cruthley (1999) who found that the monitoring is carried
out institutions capable substitute agency costs, thus decreasing agency
costs and increase firm value.
b. Managerial Ownership
Managerial ownership is ownership of shares of the company by a
manager or in other words the manager as well as a shareholder
(Christiawan and Tarin, 2007). According to Jansen and Meckling
(1976) one way in order to reduce the conflict between the principal
and the agent can be done by increasing managerial ownership of a
company. That means that managerial stock ownership in a company
will encourage pooling of interests between principal and agent so that
managers act in accordance with the wishes of shareholders.
Managerial share ownership can also aligns the interests between
managers and shareholders so that managers will be careful in taking
decisions because they directly share in the benefits and impact of the
decisions of making the wrong decision (Gelisha, 2011).
The greater the proportion of managerial stock ownership in the
company, the managers tend to try harder and motivated to create the
optimal performance of the company because managers have an
obligation to maximize the welfare of the shareholders, yet on the
other hand managers also have an interest to maximize their welfare
(Gelisha, 2011). The Manager will seek to reduce conflicts of interest

27
resulting in lower agency costs and can reduce the tendency of
managers to perform opportunistic actions.
5. Earnings Management
Earnings management is to intervene in the management of
external financial reporting process in order to achieve a certain income
level with the aim to benefit himself (or his own company). Opportunities
to distort that particular income arising from the accounting methods
provide opportunities for management to take note of a certain fact in
different ways and opportunities for management to involve subjectivity in
compiling estimates (Worthy, 1984).
Healy (1985) stated that earnings management occurs when
managers working in the company with the bonus plan tried to arrange
reported earnings in order to maximize the bonus they will receive.
Merchant (1989) defines earnings management as an action taken by
management to affect earnings that can provide information about the
economic benefits are not actually experienced companies. Scipper (1989)
defines as earnings management intervention in the financial reporting to
external parties for the purpose of personal gain.
Earnings management is the management's efforts to change the
financial statements aimed at misleading the shareholders who want to
know the performance of the company or to influence contractual
outcomes that rely on accounting numbers that report. Note that earnings

28
management is not necessarily linked to the process of manipulation by
the manager, but more likely to be associated with the process of selecting
the method of accounting (accounting method) to adjust benefits can be
obtained by the company because it is allowed by regulation accounting
earnings management, but this remains to be detrimental to shareholders
stocks because they get company information presented is not real by the
manager so that they can not accurately predict who would benefit they get
from the fund has been invested into the company (Healy dan Wahlen,
1998).
Based on the various definitions of the earnings management, some
of the characteristics of earnings management, namely: (1) carried out
based on the time dimension; (2) as an option to the company's accounting
policies for financial reporting purposes; (3) there are aspects of the
behavior of managers that manage earnings (earnings) with various
motives, for example, take advantage by asymmetry of information or to
hide poor performance.
According to Scott (2002) motivation of the company in this case
is the manager doing earnings management:
a. Bonus scheme
Managers who work in the company with the bonus plan will try to
arrange in order to maximize profits bonus that will be received.

29
b. Debt Covenant Clause
Motivation in line with the debt covenants hypothesis in a positive
accounting theory the closer a company to breach debt agreement then
the manager will tend to choose accounting methods that can "move"
the current period income so as to reduce the possibility of the
company suffered a breach of contract.
c. Political motivation
Large companies and other strategic industry tends to reduce
profits to reduce the visibility, especially during periods of high
prosperity. This action is performed to obtain the ease and facility of
government.
d. Taxation motivation
Taxation is one of the main reasons why companies reduce
reported earnings. By reducing reported earnings, the company can
minimize the taxes that must be paid to the government.
e. Substitution Chief Executive Officer (CEO)
CEO assignment that will expire or be pursuing a strategy of
maximizing retirement income to increase bonus. Similarly, the CEOs
whose performance is not good, it will tend to maximize profits in
order to prevent or undo his dismissal.

30
f. Initial Public Offerings (IPO)
When the company goes public, the financial information contained in
the prospectus is an important source of information. This information
can be used as a signal to potential investors, the managers tried to
increase reported earnings.
6. Company Performance Analysis
The company is an entity form the scene of a unity of the various
functions and operational performance work systematically to achieve a
certain goal. The goal of a company is an objective to be achieved all
stakeholders in the company. To achieve these objectives, the parties
interested in the company should cooperate systematic way to yield
optimal performance. One way to know whether a company in carrying
out its operations in accordance with a predetermined plan and in
accordance with the objectives was to find out from the company
performance.
Performance is a picture of the level of achievement of the results
of the implementation of an operational activity. Assessment of
performance here is a method and process assessment task execution
performance of a person or group of people or work units within a
company or organization in accordance with the performance standards or
goals set. In realizing the vision and mission of the organization,

31
companies need to have a measure to gauge how the achievement of goals
and objectives within a specific time period.
Thus, the performance as a description of the achievement of the
implementation of operational activities is vital in realizing the vision and
mission of the organization. Assessment of performance is a form of
reflection obligation and responsibility to report on the performance,
activities and resources have been used, accomplished and done. To assess
whether the stated goals have been achieved is not something easy to do.
This is because it concerns the management aspects which are not few in
number. Because of this, the company performance can be accessed
through a variety of indicators or variable to measure the success of the
company. However, in general the performance appraisal company
focused on the information derived from the financial statements. General
performance of the company usually represent in the financial statements.
These financial statements are useful to help investors, creditors, potential
investors and other users in order to make investment decisions, credit
decisions, as well as the stock analysis determines a company prospects in
the future. Through performance evaluation, the company can choose a
strategy and financial structure.
Since the company performance appraisal based on financial
statements, it is to assess the performance using financial ratios. These
ratios which will give the indication for the management of the investor

32
assessment of the company performance and its prospects in the future.
Ratios commonly used to assess the financial performance, among others,
is Tobin's Q. In the capital markets, managers and investors are more
interested in the market value of a company is more often using Tobin's Q
as the ratio to measure financial performance. According to Darmawati
(2011) Tobin's Q ratio can explain various phenomena in company
activities, such as the relationship between management ownership and
company value, the relationship between performance management and
profits, acquisitions, and financing policies, as well as dividends, and
compensation.
Darmawati (2011) also stated that the ratio of assessed to provide
good information, because it can explain various phenomena in corporate
events, such as the differences in investment and diversification decisions,
the relationship between management stock ownership and corporate
value. However, the use of Tobin's Q as financial ratios to demonstrate the
performance of the company has a number of drawbacks. According to
Bukhari (2011) that the market value can be the size of the firm value,
while the balance sheet, total equity capital of the company describe.
Assessment of the company not only refers to the nominal value, this is
due to the condition of the company to change at any time significantly.
Usually the pre-crisis nominal value of the company is quite high but after
crisis condition of the company slipped while nominal fixed.

33
From the above statement can be concluded that the decline in the
condition of the company after the crisis is sometimes not immediately
followed by a decrease in stock value. In fact, the nominal value of shares
requires a certain time lag to changes according to the condition of the
company after the decrease or increase in operational performance. This
does not include the risk that comes from the presence of a particular issue
or cause the movement of the stock price becomes abnormal. With such
conditions, researchers not use Tobin's q as a measure of company
performance, but researcher use profitability ratios for measured the
company performance. Profitability ratios indicate the ability of the
company assets to generate operating profits. Profitability ratios focus on
measuring the performance of the company's current and profitability
ratios are not tied to stock (Ferdiana, 2012).
Most researchers consider Tobin's Q are better able to explain the
actual state of the company. However, the high volatility of stock price
due to the influence of various macroeconomic factors can have a big
impact can affect the results of the calculation. This would not happen if
we used profitability ratios, because of these considerations this study used
as an indicator of performance, profitability ratios assessment indicates the
overall efficiency and performance of the company.

34
B. Previous Research
Table 2.1 Previous Research
(Continue to next page)
No. Researcher (Year) Title Variable
Result (Summary) Similarity Difference
1. Murhadi (2009)
The effect of good
governance practices
against earnings
management
practices by
companies
Variable :
Corporate
Governance,
Earnings
Management
Sample :
Manufacture
corpanies periode
2005-2007
The researcher found that only two
variables significantly influence the
earnings management practices that CEO
duality and the existence of a controlling
shareholder. While other independent
variables such as independent directors,
audit committee and also a shareholder
coalition outside the controlling
shareholders do not have any impact on
earnings management practices in the
company.
2. Dyas Tri
Pamungkas (2012)
Earnings
management on firm
value with good
corporate governance
as moderating
variable
Variable :
Earnings
Management,
Managerial
Ownership,
Institutional
Ownership,
Firm Value
Sample : LQ-45
Index Companies
Listed in
Indonesian Stock
Exchange Periode
2010-2012
The result of this research shows that
earnings management has no influence
toward firm value. However, corporate
governance mechanism that measured by
managerial ownership, institutional
ownership and independent commissioner
simultaneously affecting Firm value
significantly. In partial, managerial
ownership and institutional ownership are
moderating variable in influence between
earnings management and Firm value,
while independent commissioner is not
moderating variable in influence between
earnings management and Firm value.

35
Table 2.1 Previous Research (Continued)
No. Researcher (Year) Title Variable
Result (Summary) Similarity Difference
4
Khaliq Ur Rehman
Cheema and
Muhammad Sadat
Din (2013)
Impact of Corporate
Governance on
Performance of
Firms
Variable :
Corporate
Governance,
Firm Value
Variable : Firm
Value
measurement by
return on equity,
return on assets,
and earnings per
share.
The researcher found that CEO duality is
negatively and significantly related to
cement industry performance, as the
performance indicator for firm is EPS.
Family and non-family firms has also
impact on cement firm’s performance. Its
shows that board size do not affect the
performance of a firm.
5. Fauzan Kamil
(2014)
Earnings
management on firm
value with good
corporate governance
as moderating
variable
Variable :
Earnings
Management,
Managerial
Ownership,
Institutional
Ownership
Board of
Inndependent,
Firm Value
Sample : LQ-45
Index Companies
Listed in
Indonesian Stock
Exchange Periode
2010-2012
The result of this research shows that
earnings management has no influence
toward firm value. However, corporate
governance mechanism that measured by
managerial ownership, institutional
ownership and independent commissioner
simultaneously affecting Firm value
significantly. In partial, managerial
ownership and institutional ownership are
moderating variable in influence between
earnings management and Firm value,
while independent commissioner is not
moderating variable in influence between
earnings management and Firm value.

36
C. Theoritical Framework
Figure 2.1
Theoritical Framework
(Continue to next page)
Annual Report of All Listed Company on IDX as a
Property and Real Estate Business
Period 2010-2014
Independent Variable
Earnings Management
Control Variable
Size of the Company
Dependent Variable
Firm Value (Tobin’s Q)
Moderating Variables
1. Board of Directors
2. Managerial Ownership
3. Institutional Ownership

37
Figure 2.1
Theoritical Framework (Continued)
Classic Assumption Test
1. Normality
2. Multicollinearity
3. Autocolleration
4. Heterocedasticity
Moderate Regression Analysis
Analysis and Intepretation
Conclusion
Hypothesis Test
6. Test Coefficient of
Determination (R2)
7. Multiple Regression
Analysis
8. Simultaneous Significance
Testing ( F-Test)
9. Partial Significance Test
(t-Test)

38
D. Hypothesis
1. Earnings Management and Firm Value
As the manager of the company managers more aware of internal
information and prospects of the company in the future compared to the
owners (shareholders), giving rise to asymmetry of information. Managers are
required to provide a signal about the state of the company to the owner.
Given signal is a reflection of the firm value through the disclosure of
accounting information such as financial reports. The financial report is
important for external users because of the group's companies are in a
condition that at least a high degree of certainty (Ali 2002).
Asymmetry between the management and the owners give managers
the opportunity to perform earnings management to increase the firm value at
a given time so as to mislead the owners (shareholders) of the actual firm
value. Sloan (1996) examined the nature of the information content of the
accrual component and a component of cash flows is reflected in the share
price. Proved that the performance of profits derived from accrual as a
component of earnings management activities have lower persistence than
cash flow. Reported earnings greater than the operating cash flow that can
increase the firm value at this time.
H1 : Earnings management have positive influence on firm value.
39
2. Corporate Governance and Firm Value
In the perspective of agency theory, the agent is risk adverse and tend
to be selfish would allocate resources from investments that do not increase
the firm value to a more profitable investment alternatives. Problems agency
will indicate that the firm value will rise if the owner of the company can
control the behavior of the management in order not to waste resources
companies, either in the form of investments that are not feasible or in the
form of shirking. Corporate governance is a system that regulates and controls
the company that is expected to provide and enhance the company's value to
its shareholders. Thus, the implementation of good corporate governance is
believed to increase the firm value.
Klapper and Love (2002) found a positive relationship between corporate
governance and corporate performance as measured by return on assets
(ROA) and Tobin's Q. Another important discovery is that the application of
corporate governance at the enterprise level is more meaningful in developing
countries than in developed countries , It shows that companies that
implement good corporate governance would gain greater benefit in countries
with poor legal environment.
H2 : Practice corporate governance positively influence jointly and partially
to firm value.

40
3. Earnings Management, Corporate Governance and Firm Value
The company that organizes corporate governance system is believed
to limit opportunistic earnings management. Therefore, the higher the size of
board of director, the proportion of managerial ownership ana institutional
ownership reduce the tendency of earnings management. The negative
relationship between corporate governance and earnings management may
weaken the effect between earnings management and firm value.
H3 : Earnings management influence on the firm value weakened by the
practice of corporate governance.

41
CHAPTER III
RESEARCH METHODOLOGY
A. Scope of Research
This research is empirical study of hypothesis testing with using
causalities research method to determine the influence between the
independent variables (variables that effect) and the dependent variable (the
variable that is effected) with moderating variable. The independent variable
in this research is earnings management. The dependent variable in this
research is firm value and the corporate governance as moderating variable.
This study aimed to examine the influence of Earnings management
implementation towards the firm value and Corporate Governance as
moderating variable, the study on real estate and properties companies listed
in the Indonesian Stock Exchange (IDX) within 2012-2014. Corporate
governance proxies by Board of Director (BOD), Managerial Ownership
(MO), Institutional Ownership (IO), and firm value measure by Tobin’s Q.
B. Sampling Method
Sampling method is kind of method that take data from population.
Sample is a part of the number, and characteristic possessed by the population.
Research will not take all the populations, because due to limited funds,
manpower and time. So, sample can represents the population (Sugiyono,
2009:5). The sampling method used in this research is purposive sampling

42
method. In purposive sampling this research use judgmental sampling by
specific criteria (Sekaran, 2009:79).
1. The sample specific criteria in this research are as follow:
2. The company has published its annual report publicly within period 2012-
2014.
3. All Real Estate business listed in IDX that use IDR currency.
4. The company has the data Board of Director (BOD), Managerial
Ownership (MO), Institutional Ownership (IO), that will be tested in its
annual report.
C. Data Collection Method
This research uses secondary data. This type of data obtained through
research literatures which provide the theoretical basis and frame of mind to
support primary data, as well as to support problem identification
discussion (Indriantoro and Supomo, 2009:5). Secondary data refer to
information gathered from sources that already exist (Sekaran and Bougie,
2010:81). This research data will be acquired from reports on the
company’s website, annual reports of company or the media reports.
Secondary data used in this study are the annual report of real estate business
listed on the Indonesia Stock Exchange in 2010 - 2014.

43
D. Data Analyze Method
The method of data analysis used in this study is a model of multiple
regression analysis with the help of software SPSS 22 for Windows. Data
analysis was performed by descriptive statistical analysis, classical
assumptions test and hypothesis test. Classical assumptions test include
normality test, multicollinearity test, heteroscedasticity test and
autocorrelation test. Hypothesis test include multiple regression analysis, test
of coefficient of determination, simultaneous significance test and partial
significance test.
1. Descriptive Statistical Analysis
Descriptive analysis is used to provide an overview of the study
variables. Descriptive statistics were used, among others, mean, median,
minimum, maximum, and standard deviation (Ghozali, 2013:19).
Statistical analysis was used to test the quality of the data and testing
hypotheses. Statistical analyzes were performed was the classic
assumption test and hypothesis test.
The data in this study were analyzed with descriptive statistics.
Descriptive statistical testing in this research basically is a process
transformation research data in a form of tabulation in order that can be
easier to be understood and interpreted. Tabulation in generally is used by
researcher to obtain information about characteristics of primary variable
in research. The measurement applied in this descriptive statistical testing

44
depends on the type of scale of measurement. The descriptive statistical
testing obtains a picture or describes data that can be seen from median,
mean, mode, standard deviation, variance, maximum and minimum.
2. Classic Assumptions Test
Classical test assumption aims to determine the relationship
between the variables in the data. Before conducting regression analyzes,
first tested the classical assumptions to determine whether there is a
relationship between the variables.
a. Normality Test
Normality test aims to test whether the regression model, or
residual confounding variable has a normal distribution. There are two
ways to detect whether or not residual normal distribution, i.e. the
graph analysis and statistical tests (Ghozali, 2013: 160). Normality test
can use the tools such as statistical tests to Kolmogorov-Smirnov Z (1
- Sample KS), the basic decision-making (Ghozali, 2013: 164):
1) If the value Asymp. Sig. (2-tailed) less than 0.05, then H0 is
rejected. This means that the data are not normally distributed
residuals.
2) If the value Asymp. Sig. (2-tailed) of more than 0.05, then H0 is
accepted. This means that the data were normally distributed
residuals.

45
Another way to normality test can be done by looking at the spread
of the data (dots) on the diagonal axis of the graph or by looking at the
histogram from the residual. Basic decision-making, namely (Ghozali,
2013: 163):
1) If the point spread around the diagonal line and follow the
direction of the diagonal line, the regression model to meet the
assumptions of normality.
2) If the point spread away from the line or diagonal and do not
follow the direction of the diagonal line, the regression model did
not meet the assumptions of normality.
b. Multicollinearity Test
Multicollinearity test aims to test whether the regression model
found a correlation between the independent variables (Ghozali,
2013:105). A good regression model should not happen correlation
between the independent variables. To detect the presence or absence
of multicollinearity in the regression model can be seen from the value
of tolerance and the Variance Inflation Factor (VIF). Multicollinearity
views of the tolerance value <0.10 or VIF> 10. Both of these
measurements indicate each independent variable which is explained
by the other independent variables.

46
c. Autocorrelation Test
Autocorrelation test aims to test something, in a linear regression
model. There is a correlation between the error of a bug in the period t
to bug errors t-1 period or previous period (Ghozali 2013:110).
Diagnose the autocorrelation done through testing to test the value of
Durbin Watson (DW test) by (Ghozali 2013:111). Basis for decision-
making as follows:
1) If 0 < DW< DL there is any positive autocorrelation.
2) If DL < Dw < Du or 4-Du < D < 4-DL uncertain conclusion.
3) If 4-DL < Dw < 4 there is any negative autocorrelation.
4) If 0 < Dw < DL or Du < Dw < 4-Du there is no autocorrelation.
d. Heteroscedasticity Test
According to Ghozali (2013 : 139), the aim from heteroscedasticity
test is to test whether the regression model occur the variance
inequality of the residual from one observation to another observation.
If the variance from residual of one observation to other observations
is fixed, it is called homocedasticity and if it different called
heteroscedasticity. The presence of heteroscedasticity can be seen from
the graph Scatterplot between the predicted value of the dependent
variable is ZPRED with residual SRESID. If there is a pattern like dots
are there forms a particular pattern of regular, then there

47
heteroscedasticity. Conversely, if there is no clear pattern as well as
points that spread then there is no heteroscedasticity.
3. Hypotesis Testing
a. Test Coefficient of Determination ( R2)
The coefficient of determination (R2) was essentially measure how
far the model's ability to explain variation in the dependent variable.
Determination coefficient is between zero and one. Small value of R2
is the ability of independent variables in explaining the dependent
variable is very limited. Value close to one means that the independent
variable gives almost all the information needed to predict the
variation in the dependent variable (Ghozali, 2013: 97).
Coefficient determination is a statistical measurement of how well
the regression line approximates the real data point. By knowing the
value of R2, It can determine the magnitude contribution of
independent variables toward the dependent variable. R2 expresses a
value between zero and one. If R2 is near to 0, most of data variations
cannot be explained by the regression model. In this case, the
regression model fits the data poorly. On the other hand, if R2 is near
to 1, most of the variation in the dependent variable can be explained
by the regression model. In other words, the regression model fits the
data well (Sekaran, 2010).

48
The closer adjusted R2 score to 1, the better independent variables
explaining dependent variable The hypothesis in this study is
influenced by the value of the corresponding variable coefficient
significance after testing. Conclusion the hypothesis made by t-test.
b. Multiple Regression Analysis
Multiple regression analysis is used to test the effect of two or more
independent variables toward the dependent variable (Ghozali, 2013 :
96 ). Regression analysis divided into two kinds, simple regression
analysis (if there is only one independent variable) and multiple
regression analysis (if there is more than one independent variables).
Multiple regression analysis can be measured partially (indicated by
coefficient of partial regression) jointly indicated by coefficient of
multiple determination or R2
(Indriantoro and Supomo, 2002).
c. Simultaneous Significance Testing ( F-Test)
Essentially, F-test has purpose to know whether among
independent variables simultaneously have significant influence
toward dependent variable (Ghozali, 2013: 98). Independent variables
in this research are good corporate governance indicator and ownership
structure whereas dependent variable is company performance. So, F-
test has a function to know the effect of good corporate governance on
company performance. α used for this research is 0.05 ( 5%) with
assumption:
49
1) If sig ≥ 5%, ho is accepted.
2) If sig < 5%, ho is rejected.
d. Partial Significance Test ( t-Test)
Partial Significance Test or t-test basically has purpose to know
how far and how much the influence independent variables on
dependent variables (Ghozali, 2013:98). In this research, t-test is done
to know the effect of good corporate governance as independent
variables on company performance as dependent variable.
Assumption used for this test are if the significance value of t more
than α (significance value > α), then hypothesis is rejected but if on
contrary the significance value of t less than α (significance value < α),
so hypothesis is accepted. Level of significance (α) use in this research
is 0.05 (5%).
e. Moderated Regression Analysis (MRA)
The purpose of this analysis to determine whether the moderating
variables will strengthen or weaken the relationship between
independent variables and the dependent variable. Moderated
Regression Analysis (MRA) is a specific application of multiple linear
regression where the regression equation contains elements of
interaction (multiplication of two or more independent variables).

50
E. Definition of Operational Research
Operational variable is a way to set up a concept and how the concept
should be measured so that there are variables that can lead to other problems
of a variable depends on the situation and condition of other variables.
Operational variables based on the nature of the attributes of the object
observed in the study, can form both qualitative and quantitative researchers
made merely for the purpose of research, after understanding the attributes
based on the support of various runway.
1. Independent Variables
The independent variable is the type of variables that explain or
influence another variable or variables suspected as the caue of the
dependent variable (Indriantoro and Supomo, 2009: 64). The independent
variables in this research is earnings management thet proxy by
discretionary accrual using Jones model that modified Dechow et.al
(Dechow et.al in Herawaty, 2008) with the following step :
a) Total Accrual
TAC = NIit – CFOit
Description :
NIit = Net income company i on periode t
CFOit = cash flow of operation company i on periode t

51
b) Total accruals are estimated with a regression equation OLS
(Ordinary Least Square)
TAit/Ait-1 = β1 (1/Ait-1 ) + β2 (Δ Revit/Ait-1 ) + β3 (PPEit/Ait-
1 ) + e
Description :
TAit = Total accrual in period t
Ait-1 = Total asset period t-1
ΔRevit = Changes in income / net sales in period t
PPEit = Property, plant and equipment period t
β1 β2 β3 = Koefisien correllation.
c) Non accrual discretionary
NDAit = β1(1/Ait-1 ) + β2(ΔRevit/Ait-1-ΔRecit/Ait-1) +
β3(PPEit/Ait-1) + e
Description :
ΔRecit = Changes in net debt in period t
β1 β2 β3 = Fitted coefficient obtained from the regression
results in the calculation of total accrual.
d) Discretionare total accrual
DAit = TAit /Ait-1 – NDAit

52
Description :
TAit = Total accrual year t
NDAit = Non accrual discretionare in year t
2. Dependent Variable
Dependent variable is type of variables that explained or
influenced by other variables or variable expected as a result of the
independent variable (Indriantoro and Supomo, 2009:159). Dependent
variable used in this research is firm value. Tobin’s Q is used to measure
firm value. According to Ma & Tian (2009), Tobin’s Q has the advantage
of reflecting the firm’s current value and future profitability potential.
According to Vinola Herawati (2008), firm value can be measured by
Tobin Q which is formulated as :
Q = EMV + D
EBV + D
Description :
Q = Firm value
EMV = Equity Market Value
EBV = Equity Book Value
D = The book value of the total debt.

53
3. Moderating Variable
The moderating variable is the one that has strong contingent effect
on the independent variable-dependent variable relationship. That is, the
presence of a third variable (the moderating variable) modifies the original
relationship between the independent and the dependent variables
(Sekaran 2010:73).
a. Board of Directors (BOD) is fully responsible for the management of
the company effective and efficient in order to achieve the company's
goals. Therefore, According to Linck et al (2008) Board of Directors
size measured by the number of Board of Directors member in the
company.
b. Managerial ownership (MO) is the ownership by the shareholders who
have a management position in the company like directors and
commissioners. According to Setyawan, (1999) in Faisal, (2004) The
Managerial ownership measured by the total percentage of managerial
ownership in a company.
c. Institutional Ownership (IO) is ownership by the government, financial
institutions, incorporated institutions, foreign institutions, and other
institutions in a company. According to Muwaningsari (2007) stated
that the Institutional ownership is measured by the total percentage of
institutional ownership in a company.

54
Table 3.1
Summary of variable operational research
No Variable Measure Scale
1
Earnings Management Total number of board director
Ratio
2
Board of Directors
(BOD)
The total number of
board of directors
members
Rasio
3
Managerial ownership
(MO)
% of shares owned by
managerial
Rasio
4 Institutional Ownership
(IO)
% of shares owned by
institutional
Rasio
5
Firm Value
Tobin’s Q =
Rasio

55
CHAPTER IV
RESULT AND ANALYSIS
A. General Description of Research Object
This chapter presents and discusses the findings of the research. The
population of this research is real estate business listed in IDX within period
2012-2014. The selection of sample is chosen by criteria of population that
have explained in research methodology in previous chapter that is taken as
annually in 2012-2014.
In 2012-2014, Real estate business that go public in Indonesia Stock
Exchange are 50 companies. This research is used purposive sampling. And
from 50 companies, regarding on criteria of sampling in previous chapter, so
the amount of sampling are 12 companies. This research will use pooling
data method in which the variable will be tasted in three year, so the total
sample are 36 samples of annual report.
Companies that become the sample is the company that fulfill the criteria
of the sample in this research:
56
Table 4.1
Sample Selection
No.
Criteria
Number
1
Population real estate business
50
2
Real estate business that do not have institutional
ownership
(38)
Total sample of companies
12
Total sample of annual report used in this
Research
36
Source : Data Process
Table 4.2
List of Companies Sample
Source : Data Process
No Company Code
1 Agung Podomoro Land Tbk. APLN
2 Bekasi Fajar Industrial Estate Tbk. BEST
3 Bukit Darmo Property Tbk. BKDP
4 Ciputra Development Tbk. CTRA
5 MNC Land Tbk. KPIG
6 Lamicitra Nusantara Tbk. LAMI
7 Indonesia Prima Property Tbk. OMRE
8 Pudjiati Prestige Tbk. PUDP
9 Pakuwon Jati Tbk. PWON
10 Rista Bintang Mahkota Sejati Tbk. RBMS
11 Roda Vivatex Tbk. RDTX
12 Summarecon Agung Tbk. SMRA
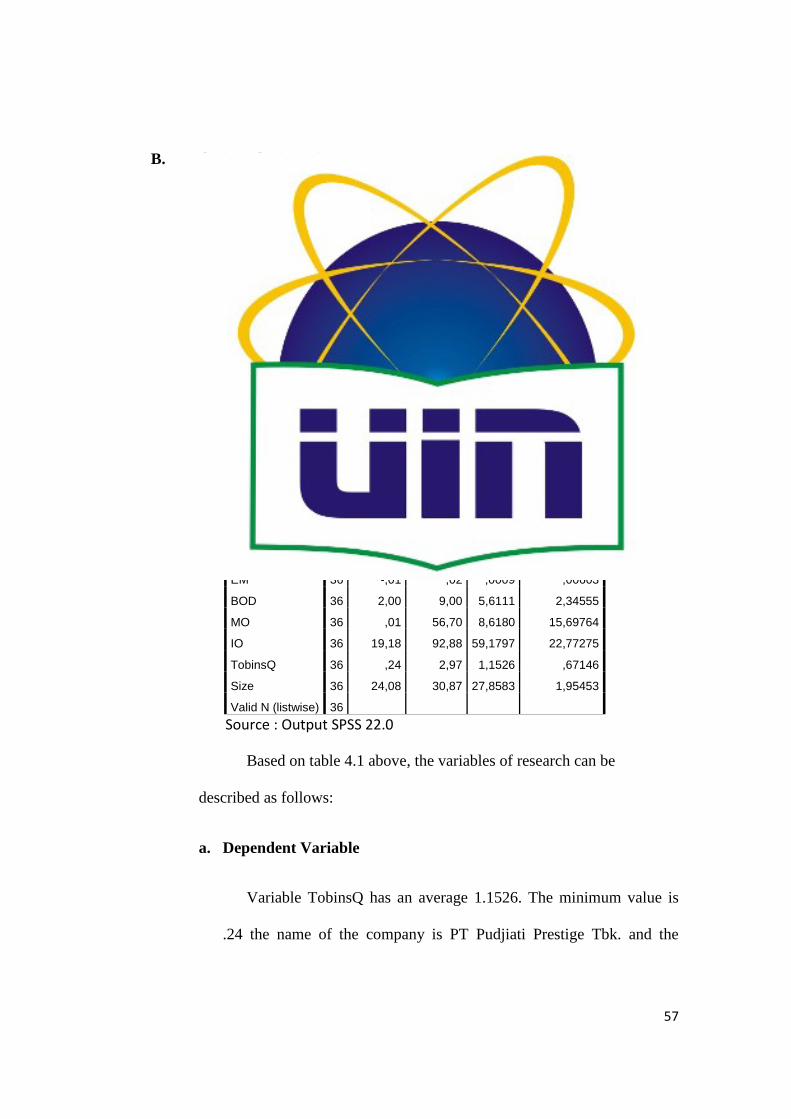
57
B. Analysis and Discussion
The data processing in this research is conducted by the statistical
application. The application used for data processing in this research is SPSS
22.0 version.
1. Descriptive Statistics
Descriptive statistics provide an overview of the minimum value,
maximum value, average value (mean) and standard deviation of the data
used in the study.
Table 4.3
Descriptive Statistics
N Minimum Maximum Mean Std. Deviation
EM 36 -,01 ,02 ,0009 ,00603
BOD 36 2,00 9,00 5,6111 2,34555
MO 36 ,01 56,70 8,6180 15,69764
IO 36 19,18 92,88 59,1797 22,77275
TobinsQ 36 ,24 2,97 1,1526 ,67146
Size 36 24,08 30,87 27,8583 1,95453
Valid N (listwise) 36
Source : Output SPSS 22.0
Based on table 4.1 above, the variables of research can be
described as follows:
a. Dependent Variable
Variable TobinsQ has an average 1.1526. The minimum value is
.24 the name of the company is PT Pudjiati Prestige Tbk. and the

58
maximum value is 2.97 that is PT Bekasi Fajar Industrial Estate Tbk.,
where as the standard deviation value is 0.67146.
b. Independent Variable
1) Earnings Management (EM)
Variable earnings management has an average 0.0009. The
minimum value is -0.1 that is PT Rista Bintang Mahkota Sejati Tbk
and the maximum value is 0.02 that is PT Rista Bintang Mahkota
Sejati Tbk., where as the standard deviation value is .00603.
2) Board of Director (BOD)
Variable Board of Director as an average 5.6111. The
minimum value is 2.00 that is PT Bumi Serpong Damai Tbk and
the maximum value is 9.00 that is PT Agung Podomoro Land Tbk,
PT Ciputra Development Tbk and PT Summarecon Agung Tbk,
whereas the standard deviation value is 2.34555.
3) Managerial Ownership (MO)
Variable Managerial Ownership has an average 8.6180.
The minimum value is 0.01 that is PT Lamicitra Nusantara Tbk
and the maximum value is 56.70 that is PT Rista Bintang Mahkota
Sejati Tbk, whereas the standard deviation value is 15.69764.

59
4) Institutional Ownership (IO)
Variable Institutional Ownership has an average .59.1797
The minimum value is 19.18 that is PT. Rista Bintang Mahkota
Sejati Tbk and the maximum value is 92.88 that is PT Lamicitra
Nusantara Tbk, whereas the standard deviation value is 22.77275.
5) Size of Company
Variable size of company has an average 27.8583. The
minimum value is 24.08 that is PT Rista Bintang Mahkota Tbk and
the maximum value is 30.87 that is PT MNC Land Tbk, whereas
the standard deviation value is 1.95453.
2. Classical Assumtion Test
a. The Result of Normality Test
Normality Data test aims to test whether the dependent variable and
independent variables both have a normal distribution or not in the
regression model. The statistical test that can be used to test whether
the residuals are normally distributed non-parametric test statistic
Kolmogorov-Smirnov (KS) by making hypotheses :
H0: the data were normally distributed residuals
Ha: the data not normally distributed residuals.

60
If the significance value greater than 0.05 then H0 is accepted and
Ha rejected, otherwise if the significance value is less than 0.05 then
H0 rejected and Ha accepted. The results of the normality data test
using Kolmogorov-Smirnov (KS) can be shown in the following table:
Table 4.4
One-Sample Kolmogorov-Smirnov Test (Model 1)
Unstandardized Residual
N 36
Normal Parametersa,b
Mean ,0000000
Std. Deviation ,38854437
Most Extreme Differences Absolute ,147
Positive ,147
Negative -,088
Test Statistic ,147
Asymp. Sig. (2-tailed) ,048c
Source : Output SPSS 22.0
Table 4.5
One-Sample Kolmogorov-Smirnov Test (Model 2)
Unstandardized Residual
N 36
Normal Parametersa,b
Mean ,0000000
Std. Deviation ,50789697
Most Extreme Differences Absolute ,123
Positive ,123
Negative -,065
Test Statistic ,123
Asymp. Sig. (2-tailed) ,182c
Source : Output SPSS 22.0

61
Table 4.6
One-Sample Kolmogorov-Smirnov Test (Model 3)
Unstandardized Residual
N 123
Normal Parametersa,b
Mean ,0000000
Std. Deviation ,09871739
Most Extreme Differences Absolute ,063
Positive ,040
Negative -,063
Test Statistic ,063
Asymp. Sig. (2-tailed) ,200c,d
Source : Output SPSS 22.0
Based on the results of statistical tests with models such as the
Kolmogorov-Smirnov contained in table can be seen from the
significance value of model 1 is 0.048, the significance value of
model 2 is 0.182 and the significance value of model 3 is 0.200. In
table model 1 the significance value is 0.048 that means that the data
not normally distributed because less than 0.05. But refers to the
assumption of the Central Limit Theorem Dielman (1961) in Ghozali
which states that for a large sample, especially more than 30
distribution of samples considered close to the normal distribution,
which means that even on the classic assumption test in the form of
normality test indicates that there is data distribution is not normal but
because observation of more than 30 then the data will still be
considered normal, because the use of 12 companies with 36
observation of the sample.

62
Normally distributed data can also be viewed using a normal plot
of the standardized residuals probably, the result is shown in Figure
below:
Figure 4.1 (Model 1)
Source : Output SPSS 22.0

63
Figure 4.2 (Model 2)
Figure 4.3 (Model 3)
Source : Output SPSS 22.0

64
Based on Figure above it can be seen that the points spread around
the diagonal line and follow the direction of a diagonal spread. Thus it
can be stated that the distribution of the data close to normal or have
met the assumptions of normality. It can also be viewed using the
histogram graph as follows:
Figure 4.4 (Model 1)
Source : Output SPSS 22.0

65
Figure 4.5 (Model 2)
Figure 4.6 (Model 3)
Source : Output SPSS 22.0

66
Histogram graph showing a normal distribution pattern because the
graph does not deviate to the left or off to the right.
b. The Result of Multicollinearity Test
Multicollinearity test is used to test the existing of perfect
relationship or near-perfect relationship between the independent
variables the regression model.
Detection of multicollinearity can be seen, that if the value of
Variance Inflation Factor (VIF) of not more than 10 and the value of
tolerance is no less than 0.1, it can be said to be free of
multicollinearity. VIF values and tolerance of other research variables
can be seen from the following table.
Table 4.7
Multicollinearity Test (Model 1)
Coefficientsa
Model
Collinearity Statistics
Tolerance VIF
1 (Constant)
EM ,975 1,025
Size ,975 1,025
a. Dependent Variable: TobinsQ
Source : Output SPSS 22.0

67
Table 4.8
Multicollinearity Test (Model 2)
Coefficientsa
Model
Collinearity Statistics
Tolerance VIF
1 (Constant)
BOD ,553 1,807
MO ,382 2,617
IO ,581 1,721
a. Dependent Variable: TobinsQ
Source : Output SPSS 22.0
Table 4.9
Multicollinearity Test (Model 3)
Coefficientsa
Model
Collinearity Statistics
Tolerance VIF
1 (Constant)
EM ,013 79,666
BOD ,521 1,920
MO ,187 5,361
IO ,408 2,449
Size ,392 2,551
EM_BOD ,072 13,876
EM_MO ,081 12,359
EM_IO ,045 22,053
a. Dependent Variable: TobinsQ
Source : Output SPSS 22.0
Based on table above, it can be concluded this research There
multicollinearity problems on table 3. Where variance inflation factor
(VIF) of earning management (EM) is 79.666, board of commissioner

68
moderate (EM_BOD) is 13.876, board of director moderate (EM_MO)
is 12.359, and audit commitee moderate (EM_IO) is 22.053.
Multicollinearity in the regression model can be ignored because of
the correlation between the independent variables that occur due to the
interaction between the independent variables (Herawati, 2008).
c. The Result of Autocorrelation Test
Autocorrelation test is used to detect the internal correlation among
the groups of a series observation arrange in a series of place and time.
Based on Ghozali (2013: 111), the criteria for the assessment of the
auto correlation are:
1) If 0 < Dw < DL there is any positive autocorrelation.
2) If DL < Dw < Du or 4-Du < D < 4-DL uncertain conclusion.
3) If 0 < Dw < DL or Du < Dw < 4-Du there is no autocorrelation.
4) If 4-DL < Dw < 4 there is any negative autocorrelation.
The basic of decision making in this test are based on Durbin-
Watson Test, which can be seen in the table below:
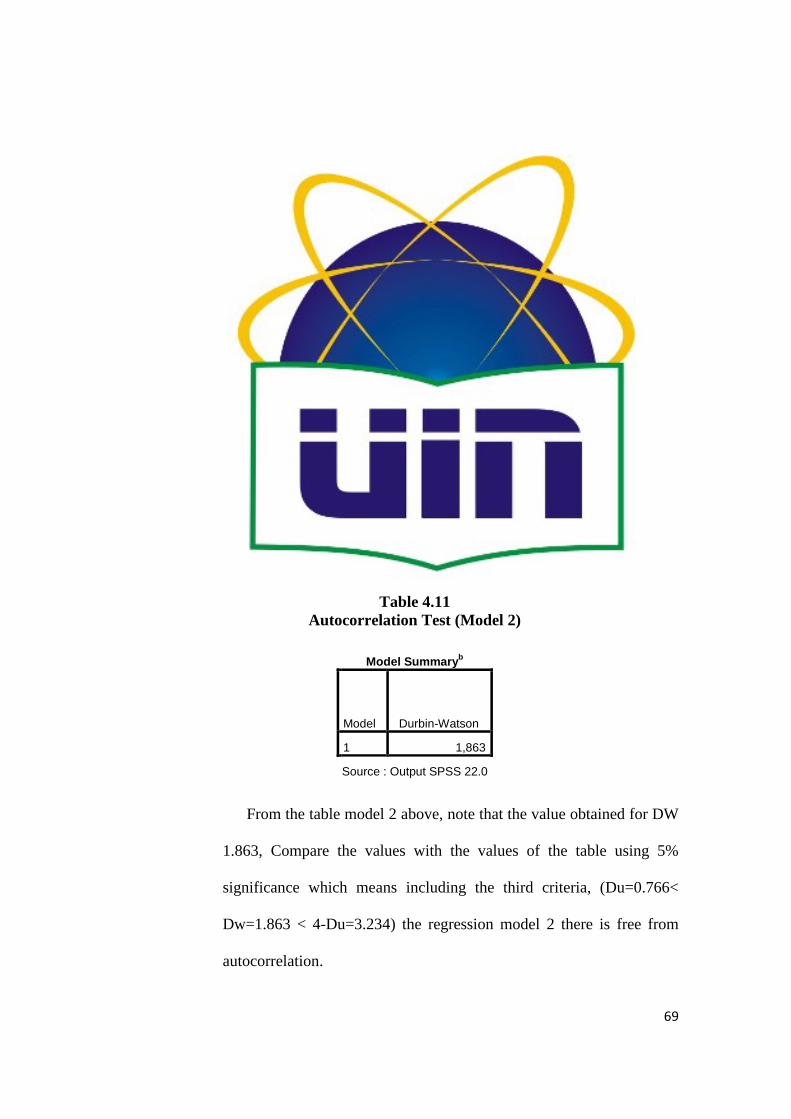
69
Table 4.10
Autocorrelation Test (Model 1)
Model Summaryb
Model Durbin-Watson
1 2,325
Source : Output SPSS 22.0
From the table model 1 above, note that the value obtained for DW
2.325, Compare the values with the values of the table using 5%
significance which means including the third criteria, (Du=1.442<
Dw=2.325 < 4-Du=2.558) so it can be concluded that the regression
model 1 free from autocorrelation.
Table 4.11
Autocorrelation Test (Model 2)
Model Summaryb
Model
Durbin-Watson
1 1,863
Source : Output SPSS 22.0
From the table model 2 above, note that the value obtained for DW
1.863, Compare the values with the values of the table using 5%
significance which means including the third criteria, (Du=0.766<
Dw=1.863 < 4-Du=3.234) the regression model 2 there is free from
autocorrelation.

70
Table 4.12
Autocorrelation Test (Model 3)
Model Summaryb
Model Durbin-Watson
1 2,337
Source : Output SPSS 22.0
From the table model 3 above, note that the value obtained for DW
2.337, Compare the values with the values of the table using 5%
significance which means including the third criteria, (Du=1.925<
Dw=2.337 < 4-Du=1.925) so it can be concluded that the regression
model 3 there is little autocorrelation in region without decision. This
is possible because the explanatory variables omitted from the model
(Rahayu 2009).
d. The Result of Heteroscedasticity Test
The presence of heteroscedasticity can be seen from the graph
Scatterplot on the basis of the analysis as follows:
1) If there is a specific pattern, such as dots form a pattern of certain
existing regular (wavy, widened and then narrowed), then the
indicate has occurred heteroskedastisitas.
2) If there is a clear pattern, as well as the points spread above and
below the number 0 on the Y axis, then there is no
heteroscedasticity.

71
The result of heteroscedasticity test can be shown in the figure as
follow :
Figure 4.7
Source : Output SPSS 22.0
Figure 4.8
Source : Output SPSS 22.0

72
Figure 4.9
Source : Output SPSS 22.0
Based on Figure 4.3 it can be seen that the points spread below and
above the number 0 on the Y axis and does not form a specific pattern,
which means that there is no heteroscedasticity in regression models.
3. Hypotesis Testing
a. Test Coefficient of Determination ( R2)
In multiple linear regression test were analyzed also the coefficient
of determination (R2). Coefficient of determination used in this study
to see the influence of the independent variable and moderating
variable to dependent variable. Value of the correlation coefficient (R)
shows how much correlation or relationship between the independent
variables with the dependent variable. The criteria of correlation
according to Sarwono (2014: 100) are:

73
Table 4.13
Criteria of Correllation Coefficient
VALUE INFORMATION
0 No correlation between variable
> 0 – 0.25 Very weak correlation
> 0.25 – 0.5 Fairly strong correlation
> 0.5 – 0.75 Strong correlation
> 0.75 – 0.99 Very strong correlation
1 Perfectly correlation
Table 4.14
Model Summaryb
Model R R Square Adjusted R Square Std. Error of the Estimate
1 ,816a ,665 ,645 ,40015
a. Predictors: (Constant), Size, EM
b. Dependent Variable: TobinsQ
Source : Output SPSS 22.0
Table 4.14 shows that the correlation coefficient (R) for 0.816,
which means that the correlation between the dependent variable with
the independent variables are very strong correlation based on the
criteria correlation coefficient value ( > 0.75 – 0.99 ) is very strong
correlation. Adjusted R Square value or coefficient of determination is
equal to 0.645. This table show that earnings management variable and
size of company variable can explain 64.5% of the amount of value of
company. While 35.5% (100%-64.5%) is explained by other variables
that are not investigated in this study e.g. Loss Loan Provision (LLP),
Loan Charge-Off (LCO), Loss Loan Allowance (LLA) and other
things.

74
Table 4.15
Model Summaryb
Model R R Square Adjusted R Square Std. Error of the Estimate
1 ,654a ,428 ,374 ,53117
a. Predictors: (Constant), IO, BOD, MO
b. Dependent Variable: TobinsQ
Source : Output SPSS 22.0
Table 4.15 shows that the correlation coefficient (R) for 0.654,
which means that the correlation between the dependent variable with
the independent variables are strong correlation based on the criteria
correlation coefficient value ( > 0.5 – 0.75 ) is strong correlation.
Adjusted R Square value or coefficient of determination is equal to
0.374. This table show that board of director, managerial ownership
and institutional variable can explain 37.4% of the amount of value of
company. While 62.6% (100%-37.4%) is explained by other variables
that are not investigated in this study e.g. Audit Committee, Board of
Commissioner Board of Independent and othe things.
Table 4.16
Model Summaryb
Model R R Square Adjusted R Square Std. Error of the Estimate
1 ,863a ,746 ,670 ,38565
a. Predictors: (Constant), EM_IO, IO, BOD, EM_MO, Size, EM_BOD, MO, EM
b. Dependent Variable: TobinsQ
Source : Output SPSS 22.0
Table 4.16 shows that the correlation coefficient (R) for 0.863,
which means that the correlation between the dependent variable with

75
the independent variables are very strong correllation based on the
criteria correlation coefficient value ( > 0.75 – 0.99 ) is very strong
correlation. Adjusted R Square value or coefficient of determination is
equal to 0.670. This table show that earnings management, size of
company, and earnings management that moderate with board of
director, managerial ownership and institutional ownership variable
can explain 67% of the amount of value of company. While 33%
(100% - 67%) is explained by other variables that are not investigated
in this study e.g. Audit Committee, Board of Commissioner, Board of
Independent and othe things.
b. Multiple Regression Analysis
This research show that the effect of earnings management and
good corporate governance indicator on company performance
(TobinsQ). Here is the result of multiple regression analysis :
Table 4.17
Multiple Regression Analysis (Model 1)
Coefficientsa
Model
Unstandardized Coefficients
B Std. Error
1 (Constant) -6,738 ,977
EM -14,085 11,348
Size ,284 ,035
a. Dependent Variable: TobinsQ
Source : Output SPSS 22.0

76
From table 4.17 above stated that the Earnings Management (EM)
negatively affect the company value (TobinsQ) and size of company
positively affect the company value (TobinsQ). It can be seen the
relation between Earnings Management (EM), and size of company to
company value (TobinsQ) as follow :
TobinsQ = -6.738 - 14.085 + 0.284Size + e
From the multiple linear regression equation above, it can be
explained for each variable as follow :
1) Constant at -6.738 units stated that if there is effect or unchanged
in X1 and X2 (EM and SIZE) then the value of company value will
be -6.738.
2) Regression coefficient of variable X1 (EM) -14.085 it shows that
the effect of earnings management on the company value is
negative or opposite direction, which means that if the value of the
earnings management variables change increased by one point,
then the value of company performance will decrease by -14.085,
with assumption other independent variables remain or unchanged.
3) Regression coefficient of variable X2 (SIZE) 0.284 it shows that
the effect of size of company on the company value is positive or
parallel, which means that if the value of the size of the company
variables change increased by one point, then the value of

77
company value will increase 0.284, with assumption other
independent variables remain or unchanged.
Table 4.18
Multiple Regression Analysis (Model 2)
Coefficientsa
Model
Unstandardized Coefficients
B Std. Error
1 (Constant) 2,956 ,568
BOD -,117 ,051
MO -,043 ,009
IO -,013 ,005
a. Dependent Variable: TobinsQ
Source : Output SPSS 22.0
From table 4.18 above stated that the board of director (BOD),
managerial ownership (MO), and institutional ownership (IO)
negatively affect the company value (TobinsQ). It can be seen the
relation between board of director (BOD), managerial ownership
(MO), and institutional ownership (IO) to company value (TobinsQ) as
follow :
TobinsQ = 2.956 - 0.117BOD - 0.043MO - 0.013IO+ e
From the multiple linear regression equation above, it can be
explained for each variable as follow :
1) Constant at 2.956 units stated that if there is effect or unchanged in
X3, X4 and X5 (BOD, MO and IO) then the value of company
value will be 2.956.

78
2) Regression coefficient of variable X3 (BOD) -0.117 it shows that
the effect of board of director on the company value is negative or
opposite direction, which means that if the value of the board of
director variables change increased by one point, then the value of
company value will decrease by -0.117, with assumption other
independent variables remain or unchanged.
3) Regression coefficient of variable X4 (MO) -0.043 it shows that
the effect of board of director on the company value is negative or
opposite direction, which means that if the value of the of
managerial ownership variables change increased by one point,
then the value of company value will decrease by -0.043, with
assumption other independent variables remain or unchanged.
4) Regression coefficient of variable X5 (IO) -0.013 it shows that the
effect of institution ownership on the company value is negative or
opposite direction, which means that if the value of the institution
ownership variables change increased by one point, then the value
of company performance will decrease by -0.013, with assumption
other independent variables remain or unchanged.

79
Table 4.19
Multiple Regression Analysis (Model 3)
Coefficientsa
Model
Unstandardized Coefficients
B Std. Error
1 (Constant) -6,329 1,737
EM -131,775 96,411
BOD -,081 ,039
MO -,009 ,010
IO -,003 ,004
Size ,293 ,053
EM_BOD 10,085 7,338
EM_MO 1,709 1,176
EM_IO ,789 ,956
a. Dependent Variable: TobinsQ
Source : Output SPSS 22.0
From table 4.19 above stated that the board of director moderate on
earnings management (EM_BOD), managerial ownership moderate on
earnings management (EM_MO) and institutional ownership moderate
on earnings management (EM_IO) positively affect the company
value. It can be seen the relation between board of director moderate
on earnings management (EM_BOD), managerial ownership moderate
on earnings management (EM_MO) and institutional ownership
moderate on earnings management (EM_IO) to company value
(TobinsQ) as follow :
TobinsQ = -6.329 + 10.085EM_BOD + 1.709EM_MO -
0.789EM_IO + e

80
From the multiple linear regression equation above, it can be
explained for each variable as follow :
1) Regression coefficient of variable X6 (EM_BOD) 10.085 it shows
that the effect of board of director moderate on earnings
management on the company value is positive or paraller, which
means that if the value of the board of director moderate on
earnings management variables change increased by one point,
then the value of company value will increase by 10.085, with
assumption other independent variables remain or unchanged.
2) Regression coefficient of variable X7 (EM_MO) 1.709 it shows
that the effect of managerial ownership moderate on earnings
management on the company value is positive or paraller, which
means that if the value of the of managerial ownership moderate
variables change increased by one point, then the value of
company value will increase by 1.709, with assumption other
independent variables remain or unchanged.
3) Regression coefficient of variable X8 (EM_IO) 0.789 it shows that
the effect of institutional ownership moderate on earnings
management on the company value is positive or paraller, which
means that if the value of the institutional ownership variables
change increased by one point, then the value of company

81
performance will increase by 0.789, with assumption other
independent variables remain or unchanged.
c. Simultaneous Significant Test (F-Test)
The F test of hypothesis testing is used to see whether the overall
independent variables have a significant effect on the dependent
variable. From the test results simultaneously obtained as follows:
Table 4.20
Simultaneous Significant Test (Model 1)
ANOVAa
Model Sum of Squares df Mean Square F Sig.
1 Regression 10,496 2 5,248 32,777 ,000b
Residual 5,284 33 ,160
Total 15,780 35
a. Dependent Variable: TobinsQ
b. Predictors: (Constant), Size, EM
Source : Output SPSS 22.0
From the table 4.20, the results of the calculation of the F test
statistic is 32.777 with probability 0.000. Because the probability is
smaller than 0.05, which means regression model can use to predict
company value or earnings management (EM and size of company
variables significant and simultaneously effect to company value
(TobinsQ).

82
Table 4.21
Simultaneous Significant Test (Model 2)
ANOVAa
Model Sum of Squares df Mean Square F Sig.
1 Regression 6,751 3 2,250 7,976 ,000b
Residual 9,029 32 ,282
Total 15,780 35
a. Dependent Variable: TobinsQ
b. Predictors: (Constant), IO, BOD, MO
Source : Output SPSS 22.0
From the table 4.21, the results of the calculation of the F test
statistic is 7.976 with probability 0.000. Because the probability is
smaller than 0.05, which means regression model can use to predict
company value or board of director (BOD), managerial ownership
(MO) and institutional ownership variables significant and
simultaneously effect to company value (TobinsQ).
Table 4.22
Simultaneous Significant Test (Model 3)
ANOVAa
Model
Sum of
Squares df Mean Square F Sig.
1 Regression 11,764 8 1,471 9,888 ,000b
Residual 4,016 27 ,149
Total 15,780 35
a. Dependent Variable: TobinsQ
b. Predictors: (Constant), EM_IO, IO, BOD, EM_MO, Size, EM_BOD, MO, EM
Source : Output SPSS 22.0
From the table 4.22, the results of the calculation of the F test
statistic is 9.888 with probability 0.000. Because the probability is
smaller than 0.05, which means regression model can use to predict

83
company value or board of director moderate on earnings management
(EM_BOD), managerial ownership (EM_MO) moderate on earnings
management and institutional ownership (EM_IO) moderate on
earnings management (EM_AC) variables significant and
simultaneously effect to company value (TobinsQ).
d. Significant Partial Test (T-Test)
Statistical t-test performed to further investigate which of the
independent variables in influencing the dependent variable. The
hypothesis that will be tested as follows:
Table 4.23
Partial Test Result (Model 1)
Coefficientsa
Model
Unstandardized Coefficients Standardized Coefficients
t Sig. B Std. Error Beta
1 (Constant) -6,738 ,977 -6,898 ,000
EM -14,085 11,348 -,127 -1,241 ,223
Size ,284 ,035 ,826 8,096 ,000
a. Dependent Variable: TobinsQ
Source : Output SPSS 22.0

84
Table 4.24
Partial Test Result (Model 2)
Coefficientsa
Model
Unstandardized Coefficients Standardized Coefficients
t Sig. B Std. Error Beta
1 (Constant) 2,956 ,568 5,201 ,000
BOD -,117 ,051 -,409 -2,273 ,030
MO -,043 ,009 -1,016 -4,697 ,000
IO -,013 ,005 -,443 -2,525 ,017
a. Dependent Variable: TobinsQ
Source : Output SPSS 22.0
By Seeing Table above, the results of significant test partial (T-Test)
are as follows:
1) Earnings Management Variable
Earnings management on table 4.23 has a significant level
0.223 greater than the significant standard level 0.05.
Coefficient regression for earnings management is -14.085
which shows a negative direction to company value that
indicate if earnings management change increased by one
point, then the fim value will decrease by -14.085. This
describe that earnings management have negative effect not
significant on company value.
Earnings management is the management's efforts to change
the financial statements aimed at misleading the shareholders
who want to know the performance of the company or to
influence contractual outcomes that rely on accounting

85
numbers that report. Nonetheless, as an earnings management
action to increase or decrease profit by selecting accounting
policies by management that are subjective, then the earnings
management, especially in the long run will reduce the firm
value.
Based on agency theory that an agency relationship may create
conflicts of interest between the owner and the manager.
contract made with the hope to minimize conflicts of interest.
The results of this study found that earnings management
actions carried out by the manager would not give a favorable
reaction that will have an impact on increasing the firm value
that reflected in the company's stock price. So, when the goal
that owned by manager and investor are different the agency
conflict cannot be avoided in the company. The management
will be detrimental to the owners of capital to behave
unethically in conducting the accounting fraud. Agency
conflicts that occur within a company can have an impact on
the quality of the profit generated, it is because the managers
will act opportunistic. Earnings are opportunistic certainly be
detrimental to some parties who have a low quality will not
represent the information that actually represent. Thus earnings
are low-quality highly detrimental to the investors and the

86
company will alsodeprimental because it is related to the firm
value that reflected in the price of shares traded.
The results of this study are consistent with research by
Herawaty (2008), Pamungkas (2012), and Kamil (2014) that
state earnings management negatively affect the firm value.
2) Size of Company Variable
Size of company has a significant level 0.000 smaller than the
significant standard level 0.05. Coefficient regression for size
of company is 0.284 which shows positive direction to
company value that indicate if size of company change
increased by one point, then the value of company performance
will decrease by 0.284. This describe that size of company had
a significant effect on company performance. The results of
this study are consistent with research by Herawaty (2008) that
state the size of the company has a positive influence on the
value of the company, the larger the company the greater the
value of the company.
3) Board of Director Variable
Board of commissioner has a significant level 0.030 greater
than the significant standard level 0.05. Coefficient regression
for board of director is -0.117 which shows a negative direction
to company value that indicate if board of director change
increased by one point, then the value of company performance

87
will decrease by -0.117 . This describe that board of director
have negative effect significant on company value. The
company has a large of board of director size cannot do the
coordination, communication, and decision-making better than
the company that has a smaller board of director. The results of
this study are consistent with research by Febriyanto (2013),
Amyulianthy (2012), Dalton et.al.(1999) find the effect
between Board of Directors size and company performance.
4) Managerial Ownership Variable
Board of director has a significant level 0.000 smaller than the
significant standard level 0.05. Coefficient regression for
managerial ownership is -0.043 which shows a negative
direction to company value. This describe that board of director
have negative effect significant on company value. That
indicate if board of director change increased by one point,
then the value of company performance will decrease by -
0.043. Managerial ownership is a mechanism to reduce agency
problems of managers, by aligning the interests of managers
and shareholders (Jensen and Meckling, 1976 in Herawaty,
2008). Thus, if the manager is expected to have the company's
shares are high, is expected to improve the company's
performance as a manager will be more motivated to improve
their performance as a result of reciprocity will be accepted the

88
manager will increase with the improved performance of the
company which will increase the stock price and the value of
the company. However, Siswantaya (2007) argues when
managerial ownership of a company is too high, it will cause
security problems. This means that if the managerial ownership
is too high, the manager will have a strong position in
controlling the company, and external parties will find it
difficult to control the actions of managers. The results of this
study are consistent with research by Siallagan and Machfoedz
(2006) and Kamil (2014) that state managerial ownership is
statistically negative effect on firm value.
5) Institutional Ownership Variable
Institutional ownership has a significant level 0.017 smaller
than the significant standard level 0.05. Coefficient regression
for board of commissioner is -0.013 which shows a negative
direction to company value. This describe that institutional
ownership had negative effect significant on company
performance. That indicate if institutional ownership change
increased by one point, then the value of company performance
will decrease by -0.013. The majority owner of the institution
involved in the control of companies that tend to act in their
own interests although sacrifice the minority owners so in long
term can make the firm value will be decrease. The results of

89
this study are consistent with research by Sudarma (2003),
Sujoko and Soebiantoro (2007) that found that institutional
ownership have negative effect to company value. This result
contrast with Kamil (2014) that state institutional ownership
have positive significant effect to firm value.
a. Moderate Regression Analysis
Table 4.25
Partial Test Result (Model 3)
Coefficientsa
Model
Unstandardized Coefficients Standardized Coefficients
t Sig. B Std. Error Beta
1 (Constant) -6,329 1,737 -3,643 ,001
EM -131,775 96,411 -1,184 -1,367 ,183
BOD -,081 ,039 -,284 -2,108 ,044
MO -,009 ,010 -,205 -,912 ,370
IO -,003 ,004 -,088 -,579 ,567
Size ,293 ,053 ,854 5,509 ,000
EM_BOD 10,085 7,338 ,497 1,374 ,181
EM_MO 1,709 1,176 ,496 1,454 ,158
EM_IO ,789 ,956 ,376 ,825 ,417
a. Dependent Variable: TobinsQ
Source : Output SPSS 22.0
1) Board of director moderate Variable
Board of director moderate has a significant level 0.181 greater
than the significant standard level 0.05. Coefficient regression
for board of director moderate is 10.085 which shows a
positive direction to company value. This describe that board of

90
director have positive effect significant on company value.
That indicate if board of director moderate change increased by
one point, then the value of company performance will increase
by 10.085. The result show that earnings management to firm
value weakens by board of director as moderating variable.
2) Managerial Ownership moderate Variable
Managerial ownership moderate has a significant level 0.158
greater than the significant standard level 0.05. Coefficient
regression for board of director moderate is 1.709 which shows
a positive direction to firm value. This describe that managerial
ownership have positive effect significant on company value.
That indicate if managerial ownership change increased by one
point, then the value of company performance will increase by
1.709. The result show that earnings management to firm value
weakens by managerial ownership as moderating variable.
3) Institutional Ownership moderate Variable
Institutional ownership moderate has a significant level 0.417
greater than the significant standard level 0.05. Coefficient
regression for board of director moderate is 0.789 which shows
positive direction to company value. This describe that
institutional ownership moderate have positive effect not
significant on company value. That indicate if institutional
ownership moderate change increased by one point, then the

91
firm value will increase by 0.789. The result show that
earnings management to firm value weakens by institutional
ownership as moderating variable. The results of this study
reinforce previous research by Herawaty (2008) and the
Dervish (2010) which states that the Institutional Ownership
has a positive influence on the relationship between earnings
management with firm values.

92
CHAPTER V
CONCLUSION AND RECOMMENDATION
A. Conclusion
The purpose of this research is to find out the influence of earnings
management to firm value and board of director (BOD) managerial ownership
(MO) and institutional ownership (IO) as moderating variable in real estate
and properties company listed on the Indonesia Stock Exchange from the
period 2012 until 2014. Based on test results with three regression models
found the conclusions are as follows:
1. Based on significant partial test (T-Test), Earnings management (EM) do
not have significant influence to the firm value with coefficient regresion
negative that shows earnings management can decrease the company
value. While size of company have significant effect to the firm value with
coefficient positive that show larger the company the greater the firm
value.
2. Based on significant partial test (T-Test), board of director as moderating
do not have significant effect to the firm value with coefficient positive
that show corporate governance especially board of director have positive
effect as moderating on firm value.
3. Based on significant partial test (T-Test), managerial ownership as
moderating do not have significant effect to the firm value with

93
coefficient positive that show corporate governance especially
mannagerial ownership have positive effect as moderating on firm value.
4. Based on significant partial test (T-Test), institutional ownership as
moderating do not have significant effect to the firm value with
coefficient positive that show corporate governance especially institutional
ownership have positive effect as moderating on firm value.
B. Recommendation
1. Measurement of corporate governance mechanism in this study only use
board of directors managerial ownership and institutional ownership. It is
expected to further research can add measurement variable corporate
governance mechanisms, such as managerial ownership and institutional
ownership.
2. Measurement of earning management mechanism in this study only use
Disretionare accrual. It is expected to further research can add
measurement variable earnings management mechanisms, such as Loss
Loan Provision and Loss Loan Allowance.
3. The study period was relatively short, lasting only three years. So it may
not be able to feel the impact of corporate governance mechanisms.
Researchers further suggested using a longer study period so that it can be
felt the impact of corporate governance mechanisms.
4. Sample companies in this study was relatively small. It is hoped further
research using larger sample, such as all companies listed in Indonesia
Stock Exchange.

95
REFERENCES
Ali, Irfan, ”Pelaporan Keuangan dan Asimetri Informasi dalam Hubungan
Agensi”, Lintasan Ekonomi Vol. XIX. No.2 Juli, 2002.
Amyulianthy, Rafriny. "Pengaruh Struktur Corporate Governance Terhadap
Kinerja Perusahaan Publik Indonesia". Jurnal. Universitas Pancasila.
Jakarta. 2012
Barnae Amir and Amir Rubin. " Corporate Social Resposibility as a Conflict
Between Shareholders". Financial and Banking Journal. Vol. 16, No. 2.
2005.
Beasley, Mark S., "An Empirical Analysis of the Relation Between The Board of
Director Composition and Financial Statement Fraud". The Accounting
Review Vol. 71, No. 4, October: 443-465. 1996.
Berle and Means. “The Modern Corporation and Private Property”,
Transaction Publisher, 1932.
Boediono, Gideon. S.B. "Kualitas Laba: Studi Pengaruh Mekanisme Corporate
Governance dan Dampak Manajemen Laba dengan Menggunakan Analisis
Jalur". Article Simposium Nasional Akuntansi (SNA) VIII, Solo. 2010.
Bukhori,Iqbal,”Pengaruh Good Corporate Governance dan Ukuran Perusahaan
terhadap Kinerja Perusahaan”, Undergraduate thesis, Diponegoro
University, 2012.
96
Brigham, Eugene F. and Joel F. Houston, “Fundamentals of Financial
Management”, Ninth Edition, Horcourt College, United States of
America, 2001.
Christiawan, Y.J. and Tarigan, J. "Kepemilikan Manajerial: Kebijakan Hutang,
KInerja dan Nilai Perusahaan". Jurnal Akuntansi dan Keuangan Vol. 9, No.
I, 2007.
Cornett M. M, J. Marcuss, Saunders and Tehranian H. “Earnings Management,
Corporate Governance, and True Financial Performance, 2006.
Darmawati, Deni et.al, “Hubungan Corporate Governance Dan Kinerja
Perusahaan”. Simposium Nasional Akuntansi Vol. VII 2-3 Desember,
Denpasar, 2004.
Darwis, Herman. "Manajemen Laba Terhadap Nilai Perusahaan Dengan
Corporate Governance Sebagai Pemoderasi". Jurnal Keuangan dan
Perbankan, Vol. 16, No.1, Januari 2012, Hal 45-55, 2012.
Dechow, Patricia, Sloan, Richard G. and Sweeney, Amy P. "Detecting Earnings
Management". Accounting Review, April : 193-225. 1995.
Faisal, “Analisis Agenci Cost, Struktur Kepemilikan, dan Mekanisme Corporate
Governance”, VII Accounting National Symposium, Denpasar, 2004.
FCGI (Forum for Corporate Governance in Indonesia), “ The Roles of the Board
of Commissioners and the Audit Committee in Corporate Governance”,
(Seri Tata Kelola Perusaaan (Corporate Governance) Jilid II, 2001

97
Gumanti, Tatang Ary. “Earnings Management : Suatu Telaah Pustaka”, Jurnal
Kuntansi dan Keuangan Vol. 2 November, Universitas Kristen Petra,
2000.
Ghozali, Imam. “ Analisis Multivariat dan Ekonometrika Teori, Konsep dan
Aplikasi dengan Eviews 8”, 2013.
Hastuti, Theresia Dwi, “Hubungan Corporate Governance dengan Kinerja
Keuangan ( Studi Kasus pada Perusahaan yang listing di Bursa Efek
Jakarta”. Jurnal Akuntansi dan Keuangan, 2005.
Hardikasari, Eka, “Pengaruh Penerapan Good Corporate Governance terhadap
Kinerja Keuangan pada Industri Perbankan yang terdaftar di Bursa Efek
Indonesia (BEI) tahun 2006-2008”, Undergraduate Thesis, Diponegoro
University, Semarang, 2011.
Heally, P.M and Wahlen, J.M, “A Review of The Earnings Management
Literature and its Implication for Standard Setting”, Accounting Horizon
(December), p 365-383, 1999.
Herawaty, Vinola. “Peran Praktek Corporate Governance Sebagai Moderating
Variable dari Pengaruh Earning Management terhadap Nilai
Perusahaan”, Jurnal Akuntasi Keuangan No. 10, 2008.
Igra, “The Influence of Board of Commissioners’ Characteristics on Earning
management; In Case of Banking Company Listed in Indonesia Stock
Exchange”, Undergraduate Degree Thesis, Andalas University of
Indonesia, 2012.
Indonesia Stock Exchange, www.idx.co.id. Access on February 15th
, 2015

98
Indriantoro, Nur and Supomo, Bambang. “Metodologi Penelitian Bisnis
untuk Akuntansi & Manajemen”. Edisi revisi, BDFE Yogyakarta, 2009.
Jensen, M.C. and Meckling, W.H, “Theory of The Firm: Managerial
Behavior, Agency Cost, and Ownership Structure”. Journal of Financial
Economics, Vol. 76, pp. 305-360, 1976.
Jones, J. "Earnings Management During Import Relief Investigations". Journal of
Accounting Research 29: 193-228. 1991.
Kamil, Fauzan. "Pengaruh Manajemen Laba Terhadap Nilai Perusahaan dengan
Mekanisme Corporate Governance Sebagai Variabel Moderating",
Undergraduate Degree Thesis, Universitas Telkom, 2014
Klapper, Leora. F. & I. Love, “Corporate Governance, Investor Protection and
Performance in Emerging Market”. World Bank Working Paper. http://
ssrn. com, 2002.
KNKG (Komite Nasional Kebijakan Governance), “Pedoman Umum Good
Corporate Governance”, 2006.
Latifah dan P, Nurul. “Adakah Perilaku Oportunistik dalam Aplikasi Agency
Theori di Sektor Publik”, Jurnal Fokus Ekonomi Vol. 5 No. 2. Semarang,
STIE Pelita Nusantara, 2010.
Merchant, K.A., 1981. "The Design of Corporate Budgeting System: Influence on
Managerial Behaviour and Performance". The Accounting Review, 1981.
Midiastuty, Pratana Puspa and Mas’ud Machfoedz. “Analisa Hubungan
Mekanisme Corporate Governance dan Indikasi Manajemen Laba”.
Simposium Nasional Akuntansi VI. Surabaya. 2003.

99
Murhadi, Werner R. “Good Corporate Governance and Earnings Management
Practices: An Indonesian Cases”. 2009. http://ssrn.com. Access on
January 21th
, 2015.
Purbaningsih, Yoppy Palupi,” The Effect Of Liquidity Risk and Non Performing
Financing (NPF) Ratio to Commercial Sharia Bank Profitability in
Indonesia", STIE EKUITAS Indonesia, 2013.
Richardson Vernon J, ".Information Asymmetry and Earning Management: Some
Evidence" Working Paper, 1998.
Sarwono, Jonathan, “RisetSkripsidanTesisdengan SPSS 22”, Elex Media
Komputindo, Jakarta, 2014.
Scott, William R, "Financial Acconting theory”, 4th Edition. Canada Inc : Pearson
Education, 2006.
Sekaran, Uma and Bougie, Roger, “Research Methods for Business”, Great
Britain, John Wiley & Sons Ltd, 2010.
Siallagan, Hamonangan. Machfoedz. “Mekanisme Corporate Governance,
Kualitas Laba dan Nilai Perusahaan”, Simposium Nasional Akuntansi
IX (Padang), 2006.
Siswantaya, I Gede. "Mekanisme Corporate Governance dan Manajemen Laba".
Tesis S2. Universitas Diponegoro : Semarang, 2007.
Sudarma, Made, "Pengaruh Struktur Kepemilikan saham, Faktor Intern, Faktor
Ekstern terhadap Struktur Modal dan Nilai Perusahaaan", Disertasi
program Pasca sarjana Universitas Brawijaya malang, 2003

100
Sugiyono, “Metode Penelitian Kuantitatif Kualitatif dan R&D, Edisi Pertama,
Cetakan Ketiga” ifabeta, Bandung, 2009.
Sumantoro, “Pengantar Tentang Pasar Modal Di Indonesia”, Jakarta : Ghalia
Indonesia, 1990.
Tarjo, “Analisa Free Cash Flow dan Kepemilikan Manajerial terhadap Kebijakan
Hutang pada Perusahaan Mempublik di Indonesia”. Tesis S2 Program
Pasca sarjana UGM, Yogyakarta, 2002.
Tjager. IN., Alijoyo, F.A., Djemat, H.R, and Soembodo, B, “Corporate
Governance: Tantangan dan Kesempatan Bagi komunitas Bisnis
Indonesia, Serial Mastering Good Corporate Governance”, Prenhallindo,
Jakarta, 2003.
Ujiyantho, Muh. Arif and Bambang Arif Pramuka, ” Mekanisme Corporate
Governance, Manajemen Laba dan Kinerja Keuangan”, Simposium
Nasional Akuntansi X, Makasar, 26-28 Juli, 2007.
Warsono, Sony., Fitri Amalia and Kartika Rahajeng. CGCG UGM’s "Corporate
Governance Rating Model". Yogyakarta: CGCG UGM. 2010.
Watts R. and J.L. Zimmerman, ”Positive Accounting Theory", New York:
Prentice Hall, 1986.
Weterings, Josephus P et al., “The Impact of Board Size on Firm Value:
Evidence from The Asian Real Estate Industry”, 2011.
William R. Scott, “Financial Accounting Theory” Third Edition, Pearson
Education Canada Inc., 2003.

101
APPENDIX I
List of Data
CODE YEARS EM BOD MO IO TOBINSQ SIZE
APLN 2012 -0,00490449 9 3,098 67,04 1,081346 29,65719
ASRI 2012 0,002904854 5 0 46,99 1,644756 30,09824
BAPA 2012 -0,019891111 3 0 69,92 1,619373 25,94908
BCIP 2012 0,008138418 5 0 52,43 1,482623 26,60234
BEST 2012 -0,008829355 3 0,07 74,7 2,96969 29,46717
BIPP 2012 0,00538633 3 0 54,58 1,604334 25,98328
BKDP 2012 -0,004684359 4 15,72 42,16 0,993258 27,19053
BKSL 2012 -0,002254306 9 0 48,35 1,1816 29,41172
BSDE 2012 -0,000412214 10 0 63,12 1,530531 30,59741
COWL 2012 -0,001047393 3 0 94,74 0,754114 27,26945
CTRA 2012 0,013636843 9 0,204 30,63 1,539307 30,12692
CTRP 2012 0,014174424 8 0 57,93 1,004693 28,95318
CTRS 2012 -0,00312106 8 0 62,66 1,505365 29,12447
DART 2012 0,010489387 5 0 89,66 0,895122 28,50125
DILD 2012 -0,000497022 8 0 42,13 0,921472 28,87591
DUTI 2012 -0,000350639 9 0 88,56 1,073842 29,36135
EMDE 2012 0,003177865 4 7,86 71,86 0,938019 26,87387
FMII 2012 -0,004894797 4 0 87,87 2,173737 27,22552
GAMA 2012 -0,008217771 3 0 60 3,005691 28,88428
GMTD 2012 -0,001994296 6 0 65 0,814585 24,92818
GPRA 2012 0,007552295 3 0 84,75 1,214209 27,6146
GWSA 2012 0,000385862 4 0 79,49 1,031694 28,17111
JRPT 2012 0,002215083 5 0 79,12 8,533334 31,31677
KIJA 2012 0,003508067 4 0 17525 0,998301 29,00812
KPIG 2012 0,000122139 5 8,13 51,95 1,953185 29,20229
LAMI 2012 7,82278E-06 7 0,01 92,88 0,894616 26,23229
LCGP 2012 0,007734602 3 0,17 23,77 1,343263 26,20088
LPCK 2012 0,000793755 5 0 42,2 1,38338 28,47009
LPKR 2012 0,003115273 8 0 18,12 1,466753 30,76989
MDLN 2012 0,010563938 4 0 41,15 1,347691 28,97195
MTSM 2012 0,00171226 2 0 82 1,731769 25,81698
OMRE 2012 -0,003936961 6 0,07 90,43 1,054743 27,09415
PLIN 2012 0,000451423 5 0 88,84 1,890754 29,38039
PUDP 2012 -0,000158817 2 26,91 59,64 0,295983 25,76022
PWON 2012 0,006311819 6 0,03 70,39 2,017831 30,01389
RBMS 2012 -0,000676584 3 50,31 19,18 0,366531 24,56747
RDTX 2012 0,008255257 4 1,03 75,23 0,989753 27,57

102
CODE YEARS EM BOD MO IO TOBINSQ SIZE
RODA 2012 -0,004681279 5 0 68,9 2,232328 29,10798
SCBD 2012 0,014063414 4 0,001 82,41 3,053914 29,93023
SMDM 2012 0,000133007 4 0 87,09 0,542146 27,53308
SMRA 2012 -0,003944584 7 0,28 41,82 0,6769 26,43024
APLN 2013 -0,005334339 9 3,092 67,04 0,857468 29,11437
ASRI 2013 0,001804637 5 0 51,8 1,216069 29,7651
BAPA 2013 -0,002406326 3 0 70,37 0,976219 25,20426
BCIP 2013 -0,005191997 5 0 52,43 2,001332 27,20118
BEST 2013 0,009546985 4 0,07 61,39 1,538083 29,08612
BIPP 2013 -0,004761765 3 0 66,35 0,904721 26,33238
BKDP 2013 -0,003863017 4 15,72 42,16 0,993556 27,09522
BKSL 2013 0,008663516 6 0 41,58 0,817122 29,22622
BSDE 2013 0,001183857 9 0 63,12 1,405625 30,74769
COWL 2013 -0,003476297 2 0 93,5 1,569118 28,45934
CTRA 2013 0,003355043 8 0,206 30,63 1,335009 30,11434
CTRP 2013 -0,004492041 8 0 58,04 1,026975 29,07641
CTRS 2013 -0,001963029 8 0 62,66 1,304825 29,07901
DART 2013 -4,97123E-05 5 0 89,66 0,679401 27,96601
DILD 2013 -0,003170672 8 0 42,13 0,889616 28,81436
DUTI 2013 0,000414752 7 0 88,56 1,298879 29,74471
EMDE 2013 0,010832682 4 0 74,22 0,905234 26,87387
FMII 2013 0,001745928 4 0 87,87 2,777266 27,67751
GAMA 2013 0,007466492 3 0 59,92 0,966437 27,63205
GMTD 2013 0,001343291 5 0 65 1,335829 27,45995
GPRA 2013 -0,001155325 3 0 84,75 0,883622 27,1938
GWSA 2013 -0,006261095 4 0,04 79,49 0,72897 27,84639
JRPT 2013 0,000515213 5 0 75,95 2,276839 29,98743
KIJA 2013 0,005043188 5 0 19,967 0,963343 28,98774
KPIG 2013 0,001094153 6 0,37 82,58 1,006633 29,44685
LAMI 2013 -0,000194913 7 0,01 92,88 0,746184 26,0378
LCGP 2013 -0,000112268 3 0 63,89 1,01907 28,13877
LPCK 2013 0,000763251 4 0 42,2 1,408367 28,85274
LPKR 2013 0,002283646 6 0 18,12 1,217971 30,67558
MDLN 2013 0,00454675 4 0 36,91 1,021994 29,21778
MTSM 2013 -0,003348072 3 0 80,95 1,795814 25,80259
OMRE 2013 -3,91451E-05 7 0,07 90,43 1,066988 27,10897
PLIN 2013 0,000660173 5 0 89,07 2,128294 29,55029
PUDP 2013 -0,000625419 2 26,91 59,64 0,244356 25,78706
PWON 2013 0,000911435 7 0,03 52,19 1,957102 30,19621
RBMS 2013 -0,01262748 3 50,36 19,2 0,371176 24,11548

103
CODE YEARS EM BOD MO IO TOBINSQ SIZE
RDTX 2013 -0,008281308 3 1,27 81,74 1,109611 27,90647
RODA 2013 -0,008252833 5 0 68,31 2,597808 29,442
SCBD 2013 0,030572384 5 0 82,41 1,842182 29,82487
SMDM 2013 6,88932E-05 4 0 89,16 0,43822 26,91103
SMRA 2013 0,002043967 9 0,28 41,82 0,678208 26,29409
APLN 2014 0,008876925 8 3,098 67,04 0,932658 29,55787
ASRI 2014 2,07727E-05 5 0 51,48 1,273716 30,02925
BAPA 2014 0,006849925 3 0,13 76,89 0,829946 24,96585
BCIP 2014 0,000484193 4 0 58,02 2,44124 27,72727
BEST 2014 -8,36305E-05 3 0,07 57,96 2,147466 29,5828
BIPP 2014 0,001735348 3 0 66,35 0,733286 26,38644
BKDP 2014 -0,000306895 4 15,72 42,16 1,143546 27,29816
BKSL 2014 0,00496443 6 0 41,58 0,699313 28,81437
BSDE 2014 -4,53579E-05 9 0 64,88 1,522051 31,1324
COWL 2014 0,006785416 3 0 93,32 1,460712 28,74436
CTRA 2014 0,00481206 8 0,2 30,63 1,681435 30,65387
CTRP 2014 0,006694097 9 0 58,04 1,105738 29,27905
CTRS 2014 -9,99415E-05 9 0 62,66 1,463785 29,39873
DART 2014 -0,000375533 4 0 89,66 0,782827 28,39002
DILD 2014 -0,006021626 8 0 42,13 1,251823 29,53876
DUTI 2014 -0,000127599 8 0 88,56 1,346395 29,83135
EMDE 2014 0,006016074 4 0 74,22 0,877852 26,85221
FMII 2014 -0,00214124 4 0 87,87 3,037036 27,83129
GAMA 2014 0,004000424 2 0 59,92 0,495899 26,69166
GMTD 2014 -0,001615998 5 0 65 0,96922 27,15199
GPRA 2014 0,007066526 3 0 83,59 1,058954 27,61024
GWSA 2014 0,006270568 4 0,04 79,49 0,732136 27,93654
JRPT 2014 0,000176624 5 0 79,61 2,569547 30,24792
KIJA 2014 0,001281048 5 0 19,967 1,153737 29,41767
KPIG 2014 0,000766604 7 1,64 53,32 2,760724 30,8722
LAMI 2014 0,000115583 7 0,01 92,88 0,876844 26,48927
LCGP 2014 -1,55267E-05 3 0 39,64 2,0819 28,88321
LPCK 2014 -0,000593912 4 0 42,2 2,059658 29,61042
LPKR 2014 0,000299122 7 0 23,44 1,156067 30,78969
MDLN 2014 0,003178865 4 0 35,96 1,113535 29,50547
MTSM 2014 0,000721292 3 0 80,95 1,857704 25,80259
OMRE 2014 0,00482259 7 0,07 90,43 0,936247 27,10897
PLIN 2014 0,001811927 6 0 89,46 3,408258 30,21972
PUDP 2014 -0,000687396 2 26,91 59,64 0,282847 25,70231
PWON 2014 0,000643141 7 0,03 57,61 1,984986 30,84195

104
CODE YEARS EM BOD MO IO TOBINSQ SIZE
RBMS 2014 0,016857195 3 56,7 19,18 0,323611 24,08196
RDTX 2014 0,007735484 3 1,27 84,19 1,036159 27,97546
RODA 2014 0,001892163 5 0 68,31 1,733482 29,1022
SCBD 2014 -0,000368867 6 0 82,53 1,484124 29,52476
SMDM 2014 1,34633E-05 4 0 95,18 0,513745 27,23482
SMRA 2014 0,001877191 9 0,28 37,68 0,649241 27,11741
Source : Data Process
Table 4.2
List of Companies Sample
Source : Data Process
No Company Code
1 Agung Podomoro Land Tbk. APLN
2 Bekasi Fajar Industrial Estate Tbk. BEST
3 Bukit Darmo Property Tbk. BKDP
4 Ciputra Development Tbk. CTRA
5 MNC Land Tbk. KPIG
6 Lamicitra Nusantara Tbk. LAMI
7 Indonesia Prima Property Tbk. OMRE
8 Pudjiati Prestige Tbk. PUDP
9 Pakuwon Jati Tbk. PWON
10 Rista Bintang Mahkota Sejati Tbk. RBMS
11 Roda Vivatex Tbk. RDTX
12 Summarecon Agung Tbk. SMRA

105
APPENDIX II
Table 4.3
Descriptive Statistics
N Minimum Maximum Mean Std. Deviation
EM 36 -,01 ,02 ,0009 ,00603
BOD 36 2,00 9,00 5,6111 2,34555
MO 36 ,01 56,70 8,6180 15,69764
IO 36 19,18 92,88 59,1797 22,77275
TobinsQ 36 ,24 2,97 1,1526 ,67146
Size 36 24,08 30,87 27,8583 1,95453
Valid N (listwise) 36
Source : Output SPSS 22.0
Table 4.4
One-Sample Kolmogorov-Smirnov Test (Model 1)
Unstandardized Residual
N 36
Normal Parametersa,b
Mean ,0000000
Std. Deviation ,38854437
Most Extreme Differences Absolute ,147
Positive ,147
Negative -,088
Test Statistic ,147
Asymp. Sig. (2-tailed) ,048c
Source : Output SPSS 22.0
Table 4.5
One-Sample Kolmogorov-Smirnov Test (Model 2)
Unstandardized Residual
N 36
Normal Parametersa,b
Mean ,0000000
Std. Deviation ,50789697
Most Extreme Differences Absolute ,123
Positive ,123
Negative -,065
Test Statistic ,123
Asymp. Sig. (2-tailed) ,182c
Source : Output SPSS 22.0

106
Table 4.6
One-Sample Kolmogorov-Smirnov Test (Model 3)
Unstandardized Residual
N 123
Normal Parametersa,b
Mean ,0000000
Std. Deviation ,09871739
Most Extreme Differences Absolute ,063
Positive ,040
Negative -,063
Test Statistic ,063
Asymp. Sig. (2-tailed) ,200c,d
Source : Output SPSS 22.0
Figure 4.1
Source : Output SPSS 22.0

107
Figure 4.2
Figure 4.3
Source : Output SPSS 22.0

108
Figure 4.4 (Model 1)
Source : Output SPSS 22.0
Figure 4.5 (Model 2)
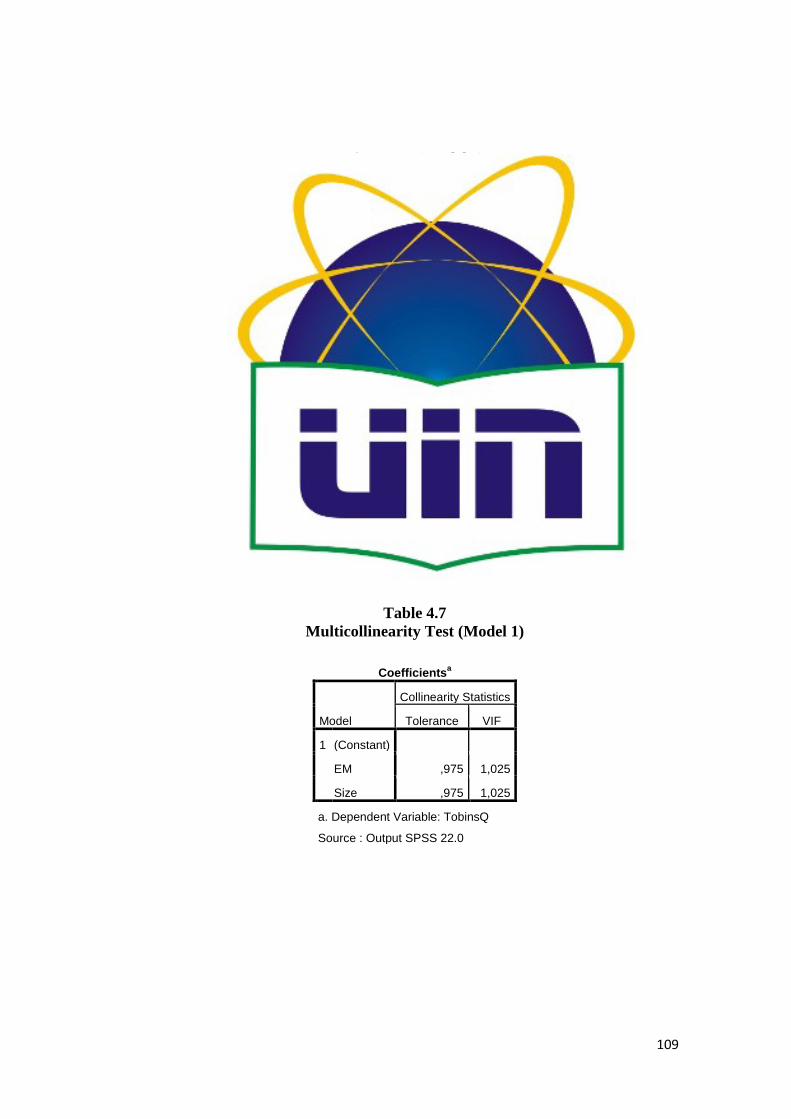
109
Figure 4.6 (Model 3)
Source : Output SPSS 22.0
Table 4.7
Multicollinearity Test (Model 1)
Coefficientsa
Model
Collinearity Statistics
Tolerance VIF
1 (Constant)
EM ,975 1,025
Size ,975 1,025
a. Dependent Variable: TobinsQ
Source : Output SPSS 22.0

110
Table 4.8
Multicollinearity Test (Model 2)
Coefficientsa
Model
Collinearity Statistics
Tolerance VIF
1 (Constant)
BOD ,553 1,807
MO ,382 2,617
IO ,581 1,721
a. Dependent Variable: TobinsQ
Source : Output SPSS 22.0
Table 4.9
Multicollinearity Test (Model 3)
Coefficientsa
Model
Collinearity Statistics
Tolerance VIF
1 (Constant)
EM ,013 79,666
BOD ,521 1,920
MO ,187 5,361
IO ,408 2,449
Size ,392 2,551
EM_BOD ,072 13,876
EM_MO ,081 12,359
EM_IO ,045 22,053
a. Dependent Variable: TobinsQ
Source : Output SPSS 22.0
Table 4.10
Autocorrelation Test (Model 1)
Model Summaryb
Model Durbin-Watson
1 2,325
Source : Output SPSS 22.0

111
Table 4.11
Autocorrelation Test (Model 2)
Model Summaryb
Model
Durbin-Watson
1 1,863
Source : Output SPSS 22.0
Table 4.12
Autocorrelation Test (Model 3)
Model Summaryb
Model Durbin-Watson
1 2,337
Source : Output SPSS 22.0
Figure 4.7
Source : SPSS 22.0

112
Figure 4.8
Source : SPSS 22.0
Figure 4.9
Source : SPSS 22.0

113
Table 4.13
Criteria of Correllation Coefficient
VALUE INFORMATION
0 No correlation between variable
> 0 – 0.25 Very weak correlation
> 0.25 – 0.5 Fairly strong correlation
> 0.5 – 0.75 Strong correlation
> 0.75 – 0.99 Very strong correlation
1 Perfectly correlation
Table 4.14
Model Summaryb
Model R R Square Adjusted R Square Std. Error of the Estimate
1 ,816a ,665 ,645 ,40015
a. Predictors: (Constant), Size, EM
b. Dependent Variable: TobinsQ
Source : Output SPSS 22.0
Table 4.15
Model Summaryb
Model R R Square Adjusted R Square Std. Error of the Estimate
1 ,654a ,428 ,374 ,53117
a. Predictors: (Constant), IO, BOD, MO
b. Dependent Variable: TobinsQ
Source : Output SPSS 22.0
Table 4.16
Model Summaryb
Model R R Square Adjusted R Square Std. Error of the Estimate
1 ,863a ,746 ,670 ,38565
a. Predictors: (Constant), EM_IO, IO, BOD, EM_MO, Size, EM_BOD, MO, EM
b. Dependent Variable: TobinsQ
Source : Output SPSS 22.0

114
Table 4.17
Multiple Regression Analysis (Model 1)
Coefficientsa
Model
Unstandardized Coefficients
B Std. Error
1 (Constant) -6,738 ,977
EM -14,085 11,348
Size ,284 ,035
Source : Output SPSS 22.0
Table 4.18
Multiple Regression Analysis (Model 2)
Coefficientsa
Model
Unstandardized Coefficients
B Std. Error
1 (Constant) 2,956 ,568
BOD -,117 ,051
MO -,043 ,009
IO -,013 ,005
Source : Output SPSS 22.0
Table 4.19
Multiple Regression Analysis (Model 3)
Coefficientsa
Model
Unstandardized Coefficients
B Std. Error
1 (Constant) -6,329 1,737
EM -131,775 96,411
BOD -,081 ,039
MO -,009 ,010
IO -,003 ,004
Size ,293 ,053
EM_BOD 10,085 7,338
EM_MO 1,709 1,176
EM_IO ,789 ,956
Source : Output SPSS 22.0
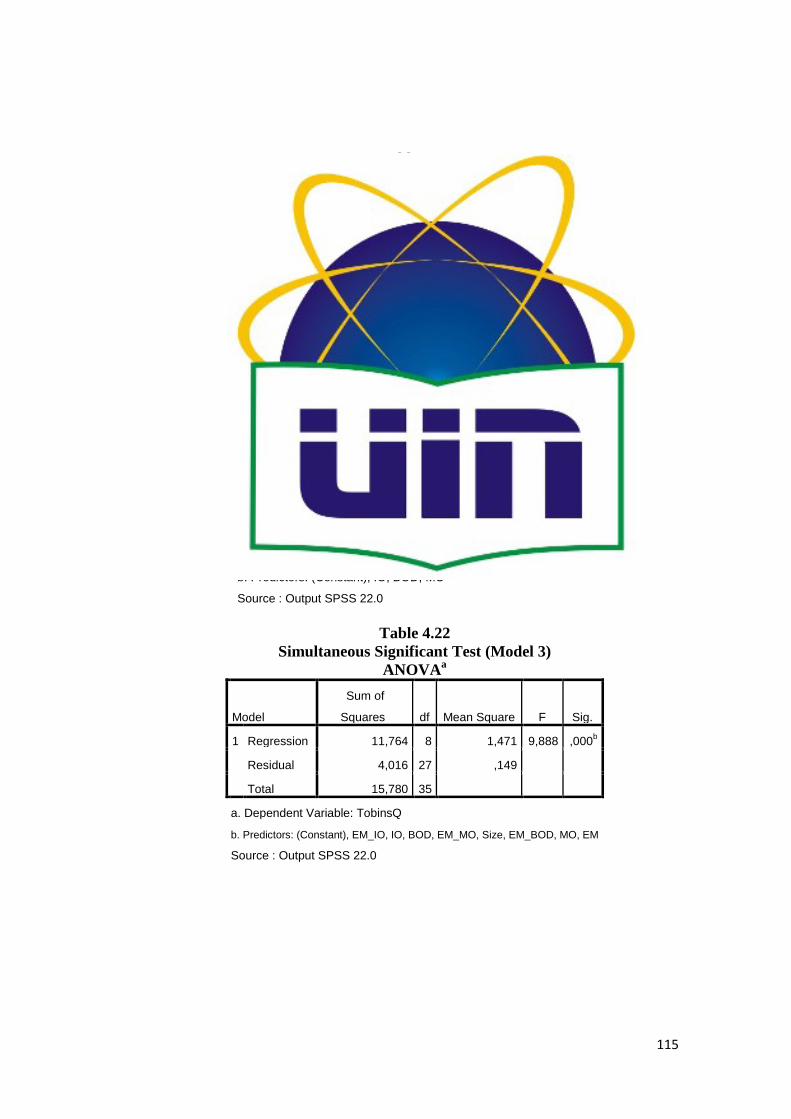
115
Table 4.20
Simultaneous Significant Test (Model 1)
ANOVAa
Model Sum of Squares df Mean Square F Sig.
1 Regression 10,496 2 5,248 32,777 ,000b
Residual 5,284 33 ,160
Total 15,780 35
a. Dependent Variable: TobinsQ
b. Predictors: (Constant), Size, EM
Source : Output SPSS 22.0
Table 4.21
Simultaneous Significant Test (Model 2)
ANOVAa
Model Sum of Squares df Mean Square F Sig.
1 Regression 6,751 3 2,250 7,976 ,000b
Residual 9,029 32 ,282
Total 15,780 35
a. Dependent Variable: TobinsQ
b. Predictors: (Constant), IO, BOD, MO
Source : Output SPSS 22.0
Table 4.22
Simultaneous Significant Test (Model 3)
ANOVAa
Model
Sum of
Squares df Mean Square F Sig.
1 Regression 11,764 8 1,471 9,888 ,000b
Residual 4,016 27 ,149
Total 15,780 35
a. Dependent Variable: TobinsQ
b. Predictors: (Constant), EM_IO, IO, BOD, EM_MO, Size, EM_BOD, MO, EM
Source : Output SPSS 22.0

116
Table 4.23
Partial Test Result (Model 1)
Coefficientsa
Model
Unstandardized Coefficients Standardized Coefficients
t Sig. B Std. Error Beta
1 (Constant) -6,738 ,977 -6,898 ,000
EM -14,085 11,348 -,127 -1,241 ,223
Size ,284 ,035 ,826 8,096 ,000
a. Dependent Variable: TobinsQ
Source : Output SPSS 22.0
Table 4.24
Partial Test Result (Model 2)
Coefficientsa
Model
Unstandardized Coefficients Standardized Coefficients
t Sig. B Std. Error Beta
1 (Constant) 2,956 ,568 5,201 ,000
BOD -,117 ,051 -,409 -2,273 ,030
MO -,043 ,009 -1,016 -4,697 ,000
IO -,013 ,005 -,443 -2,525 ,017
a. Dependent Variable: TobinsQ
Source : Output SPSS 22.0

117
Table 4.25
Partial Test Result (Model 3)
Coefficientsa
Model
Unstandardized Coefficients Standardized Coefficients
t Sig. B Std. Error Beta
1 (Constant) -6,329 1,737 -3,643 ,001
EM -131,775 96,411 -1,184 -1,367 ,183
BOD -,081 ,039 -,284 -2,108 ,044
MO -,009 ,010 -,205 -,912 ,370
IO -,003 ,004 -,088 -,579 ,567
Size ,293 ,053 ,854 5,509 ,000
EM_BOD 10,085 7,338 ,497 1,374 ,181
EM_MO 1,709 1,176 ,496 1,454 ,158
EM_IO ,789 ,956 ,376 ,825 ,417
a. Dependent Variable: TobinsQ
Source : Output SPSS 22.0