the influence of brand name, product quality, price, store
TRANSCRIPT

The Influence of Brand Name, Product Quality, Price,
Store Environment, Promotion, and Service Quality towards
Brand Loyalty: A Case of Jco donut and Coffee in South Jakarta
and South Tangerang
By
Maudy Riaditya Gunawan
014200900090
A Skripsi presented to the
Faculty of Business President University
in partial fulfillment of the requirements for
Bachelor Degree in Economics Major in Management
February 2015
i
PANEL OF EXAMINERS APPROVAL SHEET
Herewith, the Panel of Examiners declares that the Skripsi entitled “THE
INFLUENCE OF BRAND NAME, PRODUCT QUALITY, PRICE,
STORE ENVIRONMENT, PROMOTION AND SERVICE QUALITY
TOWARDS BRAND LOYALTY: A CASE OF JCO DONUT AND
COFFEE IN SOUTH JAKARTA AND SOUTH TANGERANG”
submitted by Maudy Riaditya Gunawan, Management Study Program, Faculty
of Business was assessed and approved to have passed the oral examination on
February 12, 2015
Liswandi, S.Pd.MM
Chair - Panel of Examiners
Purwanto, ST. MM
Examiner 1
Suresh Kumar ST, M.Si
Examiner 2
ii
SKRIPSI ADVISOR
RECOMMENDATION LETTER
This Skripsi entitled “The Influence of Brand name, Product Quality,
Price, Store Environment, Promotion and Service Quality towards Brand
Loyalty: A Case of Jco donut and Coffee in South Jakarta and South
Tangerang” prepared and submitted by Maudy Riaditya Gunawan in partial
fulfilment of the requirements for the Bachelor degree of Management in
the Faculty of Business has been reviewed and found to have satisfied the
requirements for a fit to be examined. I therefore recommend this Skripsi for
Oral Defense.
Cikarang, Indonesia, January 15, 2015.
Acknowledged by, Recommended by,
Vinsensius Jajat Kristanto SE., MM., MBA Suresh Kumar ST, M.Si
Head, Management Study Program Skripsi Advisor

iii
DECLARATION OF ORIGINALITY
I declare that this skripsi, entitled “The Influence of Brand name, Product
Quality, Price, Store Environment, Promotion and Service Quality towards
Brand Loyalty: A Case of Jco donut and Coffee in South Jakarta and
South Tangerang” is, to the best of my knowledge and belief, an original
piece of work that has not been submitted, either in whole or in part, to
another university to obtain a degree.
Cikarang, Indonesia, January 15, 2015.
Maudy Riaditya Gunawan

iv
ABSTRACT
The growth of JCo Donuts and Coffee Indonesia has been developed rapidly in
several years back, but the lead in donuts industry in Indonesia is still centered to the
Dunkin Donuts for the last 2 years according to the Top Brands Awards Indonesia.
With the changing lifestyle of Indonesian consumers, more educated people and
affluent, people tend to eating-out especially in café or places that has a comfortable
ambience to hang out, this habit is not only followed by young generation but also the
older ones. This research aims to test and analyze the Impact of Brand Loyalty factors
toward Brand Loyalty of JCo Donuts and Coffee in South Jakarta and South
Tangerang. The six factors of brand loyalty are brand name, product quality, price,
promotion, service quality and store environment. Questionnaires were distributed
and self-administered to 350 respondents who have been visited in Jco Donut and
Coffee in South Jakarta and South Tangerang. This research is using the purposive
sampling. The result on this research has shown that brand loyalty factors (brand
name, Product Quality, Promotion and Service Quality) has influence towards Brand
royalty. Adjusted R square of 0.540 showed that 54.0% Brand Loyalty of JCo Donuts
and Coffee in South Jakarta and South Tangerang can be explained by Brand Name,
Product Quality, Promotion and Service Quality. While the remaining 46.0% are
influenced or explained by other variables not included in this research model. This
study can be a base for the next research in terms of certain variable such as Brand
Name, Product Quality, Price, Store Environment, Promotion and Service Quality.
Keyword: Brand Name, Product Quality, Price, Store Environment, Promotion and
Service Quality

v
ACKNOWLEDGEMENT
First of all, I would like to thank Allah SWT for all the blessing in my life and give me
opportunity to accomplish my skripsi requirement to obtain Bachelor Degree in President
University majoring in Management International Business. Furthermore, I would like to thank
all of people who have help and support me in accomplishing my skripsi “The Influence of
Brand name, Product Quality, Price, Store Environment, Promotion and Service Quality
towards Brand Loyalty: a Case of Jco donut and Coffee in South Jakarta and South
Tangerang”.
I would like to say thank, especially to:
My beloved family, my mother, my father and my brother, thank you for all the
prayers and sacrifices and all its support over the years, either in moral, spiritual,
and material infinite. I do not know how to describe my gratitude to all of you in
words. Thanks for everything that you gave to me.
Mr.Vincentius djajat as head of management study program in faculty of economy
and business which always strive to provide the best for the students in the Faculty
of Economics and Business.
Mr. Suresh Kumar, ST., M.Si, as my Skripsi advisor. Thank you so much for the
advice, guidance, and knowledge from the beginning until this Skripsi successfully
accomplish.
All the respondents in Jco Donut and Coffee in Pondok Indah Mall, Senayan City,
Summarecon Bsd and Bintaro Plaza, thanks a lot for spending your time to fill the
questionnaire.
Dearest my friends in PU, Susan, Dewangkara, Panjul, Sayed, al, Theo, Madonna,
Naomi and Novan, thanks for your supports and kindness during the thesis period.
My high school Friends, Vinnie, Kipli, diera, ninna, Govinda, Byandra, Ghazi,
thanks for always remind me and support.

vi
Dearest friends that I always remembered, Dede, Cilla, Rhesa, Abel, Morin,
Hussein, Abdu, Dion, Oi.
Dearest my uncle and aunty, Mang Buche, Om Irwan, Om Ebby, Wak pat, wak
dida, Bi Uli.
.
Finally, perfection is belongs to God, the author is aware that this thesis is still a lot
of shortcomings and far from perfectness. Therefore, the authors expect suggestions
and constructive criticism of this thesis to be a better and useful in the future.
Hopefully this study can add to the information and knowledge to the reader.
Cikarang, Indonesia, January 15 2015
Maudy Riaditya Gunawan
vii
Table of Contents
PANEL OF EXAMINERS APPROVAL SHEET ......................................................... i
SKRIPSI ADVISOR ..................................................................................................... ii
RECOMMENDATION LETTER ................................................................................ ii
DECLARATION OF ORIGINALITY ........................................................................ iii
ABSTRACT ................................................................................................................. iv
ACKNOWLEDGEMENT ............................................................................................ v
Table of Contents ........................................................................................................ vii
List of Figures ............................................................................................................... x
List of Tables ................................................................................................................ x
CHAPTER I .................................................................................................................. 1
INTRODUCTION ........................................................................................................ 1
1.1. Research background ..................................................................................... 1
1.2. Problem Identification ........................................................................................ 4
1. 3. Statement of problem ........................................................................................ 6
1. 4. Research Objective ............................................................................................ 7
1. 5. Research Limitation .......................................................................................... 8
1. 6. Definition of terms ............................................................................................ 8
1. 7. Significance of the Study .................................................................................. 9
CHAPTER II ............................................................................................................... 11
LITERATURE REVIEW ........................................................................................... 11
2.1. Theoretical Review .......................................................................................... 11
2.1.1. Brand Name .............................................................................................. 12
2.1.2. Product Quality ......................................................................................... 13
2.1.3. Price .......................................................................................................... 14
2.1.4. Store Environment .................................................................................... 14

viii
2.1.5. Promotion .................................................................................................. 15
2.1.6. Service Quality .......................................................................................... 16
2.1.7. Brand Loyalty ........................................................................................... 16
2.2. Previous Research ............................................................................................ 17
2.3. Theoretical Framework .................................................................................... 20
2.4. Hypothesis ........................................................................................................ 20
CHAPTER III ............................................................................................................. 22
RESEARCH METHODOLOGY ................................................................................ 22
3.1 Research Design ................................................................................................ 22
3.1.1 Research Variable ...................................................................................... 23
3.2 Population and Sample ...................................................................................... 23
3.3 Operationalization of Variables ......................................................................... 24
3.4 Data Collection .................................................................................................. 28
3.4.1 Data collecting method .............................................................................. 28
3.4.2 Type and Source of data ............................................................................. 29
3.5 Analysis method ................................................................................................ 31
3.5.1 Research instrument ................................................................................... 31
3.6 Quantitative Analysis ........................................................................................ 31
3.6.1 Validity test ................................................................................................ 31
3.6.2 Reliability test ............................................................................................ 33
3.6.3 Multiple Linear Regression Analysis ......................................................... 33
3.6.4. Classic Assumption ................................................................................... 34
3.6.5 Testing the Hypothesis ............................................................................... 36
3.6.6. Adjusted R Square .................................................................................... 36
CHAPTER IV ............................................................................................................. 37
THE ANALYSIS OF DATA AND INTERPRETATION ......................................... 37
4.1 The History of J Co Donuts and Cofee in Indonesia ......................................... 37
4.2 The analysis of Qualitative and Interpretation .................................................. 39
4.2.1 Profile of Respondents ............................................................................... 39

ix
4.3. Data Analysis (Test Validity and Reliability Test) .......................................... 48
4.3.1. Test Validity (Factor Analysis) ................................................................. 48
4.4. Analysis of Multiple Linear Regression ........................................................... 63
4.4.1. Classic Assumption Test ........................................................................... 63
4.4.2. Testing of Hypothesis ............................................................................... 66
4.5. Interpretation of result ..................................................................................... 71
CHAPTER V .............................................................................................................. 73
CONCLUSIONS AND RECOMENDATION ........................................................... 73
5.1 Conclusions ....................................................................................................... 73
5.2 Recommendation ............................................................................................... 74
REFERENCES ........................................................................................................... 77
Journals ....................................................................................................................... 78
Internet ........................................................................................................................ 81
APPENDIX ................................................................................................................. 82

x
List of Figures
Figure 1.1. TokoDonat 2012 ......................................................................................... 6
Figure 1.2. TokoDonat 2013 ......................................................................................... 6
List of Tables
Table 3. 1. Operationalization of Variables ................................................................ 23
Table 4. 2. Profile of Respondents .............................................................................. 38
Table 4.3. Score per statement item about Brand Name ............................................. 39
Table 4.4. Score per statement item about Product Quality........................................ 40
Table 4.5. Score per statement item about Price ......................................................... 41
Table 4.6. Score per statement item about Store Environment ................................... 43
Table 4.7. Score per statement item about Promotion ................................................ 44
Table 4.8. Score per statement item about Service Quality ........................................ 45
Table 4.9. Score per statement item about Brand Loyalty .......................................... 46
Table 4.10. KMO and Bartlett's Test .......................................................................... 49
Table 4.11. Communalities ......................................................................................... 49
Table 4.12. Rotated Component Matrix of Variables ................................................. 50
Table 4.13. Rotated Component Matrix of Variables ................................................. 51
Table 4.14. Final Rotated Component Matrix of Variables ........................................ 52
Table 4.15. Final KMO and Bartlett’s Test ................................................................ 53
Table 4.16. Final Communalities ................................................................................ 54
Table 4.17. Total Variance Explained ........................................................................ 55
Table 4.18. Final Rotated Component Matrix ............................................................ 56
Table 4.19. KMO and Bartlett's test............................................................................ 57
Table 4.20. Communalities ......................................................................................... 57
Table 4.21. KMO and Bartlett's test............................................................................ 58
Table 4.22. Communalities ......................................................................................... 58
Table 4.23. Total Variance Explained ........................................................................ 59
Table 4.24. Brand Name (X1) ..................................................................................... 60
Table 4.25. Product Quality (X2)................................................................................ 60
Table 4.26. Promotion (X5).........................................................................................61
Table 4.27. Service Quality (X6) ................................................................................ 62
Table 4.28. Brand Loyalty (Y) .................................................................................... 63
Table 4.29. Histogram ................................................................................................. 64
Table 4.30. Normal P-P Plot of Regression Standardized Residual ........................... 65

xi
Table 4.31. Multicollinearity ...................................................................................... 66
Table 4.32. Scatterplot ................................................................................................ 67
Table 4.33. F test – Anova .......................................................................................... 69
Table 4.34. The Model of Regression Equation ......................................................... 70
Table 4.35. The Model of Summary ........................................................................... 71

1
CHAPTER I
INTRODUCTION
1.1. Research background
One of the vital needs of the increasing population in our country is food.
There are a few number of restaurant goers to meet the necessity of food. Most of the
people in our country occasionally go to the restaurant to enjoy ethnic and some of
western food items. Unhygienic environment, poor food quality, insufficient
structural facilities, deficiency of available food items, uneducated chefs, unskilled
waitress and ineffective management system make people reluctant to consume
foods from restaurant in our country. Today, meals are more of an afterthought rather
than a planned occasion. People themselves hungry with no time cook; so they eat
out.
Nowadays, economy grows very fast along with the growth of every aspect
industry. Especially in food industry, there are so many chances are offer to people
that want to try their luck in this industry. For those people who have skilled to cook,
they usually build their own restaurant. But, for people who don’t have skill,
franchise is one of the best alternative investment because in general, restaurants who
turn into franchise already have good image from consumer and also the operation is
not complicated and the management system is already built with the standard
operation that have been done in many companies generally. In Indonesia itself,
especially in Jakarta, there are many choices of franchise that offered, from the
traditional food until international food from abroad food company. For the customer,
there are many positive aspects they can get such as they have many choices of food
2
they want just settle it with their taste and motivate local franchise company to
increase their service into international quality. Somehow, for some people, food
franchise is already become a quality assurance to be done although there is still
people who fail in this franchise business. But, for those who ran the business itself, it
is more challenging by looking there is many competitors out there, a good
management strategy is must.
In a business of services, we believe that restaurant failures are partly a result
of management's lack of strategic orientation in measuring and focusing on customer
satisfaction. Although food taste is one of the measure people will be coming to a
restaurant, there is no guarantee people will come back. As stated by Mittal and
Kamakura (2001), customer satisfaction is a key factor in formation of customer’s
desires for future purchase. Customer likes to talk about their good experiences at
purchasing something. Since resources are almost always limited, the business man
must establish priorities among the strategic moves that are likely to improve a
customer's repeat purchase. Restaurants must understand their strategy and what their
strategy means to risks associated with it. They must also understand risks generally
associated with restaurants. Restaurants face several types of risk: operational,
strategic, and economic (theinstitute.org, 2011).
Restaurants that change their menu, service staff, pricing, or other processes
face risks to their reputation. A restaurant strategically driven towards high ratings
and resulting prestige might find its rating lowered when makes menu changes.
Addressing this strategic risk requires an understanding of the criteria for being in a
particular rating category. Even if a restaurant enjoys high ratings, people’s tastes
change, and maintaining clientele requires dedicated attention to shifting customer
needs (theinstitute.org, 2011). This focus can include assessing data about which
items are ordered, customer surveys, and even informal reports from employees on
customer satisfaction. Changing trends in the sale of vegetables, herbs, and meats in
local marketplaces can also show taste changes (theinstitute.org, 2011).

3
The community in which a restaurant is located also can affect the restaurant’s
reputation. For example, if the restaurant is located in a resort community that is no
longer fashionable or goes out of business, will people continue to visit the
restaurant? The same problem exists in a mall when the customer leaves and the mall
receive less traffic. Restaurant owners must also deal with strategic risks involving
growth and expansion. Researching local economics, demographics, and changing
customer tastes before making any strategic direction changes is as important as
educating staff on cleanliness in the kitchen.
As the restaurant industry continues to grow, restaurants face increased
competition. In an effort to attract new customers and maintain current customers,
many establishments are offering additional services such as entertainment and
catering. Theme restaurants featuring movie, sports, and musicmemorabilia have also
gained popularity over the past few years. Several theme restaurants provide
entertainment not only live band or big television for them to watch during eating
anymore but they are trying to do innovations bring pleasure in dining. For example,
Beerdy Virtual Golf & Bar at Gandaria City Mall that serve customer not only with
their variety of food but also entertain them with virtual golf where customer can
enjoy playing golf in the middle of lunch or dinner. Other is Strawberry restaurant
that provide the playing Jumanji board game complete with the room to play when
they are done eating. Toys café also a place located in Senopati, where people can eat
while they can also play many kinds of games, the video games, laser tag, card
games, board games, pinball and etc. Not only games and but now people can try to
eat in the dark where they are discovering their food with no light at all, Blind café
provide food for people to enjoy in the dark, they guided and served by blind people
that believed has ability to feel anything in the dark. As the competition heats up,
many people are focusing only in those segments. But, people should pay attention
also to the bakery restaurant which has not many competitors especially in donut
segment.

4
History of Donuts come to Indonesia is begin in 1968 where American
Donuts opened their stand in Djakarta Fair, they introduce Donuts with automatic
fried machine for the first time. Followed by Dunkin Donuts in 1985 opened their
first shop at HayamWuruk, Central Jakarta. Dunkin Donuts then attract the intention
of customer up until they owned 200 franchises in Indonesia (DunkinDonuts.co.id).
On 1990, Dunkin is sold to Allied Domecq (formerly of Allied Lyons) of Great
British. They keep on moving the business to the brighter era; they even opened their
5000th
stores in Bali, Indonesia on 1999, the first Dunkin Café in Mall Taman
Anggrek, Jakarta, Indonesia on 2006 and they opened the world’s biggest store of
Dunkin Donuts in Palembang, Indonesia on 2012. On 2009, Dunkin already owned
15.000 stores all over the world. Dunkin' Donuts set a record breaking sales US$ 5
billion during 2005 - 2006 fiscal years.
The Donuts trend in Indonesia keep on development up until now there are
Master Ring, Master Donuts, Mister Donuts and others. Finally on 2005, local brand
come with its own attractiveness and many variety of products and it’s not just selling
donuts but also sell the other beverages and frozen yoghurt without override their
main products, donuts itself.
1.2. Problem Identification
JCO Donuts and Coffee owned by Johnny Andrean the hairdresser and
entrepreneur. On its owned group, despite Johnny Salon and JCo Donuts, the group
also consisted of Breadtalk and Roppan. Growth of his business keep on health
condition, knowing the market intention, Johnny tries to win the customer with his
touch in all his business. Now, JCo Donuts and Coffee already open 170 branches,
135 in Indonesia, 11 in Malaysia, 18 stores in Philippines, 4 stores in Singapore and 2
stores in China (JcoDonuts.com). The businesses keep growing, the variety of
topping and taste keep on renewal. Not only the taste of the products but Johnny
5
knows how to spoil their customer with the environment of the store, music selection,
interior/store display and not forget to mention the service quality.
For a while in Indonesia, Dunkin Donuts being a single character of Donuts
franchise, serving customers with American taste, Dunkin has a simple focus in
serving breakfast and snack for its customers. Until 2005 where Jco has been
established in Indonesia bring a new variety of products, Jco gives their customer
choice of taste and product selections. The market attract to the concept of Jco
Donuts in Indonesia, gives them a modern touch with local insight. Jco grow their
products to beverages and frozen yoghurt with topping selections.
Jco and Dunkin Donuts keep on competing their own features, stick with their
specialties they have their own customers but don’t mean that their customers are
overlapped. Those two brands are registered at TOP BRAND AWARD Indonesia as
2 biggest franchise donuts in Indonesia on last two years 2012 and 2013 with Dunkin
in the top position with 53% (2012) and 49% (2013) over 100% of the ratings. In the
second place, Jco with 40,4% (2012) and 45,3% (2013) still in position ready to
compete Dunkin Donuts with the biggest competitor for its brand in Indonesian
Market (topbrand-award.com).
As people can see in recent years, Jco donuts nowadays are more visited by
customer than Dunkin Donut. But, According to figure 1.1 and figure 1.2, it show
that Dunkin Donut still better than Jco donut. This shows that Jco Donut has less big
market share compared to Dunkin Donut. But, Dunkin Donut should be more careful
now because Jco is getting better from the past two years.

6
Figure 1.1. TokoDonat 2012
(Source: .topbrand-award.com, 2012)
Figure 1.2. TokoDonat 2013
(Source: .topbrand-award.com, 2013)
1. 3. Statement of problem
In this research, researcher discussed about how much is the impact from
brand loyalty variable towards brand loyalty of JCo Donuts & Coffee in Indonesia.
Therefore, based on the statement above this thesis title is “The Influence of Brand
name, Product Quality, Price, Store Environment, Promotion and Service Quality
7
towards Brand Loyalty: a Case of Jco donut and Coffee in South Jakarta and South
Tangerang” specifically this research is aimed to answer the questions below:
1. To what extent do brand name, product quality, price, store environment,
promotion and service quality influence simultaneously Brand loyalty of JCo
Donuts & Coffee Indonesia?
2. To what extent does Brand Name partially influence of Brand Loyalty JCo
Donuts & Coffee Indonesia?
3. To what extent does Product Quality partially influence of Brand Loyalty JCo
Donuts & Coffee Indonesia?
4. To what extent does Price partially influence of Brand Loyalty JCo Donuts &
Coffee Indonesia?
5. To what extent does Store Environment partially influence of Brand Loyalty JCo
Donuts & Coffee Indonesia?
6. To what extent does Promotion partially influence of Brand Loyalty JCo Donuts
& Coffee Indonesia?
7. To what extent does Service Quality partially influence of Brand Loyalty JCo
Donuts & Coffee Indonesia?
1. 4. Research Objective
The main objective of this research is empirically investigating the impact of
brand loyalty variables toward brand loyalty of JCo Donuts & Coffee Indonesia.
This study is conducted to meet some following objectives:
1. To determine the influence of Brand Name, Product Quality, Price, Promotion,
Service Quality and Store Environment toward the Brand Loyalty of JCo Donuts
& Coffee in South Jakarta and South Tangerang.

8
2. To determine the influence of brand name towards the Brand Loyalty of JCo
Donuts & Coffee South Jakarta and South Tangerang..
3. To determine the influence of product quality towards the Brand Loyalty of JCo
Donuts & Coffee South Jakarta and South Tangerang.
4. To determine the influence of price towards the Brand Loyalty of JCo Donuts &
Coffee South Jakarta and South Tangerang.
5. To determine the influence of store environment towards the Brand Loyalty of
JCo Donuts & Coffee South Jakarta and South Tangerang.
6. To determine the influence of promotion towards the Brand Loyalty of JCo
Donuts & Coffee South Jakarta and South Tangerang.
7. To determine the influence of service quality towards the Brand Loyalty of JCo
Donuts & Coffee South Jakarta and South Tangerang.
1. 5. Research Limitation
This research is focusing on the customer loyalty on JCo Donuts & Coffee Indonesia
for the last two years (based on the data from Top Brand Award 2012 and 2013). The
research is conducted at South Jakarta and South Tangerang with the main target
classified between the ages of 15 – 65 years old. This target has been selected due to
the common JCo Donuts & Coffee Indonesia customer; the respondents must be a
regular customer of food franchise industry among the selected areas.
1. 6. Definition of terms
1. Brand loyalty is defined as a deeply held commitment to a preferred product or
service consistently in the future, repeated purchase and commitment despite the
situational influences and marketing efforts which have the potential to cause
switching behavior (Algesheimer et al.,2005; Şahin et al., 2011).

9
2. Brand name is the creation of an image or the development of a brand identity
and is an expensive and time consuming process (Shulz, 2012).
3. Product quality is defined as fitness of use or conformance to requirement (Rusell
and Taylor, 2006).
4. Price is the amount of money charged for a product or service, or the sum of the
values that customers exchange for the benefits of having or using the product or
service (Kotler and Amstrong, 2010)
5. Store environment is the image or impression of a store in the minds of customers
(Dunne and Lunsch, 2005)
6. Promotion is part of communication that consists of company messages designed
to stimulate awareness of, interest in, and purchase of its various products and
services (kotler, 2003).
7. Service quality is one of the vital determinants of customer satisfaction and it will
directly affect the organizational success especially in the service industry (Tat et
al., 2011).
1. 7. Significance of the Study
This research has been done on many purposes, which is divided into several
aspects
1. The Reader
To be used as source of information, secondary data, and as contribution to the
importance of brand name, product quality, price, store environment, promotion
and service quality on achieving brand loyalty.
2. The Researcher
To gain knowledge on the importance of brand name, product quality, price, store
environment, promotion and service quality affecting the brand loyalty.
10
3. Academic
As the benchmark in doing research related to the curriculum in the university.
4. The Company
It is expected to give thoughts to the company to be used as suggestion or
recommendation in increasing the brand loyalty.

11
CHAPTER II
LITERATURE REVIEW
2.1. Theoretical Review
Brand loyalty is defined as a deeply held commitment to a preferred product
or service consistently in the future, repeated purchase and commitment despite the
situational influences and marketing efforts which have the potential to cause
switching behavior (Algesheimer et al.,2005; Şahin et al., 2011). It means to have the
loyalty, consistency for servicing the customer is important. Before it, the company
should maintain a good relationship with customers. According to Bowden (2009),
Customer brand relationship is developed over a period of time due to customers’
previous experience with a brand. Brand experience is therefore conceptualized as
sensations, feeling, cognition's and behavioral responses that are evoked by brand
related stimuli such, identity, packaging, communication, as well as the brand
environment (Brakus et al., 2009). This means, customers would make a decision on
choosing a product or services and that decisions are often influence by great
marketing promotion and also friendly environments provided by the brand. These
factors changes buyers’ behavior and customers will return to a brand with great
services that guarantee the satisfaction. Leading to that the likeliness of customers
returning to brand increases as well as their loyalty (Bowden, 2009; Iglesias et al.,
2011). This since, a strong relationship is built on customers positive experiences
with the brand (Hong-Youl & Perks, 2005).
Before they become loyal, the customers should have a good experienced first
with the brand or product. Brand experience can be defined as customers perception
of the interaction with the brand such as the brand image shown in advertising,

12
personal contact or the level of quality concerning the personal treatment that the
customers receive (Alloza, 2008). To keep maintaining customer preferences, it is
essential to identify the main factors that would impact in the brand loyalty of
customers. Furthermore, the ability to create a strong brand loyalty is reflected in the
company’s values that might provide entry barriers for new competitors and increase
the ability to respond to emerging threats on the market, increase sales and revenues
and a customer base that is less sensitive to the marketing efforts by competing
brands (Delgado-Ballester & Munuera-Alemán, 2001). The company should not only
to keep maintain good relationship with customer, but with a good price also.
Punniyamoorthy et al., (2007) further states that loyalty is affected by perceived
value, trust, satisfaction and commitment. It can determine Brand name, product
quality, price, store environment, promotion and service quality are very important to
achieve. Brand loyalty, is a very important concept in understanding consumer
behavior (Lee et al., 2001; Wood, 2004). Loyal consumers only buy the same brand,
even when there is other brand in the market (Ryan et al., 1999)
2.1.1. Brand Name
Brand can be defined as a type of product manufactured by a particular
company under a particular name. Brand name can represent the image of a product.
The main importance of brand name is to attract the customers, more famous the
brand name people have, the more customers they get. As stated by Keller (2003),
famous brand name can disseminate product benefits and lead to higher recall of
advertised benefits than non-famous brand names.
Brand name should be unique and easy to remember that will attract
customers and give an insight to the reputation of companies in market with
preference to their names (Keller, 2008). Brand name distinct product of companies
than that of the rivals and give competitive advantage over competitors (Zeugner -
Roth, et al., 2008)
13
To develop a successful brand name are need a long way process, the brand
name should represent the image of the product. A brand name is a highly loaded
variable in the factor of branding, and is found to be the most important element
affecting a restaurant’s performance; brand name is the creation of an image or the
development of a brand identity and is an expensive and time consuming process
(Shulz, 2012). The development of a brand name become an essential part of process
since it will impact the brand image will be in the future. From the findings, a
restaurant should aim most of its advertising efforts at enhancing customer awareness
so that customers at least consider that brand in the suggested set of alternatives
(Shulz, 2012). Brand name can be a main attributes to push the success of a product.
When people are recognize the brand and knowing what they will get from buying a
brand it will be a huge investment that already planted in a customer’s mind of what
benefits will they get from a single purchase.
2.1.2. Product Quality
Product quality is defined as fitness of use or conformance to requirement
(Rusell and Taylor, 2006). Product is a manufactured creates by someone and refined
for sale. Product quality is the characteristic of a product or performance as a measure
of satisfy needs. If the products have good quality, consumer will repeat purchase.
People will recognize big brand or famous brand names but at the end, the product of
quality is the main factor people tend to repeat purchase.
The value of purchase that guarantees their satisfaction will be trigger of
people being a repeat customer. In service industry context product quality is
considered as service quality that includes the approach how that service provider for
example the airline, restaurants, banks and retail stores serve their customers, how the
product they offer satisfy customer needs as physical quality of product and how such
particular product apparently communicate that brand image to build brand loyalty an

14
d in result brand equity (Chang and Yen 2002). More you are reliable in terms of
your product quality more customers will be satisfies with your product.
2.1.3. Price
According to Cadogan and Foster (2000), price is probably the most important
consideration for the average consumer. Consumers with high brand loyalty are
willing to pay a premium price for their favored brand, so their purchase intention is
not easily affected by price. The importance of price is as a measurement that
indicated between goods and the money to pay. People will evaluate the market price
before they decide to buy something.
For loyal customers, they willing to pay high cost for the product from some
brand they trust. Loyal customer are willing to pay more for brand or product that
they already aware and trusted rather than try something new with same price. Even
the price are gaining, the intentions of purchase still high because the perceive risk
are paid by the brand trust. Loyal customers are willing to pay a premium even if the
price has increased because the perceived risk is very high and they prefer to pay a
higher price to avoid the risk of any change (Yoon and Kim, 2000).
Price can be defined as the amount of money or exchange value to be given to
pay product or service (Han, 2009). According to bucklin et al (2002), price
significantly influences consumer choice and incidence of purchase. People can to
buy product when the price is low, the discount pricing attempt to be main influence
to consume the product. Han (2009) claim that one of the most adaptable factors
which improved quickly is the pricing.
2.1.4. Store Environment
Success or failure of a restaurant depends partly on the physical environment
of restaurants (Parsa et al., 2011). Some attributes going to be a big impact to attract
the customer. Those attributes such as store location, store layout, the interior, music
15
and ambience are matters for customer satisfaction. it will give a big impact for
customer to repeat their purchase and become a loyal customer. Environment failures
of restaurants lead to operational inefficiencies and eventual loss of competitive edge,
ultimately leading to customer losses (Parsa et al.,2011).
Fields (2007), poor concept that is not differentiated is one of the primary
reasons for restaurant failures. The store in strategic location is more profitable since
the probability of accidentally of purchase will be higher. Locations can be one of the
most important things in business since it gave more benefits rather than a store in
less strategic location.
2.1.5. Promotion
Promotion is one of marketing mix attributes which is kind of communication
with customer. These activities are helping the company to enhance the loyalty of the
brand through personal selling companies promote the products and their service and
this efforts of the company increase the purchase intension of the consumer and
positive attitude towards the product and as well as the image of the organization (To
and Leung, 2001). It can be included the advertising, sales promotion, personal
selling and publicity. A good price promotion should communicate to customer what
the benefit they will get and what the company will provide. price promotions have
accounted for the main share of the marketing budget in most consumer packaged
goods categories (Srinivasan, et al., 2004). Promotions are also one of media to show
that the product is different with other brands.
Kotler and Armstrong (2006) agreed and added that promotions are beneficial
to retailers in several aspects: First, promotional variables such as in-store display and
‘‘two for-one’’ are often used to trigger unplanned purchases. Promotion also can
encourage customer to purchase or consume the product with many attracting ways.
With promoting their brands, the company tries to increase the awareness of their
products and somehow gain the profit from the purchase. One of the importance of

16
promotion is to attract customer preferences and to see how the products perform in
the market.
2.1.6. Service Quality
Service is kind of performance that's proposed by 1 get together to an
alternative and also within corporeality can be although to part of it (Kotler & Keller,
2006). Customer spends the money not only for the product but also for the service
they will get. People tend to make assessment in their mind that the money they
spend should be equal with the product and service quality will be received by them.
Poor of service quality can cause loss of interest and break the perception of the
brand image itself. On the other hand, Wong (2004) found that service quality
positively would affect emotional satisfaction that in turn would have positive effect
on both customer loyalty and relationship quality
Brand loyalty is wide concept and is impacted by many factors and service
quality is one of the major determinants of customer brand loyalty (Zeithaml and
Bitner, 2003) Zeithaml and Bitner (2000) suggested that consumers judge the quality
of the services based on their perceptions of the technical outcome provided, the
process by which the outcome is delivered, and the quality of the physical
surroundings where the service is delivered.
2.1.7. Brand Loyalty
Brand loyalty is the costumers’ tendency for buying some goods from one
brand repeatedly rather than buying from competitors’ brand. Brand loyalty by any
customer not only represent the repeat purchase of that brand but sometimes it also
refers to the psychological commitment of that customers toward that brand therefore,
brand loyalty not only mean that customer will not purchase that brand most often but
also he or she will refute to purchase any other brand of same or better quality as
compare to the old one he or she is loyal to that brand (Rehman et al., 2007).

17
Numerous researchers believed that antecedents of brand loyalty are dynamic
and complex in nature that evolves over time with the changing needs of customers
(Johnson, Herrmann, and Huber, 2006). Researchers highlighted that there are still
somefactors that need to be understand and need to be analyzed from the perspective
of customer loyalty with any specific brand (Taylor, Hunter, and Longfellow, 2006)
Various researchers defined brand loyalty in different ways. Relationship
theory of brand suggests that, brand is a tool that connects customers and suppliers to
the firm and is a mean to sustain such relationship in long run (Davis,Oliver,
&Brodie, 2000; Chang & Chieng, 2006). Customers tend to try a new product first
just to get to know the product performance. If they feel satisfy with the new product,
they are willing to purchase and the chance of being loyal customer increase.
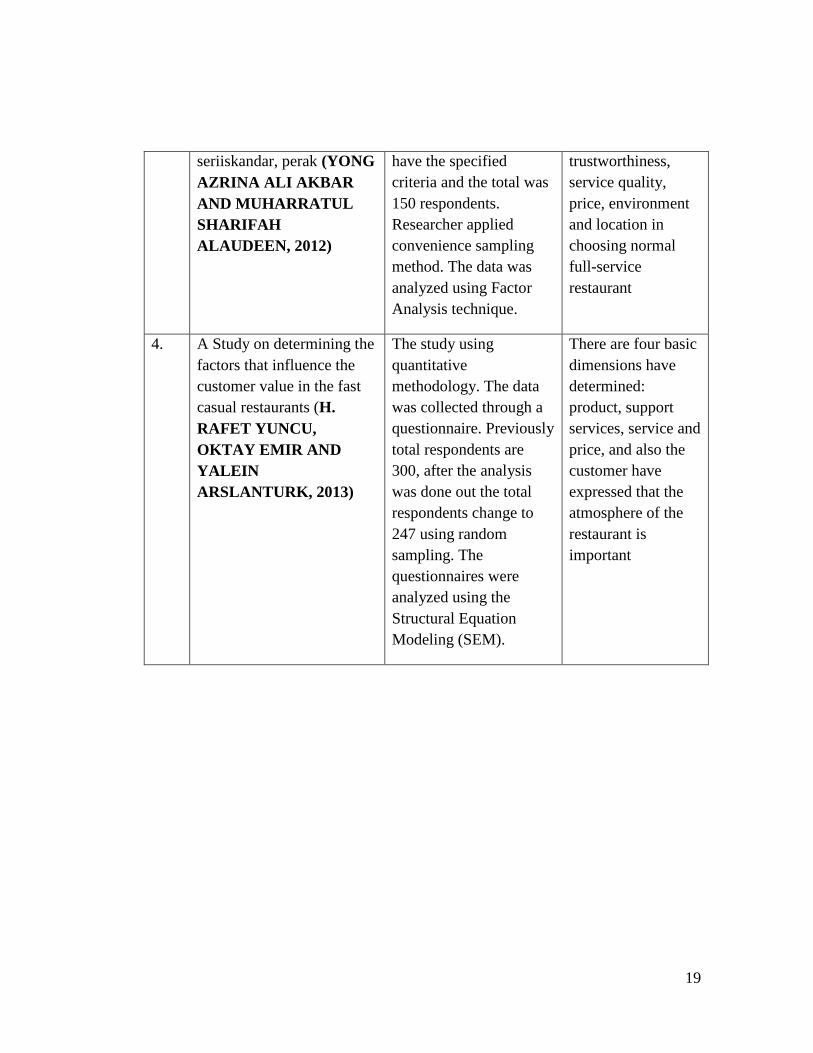
2.2. Previous Research
No. Title/Research Research Design Result
1. Influence of brand loyalty
on consumer sportswear
(WOONG FONG YEE
AND YAHYAH SIDEK,
2008)
A total of 100 sets of
questionnaires were
distributed to
respondents at the
Bandar Baru Bangi and
Serdang areas. The
sampling used is
purposive sampling
distributed to multiple
ethnicity namely Malay,
Chinese, Indian and
other race. Descriptive
analysis is used to
analyze the background
as well as the
respondent’s profiles
pertaining to their
evaluation of brand
The research result
showed that there is
positive and
significant
relationship
between factors of
brand loyalty (
brand name, product
quality, price, style,
promotion, service
quality and store
environment ) with
sportswear brand
loyalty

18
loyalty. Pearson
correlation used to test
seven independent
variables (brand name,
product quality, price,
style, promotion, service
quality and store
environment) that
influenced consumer
brand loyalty and to test
if a relationship existed
between the independent
and dependent variables.
2. Factors influencing
customer loyalty towards
fast food restaurant
(HOSSEIN NEZAKATI,
YEE LEE KUAN AND
OMID ASGARI, 2011)
This study chooses to
use exploration research.
There are 230 self
administered
questionnaire were
distributed direct
distribution to
respondent and small
portion of questionnaire
are distributed through
email. This study using
the non-probability
sampling is used to
conduct the survey. The
techniques of data
analysis in this study is
the multiple regression
linear analysis.
These three
variables (product
quality, customer
satisfaction and
brand trust) are
significant at 0.05
significant values
the findings indicate
that Malaysian
consumers are
concern on product
quality of a fast
food
3. Determinant of factors that
influence consumer in
choosing normal full-
service restaurant: case in
The primary data
collected through
questionnaires given
away to students who
Consumers are put
heavy priorities on
food quality,
followed by
19
seriiskandar, perak (YONG
AZRINA ALI AKBAR
AND MUHARRATUL
SHARIFAH
ALAUDEEN, 2012)
have the specified
criteria and the total was
150 respondents.
Researcher applied
convenience sampling
method. The data was
analyzed using Factor
Analysis technique.
trustworthiness,
service quality,
price, environment
and location in
choosing normal
full-service
restaurant
4. A Study on determining the
factors that influence the
customer value in the fast
casual restaurants (H.
RAFET YUNCU,
OKTAY EMIR AND
YALEIN
ARSLANTURK, 2013)
The study using
quantitative
methodology. The data
was collected through a
questionnaire. Previously
total respondents are
300, after the analysis
was done out the total
respondents change to
247 using random
sampling. The
questionnaires were
analyzed using the
Structural Equation
Modeling (SEM).
There are four basic
dimensions have
determined:
product, support
services, service and
price, and also the
customer have
expressed that the
atmosphere of the
restaurant is
important
20
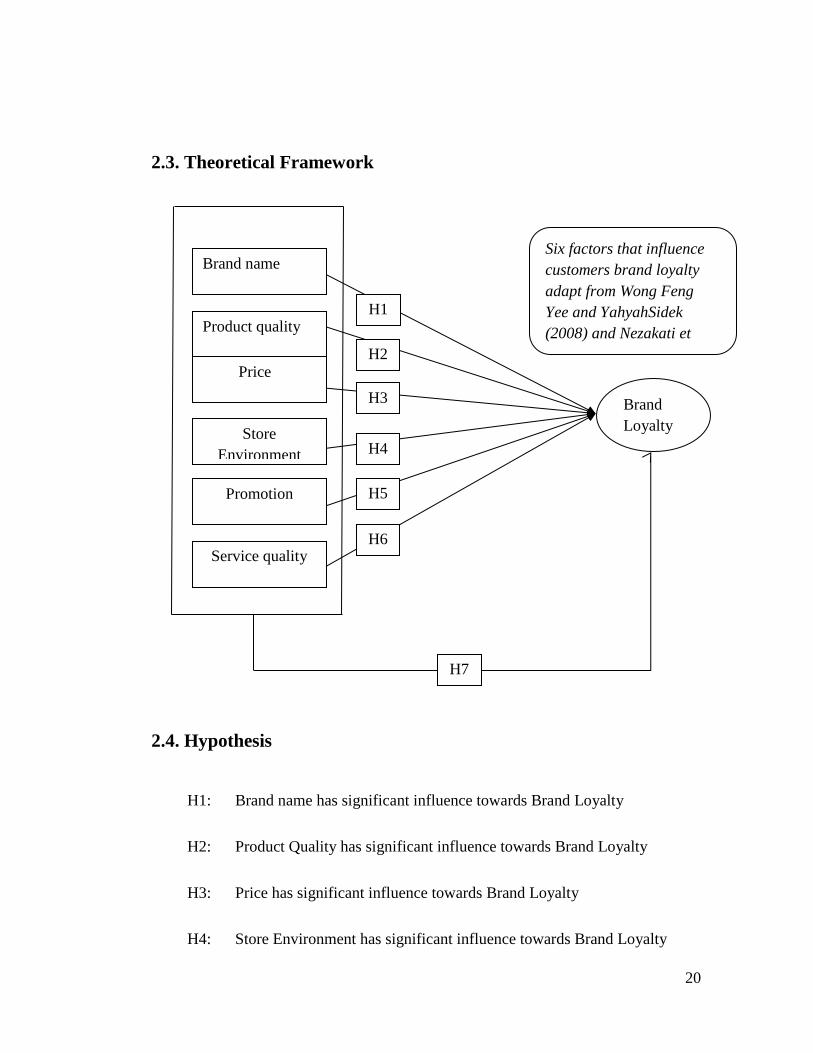
2.3. Theoretical Framework
2.4. Hypothesis
H1: Brand name has significant influence towards Brand Loyalty
H2: Product Quality has significant influence towards Brand Loyalty
H3: Price has significant influence towards Brand Loyalty
H4: Store Environment has significant influence towards Brand Loyalty
Brand
Loyalty
Six factors that influence
customers brand loyalty
adapt from Wong Feng
Yee and YahyahSidek
(2008) and Nezakati et
al.,(2011)
Brand name
Product quality
Price
Promotion
Store
Environment
Service quality
H2
H3
H4
H5
H6
H1
H7
&7

21
H5: Promotion has significant influence towards Brand Loyalty
H6: Service Quality has significant influence towards Brand Loyalty
H7: Brand name, Product Quality, Price, Promotion, Service Quality and
Store Environment have simultaneously influence towards Brand
Loyalty

22
CHAPTER III
RESEARCH METHODOLOGY
3.1 Research Design
In doing a research, researcher can use two kinds of methods. There are
qualitative and quantitative. Quantitative research is scientific investigation that
includes both experiments and other systematic methods that emphasize control and
quantified measures of performance (Proctor & Capaldi, 2006 cited in Hoy, 2009).
Quantitative research, which usually expressed as scores, consists of empirical
observation and mathematical expression which becomes the central of
measurement and statistics (Taylor, 2005).
According to Glesne & Peshkin (as cited in Thomas, 2003) quantitative
methods focus on measurements or amounts (such as more and less, larger and
smaller), the researcher will seek about the explanation by analyzing those numbers
and the role is to observe and measure by using sampling strategies and
experimental design as important aspects.
On the other hand, qualitative research is an experiments that deals with
words (verbal, narrative, and descriptive), data collection done through direct
observation, interviews, and written documentation (Taylor, 2005). Qualitative
research is way to take deeper meanings of particular experience through
observations on the person, this method seems more flexible than the other one
because it allows the research procedures to develop from the observations that
collected and accept the researcher to use a subjectivity to get deeper understanding
from the experience observed (Rubin & Babbie, 2011).

23
In this research, researcher used quantitative method to support the
research conducted. The purpose of using quantitative is by some advantages, such
as: the result is statistically reliable if the research conducted properly, means that
researcher can directly identify whether the idea, concept, product, or service is
better than the alternatives. The second is that the results are projectable to the
population (Nykiel, 2007).
3.1.1 Research Variable
This research consists of seven variables, which are six Independent Variables
and one dependent variable. The independent ones are brand name denoted in X1,
product quality denoted in X2, price denoted in X3, store environment denoted X4,
promotion denoted in X5, and service quality denoted X6. Whereas, the dependent
one is brand loyalty denoted in Y.
3.2 Population and Sample
Sample size or the number of samples taken to be an important issue when the
type of research to be done is research that uses quantitative analysis. Roscoe (1975)
in Sekaran (2010) provided guidance on the determination of the number of samples
should be among 30 to 500 elements. According to Supranto (2001) in which he
stated that size of the sample can be determined by calculating with below formula:
5 × 𝑞
Where q defines the number of questions in questionnaire.
By that formula, minimum number of respondent in this research is 175
because there are 35 questions. Researcher spread 350 just in case there are
questionnaires lost or left unfinished as those will not be counted. The number of 350
is very applicable according to Roscoe (1975) in Sekaran (2010) in which he stated
24
that number of samples should be among 30 to 500 elements. Population is the whole
object or subject in a region and meets certain conditions and related with the
problems which the sample chosen for an exact purpose. A person is chosen as
sample because the researcher assumes that the person has relevant information
towards the research and fulfilled the criteria that are already determined by the
researcher (Ferdinand, 2006).
Based on that explanation, the samples in this study were selected as many as
350 respondents and eligible to be processed there as much as 327 respondents.
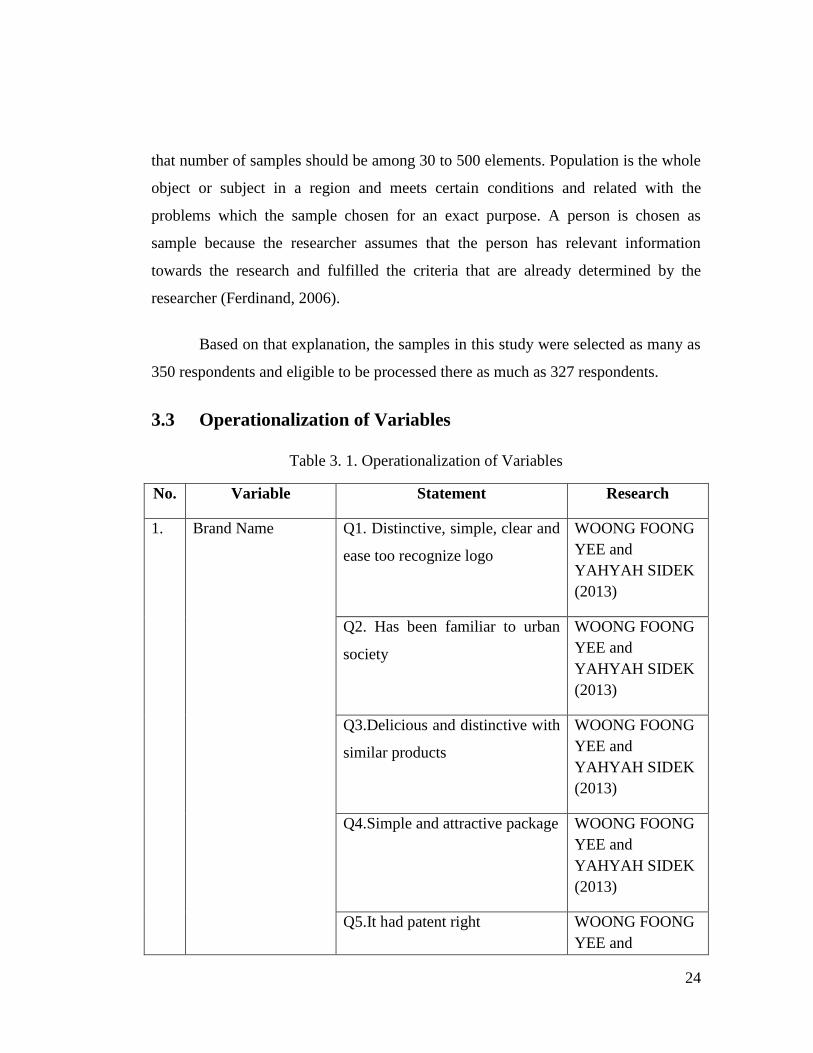
3.3 Operationalization of Variables
Table 3. 1. Operationalization of Variables
No. Variable Statement Research
1. Brand Name Q1. Distinctive, simple, clear and
ease too recognize logo
WOONG FOONG
YEE and
YAHYAH SIDEK
(2013)
Q2. Has been familiar to urban
society
WOONG FOONG
YEE and
YAHYAH SIDEK
(2013)
Q3.Delicious and distinctive with
similar products
WOONG FOONG
YEE and
YAHYAH SIDEK
(2013)
Q4.Simple and attractive package WOONG FOONG
YEE and
YAHYAH SIDEK
(2013)
Q5.It had patent right WOONG FOONG
YEE and

25
YAHYAH SIDEK
(2013)
2. Product Quality Q1. Favorable and containing
Vitamin required by human body
FR SOFIA (2013)
Q2. Sterile food preparation
process and assured with
qualified materials with halal
certificate
FR SOFIA (2013)
Q3. Delicious and distinctive
with similar products
FR SOFIA (2013)
Q4. Willing to pay more for
delicious taste
FR SOFIA (2013)
Q5. Having various tastes and
flavors
FR SOFIA (2013)
3. Price Q1. Offered price is affordable
for customer
WOONG FOONG
YEE and
YAHYAH SIDEK
(2013)
Q2. Varying price for each
product type
WOONG FOONG
YEE and
YAHYAH SIDEK
(2013)
Q3. Price is competitive for
similar product
WOONG FOONG
YEE and
YAHYAH SIDEK
(2013)
Q4. Product price includes tax
and service
WOONG FOONG
YEE and
YAHYAH SIDEK
(2013)

26
Q5. Offered Price equals to
product quality
WOONG FOONG
YEE and
YAHYAH SIDEK
(2013)
4. Store Environment Q1. Outlet is located in strategic
location
WOONG FOONG
YEE and
YAHYAH SIDEK
(2013)
Q2. Outlet lay out is attractive
enough for customers
WOONG FOONG
YEE and
YAHYAH SIDEK
(2013)
Q3. Interior design in is attractive
enough
WOONG FOONG
YEE and
YAHYAH SIDEK
(2013)
Q4. Outlet placement makes
product easy to see
WOONG FOONG
YEE and
YAHYAH SIDEK
(2013)
Q5. Easing customer to buy
products
WOONG FOONG
YEE and
YAHYAH SIDEK
(2013)
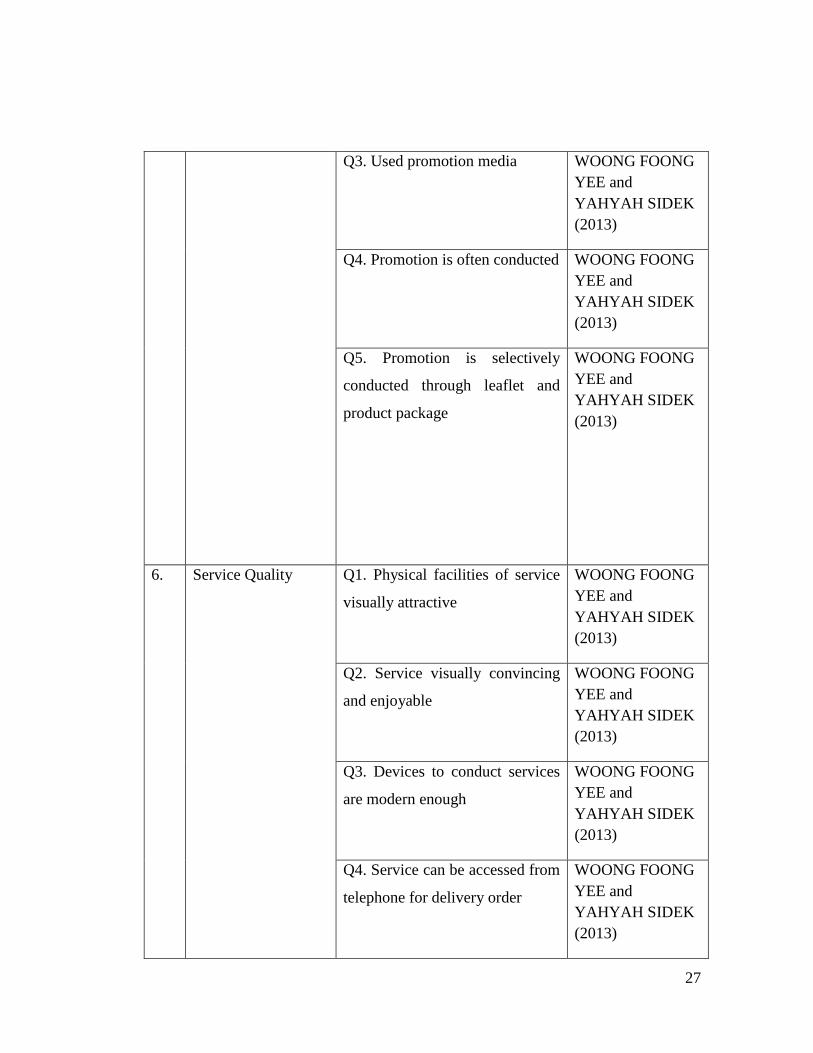
5. Promotion
Q1. Promotion conducted by
outlet is attractive
WOONG FOONG
YEE and
YAHYAH SIDEK
(2013)
Q2. Promotion is conducted
selectively by the corporation
WOONG FOONG
YEE and
YAHYAH SIDEK
(2013)
27
Q3. Used promotion media WOONG FOONG
YEE and
YAHYAH SIDEK
(2013)
Q4. Promotion is often conducted WOONG FOONG
YEE and
YAHYAH SIDEK
(2013)
Q5. Promotion is selectively
conducted through leaflet and
product package
WOONG FOONG
YEE and
YAHYAH SIDEK
(2013)
6. Service Quality Q1. Physical facilities of service
visually attractive
WOONG FOONG
YEE and
YAHYAH SIDEK
(2013)
Q2. Service visually convincing
and enjoyable
WOONG FOONG
YEE and
YAHYAH SIDEK
(2013)
Q3. Devices to conduct services
are modern enough
WOONG FOONG
YEE and
YAHYAH SIDEK
(2013)
Q4. Service can be accessed from
telephone for delivery order
WOONG FOONG
YEE and
YAHYAH SIDEK
(2013)

28
Q5. Short waiting time for
service Service can be accessed
from telephone for delivery order
WOONG FOONG
YEE and
YAHYAH SIDEK
(2013)
3.4 Data Collection
3.4.1 Data collecting method
The data used in this research are collected in two step. The first step done by
collecting data through analysis test instrument question or remark that aims to see
the level of validity and reliabilities instrument question or statement said. The
second step, data that has been tested through the level of validity and the reliability
will be analyzed by software spss 18 for windows to see the influence of between
each variable research.
This type of research is a research with descriptive analysis method.
Analytical descriptive survey method is a method of research that takes from a
population and use the questionnaire as a data collection tool. In this study the data
and information collected from respondents using a questionnaire. After the data is
retrieved and then the results will be presented in a descriptive and at the end of the
research will be analyzed to test the hypothesis put forward at the beginning of this
research.
Meanwhile data collecting method obtained using:
1. Literature study
In this case the researcher obtains the data by literatures and other journals
that are appropriate regarding the problem that are investigated.
29
2. On-field study
The researcher obtains the data directly to the research object by:
3. Observation
By holding observation directly to the objects that JCo's restaurant &coffee in
South Jakarta and Tangerang (Bumi Serpong Damai).
4. Questionnaire
By spreading questionnaire that contained structured statement to get the
require information from the respondent.
3.4.2 Type and Source of data
The data of this research obtain from two resources, which are primary data
and secondary data.
1. Primary Data
Primary data defined as the way of collecting the data from
original source for the first time by researcher or investigator
for their own purpose (Kothari, 2004), or a process of
collecting data for the first time for a certain research
(McMurray, Pearson, Scott, & Pace, 2004) sometimes also
called as first-hand information.
1. Survey
In this research the primary data collected by survey
method through distributing questionnaire. According to
Mahotra and Pearson, 2002 in (Tandi, 2008) Survey is a
structured questionnaire given to a sample of population
and designed to specific information from respondent. In

30
this research, the primary data collected by survey method
through distributing the questionnaire.
2. Questionnaire
Questionnaire method usually used for big quantity of
respondents, and can be distributed directly, via internet,
e-mail, or post to the respondents. In this research,
questionnaire using likert scale, the most favored
measuring tool nowadays, it does not require the
respondents to rate the items but the researcher prepares it
(McNabb, 2013). The objective of this measurement is to
see the extent of participant agreement with each item.
3. Demographic
This study has a clear demographic orientation,
characteristic considered in this study were age and
gender. The respondents should meet the requirements
before fill in the questionnaire offered, they have to be a
regular customers at food franchise industry around South
Jakarta and South Tangerang.
2. Secondary Data
Secondary data are those data or information that already exist and
collected by someone else for his or her study (Kothari, 2004). Usually
this information is merely a compilation of some data based on the
study or research done before. Secondary data can be various, such as
archives, company sources, records, and others. In this research, those
secondary data collected from books and journals.

31
3.5 Analysis method
To solve the problem in this research, the researcher implemented quantitative
analysis.
3.5.1 Research instrument
The data obtained from the results of the questionnaire to each variable will
be given score with Likert scale. Where an alternative answer to the respondent was
given a score of 1 to 6, with an alternate answer strongly agree, agree, Agree with
doubt, Doubt with disagree, disagree, strongly disagree (Chomeya,2010).
3.6 Quantitative Analysis
Quantitative analysis is the analysis of data that obtained from the research
with a statistical method for measuring the amount of influence the variables. To
know the influence of the variables, the testing of hypotheses tested by calculation
statistics. A quantitative analysis used in this research is:
3.6.1 Validity test
Validity test is a tool that uses to measure the validity of a questionnaire. In
short, it is concerning to what was to be measured was actually measured. Validity
also defines as the degree to which evidence and a theoretical rationale support the
standard and defines the appropriateness of summary and actions based on the scores
of data or information (Lissitz, 2009). Researcher tested validity using Factor
Analysis.
Factor analysis is a multivariate statistical procedure that used to
examine all the variables for interdependence (Malhotra, 2010). In general, this
method used to examine small number of factors that used to represent relationship
32
among interrelated variables. According to Nunnally in Yamaguchi (2008) there are
several steps in factor analysis to be tested:
1. KMO and Barlett Test
This research is using factor analysis to find out what extent independent
variables influence dependent variable. There are two criteria used to determine
whether factor analysis appropriate statistically by Kaisar-Meyer-Olkin (KMO)
measure of adequacy and Bartlett Test of sterility (Simamora, 2005). The standard of
KMO value should be more than (0.5), when KMO is less than (0.5), the factor
analysis is not appropriate to use (Child, 2006). Bartlett Test of sterility is a statistical
test used to test either variable in the research has correlation or not (Simamora,
2005). The significant value of Bartlett test should be significant (p < 0.05) for factor
analysis to be suitable (Wiliams, 2012).
2. Communalities
According to Malhotra (2010), communalities is the appropriate test shows
the amount of variance (in percentage) a variable that can be defined by the formed
factors. The standard of communalities values should be greater than (>0.5). When
there are the value less than (0.5) then the item of question should be taken out. The
greater communalities value of one variable will create the strong relation with the
formed factors.
3. Total Variance
In total variance table, there is cumulative column which representing a
percentage of the variance being explained in this study. The requirement of

33
cumulative percentage is 60%, but it would be great if the percentage is much higher.
(Lehner & Bredl, 2011).
4. Factor Rotation
Rotated component matrix show the factor loading of each variable on the
component and represent the partial correlation between item and rotated factor.
Factor loading show the correlation between variable and components (Santoso,
Statistik Multivariat, 2010).
3.6.2 Reliability test
Reliability test is an instrument to measure the questionnaire as indicators
from variables (Ghozali, 2001). Since unreliable construct cannot be valid, the first
thing to do is asses the reliability test. Reliability test is purposed to describe the
overall consistency of a measurement and seek the correlation’s answer between
respondent (K.Malhotra, 2010). The measuring process has been done with statistic
Cronbach Alpha (α). According to Nunnaly (1967) in Ghozali (2001), the following
decision rule of the reliability test is as follows:
a. if the Cronbach Alpha value is above 0,6 the following variable is reliable
b. if Cronbach Alpha value is below 0,6 the following variable is not reliable
3.6.3 Multiple Linear Regression Analysis
Regression analysis is a study that used to define the dependence of dependent
variable on one or more independent variable, to estimate the average value of
dependent variable (Ghozali as cited in Andini, 2012). Regression with more than one
independent variable called as multiple regressions, a condition when two or more
independent variables are used in a linear regression analysis (Richter, 2012). The
general form of the multiple regressions can be formulated as:

34
Y = a + b1X1 + b2X2 + b3X3 + b4X4 + b5X5 + b6X6 + e
Where:
Y define as the dependent variable (Brand loyalty)
X1 = variable 1 (Brand name)
X2 = variable 2 (Product quality)
X3 = variable 3 (Price)
X4 = variable 4 (Store environment)
X5 = variable 5 (Promotion)
X6 = variable 6 (Service quality)
3.6.4. Classic Assumption
3.6.4.1. Normality
Defines as a basic assumption in regression, where residuals are distributed in
a normal and independent way. In the case of measuring the normality of a study,
researcher can check whether the distributions are illustrated through a straight line in
the plot or not (Richter, 2012). Ghozali (2006) stated that normality test can be
detected through scatter plot performance on the diagonal line in the graph, or by
analyze the histogram. Based on:
a. If the data are scattered around diagonal line and come after the line or
the histogram graph perform a normal distribution form, meaning that the normality
assumption is acceptable.

35
b. If the data are not scattered around diagonal line and/or not come after
the line or the histogram graph does not perform a normal distribution form, meaning
that the normality assumption is not acceptable.
3.6.4.2. Multicollinearity
It refers to a situation in which more than one explanatory variables are
linearly dependent (Van den Poel and Lariviere, 2004) and multicollonearity used to
calculate the matrix value. T
His situation can be detected by:
a. When regression having a similarity value with R2, which is very high. But
there are a lot of not significant independent variables.
b. There are several variables with eigen value closer to zero. (Prastisto, 2004)
Ghozali (2006) explain about multicollinearity test can be detected by two
ways. The first, tolerance value and the opposite, the second is VIF (Variance
Inflation Factor). If the tolerance value is 0.10 or less and equal to VIF of 10, means
that there is an exact collinearity detected (Jacob Cohen, 2013).
3.6.4.3. Heterocedasticity
Represent the variances of error terms that might occur in regression model
are not constant over different sample observations. The figure will indicates that the
magnitude of error terms is a function of the size of object being studied (Lee, Lee, &
Lee, 2013). This method will help in defines a problem when researcher would like to
estimating parameters in the regression model. The easiest way in examine a
heterocedasticity is by look at the plot of the residuals against the independent
variables or expected values. (Lee, Lee, & Lee, 2013). To detect a heterocedasticity
in a research can be done by analyzing the scatter plot. If the scatters plot form a

36
particular pattern, meaning that there is a heterocedasticity in the regression. On the
other hand, if the scatter plot does not perform particular pattern, there is no
heterocedasticity detected (Prastisto, 2004).
3.6.5 Testing the Hypothesis
To accept and reject the research hypothesis that has been formulated, t test an
f test is needed.
a. F test
F test usually using ANOVA (Analysis of variance), F test is used to test the
significance of the overall multiple regression model. This test determines whether
there is significant relationship between the dependent variable and independent
variables (Berenson, Levine, & Krehbiel, 2005). If the significance level for the F-test
is less than (<0.05), means rejecting H0 and conclude that the relationship between
variables does exist, and vice versa.
b. T test
T test usually using coefficients table, which is used to determine the effect of
each independent variable toward dependent variable. This test aims to see whether
independent variable partially influence dependent variable partially (Malhotra,
2010). If the significant <0.05, Ha do not rejected and H0 rejected. Otherwise, if the
significant >0.05, Ha rejected and H0 do not rejected.
3.6.6. Adjusted R Square
According to Malhotra (2010) adjusted R square used to find out the relation
between two or more independent variables with dependent variable. The value of R
is around 0 to 1, the relation is stronger when the value approaches 1, vice versa.

37
CHAPTER IV
THE ANALYSIS OF DATA AND INTERPRETATION
4.1 The History of J Co Donuts and Cofee in Indonesia
The J-Co is owned by Johnny Andrean, an owner network business franchise
of salon and BreadTalk in Indonesia. J-Co is inspired by USA donuts. Johnny is
always doing business trips to USA and having chance to enjoy various kinds of
flavors and uniqueness donuts. First time, he wanted to buy a network marketing
franchise of USA donuts but he found several product limitations. The limitations are
on raw material and weakness in quality control.
Then Johnny decided to develop his own production without having to buy
franchise donut from USA. He chose to produce a perfect shape and sense donuts as
he had tried in the USA, with a special focus on the quality of raw materials and
production processes.

38
On his return to Indonesia, he develops a donut outlet with the similar
concept, shape and taste with USA donut outlets. Johnny has observed that none of
Indonesian donut outlets, which has an open kitchen concept, so he started in J.CO.
Thus, in addition to having a different flavor, the concept of the outlet is also created
as an open kitchen so the consumers can see the various attractions in the making of
donuts, from mixing the ingredients until the donuts ready for sale.
J.Co donuts are made by machines, including mixing the ingredients, cooking
and making donuts toppings. The only human labor is only at the time of making
donuts, which also use the mold tool.
All machines used fully imported from USA, also with the basic ingredients,
more than 50% is imported from abroad. For example, chocolate and milk, chocolate
is imported from Belgium and milk from New Zealand. And for drinks, the
ingredients mostly imported. Most coffee powder imported from Italy and Costa
Rica. Based on all this, J.CO is positioned as a premium-quality product in the
Indonesian market donuts.
Some people may argue that J.CO logo has similarities with the Starbucks
logo, but if observed carefully, it is different. The spherical shape may be the same,
but it is not a trademark.
39
J.CO Donuts & Coffee uses peacock symbols on their logo. The peacock
symbolizes beauty, neatness, softness and timelessness. The beauty and subtlety
reflected from flavors and shapes of donut. While immortality can be seen from the
Loyalty of consumers who are willing to stand in the long queue stores just to get
their favorite J-Co donut.
Each donut creatively named based toppings and flavors. This creates a
unique and easy to remember, for example, Chees Me Up is the name for a donut
with melted cheese on top layer. Tira Miss U is the name for a donut with tiramisu
topping.
Johnny take three years before launching J.CO Donuts & Coffee to the
Indonesian market. Three years used to prepare standards and production procedures,
selection of raw materials, improve the quality of products and production processes,
as Good as business operations.
However, J.CO has been presented in the Indonesian market. The first outlet
opened in Supermall Karawaci Tangerang (not far from Jakarta) on June 26, 2005.
J.CO Donuts & Coffee in Indonesia is controlled and owned by Johnny himself,
while overseas outlet franchise, Good known J.CO Donuts & Coffee franchise is
owned by Singapore's BreadTalk group.
JCO is now opened for franchise and spread abroad. Enjoy J.CO.
4.2 The analysis of Qualitative and Interpretation
4.2.1 Profile of Respondents
This study was conducted on 350 consumers J.Co Donuts and Coffee in
Indonesia by distributing questionnaires. The questionnaire distributed directly to the
350 consumers to be filled completely in accordance with the existing conditions.

40
From the 350 questionnaires, only 327 questionnaires were returned, so that the data
used in this study only 327 questionnaires. It shows that the rate of return the
questionnaire by consumers J.Co Donuts and Coffee in Indonesia quite good, which
amounted to 93.4%. The profile of the respondents in this study can be seen in the
following table:
Table 4. 2. Profile of Respondents
Characteristic of Responden Number %
Sex gender
- Male 171 52,29
- Female 156 47,71
Total number 327 100
Level of Education
- < S-1 101 30,89
- S-1 128 39,14
- S-2 98 29,97
Total number 327 100
Profession
- Officer 148 45,26
- Collage student 106 32,41
- Etc 73 22,33
Total number 327 100
Source: Processed Data, 2014
Table 4.2 shows that consumers J.Co Donuts and Coffee in Indonesia, mostly
are male with a number of 171 people (52.29%); mostly have higher education (S1
41
and S2) with a number of 226 people (69.11%) and the majority of the civil servants,
employees and entrepreneurs profession with the number of 148 people (45.26%).
Descriptive statistics aims to provide an overview or description of the data in
the form of responses or perceptions respondents on Brand Name, Product Quality,
Price, Store Environment, Promotion, Service Quality, and Brand Loyalty in J.Co
Donuts and Coffee in Indonesia, so it can be more easily understood.
According to Martiasrus (2013) These are analytical formula descriptions
percentage used to calculate observation results:
Percentage (%): n/N x 100 %
Where n: Score obtain
N: The total number of the ideal value of each item multiplied by the
number respondents
These are the descriptive score (Martiasrus, 2013) refer to the percentage:
01 % – 20 % : Very Poor
21 % – 40 % : Poor
41 % – 60 % : Enough
61 % – 80 % : Good
81 % – 100 % : Very Good
Based on respondents' answers, it can be seen criteria respondents rating
based on Brand Name, Product Quality, Price, Store Environment, Promotion,
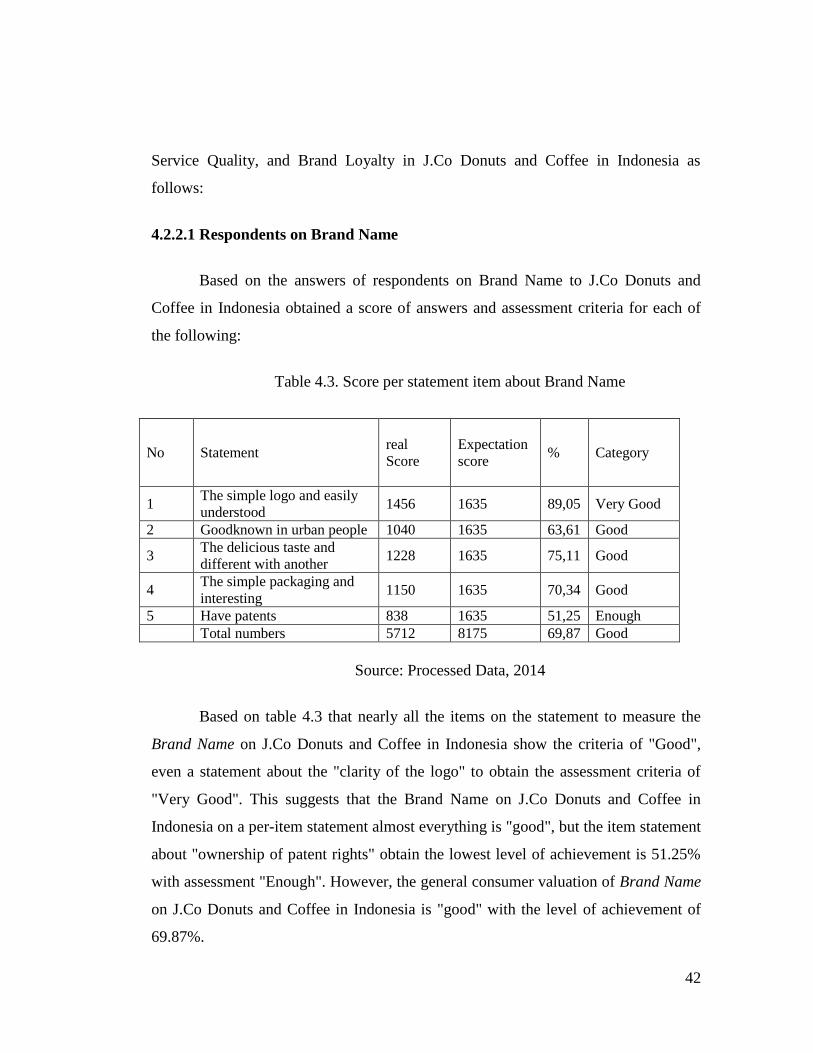
42
Service Quality, and Brand Loyalty in J.Co Donuts and Coffee in Indonesia as
follows:
4.2.2.1 Respondents on Brand Name
Based on the answers of respondents on Brand Name to J.Co Donuts and
Coffee in Indonesia obtained a score of answers and assessment criteria for each of
the following:
Table 4.3. Score per statement item about Brand Name
No Statement
real
Score
Expectation
score % Category
1 The simple logo and easily
understood 1456 1635 89,05 Very Good
2 Goodknown in urban people 1040 1635 63,61 Good
3 The delicious taste and
different with another 1228 1635 75,11 Good
4 The simple packaging and
interesting 1150 1635 70,34 Good
5 Have patents 838 1635 51,25 Enough
Total numbers 5712 8175 69,87 Good
Source: Processed Data, 2014
Based on table 4.3 that nearly all the items on the statement to measure the
Brand Name on J.Co Donuts and Coffee in Indonesia show the criteria of "Good",
even a statement about the "clarity of the logo" to obtain the assessment criteria of
"Very Good". This suggests that the Brand Name on J.Co Donuts and Coffee in
Indonesia on a per-item statement almost everything is "good", but the item statement
about "ownership of patent rights" obtain the lowest level of achievement is 51.25%
with assessment "Enough". However, the general consumer valuation of Brand Name
on J.Co Donuts and Coffee in Indonesia is "good" with the level of achievement of
69.87%.
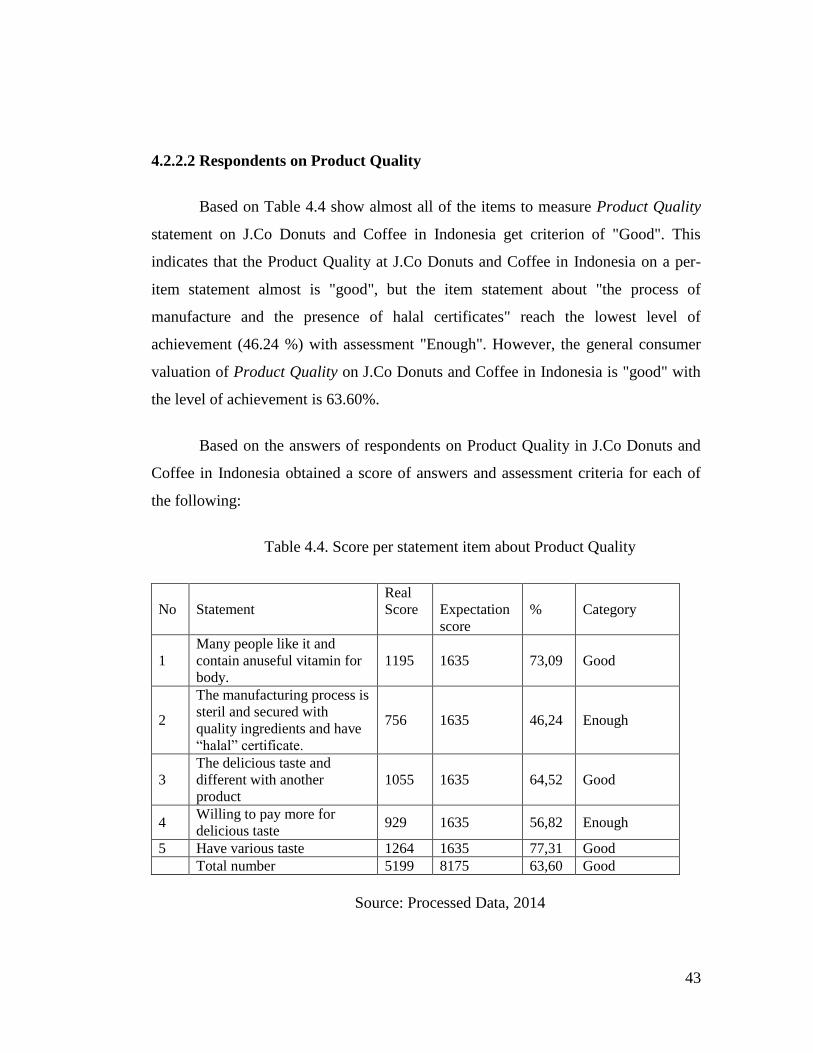
43
4.2.2.2 Respondents on Product Quality
Based on Table 4.4 show almost all of the items to measure Product Quality
statement on J.Co Donuts and Coffee in Indonesia get criterion of "Good". This
indicates that the Product Quality at J.Co Donuts and Coffee in Indonesia on a per-
item statement almost is "good", but the item statement about "the process of
manufacture and the presence of halal certificates" reach the lowest level of
achievement (46.24 %) with assessment "Enough". However, the general consumer
valuation of Product Quality on J.Co Donuts and Coffee in Indonesia is "good" with
the level of achievement is 63.60%.
Based on the answers of respondents on Product Quality in J.Co Donuts and
Coffee in Indonesia obtained a score of answers and assessment criteria for each of
the following:
Table 4.4. Score per statement item about Product Quality
No Statement
Real
Score
Expectation
score
% Category
1
Many people like it and
contain anuseful vitamin for
body.
1195 1635 73,09 Good
2
The manufacturing process is
steril and secured with
quality ingredients and have
“halal” certificate.
756 1635 46,24 Enough
3
The delicious taste and
different with another
product
1055 1635 64,52 Good
4 Willing to pay more for
delicious taste 929 1635 56,82 Enough
5 Have various taste 1264 1635 77,31 Good
Total number 5199 8175 63,60 Good
Source: Processed Data, 2014
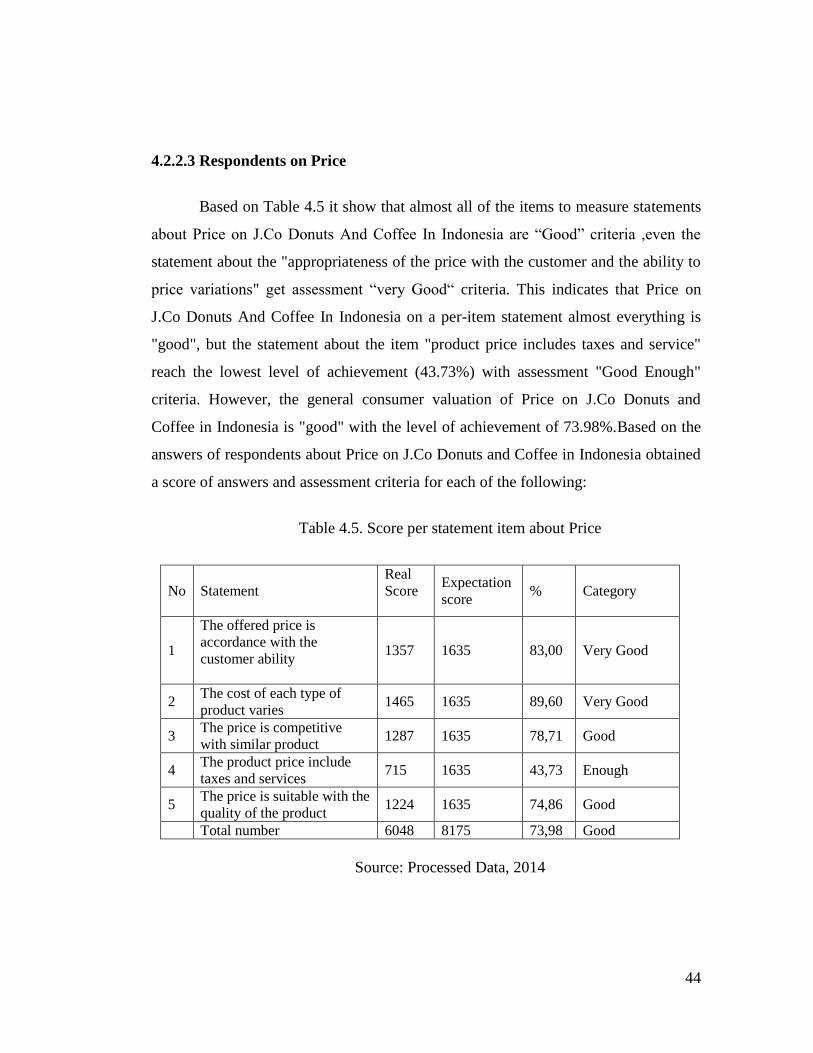
44
4.2.2.3 Respondents on Price
Based on Table 4.5 it show that almost all of the items to measure statements
about Price on J.Co Donuts And Coffee In Indonesia are “Good” criteria ,even the
statement about the "appropriateness of the price with the customer and the ability to
price variations" get assessment “very Good“ criteria. This indicates that Price on
J.Co Donuts And Coffee In Indonesia on a per-item statement almost everything is
"good", but the statement about the item "product price includes taxes and service"
reach the lowest level of achievement (43.73%) with assessment "Good Enough"
criteria. However, the general consumer valuation of Price on J.Co Donuts and
Coffee in Indonesia is "good" with the level of achievement of 73.98%.Based on the
answers of respondents about Price on J.Co Donuts and Coffee in Indonesia obtained
a score of answers and assessment criteria for each of the following:
Table 4.5. Score per statement item about Price
No Statement
Real
Score
Expectation
score % Category
1
The offered price is
accordance with the
customer ability
1357 1635 83,00 Very Good
2 The cost of each type of
product varies 1465 1635 89,60 Very Good
3 The price is competitive
with similar product 1287 1635 78,71 Good
4 The product price include
taxes and services 715 1635 43,73 Enough
5 The price is suitable with the
quality of the product 1224 1635 74,86 Good
Total number 6048 8175 73,98 Good
Source: Processed Data, 2014

45
4.2.2.4 Respondents of the Store Environment
Based on Table 4.6 it appears that nearly all the items on the statement to
measure the Store Environment on J.Co Donuts And Coffee In Indonesia get "good"
criteria even the statement about "strategic location and attractive outlets" get
assessment "Very Good" criteria. This indicates that the Store Environment on J.Co
Donuts And Coffee In Indonesia as a per-item statement almost everything is "good",
but the statement about the item "Placement Outlet" get the lowest level of
achievement (34.01%) with the " Enough" assessment. However, the general
consumer valuation of Store Environment on J.Co Donuts and Coffee in Indonesia is
"good" with the level of achievement of 64.23%.
Based on the answers of the respondents of Store Environment on J.Co
Donuts and Coffee in Indonesia obtained a score of answers and assessment criteria
for each of the following:
Table 4.6. Score per statement item about Store Environment
No Statement
Rreal
Score
Expectation
score % Category
1 The available outlet is on
strategic location. 1337 1635 81,77 Very Good
2 Booth layout is quite
attractive to buyers 1344 1635 82,20 Very Good
3 The outlet interior design is
quite interesting 1228 1635 75,11 Good
4
Placement Outlet is
harmonious and show
available product
556 1635 34,01 Enough
5 Make easier for buyers to
buy products 786 1635 48,07 Enough
Total number 5251 8175 64,23 Good
Source: Processed Data, 2014

46
4.2.2.5 Respondents on Promotion
Based on Table 4.7 it appears that all of the items to measure statements about
the Promotion J.Co Donuts and Coffee in Indonesia get “Good” criteria, even the
statement about "selective Promise" obtain assessment “Very Good” criteria. This
suggests that the Promotion at J.Co Donuts and Coffee in Indonesia on a per-item
statement almost everything is "good", and in general consumer valuation of
Promotion on J.Co Donuts and Coffee in Indonesia is "good" with the level of
achievement 75, 22%.
Based on the answers of respondents on the Promotion J.Co Donuts and
Coffee in Indonesia obtained a score of answers and assessment criteria for each of
the following:
Table 4.7. Score per statement item about Promotion
No Statement
Rreal
Score
Expectation
score % Category
1 The promotion get many
attention 1204 1635 73,64 Good
2 Promotion of the company is
selective 1335 1635 81,65 Very Good
3 The promotion media used 1271 1635 77,74 Good
4 The huge number of used
promotion media 1101 1635 67,34 Good
5
The promotion is selectively
by let live and product
packages
1238 1635 75,72 Good
6 Total number 6149 8175 75,22 Good
Source: Processed Data, 2014
4.2.2.6 Respondents on Service Quality
Based on Table 4.8 it appears that nearly all the items on the statements to
measure Service Quality in J.Co Donuts And Coffee In Indonesia get “enough”

47
criteria, even the statement about "telephone service" assessment criteria to obtain
"Poor" with the level of achievement of the most low (30.82%). However, the
general consumer valuation of the Service Quality on J.Co Donuts and Coffee in
Indonesia is "Enough" to the level of achievement of 55.84%.
Based on the answers of respondents, Service Quality in J.Co Donuts and
Coffee In Indonesia obtained a score of answers and assessment criteria for each of
the following:
Table 4.8. Score per statement item about Service Quality
No Statement
Rreal Score
Expectation
score % Category
1 The physical facility of
services is attractive 1264 1635 77,31 Good
2 The services is convincing
and enjoyable 1279 1635 78,23 Good
3 The tool used for service is a
quite modern. 819 1635 50,09 Enough
4
The customer
communication and store is
easily understood
699 1635 42,75 Enough
5
The services can be
accessed by phone for
delivery order
504 1635 30,82 Poor
Total number 4565 8175 55,84 Enough
Source: Processed Data, 2014
4.2.2.7 Respondents on Brand Loyalty
Based on Table 4.9 it appears that almost all of the items to measure statement
about Brand Loyalty on J.Co Donuts and Coffee in Indonesia get the “good” criteria.
This indicates that Brand Loyalty on J.Co Donuts And Coffee In Indonesia on a per-

48
item statement almost everything is "good", but the item statement about "the buying
back" get the lowest level of achievement is 43.06% with the assessment " Enough "
criteria. However, the general consumer valuation of Brand Loyalty on J.Co Donuts
And Coffee In Indonesia is "good" with the level of achievement 60.65%.
Based on the answers of respondents, Brand Loyalty on J.Co Donuts and
Coffee in Indonesia obtained a score of answers and assessment criteria for each of
the following:
Table 4.9. Score per statement item about Brand Loyalty
No Statement Real Score
Expectatio
n score % Category
1
If I want to buy a J-Co product, I will
buy it again because I have known the
J-Co product quality
704 1635 43,06 Enough
2
I would recommend J-Co product to
others because I have felt the comfort
afforded by the J-Co product
1003 1635 61,34 Good
3
I am willing to pay more for the J-co
because had proven of quality, price, etc
and have competitive price with similar
product
1166 1635 71,31 Good
4 If one day I am not satisfied with the
service J-Co, I will tell to J-Co outlet 1070 1635 65,44 Good
5 I'm interested in increasing the number
of another J-Co products 1015 1635 62,08 Good
Total number 4958 8175 60,65 Good
Source: Processed Data, 2014
4.3. Data Analysis (Test Validity and Reliability Test)
4.3.1. Test Validity (Factor Analysis)
In order to find out what extent independent variable influence mediator and
dependent variable, this research using factor analysis to analyze the most influence
factor in this research. The first step is testing the all of independent variables.

49
4.3.1.1 Factor Analysis of Independent Variables
1. KMO and Bartlett test
Table 4.10. KMO and Bartlett's Test
Kaiser-Meyer-Olkin Measure of Sampling Adequacy. .826
Bartlett's Test of Sphericity Approx. Chi-Square 6.556E3
Df 435
Sig. .000
Kaiser-Meyer-Olkin criterion (value are between 0 to 1) cand 0.826 is quite
high and acceptable. On the other hand, Bartlett test also accepted if the significance
is less than 0.05, in this research the significance is 0.0001.
Based on table below, all the variables are acceptable because they meet the
requirement of communalities value which should be above 0.5. So, there is no need
to take out any question from the questionnaire.
2. Communalities
Then the researcher tried to run the next factor analysis by using the variables
in the table 4.11. The result is as follows:
The result of table 4.12 shows that Store Environment (X4) variables are
separated one to another or not in the same component. So, the reseracher try to re-
run the process by excluding the Store Environment (X4) variables. The result is as
follows:
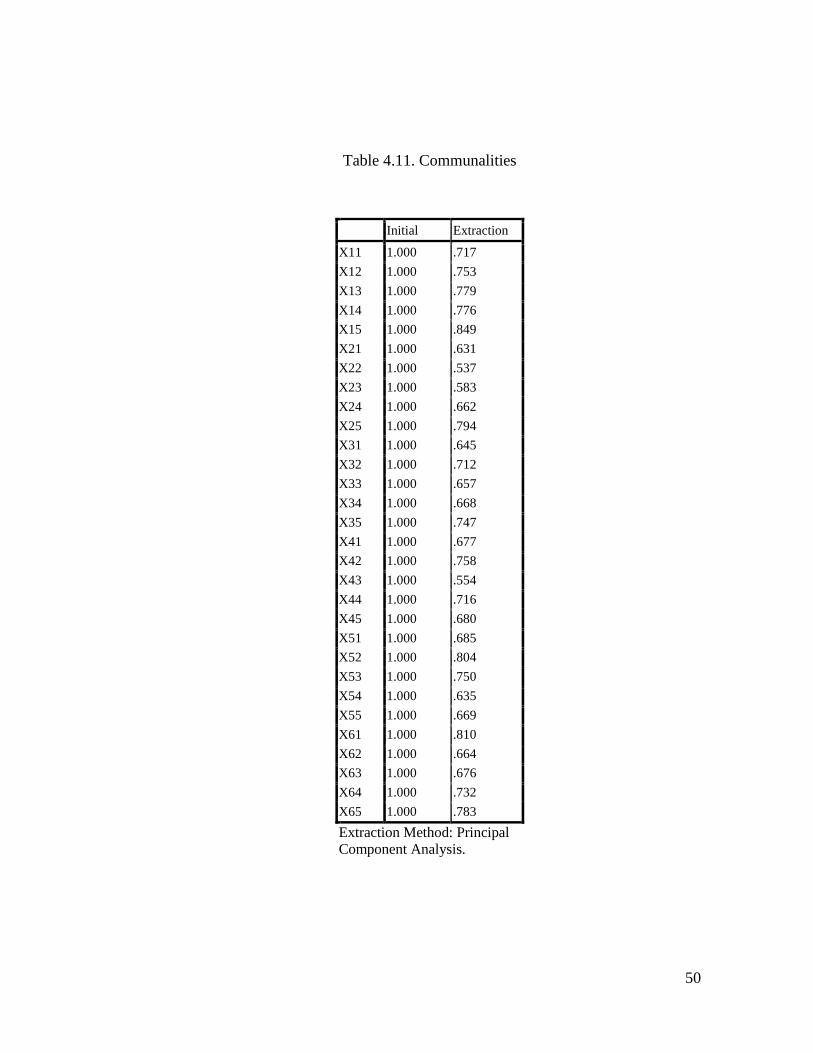
50
Table 4.11. Communalities
Initial Extraction
X11 1.000 .717
X12 1.000 .753
X13 1.000 .779
X14 1.000 .776
X15 1.000 .849
X21 1.000 .631
X22 1.000 .537
X23 1.000 .583
X24 1.000 .662
X25 1.000 .794
X31 1.000 .645
X32 1.000 .712
X33 1.000 .657
X34 1.000 .668
X35 1.000 .747
X41 1.000 .677
X42 1.000 .758
X43 1.000 .554
X44 1.000 .716
X45 1.000 .680
X51 1.000 .685
X52 1.000 .804
X53 1.000 .750
X54 1.000 .635
X55 1.000 .669
X61 1.000 .810
X62 1.000 .664
X63 1.000 .676
X64 1.000 .732
X65 1.000 .783
Extraction Method: Principal
Component Analysis.

51
Table 4.12. Rotated Component Matrix of Variables
Rotated Component Matrixa
Component
1 2 3 4 5 6
X41 .802
X31 .773
X42 .760
X35 .748
X25 .702
X32 .648
X33 .586
X21 .577
X23 .552
X43
X54
X44 .806
X65 .804
X63 .708
X45 .702
X64 .683
X34 .672
X22 .648
X24 .555
X52 .812
X53 .809
X55 .722
X51 .683
X13 .817
X12 .800
X11 .553
X61 .813
X62 .586
X15 .836
X14 .539 .593
Extraction Method: Principal Component Analysis.
Rotation Method: Varimax with Kaiser Normalization.
a. Rotation converged in 7 iterations.
The result of table 4.13 shows that Price (X3) variables are separated one to
another or not in the same component. So, the reseracher try to re-run the process by
excluding the Price (X3) variables. The result is as follows:
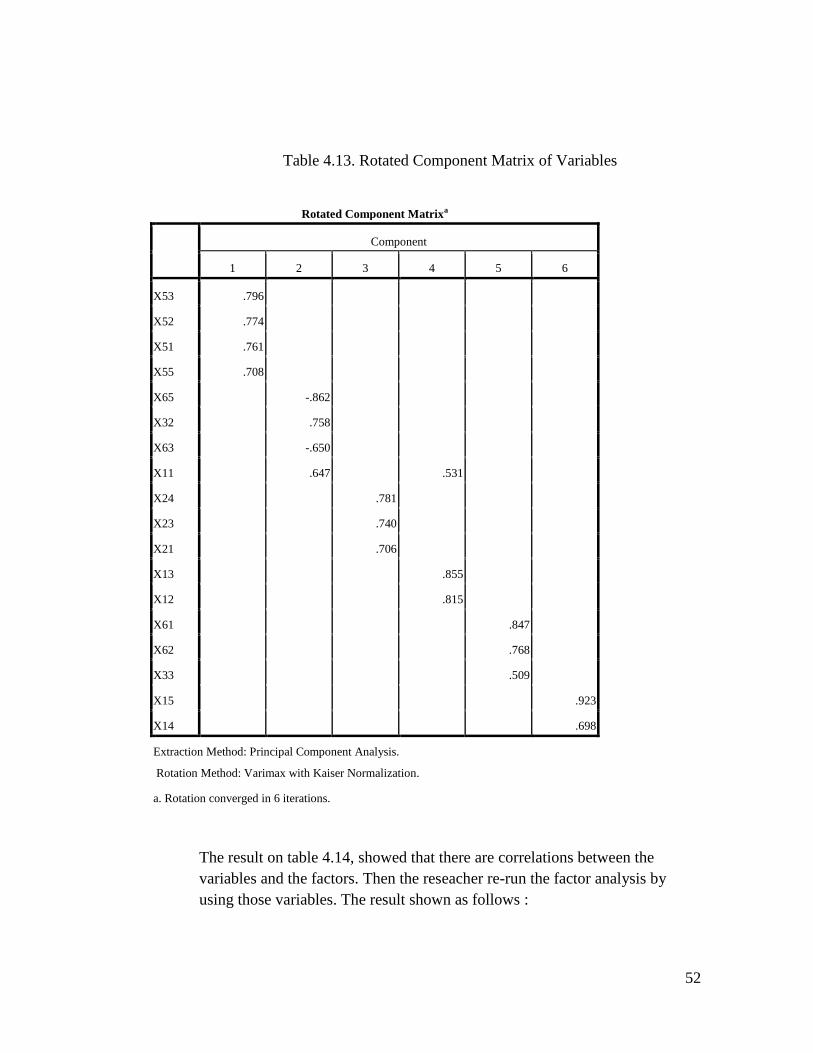
52
Table 4.13. Rotated Component Matrix of Variables
Rotated Component Matrixa
Component
1 2 3 4 5 6
X53 .796
X52 .774
X51 .761
X55 .708
X65 -.862
X32 .758
X63 -.650
X11 .647 .531
X24 .781
X23 .740
X21 .706
X13 .855
X12 .815
X61 .847
X62 .768
X33 .509
X15 .923
X14 .698
Extraction Method: Principal Component Analysis.
Rotation Method: Varimax with Kaiser Normalization.
a. Rotation converged in 6 iterations.
The result on table 4.14, showed that there are correlations between the
variables and the factors. Then the reseacher re-run the factor analysis by
using those variables. The result shown as follows :

53
Table 4.14. Final Rotated Component Matrix of Variables
Rotated Component Matrixa
Component
1 2 3 4
X53 .806
X52 .786
X51 .761
X55 .658
X24 .826
X23 .695
X21 .694
X22 .644
X12 .844
X13 .778
X14 .764
X61 .839
X62 .776
Extraction Method: Principal Component Analysis.
Rotation Method: Varimax with Kaiser Normalization.
a. Rotation converged in 6 iterations.
Table 4.15. Final KMO and Bartlett’s Test
KMO and Bartlett's Test
Kaiser-Meyer-Olkin Measure of Sampling Adequacy. .798
Bartlett's Test of Sphericity Approx. Chi-Square 1.884E3
Df 78
Sig. .000

54
Kaiser-Meyer-Olkin criterion (value are between 0 to 1) and 0.798 is
acceptable. On the other hand, Bartlett test also accepted if the significance is less
than 0.05, in this research the significance is 0.0001.
Table 4.16 - Final Communalities
Communalities
Initial Extraction
X12 1.000 .792
X13 1.000 .705
X14 1.000 .653
X21 1.000 .717
X22 1.000 .584
X23 1.000 .555
X24 1.000 .703
X51 1.000 .712
X52 1.000 .769
X53 1.000 .724
X55 1.000 .646
X61 1.000 .776
X62 1.000 .784
Extraction Method: Principal Component
Analysis.
Based on table 4.16, all the variables are acceptable because they meet the
requirement of communalities value which should be above 0.5. Those accepted
variables are: Brand Name 2 (X12), Brand Name 3 (X13), Brand Name 4 (X14),
Product Quality 1 (X21), Product Quality 2 (X22), Product Quality 3 (X23), Product
Quality 4 (X24), Promotion 1 (X51), Promotion 2 (X52), Promotion 3 (X53)
Promotion 5 (X55), Service Quality 1 (X61), and Service Quality 1 (X61).
3. Total Variance Explain
As we can see from table 4.17, cumulative percentage is 69,384% which is
good because it represents that 69.38% of the independent variable offered are cover
up factors that influencing dependent variable.

55
Table 4.17. Total Variance Explained
Total Variance Explained
Component
Initial Eigenvalues Extraction Sums of Squared Loadings Rotation Sums of Squared Loadings
Total % of Variance Cumulative % Total % of Variance Cumulative % Total % of Variance Cumulative %
1 5.102 39.246 39.246 5.102 39.246 39.246 2.557 19.667 19.667
2 1.515 11.651 50.897 1.515 11.651 50.897 2.445 18.804 38.472
3 1.373 10.561 61.458 1.373 10.561 61.458 2.272 17.476 55.948
4 1.030 7.926 69.384 1.030 7.926 69.384 1.747 13.437 69.384
5 .733 5.640 75.024
6 .693 5.330 80.355
7 .591 4.543 84.898
8 .554 4.263 89.160
9 .380 2.923 92.083
10 .317 2.436 94.519
11 .289 2.220 96.739
12 .227 1.750 98.489
13 .196 1.511 100.000
Extraction Method: Principal Component Analysis.
4. Rotated Component Matrix
As per result on table 4.16, there are correlations between the variables
and the factors. The first factor loading is Brand Name variable, which
are Brand Name 2 (0.792), Brand Name 3 (0.705), Brand Name 4
(0.653). Next is Product Quality variable, which are Product Quality 1
(0.717), Product Quality 2 (0.584), Product Quality 3 (0.555), Product
Quality 4 (0.703). Next is Promotion variable, which are Promotion 1
(0.712), Promotion 2 (0.769), Promotion 3 (0.724) Promotion 5

56
(0.646). The last one is Service Quality variable, which are Service
Quality 1 (0.776), and Service Quality 1 (0.784)
Table 4.18 – Final Rotated Component Matrix
Rotated Component Matrixa
Component
1 2 3 4
X53 .806
X52 .786
X51 .761
X55 .658
X24 .826
X23 .695
X21 .694
X22 .644
X12 .844
X13 .778
X14 .764
X61 .839
X62 .776
Extraction Method: Principal Component Analysis.
Rotation Method: Varimax with Kaiser Normalization.
a. Rotation converged in 6 iterations.
4.3.1.2 Factor Analysis of Dependent Variable
1. KMO and Bartlett test
Kaiser-Meyer-Olkin value should be between 0 to 1. The closer to 1 the better
the value. The dependent variable’s KMO value is 0.721 which is acceptable. On the
other hand, Bartlett test also accepted if the significance is less than 0.05, in this
research the significance is 0.0001

57
Table 4.19. KMO and Bartlett's test
2. Communalities
Table 4.20. Communalities
Based on table 4.20, not all the variables are acceptable because there are two
values which below 0.5. Therefore, those dependent variables will be taken out
The final results of dependent variable are:

58
Table 4.21. KMO and Bartlett's test
Based on table 4.21, KMO and Bartlett of dependent variable has been
accepted from both side. With KMO 0,617 and Bartlett is less than 0.05, in this
research the significance is 0.0001.
Table 4.22. Communalities
Based on result after reprocess, all the variables are acceptable because their
value are above 0.5. From table 4.22 the remaining variables are Y3, Y4, and Y5.
3. Total Variance Explain
Table 4.23. Total Variance Explained
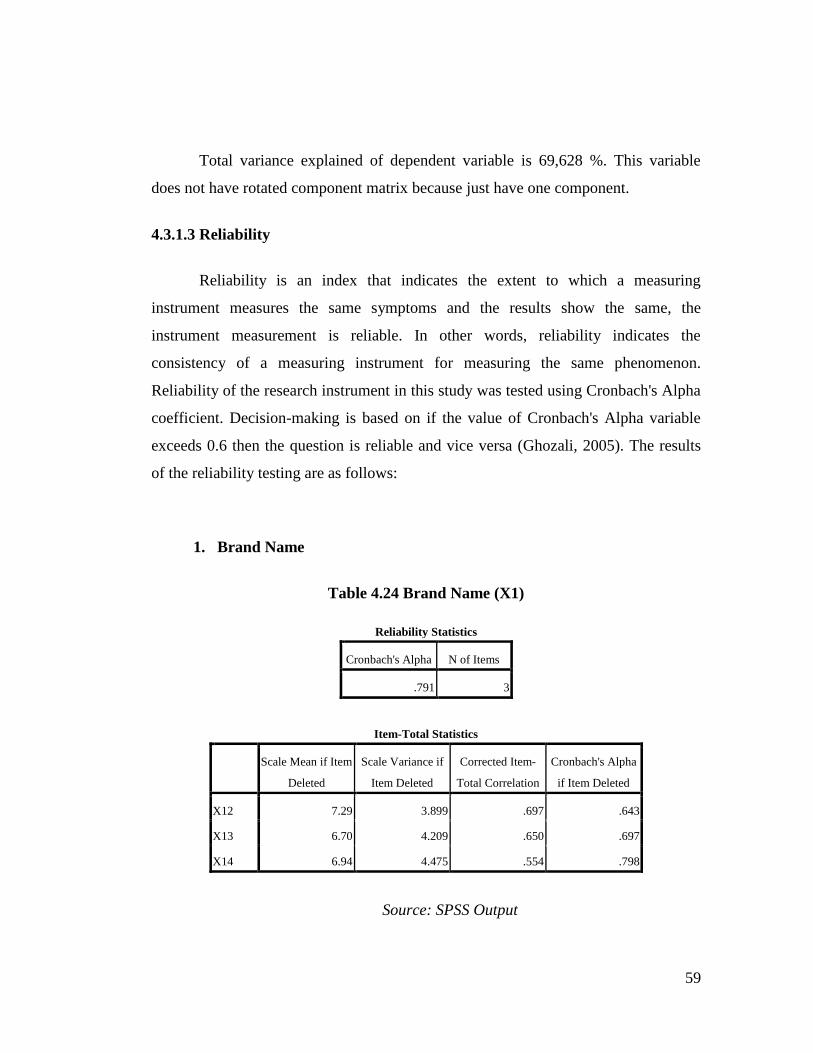
59
Total variance explained of dependent variable is 69,628 %. This variable
does not have rotated component matrix because just have one component.
4.3.1.3 Reliability
Reliability is an index that indicates the extent to which a measuring
instrument measures the same symptoms and the results show the same, the
instrument measurement is reliable. In other words, reliability indicates the
consistency of a measuring instrument for measuring the same phenomenon.
Reliability of the research instrument in this study was tested using Cronbach's Alpha
coefficient. Decision-making is based on if the value of Cronbach's Alpha variable
exceeds 0.6 then the question is reliable and vice versa (Ghozali, 2005). The results
of the reliability testing are as follows:
1. Brand Name
Table 4.24 Brand Name (X1)
Reliability Statistics
Cronbach's Alpha N of Items
.791 3
Item-Total Statistics
Scale Mean if Item
Deleted
Scale Variance if
Item Deleted
Corrected Item-
Total Correlation
Cronbach's Alpha
if Item Deleted
X12 7.29 3.899 .697 .643
X13 6.70 4.209 .650 .697
X14 6.94 4.475 .554 .798
Source: SPSS Output

60
Based on the result on table 4.24, cronbach’s alpha of Brand Name
variable is 0.791, which is good. There is one item can be deleted if
the researcher want to increase the alpha value.
.
2. Product Quality
Table 4. 25. Product Quality (X2)
Reliability Statistics
Cronbach's Alpha N of Items
.761 4
Item-Total Statistics
Scale Mean if Item
Deleted
Scale Variance if
Item Deleted
Corrected Item-
Total Correlation
Cronbach's Alpha
if Item Deleted
X21 8.38 6.512 .644 .658
X22 9.72 7.760 .502 .736
X23 8.81 7.046 .511 .731
X24 9.19 6.033 .598 .686
Source: SPSS Output
Based on the result on table 4.25, cronbach’s alpha of Product Quality
variable is 0.761, which is good. There is no item can be deleted to increase the alpha
value.

61
3. Promotion
Table 4.26. Promotion (X5)
Reliability Statistics
Cronbach's Alpha N of Items
.832 4
Source: SPSS Output
Based on the result on table 4.26, cronbach’s alpha of Promotion variable is
0.832, which is good. There is no item can be deleted to increase the alpha value.
4. Service Quality
Based on the result on table 4.27, cronbach’s alpha of Service Quality variable
is 0.701, which is good. There is no item can be deleted to increase the alpha value.
Table 4.27. Service Quality (X6)
Item-Total Statistics
Scale Mean if Item
Deleted
Scale Variance if
Item Deleted
Corrected Item-
Total Correlation
Cronbach's Alpha
if Item Deleted
X51 11.76 6.989 .574 .827
X52 11.35 6.782 .756 .749
X53 11.55 6.561 .707 .766
X55 11.65 6.743 .620 .806
Reliability Statistics
Cronbach's Alpha N of Items
.701 2

62
Source: SPSS Output
.
5. Brand Loyalty
Based on the result on table 4.28, cronbach’s alpha of Brand Awareness
variable is 0.775, which is good. There is one item can be deleted to
increase the alpha value.
Table 4.28. Brand Loyalty (Y)
Item-Total Statistics
Scale Mean if Item
Deleted
Scale Variance if
Item Deleted
Corrected Item-
Total Correlation
Cronbach's Alpha
if Item Deleted
Y3 6.38 4.585 .524 .786
Y4 6.67 3.866 .578 .742
Y5 6.84 3.860 .751 .546
Source: SPSS Output
Item-Total Statistics
Scale Mean if Item
Deleted
Scale Variance if
Item Deleted
Corrected Item-
Total Correlation
Cronbach's Alpha
if Item Deleted
X61 3.91 1.032 .547 .a
X62 3.87 1.424 .547 .a
a. The value is negative due to a negative average covariance among items. This violates
reliability model assumptions. You may want to check item codings.
Reliability Statistics
Cronbach's Alpha N of Items
.775 3

63
Based on the table above shows that the variable Brand Name (X1), Product
Quality (X2), Promotion (X5), Service Quality (X6) and Brand Loyalty (Y) indicates
the value of the coefficient of Cronbach's Alpha exceeds 0.6. Those condition means
that all of these variables can be used in subsequent analysis.
4.4. Analysis of Multiple Linear Regression
4.4.1. Classic Assumption Test
The data in regression model should meet the requirement of assumption tests.
Classical assumption test including normality test, Heterocedasticity test, and
multicollinearity test.
4.4.1.1 Normality Test
The first normality histogram in table 4.29 shows that the data spread to the
entire normal curve area, which means the data has a normal distribution. Normality
P-plot chart also shows that the data spread around the diagonal line, which means
the data also has a normal distribution.
Table 4.29. Histogram

64
Table 4.30. Normal P-P Plot of Regression Standardized Residual
4.4.1.2 Multicollinearity
Multicollinearity test aims to test whether the regression model find a
correlation between the independent variables. The general guidelines to limit the
value of tolerance and VIF to the regression model is free from multicollinearity is
above 10% for tolerance and below of 10 for VIF (Variance Inflation Factor). The
result in the table 4.31 shows all the variables have not any multicolinearity
problems.
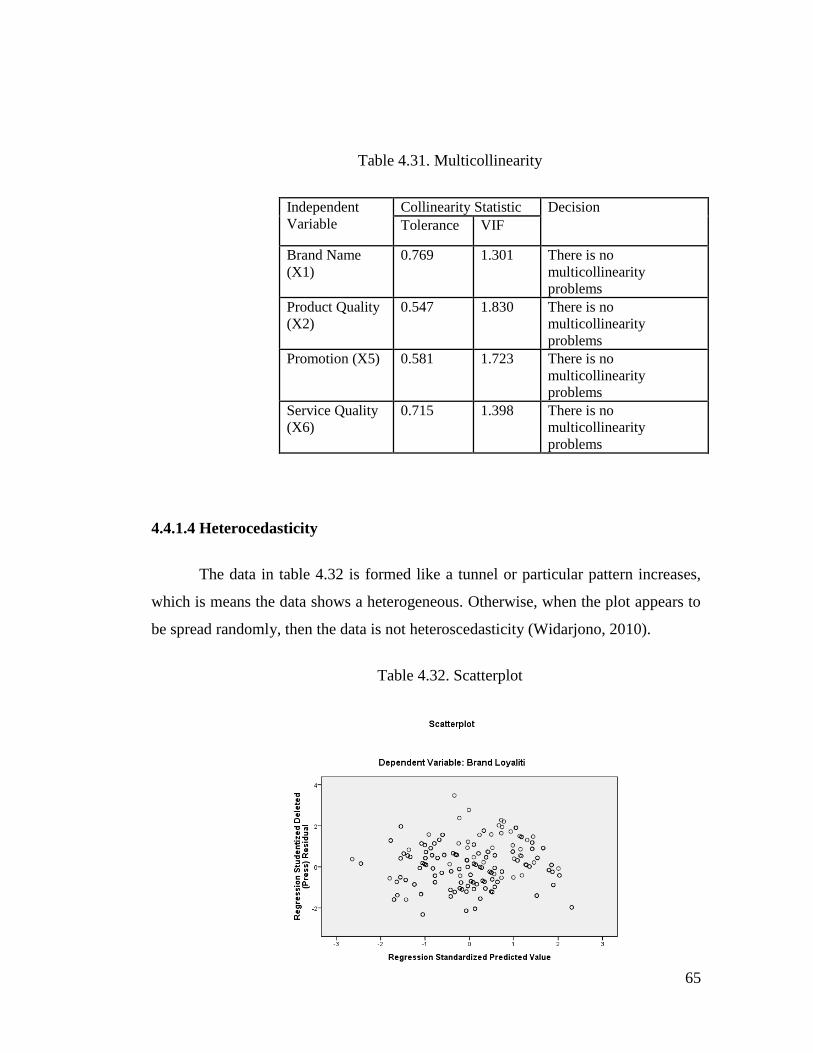
65
Table 4.31. Multicollinearity
Independent
Variable
Collinearity Statistic Decision
Tolerance VIF
Brand Name
(X1)
0.769 1.301 There is no
multicollinearity
problems
Product Quality
(X2)
0.547 1.830 There is no
multicollinearity
problems
Promotion (X5) 0.581 1.723 There is no
multicollinearity
problems
Service Quality
(X6)
0.715 1.398 There is no
multicollinearity
problems
4.4.1.4 Heterocedasticity
The data in table 4.32 is formed like a tunnel or particular pattern increases,
which is means the data shows a heterogeneous. Otherwise, when the plot appears to
be spread randomly, then the data is not heteroscedasticity (Widarjono, 2010).
Table 4.32. Scatterplot
66
4.4.2. Testing of Hypothesis
The Statistical tools were used to test the hypothesis is multiple linear
regression (multiple regression). The aim is to connect multiple linear regression of
the dependent variable with several independent variables in a single predictive of
capital. The influence of the independent variable on the dependent variable was
tested at a significance level of 5%. The decision-making criteria in the acceptance
and rejection of each hypothesis are to compare the calculated value with the value
table for each regression coefficient. If the calculated value is smaller than the table
value, the hypothesis of Ho is rejected and vice versa if the calculated value is greater
than the table value, then Ha is accepted. In addition to the comparison criteria
calculated value with the value of the table, also used the criteria of p value. P value ≥
0.05 then Ho is rejected (insignificant) and vice versa p value ≤ 0.05 then Ha
accepted (significant).
4.4.2.1. F Test – ANOVA
F test or ANOVA table is used to understand the influence of all independent
variables toward dependent variables. In table 4.33, F test result shows in the table is
(96.501) with significant value (0.000) which means that independent variables
simultaneously influence dependent variable.
F test is used to determine whether there is influence jointly (simultaneously)
from the independent variables (free) to the dependent variable (bound) between the
independent variables in the model between variables of Brand Name (X1), Product
Quality (X2), Price (X3), Store Environment (X4), Promotion (X5), Service Quality
(X6) on the dependent variable (dependent) Brand Loyalty (Y). Proving is done by
looking at the magnitude of the probability value (p value) compared to 0.05 (Level
of significance α = 5%). The test criteria were used as follows:

67
Ho: There are no effect Brand Name (X1), Product Quality (X2), Price (X3),
Store Environment (X4), Promotion (X5), Service Quality (X6) on Brand Loyalty (Y)
Ha: There are influence of Brand Name (X1), Product Quality (X2), Price
(X3), Store Environment (X4), Promotion (X5), Service Quality (X6) on Brand
Loyalty (Y).
The test results of multiple linear regression model obtained F value is 96.501
with a significance probability of 0.000. Thus Ho is rejected and Ha is accepted, it
means that the variables Brand Name (X1), Product Quality (X2), Price (X3), Store
Environment (X4), Promotion (X5), Service Quality (X6) as simultaneously have
significant impact on Brand Loyalty (Y)
Table 4.33. F test - Anova
ANOVAb
Model Sum of Squares df Mean Square F Sig.
1 Regression 4095.350 4 1023.838 96.501 .000a
Residual 3416.307 322 10.610
Total 7511.657 326
a. Predictors: (Constant), Service Quality, Brand Name, Promotion, Product Quality
b. Dependent Variable: Brand Loyaliti
4.4.2.2. T-Test (Coefficients Table)
Analysis of Multiple linear regression was used to determine the influence of
the independent variables (independent), are Brand Name (X1), Product Quality
(X2), Price (X3), Store Environment (X4), Promotion (X5), Service Quality (X6) to
variable bound (dependent) are Brand Loyalty (Y) which can be calculated by using
the SPSS software SPSS for Windows 18. The calculation results together can be
seen in the following table:

68
Table 4.34. The Model of Regression Equation
Source: Primary data processed with SPSS software
Based on the above table, obtained the model multiple linear regression
Standardized Coefficients as follows:
𝑌 = −1.380 + 0.135𝑋1 + 0.276 𝑋2 + 0.211𝑋5 + 0.560 𝑋6
The multiple linear regression models can be interpreted as follows:
a. The coefficient of regression of the variable X1 (Brand Name) obtained 0.135
with a positive coefficient. This indicates that the variables Brand Name
contributes positively to Brand Loyalty of 0.135 or 13.5% with an estimated
standard error are 0.052.
b. The coefficient regression of variable X2 (Product quality) obtained 0,276
with positive coefficient. This indicates that the product quality variable have
positive contribution to Brand Loyalty with 0.276 or 27,6 % and estimated
standard error are 0,061.
c. The regression coefficient of X5 variable (Promotion) of obtained 0.211 with
a positive coefficient. This indicates that the variable of Promotion makes a
Model
Unstandardized Coefficients Standardized Coefficients
T Sig. B Std. Error Beta
1 (Constant) -1.380 1.026 -1.345 .180
Brand Name .135 .052 .112 2.619 .009
Product Quality .276 .061 .231 4.551 .000
Promotion .211 .057 .183 3.703 .000
Service Quality .560 .061 .408 9.177 .000
a. Dependent Variable: Brand Loyaliti
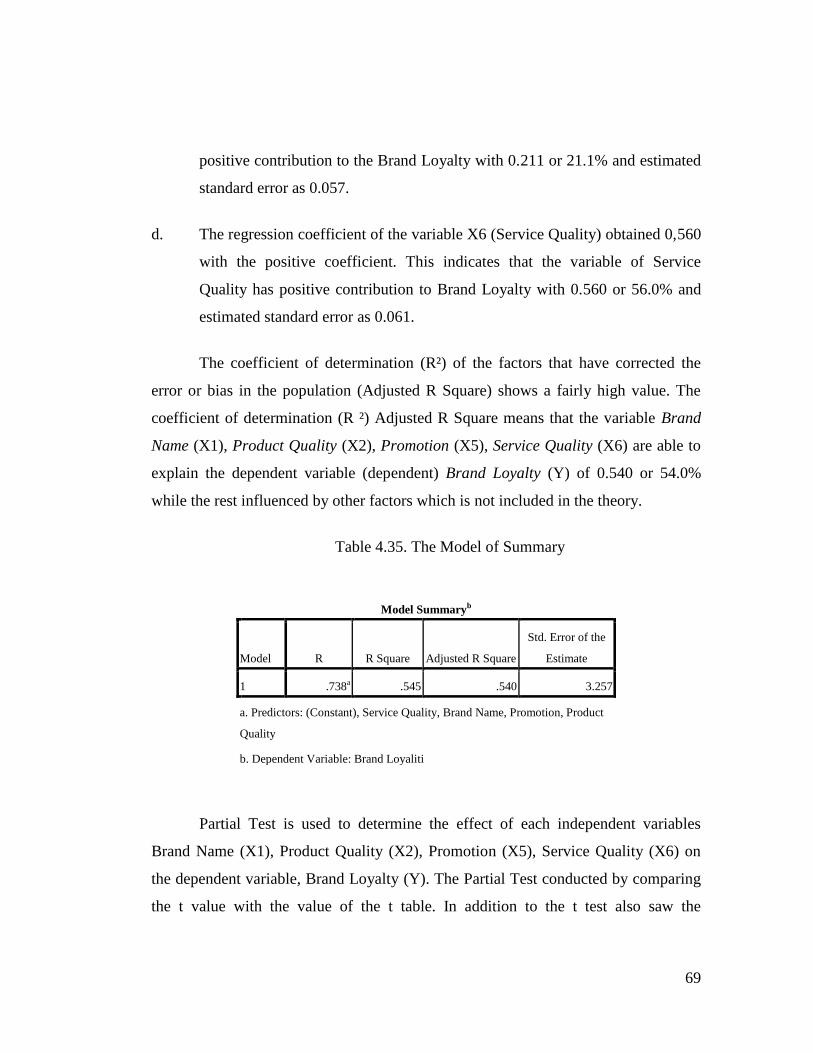
69
positive contribution to the Brand Loyalty with 0.211 or 21.1% and estimated
standard error as 0.057.
d. The regression coefficient of the variable X6 (Service Quality) obtained 0,560
with the positive coefficient. This indicates that the variable of Service
Quality has positive contribution to Brand Loyalty with 0.560 or 56.0% and
estimated standard error as 0.061.
The coefficient of determination (R²) of the factors that have corrected the
error or bias in the population (Adjusted R Square) shows a fairly high value. The
coefficient of determination (R ²) Adjusted R Square means that the variable Brand
Name (X1), Product Quality (X2), Promotion (X5), Service Quality (X6) are able to
explain the dependent variable (dependent) Brand Loyalty (Y) of 0.540 or 54.0%
while the rest influenced by other factors which is not included in the theory.
Table 4.35. The Model of Summary
Partial Test is used to determine the effect of each independent variables
Brand Name (X1), Product Quality (X2), Promotion (X5), Service Quality (X6) on
the dependent variable, Brand Loyalty (Y). The Partial Test conducted by comparing
the t value with the value of the t table. In addition to the t test also saw the
Model Summaryb
Model R R Square Adjusted R Square
Std. Error of the
Estimate
1 .738a .545 .540 3.257
a. Predictors: (Constant), Service Quality, Brand Name, Promotion, Product
Quality
b. Dependent Variable: Brand Loyaliti
70
magnitude of the probability value (p value) compared with 0.05 (Level of
significance α = 5%).
Based on Table 4.34 above the regression model, it can be described as
follows:
a. Hypothesis Test of brand name influenced (X1) to Brand Loyalty (Y)
Brand name has significant value of 0.009 and it is smaller than 0.05
(Level of significance α = 5%). This means that the variable Brand Name
(X1) have significant positive impact on Brand Loyalty (Y). While the views
of the value of the regression coefficient Brand Name variable (X1) is
positive, it indicates that the increasing respondents' perceptions about Brand
Name (X1) can result in an increasing in Brand Loyalty (Y). It can be
concluded that H1 is accepted.
b. Hypothesis Test of product quality influenced (X2) to Brand Loyalty (Y)
Product quality has significant value of 0.000 and it is less than 0.05
(Level of significance α = 5%). This means that the variable of Product
Quality (X2) have significant and positive effect on Brand Loyalty (Y). While
the views of the value of the regression coefficient of the variable Product
Quality (X2) is positive, it indicates that the increase in respondents'
perceptions of Product Quality (X2) can result an increasing in Brand Loyalty
(Y). It can be concluded H2 is accepted.
c. Hypothesis Test of Promotion influenced (X5) to Brand Loyalty (Y)
Promotion has significant value of 0.000 and it is less than 0.05 (Level
of significance α = 5%). This means that the variable of Promotion (X5) have
significant and positive impact on Brand Loyalty (Y). While the views of the

71
value of the regression coefficient Promotion variable (X5) is positive, it
indicates that the increase in respondents' perceptions of Promotion (X5) can
result an increasing Brand Loyalty (Y). It can be concluded H5 is accepted.
d. Hypothesis Test of Service quality influenced (X6) to Brand Loyalty (Y)
Service quality has significant value of 0.000 it is less than 0.05 (Level
of significance α = 5%). This means that the variable of Service Quality (X6)
have a significant and positive impact on Brand Loyalty (Y). While the views
of the value of the regression coefficient of the variable Service Quality (X6)
is positive, it indicates that the increase in respondents' perceptions of Service
Quality (X6) can result increasing Brand Loyalty (Y). It can be concluded H6
is accepted.
4.5. Interpretation of result
The test results of multiple linear regression model obtained F value indicate
that the independent variables Brand Name (X1), Product Quality (X2), Price (X3),
Store Environment (X4), Promotion (X5), Service Quality (X6) as simultaneously
have significant impact on Brand Loyalty (Y). This result is equal to the researches
by Woong Fong Yee and Yahyah Sidek (2008) which indicates that brand loyalty
variables has significance impact to brand loyalty.
From the calculation of the t value greater than the table value, while the
magnitude of the probability is smaller than 0.05 (Level of significance α = 5%). This
means that the variable Brand Name (X1) have significant positive impact on Brand
Loyalty (Y). This result is related to the research by Woong Fong Yee and Yahyah
Sidek (2008) that Brand Name has significant impact to Brand Loyalty.
From the calculation of the t value greater than the table value, while the
magnitude of the probability less than 0.05 (Level of significance α = 5%). This
72
means that the variable of Product Quality (X2) have significant and positive effect
on Brand Loyalty (Y). This result is related to the research by Woong Fong Yee and
Yahyah Sidek (2008) that Product Quality has significant impact to Brand Loyalty.
This result also related to the research by Hossein Nezakati, Yee Lee Kuan And
Omid Asgari, (2011) entitled Factors influencing customer loyalty towards fast food
restaurant that shows Product Quality has significant impact to customer loyalty
towards fast food restaurant.
From the calculation of the t value obtained greater than the table value, while
the magnitude of the probability value less than 0.05 (Level of significance α = 5%).
This means that the variable of Promotion (X5) have significant and positive impact
on Brand Loyalty (Y). This result is related to the research by Woong Fong Yee and
Yahyah Sidek (2008) that Promotion has significant impact to Brand Loyalty.
From the calculation of the t value obtained greater than the table value of,
while the magnitude of the probability value less than 0.05 (Level of significance α =
5%). This means that the variable of Service Quality (X6) have a significant and
positive impact on Brand Loyalty (Y). This result is related to the research by Woong
Fong Yee and Yahyah Sidek (2008) that Service Quality has significant impact to
Brand Loyalty. This result is also related to the research by Yong Azrina Ali Akbar
And Muharratul Sharifah Alaudeen, (2012) entitled Determinant of factors that
influence consumer in choosing normal full-service restaurant: case in seri iskandar,
perak that shows Service quality has significant influence towards consumers in
choosing normal full-service restaurant.

73
CHAPTER V
CONCLUSIONS AND RECOMENDATION
5.1 Conclusions
Based on the results of research and discussion on The Influence of Brand
name, Product Quality, Price, Store Environment, Promotion and Service Quality
towards Brand Loyalty: a Case of Jco donut and Coffee in South Jakarta and South
Tangerang, it can be concluded as follows:
1. The Brand Name in J.Co Donuts and Coffee in Indonesia generally is "good", but
the statement about the items' ownership of patent rights "show the lowest level
of achievement of the assessment" Enough "criteria and Brand Name have a
positive and significant impact on Brand Loyalty. This can be seen in the results
of the regression test showed that the beta value for Brand Name is a positive and
hypothesis testing results show that the value p is smaller than the value of alpha.
2. The Product Quality on J.Co Donuts And Coffee In Indonesia generally is
"good", but the item statement about "the process of creation and existence of
halal certificate" get the lowest level of achievement of the assessment " Enough"
criteria and The Product Quality have the positive effect and significant impact on
Brand Loyalty. It can be seen in the regression test results showing that the value
of beta for Product Quality is positive and hypothesis testing results show that the
value p value is smaller than the value of alpha.
3. Price on J.Co Donuts and Coffe in Indonesia generally is “good’. But the item has
been eliminated because in the factor rotation process, Price items were separated
one to another or not in the same component. So, the researcher re-run the factor
analysis process without including those price items.

74
4. Store Environment on J.Co Donuts and Coffe in Indonesia generally is “good’.
But the item has been eliminated because in the factor rotation process, Store
Environment items were separated one to another or not in the same component.
So, the researcher re-run the factor analysis process without including those Store
Environment items.
5. Promotion on J.Co Donuts and Coffee in Indonesia generally is "good", and
Promotion have positive and significant impact to Brand Loyalty. It can be seen
in regression testing show beta value for promotion is positive and the result of
hypothesis testing show p value is smaller than alpha value.
6. Service Quality on J.Co Donuts And Coffee In Indonesia generally is "Enough",
even on the item statement about "telephone service" obtain the lowest level of
achievement with the assessment criteria of "Poor" and Service Quality have the
positive and significant impact to Brand Loyalty. It can be seen in the regression
test results showing that the value of beta for the Service Quality is positive and
hypothesis testing results show that the value p is smaller than the value of alpha.
7. Apart from the variables that already discussed above, there might be other
factors that are not mentioned in this study. Since all the independent variable can
only predict 54%, the other factors might come from external, for example
Customer satisfaction, Brand Image, Brand Trust, Place or the Location of the
store and etc.
5.2. Recommendation
Based on the above conclusions, the attempts that must be done by J.Co
Donuts and Coffee in Indonesia for increasing Brand Loyalty is as follows:
75
1. For the company
Based on the result above, the ownership of the patent rights has a low score,
probably driven by the name of J.Co did not representative of Indonesian
name, so people referring more to the foreign brand. Company must put more
focus to emphasize J.Co as a local brand with international standard to attract
more interest that Indonesian has a really good brand that can be compared to
the international brand.
Majority of Indonesian citizen are Moslem, the “halal” label can be a
trigger for people to buy the products, with the idea of J.Co is not an
Indonesian brand they will be consider that J.Co may not be a khoser
products, this problem can also be one of the preference of buying the
products. Company can also put the “halal” label on the products to make
customers easier to identify the khoser of the products.
Mostly of restaurant and food place are putting the price exclude the
tax and service charge. For such restaurant like a J.Co where people are
queuing in the line and order their product directly in the cashier lane it will
be hard for them to calculate how much is the nett price of the products. This
can be an idea for the J.Co to include the price with tax and services.
Furthermore, the J.Co has less variety in the menus, which most of their
products are in a set of package e.g. one dozen, half dozen etc. Which will be
easier if the price in displays are already include with the tax and service
charge. Also, this probably can faster people to queue in the line.
Even though the Store Environment variable is already in a good rate,
the statement “the placement of the outlets” is still enough rates. This
probably because most of the J.Co outlets are located inside the malls or rest
area, which will be harder for the customers that want to just buy the products,

76
they should come inside the store. J.Co also can consider placing their outlets
in stand-alone store for them to buy only the products without coming inside
malls.
Promotion variable already significant impact to the Brand Loyalty,
this can be a good point for the company. Although they still have to maintain
this particular variable to manage their customer’s loyalty.
Last variable is the Service Quality, this particular variable is already
in a good rate but the item “telephone service” is rated as poor. This probably
caused by the service of the workers in-charge for telephone service/delivery
have a low knowledge on how to service the customer by the phone.
Company can provide training for those who work in this particular position
on how they greet, they manage to answer the call and response to particular
questions in a certain amount of time. So this can be more effective for the
company.
2. For the other researcher
This study can be a base for the next research in terms of certain
variable such as Brand Name, Product Quality, Price, Store Environment,
Promotion and Service Quality. Also, the next research can focus on the
improvement of existing deficiencies and factors that are not mentioned in
this particular study, such as Customer satisfaction, Brand Image, Brand
Trust, Place or the Location of the store and etc.
Based on the result of adjusted R2 in this research, there is a big
opportunity for future researcher to reach higher value of determinant, which
represents the contribution of Brand Name, Product Quality, Price, Store
Environment, Promotion and Service Quality on Brand loyalty or if future
research want to use this variable to research in another service field.
77
REFERENCES
Books
Child, D. (2006). The Essentials of Factor Analysis. United Kingdom:
Bloomsbury Academic.
Evans, M., Moutinho, L., & Raaij, W. F. V. (1996). Applied Consumer
Behavior. Addison-Wesley: Harlow
Keller, K. L. (2008). Strategic Brand Management: Building, Measuring, and
Managing Brand Equity (3 rd edition). Upper Saddle River, NJ: Prentice Hall.
Keller, K. L. (2003) Strategic Brand Management: Building, Measuring and
Managing Brand Equity. Prentice Hall: New Jersey.
Kotler, P. & Armstrong, G. (2004). Principle of Marketing. (10th edition). New
Jersey: Prentice Hall
McNabb, D. E. (2013). Research Methods in Public Administration and Nonprofit
Management: Quantitative and Qualitative Approaches. M.E. Sharpe.
Prastisto, A. (2004). Cara Mudah Mengatasi Masalah Statistik dan Rancangan
Percobaan dengan SPSS 12. Elex Media Komputindo.
Proctor R. W. & Capaldi E. J. (2008). Why Science Matters: Understanding the
Methods of Psychological Research.
Rubin, A. & Babbie, E. R. Research Methods for Social Works. 8th edition.
Santoso, S. (2010). Statistik Multivariat. Jakarta: PT. Elex Media Komputindo.
Sekaran, U., & Bougie, R. (2010). Research Methods for Business : A Skill Business
Approach. New York: John Willey

78
Supranto, J. 2008. STATISTIK teori dan aplikasi. Jakarta: Raja Grafindo persada.
Taylor,. G.R. (2005). Integrating Quantitative and Qualitative Methods in Research.
University Press of America.
Journals
Algesheimer, R., Dholakia, M. U., & Herrmann, A. (2005). The Social Influence of
Brand Community: Evidence From European Car Clubs. Journal of
Marketing Vol. 69, 19-34.
Alloza, A. (2008). Brand Engagement and Brand Experience At BBVA: The
Transformation of a 150 Years Old Company. Corporate Reputation Review,
Vol. 11, 371-381
Bowden, J. (2009). Customer Engagement: A Framework for Assessing Customer
Brand Relationships: The Case of the Restaurant Industry. Journal of
Hospitality Marketing & Management, Vol. 18, 574-596
Brakus, J., Josko, Schmitt, B. H., & Zarantonello, L. (2009). Brand Experience: What
is it? How is it measured? Does it affect loyalty? Journal of marketing, Vol.
73, 52-68.
Cadogan, J. W. & Foster, B. D. (2000). Relationship Selling and Customer Loyalty:
An Empirical Investigation. Marketing Intelligence and Planning, Vol. 18,
185-199.
Chomeya, R. (2010). Quality of Psychology Test Between Likert Scale 5 and 6
Points. Journal of Social Sciences.
Delgado- Ballester, E. & Munuera - Alemán, J. L. (2001). Brand Trust in The
Context of Consumer Loyalty. European Journal of Marketing, Vol. 35,
1238-1258.
F.R. Sofia. (n.d). Pengaruh Harga, Kualitas Produk, Dan Citra Merek Terhadap
Keputusan Pembelian Kecap Manis Merek Bango(Studi Kasus Para Ibu
Rumah Tangga Di Komplek Villa Mutiara Johor Ii Dan Taman Johor Mas).
Universitas Sumatera Utara.
Ghozali, Imam. 2006. Aplikasi Analisis Multivariate Dengan Program SPSS.
Semarang: Badan Penerbit Universitas Diponegoro.

79
Han, H., & Rye, K. (2009). The roles of the physical environment, price perception,
and customer satisfaction in determining customer loyalty in the restaurant
industry. J. Hosp. Tour. Res., 33(4), 487-510Hong-Youl, H. & Perks, H.
(2005). Effects of Consumer Perceptions of Brand Experience on The Web:
Brand Familiarity, Satisfaction and Brand Trust. Journal of Consumer
Behaviour, Vol. 4, 438-452
Huddleston, P., Whipple, J. and Van Auken, A. (2004) Food Store Loyalty:
Application of a Consumer Loyalty Framework, Journal of Targeting,
Measurement and Analysis for Marketing, 12, 213-230.
Iglesias, O., Singh, J. & Batista- Foguet, J. M. (2011). The Role of Brand Experience
and Affective Commitment in determining Brand Loyalty. Journal of Brand
Management, Vol. 18, 570-582.
Kotler, P. & Armstrong, G. (2012). Principles of Marketing 14th ed, New Jersey:
Prentice Hall. Lau, M. M., Chang, M. S., Moon, K. and Liu, W. S. (2006) The
Brand Loyalty of Sportswear in Hong Kong, Journal of Textile and Apparel,
Technology and Management, 5, 1-13.
Lee, J., Lee, J., & Feick, L. (2001). The Impact of Switching Costs on The Customer
Satisfaction Loyalty Link: Mobile Phone Service in France. The Journal of
services Marketing, 15(1), 35-48.
Lin, M. Y. and Chang, L. H. (2003) Determinant of Habitual Behavior for National
and Leading Brand in China, Journal of Product and Brand Management. 12,
94-107.
Malhotra, N. K. (2007) Marketing Research: An Applied Orientation (5th ed.).
Pearson/Prentice Hall: New Jersey.
Martiasrus (2013) Analisis Studi Kasus Penerjemahan Menggunakan Transtool
Google Dari Bahasa Jepang Ke Dalam Bahasa Indonesia, 24 - 25 z
Nezakati, H., Kaun, Y. L., & Omid, A., (2011). Factors Influencing Customer
Loyalty towards Fast Food Restaurants. International Conference on Sociality
and Economics Development, 12-16
Parsa H.G, Amy G & Terry M, (2011). Why do Restaurant Fail? PART III: AN
ANALYSIS OF MACRO AND MICRO FACTORS. The Dick Pope Sr.
Institute for Tourism Studies
80
Prasanna, M., & Punniyanmoorthy. (2007). An Empirical Model for Brand Loyalty
Measurement. Journal of Targeting, Measurement and Analysis for
Marketing, 15.
Punniyamoorthy, & Prasanna, M. R. (2007). An Empirical Model for Brand Loyalty
Measurement. Journal of Targeting, Measurement and Analysis for
Marketing, p. 15.
Rehman, and waheed (2007). Factors affecting Brand Loyalty: a perspective of fast
food restaurants
Russell, R. S. and Taylor, B. W. (2006) Operation Management: Quality and
Competitiveness in a Global Environment (5th Ed.). John Wiley & Sons, Inc.:
RiverStreet.
Shulz R.N. (2012). EFFECTS OF BRANDING ON RESTAURANTS’ IMAGE: A
CASE OF SELECTED RESTAURANTS IN NAIROBI, KENYA. European
Journal of Business and Social Sciences, Vol. 1, No. 8, pp 56-66,
Simamora, B. (2005). Analisi Multivariat Pemasaran. Jakarta: Gramedia Pustaka.
Tat, H.H (2011). Consumers’ Purchase Intentions in Fast Food Restaurants: An
Empirical Study on Undergraduate Students. The Special Issue on
Contemporary Issues in Business and Economics
Taylor, S.A., Hunter, G.H. and Longfellow, T.A. (2006), Testing an expanded
attitude model of goal-directed behavior in a loyalty context, Vol.19, pp.18-
39.
To, C. K. M., and Leung, C. S. (2001) Service-enhanced Manufacturing: Study of
Perceived Service Quality of Apparel Manufacturers, Journal of Fashion
Marketing and Management, 5, 313-323.
Wong, A. (2004). The role of emotional satisfaction in service encounters. Managing
Service Quality, 14(5), 365-376
Yee, W. F., & Sidek, Y. (2008). Influence of Brand Loyalty on Consumer Sportwear.
International Jurnal of Economics and Management.
Yoon, S. J. and Kim, J. H. (2000) An Empirical Validation of a Loyalty Model based
on Expectation and Disconfirmation. Journal of Consumer Marketing, 17,
120-136.

81
Internet
Cruz, D. A. (2013). Tray’s Anatomy: The Donut Battle between J.Co and Krispy
Kreme. Retrieved from
http://www.pepper.ph/trays-anatomy-jco-vs-krispy-kreme/
Morris. (n.d). Factor Analysis. Retrieved from
http://www.coe.fau.edu/faculty/morris/sta7114%20files/lab%209/9a%20in
structions/factor_analysis_page.htm
Projecting Indonesia. (2012). The Amazing J.Co Donuts & Coffee. Retrieved from:
http://projectingindonesia.com/economy-2/companies/amazing-of-j-co
donuts/
StudyMode. (2011). Dunkin Donut vs J.Co. Retrieved from
http://www.studymode.com/essays/Dunkin-Donut-Vs-Jco-678254.html
The Institutes. (n.d.). Restaurant Risk Management. Retrieved from:
http://www.theinstitutes.org
Top Brand Award. (n.d.). Donut Industry. Retrieved from:
http://www.topbrandaward.com
Young Entrpreneur Academy’s Blog. (2013). J.Co dan Dunkin Donuts, Mana yang
Anda Pilih. Retrieved from:
http://yeaind.wordpress.com/2013/07/12/j-co-dan-dunkin-donuts-mana-yang
anda-pilih/
Communication and promotion: Kotler on marketing, Retrieved from:
http://www.marsdd.com/mars-library/communication-and-promotion-kotler-
on-marketing/
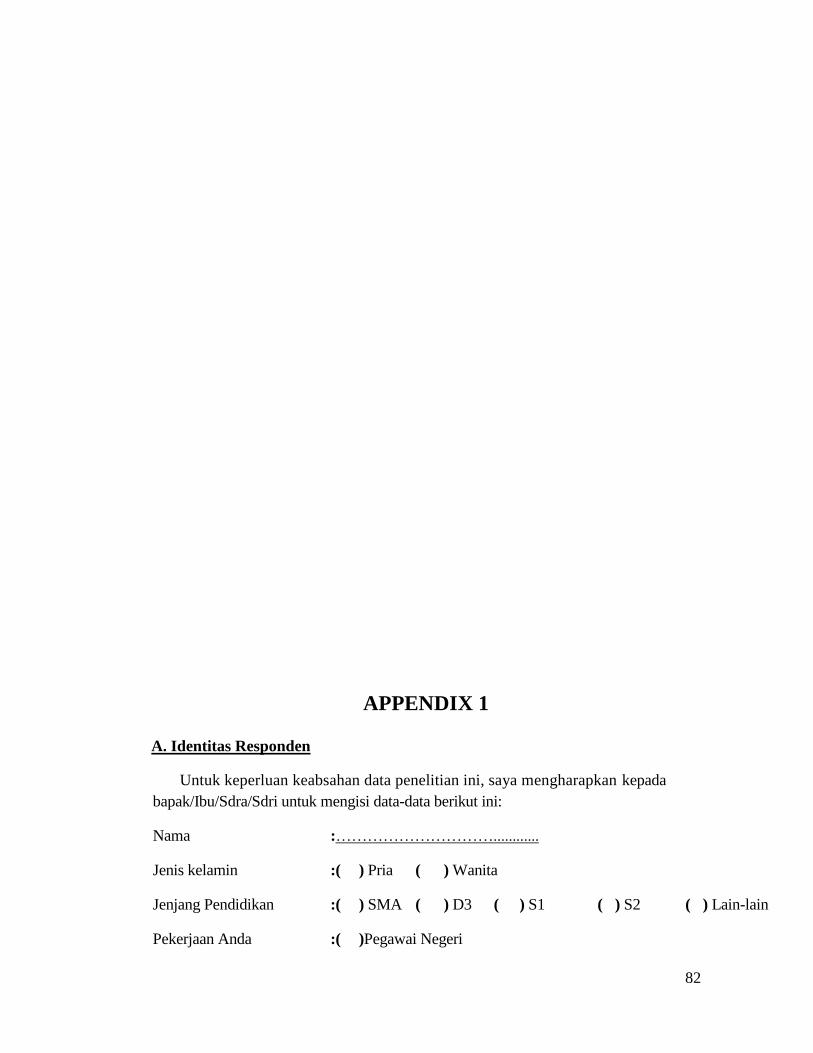
82
APPENDIX 1
A. Identitas Responden
Untuk keperluan keabsahan data penelitian ini, saya mengharapkan kepada
bapak/Ibu/Sdra/Sdri untuk mengisi data-data berikut ini:
Nama :…………………………............
Jenis kelamin :( ) Pria ( ) Wanita
Jenjang Pendidikan :( ) SMA ( ) D3 ( ) S1 ( ) S2 ( ) Lain-lain
Pekerjaan Anda :( )Pegawai Negeri
83
( )Pegawai Swasta
( )Profesi: Dokter, Pengacara, dll
( )Wiraswasta
( )Lain-lain
B. Petunjuk Pengisian
Peryataan-pernyataan di bawah ini bertujuan untuk mengetahui pendapat anda
tentang The Impact Of Brand Loyalty Variable Toward The Brand Loyalty Of JCO
Donutor And Coffee In Indonesia. Bapak/Ibu dimohonkan hanya memberikan satu
pilihan jawaban yang diungkapkan paling sesuai dengan memberikan tanda silang
(x) di kolom sebelah kanan. Pada setiap pertanyaan telah disediakan bagian lima
poin skala di sampingnya dengan keterangan sebagai berikut:
1. Sangat Setuju(SS)
2. Setuju(S)
3. Ragu-Ragu dengan Setuju (RDS)
4. Ragu-Ragu dengan tidak Setuju (RDTS)
5. Tidak Setuju (TS)
6. Sangat Tidak Setuju (STS)
1. NAMA MERK
Atribut penelitian :
SS : Sangat Setuju S : Setuju
RDS : Ragu-Ragu dengan Setuju RDTS : Ragu-Ragu dengan
tidak Setuju TS : Tidak Setuju
STS : Sangat Tidak Setuju
NO PERNYATAAN SS S RDS RDTS TS STS

84
1 Logonya has,simple dan jelas sehingga mudah
2 sudah memasyarakat di masyarakat perkotaan
3 Rasanya mantap dan enak berbeda dengan produk
sejenis
4 Kemasannya sederhana dan mempunyai daya tarik
5 Sudah Punya hak paten
2. KUALITAS PRODUK/ TASTE
Atribut penelitian :
SS : Sangat Setuju S : Setuju
RDS : Ragu-Ragu dengan Setuju RDTS : Ragu-Ragu dengan
tidak Setuju TS : Tidak Setuju
STS : Sangat Tidak Setuju
NO PERNYATAAN SS S RDS RDTS TS STS
1 Banyak yang suka dan mengandung Vitamin yang
diperlukan oleh tubuh
2 Proses pembuatannya yang seteril dan terjamin
dengan bahan yang berkualitasdan ada sertifikat
halal
3 Rasanya mantap dan enak berbeda dengan produk
sejenis
4 Mau mengeluarkan biaya lebihjika rasanya enak
5 Mempunyai berbagai macam rasa

85
3. HARGA
Atribut penelitian :
SS : Sangat Setuju S : Setuju
RDS : Ragu-Ragu dengan Setuju RDTS : Ragu-Ragu dengan
tidak Setuju TS : Tidak Setuju STS : Sangat Tidak
Setuju
NO PERNYATAAN SS S RDS RDTS TS STS
1 Harga yang ditawarkan sesuai dengan kemampuan
pelanggan
2 Harga tiap Jenis produk bervariasi
3 Harga cukup bersaing dengan produk sejenis
4 Harga Produk termasuk Pajak dan Servis
5 Harga yang ditawarkan sesuai dengan kualitas produk
4. LINGKUNGAN GERAI ATAU RESTORAN
Atribut penelitian :
SS : Sangat Setuju S : Setuju
RDS : Ragu-Ragu dengan Setuju RDTS : Ragu-Ragu dengan
tidak Setuju TS : Tidak Setuju STS : Sangat Tidak
Setuju
NO PERNYATAAN SS S RDS RDTS TS STS
1 Gerai yang tersedia berada di tempat strategis
2 Tata letak Gerai cukup menarik bagi pembeli
3 Desain Interior di dalam Outlet cukup menarik
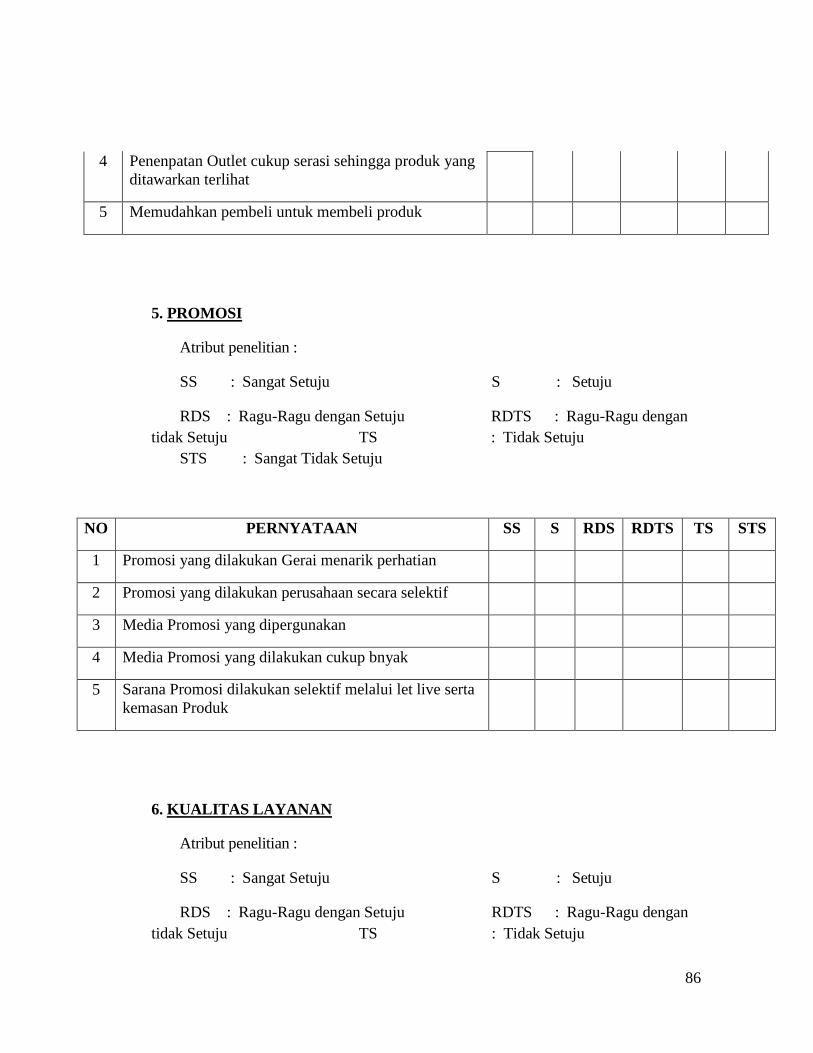
86
4 Penenpatan Outlet cukup serasi sehingga produk yang
ditawarkan terlihat
5 Memudahkan pembeli untuk membeli produk
5. PROMOSI
Atribut penelitian :
SS : Sangat Setuju S : Setuju
RDS : Ragu-Ragu dengan Setuju RDTS : Ragu-Ragu dengan
tidak Setuju TS : Tidak Setuju
STS : Sangat Tidak Setuju
NO PERNYATAAN SS S RDS RDTS TS STS
1 Promosi yang dilakukan Gerai menarik perhatian
2 Promosi yang dilakukan perusahaan secara selektif
3 Media Promosi yang dipergunakan
4 Media Promosi yang dilakukan cukup bnyak
5 Sarana Promosi dilakukan selektif melalui let live serta
kemasan Produk
6. KUALITAS LAYANAN
Atribut penelitian :
SS : Sangat Setuju S : Setuju
RDS : Ragu-Ragu dengan Setuju RDTS : Ragu-Ragu dengan
tidak Setuju TS : Tidak Setuju

87
STS : Sangat Tidak Setuju
NO PERNYATAAN SS S RDS RDTS TS STS
1 Fasilitas fisik pelayanan mempunyai tampilan yang
Menarik
2 Penampilan pelayanan cukup menyakinkan dan
menyenangkan
3 Komunikasi Pelanggan dan pelayan mudah dipahami
4 Pelayanan dapat diakses melalui Telp. untuk delivery
order
5 Waktu tunggu pelayanan tidak lama
7. BRAND LOYALTY
Atribut penelitian :
SS : Sangat Setuju S : Setuju
RDS : Ragu-Ragu dengan Setuju RDTS : Ragu-Ragu dengan
tidak Setuju TS : Tidak Setuju
STS : Sangat Tidak Setuju
NO PERNYATAAN SS S RDS RDTS TS STS
1 Jika saya ingin membeli produk J-Comaka produk J-Co akan
saya beli kembali karena saya telah merasakan kualitas J-Co
itu sendiri
2 Saya akan merekomendasikan produk J-Co pada orang lain
karena saya telah merasakan kenyamanan yang diberikan
oleh produk J-Co
3 Saya bersedia membayar lebih tinggi untuk produk J-Co
karena produk J-Co sudah terbukti kualitas, rasa dan lain-lain
dan juga memiliki harga jual bersaing dengan produk sejenis

88
4 Bila suatu saat saya tidak puas atas pelayanan J-Co, saya
akan menyampaikannya pada pihak J-Co
5 Saya tertarik menambah jumlah produk J-Co yang lain
APPENDIX 2
Profile of Respondents
Characteristic of Responden Number %
Sex gender
- Male 171 52,29
- Female 156 47,71
Total number 327 100
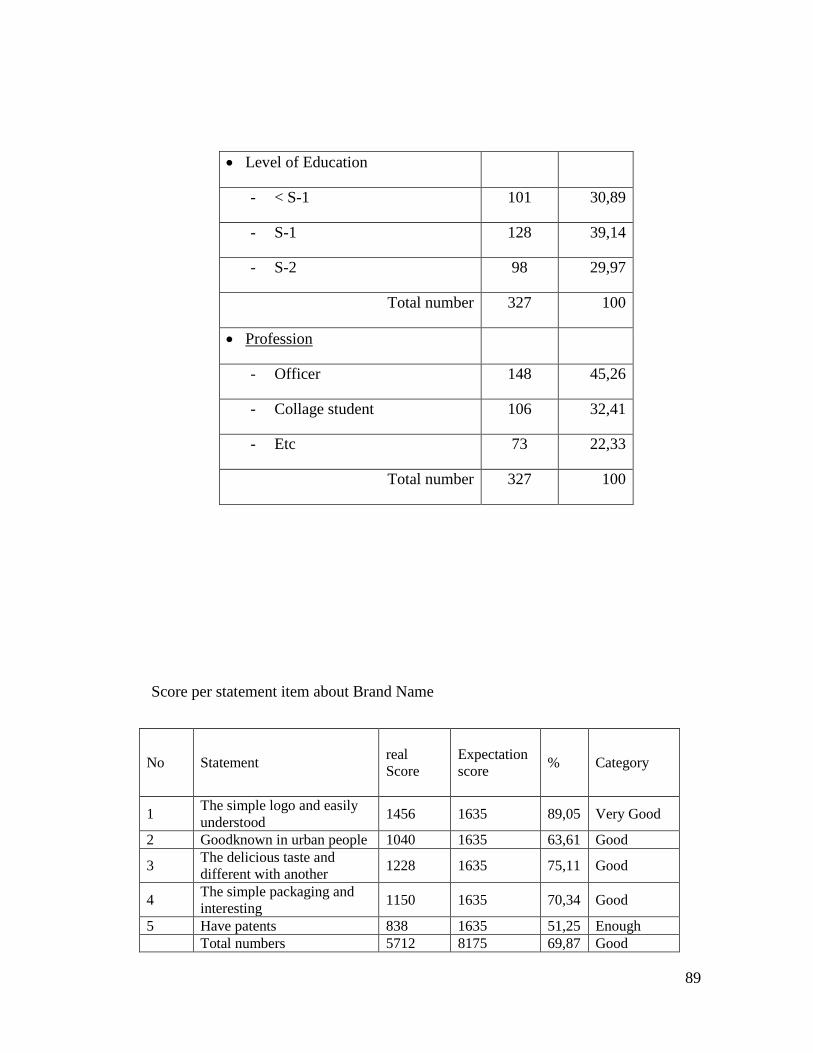
89
Level of Education
- < S-1 101 30,89
- S-1 128 39,14
- S-2 98 29,97
Total number 327 100
Profession
- Officer 148 45,26
- Collage student 106 32,41
- Etc 73 22,33
Total number 327 100
Score per statement item about Brand Name
No Statement
real
Score
Expectation
score % Category
1 The simple logo and easily
understood 1456 1635 89,05 Very Good
2 Goodknown in urban people 1040 1635 63,61 Good
3 The delicious taste and
different with another 1228 1635 75,11 Good
4 The simple packaging and
interesting 1150 1635 70,34 Good
5 Have patents 838 1635 51,25 Enough
Total numbers 5712 8175 69,87 Good

90
Score per statement item about Product Quality
No Statement
Real
Score
Expectation
score
% Category
1
Many people like it and
contain anuseful vitamin for
body.
1195 1635 73,09 Good
2
The manufacturing process is
steril and secured with
quality ingredients and have
“halal” certificate.
756 1635 46,24 Enough
3
The delicious taste and
different with another
product
1055 1635 64,52 Good
4 Willing to pay more for
delicious taste 929 1635 56,82 Enough
5 Have various taste 1264 1635 77,31 Good
Total number 5199 8175 63,60 Good
Score per statement item about Price
No Statement
Real
Score
Expectation
score % Category
1
The offered price is
accordance with the
customer ability
1357 1635 83,00 Very Good
2 The cost of each type of
product varies 1465 1635 89,60 Very Good
3 The price is competitive
with similar product 1287 1635 78,71 Good
4 The product price include
taxes and services 715 1635 43,73 Enough
5 The price is suitable with the 1224 1635 74,86 Good
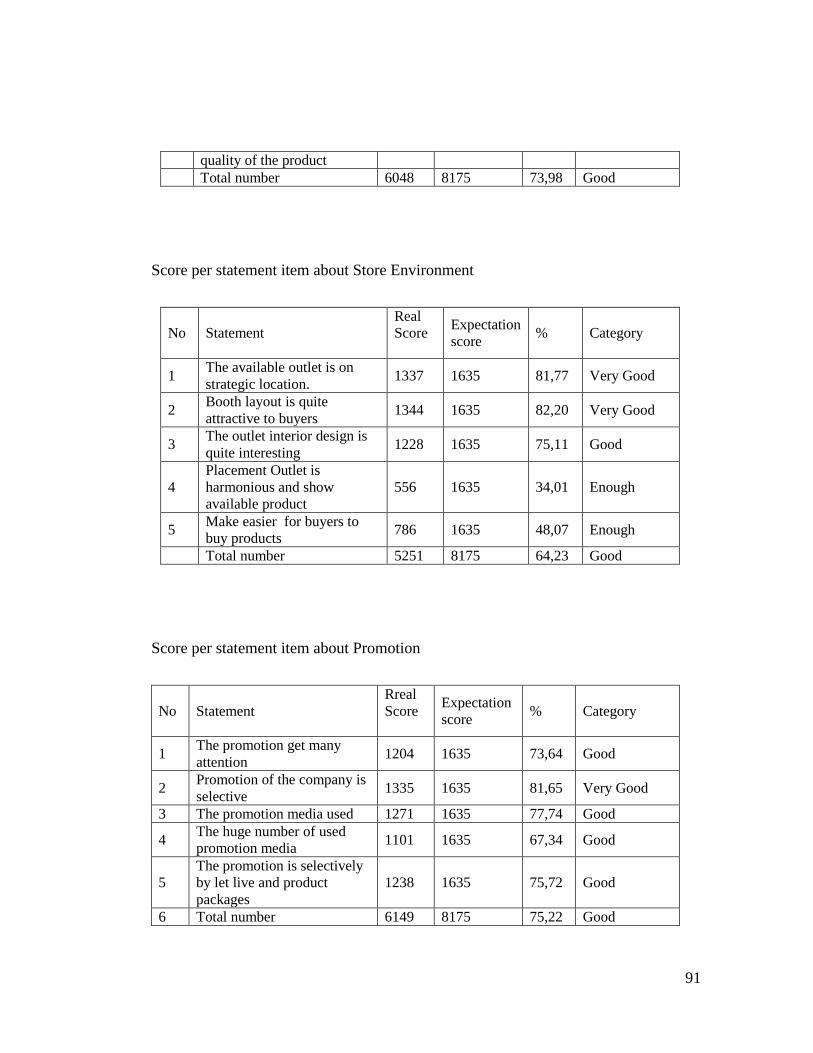
91
quality of the product
Total number 6048 8175 73,98 Good
Score per statement item about Store Environment
No Statement
Real
Score
Expectation
score % Category
1 The available outlet is on
strategic location. 1337 1635 81,77 Very Good
2 Booth layout is quite
attractive to buyers 1344 1635 82,20 Very Good
3 The outlet interior design is
quite interesting 1228 1635 75,11 Good
4
Placement Outlet is
harmonious and show
available product
556 1635 34,01 Enough
5 Make easier for buyers to
buy products 786 1635 48,07 Enough
Total number 5251 8175 64,23 Good
Score per statement item about Promotion
No Statement
Rreal
Score
Expectation
score % Category
1 The promotion get many
attention 1204 1635 73,64 Good
2 Promotion of the company is
selective 1335 1635 81,65 Very Good
3 The promotion media used 1271 1635 77,74 Good
4 The huge number of used
promotion media 1101 1635 67,34 Good
5
The promotion is selectively
by let live and product
packages
1238 1635 75,72 Good
6 Total number 6149 8175 75,22 Good
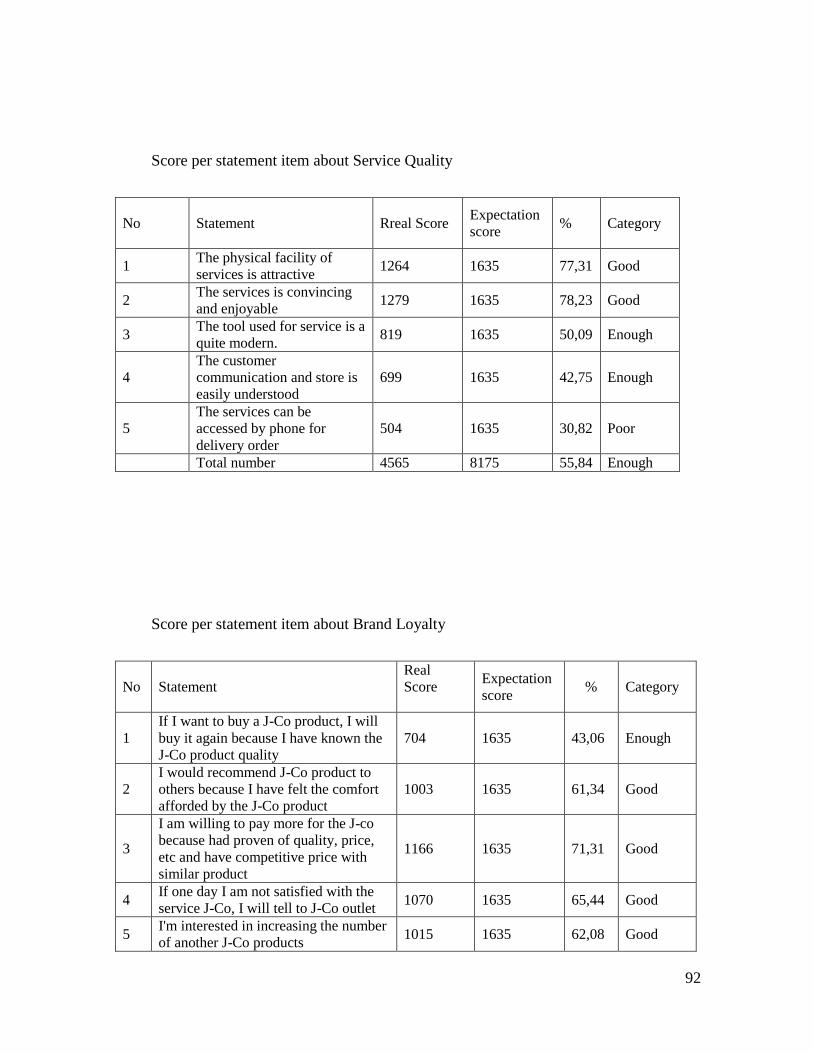
92
Score per statement item about Service Quality
No Statement
Rreal Score
Expectation
score % Category
1 The physical facility of
services is attractive 1264 1635 77,31 Good
2 The services is convincing
and enjoyable 1279 1635 78,23 Good
3 The tool used for service is a
quite modern. 819 1635 50,09 Enough
4
The customer
communication and store is
easily understood
699 1635 42,75 Enough
5
The services can be
accessed by phone for
delivery order
504 1635 30,82 Poor
Total number 4565 8175 55,84 Enough
Score per statement item about Brand Loyalty
No Statement
Real
Score
Expectation
score % Category
1
If I want to buy a J-Co product, I will
buy it again because I have known the
J-Co product quality
704 1635 43,06 Enough
2
I would recommend J-Co product to
others because I have felt the comfort
afforded by the J-Co product
1003 1635 61,34 Good
3
I am willing to pay more for the J-co
because had proven of quality, price,
etc and have competitive price with
similar product
1166 1635 71,31 Good
4 If one day I am not satisfied with the
service J-Co, I will tell to J-Co outlet 1070 1635 65,44 Good
5 I'm interested in increasing the number
of another J-Co products 1015 1635 62,08 Good

93
Total number 4958 8175 60,65 Good
F test - Anova
ANOVAb
Model Sum of Squares df Mean Square F Sig.
1 Regression 4095.350 4 1023.838 96.501 .000a
Residual 3416.307 322 10.610
Total 7511.657 326
a. Predictors: (Constant), Service Quality, Brand Name, Promotion, Product Quality
b. Dependent Variable: Brand Loyaliti
The Model of Regression Equation
The Model of Summary
Model
Unstandardized Coefficients
Standardized
Coefficients
t Sig. B Std. Error Beta
1 (Constant) -1.380 1.026 -1.345 .180
Brand Name .135 .052 .112 2.619 .009
Product Quality .276 .061 .231 4.551 .000
Promotion .211 .057 .183 3.703 .000
Service Quality .560 .061 .408 9.177 .000
a. Dependent Variable: Brand Loyaliti

94
Histogram
Normal P-P Plot of
Regression Standardized Residual
Model Summaryb
Model R R Square Adjusted R Square
Std. Error of the
Estimate
1 .738a .545 .540 3.257
a. Predictors: (Constant), Service Quality, Brand Name, Promotion, Product
Quality
b. Dependent Variable: Brand Loyaliti

95
Multicollinearity
Independent
Variable
Collinearity Statistic Decision
Tolerance VIF
Brand Name
(X1)
0.769 1.301 There is no
multicollinearity
problems
Product Quality
(X2)
0.547 1.830 There is no
multicollinearity
problems
Promotion (X5) 0.581 1.723 There is no
multicollinearity
problems
Service Quality
(X6)
0.715 1.398 There is no
multicollinearity
problems

96
Scatterplot

97

98
99
100

101

102

103