the influence of academic and social self-concept on
TRANSCRIPT

University of South CarolinaScholar Commons
Theses and Dissertations
2015
The Influence of Academic and Social Self-Concepton College Student WithdrawalElizabeth OrehovecUniversity of South Carolina - Columbia
Follow this and additional works at: https://scholarcommons.sc.edu/etd
Part of the Educational Administration and Supervision Commons
This Open Access Dissertation is brought to you by Scholar Commons. It has been accepted for inclusion in Theses and Dissertations by an authorizedadministrator of Scholar Commons. For more information, please contact [email protected].
Recommended CitationOrehovec, E.(2015). The Influence of Academic and Social Self-Concept on College Student Withdrawal. (Doctoral dissertation). Retrievedfrom https://scholarcommons.sc.edu/etd/3138

THE INFLUENCE OF ACADMEIC AND SOCIAL SELF-CONCEPT ON
COLLEGE STUDENT WITHDRAWAL
by
Elizabeth Orehovec
Bachelor of Arts
University of Miami, 2004
Master of Education
University of South Carolina, 2006
Master of Business Administration
University of South Carolina, 2009
______________________________________________________
Submitted in Partial Fulfillment of the Requirements
For the Degree of Doctor of Philosophy in
Educational Administration
College of Education
University of South Carolina
2015
Accepted by:
Katherine Chaddock, Major Professor
Bethany Bell, Committee Member
Jennifer Keup, Committee Member
Spencer Platt, Committee Member
Lacy Ford, Vice Provost and Dean of Graduate Studies

ii
© Copyright by Elizabeth Orehovec, 2015
All Rights Reserved.

iii
DEDICATION
To my parents, Paul and Maribeth Orehovec. Thank you for teaching me the value of
education and letting me discover my love for learning at my own pace.
And, to my husband, Geoff Schwitzgebel, and our two girls. I can’t wait to spend this
next chapter with the three of you!
iv
ACKNOWLEDGEMENTS
I’d like to start by thanking my dissertation chair, Dr. Katherine Chaddock. Your
support and guidance throughout this process has enabled me to complete this project,
and because of you, I am a better researcher and scholar. I can’t thank you enough for
continuing as my chair after your retirement. I’d also like to thank my committee
members: Dr. Bethany Bell, Dr. Jennifer Keup, and Dr. Spencer Platt. I appreciate the
way you challenged me to produce a strong study, but also supported and encouraged me
along the way.
I’m am also extremely grateful to my supervisors, Connie Scrivens, Scott Verzyl,
and Dr. Mary Wagner, and the entire Office of Undergraduate Admissions team. From
the day I decided to pursue my Ph.D., I have received nothing but encouragement and
support. Working full-time while pursing my Ph.D. was one of the most challenging
things I have ever done; however, my staff, supervisors and coworkers made it possible
for me to manage both. Thank you to Dr. Pam Bowers, Joey Derrick, and Dr. Nikki
Knutson for your assistance with my data collection.
Last, but not least, I want to thank my family and friends, especially my parents
and husband, who have made it possible for me to reach this goal. Mom, thank you for
your countless phone calls, care packages, and even for distracting me when I needed to
take a break and have a little fun. Dad, thank you for being my mentor. I would not be
where I am today, if it weren’t for your career advice and guidance.

v
Finally, thank you to Geoff. I am FINALY done! I know that when we met you
never thought I would still be “in school” eight years later. I honestly could not have
done this without you. You’ve supported me in more ways that you can imagine, and
never once complained about it. You now have your wife back!

vi
ABSTRACT
This quantitative study explored students’ self-reported, pre-college academic self-
concept and students’ self-reported, pre-college social self-concept and the likelihood of
student withdrawal prior to their second year. Additionally, the interaction between
academic self-concept and social self-concept and first-year academic performance were
examined. Using data from the University of South Carolina, three binary logistic
regression models were run to determine whether academic self-concept and social self-
concept were significant predictors of student withdrawal and/or whether or not the self-
concept variables moderated the relationship between students’ first-year academic
performance and student withdrawal. Additional academic, financial, and demographic
pre-college attributes were selected as control variables and included in each logistic
regression model. The variables selected for this study reflect each of the three categories
(family background, individual attributes, and pre-college schooling) of pre-entry
characteristics in Tinto’s (1993) Student Integration Model, the theoretical framework for
this study. As researchers have cited the need to include a psychological component to
Tinto’s model (Berger & Lyon, 2005; Braxton, 2000; Pascarella & Terenzini, 1991;
Robbins & Noeth, 2004), this research sought to advance the literature by determining
whether academic self-concept and social self-concept were variables to include as
additional pre-college characteristics in the Student Integration Model. The results from
the study revealed there is not a statistically significant relationship between academic
self-concept and student withdrawal or between social self-concept and student

vii
withdrawal. Additionally, neither self-concept variable moderates the relationship
between students’ first-year academic performance and student withdrawal. However,
there were several significant findings outside the scope of the research questions. Of the
ten control variables used in this study, four were statistically significant predictors of
student withdrawal, after controlling for the other variables in the model. As expected,
first-year academic performance was a significant predictor of student withdrawal.
Additionally, major declaration, student residency, and completion of the FAFSA were
also significant predictors of student withdrawal.

viii
TABLE OF CONTENTS
DEDICATION ................................................................................................................... iii
ACKNOWLEDGEMENTS ............................................................................................... iv
ABSTRACT ....................................................................................................................... vi
LIST OF TABLES .............................................................................................................. x
CHAPTER ONE: INTRODUCTION ................................................................................. 1
Background ..................................................................................................................... 1
Purpose of the Study ....................................................................................................... 6
Research Questions ......................................................................................................... 7
Theoretical Framework ................................................................................................... 8
Research Design ............................................................................................................ 10
Definition of Terms ....................................................................................................... 12
Significance ................................................................................................................... 13
Summary ....................................................................................................................... 14
CHAPTER TWO: REVIEW OF THE LITERATURE .................................................... 16
Early Theories of Student Departure ............................................................................. 17
Tinto’s Interactionalist Theory of Student Departure ................................................... 22
Influence of Psychosocial Factors on Persistence and Retention ................................. 31
Summary ....................................................................................................................... 41
CHAPTER THREE: RESEARCH METHODS ............................................................... 42
Statistical Methods ........................................................................................................ 43
Data Sample and Collection Procedures ....................................................................... 44
Statistical Analysis ........................................................................................................ 56
CHAPTER FOUR: FINDINGS ........................................................................................ 62
Descriptive Statistics ..................................................................................................... 62
Bivariate Analysis ......................................................................................................... 71
Logistic Regression Analysis: Research Question One ................................................ 72

ix
Logistic Regression Analysis: Research Question Two ............................................... 73
Logistic Regression Analysis: Research Question Three ............................................. 75
Additional Findings ....................................................................................................... 77
Summary ....................................................................................................................... 79
CHAPTER FIVE: DISCUSSION ..................................................................................... 80
Key Findings ................................................................................................................. 81
Additional Findings ....................................................................................................... 85
Implications for Practice ............................................................................................... 91
Limitations .................................................................................................................... 94
Recommendations for Future Research ........................................................................ 95
Summary and Conclusion ............................................................................................. 99
REFERENCES ............................................................................................................... 101

x
LIST OF TABLES
Table 2.1: Magnitude of Support for Each Proposition by Multiple and Single
Institutional Tests ……………………………………………………………….30
Table 2.2: Summary of Findings from Robbins et al. (2004) Meta-Analysis …………..33
Table 3.1: Variables by Definition and Source ………………………………………....49
Table 3.2: Variables, Coding Levels, and Abbreviations………………………………. 57
Table 4.1: Descriptive Statistics: Comparison between Returners and Non-Returners ...65
Table 4.2: Descriptive Statistics: Comparison between Academic Self-Concept
Categories ……………………………………………………………………….68
Table 4.3: Descriptive Statistics: Comparison between Social Self-Concept
Categories………………………………………………………………………..69
Table 4.4: Frequencies of Students by FAFSA Completion……………………………70
Table 4.5: Frequencies of Students by Gender……………………………………….....70
Table 4.6: Frequencies of Students by Major Declaration………………………………70
Table 4.7: Frequencies of Students by Race/Ethnicity………………………………......70
Table 4.8: Frequencies of Students by Residency Status………………………..………71
Table 4.9: Frequencies of Students by Withdrawal Status………………………………71
Table 4.10: Comparison of Base Regression Model with Academic Self-Concept and
Social Self-Concept Regression Model………………………………………….74
Table 4.11: Comparison of Base Regression Model with Academic Self-Concept and
First-Year Academic Performance Interaction Model ………………………….76
Table 4.12: Comparison of Base Regression Model with Social Self-Concept and First-
Year Academic Performance Interaction Model……………………...…………71

1
CHAPTER ONE: INTRODUCTION
Student retention and graduation have been pressing issues for college and
university administrators since the 1970s. As traditional college student enrollment
declined and competitive admission practices rose, it became increasingly important for
colleges and universities to retain students from acceptance through graduation (Astin,
1993; Berger & Lyon, 2005; Noel, 1985; Spady, 1971; Tinto, 1993). More recently,
increased policy pressure and discussion of accountability-based funding have forced
institutions to focus on increasing retention and graduation rates (Bautsch & Williams,
2010; Miao, 2012; Selingo, 2013). Researchers have found that “both the number of
people attending college and the share of them receiving financial aid continue to grow,
while graduation rates remain flat” (Supiano, 2011, para. 1). Numerous studies have been
conducted on college performance, persistence, and attrition (e.g., Astin, 1985, 1993;
Bean, 1980; Pascarella & Terenzini, 1980, 1983; Spady, 1971; Tinto, 1975, 1993).
Additionally, increased resources at the institutional level have been dedicated to
retention initiatives (Kalsbeek, 2013; Tinto, 2012). However, college retention and
graduation rates have remained relatively stable since the 1980s.
Background
Nationally, 58 percent of first-time students who sought bachelor’s degrees full-
time in fall 2004 completed their degrees at their original institution within six years,
which means more than one-third of students leave their institution prior to graduation

2
(Aud et al., 2012). Of the students who leave, more than half withdraw prior to
beginning their second year. Only “79 percent of first-time, full-time students who
entered four-year institutions in 2009 returned the following year to continue their
studies” (Aud et al., p.114).
Completion rates vary by institution type, institution selectivity, and student
demographics. Of the students who started full-time in fall 2004, those at private,
nonprofit institutions had the highest six-year graduation rate at 65 percent and those at
private for-profit institutions had the lowest six-year graduation rate at 28 percent.
Students who enrolled at public institutions had a six-year graduation rate of 56 percent.
Regardless of institution type, the six-year graduation rate for females is higher than
males and low income, first-generation and minority students are disproportionately at
risk when compared to their higher income, white counterparts. In terms of six-year
graduation rates by race/ethnicity, Asian/Pacific Islander students graduate at the highest
rate (69 percent), followed by White students (62 percent), Hispanic students (50
percent), and Black and American Indian/Alaska Native students (39 percent) (Aud et al.,
2012). Low income, first generation students are four times more likely to leave college
after their first year than students who do not have either of these risk factors (Engle &
Tinto, 2008).
Historically, graduation and retention rates have been measured at an institutional
level. Researchers have started to examine retention from a systematic perspective as
some students do leave their original institution to successfully complete a degree
elsewhere (Shapero, Dundar, Yuan, Harrell, & Wakhungu, 2014). However, the majority
of students who leave their original four-year institution fail to graduate from any college

3
or university. Of full-time students who started at four-year public institutions in fall
2006, 29 percent left their original institution prior to graduation, and only 10 percent of
those completed a degree at another institution within six years (Shapiro et al, 2012).
Further, while students may transfer to other institutions to continue their degree, the cost
of transferring can be substantial for both the student and institution (Ott & Cooper,
2013; Raisman, 2013). Many colleges and universities do not have transparent transfer
processes so students risk losing credit, and oftentimes take more than four years to
graduate. For the purpose of this study, transfer students are viewed from an institutional
perspective and therefore, all students who left the institution prior to graduation are seen
as a loss to the institution.
Hunt Jr. and Tierney (2006) note that “retention and completion have long been
the Achilles heel of American higher education. In the past, far too many students who
enrolled in college failed to graduate, and this remains true today” (p. 9). While overall
college participation has increased, the rate at which students are earning degrees has
declined slightly (Bound, Lovenheim & Turner, 2010). This is concerning, particularly
given the research conducted and student success and early intervention initiatives that
have been implemented to improve persistence and graduation rates (Barefoot, 2004;
Berger & Lyon, 2005; Braxton, 2000; Kuh, Kinzie, Buckley, Bridges & Hayek, 2007;
Tinto, 2012).
There are numerous societal, institutional, and individual benefits to earning a
college degree. On average, college graduates earn a million dollars more in their lifetime
than individuals who do not have a bachelor’s degree (Aud et al., 2012). In addition to
higher earning potential, college graduates are less likely to live in poverty or depend on

4
public assistance (“The rising cost,” 2014). They are also more likely to exercise, avoid
smoking, and make better overall health choices. Furthermore, college graduates pay
more taxes due to higher salaries and are more likely to volunteer their time and vote
(Baum, Ma, & Payea, 2010). A 2011 study by the Institution for Higher Education Policy
determined that “58 percent of the 1.8 million borrowers whose student loans began to be
due in 2005 hadn’t received a degree” (Casselman, 2012, para 4).
Even with all the benefits of earning a college degree, the United States is falling
behind other countries in the percentage of citizens graduating with a bachelor’s degree
(Carnevale & Rose, 2011). For many years, the United States was ranked significantly
higher than any other country in college completion rates. However, among 25-34 year
olds, the United States currently ranks seventh in bachelor’s degree completion and ninth
in total degree completion (Carnevale & Rose). It is also more important than ever to
increase college graduation rates due to the number of jobs that require advanced skills
and knowledge, particularly in technological fields (Hunt Jr. & Tierney, 2006).
In addition to societal and individual benefits, colleges and universities lose a
substantial amount of revenue when students withdraw from their institution (Johnson,
2012). A recent study found that “the loss of revenue from attrition for schools is
significant and hurtful to the financial well-being of colleges and universities” (Raisman,
2013, p. 8). On average, public, four-year institutions lose more than 13 million dollars
due to attrition of a single cohort of students (Raisman). Therefore, in addition to societal
and individual benefits, it is also in the best interest of colleges and universities to
determine ways to increase college student retention and graduation rates.

5
In 2010, President Obama declared that “by 2020, America will once again have
the highest proportion of college graduates in the world” (Obama, 2010). To achieve this
goal, the United State degree attainment rate must increase from 40 percent to 60 percent
which means an additional 10 million Americans aged 25 – 34 must earn an associates or
baccalaureate degree by 2020, a number that is eight million people beyond the projected
growth. In response to President Obama’s call for increased graduation rates, the College
Board’s Advocacy and Policy Center recommends “that institutions of higher education
set out to dramatically increase college completion rates by improving retention, easing
transfer among institutions and implementing data-based strategies to identify retention
and dropout challenges” (Hughes, 2012, p. 3).
This study addresses this call by developing and testing a data-driven model to
determine the individual characteristics that increase one’s risk for withdrawal prior to
his/her second year. More specifically, the researcher examined the academic, financial,
demographic, and psychosocial (e.g. self-concept) variables that predict student
withdrawal in an effort to develop a model to aid practitioners in designing outreach and
intervention strategies that best meet individual student needs.
Two categories of student withdrawal, involuntary and voluntary, help define why
students leave college. Involuntary departure typically occurs when a student does not
meet the academic progression requirements of the institution and is not allowed to
return. However, approximately half of students withdraw voluntarily. Of the students
who withdraw, 48 percent leave in good academic standing within their first two years
(Johnson, 2012). These students are in good academic standing, but choose to leave the
institution for a variety of other reasons. Some students cite personal reasons including
6
lack of belonging, homesickness, financial difficulties, personal issues, and health
problems. (Johnson, 2012). Other students cite institutional reasons for departure such as
poor service and treatment, scheduling difficulties, the feeling that the college does not
care, and the belief that the experience is not worth the cost (Raisman, 2013).
Researchers have explored many models for predicting student departure in an
effort to identify students who are at-risk for leaving in order to intervene early to prevent
student withdrawal (Astin, 1985; Astin & Oseguera, 2005; Bean & Eaton, 2000; Braxton,
2000; Tinto, 1975, 1993). However, with the exception of early research conducted by
Pascarella and Terenzini (1983), research models rarely differentiate between varying
levels of first-year academic performance, which is a limitation of the current body of
literature. Further, while many studies explore pre-college academic, financial, and
demographic attributes, few examine the impact of psychosocial factors. In this study, the
psychosocial variables studied were students’ self-reported, pre-college academic self-
concept and students’ self-reported, pre-college social self-concept.
Purpose of the Study
The focus of this study, first-to-second year student withdrawal, concerns the
timeframe in which the greatest proportion of non-retained students withdraw from
college (Bradburn, 2002). Identifying these students early in their college career can aid
in retention efforts. Many of the recent studies and programmatic interventions focus on
students who are at-risk academically as opposed to those who are at-risk of withdrawal
for non-academic reasons. Current predictive models do not differentiate between
students who leave due to failure to meet academic progression requirements and those

7
who are in good academic standing, but choose not to return. Furthermore, most
predictive models use students’ previous academic achievement (as measured by high
school grade point average and standardized test scores) as the predictor variables and
academic success as the criterion variable (as measured by collegiate grade point
average). It is necessary to consider other psychosocial factors, particularly when
predicting whether or not students in good academic standing are likely to return after
their freshman year. Preliminary research has shown that motivation, intellectual self-
confidence, and self-ratings of academic ability can be used to predict degree completion
(Astin & Oseguera, 2003; 2005; Robbins et al., 2004).
The purpose of this study is to determine which pre-college attributes
significantly predict student withdrawal among first-time, full-time students, after
controlling for first-year academic performance. In addition to academic, financial, and
demographic predictor variables, students’ self-reported, pre-college academic self-
concept and pre-college, self-reported social self-concept are used as psychosocial
predictive variables. Additionally, the interaction between each self-concept variable and
first-year academic performance is explored. By testing this model at one institution, it
will aid researchers in developing models that may be useful at other colleges and
universities.
Research Questions
The researcher of this study sought to answer the following research questions:
1) What is the effect of students’ self-reported, pre-college academic self-concept and
students’ self-reported, pre-college social self-concept on the likelihood of

8
withdrawal, after controlling for first-year academic performance and selected
academic, financial, demographic pre-college attributes.
2) Does the effect of students’ self-reported, pre-college academic self-concept moderate
the relationship between students’ first-year academic performance and student
withdrawal?
3) Does the effect of students’ self-reported, pre-college social self-concept moderate
the relationship between students’ first-year academic performance and student
withdrawal?
Theoretical Framework
The most prominent theory of student departure is Tinto’s (1975) model of
student integration. Tinto’s model posits that students’ pre-college entry characteristics,
in addition to their initial commitment to the institution and commitment to graduate,
influence their social and academic integration within the institution. Integration into both
the formal and informal, social and academic domains of an institution, in turn, lead to
their departure decisions. The model suggests that the more integrated a student is in each
of the domains, the more likely s/he is going to persist at a given university. This
theoretical framework views departure as a longitudinal process beginning prior to
enrollment at the institution and ends with the decision to persist (Tinto, 1975; 1993).
Since its inception, this is the most widely-accepted theory of student departure.
Consequently, there was limited research to advance student departure theory between
1975 and the late 1990s (Braxton, Hirschy, & McClendon, 2004). However, graduation
rates did not improve, so researchers began exploring economic, organizational,

9
psychological, and sociological frameworks on college student departure decisions (Bean
& Eaton, 2000; Berger & Braxton, 1998; Braxton, 2000; Robbins et al., 2006; Roberts &
Styron, 2009). More recently, researchers have noted other theoretical frameworks that
need to be explored and integrated into Tinto’s model (Berger & Lyon, 2005; Braxton,
2000). This study explored self-concept, a psychosocial variable, as a pre-entry
characteristic that, if found significant, can be incorporated into Tinto’s model.
Currently, pre-college academic indicators, such as high school grade point
average and standardized test scores, have been shown to be the most significant
predictors of college success and persistence (Astin, 1993; Astin & Oseguera, 2005;
Bradburn, 2002). However, researchers have started to explore other psychosocial
variables that may help predict student departure (Astin & Oseguera, 2003; Lotkowski,
Robbins & Noeth, 2004). Some of the factors that have been explored include motivation,
perceived social support, and institutional commitment (Friedman & Mandel, 2011; Kahn
& Nauta, 2001; Klomegah, 2007; Rayle & Chung, 2007; Robbins et al., 2006). An
additional factor that has received recent attention as a predictor of student persistence is
student’s self-concept or self-efficacy (Astin & Oseguera, 2003; Elias & Loomis, 2000;
Zajacova, Lynch & Espenshade, 2005). College self-efficacy has been defined in the
literature as a college student’s degree of confidence in performing various college-
related tasks to produce a desired outcome. Researchers have specifically examined
academic self-efficacy and college self-efficacy as they relate to student success and
persistence (Solberg, O’Brian, Villareal, Kennel & Davis, 1993).
Several recent studies have found a relationship between students’ academic
and/or college self-efficacy and persistence and/or academic success (Brady-Amoon &
10
Fuertes, 2011; Chemers, Hu, & Garcia, 2001; Choi, 2005; DeWitz, Woolsey & Walsh,
2009; Multon, Brown & Lent, 1991; Torres & Solberg, 2001; Vuong, Brown-Welty, &
Tracz, 2010; Zajacova, Lynch & Espenshade, 2005). The findings of these studies
suggest that students’ who have higher levels of self-efficacy perform better academically
and are more likely to persist in college than their peers with lower levels of self-efficacy.
This study sought to advance the literature by building on the current body of
research and examining the influence of students’ self-reported, pre-college academic
self-concept and social self-concept on student withdrawal. Additionally, the interaction
between self-concept and first-year academic performance was examined. It was
hypothesized that students’ self-reported, pre-college, academic and social self-concept
will be significant predictors of student withdrawal, even among students who are in
good academic standing. If these self-concept variables are found to be significant, they
should be considered as additional pre-college entry characteristics in Tinto’s Student
Integration Model as they may play a role in students’ ability to become integrated in the
academic and social domains of an institution. Research has shown that integration in
these domains can influence students’ departure decisions (Astin, 1993; Braxton, Vesper,
& Hossler, 1995; Tinto, 1993). Further analysis of the literature will be discussed in
chapter two.
Research Design
Binary logistic regression models were used in order to examine the relationship
between students’ pre-college, self-reported academic self-concept and social self-
concept and the likelihood of withdrawal from the University of South Carolina, a large,

11
public flagship institution in the southeast. Additionally, the way in which academic self-
concept and social self-concept interact with students’ first-year academic performance
and their decision to withdraw were explored through logistic regression interactions.
Logistic regression is used because first-to-second year retention is a categorical
dependent variable; therefore, ordinary least squares (OLS) regression was not
appropriate (Allison, 2012).
There is evidence that students’ individual background characteristics influence
their chances for degree attainment (Astin, 1993; Pascarella & Terenzini, 1991; Tinto,
1993). Academic, financial, and demographic variables that have been shown in previous
research to be significant predictors of first-year academic performance and/or first-to-
second year retention were selected as predictor variables (Astin & Oseguera, 2003,
2005; Bradburn, 2002; Lotkowski, Robbins & Noeth, 2004). These include: high school
grade point average, standardized test scores, state residency, academic major
declaration, first-year academic performance, pre-enrollment campus visit, Free
Application for Federal Student Aid (FAFSA) completion, expected family contribution
(EFC), gender, and race/ethnicity.
In addition to these predictor variables, students’ self-reported, pre-college
academic self-concept and social self-concept are collected and used as predictor
variables. Academic self-concept and social self-concept data were chosen as the
psychosocial variables to be studied because similar constructs have been shown to have
a significant effect on students’ academic performance (Multon, Brown & Lent, 1991;
Robbins et al., 2006; Torres & Solberg, 2001). Self-concept variables were collected via

12
two constructs from the Cooperative Institutional Research Program (CIRP) Freshman
Survey, which is administered to the incoming freshman cohort prior to enrollment.
Definition of Terms
For the purpose of this study, the following terms are defined as:
First-year students are defined as first-time, full-time students who enrolled in
college the summer or fall term following their high school graduation.
Full-time students are defined as those students who enrolled in a minimum of
12 credit hours each semester.
First-year academic performance is based on students’ first-year cumulative
grade point average.
Retention is defined as students who reenroll at the institution from initial
term of admission through to graduation.
First-to-second year retention is defined as students who reenroll at the
institution in the fall following their first year.
Student withdrawal is a student’s decision not to return to the institution for
the fall of his second year.
Academic self-concept is a construct comprised of multiple variables that
represent “a unified measure of students’ beliefs about their abilities and
confidence in academic environments” (Pryor et al., 2012, p. 54).
Social self-concept is a construct comprised of multiple variables that
represent “a unified measure of students’ beliefs about their abilities and
confidence in social situations” (Pryor et al., 2012, p. 54).

13
Significance
While there has been a great deal of national research on college student
persistence, most recent studies still focus on academic attributes and very few
differentiate between varying levels of academic performance among students who
withdraw. The majority of research also examines student success as measured by
collegiate grade point average and not first-to-second year retention. Other research
focuses on institutional programming such as academic advising, early warning or
intervention initiatives and student success programs to prevent student departure,
particularly for students who are in danger of falling below academic standards (Tinto,
2012).
By examining the relationship between students’ self-reported, pre-college
academic self-concept and social self-concept and their likelihood of withdrawal, this
study addresses two gaps in the current literature. Few studies have examined self-
concept as a psy chosocial predictor in student withdrawal and no studies have examined
the interaction between self-concept variables and varying levels of first-year academic
performance in predicting student withdrawal.
Students who leave voluntarily are presumed to have different risk factors than
those who no longer meet academic requirements (Johnson, 2012). Furthermore, students
who are in good academic standing are still likely to graduate with their bachelor’s
degree; therefore, it is in the institution’s best interest to retain these students. Exploring
the reasoning behind voluntary departure will allow practitioners to develop practices and
programs geared toward improving student retention, particularly among students who
have been successful academically. If the logistic regression models from this study are

14
able to significantly predict student withdrawal, researchers and practitioners can
replicate the model at their individual institutions to aid in early intervention initiatives
once students are enrolled at the institution. By differentiating between varying levels of
first-year academic performance, practitioners can tailor their outreach to the specific
needs of the students. As noted previously, the institutional, individual, and societal
benefits of earning a college degree are high; therefore, it is more important than ever to
explore ways to retain students who are academically successful during their first year of
college.
Summary
During the past several years, accountability in higher education has become a
pressing issue. With proposals being developed to base college and university funding on
retention and graduation rates, it is more important than ever to ensure students are
returning after their first year. It is especially important to retain students who are in good
academic standing and are on track to graduate. Developing a predictive model to
identify students who are at risk of withdrawal can help administrators and practitioners
in developing early intervention programs. Students who withdraw in good academic
standing are presumably doing so for different reasons than those students who are forced
to withdraw due to failure to meet academic progression requirements. Therefore, it is
important to differentiate between these two groups of students when developing a
predictive model. Furthermore, academic, financial and demographic variables alone
cannot predict a strong model for identifying at-risk students as other psychosocial
variables have been shown to positively predict student departure decisions (Astin &

15
Oseguera, 2003; Lotkowski, Robbins & Noeth, 2004). It is necessary for researchers to
continue to explore psychosocial predictors, such as college student self-concept. For this
reason, this study sought to determine the predictive relationship between students’ self-
reported, pre-college academic and social self-concept and their likelihood of returning to
college for their sophomore year.

16
CHAPTER TWO: REVIEW OF THE LITERATURE
Prior to the 1950’s, colleges and universities were not nearly as focused on
student retention and graduation as institutions are today; therefore, there was limited
research on the subject. As colleges and universities began to expand in the early 1900s,
it was primarily students from elite backgrounds who enrolled at institutions of higher
education (Thelin, 2004). At that time, colleges and universities were more concerned
with recruitment and selectivity, than they were with retaining students (Berger & Lyon,
2004). However, college student enrollment began to increase due to the GI Bill in 1944,
the National Defense Education Act of 1958, and the Higher Education Act of 1965,
which promoted college attendance in an effort to grow the American economy and stay
competitive with other countries (Berger & Lyon, 2004; Thelin, 2004). During the 1960s,
the need for a college degree became much more apparent as students saw that it was
necessary for mobility and the chance for a sound economic future (Kinzie et al., 2004).
Higher education expanded rapidly during the 1960s, and while colleges and
universities started paying more attention to retention, it was not until the 1970s when
enrollment was projected to decrease that retention became a primary focus for
researchers, practitioners and university administrators (Kinzie et al.). Since that time,
college student retention has become one of the most widely researched topics in higher
education as researchers and college and university administrators strive to understand

17
what influences students’ decisions to withdraw. However, retention and graduation rates
have not improved and there are still gaps in the literature, which this study addressed. In
this chapter, a review of the literature is divided into three sections, beginning with, a
brief description of early student departure theories. Next, Tinto’s (1975) Interactionalist
Theory of Student Departure, which serves as the theoretical framework for this study, is
examined. Third, studies concerning psychosocial factors, particularly those categorized
as self-concept and self-efficacy, as they relate to college success and retention are
discussed.
Early Theories of Student Departure
Psychological Theories
The earliest studies of college student withdrawal primarily focused on
psychological theories and attributed college student attrition to individual characteristics
and personalities (Heliburn, 1965, Marks, 1967; Rossmann & Kirk, 1970).
Characteristics which were found to lead to withdrawal included assertiveness and low
task orientation (Heliburn, 1965), hostility (Marks 1967), and low levels of motivation
(Rossmann and Kirk 1970). There were several larger, more comprehensive and
systematic studies conducted in the late 1960s (Panos & Astin, 1967; Bayer, 1968; Trent
& Medsker, 1965). These larger scale studies were important as they began the shift
toward a comprehensive study of student withdrawal, but they still focused primarily on
psychological student characteristics and “contained little emphasis on the interaction of
student and campus characteristics” (Berger & Lyon, 2004, p. 18).

18
Early psychological theories shared the common belief that departure is a
weakness or failure on the part of the individual as opposed to any reflection of the
institution (Tinto, 1975). Psychological theories of student departure are problematic
because they are “not truly explanatory nor well suited to the policy needs of most
colleges. Because it has largely ignored the impact context may have on student
behaviors” (Tinto, 1993, p. 86). However, the early psychological theories were
important as they initiated the study of student withdrawal. Further, while initial
psychological theories have their limitations, the present study revisits the impact of a
psychological construct through the use of self-concept in predicting college student
withdrawal. In this case, it is suggested that the psychological construct of self-concept
be integrated into an interactionalist model of college student withdrawal.
Sociological Theories
One of the first attempts to use previous empirical work to develop a cohesive
sociological framework was presented in Spady’s (1971) article Dropouts from Higher
Education: An Interdisciplinary Review and Synthesis. After conducting an in-depth
review of the existing literature and empirical work, Spady’s sociological model was the
first to explore both individual student characteristics and their interaction with the
institution. His theory drew on Durkheim’s (1951) theory of suicide and pointed to
students’ individual experiences within the organizational structures of the institution.
This was the first interactional model of student departure that integrated various aspects
of previous models into one comprehensive theory. Further, Spady (1971) encouraged
other researchers to explore the interaction between students and their institutional
environment as opposed to just one or the other. Spady’s research was also important
19
because it was the precursor to Tinto’s (1975) Interactionalist Theory of Student
Departure, which is explored in-depth later in this chapter.
Environmental Theories
During the 1970’s – 1980’s theorists also began to explore environmental causes
of student attrition. Environmental theories focus on the impact of societal, economic and
organizational influences on individual student behavior within institutions.
Environmental theories see “educational attainment as only one part of the broader
process of social attainment and the success or failure of students in higher education as
being molded by the same forces that shape social success” (Tinto, 1993, p. 86). These
theories examine the larger context of the student’s environment and focus on factors
such as social status, race, institutional prestige and opportunity structure.
Societal. Societal theories, a subset of environmental theories, emphasize the role
of forces that are external to the institution. These theorists view a student’s decision to
leave as part of the environment in which s/he is surrounded (Featherman & Hauser,
1978; Karabel, 1972; Pincus, 1980). Societal theories of student departure vary widely as
their “views of the underlying causes of social success also differ” (Tinto, 1993, p. 87).
Two types of societal theories are structural-functional and conflict theories.
One early societal theory, which supports a structural-functional view, contends
that there are four factors that determine a student’s educational attainment and
persistence, which include mental ability, past academic performance, aspirations, and
socioeconomic background (Featherman & Hauser, 1978). Conflict theorists, such as
Pincus (1980) believe higher education institutions are structured to serve the interests of
social and educational elites. Karabel (1972), also a conflict theorist, concluded that

20
community colleges have been given the responsibility of educating the students that
four-year institutions are not interested in accepting. Most of these students are from
moderate to lower socioeconomic backgrounds and have a difficult time completing an
associate’s degree. Since community colleges do not have the means to develop programs
to assist with student retention the way that four-year institutions do, it is very difficult
for working class students at community colleges to complete their degrees (Karabel).
However, societal theories are limited in that they do not consider the individual
institutional influences that impact student departure. Instead, they take a much more
broad approach to examining student retention (Tinto, 1993).
Economic. Economic theorists claim that students make their decision to
withdraw after weighing “the costs and benefits of alternative ways in investing one’s
scare resources” (Tinto, 1993, p.88). From an economic perspective, departure decisions
result from students examining the cost of attending a particular institution and whether
or not those costs outweigh the benefits (Cabrera et al. 1990). Students look at their
investment in education in the same way they would look at any large investment.
Economic theories contend that students’ finances and the ability of a university to award
financial aid play a large role in students’ decision to remain enrolled (Stampen &
Cabrera, 1988). Jensen (1981) notes students who receive scholarships and grants as
financial aid are more likely to show educational persistence than students who receive
loans. While these theories certainly explain why some students may choose to withdraw
from an institution, they are unable to account for the non-economic reasons why a
student may leave.
21
Organizational. Organizational theories of student departure focus less on the
external environmental characteristics and more on the characteristics of the institution.
Theorists, such as Kamens (1971) and Bean (1980) believe that it is how the institution is
organized that determines how satisfied students will be at that institution. Factors that he
examined include institutional size, faculty to student ratio, structure of the institution,
and institutional resources (Kamens). Kamens found that larger institutions have more
success retaining students due to the fact they have more links in the social environment.
Bean (1980) also took an organizational approach and examined organizational attributes
and rewards and the impact they have on student satisfaction, which in turn, leads to
retention. He found that institutions that encourage participation and reward the students
for their work will have increased retention rates (Bean). However, organizational
theories also have their weaknesses as they place all responsibility on the institution and
none on students’ individual characteristics. Organizational theories “lack explanatory
power in that they do not enable us to understand how organizational attributes
eventually impact student decisions to stay or leave” (Tinto, 1993, p. 90).
As noted previously, each of these early theories has weaknesses as they only
look at one or two factors in relation to student departure (Braxton & Hirschy, 2005).
Tinto (1993) pointed to the fact that existing models were not effective in explaining
student departure, and were not meeting the needs of researchers and practitioners. The
early psychological, sociological, and environmental models do not fully explain how
students interaction with the social and academic environments of their institutions
impact departure decisions. For this reason, a multi-theoretical approach to reducing
student departure is needed (Braxton & Mundy, 2001).The current study used an

22
interactionalist framework which contends that there are multiple influences in students’
decision to withdraw.
By the late 1970’s, Tinto’s (1975) Interactionalist Theory of Student Departure
was the most comprehensive and systematic exploration of college student withdrawal.
Since its inception (1975), and subsequent revisions (1987, 1993), this is the most widely
accepted and utilized theory of student departure. For this reason, there was limited
research to advance student departure theory between 1975 and the late 1990s and this
theory is said to have reached pragmatic status (Braxton, Hirschy & McClendon, 2004).
While Tinto’s theory may have reached pragmatic status, there are limitations which will
be discussed throughout the next section.
Tinto’s Interactionalist Theory of Student Departure
The most widely cited and accepted model of student departure is Tinto’s (1975,
1987, 1993) Interactionalist Theory of student departure. After conducting a
comprehensive review and synthesis of existing theoretical literature on student departure
(Tinto & Cullen, 1973), Tinto built on Spady’s (1971) research that linked Durkheim’s
(1951) theory of suicide to the study of college student departure (Braxton, Hirschy &
McClendon, 2004). His intention was “the development of a model linking various
individual and institutional characteristics to the process of dropout…as a means of
synthesizing a large number of recent studies but also as a means of suggesting in which
direction future research might be most fruitfully directed” (Tinto & Cullen, 1973, p. 36).
Tinto’s model posits that students’ pre-college entry characteristics, in addition to
their initial commitment to the institution and commitment to graduate, influence their

23
social and academic integration within the institution. This in turn, leads to students’
departure decisions. This theoretical framework views departure as a longitudinal process
beginning prior to enrollment at the institution and ends with the decision to persist
(Tinto, 1975).
Pre-Entry Characteristics
Since Tinto’s (1975) theory is one of individual student departure, it is necessary
to determine individual attributes which may predispose a student to certain conditions or
behaviors related to withdrawal. Tinto identified several characteristics students possess
prior to entering college. These characteristics impact students’ initial commitment to the
institution as well as students’ commitment to graduate. He identified family background,
individual attributes, and pre-college schooling experiences as the three categories of pre-
entry characteristics. Family background includes socieoeconomic status, parental
education level, and parental expectations. Individual attributes include academic ability,
race, and gender. Pre-college schooling experiences include characteristics of students’
high schools and their academic achievements in high school (Tinto).
For the purpose of this study, pre-college entry characteristics in each of the three
categories identified by Tinto are included in the model. Additionally, this study proposes
that additional psychosocial variables, such as self-concept, be explored as pre-entry
characteristics. Additional pre-entry characteristics of campus visit, state residency, and
major declaration are being included in the model as those may also impact a student’s
level of commitment to the institution and graduation (Beggs, Bantham & Taylor 2008;
Micceri, 2001; Murtaugh, Burns & Schuster, 1999).

24
Goals and Commitments
According to Tinto (1975), students enter college with educational and
occupational goals as well as a level of commitment to achieving their goals. Goals and
commitments vary for each student and are influenced by their pre-entry characteristics.
Students’ level of commitment to the institution and to graduation will influence their
institutional experiences within the academic and social domains. These experiences,
determine students’ integration into the formal and informal, academic and social
domains. Students who possess a high level of commitment to achieving their goals will
put forth the energy and resources to achieve their goals. On the other hand, students may
have clear goals, but not possess the commitment or motivation to achieve their goals.
Individual variations in goals and commitments help explain why some students will
persist to graduation while others, with the same academic credentials, may not persist.
Students not only examine their goals and commitments at the start of their college
career, but they do so prior to determining whether or not they plan to depart. It is this
process of re-examining ones goals and commitments that may eventually lead to
students’ decisions to leave the institution.
In addition to institutional commitments, students have commitments that are
external to the institution. External commitments may influence and alter students’ goals
and institutional commitments at the point in which students enter college and any time
throughout their college career.
Academic and Social Domains
Tinto (1993) states that institutions are comprised of academic and social domains
that are both formal and informal in nature. He notes “the academic [domain] concerns

25
itself almost entirely with the formal education of students. Its activities center about the
classrooms and laboratories of the institution and involve various faculty and staff whose
primary responsibility is the education of the students” (p. 106). In addition, students
have informal experiences within the academic domain which primarily include
interaction with faculty, staff and other students outside of the classroom.
On the other hand, the social domain of the institution “centers about the daily life
and personal needs of various members of the institution, especially the students” (Tinto,
1993, p. 106). On formal level, these include extracurricular activities and campus-
sponsored events. Informally, students’ interactions with their peers outside of the
organized campus structure are considered part of the social domain. These interactions
often take place in residence halls, student unions, meeting spaces, and dining halls.
Students’ experiences in each of these domains impact their decision to depart in
different ways depending on their integration into both the formal and informal, academic
and social domains of the institution. For example, a student who does not become
integrated within the formal academic domain of the institution may not meet the
minimum academic requirements, a formal condition for persistence. This student may be
forced to leave the institution. On the other hand, a student who does not become
integrated into the social domain of the institution has a choice as to whether or not s/he
wants to remain, and may decide to persist because of his/her academic integration.
Student integration into one of the domains does not necessarily indicate integration in
the other; yet, both are equally important (Tinto, 1975; 1993). Further, the strength of
each domain and ability for a student to become formally and informally integrated may
be dependent on the institutional structure or the student’s individual behavior (Tinto).

26
The formal and informal, academic and social domains are all interrelated. Tinto (1993)
best describes this when he notes:
Colleges, like other human communities, are highly interdependent, interactive
systems in which events in any one part may be felt in other parts of the system.
Experiences in the formal social system, for instance via the well-documented
effect of work-study, may have important effects upon one’s success in the
academic system of the college. At the same time, social isolation may undermine
one’s academic performance. In some instances, academic failure may arise not
from the absence of skills but from the debilitating impact of social isolation upon
a person’s ability to carry out academic work. (p. 109)
Therefore, while it is important to distinguish between the separate domains of a college
or university, it is also necessary to understand how the domains are inextricably linked,
and together, impact students’ decisions to withdraw.
Model of Student Departure
Tinto’s (1975) Student Integration Model of student departure (depicted in figure
2.1) is characterized as a sociological model that explains the longitudinal process of
college student departure at a specific institution. This model explores student departure
decisions by examining the influence of students’ pre-college attributes on their ability to
become integrated within the formal and informal, academic and social domains at a
specific institution. This model also focuses on students who withdraw from their
institution voluntarily. While students who leave due to substandard academic
performance are not ignored, this model strives to explain the reasons why students leave
when they are in good academic standing. Lastly, the model is longitudinal and

27
interactional in nature. Tinto (1993) notes “the model seeks to explain how interactions
among different individuals within the academic and social systems of the institution and
the communities which comprise them lead individuals of different characteristics to
withdraw from that institution prior to degree completion” (p. 113). In short, the model
explains student departure as a process of interaction that occurs between individuals
with certain pre-entry characteristics and the academic and social domains of an
institution. Students’ experiences within the domains lead to academic and social
integration, and continue to positively impact students’ goals and commitments to college
completion at their institution. Through these interactions and assessment of goals,
students make individual decisions to persist or withdraw from their institution (Tinto).
Figure 2.1. Tinto’s Student Integration Model of Student Departure

28
Due to the comprehensive nature and pragmatic status of Tinto’s (1975)
Interactionalist Theory of Student Departure, no other student departure theory has
received as much attention or support. In fact, research on college student departure
stalled in the mid-1990s due to the nature of this theory (Braxton, 2002). Much of the
student withdrawal research since then has been empirical studies to provide support for
Tintos’s theory (Braxton, Sullivan, Johnson, 1997; Brower, 1992; Cabrera, Stampen &
Hansen, 1990; Pascarella & Terenzini, 1980). Other research has explored ways to
improve or adapt the model as research has revealed limitations and weaknesses
(Braxton, 2002).
Empirical Support for Tinto’s Model
Since the inception of Tinto’s (1975) model, hundreds of studies have been conducted
to empirically test the model’s validity (Bean, 1980; Munro, 1981; Pascarella &
Chapman, 1983; Pascarella & Terenzini, 1979, 1980). However, two of these studies
provide a comprehensive review and analysis of existing research designed to provide
empirical support for Tinto’s model (Braxton, Sullivan & Johnson, 1997; Pascarella &
Terenzini, 1980).
The first analysis was conducted on six studies published between 1977 and 1980 and
was intended to summarize the research which tested Tinto’s construct validity
(Pascarella & Terenzini, 1980). Each of these studies were conducted by the same team
of researchers and all were based on one or more of three independent samples of
freshman at Syracuse University (Pascarella & Terenzini, 1980). After examining each of
the six studies, the researchers concluded that Tinto’s model proved to be a useful
conceptual framework for examining student departure. They also found that “operational

29
indicators of both social and academic integration were consistently found to have
statistically reliable (if sometimes modest) associations with freshman attendance
patterns, even after prematriculation differences among students were taken into account”
(Pascarella & Terenzini, 1980, p. 279). They also suggested that while these studies
address the general model, individual variables believed to be most important need to be
further explored. As a result, hundreds of studies have since explored individual aspects
of Tinto’s model.
Braxton, Sullivan and Johnson (1997) were the next to provide a thorough appraisal
of Tinto’s model. In reviewing the model, they identified 13 primary propositions that
can be empirically tested. Using a box score approach, the examined peer reviewed
studies to determine the magnitude of empirical support for each of the 13 primary
propositions (Braxton, Sullivan & Johnson). They specifically reviewed studies that
tested at least one of the propositions. Based on their analysis of multi-institutional and
single-institutional studies, they determined whether each proposition had strong,
moderate, weak or no support. They found four propositions received strong empirical
support through multi-institutional studies and five propositions received strong empirical
support through single-institutional studies. However, they also found six propositions
that did not receive strong empirical support. Table 2.1 presents a summary of the
findings. This lead Braxton, Sullivan and Johnson (1997) to conclude that “Tinto’s theory
is partially supported and lacks empirical internal consistency” (p. 3). Braxton (2002)
went on to offer suggested approaches to revise Tinto’s theory and explore new
theoretical frameworks including economic (St. John, Cabrera, Nora & Asker, 2000),

30
sociological (Berger, 2000), cultural (Kuh & Love, 2000) and psychological (Bean &
Eaton, 2000) theories.
Table 2.1
Magnitude of Support for Each Proposition by Multiple and Single Institutional Tests
Proposition Multiple Single
1 Student entry characteristics affect the level of initial
commitment to the institution.
M S
2 Student entry characteristics affect the level of initial
commitment to the goal of graduation from college.
S M
3 Student entry characteristics directly affect the student’s
likelihood of persistence in college.
M W
4 Initial commitment to the goal of graduation from college
affects the level of academic integration.
W M
5 Initial commitment to the goal of graduation from college
affects the level of social integration.
W M
6 Initial commitment to the institution affects the level of social
integration.
W W
7 Initial commitment to the institution affects the level of
academic integration.
W W
8 The greater the level of academic integration, the greater the
level of subsequent commitment to the goal of graduation.
M M
9 The greater the level of social integration, the greater the level
of subsequent commitment to the institution.
M S
10 The initial level of institutional commitment affects the
subsequent level of institutional commitment.
S S
11 The initial level of commitment to the goal of graduation from
college affects the subsequent level of commitment to the goal
of college graduation.
S S
12 The greater the level of subsequent commitment to the goal of
college graduation, the greater the likelihood of student
persistence in college.
S W
13 The greater the level of subsequent commitment to the
institution, the greater the likelihood of student persistence in
college.
M S
S = strong support; M = moderate support; W = weak support

31
The current study builds on Tinto’s model by adding self-reported, pre-college
academic self-concept and social self-concept as additional pre-college entry
characteristics that may impact students’ commitment and integration into the social and
academic domain of the institution. This new model is combining Tinto’s Student
Integration Model with a psychological approach ascertaining that certain psychological
factors impact students’ decisions to remain in college. In the next section, literature
which examines the relationship between self-concept and college success and/or
retention is explored.
Influence of Psychosocial Factors on Persistence and Retention
Recently, researchers have started to explore psychosocial variables that may
influence student departure (Astin & Oseguera, 2003; Robbins et al., 2004). Tinto’s
model is sociological in nature and it has been suggested that “developmental theories
and the research based on them suggest that other important student traits may be
overlooked if the perspective is strictly sociological” (Pascarella and Terenzini, 1991, p.
58). For this reason, the addition of academic and social self-concept will strengthen the
model by including a psychological component.
Psychosocial Variables
One of the areas researchers have started to examine is the relationship between
psychosocial factors and student persistence. Some of the factors explored include
motivation, perceived social support, and institutional commitment (Friedman & Mandel,
2011; Kahn & Nauta, 2001; Klomegah, 2007; Rayle & Chung, 2007; Robbins et al.,
2006).

32
In an effort to identify psychosocial factors that have a relationship with student
persistence and success, researchers conducted a comprehensive review of more than 400
studies, which examined postsecondary retention (Robbins, et al., 2004). Of the 400
studies, 109 examined at least one psychosocial variable and were therefore, included in a
meta-analysis to determine the psychosocial variables related to college outcomes. The
studies’ sample sizes ranged from 24 to 4,805, and all but one of the studies were
published. The researchers identified nine categories of psychosocial variables, and after
conducting the meta-analysis, they discovered 476 correlations with the retention
criterion and 279 correlations with the GPA criterion. Most of the psychosocial variables
were found to positively correlate to retention, with academic goals, academic self-
confidence, and academic related skills being the strongest predictors. The relationships
between psychosocial variables and GPA were also positively correlated, but not as
strong. Academic motivation and academic self-confidence were found to have the
strongest relationship to college GPA. A summary of the variables and correlation
strength is provided in table 2.2.
This study also pointed to the need to further investigate and identify additional
psychosocial variables related to retention as “information on these factors can enable
postsecondary institutions to identify potential students for retention programs”
(Lotkowski, Robbins, & Noeth, 2004, p. 13).
Based on the results of the previous study, Le, Casillas, Robbins, and Langley (2005),
developed a Student Readiness Inventory (SRI) in an effort to measure psychosocial
constructs centered around three primary domains including, motivation, academic
related skills, and social engagement.

33
Table 2.2
Summary of Findings from Robbins et al. (2004) Meta-Analysis
Psychosocial Factors Retention GPA
Academic self-confidence S S
Academic-related skills
S
M
Academic goals
S
M
Institutional commitment
M
M
Social support
M
M
Social involvement
M
M
Achievement motivation
W
S
General self-concept
W
W
S = strong correlation; M = moderate support; W = weak support
The Student Readiness Inventory was administered to a sample of 14,464 students
from 48 different institutions. This large-scale study was intended to examine self-
reported psychosocial factors and college outcomes as evidenced by GPA and retention
(Robbins at al., 2006). Specifically, researchers wanted to determine the “different effects
of motivational, academic skill, self-management, and social factors when predicting
college outcomes” and “whether or not psychosocial factors offer incremental prediction
of college outcomes above that already predicted by prior academic achievement,
demographic, and institutional effects” (Robbins et al., 2006, p. 600). They found that
specific measures of motivational, self-management, and social engagement factors are
all related to retention and GPA, but academic-specific motivational measures (academic
discipline and commitment to college) are the best predictors of academic performance
and retention (Robbins et al., 2006).

34
These studies examined multiple psychosocial factors and findings were mixed
regarding a relationship between self-efficacy, self-concept and self-confidence and
college student performance and retention. Robbins et al., (2006) also noted that “because
we do not know the reasons for student dropout, the retention outcome has some
ambiguity” (p. 602). The present study will start to address the ambiguity of the retention
outcome by differentiating between students who withdraw voluntary from those who
withdraw due to substandard academic performance
Self-Efficacy and Self-Concept as a Psychosocial Variable
As noted previously, student’s self-efficacy or self-concept is a variable that has
been explored as a predictor of student persistence and performance in studies examining
multiple psychosocial predictors. For the purpose of this study, research using both of
these variables is explored as they have been shown to be similar constructs (Bong &
Skaalvik, 2003). Self-efficacy was first introduced by Bandura (1977) and is defined as:
Beliefs in one’s capabilities to organize and execute the courses of action required
to produce given attainments…Such beliefs influence the course of action people
choose to pursue, how much effort they put forth in given endeavors, how long
they will persevere in the face of obstacles and failures, they resilience to
adversity, whether their thought patterns are self-hindering or self-aiding, how
much stress and depression they experience in coping with taking environmental
demands and the level of accomplishments they realize. (p. 3)
Self-concept was defined and explained by Shavelson, Hubner & Stanton (1976) as:
A person’s perception of himself…the construct is potentially important and
useful in explaining and predicting how one acts. One’s perceptions of himself are

35
thought to influence the ways in which he acts, and his acts in turn influence the
ways in which he perceives himself. (p. 411)
Self-efficacy is domain specific so researchers have specifically examined academic self-
efficacy and college self-efficacy as they relate to student success and persistence
(Peterson, 1993; Solberg, O’Brian, Villareal, Kennel and David, 1993); therefore, more
research is available on college self-efficacy. However, academic self-concept and social
self-concept are the specific constructs used in this study as there is an existing valid
instrument designed to measure these constructs (CIRP, 2013). Solberg, O’Brian,
Villareal, Kennel and David (1993) did develop a college self-efficacy instrument, and
while recent research has expanded the instrument, varying levels of reliability and
validity have been found, which is why the academic self-concept and social self-concept
constructs as measured by the Cooperative Institutional Research Program (CIRP)
Freshman Survey are being used in this study.
Early Research on Self-Efficacy
In an extensive analysis of available literature incorporating students’ self-
efficacy beliefs to academic performance and persistence outcomes, Multon, Brown &
Lent (1991) conducted the foundational research, which showed a relationship between
overall self-efficacy and academic performance and persistence. The researchers
reviewed thirty-eight studies with a total of 4,998 students. A majority of the participants
were elementary students (60.6 percent) and college students (28.9 percent). This
research provides support for the hypothesized relationship of self-efficacy beliefs to
academic performance and persistence. The researchers found self-efficacy beliefs to
account for approximately 14 percent of the variance in student’s academic performance

36
and approximately 12 percent of the variance in their academic persistence. However,
this study examined general self-efficacy, not specifically related to academic or college
related tasks.
Around the same time Peterson (1993) and Solberg, O’Brian, Villareal, Kennel
and David (1993) conducted studies specific to college students and self-efficacy.
Peterson (1993) examined career decision-making self-efficacy and its relationship with
integration of underprepared students within Tinto’s (1975) theoretical model. In this
study, survey responses from 418 students from a large, public university in Minnesota
were analyzed using correlation, analysis of variance, and multiple regression. The
researcher was guided by three primary research questions, which included 1) What is the
relationship between students’ perceived career decision-making self-efficacy and their
integration with the educational institution and their goals and commitments? 2) Do
students perceived career decision making self-efficacy, initial goals and commitments,
and integration differ by background characteristics? 3) Can students’ perceived career
decision-making self-efficacy, in addition to background characteristics, goals and
commitments, and intention to persist, help to explain the variance in integration? Overall
results found there is a relationship between career decision-making and social and
academic integration of underprepared students. The researcher found enough evidence
to warrant including career decision-making self-efficacy as an individual characteristic
in future studies of integration (Peterson, 1993). This study provides evidence of the
importance of self-efficacy in student integration. This is one of the few studies, which
directly links self-efficacy to Tinto’s model of student integration.

37
Link Between Self-Efficacy and College Student Performance
More recently, researchers have established a relationship between self-efficacy
and college performance (Brady-Amoon & Fuertes, 2011; Chemers, Hu, Garcia, 2001;
Choi, 2005 Elias & Loomis, 2000; Lynch, & Espenshade, 2005; Vuong, Brown-Welty &
Tracz, 2010). In a study of 99 introductory psychology students at a large, western public
university, Elias and Loomis (2000) intended to examine the influence of academic self-
efficacy on students’ major persistence within a variety of academic majors. The
researchers hypothesized that students with higher academic self-efficacy scores will be
less likely to change their major than students with lower scores. While academic self-
efficacy scores were not significantly related to persistence in their academic major, the
researchers did find a direct link between students’ academic self-efficacy scores and
GPA.
A longitudinal study with 373 students at the University of California, Santa Cruz,
examined first-year students’ adjustment in relation the two constructs of academic self-
efficacy and optimism on academic performance, stress, health, and commitment to
remain in school. They found self-efficacy to have a significant impact on academic
performance and adjustment and self-efficacy was determined to have predictive power
(Chemers, Hu & Garcia, 2001).
Choi (2005) also explored self-efficacy and self-concept and the relationship to
college student’s academic performance in a study with 230 undergraduate students in
general studies classes at a large southeastern university. Specifically, she wanted to
determine if self-constructs measured at a specific level correspond better with course
grades than general self-constructs. Self-efficacy was measured at three different

38
specificity levels. Global self-efficacy, academic self-efficacy and specific self-efficacy
was measured using seven items of the 17 item scale in an attempt to measure self-
efficacy specific to seven major academic task areas. The researcher found that specific
self-efficacy was the only significant predictor of grades. Based on previous research,
they were surprised that academic self-efficacy was not a significant predictor (Choi).
Another study, with 170 freshmen at a large commuter institution, explored the
joint effect of academic self-efficacy and stress on academic performance. It was
determined that academic self-efficacy and stress are negatively correlated and that
academic self-efficacy has a strong positive effect on freshman grades and credits earned.
Self-efficacy was the single strongest predictor of GPA in all models (Zajacova, Lynch,
& Espenshade, 2005).
Similarly, in a study with 1,291 first-generation sophomores at five California
universities, Vuong, Brown-Welty & Tracz (2010) found that students’ course self-
efficacy was a significant predictor of previous term GPA and overall GPA. However,
social self-efficacy did not predict any measure of academic success. However, in this
study, all of the GPA data was for past terms as opposed to future terms. This may
indicate that students’ self-efficacy was a result of the low GPA as opposed to the other
way around (Vuong, Brown-Welty & Tracz).
One of the most recent studies on college student self-efficacy and academic
performance, revealed an individual association between self-efficacy and academic
performance consistent with prior studies. However, the associations were lower in
strength. This may be due to the fact that this is the only study of those listed which

39
measured overall college self-efficacy and not specific academic self-efficacy (Brady-
Amoon & Fuertes, 2011).
Link Between Self-Efficacy and College Student Persistence
Researchers have also examined the relationship between self-concept and college
persistence. While a significant relationship has been found between students’ self-
concept and persistence, the research and strength of the association is weaker than
between self-concept and college performance (Torres & Solberg, 2001; Lotkowski,
Robbins & Noeth, 2004; Vuong, Brown-Welty & Tracz; 2010).
In a study of 189 Latino students at a two-year technical college, Torres &
Solberg (2001) evaluated the ability of academic self-efficacy, social integration, stress,
and family support systems related to college student outcomes and health. The
researchers used these four constructs to develop a model with varying paths. The first
path predicted family support directly influences both academic self-efficacy and
academic stress. The second pathway predicted that self-efficacy directly influences
college stress. Lastly, the researchers predicted that self-efficacy, social integration,
family support, and stress paths were expected to predict college persistence intentions.
The researchers found that self-efficacy directly predicted social integration, persistence
intentions, and stress. Stress was directly associated with mental and physical health;
however, social integrations did not predict persistence intentions. They also found that
family support directly affected level of academic self-efficacy. The overall finding was
that self-efficacy “served as an important determinant in educational outcomes” (p.61).
This study is one of the few studies that show the importance of self-efficacy in
relation to persistence. However, this study only looked at students’ self-reported
40
persistence implications and not actual persistence. This study also combined the three
sections of the College Self-Efficacy Inventory and other researchers have pointed out
that these items are task specific and should not be combined into one average score.
Lastly, persistence outcomes did not differentiate between students who withdraw
voluntarily from those who withdraw due to substandard academic performance.
In their study with first-generation college sophomores, Vuong, Brown-Welty &
Tracz (2010) also examined the effect of self-efficacy on student persistence. The
researchers found that for all students, course self-efficacy (one of the subscales) was a
significant predictor of the student’s persistence intentions. Roommate self-efficacy
significantly predicted intent to return for the following term. Social self-efficacy did not
predict any measure of academic success. However, as with the previous study, students
were asked to self-report their perceived likelihood to complete the current term and to
return for the following term which was how persistence was measured.
As cited previously, in their meta-analysis, Robbins et al. (2004), found academic
self-concept had a strong relationship to persistence, but the relationship between general
self-concept and retention was determined to be weak. As with all the previous studies,
they did not differentiate between voluntary and involuntary withdrawal.
By examining the relationship between students’ academic self-concept and social
self-concept and voluntary student withdrawal, this study will address two gaps in the
current literature. As noted previously, few studies have examined self-concept as a
predictor in student withdrawal and no studies have examined the predictive value of
self-concept in voluntary student withdrawal specifically. Further, the studies which have

41
been conducted have used a self-reported persistence measure which may not be
accurate.
Summary
This chapter provided an in-depth analysis of the literature including, a brief
description of early student departure theories, an overview of Tinto’s (1975)
Interactionalist Theory of Student Departure, and a discussion of the relationship between
self-concept and retention. In this chapter, it was revealed that this study integrates
Tinto’s Student Integration Model with the psychological constructs of academic self-
concept and social self-concept to strengthen the model as it is currently solely
sociological in nature. In addition, this study addressed two gaps in the literature by
adding a psychosocial component to a predictive retention model and by differentiating
between varying levels of academic performance when exploring the relationship
between self-concept and student withdrawal.
In this study, the researcher sought advance the literature by exploring the impact
of students’ self-reported, pre-college academic self-concept and students’ self-reported,
pre-college social self-concept on the likelihood of student withdrawal prior to their
second year. Additionally, the interaction between self-concept and first-year academic
performance was examined. If these self-concept variables are found to be statistically
significant, they should be considered as additional pre-college entry characteristics.

42
CHAPTER THREE: RESEARCH METHODS
In an effort to expand the current body of research on student persistence, this study
examined the relationship between students’ pre-college, self-reported academic self-
concept and social self-concept and the likelihood of withdrawal from their first
postsecondary institution. Additionally, the way in which academic self-concept and
social self-concept interact with students’ first-year academic performance and their
decision to withdraw was explored. In addition to self-concept variables, academic,
financial and demographic variables, which have been shown to be significant predictors
of student withdrawal, were included in the predictive models. Through this study, the
researcher explored whether the level of academic and/or social self-concept impacts the
likelihood of student withdrawal for students with varying levels of first-year academic
performance. As outlined in chapter one, three research questions were addressed. These
included:
1) What is the effect of students’ self-reported, pre-college academic self-concept and
social self-concept on the likelihood of withdrawal, after controlling for selected
academic, financial and demographic pre-college attributes and first-year academic
performance?
2) Does the effect of students’ self-reported, pre-college academic self-concept moderate
the relationship between students’ first-year academic performance and student
withdrawal

43
3) Does the effect of students’ self-reported, pre-college social self-concept moderate
the relationship between students’ first-year academic performance and student
withdrawal?
Statistical Methods
A series of binary logistic regression models were used to determine the relationship
between academic self-concept and social self-concept and the criterion variable of
student withdrawal. Logistic regression is a statistical model used to predict the
probability of an event by using independent variables as predictors. In this case,
Ordinary Least Squares (OLS) linear regression was not used because the dependent
variable in each model is dichotomous. When using a dichotomous variable in linear
regression, the assumptions of homoscedasticity and normality of the residuals are
violated (Allison, 2012). Logistic regression, discriminant function analysis, log-linear
models and linear probability models are all alternative statistical techniques to overcome
the limitations of OLS (Peng, So, Stage & St. John, 2002). According to Flury (1997)
“logistic regression is superior because it (a) can accept both continuous and discrete
predictors, (b) is not constrained by normality or equal variance/covariance assumptions
for the residuals, and (c) is related to the discriminant function analysis through the Bayes
theorem (as cited in Peng, So, Stage & St. John, 2002, p. 262). It is for these reasons that
logistic regression was used in this study.
Pre-college attributes that have been shown to be significant predictors of first-to-
second year retention were selected as predictor variables to be included in the regression
models (Astin & Oseguera, 2003, 2005; Lotkowski, Robbins & Noeth, 2004). These
included: high school grade point average, standardized test scores, state residency,

44
academic major declaration, first-year academic performance, pre-enrollment campus
visit, Free Application for Federal Student Aid (FAFSA) completion, expected family
contribution (EFC), gender and race/ethnicity. In addition to these predictor variables,
students’ self-reported, pre-college academic self-concept and social self-concept were
measured and used as predictor variables. Self-concept data were collected from the
Cooperative Institutional Research Program (CIRP) Freshman Survey that is
administered to the incoming freshman cohort prior to enrollment. Self-concept was
chosen as the psychosocial variable to be studied because similar constructs have been
shown to have a significant effect on student’s academic performance (Multon, Brown &
Lent, 1991; Robbins et al., 2006; Torres & Solberg, 2001). Students’ first-year,
cumulative grade point average (GPA) was also collected to explore the interaction
between first-year academic performance and self-reported academic and social self-
concept.
Data Sample and Collection Procedures
This study was conducted at the University of South Carolina, a large flagship
university in the southeast. The institution is classified by the Carnegie Foundation for
the Advancement of Teaching as having “very high research activity” and has been
designated by the College Board as having somewhat selective admission based on a 65
percent acceptance rate. An undergraduate population of more than 24,000 students
comprise more than 90 undergraduate majors on the main campus. Enrolled students
come from all 50 states and more than 100 countries. While the university system also
has seven satellite campuses, only students from the main campus were included in this
study.

45
Data were collected on all first-time, first-year students who enrolled at the main
campus during the fall 2010, fall 2011, and fall 2012 semesters and completed the
Cooperative Institutional Research Program (CIRP) Freshman Survey. All entering first-
year students are encouraged to complete the survey, so only those who self-selected to
participate were included in this study. In fall 2010, 22.8 percent of the freshman class
completed the CIRP. In fall 2011, 21.1 percent of the freshman class completed the
CIRP. In fall 2012, 28.6 percent of the freshman class completed the CIRP. In total,
CIRP data were collected on 3,841 students including: 1,009 from the fall 2010 cohort,
1,239 from the fall 2011 cohort, and 1,593 from the fall 2012 cohort. Students in these
cohorts had an average SAT (critical reading and math) of 1185, 1199, and 1199
respectively, and each cohort had an average weighted high school GPA above 3.75.
Using three years of student data ensured the sample was large enough to analyze various
demographic groups that have fewer numbers of students while making sure the student
data were recent enough to be representative of students who enroll in future terms. In
order to determine if the sample is consistent with the overall population a chi-square
goodness-of-fit test was run for each categorical variable used in the study.
Student data were only collected at a single institution for several reasons. In
order to develop the strongest model for institutional intervention, it was best to use
single institutional data to build the most accurate model. Significant predictor variables
are likely to remain similar at other four-year, public flagship institutions, but the variable
coefficients can differ depending on the institution’s student demographics. If academic
self-concept and/or social self-concept significantly predict student withdrawal, future

46
researchers and practitioners can replicate the model using the same statistical methods to
develop a predictive equation to use for intervention efforts at their institutions.
Further, the University of South Carolina has similar enrollment and demographic
characteristics as the other 12 flagship institutions in the southeast (College Board, 2014).
Secondly, the data collection and cleansing process was rigorous and needed to be done
at the institutional level by those who had extensive knowledge of the data reporting and
formatting. Therefore, the researcher identified a single institution in which she was
familiar with the data structure and coding to ensure accuracy in data collection. Once the
project was approved by the institution’s Institutional Review Board, data for each
student were collected from four institutional offices. A separate data file which included
records for all students in the fall 2010, fall 2011 and fall 2012 cohorts was obtained from
each office and the researcher merged all records using a unique student identifier used
by all offices on campus. All data were stored in a secure Access database designed
specifically for this study. Additionally, the data were cleaned in this database and then
transferred to SAS 9.4 for analysis.
First, the CIRP Freshman Survey data with students’ self-reported academic self-
concept and social self-concept was collected from the Planning and Assessment Office
in the Division of Student Affairs. Individual files for each cohort included in the study
were collected. Each file contained a unique student identifier, basic student demographic
data, and the students’ responses from the CIRP Freshman Survey, including academic
self-concept and social self-concept scores. Any record that was missing the unique
identifier and/or either of the self-concept scores were removed from the dataset. The
47
initial dataset had 3,841 students, 561 were missing necessary information, so a total of
3,281 students from the fall 2010, fall 2011, and fall 2012 cohorts remained.
All CIRP Freshman Survey data not being used in this study were deleted from the file,
so the remaining data columns included the student’s unique identifier and each student’s
self-reported academic self-concept and social self-concept scores.
The researcher then used the unique school identifier for each student to match
the student’s academic self-concept and social self-concept with an institutional dataset
provided by the Office of Undergraduate Admissions. If any student’s unique identifier
did not provide a match with the file obtained from the Office of Undergraduate
Admissions, that record was removed from the dataset. A total of 182 records were not
able to be matched at this stage.
The dataset provided by the Office of Undergraduate Admissions included
student’s average SAT score (critical reading and math), high school GPA, residency
status at time of admission, major declaration at time of admission, pre-enrollment
campus visit status, gender, and race/ethnicity. The admissions file did not contain any
missing data as all first-time, full-time students are required to submit standardized test
scores and high school transcripts. Students are also required to report gender and
race/ethnicity on the admissions application, as well as primary state of residence. In
addition, all students must either declare a major or select undeclared on the application.
Lastly, all students who did not have a campus visit recorded with the admissions office
were presumed to not have had an official campus visit prior to enrollment as the
admissions office tracks all visitors.

48
Next, using the secure Access database, the researcher merged the CIRP data and
the admissions data with a dataset that was provided by the Office of Student Financial
Aid and Scholarships. The financial aid dataset included each student’s unique ID as well
as an indicator of whether the student completed the Free Application for Federal Student
Aid (FAFSA) and the resulting Expected Family Contribution (EFC). All records in the
original dataset had a matching record in the financial dataset.
Lastly, the researcher requested a dataset from the Office of Retention and
Planning which contained records for all students in the fall 2010, fall 2011 and fall 2012
first-time, freshman cohorts. The data items included each student’s unique identifier, a
first-to-second year retention indictor and institutional GPA at the end of the spring term
for each student. This dataset was imported to the secure Access database and merged
with the existing data. All records in the original dataset had a matching record in the
retention dataset.
Once the data were in a single dataset, all variables were coded, and individual
identifiers were removed from the dataset so individual students could not be identified.
All data was stored on a password protected computer, encrypted with university security
settings so nobody had access to the dataset other than the researcher. A description of
the variables is provided below and summarized in table 3.1.
Cooperative Institution Research Program (CIRP) Freshman Survey
This study used two constructs from the CIRP Freshman Survey to measure
students’ self-reported, pre-college academic self-concept and self-reported, pre-college
social self-concept. Previous research has examined self-confidence, self-efficacy, and
self-concept using different instruments and methods. Inventories that have been used

49
Table 3.1
Variables by Definition and Source
Variable Operational Definition Source
Academic Variables
SAT Score
Standardized test score used in admissions
decision
ADM
High School GPA Weighted grade point average based on 19 core
high school courses used in admissions decision
ADM
Major Declaration Whether the student had a major declared at the
time of enrollment, or was undeclared
ADM
First-Year Academic
Performance
Based on first-year grade point average on grades
received in institutional coursework completed in
the fall and spring semesters
REG
Demographic Variables
Gender
Gender as reported by student on admissions
application
ADM
Race/Ethnicity
Race/ethnicity as reported by student on
admissions application
ADM
Residency
Whether student is a resident of same state as
institution, or an out-of-state student
ADM
Campus Visit
Whether student conducted official campus visit
prior to enrollment, or did not visit
ADM
Financial Variables
Completion of FAFSA
Whether student completed the FAFSA prior to
enrollment, or not
FIN
Expected Family Contribution Federally determined amount student’s family is
expected to contribute to education of student
based on completion of FAFSA prior to
enrollment
FIN
Self-Concept Variables
Academic Self-Concept
Student’s beliefs about his/her abilities and
confidence in academic environments
CIRP
Social Self-Concept Student’s beliefs about his/her abilities and
confidence in social situations
CIRP

50
Variable Operational Definition Source
Outcome Variables
Withdrawal
Whether student returns to institution for the
second year, or not
REG
ADM = Undergraduate Admissions Institutional Database; FIN = Financial Aid Institutional Database;
CIRP = Cooperative Institution Research Program Freshman Survey results; REG = Registrar
Institutional Database
include the College Self-Efficacy Inventory (Solberg, O’Brian, Villareal, Kennel &
David, 1993; Torres & Solberg, 2001), the Student Readiness Inventory (Le, Casillas,
Robbins & Langley, 2005), and institutional questionnaires (Chemers, Hu & Garcia,
2001; Lent, 1991). No research has been previously published using the self-concept
constructs from the CIRP Freshman Survey as variables in predicting student withdrawal.
The instrument was developed in 1965 and first administered in 1966 when 15
percent of the United States’ institutions were invited to participate. Since 1971, all
institutions have been invited to participate as long as they are “admitting first-time, full-
time students and granting a baccalaureate-level degree or higher listed in the U.S.
Department of Education’s Integrated Postsecondary Education Data System (IPEDS)”
(Pryor et al., 2012, p.49). In 2012, 236,937 first-time, full-time students at 389 colleges
and universities completed the survey. The data are collected prior to enrollment or
within the first weeks of classes before the students have substantial college experiences.
The instrument is reviewed annually by researchers at the Higher Education Research
Institute at UCLA to ensure continued reliability and validity (Pryor et al., 2012). The
instrument is comprised of 43 questions and takes approximately 25 minutes to complete.

51
Students were told about the CIRP Freshman Survey when they attended
orientation in June. Prior to enrollment, they were emailed a link to complete the web-
based version of the instrument in July. Subsequent email reminders encouraging
students to complete the survey were sent to students throughout July and August.
Students received no incentive for participation. At the time they were asked to complete
the survey, students were provided with an information sheet that outlined the
instrument’s purpose, procedure, benefits, risks, and confidentiality. Students were also
assured their responses would be used for research purposes only and would be kept
strictly confidential. As mentioned previously, the average response rate for fall 2010,
fall 2011, and fall 2012 was 22.8 percent, 27.0 percent and 34.8 percent respectively.
In 2010, researchers used Item Response Theory (IRT) to create constructs which
“represent sets of related survey items that measure an underlying trait or aspect of a
student’s life” (Sharkness, DeAngelo, & Pryor, 2010, p.1). At this time, the constructs of
academic self-concept and social self-concept were introduced. Three steps were used
during construct development to ensure reliability and validity of the items. First,
researchers conducted exploratory factor analyses for item selection and assumption
checking. Next, they used a graded response model for parameter estimation. Finally, the
researchers used MULTILOG to score students on each construct. Students’ scores are
rescaled from z-scores to have a mean of approximately 50 and a standard deviation of
approximately 10 (Sharkness, DeAngelo, & Pryor). By recoding original scores
according to observed distributions, students’ scores are categorized using a three-
category variable of “low,” “medium,” or “high.” Students with scores of 0.5 standard
deviations above the mean or higher are categorized as “high.” Those with scores within

52
0.5 standard deviations of the mean are categorized as “medium.” Students with scores of
0.5 standard deviations below the mean are categorized as “low” (Sharkness, DeAngelo,
& Pryor).
Academic self-concept was defined as “a unified measure of students’ beliefs
about their abilities and confidence in academic environments” (Pryor et al., 2012, p. 54).
The construct is based on students’ responses to the statement “Rate yourself on each of
the following traits as compared with the average person your age. We want the most
accurate estimate of how you see yourself” (Pryor et al., 2012, p. 54). The rating scale is
comprised of five options including Highest 10%, Above Average, Average, Below
Average, and Lowest 10%. The traits students rate themselves on include: academic
ability, drive to achieve, mathematical ability and self-confidence (intellectual).
Social self-concept was defined as “a unified measure of students’ beliefs about
their abilities and confidence in social situations” (Pryor et al., 2012, p. 54). The
construct is based on students’ responses to the statement “Rate yourself on each of the
following traits as compared with the average person your age. We want the most
accurate estimate of how you see yourself” (Pryor et al., 2012, p. 54). The rating scale is
comprised of five options including Highest 10%, Above Average, Average, Below
Average, and Lowest 10%. The traits students rate themselves on include: leadership
ability, public speaking ability, self- confidence (social), and popularity.
Academic Predictor Variables
SAT Score. Standardized test scores were collected from the Office of
Undergraduate Admissions. The critical reading and math sections were
combined for an SAT total score. SAT scores ranged from 830-1600. All students
53
were required to submit official test scores as part of the admissions process.
Students had the option of submitting either an ACT or SAT score. For students
who only submitted an ACT score, it was converted to the SAT scale using the
SAT-ACT concordance scale developed by the College Board and ACT.
Weighted High School Grade Point Average (GPA). A calculated weighted
core GPA was collected from the Office of Undergraduate Admissions. This
GPA is on a 5.0 weighted scale and was derived from the 19 core academic
courses required for admission to the institution. Students were awarded one
additional point for honors, AP, IB, and dual enrollment courses. The weighted
core GPA ranged from 2.24 – 5.0.
Major Declaration. Major selection was collected from the Office of
Undergraduate Admissions. Students who declared a major prior to enrollment
were categorized as declared. Students who were undecided about their major
during their first semester were categorized as undeclared. Since major selection
is a categorical variable, it was dummy-coded with declared equal to 0 and
undeclared equal to 1.
First-Year Academic Performance. Students’ first-year institutional GPA was
collected from the Retention and Planning Office. First-year GPA is calculated
from grades earned in institutional coursework taken during the fall and spring
semesters. Based on their GPA, students were assigned to one of the three
academic performance categories. Students with a GPA of 0.0 to 1.9 were
categorized as low academic performance. Students with a GPA of 2.0 to 2.9 were

54
categorized as medium academic performance. Students with a GPA of 3.0 to 4.0
were categorized as high academic performance.
Demographic Predictor Variables
Gender. Gender was collected from the Office of Undergraduate Admissions
based on students’ response to the gender question on the admissions application.
Students were required to select either male or female. Since gender is a
categorical variable, it was dummy-coded with male equal to 0 and female equal
to 1.
Race/Ethnicity. Race/ethnicity was collected from the Office of Undergraduate
Admission and was based on students’ responses to two race/ethnicity questions
on the admissions application. Based on federal reporting standards, race and
ethnicity data were reported according to the following seven mutually exclusive
ethnicity and race categories: (1) Hispanic or Latino (of any race); (2) American
Indian or Alaska Native; (3) Asian; (4) Black or African American; (5) Native
Hawaiian or Other Pacific Islander; (6) White; (7) Two or more races. Since there
were not enough students in each of the race/ethnicity categories, students were
categorized as being either white or non-white. Since race/ethnicity is a
categorical variable, it was dummy-coded with white equal to 0 and non-white
equal to 1.
Residency. Residency status was collected from the Office of Undergraduate
Admissions based on students’ residency selection on the admissions application.
Students who were residents in the same state as the institution were categorized
as resident and students who were from any other state were categorized as non-

55
resident. Since residency is a categorical variable, it was dummy-coded with
resident equal to 0 and non-resident equal to 1.
Campus Visit. Pre-enrollment campus visit status was collected from the Office
of Undergraduate Admissions. Students who had an official campus visit through
the visitor center or attended an on-campus admissions event prior to enrolling
were categorized as visitors. Students who did not have an official campus visit
were categorized as non-visitors. Since campus visit status is a categorical
variable, it was dummy-coded with visitors equal to 0 and non-visitors equal to 1.
Financial Variables
Completion of FAFSA. Completion of the FAFSA denotes whether or not a
student filed a Free Application for Federal Student Aid (FAFSA) with the
institution. Since this is a categorical variable, it was dummy-coded with
completed equal to 0 and not completed equal to 1.
Expected Family Contribution (EFC). Expected Family Contribution was
derived as a result of completion of the FAFSA. The federal formula for EFC is a
measure of the family’s financial strength and is the amount the family is
expected to contribute to the student’s cost of attendance. Zero is the lowest
possible value and 99,000 is the highest. Students were divided into 10 EFC
groups with one being students who have the most need and 10 being the students
who have the least amount of need.

56
Self-Concept Predictor Variables
Academic Self-Concept. Based on students’ individual construct scores, they
were categorized as having “low,” “medium,” or “high” academic self-concept.
Scores and categories were collected from the CIRP Freshman Survey data file.
Social Self Concept. Based on students’ individual construct scores, they were
categorized as having “low,” “medium,” or “high” social self-concept. Scores and
categories were collected from the CIRP Freshman Survey data file.
Outcome Variables
Student Withdrawal. Students’ first-to-second year retention status was
collected from the Retention and Planning Office. Students who were still
enrolled at the institution in the fall after they started were categorized as
returned. Those who were no longer enrolled were categorized as non-returners.
Official enrollment numbers were captured each October during a data freeze
process. Since retention status is a categorical variable, it was dummy-coded with
withdrawn equal to 0 and retained equal to 1.
Statistical Analysis
Each of the research questions was addressed using logistic regression, a common
statistical method used in higher education research (Peng, So, Stage, & St. John, 2002).
Student withdrawal status was used as the dependent variable in each regression model.
A list of independent variables and coding levels is in table 3.2.
Prior to inclusion in the logistic regression models, all of the variables were tested
for multicollinearity. SAS procedure PROG CORR was used to examine bivariate

57
Table 3.2
Variables, Coding Levels and Abbreviations
Variable Categories Coding Abbreviation
Academic Variables
SAT Score
SAT score ranging from 830-1600
Continuous
SAT
High School GPA GPA ranging from 2.4 – 5.0 x 100 Continuous
GPA
Major Declaration Declared Major (reference)
0 = yes; 1 = no MAJOR
First-Year Academic
Performance
0.0-1.9: Low
2.0-2.9: Medium
3.0-4.0: High (reference)
1 = 1, 0
2 = 0, 1
3 = 0, 0
FYPERMlow
FYPERMmedium
Demographic Variables
Gender
Male (reference)
0 = yes; 1 = no
GENDER
Race/Ethnicity
White (reference)
0 = yes; 1 = no RACE
Residency
Resident (reference)
0 = yes; 1 = no
RES
Campus Visit
Visited campus (reference) 0 = yes; 1 = no VISIT
Financial Variables
Completion of FAFSA
Completed FAFSA (reference)
0 = yes; 1 = no
FAFSA
Expected Family
Contribution
EFC Range 1 -10 Continuous EFC
Self-Concept Variables
Academic Self-
Concept
Low
Medium
High (reference)
1 = 1, 0
2 = 0, 1
3 = 0, 0
ACA_SClow
ACA_SCmedium
Social Self-Concept Low
Medium
High (reference)
1 = 1, 0
2 = 0, 1
3 = 0, 0
SOC_SClow
SOC_SCmedium
Interaction Variables
FYPERF 𝑥 ACA_SC
Interaction of first-year academic
performance and academic self-
concept variables
FYPERF 𝑥 SOC_SC
Interaction of first-year academic
performance and social self-
concept variables

58
correlations between independent variables. PROC REG, normally used for linear
regression analysis, was used to determine if any of the variables had low levels (< .40)
of tolerance, an indication of multicollinearity.
Once multicollinearity was tested, the first research question was examined
through a logistic regression model using all variables applied to the entire sample. The
logistic regression equation expressed as:
𝑙𝑜𝑔 [𝑝𝑖
1 − 𝑝𝑖] = 𝛼 + 𝛽1𝑆𝐴𝑇 + 𝛽2𝐺𝑃𝐴 + 𝛽3𝑀𝐴𝐽𝑂𝑅
+ 𝛽4𝐹𝑌𝑃𝐸𝑅𝐹𝑙𝑜𝑤 + 𝐹𝑌𝑃𝐸𝑅𝑀𝑚𝑒𝑑𝑖𝑢𝑚 + 𝛽6𝐺𝐸𝑁𝐷𝐸𝑅 + 𝛽7𝑅𝐴𝐶𝐸
+ 𝛽8𝑅𝐸𝑆 + 𝛽9𝑉𝐼𝑆𝐼𝑇 + 𝛽10𝐹𝐴𝐹𝑆𝐴 + 𝛽11𝐸𝐹𝐶 + 𝛽12𝐴𝐶𝐴_𝑆𝐶𝑙𝑜𝑤
+ 𝛽13𝐴𝐶𝐴_𝑆𝐶𝑚𝑒𝑑𝑖𝑢𝑚 + 𝛽14𝑆𝑂𝐶_𝑆𝐶𝑙𝑜𝑤 + 𝛽15𝑆𝑂𝐶_𝑆𝐶𝑚𝑒𝑑𝑖𝑢𝑚
where 𝑝𝑖 is the probability of withdrawing prior to the second year, was interpreted. In
the above equation, 𝛽 represents the predicted changes in log odds of withdrawal
(dependent variable) for every one unit change in the associated independent variable. To
answer the first research question, the 𝛽 coefficients associated with academic self-
concept and social self-concept were examined.
Significance of the individual predictors, academic self-concept and social self-
concept, were tested using the Wald chi-square statistic (p < .05) and odds ratios with a
95% confidence interval.
Since log odds are not easily interpreted, the relationship between the self-concept
variables and the dependent variable of withdrawal was based on odds ratios. The odds
ratios were used to “measure the relationship between two different dichotomous
variables” for each self-concept variable in the model (Allison, 2012, p. 16). Odds ratios

59
are used because “they are less sensitive to changes in the marginal frequencies than
other measures of association” (Allison, p. 17).
The second research question was answered through a second logistic regression
model with the addition of interaction terms between first-year academic performance
and academic self-concept. The logistic regression equation is expressed as: 𝑙𝑜𝑔 [𝑝𝑖
1−𝑝𝑖] =
𝛼 + 𝛽1𝑆𝐴𝑇 + 𝛽2𝐺𝑃𝐴 + 𝛽3𝑀𝐴𝐽𝑂𝑅 + 𝛽4𝐹𝑌𝑃𝐸𝑅𝐹𝑙𝑜𝑤 + 𝛽5𝐹𝑌𝑃𝐸𝑅𝐹𝑚𝑒𝑑𝑖𝑢𝑚 +
𝛽6𝐺𝐸𝑁𝐷𝐸𝑅 + 𝛽7𝑅𝐴𝐶𝐸 + 𝛽8𝑅𝐸𝑆 + 𝛽9𝑉𝐼𝑆𝐼𝑇 + 𝛽10𝐹𝐴𝐹𝑆𝐴 + 𝛽11𝐸𝐹𝐶 +
𝛽13𝑆𝑂𝐶_𝑆𝐶𝑙𝑜𝑤+ 𝛽14𝑆𝑂𝐶_𝑆𝐶𝑚𝑒𝑑 + 𝛽15𝐴𝐶𝐴_𝑆𝐶𝑙𝑜𝑤 + 𝛽16𝐴𝐶𝐴_𝑆𝐶𝑚𝑒𝑑𝑖𝑢𝑚 +
𝛽17𝐹𝑌𝑃𝐸𝑅𝐹𝑙𝑜𝑤 ∗ 𝐴𝐶𝐴_𝑆𝐶𝑙𝑜𝑤 + 𝛽18𝐹𝑌𝑃𝐸𝑅𝐹𝑙𝑜𝑤 ∗ 𝐴𝐶𝐴_𝑆𝐶𝑚𝑒𝑑𝑖𝑢𝑚 +
𝛽19𝐹𝑌𝑃𝐸𝑅𝐹𝑚𝑒𝑑𝑖𝑢𝑚 ∗ 𝐴𝐶𝐴_𝑆𝐶𝑚𝑒𝑑𝑖𝑢𝑚 + 𝛽20𝐹𝑌𝑃𝐸𝑅𝐹𝑚𝑒𝑑𝑖𝑢𝑚 ∗ 𝐴𝐶𝐴_𝑆𝐶𝑙𝑜𝑤
The third research question was answered through a third logistic regression
model with the addition of interaction terms between first-year academic performance
and social self-concept. The logistic regression equation is expressed as:
𝑙𝑜𝑔 [𝑝𝑖
1 − 𝑝𝑖] = 𝛼 + 𝛽1𝑆𝐴𝑇 + 𝛽2𝐺𝑃𝐴 + 𝛽3𝑀𝐴𝐽𝑂𝑅
+ 𝛽4𝐹𝑌𝑃𝐸𝑅𝐹𝑙𝑜𝑤 + 𝛽5𝐹𝑌𝑃𝐸𝑅𝐹𝑚𝑒𝑑𝑖𝑢𝑚 + 𝛽6𝐺𝐸𝑁𝐷𝐸𝑅 + 𝛽7𝑅𝐴𝐶𝐸
+ 𝛽8𝑅𝐸𝑆 + 𝛽9𝑉𝐼𝑆𝐼𝑇 + 𝛽10𝐹𝐴𝐹𝑆𝐴 + 𝛽11𝐸𝐹𝐶 + 𝛽12𝐴𝐶𝐴_𝑆𝐶𝑙𝑜𝑤
+ 𝛽13𝐴𝐶𝐴_𝑆𝐶𝑚𝑒𝑑 + 𝛽14𝑆𝑂𝐶_𝑆𝐶𝑙𝑜𝑤 + 𝛽14𝑆𝑂𝐶_𝑆𝐶𝑚𝑒𝑑𝑖𝑢𝑚
+ 𝛽15𝐹𝑌𝑃𝐸𝑅𝐹𝑙𝑜𝑤 ∗ 𝑆𝑂𝐶_𝑆𝐶𝑙𝑜𝑤 + 𝛽16𝐹𝑌𝑃𝐸𝑅𝐹𝑙𝑜𝑤 ∗ 𝑆𝑂𝐶_𝑆𝐶𝑚𝑒𝑑𝑖𝑢𝑚
+ 𝛽17𝐹𝑌𝑃𝐸𝑅𝐹𝑚𝑒𝑑𝑖𝑢𝑚 ∗ 𝑆𝑂𝐶_𝑆𝐶𝑚𝑒𝑑𝑖𝑢𝑚
+ 𝛽18𝐹𝑌𝑃𝐸𝑅𝐹𝑚𝑒𝑑𝑖𝑢𝑚 ∗ 𝑆𝑂𝐶_𝑆𝐶𝑙𝑜𝑤
To answer research questions two and three, the interaction variables were
analyzed. Significance was tested using the Wald chi-square statistic (p < .05).

60
Additionally, goodness-of-fit was examined to determine if the new model, with
interactions, fits the data better than the original model from research question one. A
significant interaction and a significant change in -2 log likelihood is evidence of a
moderating effect. If there is only a significant interaction and no significant change in -2
log likelihood, it will be evidence of a weak moderating effect. There will be no evidence
of a moderating effect, if neither the interaction nor the change in -2 log likelihood is
significant.
In addition to statistical tests of individual predictors for each self-concept
variable and interaction, the researcher also considered an overall model evaluation for
each of the three models. The likelihood ratio, score and Wald tests were examined to
determine if the logistic model is more effective than the null model. If the logistic model
is an improvement over the intercept-only (null) model, it is determined to provide a
better fit to the data (Peng, Lee, Ingersoll, 2002). It was also necessary to assess the fit of
the logistic model against the actual outcomes. The goodness-of-fit was examined using
the Hosmer-Lemeshow (H-L) test (p >.05). Finally, validations of predicted probabilities
were explored using Somer’s D statistic and the c statistic.
Summary
To answer the three research questions proposed in this study, using data from the
University of South Carolina, three binary logistic regression models were run to
determine whether academic self-concept and/or social self-concept were significant
predictors of student withdrawal. Additionally, the interaction between both self-concept
variables and first-year academic performance was explored. Additional academic,

61
financial, and demographic pre-college attributes were selected as control variables and
included in each logistic regression model.

62
CHAPTER FOUR: FINDINGS
The fall 2010, fall 2011 and fall 2012 freshman class cohorts were comprised of
4,423, 4,569, and 4,580 students respectively, for a combined population of 13,572
students. Of these students, 3,841 (28 percent) completed the CIRP Freshman Survey and
were therefore, considered for this study. Students who were missing unique identifiers,
self-concept scores and/or did not have at least 24 credit hours were eliminated from the
dataset, leaving 3,099 (22.8 percent) students for this study. Students who were missing
either the unique identifier, the CIRP self-concept scores, or the required number of hours
were eliminated from the study during the first step of the data matching process;
therefore, no additional analysis was able to be performed.
Descriptive Statistics
The sample for this study was comprised of 3,099 students. Of these students, 65
percent (2,026) were female. Approximately half, 54 percent (1,657) were South Carolina
residents, and 71 percent (2,198) had conducted an official campus visit prior to
enrolling. Eight-three percent (2,557) of the students were White, non-Hispanic students.
The 17 percent (542) non-White students were either Hispanic or Latino (of any race),
American Indian or Alaska Native, Asian, Black or African American, Native
Hawaiian/Other Pacific Islander or two or more races.
63
Academically, the students in this study had a mean SAT of 1224 (SD 131) and a
mean high school GPA of 4.01 (SD .53). Their mean first-year GPA was 3.33 (SD .80).
In terms of first-year academic performance, six percent (197) of students were
categorized as low, 15 percent (469) were categorized as medium and 79 percent (2,433)
were categorized as high. Almost all of the students, 92 percent (2,853), had declared a
major prior to starting their freshman year. Financially, 83 percent (2,587) of students
completed the Free Application for Federal Student Aid (FAFSA). The mean Expected
Family Contribution (EFC) was 4.35, which falls in the $3,000 - $3,999 category.
In terms of self-concept, 15 percent (462) of students had low academic self-
concept, 49 percent (1,510) had medium academic self-concept, and 36 percent (1127)
had high academic self-concept. Twenty-five percent (778) of students had low social
self-concept, 40 percent (1,243) had medium social self-concept, and 35 percent (1,078)
had high social self-concept. A comparison of demographics between the self-concept
categories is presented later in the chapter.
Comparison between Returners and Non-Returners
Nearly 90 percent (2,792) of the students in the study returned to the institution in
the fall of their second year and were categorized as returners for this study. This number
is slightly higher than the percent (87.4) of the total population (13,730) who returned to
the institution for their second year. Several differences existed between the returner and
non-returner students.
The 307 students who withdrew prior to starting their second year had a mean
first-year GPA of 2.11 (SD 1.47). The 2,792 students who did return to the institution for
their second year had a mean first-year GPA of 3.46 (SD .54). Of those who withdrew, 43

64
percent (133) were categorized as low academic performance, 19 percent (58) were
categorized as medium academic performance, and 38 percent (116) were categorized as
high academic performance. The returners had two percent (64) of students in the low
academic performance category, 15 percent (411) in the medium academic performance
category, and 83 percent (2,317) in the high academic performance category.
Additionally, the students’ pre-college academic credentials differed with the non-
returners having a mean SAT of 1193 (SD 118) and the returners having a mean SAT of
1228 (SD 132). The mean high school GPA was 3.78 (SD .52) for the non-returners and
4.04 (SD .53) for the returners.
While the students EFC was similar, with a mean of 4.55 for non-returners and
4.32 for returners, a higher percentage of returners opted to complete the FAFSA.
Seventy-five percent (231) of non-returners completed the FAFSA for their first year,
whereas 84 percent (2,356) of returners completed the FAFSA. Non-returners were also
less likely to have visited campus prior to enrolling. Sixty percent (187) of non-returners
visited campus and 72 percent (2,011) of returners had visited.
In terms of self-concept, academic self-concept differed between the two groups
of students, but social self-concept levels were similar. Of the non-returners, 19 percent
(57) had low academic self-concept, compared to 15 percent (405) of the returners. Fifty-
five percent (168) of the non-returners had medium self-concept, compared to 48 percent
(1342) of the returners. Twenty-seven percent (82) of non-returners had high academic
self-concept, compared to 37 percent (1045) of returners. Complete descriptive statistics
comparing returners and non-returners can be found in table 4.1.
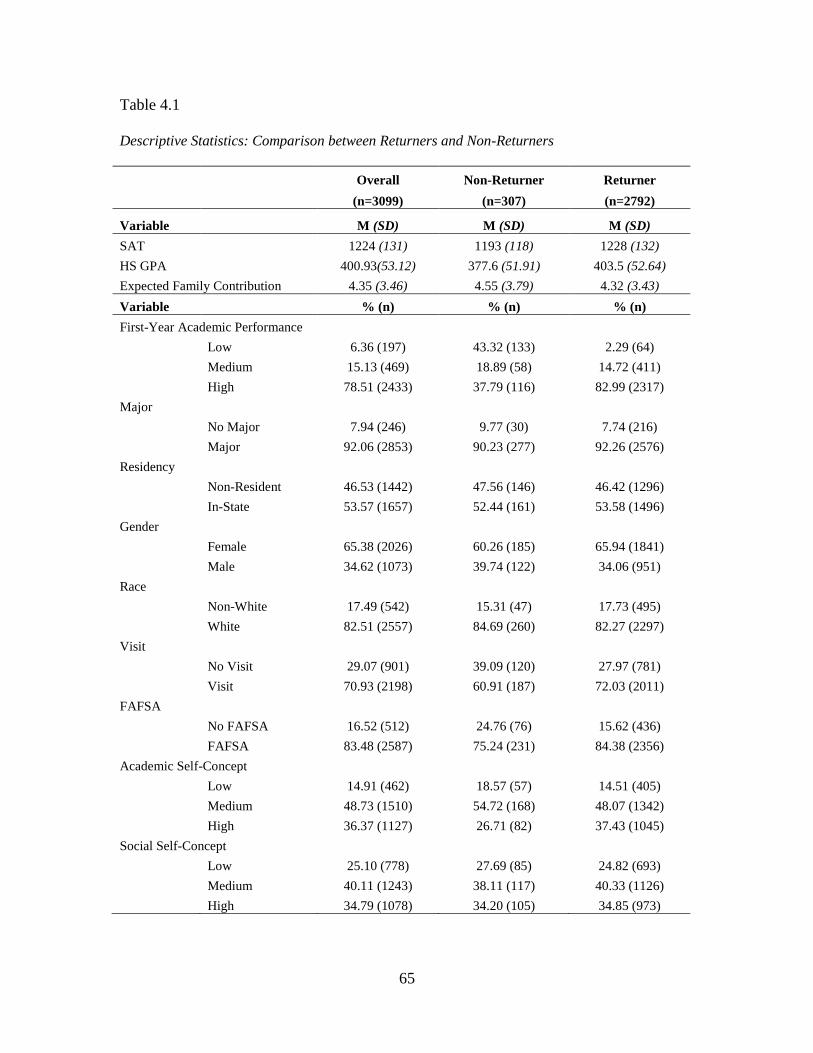
65
Table 4.1
Descriptive Statistics: Comparison between Returners and Non-Returners
Overall Non-Returner Returner
(n=3099) (n=307) (n=2792)
Variable M (SD) M (SD) M (SD)
SAT
1224 (131) 1193 (118) 1228 (132)
HS GPA
400.93(53.12) 377.6 (51.91) 403.5 (52.64)
Expected Family Contribution 4.35 (3.46) 4.55 (3.79) 4.32 (3.43)
Variable % (n) % (n) % (n)
First-Year Academic Performance
Low 6.36 (197) 43.32 (133) 2.29 (64)
Medium 15.13 (469) 18.89 (58) 14.72 (411)
High 78.51 (2433) 37.79 (116) 82.99 (2317)
Major
No Major 7.94 (246) 9.77 (30) 7.74 (216)
Major 92.06 (2853) 90.23 (277) 92.26 (2576)
Residency
Non-Resident 46.53 (1442) 47.56 (146) 46.42 (1296)
In-State 53.57 (1657) 52.44 (161) 53.58 (1496)
Gender
Female 65.38 (2026) 60.26 (185) 65.94 (1841)
Male 34.62 (1073) 39.74 (122) 34.06 (951)
Race
Non-White 17.49 (542) 15.31 (47) 17.73 (495)
White 82.51 (2557) 84.69 (260) 82.27 (2297)
Visit
No Visit 29.07 (901) 39.09 (120) 27.97 (781)
Visit 70.93 (2198) 60.91 (187) 72.03 (2011)
FAFSA
No FAFSA 16.52 (512) 24.76 (76) 15.62 (436)
FAFSA 83.48 (2587) 75.24 (231) 84.38 (2356)
Academic Self-Concept
Low 14.91 (462) 18.57 (57) 14.51 (405)
Medium 48.73 (1510) 54.72 (168) 48.07 (1342)
High 36.37 (1127) 26.71 (82) 37.43 (1045)
Social Self-Concept
Low 25.10 (778) 27.69 (85) 24.82 (693)
Medium 40.11 (1243) 38.11 (117) 40.33 (1126)
High 34.79 (1078) 34.20 (105) 34.85 (973)

66
Comparison between Self-Concept Categories
Since the primary focus of this study was self-concept, it was also necessary to
examine the demographic differences between students with differing levels of academic
self-concept and social self-concept. Of the 3,099 students in the study, 15 percent (462)
had low academic self-concept, forty-nine percent (1,510) had medium academic self-
concept, and 36 percent (1,127) had high academic self-concept. In terms of social self-
concept, 25 percent (778) of students had low social self-concept, 40 percent (1,243) had
medium social self-concept, and 35 percent (1,078) had high social self-concept. Several
notable differences existed between the groups.
Academic self-concept. When examining the different levels of academic self-
concept, academic differences among the students were the most apparent differences.
Students in the low academic self-concept group had a mean SAT of 1131 (SD 97.64),
whereas students in the high academic self-concept group had a mean SAT of 1287 (SD
133.95). The same trend existed with high school GPA and first-year academic
performance. Students in the low academic self-concept group had a mean high school
GPA of 3.58 (SD .47) and a mean first-year GPA of 3.04 (SD .78). Students in the high
academic self-concept group had a mean high school GPA of 4.29 (SD .47) and a mean
first-year GPA of 3.50 (SD .75). Further, 87 percent of the students with high academic
self-concept also had high first-year academic performance. Whereas, 65 percent of the
students with low academic self-concept had high first-year academic performance.
All other categories among the three groups were similar with the exception of
gender. Seventy-four percent (344) of the students with low academic self-concept were
female, whereas females made up 59 percent (662) of the students with high academic

67
self-concept. Complete descriptive statistics comparing students in the academic self-
concept categories can be found in table 4.2.
Social self-concept. The differences among students with varying levels of social
self-concept were not tied to academics. All three social self-concept groups had similar
mean SAT scores, high school GPAs and first-year academic performance. The primary
differences between the groups were students’ residency status and gender. In terms of
residency, 60 percent (468) of students with low social self-concept were in-state
residents, whereas 50 percent (538) of students with high social self-concept were in-state
residents. Additionally, 71 percent (549) of those who had low social self-concept were
female, compared to 59 percent (635) of those with high social self-concept. All other
categories among the three groups were similar. Complete descriptive statistics
comparing students in the social self-concept categories can be found in table 4.3.
Chi-Square Goodness-of-Fit Test
A chi-square test of goodness-to-fit was performed to determine whether the
sample of students who completed the CIRP was representative of the population, in
terms of FAFSA completion, gender, major declaration, race/ethnicity, residency, visit
status and likelihood of withdrawal. Of the seven categorical variables examined, six
were not representative of the overall population. Tables 4.4 through 4.9 show the
expected frequencies and observed frequencies for each variable in which the sample was
not representative of the population. Implications of these results will be discussed in
chapter five.

68
Table 4.2
Descriptive Statistics: Comparison between Academic Self-Concept Categories
Academic Self-Concept
Low Medium High
(n=462) (n=1510) (n=1127)
Variable
M (SD) M (SD) M (SD)
SAT
1131.49 (97.64) 1206 (114.69) 1287 (133.95)
HS GPA
3.58 (.47) 3.93 (.48) 4.29 (.47)
Expected Family Contribution 4.43 (3.58) 4.34 (3.45) 4.32 (3.43)
Variable
% (n) % (n) % (n)
First-Year Academic Performance
Low 8.66 (40) 6.75 (102) 4.88 (55)
Medium 25.97 (120) 16.89 (255) 8.34 (94)
High 65.37 (302) 76.36 (1153) 86.79 (978)
Major
No Major 9.09 (42) 7.95 (120) 7.45 (84)
Major 90.91 (420) 92.05 (1390) 92.55 (1043)
Residency
Non-Resident 41.99 (194) 48.61 (734) 45.61 (514)
Resident 58.01 (268) 51.39 (776) 54.39 (613)
Gender
Female 74.46 (344) 67.55 (1020) 58.74 (662)
Male 25.54 (118) 32.45 (490) 41.26 (465)
Race
Non-White 16.67 (77) 17.42 (263) 17.92 (202)
White 83.33 (385) 82.58 (1247) 82.08 (925)
Visit
No Visit 34.20 (158) 28.68 (433) 27.51 (310)
Visit 65.80 (304) 71.32 (1077) 72.49 (817)
FAFSA
No FAFSA 19.48 (90) 16.29 (246) 15.62 (176)
FAFSA 80.52 (372) 83.71 (1264) 84.38 (951)
Social Self-Concept
Low 39.39 (182) 26.82 (405) 16.95 (191)
Medium 41.13 (190) 43.84 (662) 34.69 (391)
High 19.48 (90) 29.34 (443) 48.36 (545)
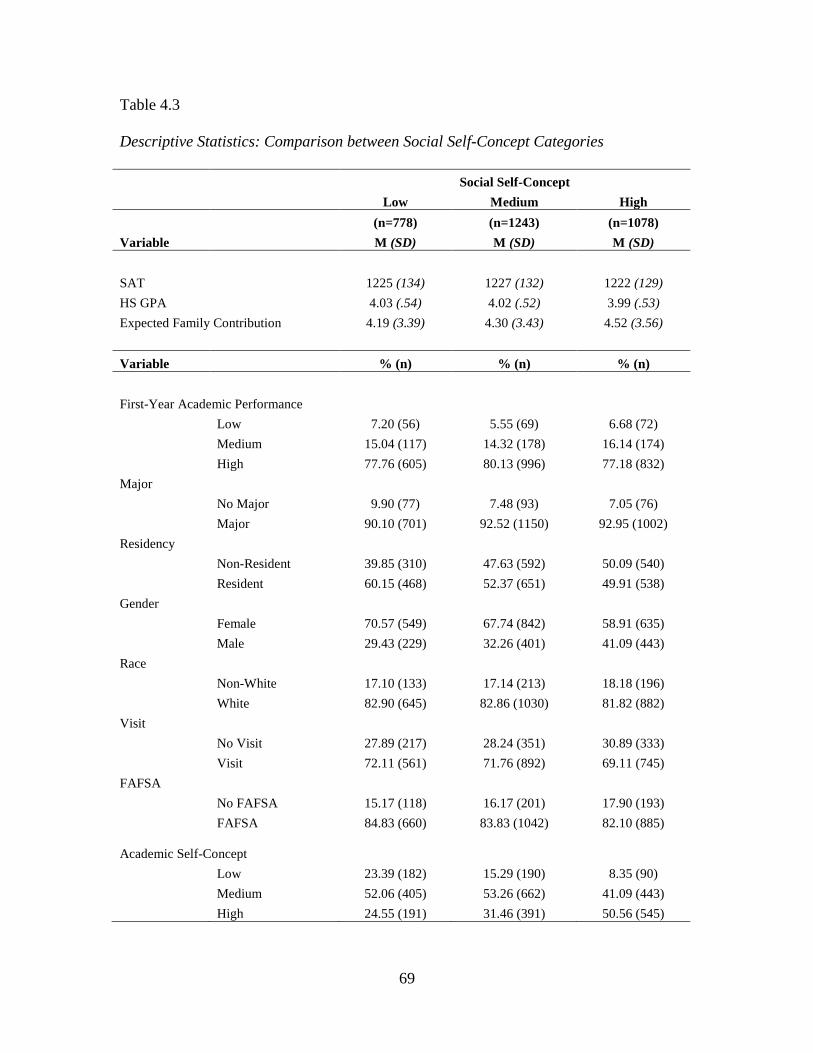
69
Table 4.3
Descriptive Statistics: Comparison between Social Self-Concept Categories
Social Self-Concept
Low Medium High
(n=778) (n=1243) (n=1078)
Variable
M (SD) M (SD) M (SD)
SAT
1225 (134) 1227 (132) 1222 (129)
HS GPA
4.03 (.54) 4.02 (.52) 3.99 (.53)
Expected Family Contribution 4.19 (3.39) 4.30 (3.43) 4.52 (3.56)
Variable
% (n) % (n) % (n)
First-Year Academic Performance
Low 7.20 (56) 5.55 (69) 6.68 (72)
Medium 15.04 (117) 14.32 (178) 16.14 (174)
High 77.76 (605) 80.13 (996) 77.18 (832)
Major
No Major 9.90 (77) 7.48 (93) 7.05 (76)
Major 90.10 (701) 92.52 (1150) 92.95 (1002)
Residency
Non-Resident 39.85 (310) 47.63 (592) 50.09 (540)
Resident 60.15 (468) 52.37 (651) 49.91 (538)
Gender
Female 70.57 (549) 67.74 (842) 58.91 (635)
Male 29.43 (229) 32.26 (401) 41.09 (443)
Race
Non-White 17.10 (133) 17.14 (213) 18.18 (196)
White 82.90 (645) 82.86 (1030) 81.82 (882)
Visit
No Visit 27.89 (217) 28.24 (351) 30.89 (333)
Visit 72.11 (561) 71.76 (892) 69.11 (745)
FAFSA
No FAFSA 15.17 (118) 16.17 (201) 17.90 (193)
FAFSA 84.83 (660) 83.83 (1042) 82.10 (885)
Academic Self-Concept
Low 23.39 (182) 15.29 (190) 8.35 (90)
Medium 52.06 (405) 53.26 (662) 41.09 (443)
High 24.55 (191) 31.46 (391) 50.56 (545)

70
Table 4.4
Frequencies of Students by FAFSA Completion
FAFSA Completion
Completed Not Completed
Observed Freq. 2587 512
Expected Freq. (prop.) 2510 (.81) 589 (.19)
Note. χ2 = 12.37*, df =1.
*p < .01
Table 4.5
Frequencies of Students by Gender
Gender
Male Female
Observed Freq. 1073 2026
Expected Freq. (prop.) 1395 (.45) 1704 (.55)
Note. χ2 = 134.80*, df =1.
*p < .01
Table 4.6
Frequencies of Students by Major Declaration
Major Declaration
Declared Not Declared
Observed Freq. 2853 246
Expected Freq. (prop.) 2913 (.94) 186 (.06)
Note. χ2 = 20.64*, df =1.
*p < .01
Table 4.7
Frequencies of Students by Race/Ethnicity
Race/Ethnicity
White Non-White
Observed Freq. 2557 542
Expected Freq. (prop.) 2417 (.78) 682 (.22)
Note. χ2 = 36.74*, df =1.
*p < .01

71
Table 4.8
Frequencies of Students by Residency Status
Residency Status
In-State Out-of-State
Observed Freq. 1657 1442
Expected Freq. (prop.) 1735(.56) 1364 (.44)
Note. χ2 = 8.06*, df =1.
*p < .01
Table 4.9
Frequencies of Students by Withdrawal Status
Withdrawal Status
Return Withdraw
Observed Freq. 2792 307
Expected Freq. (prop.) 2696 (.87) 403 (.13)
Note. χ2 = 26.22*, df =1.
*p < .01
Bivariate Analysis
While logistic regression does not require testing for assumptions of linearity,
normality or homoscedasticity, it was necessary to examine the variables for
mullticollinearity. Bivariate correlations among the independent variables were
examined. Pearson correlation coefficients ranged from .004 (SSC and FYPERF) to .73
(EFC and FAFSA). There were seven correlations greater than .30. The tolerance of each
variable was also examined. None of the variables had a tolerance value less than .40, so
all variables were retained in the model. After examining bivariate correlations and
tolerance, there was no indication that multicollinearity was a significant issue.
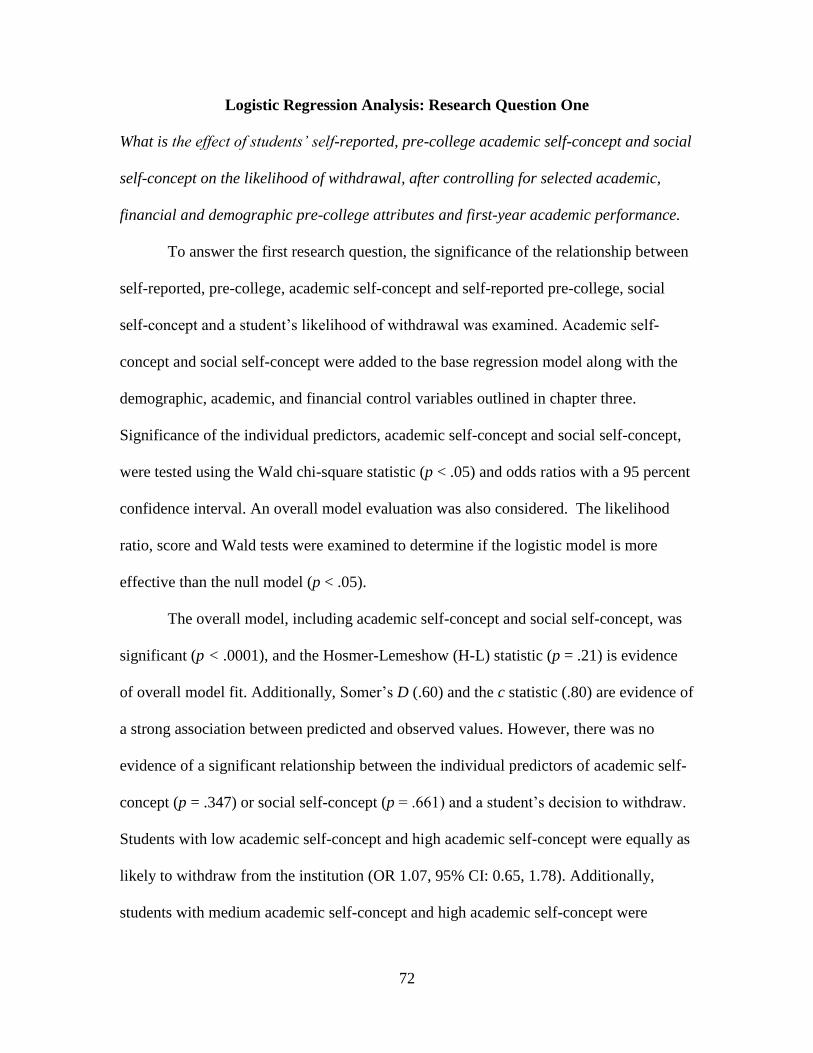
72
Logistic Regression Analysis: Research Question One
What is the effect of students’ self-reported, pre-college academic self-concept and social
self-concept on the likelihood of withdrawal, after controlling for selected academic,
financial and demographic pre-college attributes and first-year academic performance.
To answer the first research question, the significance of the relationship between
self-reported, pre-college, academic self-concept and self-reported pre-college, social
self-concept and a student’s likelihood of withdrawal was examined. Academic self-
concept and social self-concept were added to the base regression model along with the
demographic, academic, and financial control variables outlined in chapter three.
Significance of the individual predictors, academic self-concept and social self-concept,
were tested using the Wald chi-square statistic (p < .05) and odds ratios with a 95 percent
confidence interval. An overall model evaluation was also considered. The likelihood
ratio, score and Wald tests were examined to determine if the logistic model is more
effective than the null model (p < .05).
The overall model, including academic self-concept and social self-concept, was
significant (p < .0001), and the Hosmer-Lemeshow (H-L) statistic (p = .21) is evidence
of overall model fit. Additionally, Somer’s D (.60) and the c statistic (.80) are evidence of
a strong association between predicted and observed values. However, there was no
evidence of a significant relationship between the individual predictors of academic self-
concept (p = .347) or social self-concept (p = .661) and a student’s decision to withdraw.
Students with low academic self-concept and high academic self-concept were equally as
likely to withdraw from the institution (OR 1.07, 95% CI: 0.65, 1.78). Additionally,
students with medium academic self-concept and high academic self-concept were

73
equally as likely to withdraw (OR 1.26, 95% CI: 0.89, 1.81). The same result was true
when comparing social self-concept categories. Students with low social self-concept and
high social self-concept had the same likelihood of withdrawal (OR 1.19, 95 CI: 0.82,
1.74) and those with medium social self-concept and high social self-concept were
equally as likely to withdraw from the institution (OR 1.07, 95% CI: 0.77, 1.50).
Additionally, by examining the change in the -2 log likelihood, the goodness-of-
fit of the academic self-concept and social self-concept model was examined in relation
to the base model. Based on the change in the -2 log likelihood (3.37) there was no
evidence of significance. Therefore, the addition of academic self-concept and social self-
concept do not appear to significantly improve the model fit compared to the base model.
Table 4.10 shows all variables in the model and related statistics.
Logistic Regression Analysis: Research Question Two
Does the effect of students’ self-reported, pre-college academic self-concept moderate the
relationship between students’ first-year academic performance and student
withdrawal?
The second research question was addressed through a second logistic regression
model with the addition of an interaction term between first-year academic performance
and academic self-concept. The significance of the interaction and a student’s likelihood
of withdrawal was tested using the Wald chi-square statistic (p < .05) and odds ratios
with a 95 percent confidence interval. Additionally, goodness-of-fit was examined to
determine if the new model, with the interaction, fits the data better than the original
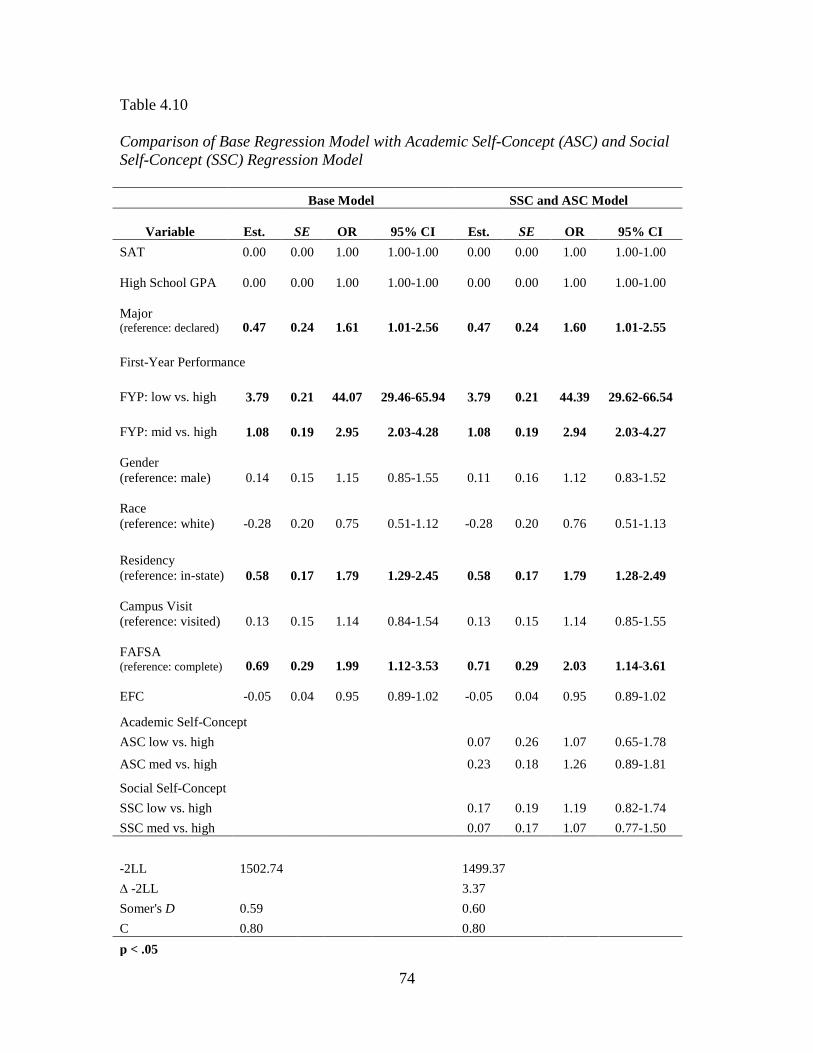
74
Table 4.10
Comparison of Base Regression Model with Academic Self-Concept (ASC) and Social
Self-Concept (SSC) Regression Model
Base Model SSC and ASC Model
Variable Est. SE OR 95% CI Est. SE OR 95% CI
SAT 0.00 0.00 1.00 1.00-1.00 0.00 0.00 1.00 1.00-1.00
High School GPA 0.00 0.00 1.00 1.00-1.00 0.00 0.00 1.00 1.00-1.00
Major (reference: declared) 0.47 0.24 1.61 1.01-2.56 0.47 0.24 1.60 1.01-2.55
First-Year Performance
FYP: low vs. high 3.79 0.21 44.07 29.46-65.94 3.79 0.21 44.39 29.62-66.54
FYP: mid vs. high 1.08 0.19 2.95 2.03-4.28 1.08 0.19 2.94 2.03-4.27
Gender
(reference: male) 0.14 0.15 1.15 0.85-1.55 0.11 0.16 1.12 0.83-1.52
Race
(reference: white) -0.28 0.20 0.75 0.51-1.12 -0.28 0.20 0.76 0.51-1.13
Residency
(reference: in-state) 0.58 0.17 1.79 1.29-2.45 0.58 0.17 1.79 1.28-2.49
Campus Visit
(reference: visited) 0.13 0.15 1.14 0.84-1.54 0.13 0.15 1.14 0.85-1.55
FAFSA (reference: complete) 0.69 0.29 1.99 1.12-3.53 0.71 0.29 2.03 1.14-3.61
EFC -0.05 0.04 0.95 0.89-1.02 -0.05 0.04 0.95 0.89-1.02
Academic Self-Concept
ASC low vs. high
0.07 0.26 1.07 0.65-1.78
ASC med vs. high
0.23 0.18 1.26 0.89-1.81
Social Self-Concept
SSC low vs. high
0.17 0.19 1.19 0.82-1.74
SSC med vs. high 0.07 0.17 1.07 0.77-1.50
-2LL 1502.74
1499.37
∆ -2LL
3.37
Somer's D 0.59
0.60
C 0.80 0.80
p < .05

75
model from research question one. While the overall model was significant (p < .0001),
the interaction between academic self-concept and first-year academic performance was
not significant. Additionally, the change in -2 log likelihood (5.08) did not appear to be
significant. Therefore, there was no evidence to support a moderating relationship
between self-reported, pre-college academic self-concept and students’ first-year
academic performance and student withdrawal. All variables in the model and relevant
statistics can be found in table 4.11.
Logistic Regression Analysis: Research Question Three
Does the effect of students’ self-reported, pre-college social self-concept moderate the
relationship between students’ first-year academic performance and student
withdrawal?
The third research question was addressed through a third logistic regression
model with the addition of an interaction term between first-year academic performance
and social self-concept. The significance of the interaction and a student’s likelihood of
withdrawal was tested using the Wald chi-square statistic (p < .05). Additionally,
goodness-of-fit was examined to determine if the new model, with the interaction, fits the
data better than the original model from research question one. While the overall model
was significant (p < .0001), the interaction between social self-concept and first-year
academic performance was not significant. Additionally, the change in -2 log likelihood
(4.89) did not appear to be significant. Therefore, there was no evidence to support a
moderating relationship between self-reported, pre-college social self-concept and

76
Table 4.11
Comparison of Base Regression Model with Academic Self-Concept (ASC) and
First-Year Academic Performance (FYPerf) Interaction Model
Base Model ASC and ASC*FYPerf Model
Variable Est. SE OR 95% CI Est. SE OR 95% CI
SAT 0.00 0.00 1.00 1.00-1.00 0.00 0.00 1.00 1.00-1.00
High School GPA 0.00 0.00 1.00 1.00-1.00 0.00 0.00 1.00 1.00-1.00
Major
(reference: declared) 0.47 0.24 1.61 1.01-2.56 0.46 0.24 1.56 1.00-2.50
First-Year Performance
FYPGA: low vs. high 3.79 0.21 44.07 29.46-65.94 4.12 0.36
FYGPA: mid vs. high 1.08 0.19 2.95 2.03-4.28 0.98 0.42
Gender
(reference: male) 0.14 0.15 1.15 0.85-1.55 0.10 0.16 1.12 0.82-1.50
Race
(reference: white) -0.28 0.20 0.75 0.51-1.12 -0.28 0.20 0.76 0.51-1.23
Residency
(reference: in-state) 0.58 0.17 1.79 1.29-2.45 0.58 0.17 1.78 1.28-2.48
Campus Visit
(reference: visited) 0.13 0.15 1.14 0.84-1.54 0.13 0.15 1.12 0.84-1.54
FAFSA
(reference: complete) 0.69 0.29 1.99 1.12-3.53 0.70 0.29 2.01 1.13-3.58
EFC -0.05 0.04 0.95 0.89-1.02 -0.05 0.04 0.95 0.89-1.02
Academic Self-Concept
ASC low vs. high
0.04 0.36
ASC medium vs. high
0.34 0.23
Social Self-Concept
SSC low vs. high
0.18 0.19 1.20 0.82-1.75
SSC medium vs. high
0.06 0.17 1.06 0.76-1.49
Academic Self-Concept * FY GPA
ASC (low) * fygpa (low)
-0.46 0.55
ASC (low) * fygpa (medium)
0.39 0.56
ASC (medium) * fygpa (low)
-0.45 0.42
ASC (medium) * fygpa (medium) -0.02 0.47
-2LL 1502.74
1496.7
2
∆ -2LL
6.02
Somer's D 0.59
0.60
C 0.80 0.80
p < .05

77
students’ first-year academic performance and student withdrawal. All variables in the
model and relevant statistics can be found in table 4.12.
Additional Findings
Conducting analysis related to the three research questions was the primary focus
of this study. However, during the course of the analysis, several other significant
findings outside of the scope of the research questions were observed. Ten control
variables were included in each regression model. Of these variables, four individual
predictors were significant using the Wald chi-square statistic (p < .05). After controlling
for each of the variables in the base model, first-year academic performance (p < .0001),
major declaration (p = .046), student residency (p <.001), and completion of the FAFSA
(p = .019) were the only significant predictors of student withdrawal.
Out-of-state students (OR 1.79, 95% CI 1.29,2.45), students who have not declared a
major at the start of their first year (OR 1.61, 95% CI 1.01-2.56), and students who have
not completed the FAFSA (OR 1.99, 95% CI 1.12-3.53) all have increased odds of
withdrawing prior to their second year, even after controlling for first-year academic
performance. The odds of withdrawal for students who have not declared a major prior to
beginning their first year are 61 percent higher than the odds for those who declared a
major. Additionally, the odds of withdrawal for non-residents are 79 percent higher than
the odds for in-state students. Lastly, the odds of withdrawal for those who did not
complete the FAFSA are 99 percent higher than the odds for those students who did
complete the FAFSA.

78
Table 4.12
Comparison of Base Regression Model with Social Self-Concept (SSC) and First-
Year Academic Performance (FYPerf) Interaction Model
Base Model ASC and ASC*FYPerf Model
Variable Est. SE OR 95% CI Est. SE OR 95% CI
SAT 0.00 0.00 1.00 1.00-1.00 0.00 0.00 1.00 1.00-1.00
High School GPA 0.00 0.00 1.00 1.00-1.00 0.00 0.00 1.00 1.00-1.00
Major
(reference: declared) 0.47 0.24 1.61 1.01-2.56 0.46 0.24 1.56 1.00-2.50
First-Year Performance
FYPGA: low vs. high 3.79 0.21 44.07 29.46-65.94 4.12 0.36
FYGPA: mid vs. high 1.08 0.19 2.95 2.03-4.28 0.98 0.42
Gender
(reference: male) 0.14 0.15 1.15 0.85-1.55 0.10 0.16 1.12 0.82-1.50
Race
(reference: white) -0.28 0.20 0.75 0.51-1.12 -0.28 0.20 0.76 0.51-1.23
Residency
(reference: in-state) 0.58 0.17 1.79 1.29-2.45 0.58 0.17 1.78 1.28-2.48
Campus Visit
(reference: visited) 0.13 0.15 1.14 0.84-1.54 0.13 0.15 1.12 0.84-1.54
FAFSA
(reference: complete) 0.69 0.29 1.99 1.12-3.53 0.70 0.29 2.01 1.13-3.58
EFC -0.05 0.04 0.95 0.89-1.02 -0.05 0.04 0.95 0.89-1.02
Academic Self-Concept
ASC low vs. high 0.07 0.26 1.07 0.65-1.78
ASC medium vs. high 0.23 0.18 1.26 0.88-1.80
Social Self-Concept
SSC low vs. high 0.29 0.25
SSC medium vs. high -0.07 0.23
Social Self-Concept * FY GPA
SSC (low) * fygpa (low) -0.17 0.45
SSC (low) * fygpa (medium) -0.39 0.45
SSC (medium) * fygpa (low) 0.56 0.44
SSC (medium) * fygpa (medium) 0.10 0.40
-2LL 1502.74
1495.7
8
∆ -2LL 6.96
Somer's D 0.59 0.60
C 0.80 0.80
p < .05

79
Summary
After running a series of logistic regression models, it was determined that pre-
college, self-reported academic self-concept and pre-college, self-reported social self-
concept were not statistically significant predictors of first-year student withdrawal.
Additionally, the interactions between academic self-concept and first-year academic
performance and between social self-concept and first-year academic performance were
not significant. However, several findings outside of the scope of the research questions
were significant. The four individual predictor variables that were statistically significant
included first-year academic performance, major declaration, student residency, and
completion of the FAFSA. In the next chapter, implications of the findings, a discussion
of the results and suggestions for future research are presented.

80
CHAPTER FIVE: DISCUSSION
The results from the study revealed that there is not a statistically significant relationship
between academic self-concept and student withdrawal or between social self-concept
and student withdrawal. Additionally, neither self-concept variable moderates the
relationship between students’ first-year academic performance and student withdrawal.
However, there were several significant findings outside the scope of the research
questions. While the addition of self-concept variables did not strengthen the model, the
base model with the ten control variables was statistically significant in predicting student
withdrawal. Of the ten control variables used in this study, four were statistically
significant predictors of student withdrawal, after controlling for the other variables in the
model. As expected, first-year academic performance was a significant predictor of
student withdrawal. Additionally, major declaration, student residency, and completion of
the FAFSA were the only other significant predictors of student withdrawal. After
controlling for the other variables in the model, neither high school GPA nor standardized
test score showed evidence of being a statistically significant predictor of student
withdrawal. Since neither self-concept variable moderated the relationship between
students’ first-year academic performance and withdrawal, there is no evidence that self-
concept impacts students who withdraw voluntarily differently than students who
withdraw due to substandard academic performance.

81
Key Findings
Research Question One
What is the effect of students’ self-reported, pre-college academic self-concept and social
self-concept on the likelihood of withdrawal, after controlling for selected academic,
financial and demographic pre-college attributes and first-year academic performance.
The absence of a statistically significant relationship between either academic
self-concept or social self-concept and student withdrawal suggests that self-concept does
not directly influence student persistence at the University of South Carolina. Therefore,
it may not be a relevant pre-entry characteristic in Tinto’s Student Integration Model.
These results are surprising, particularly regarding academic self-concept, given previous
research that suggests a predictive relationship between self-concept and student
persistence (Robbins et al., 2004; Torres & Solberg, 2001; Vuong, Brown-Welty &
Tracz, 2010). As noted in chapter two, a meta-analysis conducted by Robbins et al
(2004), found that academic self-confidence was a strong predictor of both retention and
academic performance. However, previous research also found that the strength of the
association between students’ self-concept and persistence is weaker than between self-
concept and college performance (Lotkowski, Robbins & Noeth, 2004; Vuong, Brown-
Welty, & Tracz, 2010).
While academic self-concept has been shown to have a predictive relationship
with academic performance and persistence, social self-concept has not previously been
directly linked to student persistence. In fact, the results of this study support Vuong,
Brown-Welty, & Tracz,’s (2010) finding that social self-efficacy did not predict any

82
measure of academic success. In this study, social self-concept did not predict whether or
not a student may withdraw from the institution. Social self-concept was selected as a
variable for this study because previous research found a relationship between social
support and social involvement and academic performance and persistence (Robbins et
al., 2004). Additionally, overall self-efficacy has been found to impact persistence (Lent,
1991). The researcher suspected students’ social self-concept may impact social
involvement and social support and therefore, influence persistence. Also, since Tinto’s
Student Integration Model focuses on both the academic and social domains of an
institution, it was presumed that academic and social self-concept may impact persistence
differently.
Since this study contradicted past research, particularly in the area of academic
self-concept, the researcher ran an additional model without any control variables to
determine if there was any relationship between academic self-concept and student
withdrawal or social self-concept and student withdrawal. The results of that model
revealed a statistically significant relationship between academic self-concept and student
withdrawal. This indicates there is some relationship between academic self-concept and
persistence, although not as strong of a relationship as originally suspected. Suggestions
for future research to further explore this relationship are discussed later in this chapter.
Research Question Two
Does the effect of students’ self-reported, pre-college academic self-concept moderate the
relationship between students’ first-year academic performance and student
withdrawal?

83
The second logistic regression model revealed that there is not a significant
interaction between students’ self-reported, pre-college academic self-concept and first-
year academic performance when predicting student withdrawal. Given that previous
self-concept research suggests a predictive relationship between academic self-concept
and academic performance (Brady-Amoon & Fuertes, 2011; Chemers, Hu, Garcia, 2001;
Choi, 2005; Elias & Loomis, 2000), it was presumed that academic self-concept would
moderate the relationship between first-year academic performance and student
withdrawal. The researcher suspected that those students with higher academic self-
concept would also have a significantly higher level of first-year academic performance,
and therefore, be more likely to persist. Additionally, it was hypothesized that students
with low or medium first-year academic performance may be more likely to persist if
they had high academic self-concept prior to enrolling in college.
Descriptive statistics revealed that students who had low academic self-concept
were more likely to have low first-year academic performance and students with high
academic self-concept were more likely to have high first-year academic performance.
Descriptive statistics also showed that students who had medium first-year academic
performance were more likely to return to the institution if they had high academic self-
concept. The descriptive statistics indicate that there may be a relationship between
academic self-concept and academic performance; however, there was not a statistically
significant interaction between academic self-concept and first-year academic
performance, when examining the relationship with student persistence.

84
Research Question Three
Does the effect of students’ self-reported, pre-college social self-concept moderate the
relationship between students’ first-year academic performance and student
withdrawal?
The third logistic regression model revealed that there is not a significant
interaction between students’ self-reported, pre-college social self-concept and first-year
academic performance when predicting student withdrawal. In this study, 10 percent
(307) of students did not return to the institution for their second year. More than half
withdrew from the institution voluntarily as they were in good academic standing. Thirty-
eight percent (116) had between a 3.0 and 4.0 first year grade point average, so they were
in the high first-year academic performance category. Another 19 percent had between a
2.0 and 2.9 first year grade point average, so they were in the medium academic
performance category. This research question was intended to determine if social self-
concept had any influence in predicting which students in good academic standing would
leave the institution. Since predictive models rarely differentiate between students who
withdraw voluntarily, the researcher hoped to be able to identify a factor that contributes
to a student’s decision to withdraw even when s/he is in good academic standing.
However, the findings revealed that social self-concept does not impact students who are
in good academic standing any differently than it impacts those in poor academic
standing, in terms of their decision to withdraw.
While previous research has not directly linked social self-concept to student
withdrawal, it was presumed that students with higher levels of social self-concept would
be more integrated into the institution, and therefore, more likely to persist. Previous

85
research shows that students who are more involved socially are more likely to return to
that institution (Robbins et al., 2004). In addition to the lack of a significant interaction
between social self-concept and first-year academic performance when predicting student
withdrawal, the descriptive statistics revealed little variation in the percentage of students
who were in each social self-concept and first-year performance category. The one slight
difference worth noting is that students with medium self-concept were the most likely to
have high academic performance and the least likely to have low academic performance.
This suggests that high levels of social self-concept may negatively impact first-year
academic performance. While the majority of research suggests that social involvement is
a positive indicator of academic performance and persistence, there are some studies that
have found too much social involvement can negatively impact academic performance
and persistence (Baker, 2008; Huang & Chang, 2004). Suggestions for exploring this in
the future are discussed later in this chapter.
Additional Findings
Several significant findings outside the scope of the research questions offer
noteworthy insights. The results of the chi-square test for goodness-of-fit as it relates to
the student withdrawal variable will be explored as an additional finding. Additionally, of
the ten control variables included in the model, four were significant predictors of student
withdrawal. Each of these control variables along with previous research as it relates to
their impact on persistence will be discussed. While the researcher suspects that these
variables may impact students who withdraw voluntarily differently from those who
withdraw due to substandard academic performance, this model only examined the

86
relationship between the variables and persistence and did not explore moderating
relationships. This topic will be addressed in suggestions for future research.
Major Declaration
Students who declared a major prior to enrollment returned to the institution at a
significantly higher rate than those students who enrolled as undeclared. This finding is
notable given that previous research on the impact of major declaration on persistence is
divided. Some studies support this finding and have shown that students who are
undecided about what academic major they want to pursue are less likely to persist and
graduate. These studies found that undeclared students are not as committed to a specific
major or educational goal and are less likely to be retained (Galotti, 1999; Levitz & Noel,
1989; Legutko, 2007). If this is in fact true, this finding supports Tinto’s inclusion of the
importance of students’ goals and commitments in their decision to remain enrolled at a
particular institution.
However, some research also supports the view that it is better for students to
enter college undeclared since traditional aged students may not be at the point
developmentally where they can make an informed decision about their major (Gordon,
2007; Perry, 1999). In fact, one study found that students who start college undeclared
are 15 percent more likely to graduate than those students who declare a major prior to
enrollment (Micceri, 2005). Additionally, on average 75 percent of students change their
original major at least once (Gordon, 2007; Kramer, Higley & Olsen, 1994).
Tinto (1993) noted that entering college undeclared may be positive for students,
if they have the support and guidance to work through the process of becoming
committed to an academic major. This may be one reason why studies on the impact of

87
major declaration on persistence present mixed results, and why it is important to study
predictive relationships at the institutional level. The impact of a student’s decision to
enroll as undeclared may be institution-specific depending on the resources and support
provided to students who have not decided on a major. If an institution has adequate
support and counseling for undeclared students, it may positively impact their
commitment to their degree and the institution. Beggs, Bantham & Taylor (2008) found
that students who have a period of time to explore careers and majors, may make a more
informed decision when they do decide. On the other hand, undeclared students who are
not provided with the opportunities for such exploration may be at more risk to withdraw.
Residency Status
Another control variable that significantly predicted withdrawal was student
residency status. Students who were from a state other than that of the institution were
more likely to withdraw prior to their second year. While this variable has not been as
widely researched as major selection, previous researchers have explored residency status
as a predictor in retention and their findings support the results from this study
(Murtaugh, Burns & Schuster, 1999; Wohlgmuth, Whalen, Sullival, Nading, Shelley &
Wang, 1999; Yu, DiGangi, Jannasch-Pennell, & Kaprolet, 2010). Research suggests that
students who are non-residents may have a more difficult time becoming integrated into
the social and cultural environment of an institution and therefore, at risk for withdrawal
(Murtaugh, Burns & Schuster). These students may also have more of a financial burden
than in-state students as they are often paying higher tuition costs and must spend more
money on traveling to and from campus (Wohlgmuth et al).

88
While this study only categorized students as residents and non-residents, other
studies have researched students’ distance from campus. Interestingly, Yu et al (2010)
found that non-resident students were more at risk for withdrawal than resident students;
however, of the non-resident students, those who were furthest from campus were least
likely to withdraw from the institution. This may suggest that students who are traveling
further for college have made more of a commitment to the institution. These students are
also less likely to go home frequently which may help as they become integrated socially
and academically.
FAFSA Completion
The results from this study found that students who did not complete a FAFSA
were significantly more likely to withdraw than students who did complete a FAFSA.
This finding is notable because it has not received as much attention in the literature as
the use of income or expected family contribution as a predictor of withdrawal. In this
study, expected family contribution was not a significant predictor of withdrawal. There
has been some research into the characteristics of the students and their reasoning behind
not completing the FAFSA (Kantrowitz, 2011; King, 2006). The characteristics of
students who do not complete the FAFSA vary widely. King (2006) found that more than
60 percent of the students who do not complete the FAFSA are from the two highest
income quintiles. This leaves the remaining 40 percent of students from low to moderate
income levels. Many of the students who do not complete the FAFSA, particularly those
at the moderate and lower income levels would qualify for financial aid; however, many
of them assume they are not eligible for aid or they are not sure how to apply. Kantrowitz
(2011) noted that regardless of income level, students “almost all (95.3%) gave at least

89
one of five reasons for not applying: thought ineligible (60.7%), no financial need
(50.6%), did not want to take on the debt (40.2%), no information on how to apply
(22.9%) and forms were too much work (18.9%)” (p.1).
In this study, approximately 17 percent of the students did not complete the
FAFSA. Because their income data from the FAFSA is not available, it is impossible to
know whether or not these students fall into high, moderate or low income bands.
However, research has revealed that students who are from higher income backgrounds
have more resources and access to school counselors and financial aid staff who are able
to help them complete the FAFSA (Perna, 2008; Tierney & Venegas, 2006). Therefore,
the researcher suspects that many of the students who did not complete the FAFSA are
from moderate to low income backgrounds. A previous study supports this suspicion as
the researchers found that filing a FAFSA is associated with higher levels of persistence
among low income students (Novak & McKinnney, 2011). Regardless of their income
band, it is presumed that finances played in a role in these students’ decision to withdraw
from the institution.
First-year academic performance
As expected, the most significant predictor of student withdrawal was first-year
academic performance. This result was not surprising as students who fall below a 2.0 are
placed on academic probation or suspension and may be forced to withdraw from the
institution. Previous research has consistently found first-year academic performance to
be a significant predictor of persistence. However, given that more than half of the
students from this study who withdrew were in good academic standing, the primary
90
purpose of this study was to identify variables other than first-year performance which
may impact student persistence.
High school grade point average and standardized test scores
In this study, neither high school GPA nor standardized test scores were
significant predictors of student withdrawal. This finding contradicts what previous
literature has revealed about the significance of high school GPA and standardized tests
in persistence (Astin, Korn & Green, 1987; Levitz, Noel & Richter, 1999). The researcher
suspects these variables were not significant because of the selectivity required for first-
year students to be admitted. All students must meet selective admission requirements
and therefore, a minimum high school GPA and standardized test score to be accepted.
For this reason, all students are relatively high academic achievers which may eliminate
the impact these variables have on predicting retention. It is suspected that high school
GPA and standardized test scores would be significant variables in predicting first-year
academic performance. This will also be addressed as a limitation of the study.
CIRP Responders vs. CIRP Non-Responders
In order to compare the sample used in this study (CIRP responders) with the
general university population, a chi-square test for goodness-of-fit was performed using
the variable withdrawal status. The results revealed that students who persisted at the
institution were disproportionately over-represented in the sample and students who
withdrew were under-represented in the sample. While this is certainly a limitation of
self-selection, it also reveals that there is a relationship between those who chose to
complete the CIRP and student persistence. The students who take the time to complete

91
the CIRP may be more motivated and committed to the institution than students who
chose not to complete the assessment.
Implications for Practice
In this study, three binary logistic regression models were run to determine
whether or not academic self-concept or social self-concept were statistically significant
predictors of student withdrawal. While the results from this study revealed that neither
self-concept variable was a statistically significant predictor of student withdrawal at the
institution in this study, there is still valuable practical information and policy
implications that can be gained from this study.
As noted in chapter one, recent state and federal discussions surrounding higher
education have brought retention and graduation rates to the forefront of policy
discussions. Federal and state legislatures have discussed the need for accountability-
based funding with primary measures of success being retention and graduation rates.
Additionally, college and university administrators have long understood the societal,
institutional, and individual benefits of earning a college degree and have strived to
improve retention and graduation rates at their own institutions. In fact, this study was
conducted at the University of South Carolina during a time when the University
administration had a set a goal of increasing the first-to-second year retention rate from
86.8 percent in 2010 to 90 percent by 2015. Gains in retention rates are difficult to
achieve which is why data-driven models and strategies must be used to identify reasons
why students are withdrawing, even when they are in good academic standing.

92
In 2012, the College Board’s Advocacy and Policy Center recommended that institutions
implement “data-based strategies to identify retention and dropout challenges” (Hughes,
2012, p. 3). While the model developed in this study uses data from the University of
South Carolina, this study also provides colleges and university administrators with a
statistical model that can be used to help identify retention challenges at their individual
institutions.
It is recommended that practitioners run a similar model, with the exception of
first-year academic performance, at the beginning of each semester. This allows them to
identify students who have a high probability of withdrawing in hopes of developing
early intervention strategies. Logistic regression models are not able to perfectly predict
which students are going to withdraw from an institution. However, they are useful in
that they are able to predict the probability of an event occurring. In this study, the model
was able to significantly predict the probability of a student withdrawing from the
institution. Neither self-concept variable strengthened the base model, which only
included ten control variables; however, the base model and several of the control
variables were statistically significant suggesting that they should remain in future
models.
With limited resources, it is difficult to reach out to every student, particularly at
large, public institutions. At the University of South Carolina, practitioners can identify
first-year students who are undeclared, those who are from out-of-state, and those who
have not completed the FAFSA and design early intervention programs designed
specifically for these students’ needs. Early intervention is often focused on students who
are at-risk of doing poorly academically. This allows staff to focus on other non-

93
academic areas that may put students at-risk of leaving the institution, even if they are
performing well academically.
Practitioners can mirror the statistical techniques used in this study with
institutional variables that they feel may impact retention at their institution. It is
recommended that practitioners focus on institutional data since “national data are often
difficult to relate to each individual campus and its unique needs” (Barefoot, 2004). As
stated previously, some variables may show significance on one campus, but not another
depending on the individual resources and challenges at that school. For this reason, it is
recommended that practitioners not eliminate the self-concept variables used in this
study, if they have access to their own CIRP data. In fact, the researcher recommends that
practitioners use additional CIRP constructs in developing their models to see if other
constructs produce statistically significant results.
Although practitioners should continue to use CIRP constructs in the development
of predictive models, it is necessary for institutions to find ways to increase the response
rate. At the University of South Carolina, only 25 percent of the freshman class
completes the CIRP which led to sampling and self-selection bias. Much of the low
response rate is due to the fact that it is an online instrument students complete outside of
the classroom in the summer prior to enrollment. The researcher recommends that the
CIRP be administered as part of a freshman course in the first few weeks of the semester.
This will allow researchers and practitioners to utilize a more representative sample.
Even though academic self-concept was not statistically significant in the
regression model with the ten control variables, when run with just academic self-concept
and social self-concept it did show statistical significance. This may have some practical

94
implications as institutional administrators implement programs and initiatives to help
students succeed academically. Academic self-concept can be measured using the CIRP
constructs that were used in this study, or by using one of the other academic self-
efficacy inventories available. Identifying students with low academic self-concept early
in their college career may allow practitioners to intervene with resources and tools to
help those students before they are in danger of substandard first-year academic
performance or withdrawal.
Limitations
This study was limited to the University of South Carolina, a selective, public
four-year university in the southeast. The first-year students in this study are considered
traditional college students who start their freshman year immediately after they graduate
from high school. While each student has different pre-college academic preparation, all
students must meet selective admissions standards to be admitted to the institution, which
contributed to a restriction of the mean for both standardized test scores and high school
GPA. Therefore, this predictive model can only determine the predictive value of selected
pre-college attributes for students at this institution.
A major limitation of this study is that it only examines data from students who
completed the CIRP Freshman survey. The chi-square test of goodness-of-fit revealed
that the sample had a disproportionately higher number of students who completed the
FAFSA, female students, students with non-declared majors, students who self-identify
as white, and out-of-state students than the general university population. Additionally,
those students who completed the CIRP returned at a significantly higher rate than the

95
general student population. This self-selection and sampling bias is a methodological
limitation that must be considered when analyzing the results. In addition to self-
selection, students’ academic self-concept and social self-concept scores are a result of
the answers students self-report on the CIRP Freshman Survey. Self-reported scores are
another methodological limitation due to possibilities of inadvertent or purposeful
reporting errors.
Additionally, this study focuses on student departure from an institutional
perspective, which means all students who depart are viewed as a loss to the institution,
even if the student goes elsewhere to complete a degree. This study is limited to first-to-
second year retention, with the assumption that the majority of student attrition occurs
between the first and second years which is the case nationally (Bradburn, 2002).
Another important limitation of this study is that fact that the data is from only
one institution. This limits the generalizability of the findings to a single institution. The
model will need to be tested and analyzed in order to ascertain applicability at other
institutions.
Recommendations for Future Research
College student retention is one of the most widely researched topics in higher
education. Even with all of the research, there are still numerous unanswered questions.
This study explored the relationship between academic and social self-concept and
college student withdrawal, but there is much more that can be researched on this topic.
Based on the results of this study, the researcher of this study has identified several areas
of future research that should be explored.

96
Qualitative exploration
Future researchers should continue to explore psychosocial factors that may
impact persistence, particularly among students in good academic standing. Early
researchers cited the need to focus on voluntary withdrawal (Pascarella & Terenzini,
1983; Tinto, 1993), but recent research has focused much more on students who are in
danger of substandard academic performance. Understanding the reasons why students
withdraw, when they are successful academically, can help practitioners intervene earlier.
Predictive modeling is a good starting point to identify variables that may impact
students’ withdrawal decisions, but these are complex decisions and many students have
complex reasons for departure. For this reason, it is recommended that future researchers
explore voluntary student withdrawal using qualitative methodology. It is suggested that
future researchers identify students who have withdrawn from their institution voluntarily
and conduct interviews focused on their departure decisions. This would allow
researchers to hear individual student stories and identify reasons for withdrawal that may
not be captured through quantitative analysis.
Self-concept, self-confidence, and self-efficacy
This study did not find academic self-concept or social self-concept to be
significant predictors of student withdrawal, after controlling for ten other variables.
However, researchers should continue to explore student self-concept, self-confidence,
and self-efficacy as they relate to student persistence. Previous research and a secondary
model run during the course of this study, do suggest a relationship between academic
self-concept, academic performance, and student persistence. That relationship should be
explored further as it may help practitioners identify students who are at-risk
97
academically or of withdrawal. In addition to exploring academic self-concept, it is
important to continue to research social self-concept to determine if high social self-
concept may impact students negatively. Additionally, due to timing constraints, the
researcher was not able to use the College Self-Efficacy Inventory for this study, but
recommends future researchers further explore that instrument as a way to measure
students’ self-efficacy in the college setting.
Voluntary Student Withdrawal
One of the primary focuses of this study was students who withdraw when they
are still in good academic standing with the institution. Neither self-concept variable had
a moderating effect on the relationship between first-year academic performance and
withdrawal. It is necessary to continue to examine other variables that may impact
students who are at risk for withdrawal and in good academic standing. Each of the
significant variables in this study should be explored along with additional psychosocial
factors. Understanding the reasons why students leave an institution when they are doing
well academically is one of the missing pieces of retention research that needs to continue
to be examined.
Additional psychosocial variables
In addition to self-concept, self-confidence, and self-efficacy, it is recommended
that future researchers continue to identify and explore psychosocial variables and their
relationship to voluntary student withdrawal. Variables that have been studied, but need
more in-depth analysis include academic goals, motivation, perceived social support, and
institutional commitment (Friedman & Mandel, 2011; Kahn & Nauta, 2001; Klomegah,
2007; Robbins et al., 2004). As mentioned previously, it is also recommended that

98
researchers explore additional CIRP constructs to determine if any of those are significant
predictors of student withdrawal.
Examining variable combinations
This study specifically looked at single variables and their relationship with
student withdrawal. It is recommended that future researchers explore combinations of
variables to determine the impact of having more than one risk factor and a student’s
likelihood of withdrawal. It is hypothesized that students who have multiple variables
that put them at risk for withdrawal would be increasingly at risk; however, this
hypothesis must be researched further.
Institutional studies
As noted previously, there is value in having institutions conduct research similar
to this study with variables that are available to them and most relevant to their
institutional culture. It is recommended that variables that have repeatedly shown
significance in predicting student withdrawal, such as the control variables included in
this study, be included in institutional models. Administrators should also explore other
variables that may impact persistence. By conducting institutional level research,
practitioners can determine the retention challenges that are specific to their students.
One of the challenges with institutional models is that oftentimes they are not published
or shared with the public; therefore, the knowledge gained from new findings is not
always known. It is important for researchers to share their findings, even at the
institutional level, as it will help build upon the existing literature base.

99
National studies
While institutional studies have value and can help practitioners determine what
may impact persistence at their individual institutions, it is also important for researchers
to conduct large-scale national studies. Oftentimes, gathering large institutional datasets
can be challenging due to proprietary information and different reporting methods.
Therefore, there are not many national studies using predictive modelling techniques to
determine additional variables that may impact persistence. In an effort to aid in large-
scale national research studies, it would be beneficial for standard reporting agencies
such as IPEDS and the Department of Education to expand the variables they collect.
Currently, the data centers around academic indicators such as standardized test scores
and high school grade point average, along with financial indicators. However, having
national data on major declaration, student residency status, and psychosocial constructs
would allow researchers to expand their scope.
Summary and Conclusion
The purpose of this study was to explore students’ self-reported, pre-college
academic self-concept and students’ self-reported, pre-college social self-concept and the
likelihood of student withdrawal. Three binary logistic regression models were run to
determine whether academic self-concept and social self-concept were significant
predictors of student withdrawal and/or whether or not the self-concept variables
moderated the relationship between students’ first-year academic performance and
student withdrawal. Additional academic, financial, and demographic pre-college
attributes were selected as control variables and included in each logistic regression

100
model. The variables selected for this study reflect each of the three categories (family
background, individual attributes, and pre-college schooling) of pre-entry characteristics
in Tinto’s Student Integration Model, the theoretical framework for this study. As
researchers have cited the need to include a psychological component to Tinto’s model
(Berger & Lyon, 2005; Braxton, 2000; Pascarella & Terenzini, 1991; Robbins & Noeth,
2004), this research sought to advance the literature by determining whether academic
self-concept and social self-concept were variables to include as additional pre-college
characteristics in the Student Integration Model. While neither self-concept was
significant, the overall model did significantly predict student withdrawal and four
control variables were statistically significant.

101
REFERENCES
Allison, P.D. (2012). Logistic regression using SAS: Theory and application, second
edition.
Astin, A.W. (1985). Achieving academic excellence. San Francisco: Jossey-Bass.
Astin, A. W. (1993). What matters in college: Four critical years revisited. San
Francisco: Jossey-Bass.
Astin, A. W., Green, K. C., & Korn, W. S. (1987). The American freshman: Twenty year
trends, 1966-1985. Los Angeles: University of California, Los Angeles. Higher
Education Research Program.
Astin, A.W. & Oseguera, L. (2003). Degree attainment among Latino undergraduates:
Rethinking time-to-degree. Berkeley: California Policy Research Institute, UC
Policy Institute.
Astin, A.W. & Oseguera, L. (2005). Pre-college and institutional influences on degree
attainment. In A. Seidman (Ed.), College Student Retention (pp. 245-276).
Westport, CT: Praeger Publishers.
Aud, S., Hussar, W., Johnson, F., Kena, G., Roth, E., Manning, E., et al. (2012). The
condition of education 2012 (NCES 2012-045). U.S. Department of Education,
National Center for Education Statistics. Washington, DC. Retrieved from
http://nces.ed.gov/pubsearch

102
Barefoot, B. O. (2004). Higher education's revolving door: Confronting the problem of
student drop out in US colleges and universities. Open Learning: The Journal of
Open, Distance and e-Learning, 19(1), 9-18.
Barry, C. L., & Finney, S. J. (2009). Can we feel confident in how we measure college
confidence? A psychometric investigation of the college self-efficacy inventory.
Measurement and Evaluation in Counseling and Development, 42(3), 197-222.
Baum, S., Ma, J., & Payea, K. (2010). Education pays 2010. New York: The College
Board. Retrieved from http://trends.collegeboard.org/education-pay
Bautsch, B., & Williams, R. (2010). College completion: The college completion agenda
state policy guide. New York: The College Board. Retrieved from
http://advocacy.collegeboard.org/sites/default/files/PolicyGuide_062810sm.pdf
Bayer, A. (1968). The college dropout: Factors affecting senior college completion.
Sociology of Education, 41, 305 -316.
Bean, J. (1980). Dropouts and turnover: The synthesis and test of a causal model of
student attrition. Research in Higher Education, 12(2), 155-187.
Bean, J. P., & Eaton, S. B. (2000). A psychological model of college student retention. In
J. Braxton (Ed.), Reworking the Student Departure Puzzle (pp. 48-61). Nashville,
TN: Vanderbilt University Press.
Beggs, J. M., Bantham, J. H., & Taylor, S. (2008). Distinguishing the factors influencing
college students' choice of major. College Student Journal, 42(2), 381.
Berger, J.B. (2000). Optimizing capital, social reproduction, and undergraduate
persistence: A sociological perspective. In J. Braxton (Ed.), Reworking the

103
Student Departure Puzzle (pp. 48-61). Nashville, TN: Vanderbilt University
Press.
Berger, J. B., & Lyon, S. C. (2005). Past to present: A historical look at retention. In A.
Seidman (Ed.), College Student Retention (pp. 1-29). Westport, CT: Praeger
Publishers.
Berger, J.B. & Braxton, J.M. (1998). Revising Tinto’s interactionalist theory of student
departure through theory elaboration: Examining the role of organizational
attributes in the persistence process. Research in Higher Education, 39, 103-119.
Bong, M. & Clark, R.E. (1999). Comparison between self-concept and self-efficacy in
academic motivation research. Educational Psychologist, 34(3), 139-153.
Bong, M. & Skaalvik, E.M. (2003). Academic self-concept and self-efficacy: How
different are they really? Educational Psychology Review, 15(1), 1-40.
Bong, M. (2004). Academic motivation in self-efficacy, task value, achievement goal
orientations, and attributional beliefs. The Journal of Educational Research,
97(6), 287-297.
Bound, J., Lovenheim, M.F. & Turner, S. (2010). Why have college completion rates
declined? An analysis of changing student preparation and collegiate resources.
American Economic Journal: Applied Economics, 2(3), 129-57.
Bradburn, E. M. (2002). Short-term enrollment in postsecondary education: Student
background and institutional differences in reasons for early departure, 1996-
1998. U.S. Department of Education: Washington, DC.
Brady-Amoon, P. & Fuertes, J. (2011). Self-efficacy, self-rated abilities, adjustment, and
academic performance. Journal of Counseling and Development, 89, 431-438.

104
Braten, I., Samuelstuen, M.S. & Stromso, H.I. (2004). Do students’ self-efficacy beliefs
moderate the effects of performance goals on self-regulatory strategy use?
Educational Psychology, 24(2), 231-247. DOI 10.1080/0144341032000160164
Braxton, J. M. (2000). Reworking the student departure puzzle. Nashville, TN:
Vanderbilt University Press.
Braxton, J.M. & Hirschy, A.S. (2005). Modifying Tinto’s theory of college student
departure using constructs derived from inductive revision. In M. Yorke & B.
Longdon (Eds.), Retaining students in higher education. United Kingdom: Open
University Press.
Braxton, J.M., Hirschy, A.S., & McClendon, S.A. (2004). Understanding and reducing
college student departure. No 3. ASHE-ERIC Higher Education Research Report
Series. San Francisco: Jossey Bass.
Braxton, J.M. & Mundy, M.E. (2001). Powerful institutional levers to reduce college
student departure. Journal of College Student Retention, 3, 57 – 72.
Braxton, J.M. & Lien, L.A. (2000). The viability of academic integration as a central
construct in Tinto’s interactionalist theory of college student departure. In J.
Braxton (Ed.), Reworking the Student Departure Puzzle (p. 11-27). Nashville,
TN: Vanderbilt University Press.
Braxton, J.M., Sullivan, A.S., & Johnson, R.M. (1997). Appraising Tinto’s theory of
college student departure. In J.C. Smart (ed.), Higher education: A handbook of
theory and research, 12, 107-164.
Braxton, J.M., Vesper, N., & Hossler, D. (1995). Expectations for college and student
persistence. Research in Higher Education, 36, 595 – 612.

105
Cabrera, A.F., Nora, A. & Castaneda, M.B. (1993). College persistence: Structural
equations modeling test of an integrated model of student retention. Journal of
Higher Education, 64 (2), 123-139.
Cabrera, A.F., Stampen, J.O., & Hansen, W.L. (1990). Exploring the effects of ability to
pay on persistence in college. The Review of Higher Education. 13(3), 303 – 336.
Carnevale, A., & Rose, S. (2011). The undereducated American. Washington, DC:
Georgetown University Center on Education and the Workforce. Retrieved from
http://education.agu.org/files/2012/04/undereducated_american.pdf
Cary, NC: SAS Institute, Inc.
Casselman, B. (2012, Nov 22). The cost of dropping out. The Wall Street Journal.
Retrieved from
http://online.wsj.com/news/articles/SB10001424127887324595904578117400943
472068
Chemers, M.M., Hu, L., & Garcia, B.F. (2001). Academic self-efficacy and first-year
college student performance and adjustment. Journal of Educational Psychology,
93(1), 55-64.
Choi, N. (2005). Self-efficacy and self-concept as predictors of college students’
academic performance. Psychology in the Schools, 42(2), 197-205.
DeWitz, S.J., Woolsey, M.L. & Walsh, W.B. (2009). College student retention: An
exploration of the relationship between self-efficacy beliefs and purpose in life
among college students. Journal of College Student Development, 50 (1), 19 – 34.

106
Elias, S.M. & Loomis,R.J. (2000). Using an academic self-efficacy scale to address
university major persistence. Journal of College Student Development, 41(4),
450-454.
Engle, J. & Tinto, V. The Pell Institute. (2008). Moving beyond access: College success
for low-income, first generation student. Retrieved from:
http://files.eric.ed.gov/fulltext/ED504448.pdf
Friedman, B.A. & Mandel, R.G. (2011). Motivation predictors of college student
academic performance and retention. Journal of College Student Retention, 13(1),
1-15.
Galotti, K. M. (1999). Making a" major" real-life decision: College students choosing an
academic major. Journal of Educational Psychology, 91(2), 379.
Gordon, V. N. (2007). The undecided college student: An academic and career advising
challenge. Charles C Thomas Publisher.
Helibrun, A.B. (1965). Personality factors in college dropout. Journal of Applied
Psychology, 49 (1), 1-7.
Hosmer, D.W., Lemeshow, S., & Sturdivant, R.X. (2013). Applied logistic regression (3rd
ed.). New Jersey: Wiley and Sons.
Hsieh, P., Sullivan, J.R. & Guerra, N.S. (2007). A closer look at college students: Self-
efficacy and goal orientation. Journal of Advanced Academics, 18(3), 454-476.
Hughes, K. (2012). The college completion agenda: 2012 progress report. The College
Board: New York, NY. Retrieved from:
http://media.collegeboard.com/digitalServices/pdf/advocacy/policycenter/college-
completion-agenda-2012-progress-report.pdf

107
Hunt Jr., J., & Tierney, T. National Center for Public Policy and Higher Education,
(2006). American higher education: How does it measure up for the 21st
century? (06-2). Retrieved from
http://www.highereducation.org/reports/hunt_tierney/Hunt_Tierney.pdf
Jensen, E.L. (1981). Student financial aid and persistence in college. The Journal of
Higher Education, 52(3), 280-294.
Johnson, N. American Institute for Research, (2012). The institutional costs of student
attrition. Retrieved from http://www.deltacostproject.org/resources/pdf/Delta-
Cost-Attrition-Research-Paper.pdf
Kalsbeek, D. H. (2013). Reframing retention strategy for institutional improvement. San
Francisco: Jossey-Bass
Kahn, J.H. & Nauta, M.M. (2001). Social-cognitive predictors of first-year college
persistence: The importance of proximal assessment. Research in Higher
Education, 42(6), 633-652.
Kamens, D.H. (1971). The college charter and college size: Effects on occupational
choice and college attrition. Sociology of Education, 44 (3), 270-296.
Kantrowitz, M. (2011). Reasons why students do not file the FAFSA. Student Aid Policy
Analysis, 1-7.
Karabel, J. (1972). Community colleges and social stratification. Harvard Educational
Review, 42, 521-562.
King, J. E. (2006). Missed opportunities revisited: New information on students who do
not apply for financial aid. ACE Issue Brief. Washington DC: American Council
on Education.

108
Kinzie, J., Palmer, M., Hayek, J., Hossler, D., Jacob, S.A., & Cummings, H. (2004). Fifty
years of college choice: Social, political and institutional influences on the
decision-making process. Lumina Foundation for Education, New Agenda Series.
Retrieved from http://www.luminafoundation.org/publications/Hossler.pdf
Klomegah, R. (2007). Predictors of academic performance of university students: An
application of the goal efficacy model. College Student Journal, 41(2), 407-415.
Kramer, G.L., Higley, H.B., & Olsen, D. (1994). Changes in academic major among
undergraduate students. College and University, 69(2), 88-98.
Kuh, G.D., Kinzie, J., Buckley, J., Bridges, B., & Hayek, J.C. (2007). Piecing together
the student success puzzle: Research, propositions, and recommendations. ASHE
Higher Education Report, 32(5). San Francisco: Jossey-Bass.
Kuh, G.D. & Love, P.G. (2000). A cultural perspective on student departure. In J.
Braxton (Ed.), Reworking the Student Departure Puzzle (pp. 48-61). Nashville,
TN: Vanderbilt University Press.
Lau, L. (2003). Institutional factors affecting student retention. Education, 124(2), 126-
136.
Legutko, R. S. (2007). Influence of an Academic Workshop on Once-Undeclared
Graduates' Selection of a Major. College Student Journal, 41(1), 93.
Levitz, R., & Noel, L. (1989). Connecting students to institutions: Keys to retention and
success. The freshman year experience: Helping students survive and succeed in
college, 65-81.
Levitz, R. S., Noel, L., & Richter, B. J. (1999). Strategic moves for retention
success. New directions for higher education, (108), 31-49.

109
Lotkowski, V. A., Robbins, S. B., & Noeth, R. J., ACT Office of Policy Research.
(2004). The role of academic and non-academic factors in college student
retention. Retrieved from ACT website:
http://www.act.org/research/policymakers/pdf/college_retention.pdf
Miao, K. Center for American Progress, (2012). Performance-based funding of higher
education. Retrieved from website: http://www.americanprogress.org/wp-
content/uploads/issues/2012/08/pdf/performance_funding.pdf
Micceri, T. (2001). Change your major and double your graduation chances. Paper
presented at the Association for Institutional Research Annual Forum, Long
Beach, CA, June 3-6.
Marks, E. (1967). Student perceptions of college persistence and their intellectual,
personality, and performance correlates. Journal of Educational Psychology,
58(4), 210-221.
Multon, K.D., Brown, S.D. & Lent, R.W. (1991). Relation of self-efficacy beliefs to
academic outcomes: A meta-analytic investigation. Journal of Counseling
Psychology, 38(1), 30-38.
Munro, B.H. (1981). Dropouts from higher education: Path analysis of a national sample.
American Educational Research Journal, 18 (2), 133 – 141.
Murtaugh, P. A., Burns, L. D., & Schuster, J. (1999). Predicting the retention of
university students. Research in higher education, 40(3), 355-371.
Noel, L. (1985). Increasing student retention: New challenges and potential. In L. Noel,
R. Levitz, & D. Saluri (Eds.), Increasing student retention (pp. 1-28). San
Francisco, CA: Jossey-Bass Inc., Publishers.
110
Novak, H., & McKinney, L. (2011). The consequences of leaving money on the table:
Examining persistence among students who do not file a FAFSA. Journal of
Student Financial Aid, 41(3), 1.
Obama, B. (2010, February 24). Remarks of President Barack Obama -- Address to Joint
Session of Congress. Retrieved April 14, 2014, from
https://www.whitehouse.gov/the_press_office/Remarks-of-President-Barack-
Obama-Address-to-Joint-Session-of-Congress/
Ott, A.P. & Cooper, B. (2013, March 8). They’re transfer students, not cash cows. The
chronicle of higher education. Retrieved from http://chronicle.com/article/Theyre-
Transfer-Students-Not/137935/
Pajares, F., & Schunk, D. H. (2001). Self-beliefs and school success: Self-efficacy, self-
concept, and school achievement. In R. Riding & S. Rayner
(Eds.), Perception (pp. 239-266). Retrieved from
http://des.emory.edu/mfp/PajaresSchunk2001.html
Panos, R.J. & Astin, A.W. (1967). Attrition among college students. ACE Research
Reports, 2 (4).
Pascarella, E.T. & Chapman, D.W. (1983). A multiinstitutional, path analytic validation
of Tinto’s model of college withdrawal. American Educational Research Journal,
20 (1), 87- 102.
Pascarella, E.T. & Terenzini, P.T. (1979). Interaction effects in Spady and Tinto’s
conceptual models of college attrition. Sociology of Education, 52 (4), 197 – 210.
111
Pascarella, E.T. & Terenzini, P.T. (1980). Toward the validation of Tinto’s model of
college student attrition: A review of recent studies. Research in Higher
Education, 12(3), 271 – 282.
Pascarella, E.T. & Terenzini, P.T. (1980). Predicting freshman persistence and voluntary
dropout decisions from a theoretical model. Journal of Higher Education, 51(1),
60-75.
Pascarella, E.T. & Terenzini, P.T. (1983). Predicting voluntary freshman year
retention/withdrawal behavior in a residential university: A path analytic
validation of Tinto’s model. Journal of Educational Psychology, 75 (2), 215 –
226.
Pascarella, E.T. & Terenzini, P.T. (1991). How college affects students: Findings and
insights from twenty-two years of research (1st ed.). San Francisco: Jossey-Bass
Publishers.
Patrick, W.J. (2001). Estimating first-year student attrition rates: An application of
multilevel modeling using categorical variables. Research in Higher Education,
42(2), 151-170.
Peng, C.J., So, T.H., Stage, F.K., & John, E.S. (2002). The use and interpretation of
logistic regression in higher education journals: 1998-1999. Research in Higher
Education, 43(3), 259 – 293.
Peterson, S.L. (1993). Career decision-making self-efficacy and institutional integration
of underprepared college students. Research in Higher Education, 34(6), 659-684.

112
Pew Research Center, February, 2014, “The Rising Cost of Not Going to College”
http://www.pewsocialtrends.org/2014/02/11/the-rising-cost-of-not-going-to-
college/
Raisman, N. The Educational Policy Institute. (2013). The cost of college attrition at
four-year colleges and universities. Retrieved from:
http://www.educationalpolicy.org/pdf/1302_PolicyPerspectives.pdf
Rayle, A.D. & Chung, K. (2007). Revisiting first-year college students’ mattering: Social
support, academic stress, and the mattering experience. Journal of College
Student Retention: Research, Theory & Practice, 9(1), 21-37.
Robbins, S.B., Allen, J., Casillas, A. Peterson, C.H. & Le, H. (2006). Unraveling the
differential effects of motivational skills, social, and self-management measures
from traditional predictors of college outcomes. Journal of Educational
Psychology, 98(3), 598-616.
Robbins, S.B., Lauver, K., Le, H., Davis, D., Langley, R. & Carlstrom, A. (2004). Do
psychosocial and study skill factors predict college outcomes? A meta-analysis.
Psychological Bulletin, 130(2), 261-288.
Roberts, J. & Styron R. (2009). Student satisfaction and persistence: Factors vital to
student retention. Research in Higher Education Journal, 6, 1-15.
Rossman, J.E. & Kirk, B.A. (1970). Factors related to persistence and withdrawal among
university students. Journal of Counseling Psychology, 17(1), 56-62.
Selingo, J. (2013). College unbound: The future of higher education and what it means
for students. New York, NY: Houghton Mifflin Harcourt Publishing Company.

113
Shapero, D., Dundar, A., Chen, J., Ziskin, M., Park, E., Torres, V., & Chiang, Y.
National Student Clearinghouse Research Center. (2012). Completing college: A
national view of student attainment rates. Retrieved from:
http://nscresearchcenter.org/wp-content/uploads/NSC_Signature_Report_4.pdf
Shapero, D., Dundar, A., Yuan, X., Harrell, A., Wild, J., Ziskin, M. (2014, July). Some
College, No Degree: A National View of Students with Some College Enrollment,
but No Completion (Signature Report No. 7). Herndon, VA: National Student
Clearinghouse Research Center.
Shavelson, R.J., Hubner, J.J., & Stanton, J.C. (1976). Self-concept validation of construct
interpretation. Review of Educational Research, 46, 407-441.
Solberg, V.S., O’Brien, K., Villareal, P., Kennel, R. & Davis, B. (1993). Self-efficacy
and Hispanic college students: Validation of the College Self Efficacy Instrument.
Hispanic Journal of Behavioral Sciences, 15(1), 80-95. DOI
10.1177/07399863930151004
Spady, W. (1971). Dropouts from higher education: An interdisciplinary review and
synthesis. Interchange, 1, 64-85.
St. John, E.P., Cabrera, A.F., Nora, A. & Asker, E.H. (2000). Economic influences on
persistence reconsidered: How can finance research inform the
reconceptualization of persistence models. In J. Braxton (Ed.), Reworking the
Student Departure Puzzle (pp. 48-61). Nashville, TN: Vanderbilt University
Press.

114
Supiano, B. (2011, February 2). College enrollments continue to climb while graduation
rates hold steady. The chronicle of higher education. Retrieved from
http://chronicle.com/article/College-Enrollments-Continue/126191/
Terenzini, P.T. & Pascarella, E.T. (1978). The relation of students’ precollege
characteristics and freshman year experience to voluntary attrit kion. Research in
Higher Education, 9, 347 – 366.
Thelin, J.R. (2004). A history of American higher education (2nd
ed.). Baltimore, MD:
Johns Hopkins University Press.
Tierney, T. (2006). How is American higher education measuring up? An outsider’s
perspective. In American higher education: How does it measure up for the 21st
century?
Tinto, V. (1975). Dropouts from higher education: A theoretical synthesis of recent
research. Review of Educational Research, 45, 89-125.
Tinto, V. (1987). Leaving college: Rethinking the causes and cures of student attrition.
Chicago, IL: The University of Chicago Press.
Tinto, V. (1993). Leaving college: Rethinking the causes and cures of student attrition.
(2nd ed). Chicago, IL: The University of Chicago Press.
Tinto, V. (2012). Completing college: Rethinking institutional action. Chicago, IL: The
University of Chicago Press.
Tinto, V. & Cullen, J. (1973). Dropout in higher education: A review and theoretical
synthesis of recent research. Office of Planning, Budgeting and Evaluation: U.S.
Department of Education.

115
Torres, J.B. & Solberg, S.S. (2001). Role of self-efficacy, stress, social integration, and
family support in Latino college student persistence and health. Journal of
Vocational Behavior, 59, 53-63.
Trent, J.W. & Medsker, L.L. (1965). Beyond high school. San Francisco: Jossey-Bass.
Vuong, M., Brown-Welty, S. & Tracz, S. (2010). The effects of self-efficacy on
academic success of first-generation college sophomore students. Journal of
College Student Development, 51(1), 50-64.
Wohlgemuth, D., Whalen, D., Sullivan, J., Nading, C., Shelley, M., & Wang, Y. (2007).
Financial, academic, and environmental influences on the retention and
graduation of students. Journal of College Student Retention: Research, Theory
and Practice, 8(4), 457-475.
Yu, C. H., DiGangi, S., Jannasch-Pennell, A., & Kaprolet, C. (2010). A data mining
approach for identifying predictors of student retention from sophomore to junior
year. Journal of Data Science, 8(2), 307-325.
Zajacova, A., Lynch, S.M., & Espenshade, T.J. (2005). Self-efficacy, stress, and
academic success in college. Research in Higher Education, 46(6), 677-706.