the indian ocean climate initiative: stage 3 - · pdf filethe indian ocean climate initiative...
TRANSCRIPT

1
The Indian Ocean Climate
Initiative: Stage 3
Report of the 2010 Symposium held at:
Perth Convention and Exhibition Centre Tuesday 26 October 2010

2
The Indian Ocean Climate Initiative (IOCI) is a partnership of the State Government of Western Australia, CSIRO and the Australian Bureau of Meteorology, which was formed by the Western Australian Government to support informed decision making on climate variability and change in Western Australia. IOCI Stage 3 Contacts Dr Bryson Bates (Project Manager) CSIRO [email protected] Dr Carsten Frederiksen (Project Manager) Dr Pandora Hope (Project Officer) Bureau of Meteorology [email protected] I-Lyn Loo (Project Manager) Government of Western Australia [email protected] Website: www.ioci.org.au IOCI3© This Report was prepared by the Climate Change Unit in the Department of Environment and Conservation February 2011 Disclaimer This report was prepared by the Department of Environment and Conservation on behalf of the Indian Ocean Climate Initiative Stage 3 partnership. The information contained in this report does not commit the Government of Western Australia to any future action. The document does not necessarily represent Government policy or the views of the Sate Government. The State of Western Australia accepts no responsibility or legal liability for any costs, expenses, loss or damage of any kind suffered by any person arising, directly or indirectly, from the reliance on or other use of this publication (in part or in whole) or any information or material contained in it.

3
Contents
Acronyms .......................................... .............................................................4
1. Introduction ...................................... .......................................................5
2. The Program ....................................... .....................................................5
3. Delegates ......................................... ........................................................6
4. Morning Session: IOCI3 Science Update ............. .................................7 4.1 - Opening Address .......................................................................................7 4.2 - Overview of IOCI Stakeholder Feedback .................................................9 4.3 - Overview of IOCI3: Highlights, Achievements and Deliverables. .........11 4.4. - The Drying Hydroclimate of South West Western Australia. ................13 4.5 - Climate: An Extreme View .....................................................................15 4.6 - Observed and projected changes in the large scale atmospheric circulation and impacts on weather systems affecting Western Australia winter rainfall ..............................................................................................................17 4.7 - Tropical Cyclones Affecting North West Western Australia: Recent Findings and Research Questions ....................................................................19 4.8 - A Summary of the Science ......................................................................21
5. Afternoon Session: Group Discussions .............. ............................... 23
6. Delegate Surveys .................................. ................................................ 33
Appendix 1 –Delegates ............................. ................................................... 40
Appendix 2 - Dr Bates’ Powerpoint Slides .......... ....................................... 41
Appendix 3 - Dr Bates’ Powerpoint Slides .......... ....................................... 44
Appendix 4 - Dr Phatak’s Powerpoint Slides ........ ..................................... 47
Appendix 5 - Dr Frederiksen’s Powerpoint Slides ... ................................. 50
Appendix 6 - Dr McBride’s Powerpoint Slides ....... ................................... 55
Appendix 7 – Future of Climate Science in Western A ustralia ................ 63
Appendix 8 – Feedback Survey ...................... ............................................ 64

4
Acronyms BoM Bureau of Meteorology
CSIRO Commonwealth Scientific and Industrial and Research Organisation
DAFWA Western Australian Department of Agriculture and Food
DEC Western Australian Department of Environment and Conservation
CCU – DEC Climate Change Unit, Department of Environment and Conservation, Western Australia.
DMP Western Australian Department of Mines and Petroleum
DoC Western Australian Department of Commerce
DoF Western Australian Department of Fisheries
DoH Western Australian Department of Health
DoP Western Australian Department of Planning
DoW Western Australian Department of Water
DPC Western Australian Department of Premier and Cabinet
DSD Western Australian Department of State Development
DSR Western Australian Department of Sports and Recreation
DTF Western Australian Department of Treasury and Finance
DTF-BMW Western Australian Department of Treasury and Finance – Building Management and Works
FESA Fire Emergency Services Authority
FPC Forests Product Commission
IOCI Indian Ocean Climate Initiative
MRWA Main Roads Western Australia

5
1. Introduction The Indian Ocean Climate Initiative Stage 3 (IOCI3) research agreement was signed in March 2008 and is scheduled for completion in 2012. The vision, aim and key objective of IOCI3 are:
Vision: The State of Western Australia is empowered with the best available scientific knowledge for adapting to climate change. Aim: To establish and maintain state-of-the-art and regionally-specific knowledge of past and projected climate trends in Western Australia and make such knowledge available in a policy ready form and for public information processes. Key objective: To provide outputs in a useful form to policy-makers and other stakeholders.
IOCI3 has held two workshops to date:
1. 28 August 2008; and; 2. 26 – 27 October 2009
This report describes the proceedings of a Symposium held at the Perth Convention and Exhibition Centre on Tuesday, 26 October 2010. The aims of the Symposium were:
� to update Government agencies, through the representatives of the Climate Change Policy Interdepartmental Steering Group (CCPISG), on IOCI3 findings; and
� to seek feedback from Government agencies on their climate science needs, and the way in which they would like climate science information to be delivered.
2. The Program The Symposium included an update of IOCI3 finding by the scientists in the morning followed by facilitated group discussions in the afternoon.
Introductions Mr Paul Holper 08:55 - 09:00
Opening Address Hon Hendy Cowan, Chair of IOCI3 09:00 - 09:05
Overview of IOCI stakeholder feedback
Dr Anne Mathews, Department of Environment and Conservation (DEC) - Climate Change Unit
09:05 - 09:15
A. Overview of IOCI3: Highlights, achievements and deliverables.
Dr Bryson Bates, Commonwealth Scientific and Industrial Research Organisation (CSIRO)
09:15 - 10:10

6
B. The Drying Hydroclimate of South West Western Australia.
Climate: An Extreme View Dr Aloke Phatak, CSIRO 10:10 - 10:30
Morning Tea 10:30 - 11:00
Observed and projected changes in the large scale atmospheric circulation and impacts on weather systems affecting Western Australia winter rainfall
Dr Carsten Frederiksen, Bureau of Meteorology (BoM)
11:00 - 11:50
Tropical cyclones affecting North West Western Australia: Recent findings and research questions
Dr John McBride, BoM 11:50 - 12:15
Lunch 12:15 - 13:00
Group Discussion
Theme 1: To explore current stakeholder activities, projects and programs in the climate science area; the information stakeholders use currently; other information required by stakeholders and how IOCI3 can assist.
Facilitated by Mr Paul Holper, CSIRO
13:00 - 13:45
Group Discussion
Theme 2: To explore how stakeholders would like IOCI3 findings communicated to them.
Facilitated by Dr Iain Walker, CSIRO
13:45 - 14:00
Future for Climate Science in Western Australia
Facilitated by Mr Paul Holper, CSIRO
14:00 - 14:55
Closing Address Mr Paul Holper, CSIRO 14:55 - 15:00
3. Delegates Other than the CSIRO and BoM personnel the delegates at the Symposium were members of the (CCPISG) and its sub-committees.
7
4. Morning Session: IOCI3 Science Update
4.1 - Opening Address Hon Hendy Cowan, Chair of IOCI3
“IOCI is close to home as I am a farmer in the eastern wheatbelt of Western Australia
which is currently grappling with the driest winter on record.”
Mr Cowan’s address started with an acknowledgment of the Noongar people as the traditional custodians of this land, followed by a welcome to the project partners, the scientists present and the delegates. The role, membership and recent activities of the IOCI3 Board were described. The role of the IOCI3 Board:
� Overseeing and monitoring progress of the project;
� Determining the strategic direction of the Project with the objective of achieving the maximum practical application and common benefit; and
� Developing a communication strategy to ensure delivery and productive application of the research findings.
The membership of the Board is:
� Hendy Cowan (Independent Chair);
� Two Western Australia State Government representatives (Dr Anne Mathews, Acting-Director DEC-Climate Change Unit and Ms Maree De Lacey, Acting Director General of the Department of Water);
� Dr Andrew Ash, Director of Climate Adaptation Flagship, CSCIRO; and
� Dr Neville Smith, Deputy Director Research and Systems, BoM.
Although there had been delays in getting the Board established, it has made great progress since its establishment in June 2010 including:
� Meetings in July 2010 and September 2010;
� Review of two milestone reports, i) for all milestones due for completion in 2008 and ii) or all milestones due for completion in 2009;

8
� Review of project finances to 30 June 2010;
� Review of project timelines;
� Development of a draft framework for a communication strategy;
� Initiation of discussions about what happens after the completion of IOCI3; and
� Approval of this Symposium as a critical element of the process of information exchange.
Mr Cowan has been involved with IOCI since its inception. As Deputy Premier of WA he launched IOCI Stage 1 in 1997, which completed in 2002. IOCI Stage 2 started in 2003 and completed in 2005. IOCI Stage 3 started in March 2008 and is now scheduled for completion in 2012. Mr Cowan said that IOCI is also close to home as “I am a farmer in the eastern wheatbelt of Western Australia which is currently grappling with the driest winter on record”. Mr Cowan went on to say that IOCI is as important today as it was when Stage 1 was launched back in 1997. It is building capacity to understand climate change in WA; it is building our knowledge of the drivers of our environment – how they are changing and why they are changing. It will deliver this information in a policy-ready format which should enable the planning and program development necessary for us to cope with the climate changes ahead of us. Mr Cowan finished his address and formally opened the Symposium with a quote used by the Governor of Western Australia at the opening of each new Parliament: “May Providence bless your labours”.

9
4.2 - Overview of IOCI Stakeholder Feedback Dr Anne Mathews, DEC - Climate Change Unit
“….regionally-specific knowledge of past and projected climate trends…available in a policy
ready form and for public information processes.”
Dr Mathews explained the aims of the 2010 Symposium, the vision, aims and objectives of IOCI3, the progress of IOCI3, feedback from State Government agencies from the 2009 IOCI3 Workshop on the research results and climate science needs of agencies. The aims of this Symposium are to:
� Update the Climate Change Policy Interdepartmental Steering Group (CCPISG) on the work of IOCI3;
� Discuss the extent to which the IOCI3 program meets stakeholder needs; and
� Explore the future of the IOCI program in Western Australia.
The vision, aim and key objective of IOCI3:
� Vision - the State of Western Australia is empowered with the best available scientific knowledge for adapting to climate change.
� Aim - to establish and maintain state-of-the-art and regionally-specific knowledge of past and projected climate trends in Western Australia and make such knowledge available in a policy ready form and for public information processes.
� Key objective – to provide outputs in a useful form to policy-makers and other stakeholders.
Progress of IOCI3 The progress of IOCI3 was summarised: two milestone reports submitted to the IOCI3 Board; two workshops held to date, a 1-day workshop in August 2008 and a 2-day workshop in October 2009.
Feedback from State Government agencies on the research results presented at the 2009 IOCI3 Workshop indicated:
� There is more interest in the results of the research rather than the methodology;
10
� Better engagement is needed between researchers and stakeholders;
� There needs to be clarity about what IOCI3 can deliver;
� IOCI findings need to be accessible format for both policy development and for translation to the wider community, and be tailored for specific groups and levels of understanding; and
� A one-stop-shop is needed where the outputs and information arising from IOCI can be aggregated and made available to users.
Feedback from State Government agencies at the 2009 IOCI3 Workshop on their climate science needs included:
� Agriculture – regional scale, seasonality and extreme events data and probability of change and access to historical data sets;
� Fire and Emergency Services – what conditions or phenomena associated with climate change will encourage and stimulate fires;
� Terrestrial Biodiversity – downscaled climate data covering areas outside of IOCI 3 and easy transfer and delivery of climate data;
� Water – good observational data sets and associated outputs from climate models, climate predictions at seasonal to 5-year timeframes, increased confidence in climate predictions; and
� Health – local scale data on projections and risks/vulnerabilities, duration of temperature events, frequency and intensity of extreme events, increased reliability and certainty in models.
Other feedback from State Government agencies from the 2009 IOCI3 Workshop included:
� The value of the workshop in providing opportunities to network and
build relationships.
� The recognition of the commitment, capabilities and excellent progress made by the IOCI3 scientists; and
� A greater understanding of the climate of Western Australia.
11
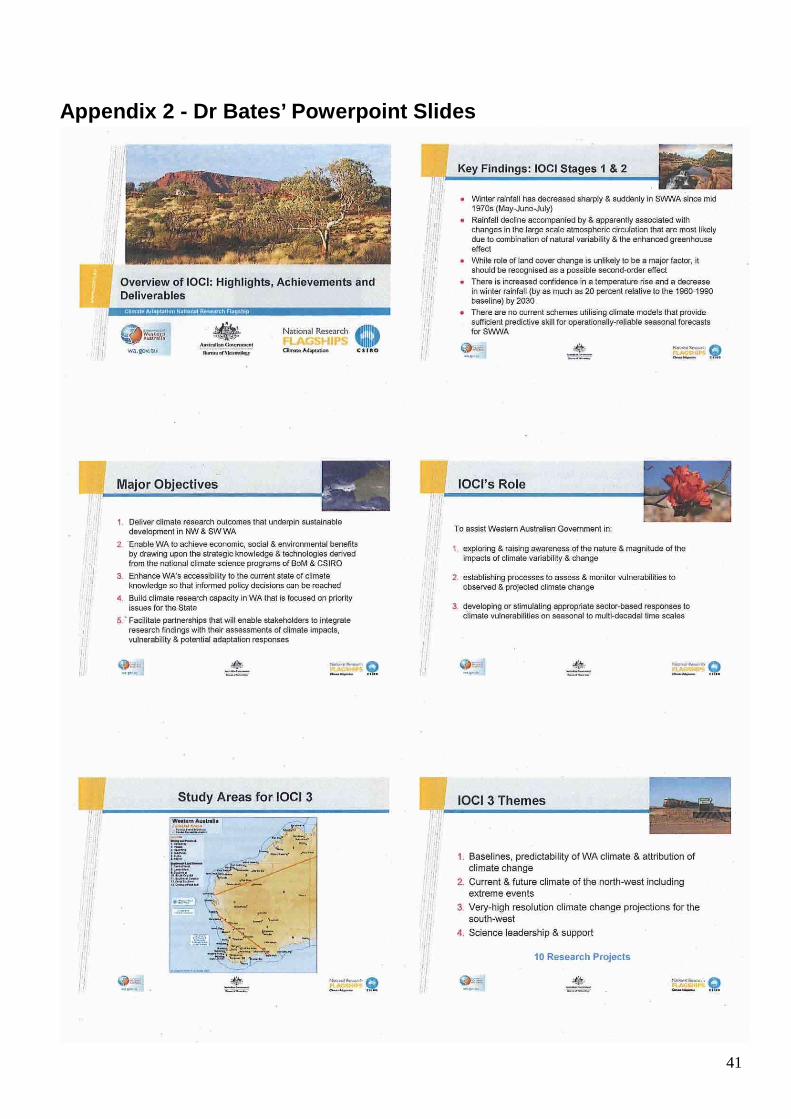
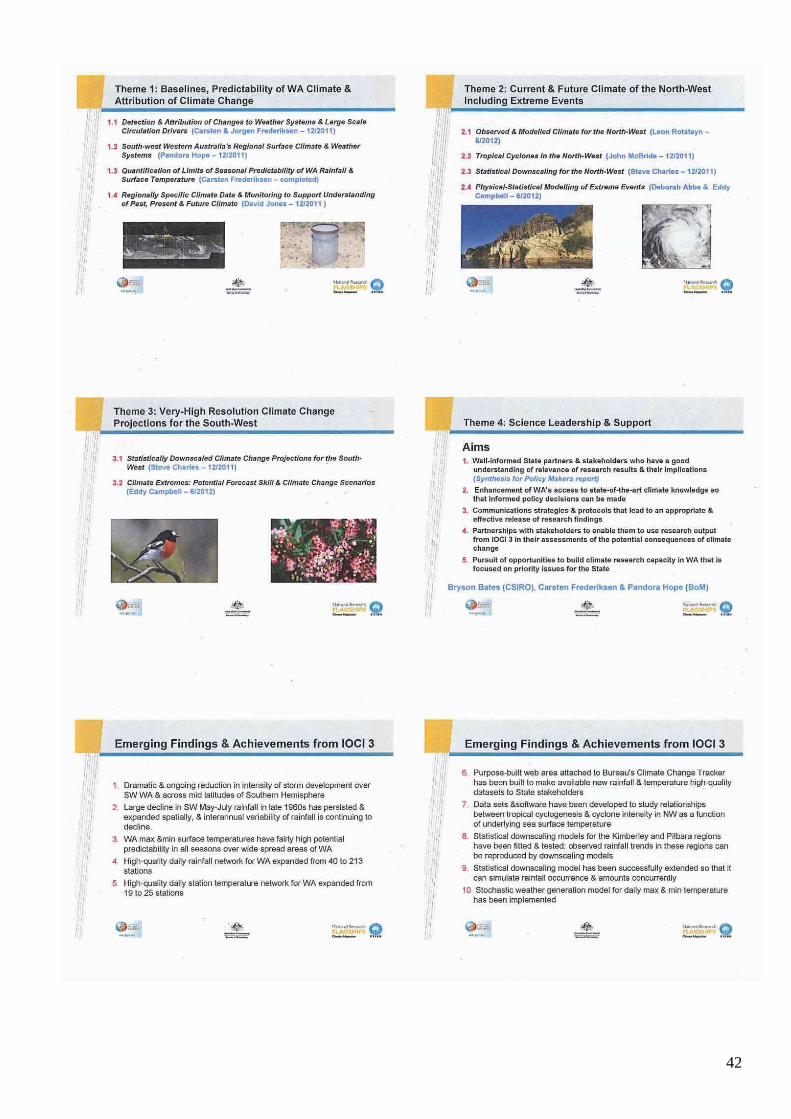
4.3 - Overview of IOCI3: Highlights, Achievements and Deliverables.
Dr Bryson Bates, CSIRO
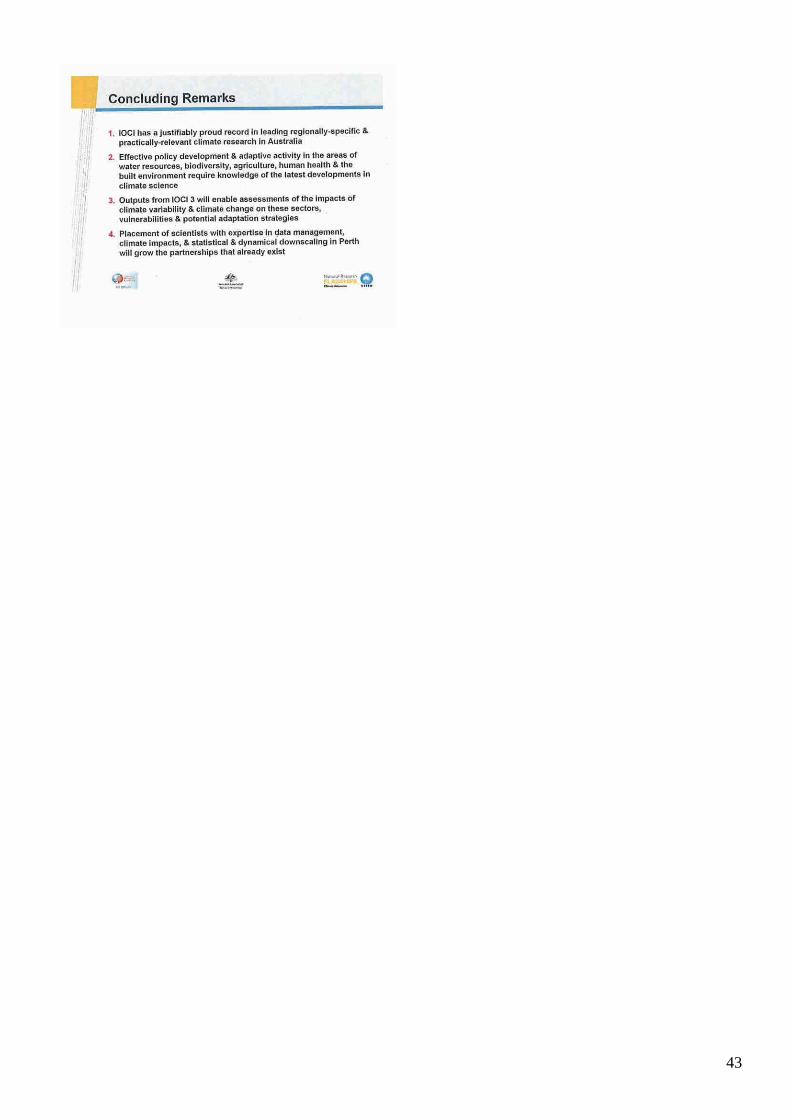
“IOCI has a justifiably proud record in leading regionally specific and practically-relevant
climate research in Australia.”
Dr Bates provided a summary of the findings of past IOCI programs, the structure and aims of IOCI3 and a summary of emerging findings.
Key points include:
Summary of Findings from IOCI1 and IOCI2
� Winter rainfall has decreased sharply and suddenly in south west Western Australia since mid 1970s (May-June-July);
� Rainfall decline accompanied by and apparently associated with changes in the large scale atmospheric circulation that are most likely due to combination of natural variability and the enhanced greenhouse effect;
� While role of land cover change is unlikely to be a major factor it should be recognised as a possible second-order effect;
� There is increased confidence in a temperature rise and a decrease in winter rainfall (by as much as 20 percent relative to the 1960-1990 baseline) by 2030; and
� There are no current schemes utilising climate models that provide sufficient predictive skill for operationally-reliable seasonal forecasts for south west Western Australia.
Major Objectives of IOCI3
� Deliver climate research outcomes that underpin sustainable development in north west and south west Western Australia;
� Enable Western Australia to achieve economic, social and environmental benefits by drawing upon the strategic knowledge and technologies derived from the national climate science programs of BoM and CSIRO;
� Enhance Western Australia’s accessibility to the current state of climate knowledge so that informed policy decisions can be reached;
� Build climate research capacity in Western Australia that is focused on priority issues for the State; and

12
� Facilitate partnerships that will enable stakeholders to integrate research findings with their assessments of climate impacts, vulnerability and potential adaptation responses.
Study Area of IOCI3
The two study areas of IOCI3: i) the north west of Western Australia encompassing the major parts of BoM’s Kimberley and Pilbara forecast districts and parts of the Gascoyne and Interior; and ii) the south west lies south west of a line approximately from Northampton to Esperance.
Please follow the links for:
� Dr Bates’ Powerpoint slides in Appendix 1
� Dr Bates’ Powerpoint presentation on the IOCI3 website
Questions
CSIRO-WAMSI: Is IOCI3 meeting expectations?
� Dr Bates talked about the problem of dam inflows emerging in late 1990s. At that time very little was known about climate variability and climate change. At the 2004 Australian and New Zealand Climate Forum a senior BoM person was heard to bemoan the fact that more was known about the climate in south west Western Australia than the south east.
DAFWA: When will downscaling datasets be available?
� Dr Bates talked about access to the datasets – who and how that access occurs requires discussion.
DoF: Are we now looking at winters as well as dry autumns?
� Dr Bates said that appears to be the case but we don’t want to extrapolate too much and you will hear more on this later.
DoW: The changes in the water balance in Western Australia have been dramatic in the last couple of years. What are the challenges of getting it across to Government
� Dr Bates said the major challenge is the lack of, with the loss of the Science Panel from IOCI3, effective communication with the Minister and the Directors General.
13
4.4. - The Drying Hydroclimate of South West Western Australia.
Dr Bryson Bates, CSIRO
“The decline in annual inflow is in fact more consistent with a smooth declining trend than with a sequence of sharp
breaks” Dr Bates presented his recent work on the drying hydroclimate in the South-West of Western Australia. The south west region of Western Australia has experienced a sustained sequence of low annual inflows to major water supply dams over the last 30 years. The Integrated Water Supply System (IWSS) supplies water for 1.6 million in Perth and surrounding areas.
Until recently, the dominant interpretation of this phenomenon has been predicated on the existence of one or more sharp breaks (change or jump points), with inflows fluctuating around relatively constant levels between them. The study was motivated by the need for a comprehensive understanding of a hydrologic series that appears to exhibit non-stationarity through a thorough investigation of the associated climatic drivers.
The work presented here brought together different disciplines with different techniques to look at a problem in a new way. The analysis showed that:
� the decline in annual inflow is in fact more consistent with a smooth declining trend than with a sequence of sharp breaks;
� the decline is associated with decreases both in the frequency of daily precipitation occurrence and in wet-day amounts; and
� the decline in regional precipitation is strongly associated with a marked decrease in moisture content in the lower troposphere, an increase in regionally-averaged sea-level pressure in the first half of the season, and intraseasonal changes in the regional north-south sea-level pressure gradient.
Please follow the links for:
� Dr Bates’ Powerpoint slides in Appendix 2
� Dr Bates’ Powerpoint presentation on the IOCI3 website.
14
Questions
DoTF –BMW: Does this mean that it won’t rain again?
� Dr Bates said what he was trying to show is that we have been trying to look for are periods when assumptions can be made about a baseline from which to do planning – however, this hides important features of the trend.
CSIRO – WAMSI: What is the role of CO2 in driving the trend?
� Dr Bates said that Dr Frederiksen will talk more about this but if the trend continues we are in trouble so we need to be planning for the bad scenario.
CCU - DEC - Now that IOCI is giving us a greater understanding of the natural variability versus the human drivers of climate it seems as if the changes we are seeing are not attributable to natural variability?
� Dr Frederiksen said that there is a high likelihood that what we are seeing is GHG driven. IOCI3 is working on a method for attributing change via a fingerprinting method which will hopefully provide definitive evidence.
DoW: There is a clear link between the climate science - the water balance – the water supply and ultimately water policy. Can we do the same for ecosystems and fire?
� Dr Bates said that ecosystems haven’t received the funding to date for this sort of work. The Bushfire CRC is doing some of it.
DEC: How important in dew point temperature depression (DTD)?
� Dr Bates said that DTD does seem critical and is used quite a bit by meteorologists in Queensland and the east generally.

15
4.5 - Climate: An Extreme View Dr Aloke Phatak, CSIRO
“Compared to climate science – rocket science is easy”
Dr Phatak provided an overview of climate change extremes in Western Australia.
Some years ago Dr Phatak worked as a rocket engineer. Referring to the cliché ‘it’s not rocket science’ Dr Phatak says that having now worked in climate science…rocket science is easy by comparison.
Dr Phatak noted that there is no unambiguous definition of ‘extreme’ weather. Two working definitions for the purposes of IOCI3 work are:
� Those climate events causing extraordinary economic and social (loss of life or livelihood) damage; and
� Events that occur when physical variables such as temperature, rainfall, etc. are at the extremes of their historical distribution, e.g., rainfall above the 99th percentile. It is the tails of those distributions that are studied.
There is some suggestion that extremes will change proportionately more than averages and the aim of IOCI3 work is to be able to say how climate extremes will behave now, and in the future.
There are a number of approaches to studying extremes:
� Descriptive statistics: e.g., on average, how many days above 37ºC have we had in the last 20 summers?
� Statistical modelling: e.g., what is the mechanism that gives rise to extremes, and what really extreme events might occur?
� Deterministic modelling: what are some of the broad-scale drivers of climate, and how will they change if anthropogenic CO2 emissions continue to increase?
� Combination of statistical and deterministic modelling.
Dr Phatak and his colleagues are using statistical modelling. The combination of statistical and deterministic modelling is IOCI’s ultimate goal.

16
Some significant challenges in studying extreme climates:
� By definition extreme events are rare, there is a paucity of data making modelling difficult;
� Definition of what constitutes extreme varies from sector to sector, e.g. a damaging event may not necessarily have been associated with ‘statistically’ extreme climate; and
� There is a need to be able to model those events in which the weather variable are only classified as moderate but the combination of them still does significant damage.
Please follow the links for:
� Dr Phatak’s Powerpoint slides in Appendix 3
� Dr Phatak’s Powerpoint presentation on the IOCI3 website

17
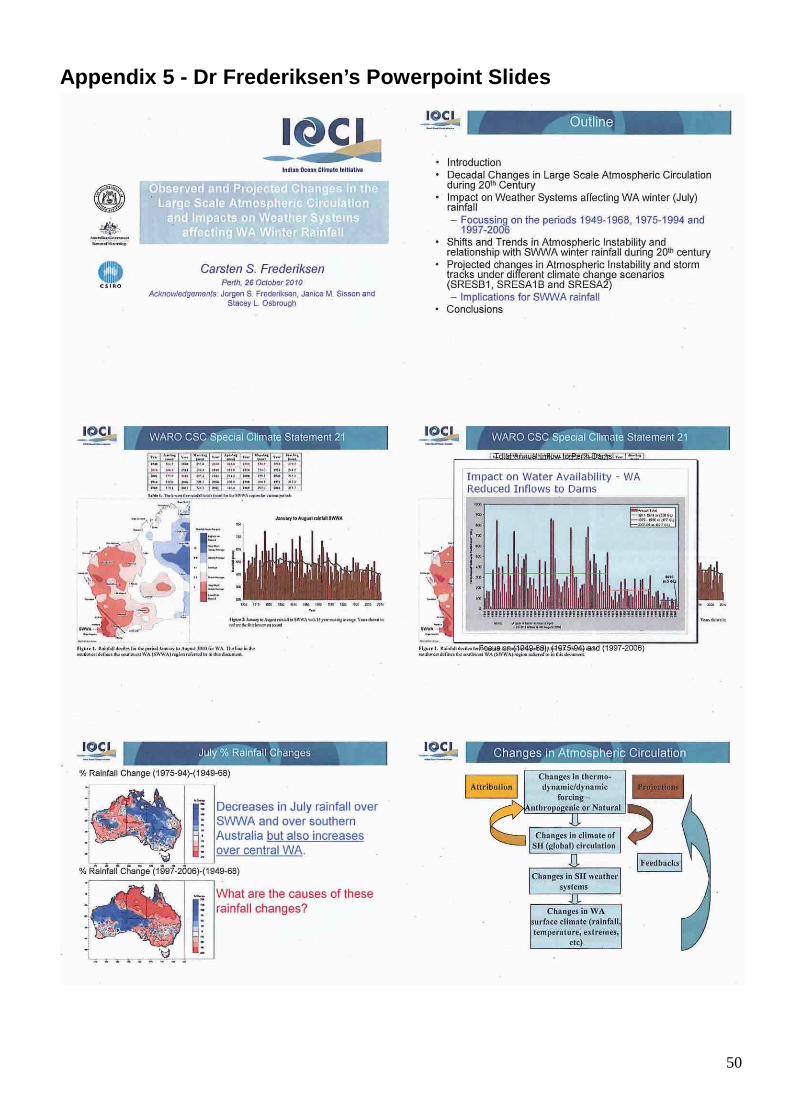
4.6 - Observed and projected changes in the large scale atmospheric circulation and impacts on weather systems affecting Western Australia winter rainfall
Dr Carsten Frederiksen, BoM
“Don’t take declining rainfall personally - it is not a local effect – it is occurring
across the southern hemisphere”
Dr Frederiksen presented on the impacts of observed and projected changes in the large scale atmospheric circulation on weather systems that drive rainfall in Western Australia.
Dr Frederiksen referred to the fact that Western Australia has experienced the driest winter on record. Comparing the periods 1949-1968, 1975-1994 and 1997-2006 it can be seen that July rainfall has decreased over south west Western Australia and southern Australia but increased over central Western Australia.
In looking at the reasons why this has occurred changes in atmospheric circulation were examined which over time found:
� Large difference in the zonal winds that extend across the southern hemisphere with large reductions around 300S;
� Large changes upstream of Western Australia in the region where storms develop; and
� Changes in the vertical averaged atmospheric temperature – warming in latitudes 300-600S and cooling of the Indian Ocean.
These changes in the atmospheric circulation have led to a reduction in the growth rate of weather systems that impact on south west Western Australia with the result that storms have been increasingly less likely to develop and those that do develop tend to do so further south over the Southern Ocean.
In terms of weather systems associated with north west cloudbands, and intraseasonal oscillations that bring rainfall to central Australia and north west Western Australia – these systems have experienced an increase in their growth rates and are increasingly more likely to occur.
The decreased rainfall over southern Australia is also attributed to the atmosphere becoming more stable in the region 300-400S, which is normally
18
associated with storm development. Negative trends in the Phillips Criterion (1950-1999) between 300-400S are highly significant even when the annual and decadal variability are removed.
A small number of models are able to pick up these changes, but with only at best half the magnitude. However, IPCC Assessment Report 5 will give more models to choose from. The fact that the changes are affecting the entire globe gives credence that what we are seeing in Western Australia is not local variability. Rainfall is harder to model than large scale circulation systems. Atmospheric instability, as measured by the Phillips Criterion, can act as a proxy for rainfall – a reduction in instability translates roughly to a 5 mm reduction in rainfall.
Model trends in Phillips Criterion and rainfall in Special Report on Emissions Scenarios (SRES) are similar to those in 20th century suggesting similar rates of reduction in rainfall to what has already occurred over south west Western Australia.
Trends in Phillips criterion in “commit” run not statistically significant, suggesting trends in SRES Scenarios are closely associated with prescribed increasing anthropogenic gas forcing.
Please follow the links for:
� Dr Frederiksen’s Powerpoint slides in Appendix 4
� Dr Frederiksen’s Powerpoint presentation on the IOCI3 website
Questions CSIRO: Will Greenhouse Gases have a gradual or step-wise impact on climate?
� Dr Frederiksen said that answer won’t come out of this analysis. However, a system can switch and go into a different state and so we are very brave to be doing what we are doing to our environment.
CSIRO - WAMSI: Only two models captured the observed changes well – why?
� Dr Frederiksen said that there may be a problem with oceans in the models, or the coupling between the oceanic and atmospheric components. When the atmospheric component is forced by a combination of observed sea surface temperature and GHG forcing some of these models do correctly reproduce the sign and magnitude of the observed changes.
19
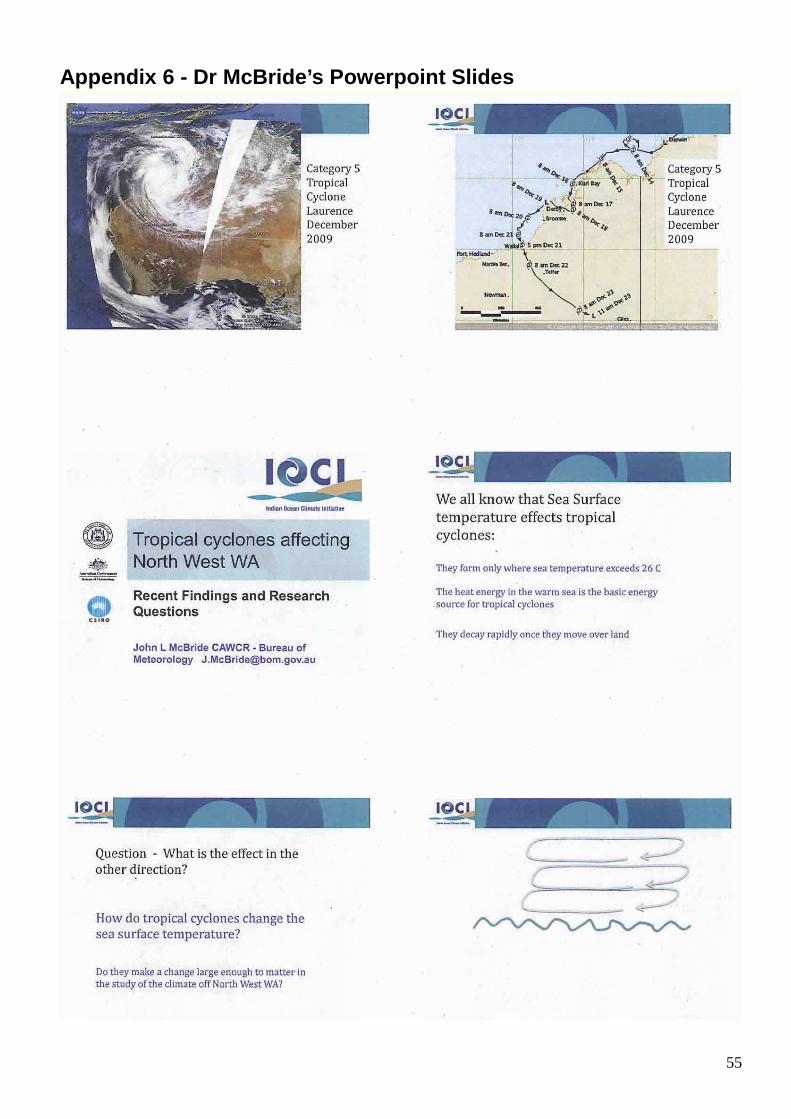
4.7 - Tropical Cyclones Affecting North West Western Australia: Recent Findings and Research Questions
Dr John McBride, BoM
“There is still much fundamental work to be done in understanding and
improving the projections for individual basins, including WA”
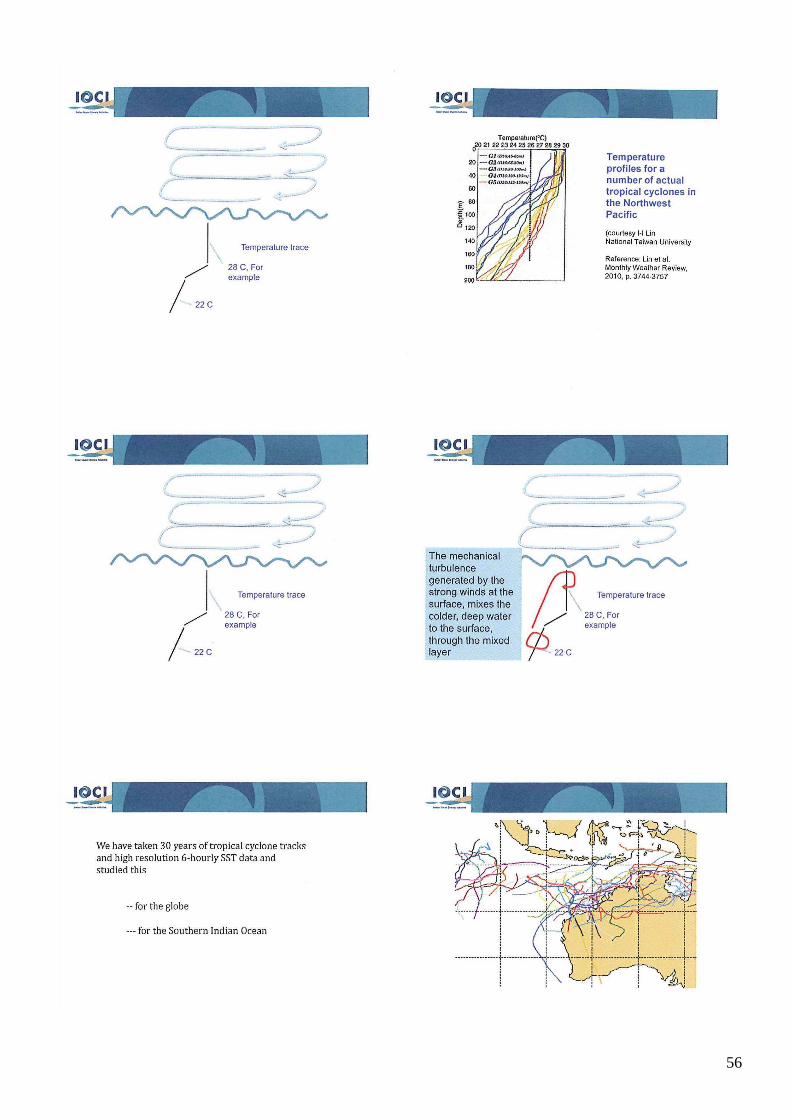
Dr John McBride presented some findings and research on the tropical cyclones affecting the north west of Western Australia. The study of tropical cyclones is a new addition to the IOCI program of research and so is a pilot project.
Although it is well known that warm seas (>26˚C) are an essential ingredient for the formation of tropical cyclones, the effect of tropical cyclones on sea-surface temperatures is one of the questions being asked by John McBride and his fellow-researchers. Results were shown for the size of the temperature reduction due to the crossing of a cyclone and for whether the effect is large enough to affect the mean sea surface temperature over the region
How important are tropical cyclones in north-west of Western Australia on rainfall or how many of the extreme rainfall events come from cyclones? This is being addressed through the IOCI project. Preliminary results were shown, and a paper and report on this will be written in 2011.
How will north-west Western Australia cyclone activity change under the climate change warming scenarios? Modelling consistently indicates that greenhouse warming will cause globally averaged intensity to increase and frequency to decrease. However, two downscaling methods are giving opposite results for cyclone frequency off Western Australia. There is still much fundamental work to be done in understanding and improving the projections for individual basins, including Western Australia.
Please follow the links for:
� Dr McBride’s Powerpoint slides in Appendix 5
� Dr McBride’s Powerpoint presentation on the IOCI3 website

20
Questions DoH: If cyclone intensity increases – will we see more damage inland due to flooding ?
� Dr McBride said we don’t really know yet; but this is under investigation. Increased rainfall is only in the central eye region and this is balanced against the fact that the overall number of cyclones may decrease.
IOCI3 Chair: Will we see fewer cyclones?
� Dr McBride said that this is a consistent projection coimg from the models. However, this projection is for the global average number of cyclones; and the projections for individual regions such as the Indian Ocean vary from model to model. It is difficult to tell from the data since we currently only have 30-40 years of reliable data – and interannual variability is high, giving a small signal to noise ratio.
IOCI3 Chair: Cyclone Steve in 2000 didn’t die out but did a big loop across the top of Australia down through Western Australia and eventually out into the Bight – will we see more cyclones like that?
� Dr McBride said that IOCI3 is the first regional study on cyclones and there are lost of questions still to be answered including this one. However, as part of the IOCI research we intend documenting events such as this so they can be studies in the climate change context.
BoM: If there is a marked increase in cyclone intensity – will this have a detrimental effect on agriculture and mining?
� Dr McBride said that hard numbers on the economic impact are difficult to obtain. While the major focus of the IOC research is on the climate science, as part of the work we are hoping to put together whatever information we can on the economic impacts of tropical cyclones.

21
4.8 - A Summary of the Science Dr Pandora Hope, BoM
“The significant shifts in Western Australia’s climate makes IOCI an exciting project to be part of, as our research will be central to
helping the State effectively adapt to climate change.
Dr Hope was asked to give an impromptu view on IOCI3 research.
Dr Hope has been a scientist and science manager in IOCI since 2002. IOCI has and continues to produce a wide range of interesting and important results and Dr Hope noted that there was only time to present a sub-set of the work at this Symposium.
In this Stage 3 of IOCI – the work has been extended to the north west of Western Australia. IOCI3 scientists are improving Australia's climate models to better simulate tropical processes in an effort to capture the observed rainfall trends in the north west.
Australia is very well placed to be a world leader in the modelling of tropical climates since it is one of the few countries that have access to high quality datasets and our own global climate models. It will also give us a better understanding of the weather systems of the region, and the drivers of extreme events.
IOCI3 has extended research beyond winter rainfall to assess temperature, and rainfall variability in other seasons. Summer temperatures are very important for human health. Previous work showed that summer maximums appear to have been cooling over the last 50 years in the north west and south west of Western Australia. However, re-runs of the analysis using improved and extended high-quality datasets reveal that some regions are not cooling by as much as previously thought. If the drivers of the cooling are short-term (aerosols or decadal variability in the phase of the Southern Annular Mode or ENSO) we may see a rapid and sudden warming in the future.

22
Dr Hope’s work with IOCI3 includes the investigation of the weather systems that make up the varying climate of south west Western Australia. She has found that winter low pressure systems decreased in daily frequency in the late 1960s, and since the late 1990s, coupled with decreased winter lows, has been an increase in the daily occurrence of high pressure systems.
In 2006 south west Western Australia experienced mean seal level pressures more than 2 standard deviations above the mean. In 2008 there was no settlement of the rock-lobster, which is highly unusual. In 2010, the index of the Southern Annular Mode (SAM) remained in its positive mode for months throughout winter, whereas this mode which is associated with high pressures over south west Western Australia usually persists for only about 10 days.
The extended positive phase of SAM is associated with the driest year on record to date for south west Western Australia. IOCI3 will also provide some high resolution datasets further down the track that can feed into understanding these changes and future projections at the local scale.
The significant shifts in Western Australia’s climate makes IOCI an exciting project to be part of as our research will be central to helping the State effectively adapt to climate change.
23
5. Afternoon Session: Group Discussions Mr Paul Holper and Dr Ian Walker from CSIRO facilitated the afternoon session exploring the stakeholder needs of Government agencies, the IOCI3 communication strategy and the future of climate science in Western Australia. Two themes, as indicated below, were explored in the afternoon session.
Delegates were grouped by tables (five tables in total) and given 20 minutes to discuss the theme and then a person was nominated from each table to present the results of the discussion.
Theme 1: To explore current stakeholder activities, projec ts and programs in the climate science area; the informati on stakeholders use currently; other information required by stakeh olders and how IOCI3 can assist.
Facilitator: Mr Paul Holper
The following guiding questions were provided to the delegates to facilitate discussion in small groups.
1. What activities, projects and programs are you currently engaged in that relies on climate information?
2. What climate information do you currently use in your work? 3. What additional climate information do you need? 4. How can IOCI3 assist?
The responses from each table that was shared with the large group are listed below. Question 1. What activities, projects and programs are you currently
engaged in that relies on climate information?
� Risk management. � DAFWA: research. � Funding applications and leveraging finding from the Commonwealth
requires climatic information. � DoW: Heavy reliance on climate data for water resource planning
(short- and long-term). � Determining social impacts of climate change and mechanisms of
adaptation. � FESA: Natural disaster preparedness. � DoF: Monitoring fish stocks. � River catchment modeling.

24
� DTF-BMW/DoSR: Advice for facility planning including water and energy efficiency, thermal comfort, type of air-conditioning needed.
� DTF-BMW/DSR. Education on climate change impacts on building design.
� FPC: Plan for forest establishment, forest health management, predict forest growth.
� DTF: Indirect use of climate information but decision making in budgetary matters is evidence-based.
� DAFWA: heavy reliance on climate data for monitoring impacts on production and providing advice to government, industry and farmers to facilitate planning and decisions.
� DAFWA: Need a range of timescales daily through to long-term to help inform tactical and strategic decisions (including succession planning).
� DSD: Has a general watching brief. Risk management of large development projects and liability of government.
� DEC: Support other agencies in conducting risk, impact and vulnerability assessments and provide data to other agencies.
� DEC: Fire management, sustainable forest management, biodiversity conservation.
� MRWA: Current and future climate information needed for standards and design of bridges/roads, for planning projects, for design of rehabilitation projects, for predicting shifts in the State’s ‘food bowl’ and its transport needs.
� DoH: Look at impacts of climate change on health from all angles with 2 major priorities: i) looking after sick people and ii) preventative health care. Need information to inform decisions all the way from projects through to policy, and to provide advice to Department stakeholders. Climate change has the potential to result in risks to health and communities. It is important that risks are identified and that sectors work together to develop adaptation strategies to reduce these risks (e.g. agriculture, water, etc) and assist people - for example mental health.
Question -2. What climate information do you curren tly use in your
work?
� Long-term trends and variance importance to guide risk management.
� DoF: Fish stocks dependent on sea-surface temperatures, wave/winds/currents.
� DAFWA: Short-term (7-day) forecasting forms the basis of so much that we do.
� Broader trends are used to inform work.
� DTF-BMW: Use maximum wet bulb data to provide advice on appropriateness of types of air-conditioners for various locations.
� DAFWA: Mainly interested in rainfall and temperature. DAFWA do seasonal projections in-house but the Department doesn’t have a lot of

25
skill. It is currently developing a generalised model. The Department has a multi-model approach.
� FPC: Forest evaporation, temperature, extreme weather events, heat waves and severe fire weather.
� Downscaled rainfall.
� Modelling – fine scale model for coastal strip.
� Trends in tropical cyclone.
� DEC: Broadly use BoM data for long-term seasonal temperature and rainfall; cyclones – daily/hourly weather forecasts; seasonal fire outlook; historical climate information to match species to site. Some use Elders but most come back to BoM.
Question 3. What additional climate information do you need and Question 4. How can IOCI3 assist? Climatic Information
� FESA: cyclone projections are vital; sea level projections; probability of
extreme events such as storms (frontal storms versus out-of-character storms such as summer mini-cyclones that have occurred in recent years) and fires.
� DSD: Cyclones in north west of particular interest as this is a key area of interest re. income generation for the Government.
� Information on lightning i.e. area of high strike; geographic pattern of strike and frequency of strike.
� DoF: IOCI and WAMSI to deliver historical trends and cycles.
� Trends and projections finer scales was a recurring theme.
� It would be useful to have a better understanding of extreme events and what leads to them e.g. hail storms.
� Location and paths of cyclones to for example inform building codes and manage risks to communities, particularly in north west Western Australia but also south west.
� Effect of climate change on variability of climate.
� Standardised set of climate scenarios appropriately downscaled for Western Australia – needs to be driven by government agencies.
� DAFWA: Farmers want a forecast and they want to use it like a recipe to dial up decisions. In summary DAFWA want data/information to help farmers to make decision across a variety of timescales.
� DEC: Need downscaled climate change projections for climate parameters relevant for industries and communities.
� DSD: sea-level rise predictions to mange risk associated with large developments projects e.g. Ashburton Reef.

26
� CSIRO: Need better interaction of atmospheric and marine scientists. Value in ensuring that WAMSI uses the same models that IOCI uses that are good for WA. Need a clear statement re. confidence in human induced contribution to observed and potential future climate change.
� To enable vulnerability assessments need downscaled projections on trends and extremes on:
1. rainfall (extreme rain events and drought)
2. temperature
3. cyclones and other extreme wind events
4. sea level, storm surge and inundation
5. lightning behaviour
� Regionally specific data – practical and relevant to Western Australian policy and in a plain language report.
� Forests – all facets of climate change including impact of fire weather, extreme weather events.
� Data for vulnerability assessments.
� MRWA: Future climates for predicting and planning transport infrastructure needs...i.e. where will the future ‘food bowl’ be and what will be the roading requirements.
� Next generation weather forecasts.
� Seasonal lightening predictions.
� More information on paleoclimate beyond observed record.
� Changes in return periods of extreme events.
� Study of cyclone transition.
� DoH: Information required includes: extreme temperature events; extreme weather storms and cyclones that can lead to injury and increase the pressure on emergency services; vector-borne diseases (i.e will rainfall cause more water pooling and impact on mosquitoes and people).
Non-climatic Information
� DoH: Need to understand the vulnerability of sites across the State. What if you can’t fly in places – want to put strategies in place. Average trends as well as extremes are important. Planning for change and fear associated and how to reassure people.
� Understanding regional differences. If future climate changes can be identified at regional scale then necessary adaptation measures can be identified including behavioural change needed.
� It would be useful to look at case studies covering impacts and adaptation across sectors.
� Vulnerability assessments on communities.

27
� Adaptation – more research and dollars needed and better linkages with CSIRO adaptation programs.
� DAFWA: Through current collaboration need information on different levels impacts on downscaled data. Need the evidence that underlies the messages we are giving to our stakeholders to ensure that information is accepted i.e. credibility behind the communications. Farmers like to know the nuts and bolts of why things happen. Value for farmers in seeing changes in the atmospheric circulation patterns to gain confidence in climate change science. Potential for system collapse and to get to this need to understand vulnerabilities. Psychological preparation that their future will be different than before the impacts.
� The issue is how to address sceptics in rural communities.
� IOCI needs to provide leadership to Government to provide further confidence re. anthropogenic climate change. IOCI Board needs to provide information to Government to raise the profile in Cabinet. State Government needs to take the view that it has to plan like Local Government is doing. Need leadership from Government that there is a risk and a need to respond. To do this need good information in a form that is readily understood.
� Climate change response should be integrated into other activities in the State and not competing with other programs.
� Information with education focus.
� Interpretation of climate data for sports and recreation opportunities i.e. evaporative versus refrigerated air-conditioning in Geraldton.
� Refinement of information.
� Implications of the changes to the resource and energy sectors i.e. platform exposure, integrity of coastal pipelines, railroad connections to ports, power transmission, water access and planning.
� Policy ready data important to influence policy decision making.
� Publically available data and report.
� Broad brush won’t suit every sector may need to be customised for different sectors.
� South west Western Australia factors that contribute to the cyclone impact including on transport links and the environment.
� How is extra rainfall going to affect roads.

28
Theme 2: To explore how stakeholders would like IOCI3 find ings communicated to them.
Facilitator: Dr Iain Walker
The following guiding questions were provided to th e delegates to facilitate discussion in small groups.
1. The Board is tasked with developing a communication strategy for IOCI3. Do you have any suggestions/changes/comments on the communication strategy framework?
2. Are you aware of the IOCI3 website? Do you use the information on this website for your day-to-day work? Do you have any suggestions for improvement?
3. A final IOCI3 synthesis report is planned for release at the end of the IOCI3 project using the style of the AR4 IPCC Summary for Policymakers. How do you think this synthesis report should be structured and presented for it to be useful for you?
4. A final IOCI3 workshop is planned for 2011. What format do you think this workshop should take?
The responses from each table that was shared with the large group are listed below. Question 1. The Board is tasked developing a Commun ication Strategy
for IOCI3. Do you have any suggestions/changes/ comments on the communication strategy framework?
� to support the delivery of IOCI key goals, outcomes and science
findings; � to deliver IOCI to climate science program policies; � to provide different levels of communication needed in styles suits
dependent on the audience; � to promote and convince that science is robust and trustworthy by
creating an interactive presentation model; � to identify the missing gap of IOCI to IOCI3 needs and develop a better
way of communication; � to focus long, loud and consistent trusted voices; � to access media/story telling and spell the implication of the
information; � to speak with the Minister and media by IOCI trusted voices; � to refine the mechanism of science information and customisation for
public access; and � to focus on education.
Question 2. Are you aware of the IOCI3 website? Do you use the information on this website for your day-to-day wor k? Do you have any suggestions for improvement?
� Yes aware of the website, but not used;
29
� Yes, a dedicated website is useful to make publications available. � The use of website is occasional not used effectively because not
promoted enough; � The need to understand how the IOCI website fits with other websites
(e.g., climate change in DEC are using for projections. How can IOCI website add value to this?);
� The IOCI website audience does not come to you? � The IOCI website should provide an easy access link to BoM website
and other relevant web science link/sites; � The need to improve – very technical information, un-package and
repackage; � The final synthesis reports to link in e-fliers in a more detailed info on
the web; � The public/seminar/leverage – how do IOCI website deliver this
information to the community? � The IOCI website should develop and design to be the first POA of call
– could be good for case studies but no where near providing info to the public;
� The IOCI website is not well publicised; � The IOCI website should identify the audiences? � The availability use of access to download IOCI report.
Question 3. A final IOCI3 synthesis report is plann ed for release at the
end of the IOCI3 project using the format of the AR 4 IPCC Summary for Policymakers. How do you think this synthesis report should be structured and presented for it be useful for you?
� Access of public report – not aware; destination schedule; simple
language and summary of all IOCI report; � To provide synthesis report should be a brief document, quick and
easy to read, and provides all the key information need for Western Australia climate change;
� The need of summary for policy maker format; � Summary and interpretation of the key scientific findings in simple form;
and � The high level of information about how various agencies will be
affected by the findings. Question 4. A final IOCI3 workshop is planned for 2 011. What format do
you think this workshop should take?
� The Purpose? Showcase IOCI; all stakeholders and 1 dog symposium. � To continue workshop and engage with community in large form. � IOCI3 – 2011 Workshop? � Several purposes for IOCI4? � Continuation of IOCI4?

30
Future for Climate Science in Western Australia.
Facilitator: Mr Paul Holper, CSIRO
The afternoon session also explored the future of climate science in Western Australia and in particular the need to continue IOCI The IOCI3 Science Management Team (Dr Bates, Dr Frederiksen and Dr Hope) identified a number of areas for potential future climate research (Appendix 7).
The summary of the General discussion and questions that followed are listed below:
� DEC - From a user’s perspective improving downscaled climate projections will be valuable in the future. To what extent will the existing climate science meet the demand for downscaled climate projections and to what extent might new (beyond IOCI3) fundamental climate science be needed to deliver those downscaled projections?
� Dr Bates talked about a new stochastic downscaling model that is being deployed in IOCI3. This model, developed in collaboration with the International Research Institute for Climate and Society, can be used to simulate daily weather sequences at a much large number of sites than what was possible in the past. The model has been successfully fitted and tested in southwest and northwest regions of WA.
� DPC -Who is collecting and maintaining the data?
� Dr Bates said the downscaled climate projections will be generated by CSIRO. Research in Australia is heavily fragmented and never enough resources are devoted to maintaining data sets. It is not clear where the data products be stored, perhaps the iVEC server?
� MRWA - Will the Powerpoint presentations be available on the website and would the scientists be available to give talks to individual agencies?
� Mr Paul Holper said ‘yes’ to both.
� IOCI Chair - Does the Commonwealth Government put funding into climate science programs?
� Mr Paul Holper said they contribute significantly to programs including the Australian Climate Change Science Program and the South East Australian Climate Initiative.
� DEC - We will need to build a business case for an IOCI4.

31
� IOCI Chair - The success of an IOCI4 bid will depend on outcomes of IOCI3. DEC, with the Climate Change Unit, should be able to take the lead on the bid for an IOCI4.

32
Closing Comments
Mr Paul Holper, CSIRO
Mr Holper summarise the day’s proceedings and outcomes and said that, it has been inspiring to see how the climate information is used and how it will be used in the future.
Clear messages from the Symposium include:
� Communication of the science needs to be long, loud and consistent;
� The value proposition of IOCI3 needs to be clearly demonstrated if there is to be an IOCI4;
� We need to get better at translating the science into policy;
� We need to be realistic about what IOCI can deliver; and
� Some delegates feel there is a need for a technical committee between the researchers and users.
33
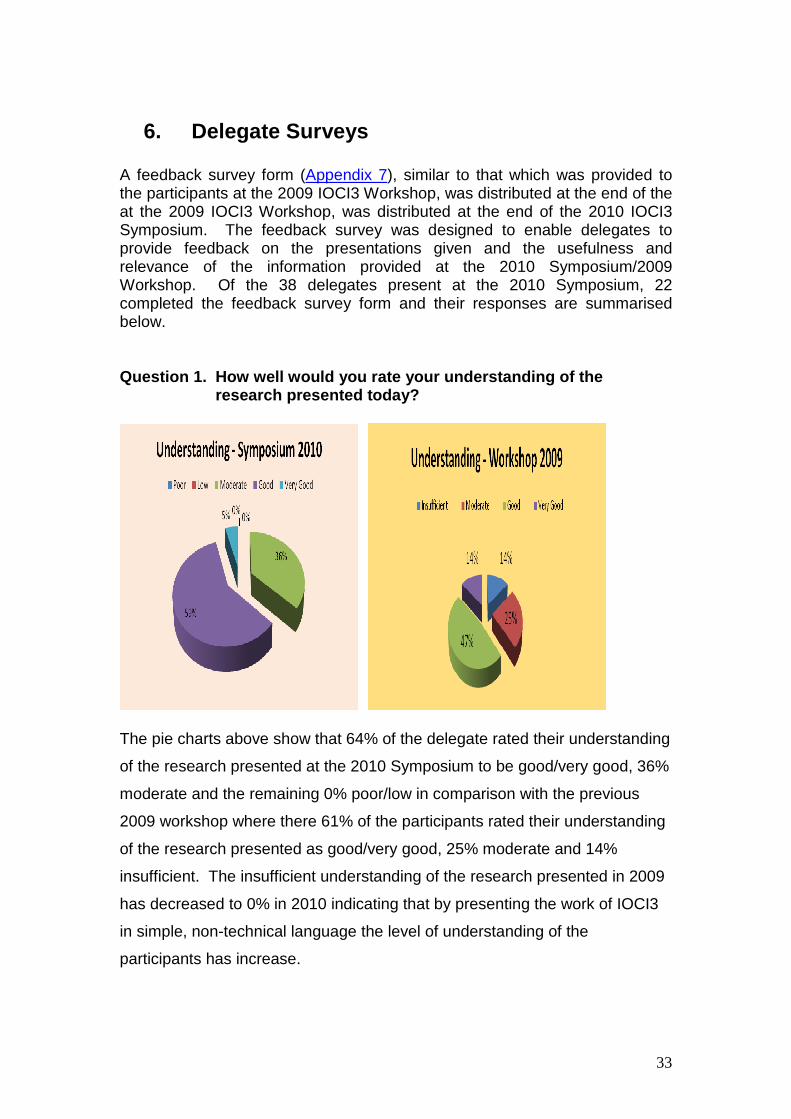
6. Delegate Surveys A feedback survey form (Appendix 7), similar to that which was provided to the participants at the 2009 IOCI3 Workshop, was distributed at the end of the at the 2009 IOCI3 Workshop, was distributed at the end of the 2010 IOCI3 Symposium. The feedback survey was designed to enable delegates to provide feedback on the presentations given and the usefulness and relevance of the information provided at the 2010 Symposium/2009 Workshop. Of the 38 delegates present at the 2010 Symposium, 22 completed the feedback survey form and their responses are summarised below. Question 1. How well would you rate your understan ding of the
research presented today?
The pie charts above show that 64% of the delegate rated their understanding
of the research presented at the 2010 Symposium to be good/very good, 36%
moderate and the remaining 0% poor/low in comparison with the previous
2009 workshop where there 61% of the participants rated their understanding
of the research presented as good/very good, 25% moderate and 14%
insufficient. The insufficient understanding of the research presented in 2009
has decreased to 0% in 2010 indicating that by presenting the work of IOCI3
in simple, non-technical language the level of understanding of the
participants has increase.

34
Question 2. How relevant are the research objectiv es of IOCI3 to the
issues your agency/sector seeking to address?
The pie charts above show that (73%) of the delegates rated the relevance of
the research presented at the 2010 Symposium to be highly relevant/very
relevant, 23% moderately relevant and the remaining 4% not
relevant/somewhat relevant in comparison with the previous 2009 Workshop
where 61% of the participants rated the relevance of the research presented
as good/very good, 11% moderate and 22% insufficient. The insufficient
relevance of the research presented in 2009 has decreased to 4% in 2010
from 22% in 2009 indicating that the work presented by the IOCI presenters is
more relevant to the issues of the agency/sectors seeking to address them
than in 2009.

35
Question 3 How useful will the results of the IOCI 3 research be to your agency/sector?
The pie charts above show that 76% of the delegates rated the usefulness of
the research to their agency/sector to be highly useful/very useful, 19%
moderately useful and the remaining 5% not useful/somewhat useful in
comparison with the previous 2009 Workshop where there 69% of the
participants rated the usefulness of the research presented as highly
useful/very useful, 28% moderately useful and 3% somewhat useful. The
results show that the useful/very useful response has increased in 2010
indicating the work of IOCI3 research is a useful for the participants to their
agency/sector.

36
Question 4 How confident are you that the results of the IOCI3 will help
your organization to progress effective policies?
The pie charts above show that 50% of the delegates rated their confidence
that the results of IOCI3 will help their organisation to progress effective
policies to be highly confident/very confident, 45% moderately confident and
the remaining 5% not confident/somewhat confident in comparison with the
previous 2009 Workshop where there 56% of the participants rated their
confidence of the research presented as highly confident/moderately
confident, 33% moderately confidence and 11% somewhat confident. The
somewhat confident/not confident response of the research presented in 2009
has decreased to 5% in 2010 indicating that the organisations are more
confident that the results of IOCI3 will help their organisation to progress
effective policies.

37
Question 5. What is the name of your organisation? The following organisations were represented by those that submitted survey forms.
Organisation Department of Water, Western Australia (DOW) Department of Commerce, Western Australia (DOC) CSIRO Department of Environment and Conservation, Western Australia (DEC) Bureau of Meteorology (BOM) Department of Mines and Petroleum, Western Australia (DMP) Department of Forests Production Commission, Western Australia (FPC) Department of Main Road Western Australia (MRWA) Department of Planning, Western Australia (DPI) Department of Health, Western Australia (DOH) Department of Agriculture, Western Australia (DAFWA) Department of Treasury and Finance, Western Australia (DTF) Department of State Development, Western Australia (DSD) Department of Fire Emergency Services Authority, Western Australia (FESA) Department of Sports and Recreation, Western Australia (DOS&R) Indian Ocean Climate Initiative (IOCI) – Board Question 6. What aspects of the Symposium were usef ul for you?
Comment
• No comment.
• The talks – got more understanding of the science exposure to stakeholders who will be ultimate users.
• Discussion in the afternoon and networking
• Summary of IOCI3 emerging findings. Discussion of Communication Strategy for IOCI3
• Discussions and presentations
• Research reports and group exercises.
• Technical presentations
• Science talks. Climate communication issues.
• Info from discussion sessions
• Interaction with various State Government people, research updates and workshop discussion.
• Understanding the needs of stakeholders
• Information on specific changes to climate trends. And all the coloured maps and graphs were used well to illustrate points.
• Discussions of small group sessions. Meeting key IOCI people – human face. Overview of latest research. Central location of venue.
• Better understanding of likely magnitude and direction of changes to some climate variables. Appreciation of the efforts within IOCI of understanding and predicting

38
climate change.
• Presentations
• Tropical cyclones.
• Provision of information. Collective discussion and potential integration across many and varied aspects.
• Scientific/technical presentations. Discussions out of session. Hendy Cowan’s frank comments.
• Overview of current work and opportunity to provide input to discussion
• Interaction with the government agencies
• Discussions about use of info. How it can be used.
• Latest trends in climate science. Ability to question researchers and provide them with future consideration in their research and networking.
• Discussion session.
Question 7. What aspects of the Symposium were leas t useful for you?
Comment
• No comment.
• No comment
• Not applicable
• No comment
• Not applicable
• None – all relevant.
• None.
• No comment
• Needed a stronger call to arms
• None to speak of.
• Presentations possibly too long
• Overcrowded room. Smaller table size for easier/better group discussions.
• No comment
• Discussion 2
• I found it difficult to follow some of the scientific language, especially the abbreviations – LR, LLR, GRI, Miroc. A lot of them weren’t explained, which leaves me wondering if they were really relevant in a workshop of this type? (ie to a non-scientific audience.)
• Not applicable
• No comment
• None, really.
• No comment
• To much technical information in some presentations.
• Stats and some of the science. But, I understand it is necessary building blocks to adaptation.
• While interesting, the intricacies of climate models was extensive. A more streamlined focus on implications/results/trends. Would be very useful.
• Detailed discussion re research models.

39
Question 8. Any other comments?
Comment
• No comment.
• No comment
• Overall, a good symposium
• No comment
• Continuation of the IOCI project stage 4 to help assists Western Australia’s future climate change weather forecasting.
• No.
• No comment
• No comment
• No comment
• No comment
• No comment
• More interactions with stakeholders (very small forum today). Good to map out GAPS. Include Technical people (not just policy in Govt) eg. Verve Vs Office of Energy
• Need to know more of the likely effects of changes to all aspects of climate – what are the feedback loops. More work required on predicting extremes e.g. damaging heatwaves, extreme fire weather.
• No comment
• Part of ensuring IOCI4 happens is to demonstrate how it is different to other climate science organisations. What won’t happen if it doesn’t go ahead?.
• No comment
• No comment
• No comment
• No comment
• No comment
• Yes, for IOCI4
• Look forward to more interesting effort into science re social impacts, Regional ‘profiles’ breakdown plus Adaptation.

40
Appendix 1 –Delegates Thirty eight delegates attended the Symposium. The following organisations were represented:
o Bureau of Meteorology o CSIRO o Department of Agriculture and Food o Department of Commerce o Department of Environment and Conservation o Department of Fisheries o Department of Health o Department of Mines and Petroleum o Department of Planning o Department of Premier and Cabinet o Department of Treasury and Finance o Department of State Development o Department of Sports and Recreation o Department of Water o Forest Products Commission o Main Roads Western Australia o Fire and Emergency Services Authority of Western Australia
41
Appendix 2 - Dr Bates’ Powerpoint Slides
42
43

44
Appendix 3 - Dr Bates’ Powerpoint Slides

45

46

47
Appendix 4 - Dr Phatak’s Powerpoint Slides

48

49
50
Appendix 5 - Dr Frederiksen’s Powerpoint Slides

51

52

53

54
55
Appendix 6 - Dr McBride’s Powerpoint Slides
56

57

58

59

60

61

62

63
Appendix 7 – Future of Climate Science in Western A ustralia
64
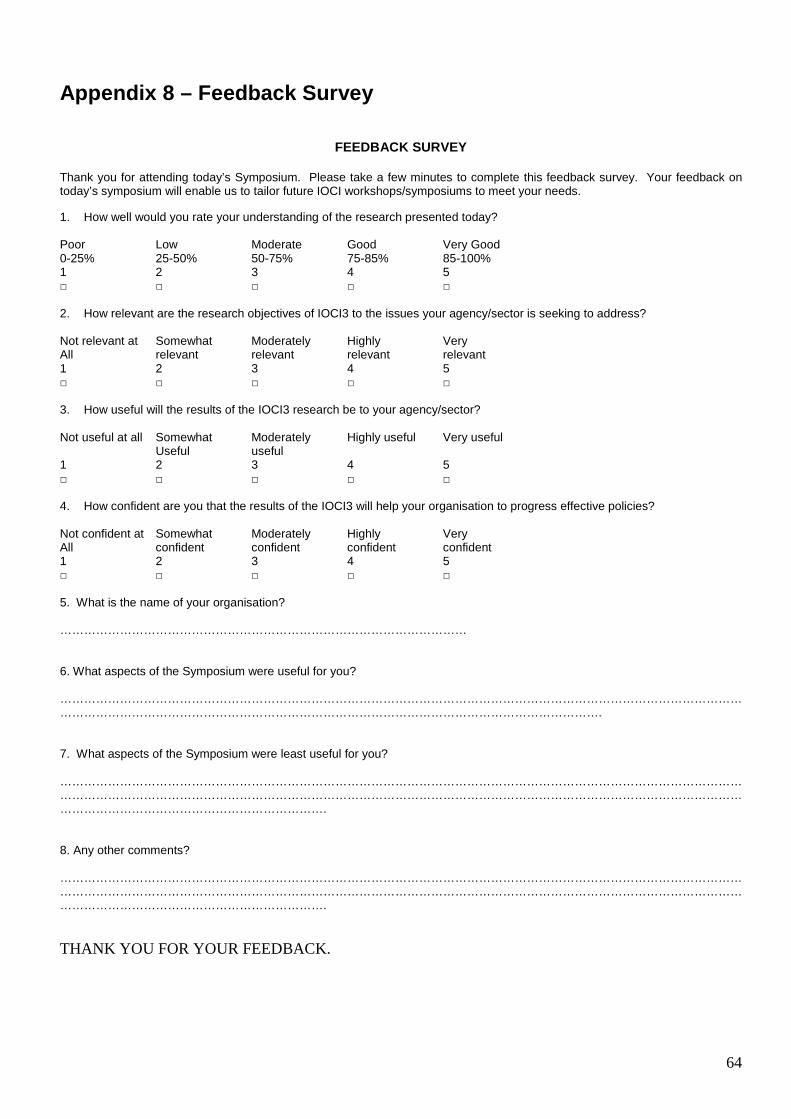
Appendix 8 – Feedback Survey
FEEDBACK SURVEY
Thank you for attending today’s Symposium. Please take a few minutes to complete this feedback survey. Your feedback on today’s symposium will enable us to tailor future IOCI workshops/symposiums to meet your needs. 1. How well would you rate your understanding of the research presented today? Poor Low Moderate Good Very Good 0-25% 25-50% 50-75% 75-85% 85-100% 1 2 3 4 5 □ □ □ □ □ 2. How relevant are the research objectives of IOCI3 to the issues your agency/sector is seeking to address? Not relevant at Somewhat Moderately Highly Very All relevant relevant relevant relevant 1 2 3 4 5 □ □ □ □ □ 3. How useful will the results of the IOCI3 research be to your agency/sector? Not useful at all Somewhat Moderately Highly useful Very useful Useful useful 1 2 3 4 5 □ □ □ □ □ 4. How confident are you that the results of the IOCI3 will help your organisation to progress effective policies? Not confident at Somewhat Moderately Highly Very All confident confident confident confident 1 2 3 4 5 □ □ □ □ □ 5. What is the name of your organisation? ………………………………………………………………………………………… 6. What aspects of the Symposium were useful for you? ………………………………………………………………………………………………………………………………………………………………………………………………………………………………………………………………………………. 7. What aspects of the Symposium were least useful for you? …………………………………………………………………………………………………………………………………………………………………………………………………………………………………………………………………………………………………………………………………………………………………………. 8. Any other comments? …………………………………………………………………………………………………………………………………………………………………………………………………………………………………………………………………………………………………………………………………………………………………………. THANK YOU FOR YOUR FEEDBACK.