the indian hotels company limited · 7 all india hospitality overview: 2016-17 v/s 2015-16 market...
TRANSCRIPT

1
The Indian Hotels Company Limited
Analyst Meet
Results for the Year ended March 31, 2017
May 26, 2017
2
These presentations may contain forward-looking statements within the meaning of applicable securities laws. Similarly,statements that describe our business strategy, outlook, objectives, plans, intentions or goals also are forward-lookingstatements
Forward-looking statements are not guarantees of future performance and involve risks and uncertainties and other factorsthat may cause actual results to differ materially from those anticipated at the time the forward-looking statements aremade. Future results, performance and achievements may be affected by general economic conditions, regulatoryenvironment, business and financing conditions, foreign exchange fluctuations, cyclicality and operating risks associatedwith the hospitality industry and other circumstances and uncertainties.
Although we believe the expectations reflected in such forward looking statements are based upon reasonable assumptions,we can give no assurance that our expectations will be attained or that results will not materially differ. We undertake noobligation to publicly update or revise any forward-looking statement, whether as a result of new information, future eventsor otherwise
Please visit our corporate website www.tajhotels.com for previous investor communications
Disclaimer

3
Presenter Panel
Rakesh Sarna -Managing Director & CEO
Giridhar Sanjeevi - Chief Financial Officer
Rajeev Newar – Vice President, Finance
4
Outline of Presentation
� Industry Trends
� Inventory – Taj Group
� Financial Results - Standalone & Consolidated
� Treasury
� Other Update

5
Industry Trends
Global outlook
� International travel and tourism arrivals grew by 3.9% to reach a total of 1,235 million in 2016 (Jan to Dec), 46 million more
than 2015 in the same period.
� Growth accelerated in Asia Pacific by (+8%) Europe by (+2%), America (+4%), and Africa (8%) enjoyed strong rebound
after two weaker years. Demand in Middle East was uneven and recorded decrease by (4%).
� The total contribution of Travel & Tourism to GDP was 10.2% of GDP in 2016, and is forecast to rise by 3.6% in 2017,
according to WTTC’s analysis
� As per WTTC, Travel & Tourism sector generated US $7,613.3 billion (10.2% of global GDP) in 2016 and supported 292
million jobs.
� Travel & Tourism is forecast to grow, in terms of GDP contribution, by 3.9% on average per year over the next ten years
and by 2027, Travel & Tourism is expected to support 382 million jobs in total globally.
Source : WTTC, UNWTO
6
Industry TrendsIndia Market Overview
� 2016-17 saw a supply growth of 3.1%, where demand increased by 6.2% over the previous year.
� Most key cities witnessed an increase in supply in the range of 1% to 5%
� E-Tourist Visa scheme for India is now available across 161 countries arriving at 16 Airports in India. Foreign tourists’ arrival
(FTAs) on e-tourist visa increased 142.5 % year-on-year in December 2016
� The total contribution of Travel & Tourism to GDP was 9.6% of GDP in 2016, and is forecast to rise to 10.2% in 2017.
� India has moved up 13 positions to 52nd rank from 65th in Tourism & Travel competitive index. The tourism and hospitality
sector is among the top 10 sectors in India to attract the highest Foreign Direct Investment (FDI).
� Domestic airline traffic has been increasingly steadily over the past year. Domestic airlines traffic will see an increase of 15.5%
this summer (2017) compared to the year-ago period.
Source : Ministry of tourism India, STR Global,WTTC
Industry Trends
7
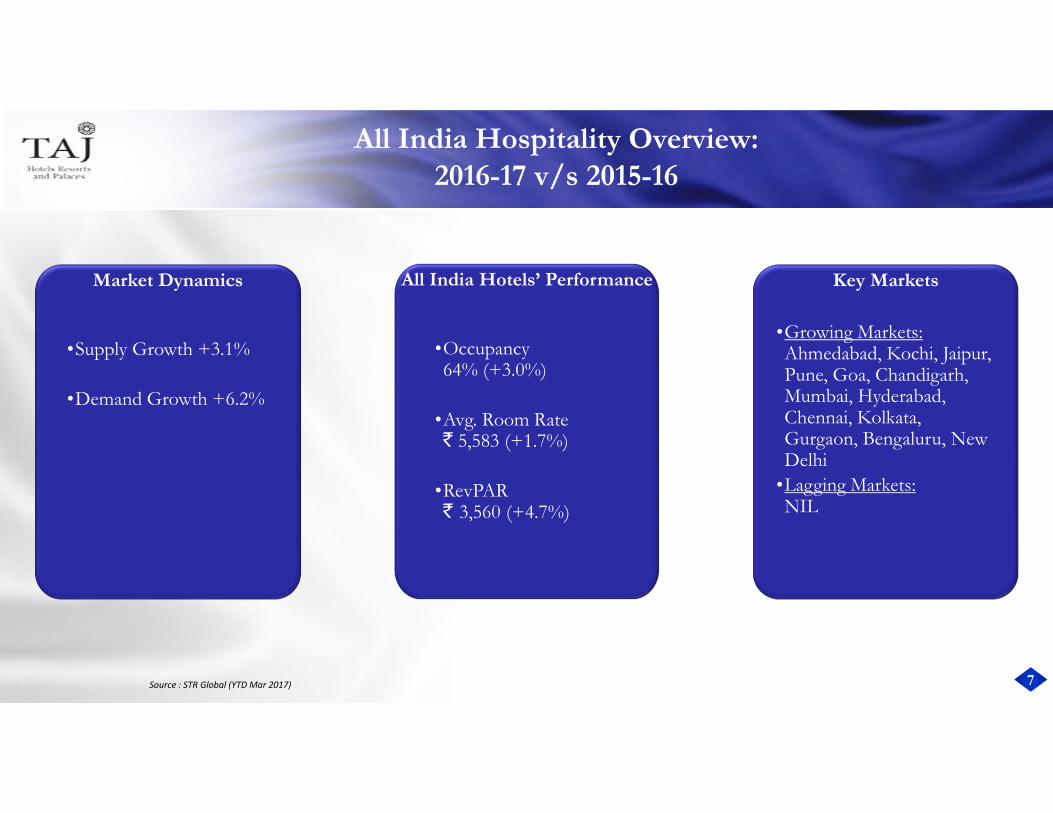
All India Hospitality Overview:
2016-17 v/s 2015-16
Market Dynamics
•Supply Growth +3.1%
•Demand Growth +6.2%
All India Hotels’ Performance
•Occupancy64% (+3.0%)
•Avg. Room Rate` 5,583 (+1.7%)
•RevPAR` 3,560 (+4.7%)
Key Markets
•Growing Markets: Ahmedabad, Kochi, Jaipur, Pune, Goa, Chandigarh, Mumbai, Hyderabad, Chennai, Kolkata, Gurgaon, Bengaluru, New Delhi
•Lagging Markets: NIL
Source : STR Global (YTD Mar 2017)

8
Taj Group
Inventory

9
Taj Group Inventory
Brand Distribution
Brands Domestic International Total
No of
Hotels
Inventory No of
Hotels
Inventory No of
Hotels
Inventory
21 3,572 10 1,851 29 5,423
35 4,939 5 575 40 5,514
27 2,206 1 208 28 2,414
35 3,324 - - 35 3,324
Total 118 14,041 16 2,634 134 16,675
10
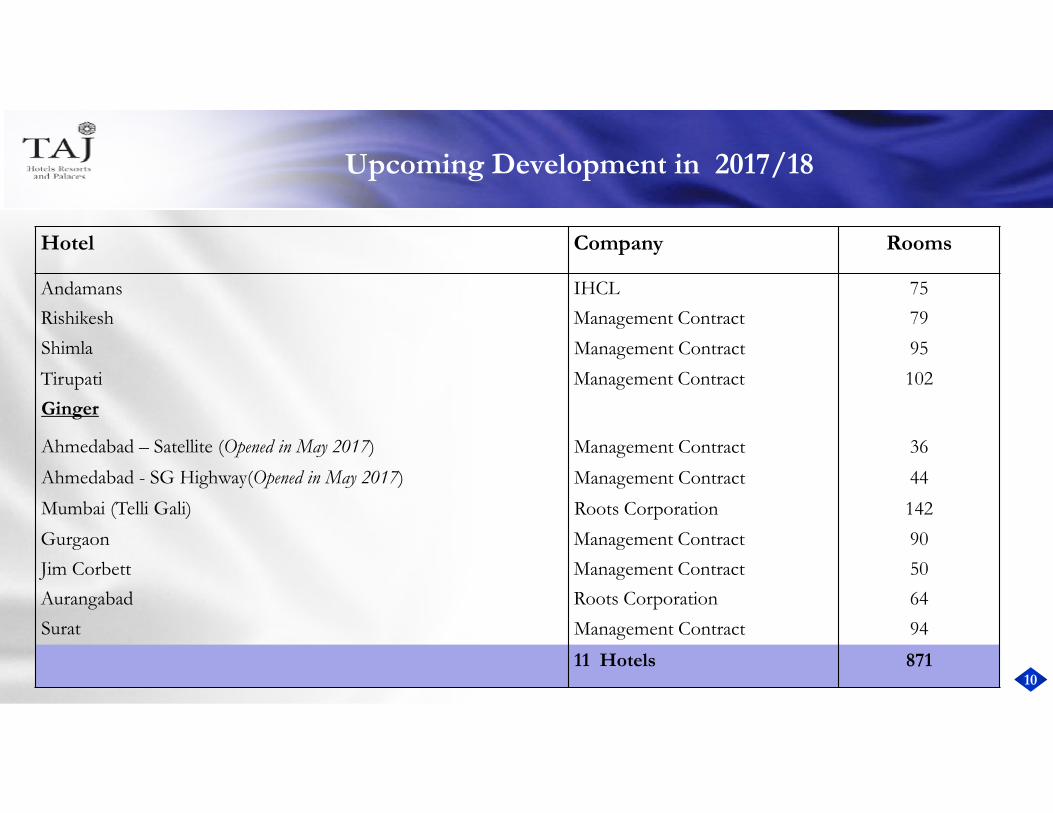
Upcoming Development in 2017/18
Hotel Company Rooms
Andamans IHCL 75
Rishikesh Management Contract 79
Shimla Management Contract 95
Tirupati Management Contract 102
Ginger
Ahmedabad – Satellite (Opened in May 2017) Management Contract 36
Ahmedabad - SG Highway(Opened in May 2017) Management Contract 44
Mumbai (Telli Gali) Roots Corporation 142
Gurgaon Management Contract 90
Jim Corbett Management Contract 50
Aurangabad Roots Corporation 64
Surat Management Contract 94
11 Hotels 871
11
Standalone Financial Performance
for the
Year ended March 31, 2017

12
IND-AS – Effective April 1, 2016
� Effective April 1, 2016, IHCL has migrated to the new Accounting Standards – IND-AS.
� Transition to IND-AS has resulted in key change in presentation of accounts, inter alia, in the following areas
Head Important Areas
Revenue recognition Loyalty Income
Fair Value Investments & Derivatives
Time value of Money Lease deposits
Effective Interest rate Low Coupon Debentures
Consolidation Equity Accounting for JV
13
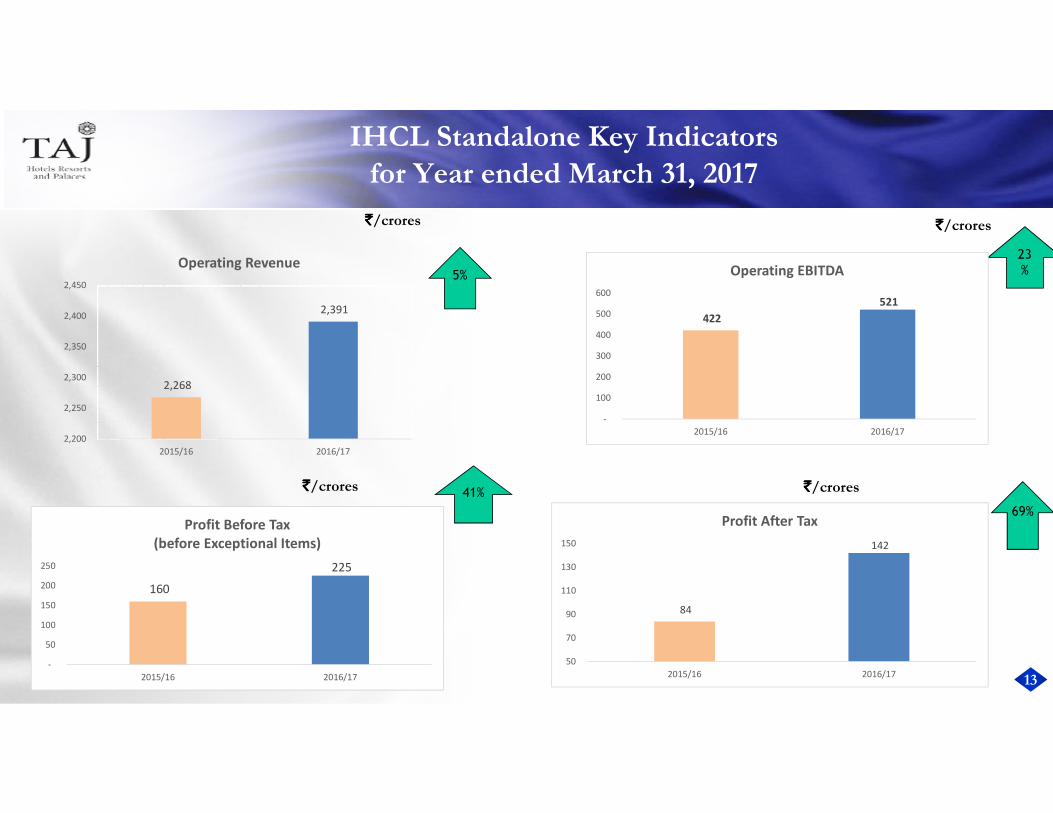
IHCL Standalone Key Indicators
for Year ended March 31, 2017
5%
23
%
`̀̀̀/crores `̀̀̀/crores
`̀̀̀/crores
69%
160
225
-
50
100
150
200
250
2015/16 2016/17
Profit Before Tax
(before Exceptional Items)
41%
84
142
50
70
90
110
130
150
2015/16 2016/17
Profit After Tax
`̀̀̀/crores
2,268
2,391
2,200
2,250
2,300
2,350
2,400
2,450
2015/16 2016/17
Operating Revenue
422
521
-
100
200
300
400
500
600
2015/16 2016/17
Operating EBITDA
14
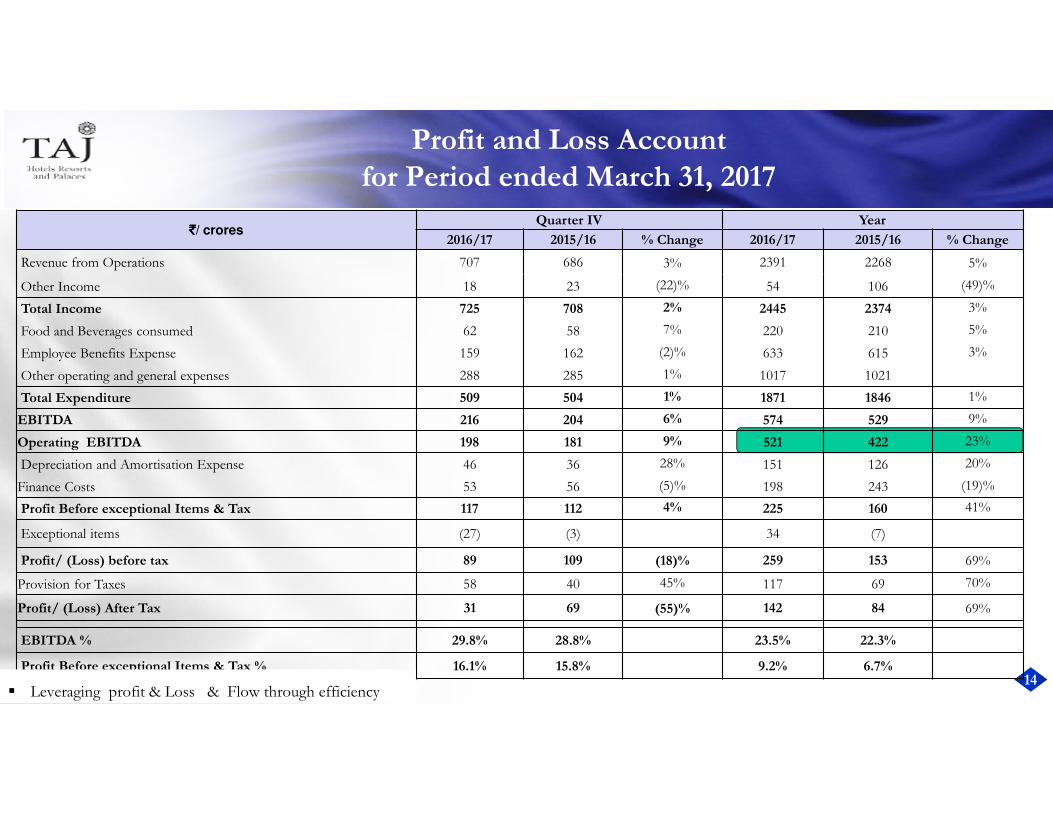
Profit and Loss Account
for Period ended March 31, 2017
`̀̀̀/ croresQuarter IV Year
2016/17 2015/16 % Change 2016/17 2015/16 % Change
Revenue from Operations 707 686 3% 2391 2268 5%
Other Income 18 23 (22)% 54 106 (49)%
Total Income 725 708 2% 2445 2374 3%
Food and Beverages consumed 62 58 7% 220 210 5%
Employee Benefits Expense 159 162 (2)% 633 615 3%
Other operating and general expenses 288 285 1% 1017 1021
Total Expenditure 509 504 1% 1871 1846 1%
EBITDA 216 204 6% 574 529 9%
Operating EBITDA 198 181 9% 521 422 23%
Depreciation and Amortisation Expense 46 36 28% 151 126 20%
Finance Costs 53 56 (5)% 198 243 (19)%
Profit Before exceptional Items & Tax 117 112 4% 225 160 41%
Exceptional items (27) (3) 34 (7)
Profit/ (Loss) before tax 89 109 (18)% 259 153 69%
Provision for Taxes 58 40 45% 117 69 70%
Profit/ (Loss) After Tax 31 69 (55)% 142 84 69%
EBITDA % 29.8% 28.8% 23.5% 22.3%
Profit Before exceptional Items & Tax % 16.1% 15.8% 9.2% 6.7%
� Leveraging profit & Loss & Flow through efficiency

15
Income Details
For period ending March 31, 2017
`̀̀̀ / Crores 2016/17 2015/16 % Change
Room Income 1,048 973 8
Food , Restaurants & Banquet Income 942 928 1
Management & Operating fees 159 149 7
Other Operating Income 242 217 11
Income from Operations 2391 2268 5
Non Operating Income 54 106 (49)
Total Income 2,445 2,374 3
� Increase in Room Income was driven by higher ARR by 8 %
� Increase in Other Operating Income was primarily driven by Income from Spa & Health Club and Membership fees.
� Non Operating Income comprises of Income from Dividend and Interest , Lower on account of reduced liquidity in Current year , used to repay
debt.
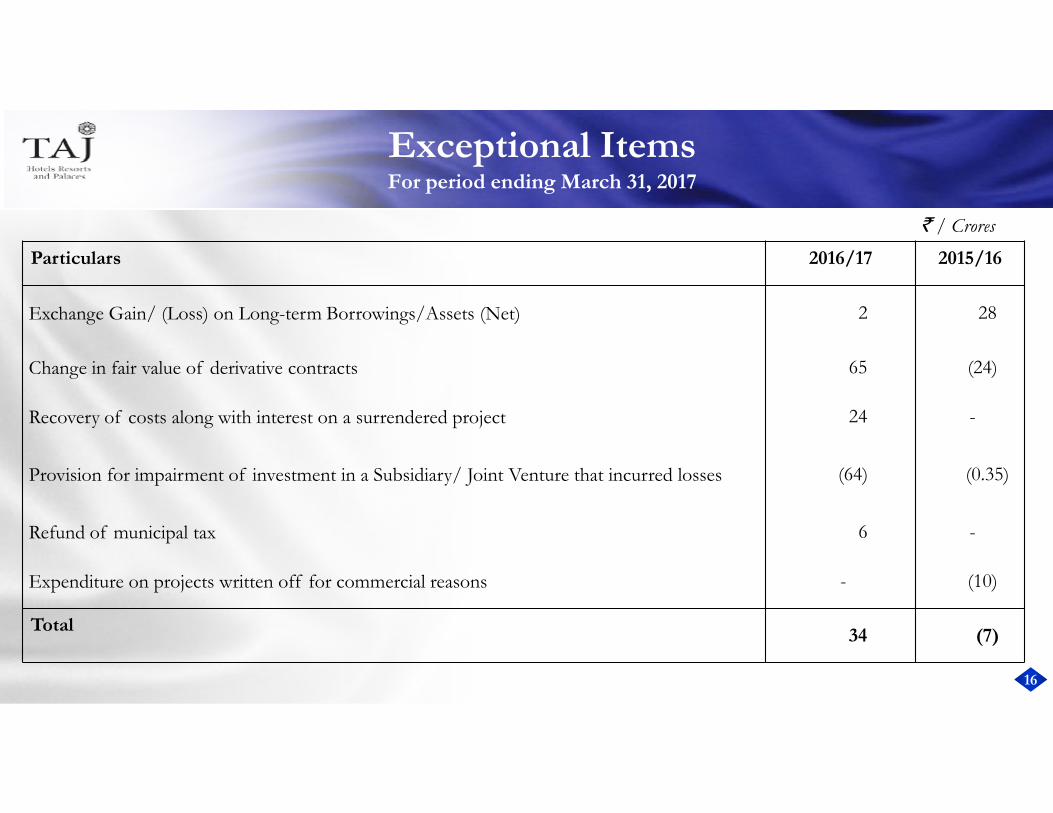
16
Exceptional ItemsFor period ending March 31, 2017
Particulars 2016/17 2015/16
Exchange Gain/ (Loss) on Long-term Borrowings/Assets (Net) 2 28
Change in fair value of derivative contracts 65 (24)
Recovery of costs along with interest on a surrendered project 24 -
Provision for impairment of investment in a Subsidiary/ Joint Venture that incurred losses (64) (0.35)
Refund of municipal tax 6 -
Expenditure on projects written off for commercial reasons - (10)
Total34 (7)
` / Crores
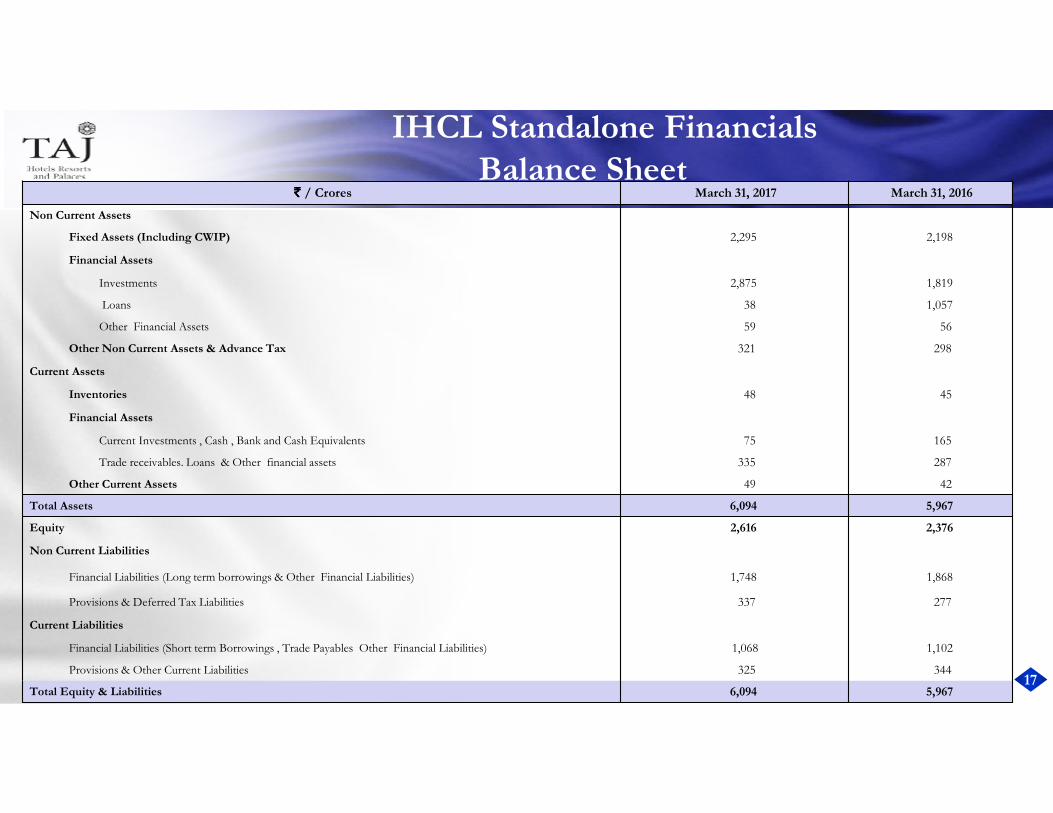
17
`̀̀̀ / Crores March 31, 2017 March 31, 2016
Non Current Assets
Fixed Assets (Including CWIP) 2,295 2,198
Financial Assets
Investments 2,875 1,819
Loans 38 1,057
Other Financial Assets 59 56
Other Non Current Assets & Advance Tax 321 298
Current Assets
Inventories 48 45
Financial Assets
Current Investments , Cash , Bank and Cash Equivalents 75 165
Trade receivables. Loans & Other financial assets 335 287
Other Current Assets 49 42
Total Assets 6,094 5,967
Equity 2,616 2,376
Non Current Liabilities
Financial Liabilities (Long term borrowings & Other Financial Liabilities) 1,748 1,868
Provisions & Deferred Tax Liabilities 337 277
Current Liabilities
Financial Liabilities (Short term Borrowings , Trade Payables Other Financial Liabilities) 1,068 1,102
Provisions & Other Current Liabilities 325 344
Total Equity & Liabilities 6,094 5,967
IHCL Standalone Financials
Balance Sheet
18
Dividend
The Board of Directors have recommended a final dividend of 35%
for 2016/17.

19
Consolidated Financial Performance
for the
Year Ended March 31, 2017
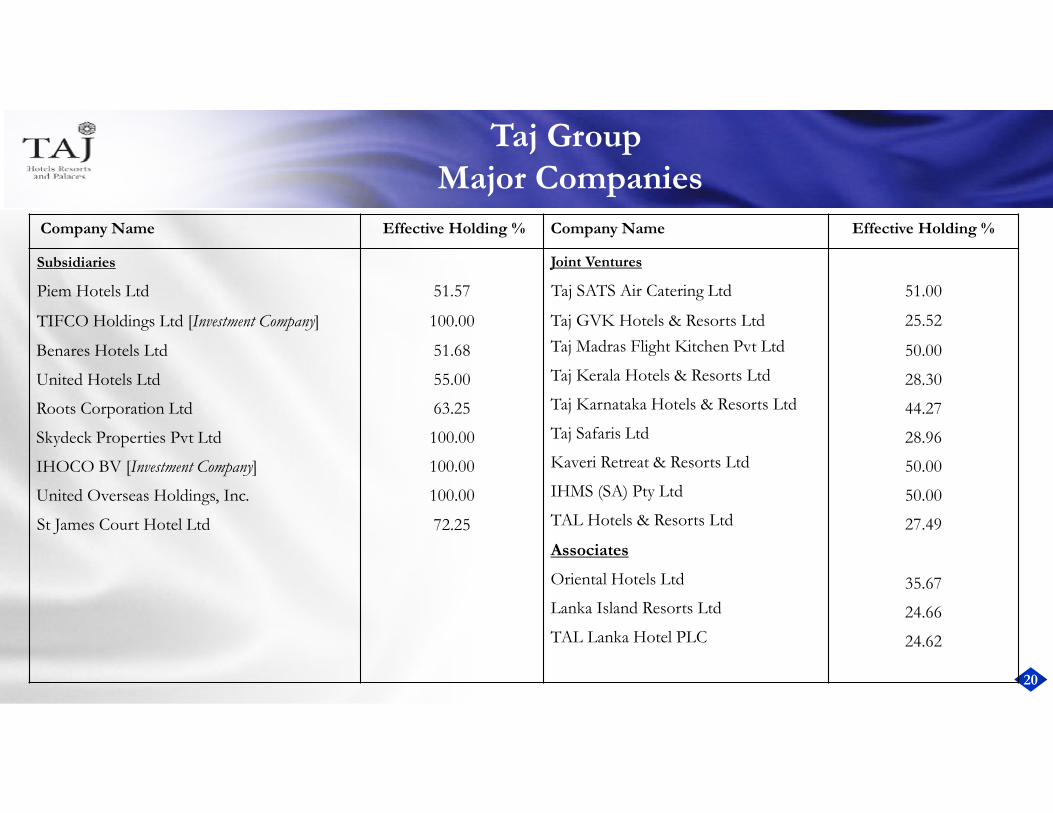
20
Taj Group
Major Companies
Company Name Effective Holding % Company Name Effective Holding %
Subsidiaries Joint Ventures
Piem Hotels Ltd 51.57 Taj SATS Air Catering Ltd 51.00
TIFCO Holdings Ltd [Investment Company] 100.00 Taj GVK Hotels & Resorts Ltd 25.52
Benares Hotels Ltd 51.68 Taj Madras Flight Kitchen Pvt Ltd 50.00
United Hotels Ltd 55.00 Taj Kerala Hotels & Resorts Ltd 28.30
Roots Corporation Ltd 63.25 Taj Karnataka Hotels & Resorts Ltd 44.27
Skydeck Properties Pvt Ltd 100.00 Taj Safaris Ltd 28.96
IHOCO BV [Investment Company] 100.00 Kaveri Retreat & Resorts Ltd 50.00
United Overseas Holdings, Inc. 100.00 IHMS (SA) Pty Ltd 50.00
St James Court Hotel Ltd 72.25 TAL Hotels & Resorts Ltd 27.49
Associates
Oriental Hotels Ltd 35.67
Lanka Island Resorts Ltd 24.66
TAL Lanka Hotel PLC 24.62

21
IHCL Consolidated Key Indicators
for Period ended March 31, 2017
`̀̀̀/crores`̀̀̀/crores
`̀̀̀/crores
� Operating Revenue for Current year includes ` 76 crores for Boston
� Operating Revenue for the Previous year includes ` 223 crores forBoston.
� Excluding Boston Operating Revenue increased by `̀̀̀ 134
Crores(4%).
4,023 4,010
3,000
3,200
3,400
3,600
3,800
4,000
4,200
4,400
2015/16 2016/17
Operating Revenue
552
610
510
540
570
600
630
2015/16 2016/17
Operating EBITDA 11%
(231)
(63)
(250)
(200)
(150)
(100)
(50)
0
2015/16 2016/17
Profit After Tax
22
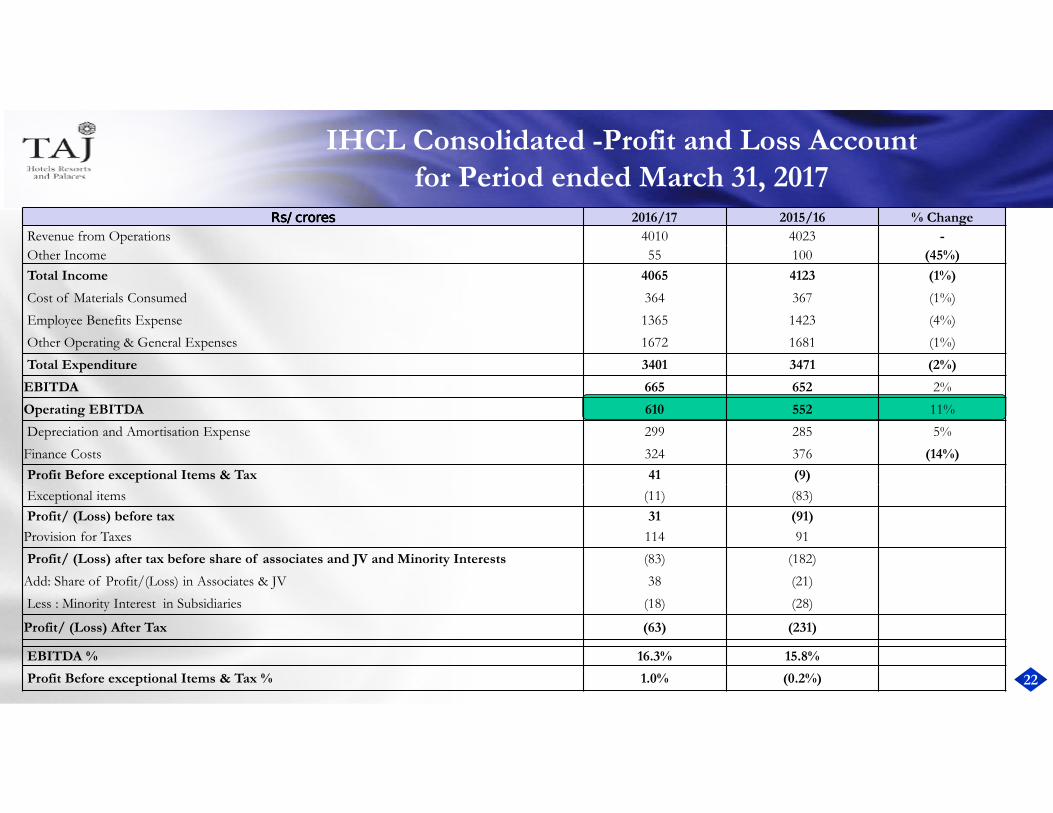
IHCL Consolidated -Profit and Loss Account
for Period ended March 31, 2017Rs/ croresRs/ croresRs/ croresRs/ crores 2016/17 2015/16 % Change
Revenue from Operations 4010 4023 -
Other Income 55 100 (45%)
Total Income 4065 4123 (1%)
Cost of Materials Consumed 364 367 (1%)
Employee Benefits Expense 1365 1423 (4%)
Other Operating & General Expenses 1672 1681 (1%)
Total Expenditure 3401 3471 (2%)
EBITDA 665 652 2%
Operating EBITDA 610 552 11%
Depreciation and Amortisation Expense 299 285 5%
Finance Costs 324 376 (14%)
Profit Before exceptional Items & Tax 41 (9)
Exceptional items (11) (83)
Profit/ (Loss) before tax 31 (91)
Provision for Taxes 114 91
Profit/ (Loss) after tax before share of associates and JV and Minority Interests (83) (182)
Add: Share of Profit/(Loss) in Associates & JV 38 (21)
Less : Minority Interest in Subsidiaries (18) (28)
Profit/ (Loss) After Tax (63) (231)
EBITDA % 16.3% 15.8%
Profit Before exceptional Items & Tax % 1.0% (0.2%)

23
Exceptional ItemsFor period ending March 31, 2017
Particulars 2016/17 2015/16
Exchange Gain/ (Loss) on Long-term Borrowings/Assets (Net) 0 (33)
Change in fair value of derivative contracts 65 (24)
Recovery of costs along with interest on a surrendered project 24 -
Refund of municipal tax 6 -
Expenditure on projects written off for commercial reasons - (25)
Provision of financial exposure in an associate (5) -
Profit on compulsory acquisition of land by government 1 -
Net Loss on disposal of IHMS (Boston) LLC (103) -
Total (11) (83)
` / Crores

24
`̀̀̀ / Crores March 31, 2017 March 31, 2016
Non Current Assets
Fixed Assets (Including Goodwill) 6038 7052
Financial Assets
Investments 1153 1345
Loans 15 15
Other Financial Assets 72 73
Other Non Current Assets , Advance Tax & Deferred Tax 430 387
Current Assets
Inventories 80 80
Financial Assets
Current Investments , Cash , Bank and Cash Equivalents 338 353
Trade receivables. Loans & Other financial assets 430 436
Other Current Assets 78 75
Total Assets 8634 9815
Equity ( Including Non Controlling Interests) 3256 3323
Non Current Liabilities
Financial Liabilities (Long term borrowings & Other Financial Liabilities) 3147 3748
Provisions & Deferred Tax Liabilities 393 328
Current Liabilities
Financial Liabilities (Short term Borrowings , Trade Payables Other Financial Liabilities) 1377 1917
Provisions & Other Current Liabilities 463 498
Total Equity & Liabilities 8634 9815
IHCL Consolidated Financials
Balance Sheet
25
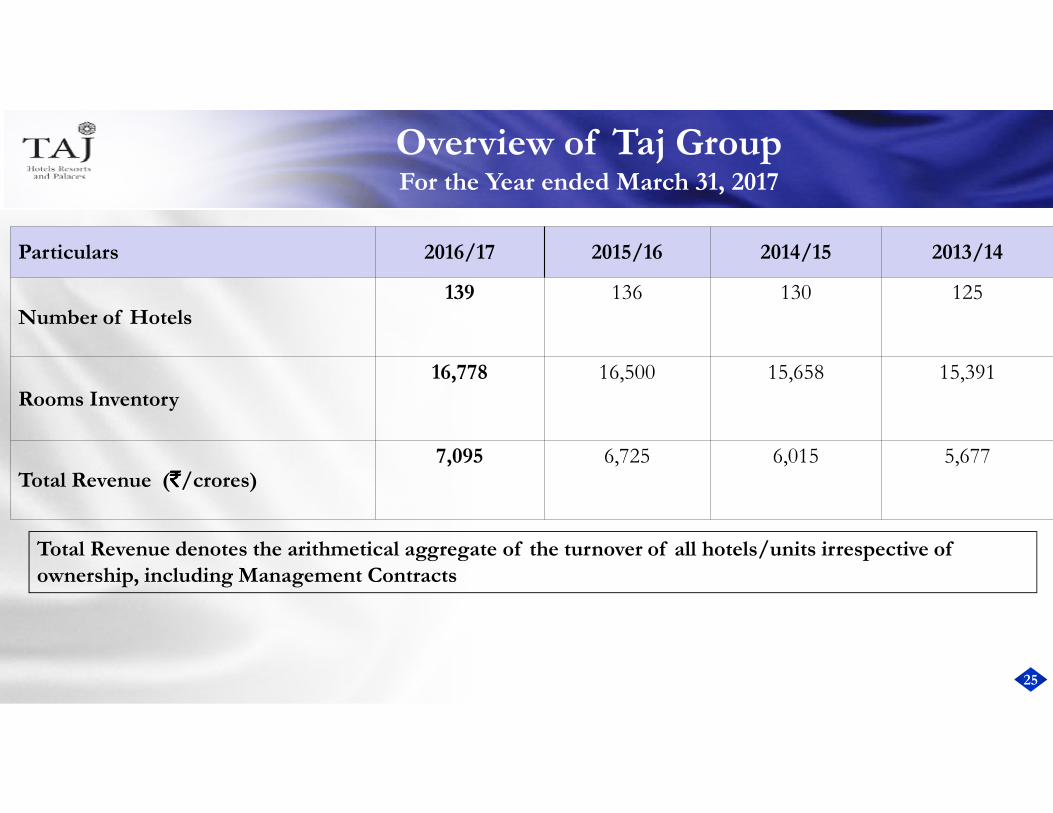
Overview of Taj GroupFor the Year ended March 31, 2017
Total Revenue denotes the arithmetical aggregate of the turnover of all hotels/units irrespective of
ownership, including Management Contracts
Particulars 2016/17 2015/16 2014/15 2013/14
Number of Hotels139 136 130 125
Rooms Inventory
16,778 16,500 15,658 15,391
Total Revenue (`̀̀̀/crores)7,095 6,725 6,015 5,677

26
Update on Financial Initiatives
International Restructuring
� The restructuring exercise for overseas hotels / investments was concluded during the year
� Holdings in the assets in USA, UK , South Africa, Sri Lanka & Maldives have all now been shifted to IHOCO BV(100% Subsidiary)
� The new simplified structure consolidates value under one entity, enhances potential fund raising ability and isefficient from regulatory perspective
� Separately, the erstwhile USA subsidiary of the company was amalgamated with IHCL through a ‘Scheme ofArrangement’, which was effected during the year 2016/17.
Sea Rock
� Sea Rock ownership has been folded into IHCL, post the acquisition of 100% equity in Lands End Properties Pvt Ltd
� The debt in Sea Rock Balance Sheet has been reduced to Rs 850 crores from the earlier levels of Rs 1400 crores.
� The ‘Scheme of Arrangement’ to amalgamate the Sea Rock Company with IHCL was effected during the year 2016/17and is now completed.
27
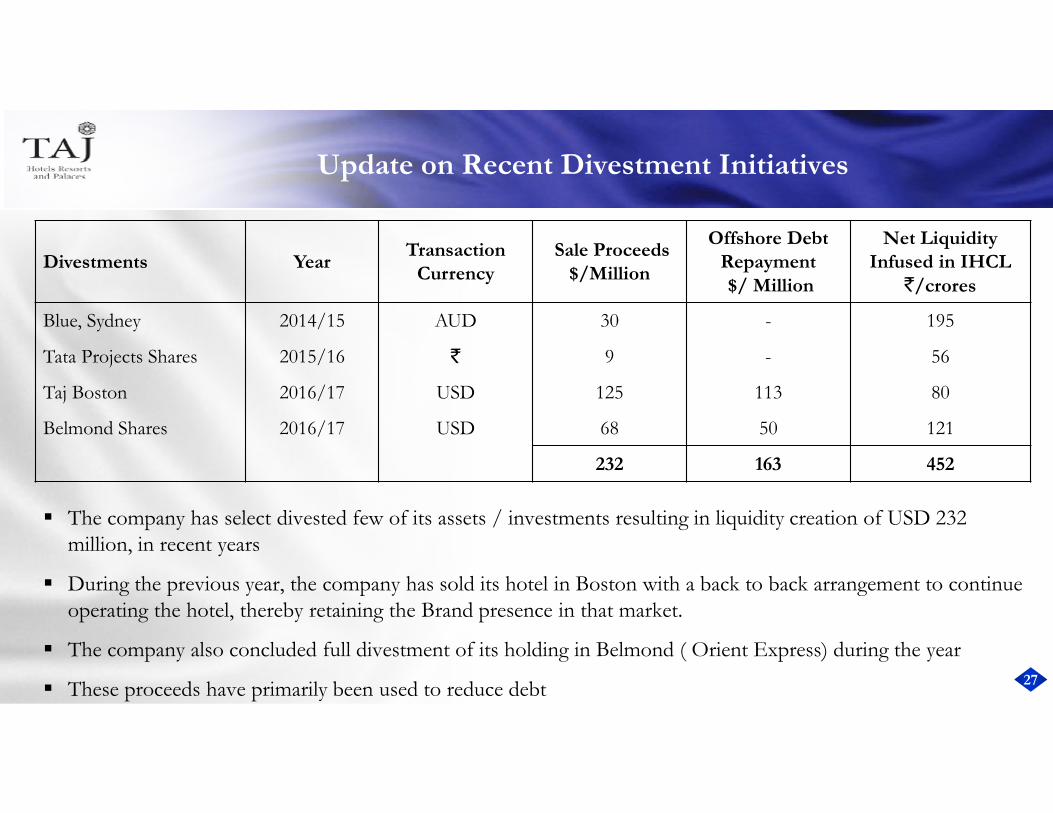
Update on Recent Divestment Initiatives
Divestments YearTransaction
Currency
Sale Proceeds
$/Million
Offshore Debt
Repayment
$/ Million
Net Liquidity
Infused in IHCL
`/crores
Blue, Sydney 2014/15 AUD 30 - 195
Tata Projects Shares 2015/16 ` 9 - 56
Taj Boston 2016/17 USD 125 113 80
Belmond Shares 2016/17 USD 68 50 121
232 163 452
� The company has select divested few of its assets / investments resulting in liquidity creation of USD 232 million, in recent years
� During the previous year, the company has sold its hotel in Boston with a back to back arrangement to continue operating the hotel, thereby retaining the Brand presence in that market.
� The company also concluded full divestment of its holding in Belmond ( Orient Express) during the year
� These proceeds have primarily been used to reduce debt

28
Debt Position
Particulars Standalone Consolidated
March 31, 2017 March 31, 2016 March 31, 2017 March 31, 2016
Gross Debt 2,049 2,158 3,383 4,526
Liquidity (67) (157) (232) (310)
Net Debt 1,982 2,001 3,151 4,216
Finance Cost 198 243 324 376
Net Debt/ Equity 0.76 0.84 0.97 1.27
Weighted cost of Debt 8.8% 8.8% 8.4% 7.4%
`̀̀̀/crores
� Consolidated debt has significantly reduced by ` 1,065 crores during the year
� This has interalia , resulted in lower finance costs
� Credit rating on the borrowings reaffirmed at AA+ by CARE and AA by ICRA
29
Other Update
30
Amalgamation
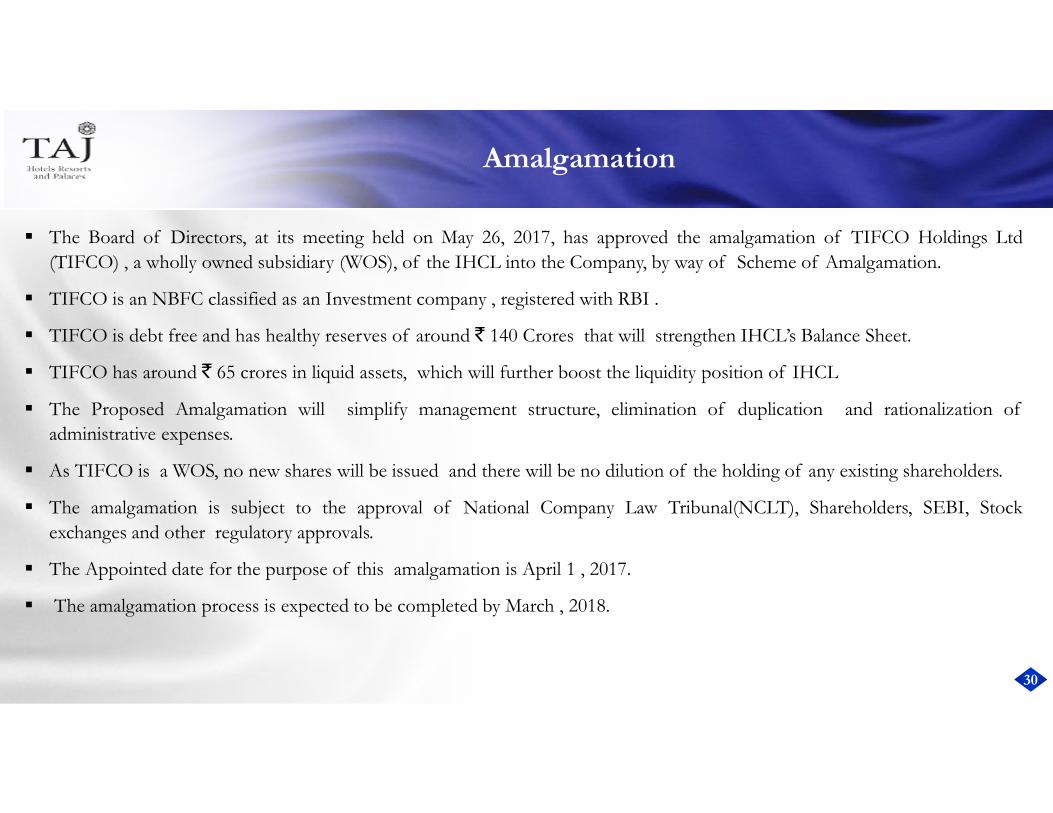
� The Board of Directors, at its meeting held on May 26, 2017, has approved the amalgamation of TIFCO Holdings Ltd
(TIFCO) , a wholly owned subsidiary (WOS), of the IHCL into the Company, by way of Scheme of Amalgamation.
� TIFCO is an NBFC classified as an Investment company , registered with RBI .
� TIFCO is debt free and has healthy reserves of around ` 140 Crores that will strengthen IHCL’s Balance Sheet.
� TIFCO has around ` 65 crores in liquid assets, which will further boost the liquidity position of IHCL
� The Proposed Amalgamation will simplify management structure, elimination of duplication and rationalization of
administrative expenses.
� As TIFCO is a WOS, no new shares will be issued and there will be no dilution of the holding of any existing shareholders.
� The amalgamation is subject to the approval of National Company Law Tribunal(NCLT), Shareholders, SEBI, Stock
exchanges and other regulatory approvals.
� The Appointed date for the purpose of this amalgamation is April 1 , 2017.
� The amalgamation process is expected to be completed by March , 2018.
31
Thank you